shell engineering and associates, inc. · shell engineering and associates, inc. 2503 west ash...
TRANSCRIPT

shell engineering and associates, inc. 2503 west ash columbia, mo 65203 314-445-0106
July 25, 1990
Mr. Dave Krehbiel County Commissioner Camden County Courthouse #l Court Circle Camdenton, Missouri 65020
Re: Particulate Emissions Tests at Camdenton, Mo. June 12, 1990
Dear Mr. Krehbiel:
Attached is our report entitled "Particulate and Visible Emission Tests for Camdenton County Asphalt Production at Camdenton, Mo. The report describes the emissions testing program conducted at that facility on June 12, 1990, and details the results of the three USEPA Method 5 and Method 9 tests performed to determine the particulate and visible emissions from the Asphalt Drum Mixers Model 6026.
The results do demonstrate compliance with the Missouri State regulation and the USEPA New Source Performance Standards regarding Asphalt Production. The average particulate emission rate was calculated as 0.013 grains per dry standard cubic foot. The allowable emission rate is 0.04 grains per dry standard cubic foot.
You will need to forward a copy of this report to the Missouri Department of Natural Resources after your review.
We appreciate this opportunity to have been of service to you and your company, and will hope that we can be of assistance again at sometime in the future. x, . -
Sincerely, - .?=.
I - , . Shell Engineering & Associates, .. :Jnc; -
-*D&.Lc Harvey D. Shell, P.E. President
Attachment HDSldjb

PARTICULATE AND VISIBLE
EMISSION TESTS FOR
CAMDENTON COUNTY ASPHALT PRODUCTION
ASPHALT DRUM MIXERS
MODEL 6026
CAMDENTON, MISSOURI
June 12, 1990

TEST CERTIFICATION
We certify that the enclosed test results are true, accurate, and
authentic. We were personally responsible for all phases of the
testing to determine the particulate and visible emissions from the Asphalt Drum Mixers Model 6026 Asphalt Plant at the Camdenton County.
The sampling equipment and procedures conformed to USEPA Method
1,2,3,5, and 9 for particulate and visible emissions from stationary sources. The results of this testing are the basis for this report.
SHELL ENGINEERING & ASSOCIATES, INC.
~arve"y D. Shell, P.E. President
-
Tom Scheppers, P.E. Project Engineer

TABLE O F C O N T E N T S
Page
Test Certification . . . . . . . Table of Contents . . . . . . . I . Introduction . . . . . . . I1 . Summary of Results . . . . I11 . Description of the Process IV . Description of the Source . V . Plant Operating Conditions VI . Test Conditions . . . . . . VII . Test Equipment and Methods
TABLES :
Table I . Summary of Emission Tests . . . . . . . . . . . . . . . 3
Table I1 . Summary of Asphalt Plant Daily Operations Reports . . . 5
APPENDICES:
Appendix A . Particulate Test Analysis . . . . . . . . . . . . . . A-1 Appendix B . Particulate Field Data Sheets . . . . . . . . . . . . B-1 Appendix C . Analytical Laboratory Reports . Particulate . . . . . C-1 Appendix D . Test Equipment Calibrations . Particulate . . . . . . D-1
Appendix E . Test Equipment Description . Particulate . . . . . . E-1 Appendix F . USEPA Reference Method 5 . . . . . . . . . . . . . . F-1
Appendix G . Visible Field Data Sheets . . . . . . . . . . . . . . G - 1
Appendix H . Visible Emissions Certification . . . . . . . . . . . H - 1
Appendix I . USEPA Reference Method 9 . . . . . . . . . . . . . . 1-1 Appendix J . 40 CFR Part 60 Subpart I . Standards of
Performance for Hot Mix Asphalt Facilities . . . . J-1 Appendix K . Asphalt Production Records, June 1 2 , 1990 . . . . . . K-1
Appendix L . Sample Calculations . . . . . . . . . . . . . . . . . L-1

I. INTRODUCTION
Shell Engineering & Associates, Inc., of Columbia, Missouri, has been
retained by Camdenton County to determine the particulate and visible
emissions from a new Model 6026 asphalt plant installed at the
Camdenton County, south on Highway 5 from Camdenton, Missouri.
Performance testing is required under the condition of an operating permit which was issued to Camdenton County by the Missouri Department of Natural Resources. The asphalt plant is also subject to the Code of
Federal Regulation (CFR) Title 40 Part 60 New Source Performance Standards (NSPS). USEPA Methods 5 and 9 were used for the testing with
no deviations from the standard procedures. The asphalt plant was
permitted to operate at a production rate of 100 tonlhr, emission rate
of no greater than 0.04 grainsldry standard cubic foot, and less than 20 percent visible emissions.
Source testing took place during the period of June 12, 1990. Pre-test
planning was accomplished by phone conversations with the following
individuals; Mr. Doug Elley of Missouri Department of Natural
Resources, Mr. Dave Krehbiel and Mr. Phil Jones of Camdenton County, and Mr. Tom Scheppers of Shell Engineering & Associates.
The project engineer during the test for Shell Engineering & Associates
was Mr. Tom Scheppers. The test-team leader was Mr. Terry C.
Shackelford. Other members of the Method 5 test team were Mr. Frank
Witt and Mr. Charles Scott. Mr. Scheppers performed the Method 9
Visible Emissions Readings. Mr. Doug Elley observed a portion of the
tests representing the Air Pollution Control Program, Missouri Department of Natural Resources. While onsite Mr. Elley videotaped
portions of the testing and asphalt production. Other individuals
present for portions or all of the tests were Mr. W. Boyd, Field
Service Representative of Asphalt Drum Mixers and Mr. Phil Jones, Camdenton County.
Weather was not a major factor during the testing program, as clear
skies predominated. The temperatures were around the 90's.
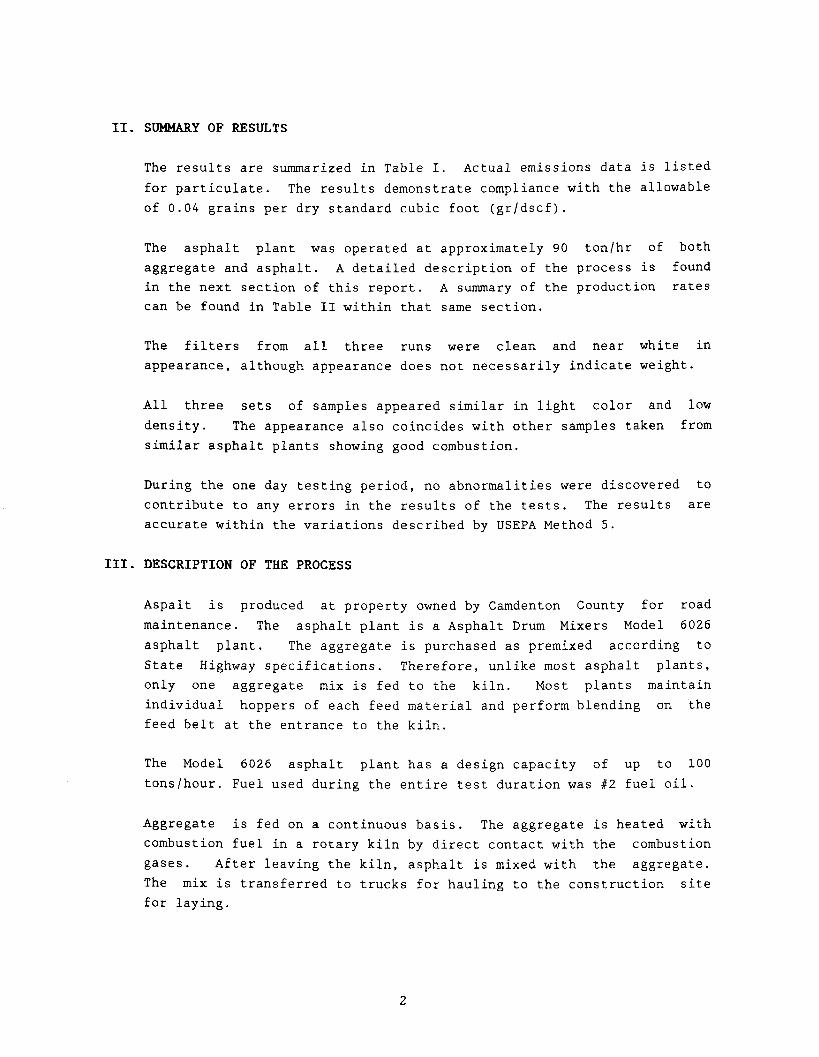
11. SUMMARY OF RESULTS
The results are summarized in Table I. Actual emissions data is listed
for particulate. The results demonstrate compliance with the allowable
of 0 . 0 4 grains per dry standard cubic foot (grldscf).
The asphalt plant was operated at approximately 9 0 ton/hr of both
aggregate and asphalt. A detailed description of the process is found in the next section of this report. A summary of the production rates can be found in Table I1 within that same section.
The filters from all three runs were clean and near white in appearance, although appearance does not necessarily indicate weight.
All three sets of samples appeared similar in light color and low
density. The appearance also coincides with other samples taken from
similar asphalt plants showing good combustion.
During the one day testing period, no abnormalities were discovered to
contribute to any errors in the results of the tests. The results are accurate within the variations described by USEPA Method 5.
DESCRIPTION OF THE PROCESS
Aspalt is produced at property owned by Camdenton County for road
maintenance. The asphalt plant is a Asphalt Drum Mixers Model 6026
asphalt plant. The aggregate is purchased as premixed according to
State Highway specifications. Therefore, unlike most asphalt plants, only one aggregate mix is fed to the kiln. Most plants maintain
individual hoppers of each feed material and perform blending on the feed belt at the entrance to the kiln.
The Model 6026 asphalt plant has a design capacity of up to 100
tonslhour. Fuel used during the entire test duration was # 2 fuel oil.
Aggregate is fed on a continuous basis. The aggregate is heated with
combustion fuel in a rotary kiln by direct contact with the combustion
gases. After leaving the kiln, asphalt is mixed with the aggregate.
The mix is transferred to trucks for hauling to the construction site for laying.

TABLE I
Camdenton County
Summary of Particulate and Visible Emission Test
Asphalt Drum Mixers Model 6026 Asphalt Plant
Run 1 Run 3 Run 4
6/12/90 6/12/90 6/12/90 AVG
Process Conditions
Feed Rate ( t o n / h r )
Stack Conditions
Stack Gas Temperature ( O F )
Actual Gas Flow (ACFM)
Std. Gas Flow (DSCFM)
Emissions. Actual
Visible (percent)
Particulate (gr/DSCF)
Particulate (lb/hr)

IV. DESCRIPTION OF THE SOURCE
The asphalt plant exhaust gases are controlled by a baghouse prior to
exiting through a rectangular stack. The gases discharge to atmosphere
through a 66 inch stack. Stack dimensions inside the wall is 24 518
Length by 22 318 Width, inches as measured at the test ports. The effective diameter is 23.4 inches.
The test ports (four equally spaced along one wall) are located 15
inches (0.64 diameters) from the stack exit, and 51 inches (2.18 diameters) from the last disturbance.
V. PLANT OPERATING CONDITIONS
The "Asphalt Plant Operations Data" for the period June 12, 1990, are
included in Appendix K. This data has been recorded every 15 minutes
during each run. The data includes process input weight for both
aggregate and asphalt, mix temperatures, fuel flows, and the pressure drop across the baghouse. A summary of these conditions can be found on Table 11.
The operation data was collected by W. Boyd. The asphalt plant was operated in a normal manner near maximum rated production consistent
with the amount of moisture contained in the aggregate. No asphalt mix was recycled during the tests.
VI. TEST CONDITIONS
The Method 5 test samples were drawn from six points on each of four
traverses of the stack. (The traverse point locations specified by
USEPA Method 1 is usually 25 points on 5 ports for rectangular stacks
and 24 points on two ports for circular stacks). Due to the limited
space along the stack wall, only four test ports could be installed in
equal areas. Therefore, 24 points were sampled. Samples were collected
isokinetically for a total of one hour for each of three runs (2.5 minuteslpoint).
No operational problems of the asphalt plant were encountered during the tests. The asphalt plant was charged with typical aggregate mix, asphalt and fuel in a steady state manner.
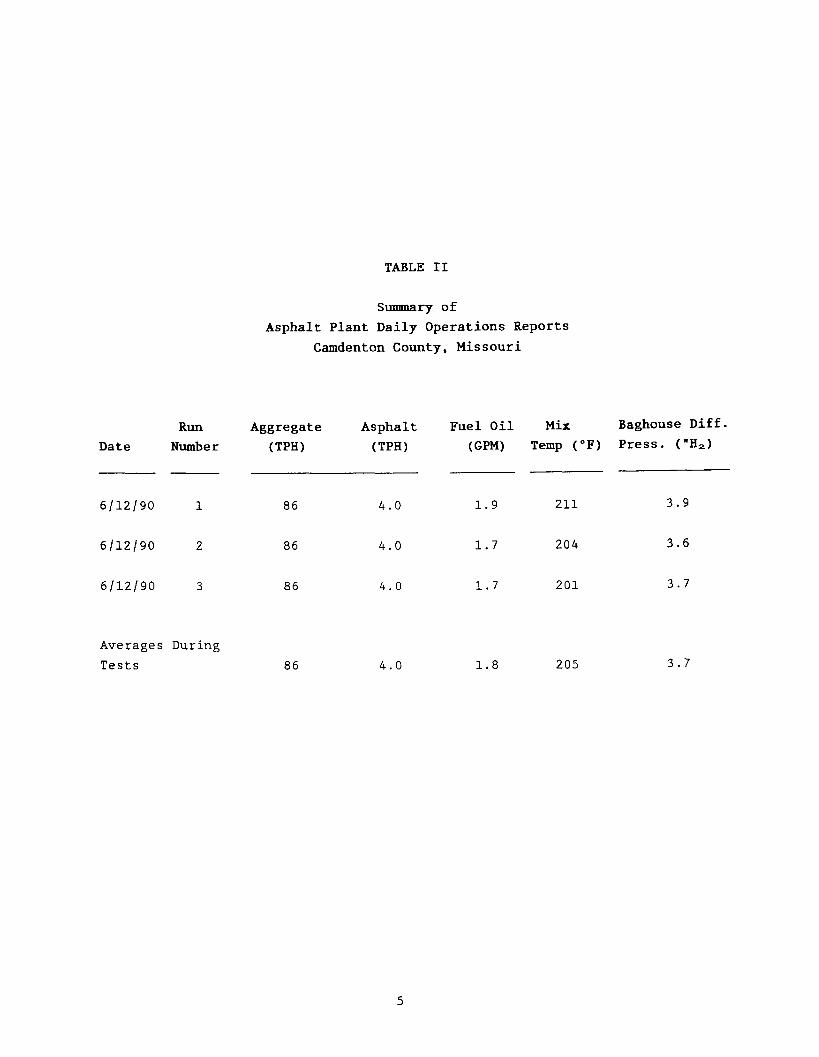
TABLE I1
Summary of
Asphalt Plant Daily Operations Reports
Camdenton County, Missouri
Run Aggregate Asphalt Fuel Oil Mix Baghouse Diff.
Date Number (TPH 1 ( TPH 1 (GPM) Temp (OF) Press. ("Hz)
Averages During
Tests

A c y c l o n i c f low t e s t and p r e l i m i n a r y v e l o c i t y t r a v e r s e was performed
p r i o r t o t h e f i r s t Method 5 t e s t . S tack f low c o n d i t i o n s were
a c c e p t a b l e f o r t e s t i n g , a s t h e average a n g l e of r o t a t i o n of t h e s t a c k
g a s e s f o r t h e 24 p o i n t s i n t h e v e r t i c a l p l a n e was 1 0 . 9 " . (Averages up
t o 20" a r e a c c e p t a b l e accord ing t o t h e USEPA p r o c e d u r e s . ) The v e l o c i t y
p r o f i l e i n t h e s t a c k was r e a s o n a b l y smooth, i n d i c a t i n g a l ack of
t u r b u l e n t f low.
VII. TEST EQUIPMENT AND METHODS
The t e s t p rocedures and equipment used t o de te rmine t h e p a r t i c u l a t e and
v i s i b l e c o n c e n t r a t i o n s i n t h e s t a c k g a s e s o f t h e a s p h a l t p l a n t a r e
d e s c r i b e d i n Appendix J of t h i s r e p o r t . I n b r i e f , a Nutech Model 2010
s t a c k sampling t r a i n was used t o de te rmine t h e p a r t i c u l a t e emiss ions
a c c o r d i n g t o USEPA Reference Method 5, and a c e r t i f i e d v i s u a l emiss ions
o b s e r v e r was used t o determine t h e v i s i b l e emiss ions a c c o r d i n g t o USEPA
Refe rence Method 9 .
APPENDIX - A
PARTICULATE TEST ANALYSIS
(Computer Reports)
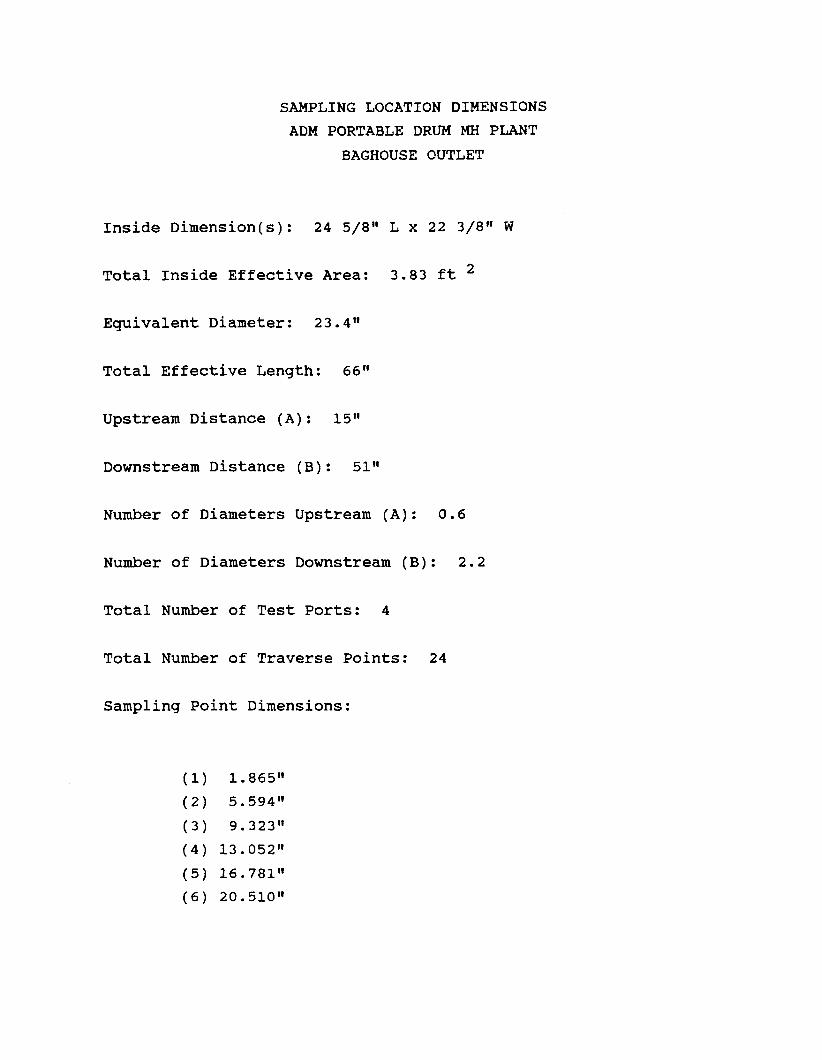
SAMPLING LOCATION DIMENSIONS
ADM PORTABLE DRUM MH PLANT
BAGHOUSE OUTLET
Inside Dimension(s): 24 5/811 L x 22 3/8" W
Total Inside Effective Area: 3.83 ft
Equivalent Diameter: 23.4"
Total Effective Length :
Upstream Distance (A): 15"
Downstream Distance (B): 51"
Number of Diameters Upstream (A): 0.6
Number of Diameters Downstream (B): 2.2
Total Number of Test Ports: 4
Total Number of Traverse Points: 24
Sampling Point Dimensions:

Particulate Test Analysis
CAMDEN COUNTY MAINTENANCE CAMDENTON, MISSOURI ADM PDM PLANT 90-089
Run Number Data set
Date Location
Start time End time ~arometric Pressure In. Hg Static Pressure In. H20 Volume of Condensate Mls Volume Sampled DCF Meter Correction Factor Square Root of Delta P Orifice Pressure In. H20 Meter Temperature Deg. F Flue Temperature Deg. F Percent C02 % Percent 02 % Diameter of Nozzle In Area of Flue Sq Ft Sample Time Min Weight Gain Grams
Absolute Flue Pressure In. Hg Corrected Sample Volume DSCF Moisture in Flue Gas % Molecular Weight Lb/LbMole Velocity of Flue Gas Volume of Flue Gas
FPS ACFM
Volume of Flue Gas DSCFM Dust Concentration Lb/DSCF Dust Concentration Lbs/Hour Dust Concentration Grs/ACF Dust Concentration Grs/DSCF Isokinetic Rate %
6-12-90 STACK (B.O.) 08:54 10:03 29.14 -0.82
3 69 46.617 1.01 1.240 2.18 86 263 6.05 12.40 0.212 3.83 60
0.0515
6-12-90 STACK (B.O.) 11: 00 12 : 07 29.14 -0.82 288
39.972 1.01 1.270 1.59 92 251 5.15 14.00 0.212 3.83 60
0.0354
Averages : Stack Temperature 256.3 Vol Flue Gas ACFM : 20,348 Part Emis Lb/DSCF : 1.893-06
Grs/ACF : 6.97E-03 Lbs/MBtu : 0
6-12-90 STACK (B.O.) 13:28 14:35 29.14 -0.82 324
40.909 1.01 1.310 1.69 96 255 5.60 13.05 0.212 3.83 60
0.0187
Percent 02 : 13.2 DSCFM : 10,548
Lb/Hour : 1.19 Grs/DSCF : 1.32E-02
APPENDIX - B
PARTICULATE FIELD DATA SHEETS
(Includes Cyclonic Flow Test)

CYCLONIC FLOW DETERMINATION DATA
Operator / L --'
Date @-/z-- Checked By
STACK Ef DUCT O
CIRCULAR 0 RECTANGULAR 6 SQUARE Cl _C Inside Dimension(s): Diameter Length ZH &s4 Width 22-37r4
" Upstream Distance /5 & Eq.uivalent D i a m e t e r s - WL? Downstream Distance 5 L Number of Diameters Upstream (A) d~ Number of Diameters Downstream (8) 2 - Z
Total Number of Traverse Points % Y Total Number of Test Ports 4'
ROTATION ANGLE, a ( 90' Yaw Angle)
Traverse Point
Number Test Ports
C 2 7
4 6 - - Z - l j a m
Absolute a Value, Average (< 20 O ) .&o

Pitot Tube Leak Check: Before &'After @dL. .>After Integrated Bag Leak Check: Before H.&/
Particulate Field Data Sheet
--
S ,57
/a73 mp I [
I
.7c5,77 7 .
I - -
z<=
- - . a
74. 3
MA H
I
7/ 7
.
e.=-- r
- ,G9 92
/
WA.&?7
$9 - 33 1/7ZCS7 5,s . / ~ ~ c 1 7

Particulate Field Data Sheet
Pitot Tube Leak Check: Before @-& After 04, Integrated Bag Leak Check: Before &A After 0‘43
Date Page Of 1 2 &-a - 40
Orsat Analysis
co2 + 0 2 0 2 CO
s,/ f lz /f%/ +3- -
RLL- fLa-7 cc, Project NO.
70- ,9&G m
fl &-/d&J
%q:/+' Nozzle Diameter Nozzle Number
M WCZ- Meter Corr. Factor
,Ls/
Sampllng Locatlon un No. - 0, 7 YDM 23/ensC sod,(&-
Sample Pt. Tlme ) Assumed % Molsturr Before After
1 se4 Leak Test x 2.5 &/7. ,,.-*bL V 4
Temperature O F Dry Gas
Sample Pr Meter Reading
Meter Meter (in. HG) point ~p AH Stack Probe Oven In Out in Cu. Ft.
- Pltot Coefflclent
O. cFy
Fllter No. Acetone No.
70 -/B 4 @-
Condensate
Meter-Orlflce
(3: s - 1 --
/f/2--7 Gz- r45./ ee9 a Pltot Number
~ 3 - z /AJ
Barometric Preuure
--
Statlc Preuure Probe Number

Particulate Field Data S h e e t
Pitot Tube Leak Check: Before /A- After /#
Integrated Bag Leak Check: Before /4+- After g k

APPENDIX - C
ANALYTICAL LABORATORY REPORTS
(Particulate)

rs4/,l Analytical Data Sheet
Client c / - P n 7 Project No. .%a - C = w Date &CAY- 90
Run No. / Filter No. - Acetone No. /of Amount liquid lost during transport -&z Acetone blank volume, ml -3 Acetone wash volume, ml - d 7
Acetone blank concentration, rnglrng (equation 5-4)" / 3 p ~ '
Acetone wash blank. mg (equation 5-5)" & 26
Run NO. 3 Filter No. 9e -/6& Acetone No.
Amount liquid lost during transport - Acetone blank volume, ml
Acetone wash volume, ml
Acetone blank concentration, rnglmg (equation 5-4)" Acetone wash blank, mg (equation 5-5)" O,Z6
Run No. -Z
Filter No. 90 --//a Acetone No. -2 Amount liquid lost during transport .-
Acetone blank volume, ml
Acetone wash volume, ml 6 - Acetone blank concentration, mglmg (equation 54)"/3- Acetone wash blank. mg (equation 5-5)' OH sL&7
Run No. 3+3
Filter No. I
Acetone No.
Amount liquid lost during transport /+ Acetone blank volume. ml
Acetone wash volume, rnl ///# - Acetone blank concentration, mglrng (equati6 5-4)' ' /- Acetone wash blank, mg (equation 5-5)"
'Convert weight of water to volume by dividing total weight increase by density of water (Iglml): Increase, = Volume Water, ml lglml
.*See ~ e d e r i Register, ~ l t h o d 5. 6.6, 8 6.7.

APPENDIX - D
TEST EQUIPMENT CALIBRATIONS

Thermocouple Calibrations
Client Barometric Press d 94 SO Project No.
Thermocouple Identification
( P o b e s ] N Z - 1
P 3 - 2 NS-- I N S - 2 N S - 3 NS- CI N 7 - /
N 7- 3-
N 7 - 3 rJ lo- I N 10-2
r\l \ Q - 3 fJ IS . - I
N I$ - 2
/ O V E ~ J S ) -
N - z N - 3 - N-c
L
/\/use
Trendicator
a d 7 2 4 7 3 46 2 4 6 2 4G 2 45 2 'a 2 -ro 2 52
2 72 2 48 2 dp
2 4 7 z CCJ
2 5 3 2 Y o 2 Gi
z 51 z 4'4
ZB 0
c x
Thermometer
6-CA /Ps 5 7 4 7
2 4 7
~ L C L 2 4 6 2 4Cl 2 44 2 5'0 z 5 3
2 z.2 2 rL Z 4-0 Z 4~ 2 4 q
z CJ
2 C o 2 To
2 d ;
2 6 2
z CLJ'
280
Thermometer Number
30755
I / I 1
/ I I
I I
1 I I
/ I I I I
I I
/ I I
Date
~ - z z - ~ o /
1.
1 - -
I . I I I . I I 1 i
./ /
7
/ I
1 I
I I
I I
I

Thermocouple Calibrations (Owm, Probe)
Client Barometric Press 2 9. 50 Project No.
Thermocouple ldentif ication I Trendicator Thermometer
Thermometer Number Date I
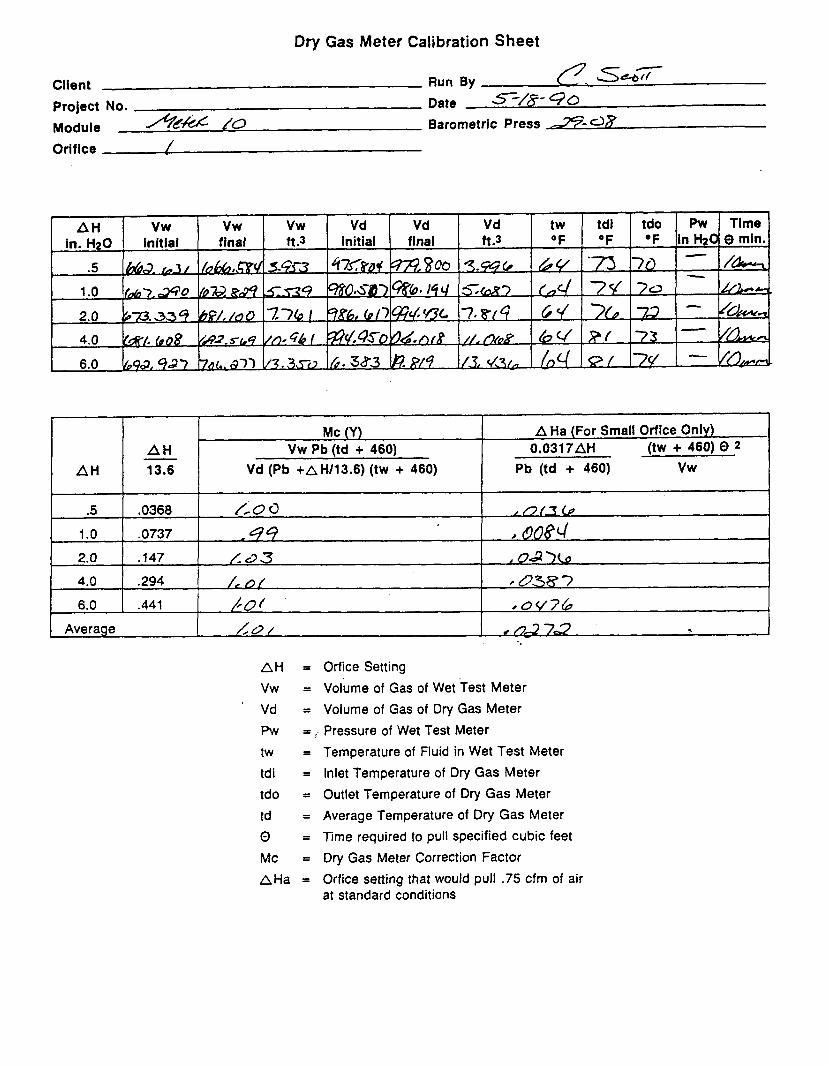
Dry Gas Meter Calibration Sheet
Client Run By (7. s-7- Project NO. Date Sc-/ti- 40 Module Ae& LO Barometric Press *-dX Orifice (
Average LO/ t
AH
A H
vw
Vd
Pw
tw
tdi
tdo
td
0 Mc
= Orfice Setting
= Volume of Gas of Wet ~ e s t Meter
= Volume of Gas of Dry Gas Meter
= :. Pressure of Wet Test Meter
= Temperature of Fluid in Wet Test Meter
= Inlet Temperature of Dry Gas Meter
= Outlet Temperature of Dry Gas Meter
= Average Temperature of Dry Gas Meter
= Time required to pull specified cubic feet
= Dry Gas Meter Correction Factor
AH - 13.6
AHa = Orfice setting that would pull .75 cfm of air at standard conditions
Mc (Y) - Vw Pb (td + 460)
Vd (Pb +A HI1 3.6) (tw + 460)
A Ha (For Small Orflce Only) 0.0317AH (tw + 460) 8 2
Pb (td + 460) Vw

Pitot Calibration Form
Client Run By B ~ U C ~ Uloods Project No. Date 5 -2 S-$0 Test Locarion ~ i t o t ~ o . A3-2 - CT/ I r - ee *)
1 "A" Sidr Calibration 1 .~ -~ - I
A P std A P (11 ern H 2 0 anH20 Doviation
Run No. (in. H20) (in. HzO) C ~ ( s ) C ~ I S ) E p ( ~ )
- Average [ Cp (Side A) I ,gq I - I
Calculations:
A P (standard)
Cp (3) 11 0.99 1 h P ($1
Deviation @(I) = (A or B)
3 C IC,(SI - E p ( ~ or 8) 1
Average Deviation = u(A or 8) = 3
Nozzle size used for Calibrations (inches) 390
lntercomponent Spacings During Calibrations:
Pitot - Nozzle: y2 z Pito t - Thermocouple: YS z. Pitot - Probe Sheath: 6

APPENDIX - E
TEST EQUIPMENT DESCRIPTION (Particulate)

- EPA METHOD 5 SA&&DJG TRAU
A Nutech Corporation Stack Sampler was used at the sampling
location(s). The particulate sampling train consisted basically
of a glass or stainless steel probe; a variable-heat-controlled
filter oven with a calibrated Type K (Chroniel/Alumel)
thermocouple located at the impinger outlet; a 1/2-hp shaft
sealed carbon vane vacuum pump assembly with a vacuum gauge; a
control unit with an elapse time indicator, a temperature
selector switch, a temperature indicator (potentiometer),
temperature controllers, gauges, a calibrated dry gas meter, and
an umbilical and various interconnecting hoses, fitting and
valves. An appropriately sized glass or stainless-steel nozzle,
a calibrated Type K temperature sensor, a static pressure tube, a
calibrated S type pitot tube and a variable-heat-controlled
stainless-steel liner with a calibrated Type K (Chromel/Alumel)
thermocouple are integral parts of the probe assembly.
The vacuum pump was used to control gas sampling rates. The
control unit was used to control probe and oven temperatures.
The control unit was also used to monitor elapsed sampling times,
temperatures, velocities, static pressure, gas sampling rates and
sampled gas volume.
alvzer (Orsat1
Flue gas concentrations were determined with a Gas Analyzer
(Orsat) which measures the percentage of carbon dioxide,
percentage of oxygen and percentage of carbon monoxide to the
nearest tenth of a percent.
Proarammable~alculator
A Hewlett Packard, Model 32S, programmable calculator was used to
determine the isokinetic sampling rate at each sampling point.

Prior to the field testing, the following procedures were
performed: All instruments were checked and calibrated. Gelman
Spectro Grade, glass-fiber-mat filters with 99.95 percent
retention of 0.3-micron particles were individually numbered,
placed in similarly numbered glass petri dishes, desiccated for
24 hours and weighed on a Sartorious analytical balance to the
nearest 0.1-milligram, and weighed a minimum of every six hours
until two consecutive weights within +0.5 milligram were
obtained, or heated for two to three hours at 220 degrees F,
cooled in a desiccator and weighed. Several 250 milliliter
crucibles were desiccated for a minimum of 24 hours and weighed
in the same manner as the filters and petri dishes. Also,
several 200-gram quantities of Type 6-16 mesh indicating silica
gel were weighed on an Ohaus beam balance and placed into
separate airtight polypropylene storage bottles.
The number of sampling points and positions of the points in the
flue at the sampling location(s), and the sampling time at each
point were determined prior to the particulate testing. The
sampling procedures were performed in accordance with the
Environmental Protection Agency's Reference Method 5,
ffDetermination of Particulate Emissions from Stationary Sourcesft
in the July 1, 1989 Federal Register, "Standards of Performance
for New Stationary Sourcesn and subsequent revisions.

Before each test run a particulate sampling train was prepared
inpart at the sampling location(s) in the following manner: An
appropriately sized sampling nozzle was installed onto the inlet
of the sampling probe and capped. The probe was then dimensioned
and marked with glass-cloth tape at increments that corresponded
with the predetermined sampling positions in the flue. A
standard impinger assembly was prepared by adding 100 milliliters
of distilled water to each of the first two impingers. The
third impinger was left dry and the fourth was filled with
approximately 200 grams of type 6-16 mesh indicating silica gel.
The entire impinger assembly was then placed in an ice bath. A
disc filter was removed from its petri dish and placed inside of
a filter holder. The filter holder was then placed inside of a
filter oven and assembled to the sampling probe outlet and the
impinger unit inlet. Next, an umbilical and sampling hoses were
connected to the sampling probe, filter oven, impinger unit, a
vacuum pump and the control unit, accordingly. The probe and
oven were then heated to and held at 248 degrees plus of minus 25
degrees.

As soon as the probe and oven temperatures had stabilized the
entire sampling train assembly was leak-checked at a minimum of
15 inches of mercury vacuum for one minute and the leakage rate
recorded. A leakage rate of less than .02 cfm and no vacuum loss
was considered acceptable.
After the particulate sampling train had been assembled, the
probe and oven heated, and the entire system leak-checked, as
previously described, the particulate sampling was performed.
Three test runs were performed at the sampling location(s). The
sampling data for each test run was recorded on a field test form
during each of the sampling periods.
After the completion of a test run, the following procedures were
performed: A final leak-check was performed at maximum vacuum or
greater incurred during the test for one minute and the leakage
rate recorded. The flue gas moisture collected in the first
three impingers was measured and recorded. The moisture laden
silica gel in the fourth impinger was transferred to an
appropriately marked, airtight polypropylene bottle and retained
for later weighing. The weight gain of the silica gel moisture
collection was added to the measured moisture condensed for that
test run. The sample nozzle, probe and filter holder were capped
and taken to a clean area for sample recovery. At the recovery
area, the disc filter was carefully removed from the filter
holder and transferred to its petri dish for later weighing.

The sampling nozzle, probe and filter holder were washed with
nanograde acetone, glass components were washed three times,
stainless steel components were washed six times and visually
inspected for cleanliness. The acetone washing and acetone blank
were collected and labeled polypropylene sample bottles and
retained for later evaporation, desiccation and weighing.
Flue gas concentrations (percentage of C O Z , percentage of 0 2 , and
percentage of CO) were determined by taking several Orsat samples
of the gas collected, simultaneously with the particulate
sampling, throughout the test run, by an integrated gas sampling
train. The integrated gas sample was collected from the
discharge of the particulate control unit. The sampling train
was set at a predetermined constant flow rate to obtain an
adequate sample or by taking direct readings from the sampling
points. The concentrations for each test run were recorded on a
field test form.
PROCEDURES - A D C E METEfPD 5 f P-
After the field testing was completed, the following procedures
were performed: Each silica gel moisture collection was weighed
in it's storage bottle on an Ohaus beam balance with sensitivity
of 0.1-gram. Each disc filter and petri dish was oven dried at
220 degrees Fahrenheit for two to three hours and cooled in a
dessicator for two hours before weighing. Each acetone washing
and acetone blank was transferred from its sample bottle to a
preweighed crucible for evaporation. When the acetone in a
crucible had completely evaporated, the crucible was transferred
to a desiccator for further drying at room temperature. Each
acetone blank collected was used to determine the amount of
residual weight each crucible retained due to acetone impurities.
Each disc filter and petri dish, acetone washing and acetone
blank was weighed on a Sartorious analytical balance with a
sensitivity of 0.1-milligram.
All test instruments were recalibrated to determine the deviation
percentage.

OR CONDITION SAMPLING UNIT
CONTROL MODULE WITH ENCLOSED
CANNED VACUUM PUMP AND DRY
GAS METER CONTROLLED-HEATED
PROBE
THERMOCOUPLE
I 3 0, u
2 U
\ S-TYPE PITOT TUBE
- FLUE WALL
TYPICAL SAMPLING TRAIN
C
L

APPENDIX -F
USEPA REFERENCE METHOD 5

APPENDIX - G
VISIBLE FIELD DATA SHEETS
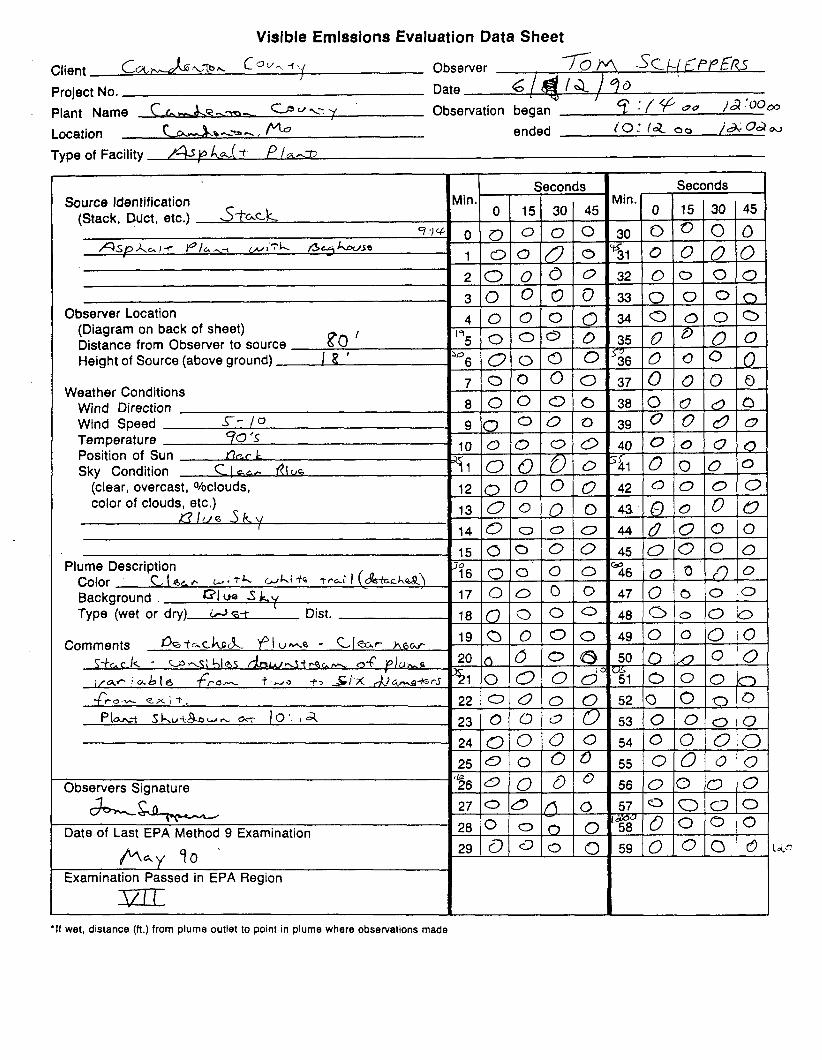
Visible Emissions Evaluation Data Sheet
Observer 0 ~ C U C P P E R S Project No. Date 6/d1h 190 Plant Name CL- &--- CP " 27 \I, Observation began : { p 0 /a :uOoo
Location ~ - , . & . . O ~ T P ~ , f i ended (0 : (a 0 0 j a. oa 0,
Type of Facility & I ~ D ~ L ( - T P / d h ~
Source Identification
gram on back of sheet)
'If wet, distance (ft.) from plume outlet to point in plume where observations made

LOCATE THE FOLLOWING ON THE DIAGRAM
1. The stack configuration with the stack under observation in the center 2. Observer's position using X to indicate position. 3. Arrow pointing direction wind is blowing. 4. Dotted line between observer and plume indicating observers line of sight when making readings. 5. Circle with S in center to indicate sun location. 6. Any large structures or significant topographical features.
NOTE: Stack configuration is not proportional to distances in feet from stack in the diagram.

Visible Emissions Evaluation Data Sheet --C
Client C a & 6 n . $ o ~ ( - D v ~ > Observer 10- S C ~ ~ ~ ~ ~ P J
Project No. Date 6 / / a / q a Plant Name C~k--&6 -+a- Lo J -7v Observation began / / . 00m
ca-aQ -7 - , MO ended / d oQ oo Location Type of Facility ASPJ-IALY 'I-ANT
Source Identification
Wind Direction
'If wet, distance (ft.) from plume outlet to point in plume where observations made

N
W
S
LOCATE THE FOLLOWING ON THE DIAGRAM
1. The stack configuration with the stack under observation in the center 2. Observer's position using X to indicate position. 3. Arrow pointing direction wind is blowing. 4. Dotted line between observer and plume indicating observers line of sight when making readings. 5. Circle with S in center to indicate sun location. 6 . Any large structures or significant topographical features.
NOTE: Stack configuration is not proportional to distances in feet from stack in the diagram.

Visible Emissions Evaluation Data Sheet - Client ~ & - + o : . - & u ~ i v Observer ,ow SCHEPPERI Project No. Date 6 I 112 140 Plant Name Ca-b-b Lo u k t ~ Observation began / 3;30 00
,% !h ended j+:30 00 Location
Type of Facility 4-1 1 - p Ia,-t
Source Identification
Distance from Observer to source Height of Source (above ground)
Weather Condition Wind Direction
'If wet, distance (R.) from plume outlet to point in plume where observations made

N
W E
S
LOCATE THE FOLLOWING ON THE DIAGRAM
1. The stack configuration with the stack under observation in the center 2. Observer's position using X to indicate position. 3. Arrcw pointing direction wind is blowing. 4. Dotted line between observer and plume indicating observers line of sight when making readings. 5. Circle with S in center to indicate sun location. 6. Any large structures or significant topographical features.
NOTE: Stack configuration is not proportional to distances in feet from stack in the diagram.

APPENDIX - H
VISIBLE EMISSIONS CERTIFICATION

JOHN ASHCROFT GoKmor
G. TRACY MEHAN 111 Dirrctor STATE OF M ISSOI!RI
DEPARTMENT OF NATURAL RESOURCES
Division of Energy Division of Environmental Quality
Division of Geology and Land Survey Division of Management Srnices
Division of Parks, Recreation. and Historic Preservation
DMSION OF ENVIRONMENTAL QUALITY P.O. Box 176
Jefferson City, MO 65 102
June 18, 1990
Mr. Tom Scheppers Shell Engineering & Associates 2503 W. Ash Columbia, MO 65203
Dear Mr. Scheppers:
The Air Pollution Control Program hereby informs you that you have successfully completed the Kansas City Air Quality Section's Visible Emissions Observer Training and have met all the requirements for certification by the State of Missouri as a Visible Emissions Observer.
Sincerely,
AIR POLLUTION CONTROL PROGRAM
Steven Feeler Environmental Engineer

APPENDIX - I
USEPA REFERENCE METHOD 9

APPENDIX - J
40 CFR PART 60 SUBPART I
(Standards of Performance for Hot Mix Asphalt Facilities

APPENDIX - K
ASPHALT PRODUCTION RECORDS
(June 1 2 , 1 9 9 0 )

PLANT DATA .>Ily l-3 F J
CLIENT L, M 0 k~yvr ~ ~ , J , ( , I T Pcc-tn DLTT RECORDED BY ;c!. LyJ 1
PROJECT NO. DATE JI]~ [ 2 , ( ~ Y Q CHECKED BY
ASPA~L'T 23 DATA SOURCE it& i- RUN NO. / PLANT LOCATION C ~ M ~ ~ ~ ~ J - ~ U I J ; /k?C, PLANT MANUFACTURER ' PLANT MODEL NO. B L O J ~ PLANT TYPE fi@&f MIX SPECIFICATION NO. O I L SPECIFICATION NO. l(/lf-#00 AGGREGATE PROPORTIONS
Q
TIME: START z'/y/~f STOP A.T. OF R.H. %
REMARKS :
-
TIME 24 HOUR
7. ;/-s - 2 Y 6 -0- Z1.U 445 M A? 100 2 - 3 2 2 4 -G - Y(a 2ta 9;s "
8L3 . b i
& / 5 h2-lfqq?fl 33% -0 - 4- 0 ;I/ 0 q d / 8: 90 d g - ~ ~ d t ? ~ AS";! Yk -- 4- 0 2 0 s 3.9 "
42- IC5c?/r 535 b +-" a>m 3.Y Y 0-
y o 0 - 322 86 -oV 40 ZZO 3-7 " I * - 6 --r -30 + J - [ . ~ # N 327 6 6 - - - 4- 0 2 Ca ?.,7
O/tl 42 j - q r i l 3 32 2 $6 - - q.0 '-I '7 i 0 3 G;
0.'. d 2 / . L j ~ p az 2 6 L/ c3 ZiO S.J -- 4 - I 4 2 - 1.88L1 30%
;/. 'oo li-a - i ,$ G?fl '%7u 8; &a -U - 4-w -2.1~3 3.8 XL -
3'7- J r 4.0 2 10 3 8
/'X kb --u - j'- 0 j9 3- 3y 'L' 0 0 2% 1 2% -0 - q- l2 &L/ 3. y
32 '2 -2 - - 0 c 2c.o j, y kd -0 - 200 3 7
. + AU2 ,o -0- '+.-'I -3.7
&.?Q t?z - 1, )sPB '30?. S'G -0- y-0 200 3 6
- FUEL OIL,@ NATURAL GAS 0
PROPANE0 BURNER
SETTING AGGREGATE TPH
RECYCLE TPH
ASPHALT MIX
TEMPERATURE OF
VENTURI 0 COLLECTOR @
DIFFERENTIAL

APPENDIX - L
SAMPLE CALCULATIONS

acf acfm A acm acm m
An
Bws
dscf dscfh dscm dscmh
fps F r
gms gm-mole
g rs A H
010 H
H c h r Oh l in. Hg Ibs Ib-mole 010 M
mmBtu mmcal mm Hg
mps
M s
= actual cubic feet = actual cubic feet per minute = effective area of flue in square feet = actual cubic meters = actual cubic meters per minute = inside area of sampling nozzle in square feet
= water vapor in gas stream, proportion by volume
= percent carbon by weight, dry basis = percent carbon monoxide by volume, dry basis = percent carbon dioxide by volume, dry basis = pitot tube coeffecient = dust loading per heat input in pounds (grams)
per million Btu (calories) per Fr constant = dust loading per heat input in pounds (grams)
per million Btu (calories) per Fr calculated = dry standard cubic feet = dry standard cubic feet per hour = dry standard cubic meters = dry standard cubic meters per hour = feet per second = ratio factor of dry flue gas volume to heat value
of combusted fuel in dry standard cubic feet (meters) per million Btu (calories)
= grams = gram-mole = grains .
= orfice drop in inches water, average = percent hydrogen by weight, dry basis = heat of combustion in Btu per pound, dry basis = hour = percent isokinetic = inches mercury = pounds = pound-mole = percent moisture by volume = million Btu = million calories = millimeters mercury = meters per second = molecular weight in pounds (gram) per pound
(gram) mole (wet basis) = percent nitrogen by weight, dry basis = percent nitrogen by difference, dry basis = percent oxygen by difference, dry basis = percent oxygen by volume, dry basis = barometric pressure in inches mercury = standard absolute pressure (29.92 in Hg)
= absolute pressure in flue in inches (millimeters) mercury
310 s scf scm
Tstd
"wsg
= static pressure in flue in inches water, average = square root of velocity head in inches water,
average = percent sulfur by weight, dry basis = standard cubic feet = standard cubic meters
= absolute temperature of air in degrees Rankine at standard conditions (528 degrees)
= absolute temperature of flue gas in degrees Rankin, average
= absolute temperature at meter in degrees Rankine, average
= velocity of flue gas in feet (meters) per second = volume of condensate through the impingers in
milliliters = volume of liquid collected in condenser in
milliliters plus weight of liquid absorbed in silica gel in grams indicated as milliliters
= volume of metered gas measured at meter conditions in cubic feet (meters)
= volume of metered gas corrected to dry standard conditions in cubic feet (meters)
= volume of flue gas at actual conditions in cubic feet (meters) per minute
= volume of flue gas corrected to dry standard conditions in cubic feet (meters) per hour
= total volume of flue gas sampled at actual conditions in cubic feet (meters)
= volume of water vapor in metered gas corrected to standard conditions in cubic feet (meters)
= volume of water condensed in impingers corrected to standard conditions
= volume of water collected in silica gel corrected to standard conditions
= total weight of dust collected per unit volume in grains (grams) per actual cubic feet (meters)
= total weight of dust collected per unit volume in pounds (grams) per dry standard cubic feet (meters)
= total weight of dust collected in grams = total weight of dust collected per unit volume
in pounds (grams) per hour, dry basis = total weight of dust collected in pounds = total weight of dust collected per unit volume
in grains (grams) per dry standard cubic feet (meters) = impinger silica gel weight gain in grams = metered gas volume correction factor
= total elapsed sampling time in minutes
Page 1 of 3

~uhdtted to: H i e e a r l A i r PoXkklon Control Program (AFCP)
Attentiorlr Dvug Elley Date :
1 . Baci22tv T~zfcrnnation
Narrmr , -- - , ,
Add.r*fla; ,I 8@&%o;. Luh!flo 6'-'zo 14- and t i t l e uf contact:
Telephone number o f conttict: j r f - s . C L - Y Y 4 o
2 . &" P ~ ) . . ~ . u ~ c c : &kmrB!G&W
~ y p e of wource: / ~ S P ) ~ A L T C ~ ~ N ' T
P e r m i t number of source to be tested;
Addreea of mourcat u-
-- -- - - .
Dlkect ians to aouzce (WE map a t t ached) :
-... -...,_-..-..-~. _ ._._C__-._i. ,..... . _- r-r-.&.*. -__ "..l-,::--...--..,+-.-. P
In lLla l start-up date: Tdl.1 B 1 I \ q q ~
3. Testino F i n n Inforrnat lon .
$ N a m e and title of contact: 7--P 4 r , ,-.
Telephone number of contact ! (31%) y v r -ul",+ , , . , , ,
flurnber of employees of firm: d o --- Number of mployees actually engaged in air p l lu t l o r l eource teetingt- A
C ~3. 1-8 I cJ c n C: 81 1-1 t-I t r 11 t . H cq 1-4 s c 31434g.31.5181 F'. 03 -. ..
'90-86-U1 11 : 07 SHELL EI+;R- & ASSOL '-P.3
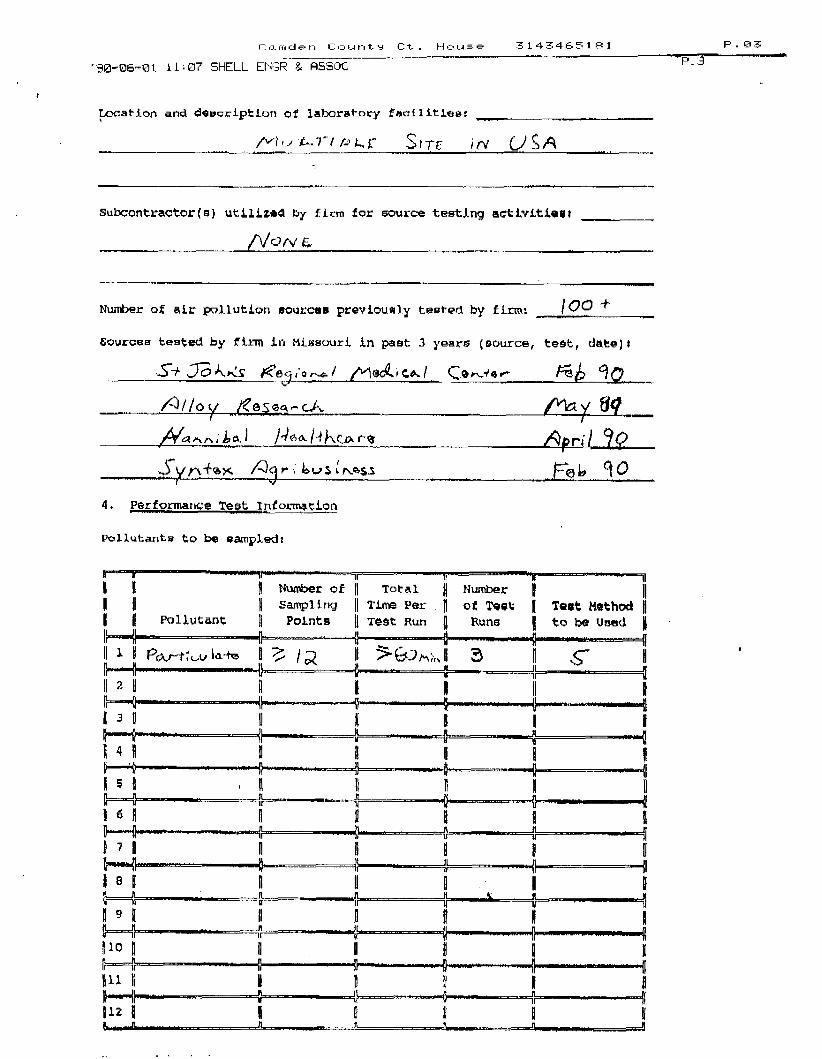
p a t i o n and deeccipt for1 of laboratory fecil lt iee!
subcontractor (s) uCLLizrQ Ry f i n n for source teeting acttvltierr t
Eourcas teat& by firm In Miesourl. in p e t 3 years (eource, teat, date]$
4 , Performat~cc'e Teat Informbcion
I If ' t ' ' -- I\ I Y N w n b e r of 1 Total i N-r E 1 I1
I I sarnpli~~g 11 T i m Per 1 ol: Tout; Turk Hothod # 1 Pollutant PoLntn 11 Teer xun 0 Run6 1 to be Used 1

,----- ' ~ G I ~ W G [email protected] 1 1 : 88 SHELL EI.IGR L ASS':IC P. 6
A description of the source aperstian includin~ as a minimum the following:
For Asphalt Concrete Plants
a. F J P ~ of pLwt Spec i fy if and model;
b. Manufacturer and mbdc3 of dryer and other maJbr Componcnlie; -woe;< & U 2 ~
aggregate meisturb content ) ; \ a T p H a qcTo * C ~ S ~ ~ E ' = ~
d . N o r m a l production r a t e , tons /h r ; bJC(4~ E,J d< o m [ & @ U P Ttt;, IaOT'i-pki
e. Number of' b u r n e r s j I
f . Type(s) of f u e l { ~ n d i c a t e perccnta$es .of each when more than one type is burned) ; P I L ~ A E ~ L - ~ ' ~ L C T ..
-#z. 1 L (.I> 1 *L &V* ~ a ~ f 7 1 VC..b 4. Momal fuel consuruytiuri ratc;
1,s GPM loo .rP+i h . P u p f l l batch s i z e , lb;
i, Descript ion af scavenger system;
k. Size distribution of feed for mixes with maximum percentage of f i n e s (material passing number 200 sieve) ;
1. N o r m a l operatine schedule;
m. Normal r . a in t tnance schednle for p l a n t , alung with a d c s c r i p t i ~ n 01 the operating B i f ficultits encountered thus Tar; and
a, Process f l o w diagram showing flow of feed, asphalt, p r ~ d u c t , stack eaacs, f l y aah, and a i r p o l l u t i o n ~ 0 n b r o l device l i q u i d , where applicable.

I
- --- ---
- p J t ) t ~ * P fly& -
location~, and ompllng p i n t - :
\
@ r e c t a n q b / a r s+~-~+k DL-awing ~f nmplLng Location showing stack or duct dimensions, air p l l u C l o n control equiprent;, fans, and lccation(s) of disturbances which affect sampling lacatLon datamination:
0 rx-,le ,

The manufacturer. and mxlel of the eamplirlg equlpncrnk to be ueed by kkke teeter for t h e performance tests, along with a deecription of any e q u i p n n t which nuy dllls~ Ism Chat rquirwd by Cba mpseifhd mthCd(s) *
A deecripklon oC any teat procedures to be ueed I n the conduct of the p ~ f ~ m c e teets whicb may differ from the sp3vtflad mttlod(4).
C. A n a l y t i c a l P r ~ e d u r e e :
A description of any analytishl procedures which differ firm t h e slpacified mathod{s).
D. Data Sheets:
A sample of bL]. ILeLd data eheeke which do not px.ov&dc t h e data r;hown on thr example sheets i n 40 CPR 69 for tha specified method(e).
E . Air Polkuti9n Control. Equipent:
Typea arid rrt&,lu cacturrrw of a l l control e q u i p n t i
W@lgn or guarantee efficiency; 4
Weiytl yaw volume at f u l l load (acfrn);
Design pressure drop! . . . -,- ..
~aintenance ScheQUl* and mrthod af recordkeeping; I_*_

EPA DUST LOADING Formulas
(1) ABSOLUTE FLUE PRESSURE (in. Hg)
Ps = ( *P f+ 13.6) + Pb
(2) WATER VAPOR VOLUME IN METERED GAS CORRECTED TO STANDARD CONDITIONS (scf)
Vwc = .04707 x VI Vwsg = .04715 x Wsg
vw = vwc + Vwsg
(3) METERED GAS VOLUME CORRECTED TO STANDARD CONDITIONS (scf)
Vms = 17.64 x Y X Vm Pb + (AH113.6) Tm
(4) PERCENT MOISTURE IN FLUE GAS
(5) AVERAGE RESULTS OF FLUE GAS ANALYSIS
%N2 dry = 100 - (%C02 + 0 1 0 0 ~ + O/OCO)
(6) APPROXIMATE MOLECULAR WEIGHT OF FLUE GAS (WET BASIS) (Ibllb-mole)
Ms = (18 x Bws) + ((.440 (O/oCOZ) + .320 (0/0O2) + .280 (O/oN2 + O/OCO)) x (1 - Bws)
(7) GAS VELOCITY IN FLUE (fps)
Vs = 85.49 x Cp x (fi ) Psx Ms
(8) FLUE GAS VOLUME AT ACTUAL CONDITIONS (acfm)
Vo = Vs x A x 60
(9) FLUE GAS VOLUME CORRECTED TO DRY STANDARD CONDITIONS (dscfh)
Page 2 of 3

EPA DUST LOADING FORMULAS (Continued)
(1 1) DUST CONCENTRATION FOR INDIRECT HEATING UNIT ACTUAL CONDITIONS AND STANDARD CONDITIONS
Wp = 0.002205 x Wg (Ib)
Wh = Wd x Qsd (Iblhr dry)
wa = 7000 x wp (grlacf)
Vt
Dl = 9820 20.9 Wd (IblmmBtu with constant 9820 Fr) (20.9 - 0/0O2)
Dl' = 20.9 Wd F r (IblmrnBtu with calculated Fr) (20.9 - %O2)
(12) PERCENT OF ISOKINETIC SAMPLING f
O h l = 1.667 x Ts x ' 0.00267 x Vlc + [Vmimx x ( P + AH113.6fl)
0 x Vs x Ps x An
Page 3 of 3

METHOD 5 - PARTICULATE EElCZlONS
NL 6 7 /.ee. ?LANT NAME: Camden County Maintenance VNIT TESTED: ADM PDM PLANT
J- + p '" I-
RUN NUMBER: 1 3ATE TESTED: ENTER NAME OF UNIT TESTED: ? ADM PDM Plant
in- ',/c 1'9 4i- gQ'* see M / J d A A
NO. OF POINTS 24 PERCENT OXYGEN TIME PER POINT 2.50 PERCENT CARBON DIOXIDE
12.4 &L.u.c* 6.1
LEAK RATE 0.0010 PERCENT CARBON MONOXIDE 0.0 '2 (METER CORR FACT) 1.010 Cp ( PITOT COEFF) 0.840 1s (STACK AREA) 3.83 Dn (NOZZLE DIAM) 0.212 Pbar (BAR PRESS) 29.14 Vinitial 128.550 Xn (WT PARTICULATE) qo0 Vf inal 175.167 Vc 368 'dsg 0.0
POINT NUMBER
1 2 3 4 5 6 7 8 9 10 I1 12 13 14 L5 16 1 7 18 19 2 0 2 1 7 2 2 3 ! 4
STAT1 C PRESSURE (PSI -0.82 -0.82 -0.82 -0.82 -0.82 -0.82 -0.82 -0.82 -0.82 -0.82 -0.82 -0.82 -0.82 -0.82 -0.82 -0.82 -0.82 -0.82 -0.82 -0.82 -0.82 -0.82 -0.82 -0.82
STACK TEMP (Ts) 271.0 271.0 270.0 268.0 266.0 261.0 264.0 264.0 266.0 267.0 266.0 260.0 265.0 266.0 265.0 263.0 259.0 252.0 263.0 263.0 263.0 261.0 257.0 251.0
VELOCITY PRESSURE (delta Ps) 2.43 2.61 3.32 3.09 2.92 1.01 2.14 2.25 2.20 1.82 1.39 0.47 1.89 1.72 2.20 1.29 0.94 0.54 1.53 1.04 0.90 0.78 0.57 0.59
ORIFICE PRESS DIFF (delta HJ 3.20 3.39 4.32 4.04 3.38 1.34 2.81 2.96 2.89 2.39 1.84 0.63 2.49 2.26 2.93 1.72 1.26 0.73 2.03 1.38 1.20 1.04 0.77 0.80
DRY GAS INLET (mi) 84.0 83.0 86.0 85.0 85.0 87.0 85.0 86.0 87.0 88.0 89.0 88.0 87.0 90.0 90.0 90.0 89.0 88.0 87.0 88.0 89.0 89.0 89.0 90.0
METER TEMP OUTLET tmo) 83.0 83.0 84.0 83.0 83.0 85.0 84.0 84.0 84.0 85.0 85.0 85.0 85.0 87.0 87.0 87.0 86.0 86.0 86.0 86.0 87.0 88.0 88.0 88.0
STACK VELOCITY 86.69 (ft/sec) egs >-" STANDARD VOLUME SAMPLED 44.53 (SCF) AVERAGE DRY GAS METER TEMP 86.4 (OF) PERCENT MOISTURE STANDARD STACK FLOW RATE
ISOKINETIC SAMPLING RATE PARTICULATE EMISSION RATE PARTICULATE EMISSION RATE

METHOD 5 - PARTICULATE EMISSIONS
'LANT NAME: C a m d e n C o u n t y M a i n t e n a n c e JNIT TESTED: ADM PDM PLANT tUN NUMBER: 2 >ATE TESTED: ENTER NAME OF U N I T TESTED: ? ADM PDM P l a n t
4 0 . OF POINTS 24 PERCENT OXYGEN 14.1 CIME PER POINT 2.50 PERCENT CARBON DIOXIDE 5.1 JEAK RATE O.OOIO PERCENT CARBON MONOXIDE 0.0 t (METER CORR FACT) 1.010 C p ( P I T O T COEFF) 0.840 4s (STACK AREA) 3.83 Dn (NOZZLE DIAM) 0.212 ?bar ( BAR PRESS ) 29.14 V i n i t i a l 175.568 4n ( WT PARTICULATE) *PO0 Vf inal 215.540 Jc 280. qsg 7.7
POINT WMBER
STAT1 C PRESSURE ( P s 1 -0.82 -0.82 -0.82 -0.82 -0.82 -0.82 -0.82 -0.82 -0.82 -0.82 -0.82 -0.82 -0.82 -0.82 -0.82 -0.82 -0.82 -0.82 -0.82 -0.82 -0.82 -0.82 -0.82 -0.82
STACK TEMP (Ts) 244.0 251.0 255.0 252.0 251.0 252.0 257.0 260.0 258.0 253.0 249.0 247.0 255.0 253.0 255.0 255.0 248.0 244.0 250.0 249.0 246.0 246.0 244.0 240.0
VELOCITY PRESSURE (delta Ps) 3.21 3.67 3.24 1.09 1.07 0.94 2.19 2.63 1.99 0.80 0.82 0.99 2.00 2.19 2.22 1.56 1.06 0.99 1.83 1.92 1.31 1.25 1.05 0.95
O R I F I C E PRESS D I F F ( d e l t a H) 3.00 3.38 3.00 1.01 0.99 0.87 2.02 2.41 1.84 0.74 0.77 0.93 1.85 2.03 2.06 1.44 0.99 0.93 1.71 1.80 1.23 1.18 0.99 0.90
DRY GAS METER TEMP INLET OUTLET ( T m i ) (Tmo) 90.0 89.0 89.0 89.0 92.0 91.0 91.0 90.0 91.0 90.0 90.0 90.0 92.0 92.0 92.0 90.0 93.0 91.0 93.0 91.0 92.0 91.0 91.0 91.0 92.0 91.0 92.0 91.0 93.0 91.0 93.0 92.0 94.0 92.0 94.0 92.0 93.0 92.0 93.0 91.0 93-0 92.0 94.0 93.0 93.0 92.0 94.0 93.0
AVG -0.82 250.6 1.27 1.59 92.3 91.1
STACK VELOCITY 87.90 ( f t / s e c ) STANDARD VOLUME SAMPLED 37.77 ( S C F ) AVERAGE DRY GAS METER TEMP 91.7 (OF) PERCENT MOISTURE 26.39 ( % ) STANDARD STACK FLOW RATE 10737.18 (DSCFIVI)
ISOKINETIC SAMPLING RATE 91.55 ( 8 ) PARTICULATE EM1 SSION RATE 3 ( l b /h r ) PARTICULATE EMISSION RATE 4 (gr/dscf 1 '

METHOD 5 - PARTI CIJLATE EI"JL:;S.I.ONS
lLANT NAME: Camden County Maintenance UNIT TESTED: ADM PDM PLANT RUN NUMBER: 3 3ATE TESTED: ENTER NAME OF UNIT TESTED: ? ADM PDM Plant
NO. OF POINTS 24 PERCENT OXYGEN 13 .0 TIME PER POINT 2.50 PERCENT CARBON DIOXIDE 5.6 LEAK RATE 0.0030 PERCENT CARBON MONOXIDE 0.0 Y (METER CORR FACT) 1.010 Cp (PITOT COEFF) 0.840 9s (STACK AREA) 3.83 Dn (NOZZLE DIAM) 0.212 Pbar ( BAR PRESS ) 29.14 Vinitial 216.394 Yn (WT PARTICULATE) 1 . a 0 0 Vf inal 257.303 V c 305.0 Y s g 18 .5
POINT NUMBER
STAT1 C PRESSURE (Ps) -0.82 -0.82 -0.82 -0.82 -0.82 -0.82 -0.82 -0.82 -0 .82 -0.82 -0.82 -0.82 -0.82 -0.82 -0.82 -0.82 -0.82 -0.82 -0.82 -0.82 -0 .82 -0.82 -0.82 -0 .82
STACK T m (Ts) 245.0 250.0 253.0 257.0 257.0 254.0 260.0 262.0 263.0 262.0 254.0 249.0 260.0 260.0 256.0 256.0 252.0 247.0 256.0 257.0 257.0 256.0 253.0 248.0
VELOCITY PRESSURE (delta Ps) 3.00 2.94 2.79 2.25 1 . 2 1 1.20 2.64 2.98 2.92 2.14 0.73 0 . 6 1 2.38 2.40 2.15 1 . 5 1 0.49 0 .69 2 . 2 1 2 .41 1 . 9 1 0.93 0.82 0.69
ORIFICE PRESS DIFF (delta H) 2.83 2.76 2 .01 2.10 1 .13 1 .13 2.46 2.77 2.70 1 .99 0.69 0.58 2 .22 2.24 2 .02 1.42 0.46 0.66 2 .07 2.26 1 .80 0.88 0.78 0.66
DRY GAS METER TEMP INLET OUTLET (mi) (Tho) 93.0 93.0 94.0 94.0 95.0 94.0 96.0 94.0 97.0 95.0 97.0 95.0 96.0 94.0 95.0 94.0 96.0 95.0 97.0 95.0 98.0 96.0 96.0 95.0 97.0 95.0 97.0 96.0 97.0 95.0 97.0 95.0 97.0 96 .0 97.0 96.0 97.0 95 .0 98.0 96.0 98.0 96.0 98.0 96.0 99.0 97.0 99.0 97.0
AVG -0.82 255.2 1 . 3 1 1 .69 96.7 95.2
STACK VELOCITY 91.10 tft/sec) STANDARD VOLUME SAMPLED 38.37 fSCF) AVERAGE DRY GAS METER TEMP 95.9 (OF) PERCENT MOISTURE 28 .41 ( % ) STANDARD STACK FLOW RATE 10754.03 (DSCm)
ISOKINETIC SAMPLING RATE 92.86 ( % ) PARTICULATE EMISSION RATE 0 0 9 (lb/hr) \ , 17 PARTICULATE EMISSION RATE O$08 (gr/dscf)