sheikh zain final presentation
TRANSCRIPT

IAMCS
Fall 2019 MSSE Capstone
Instrument Air Monitoring & Control System
Student: Zain SheikhMentor: Robert Krzystan

BiographyHouston, Texas native of 27 years
Located in Beaumont, Texas for the past 2 years
Instrumentation / Controls Engineer in Oil & Gas.
4 Years Experience in R&D, Capital Projects,
Refining and Chemical Operations
B.S. Electrical/Computer Engineering
University of Texas at Austin – 2015
Snowboarding, Motorcycle Riding, Travelling
PERSONAL
PROFESSIONAL
EDUCATION
INTERESTS 2

- Proposal
- Requirements Analysis
- Functional Analysis
- Conceptual Design
- Test Plan
- Trade Study
- System A-Spec
- Risk Management
- Schedule/EVM
- Lessons Learned
- Next Steps/Recommendations
Presentaion Outline
3

Proposal
4

ProposalObjective & Background
The IAMCS primarily provides monitoring and control capabilitiesfor an industrial grade air compressor. This includes EHM for thecompressor, performance and surge control functionality, and aninterface for operations interaction
Key Unmet User Needs:
1) Enhance Instrument Air Production
2) Provide Purging Functionality
3) Reduce Reliance on Nitrogen Backup
4) Improve Spare Capacity
5) Improve Instrument Air Generation Fleet Availability
Performance /
Surge Control
Subsystem
Instrumentation
& Control
Valves
EHM
Subsystem
Power
Distribution
Communication
Subsystem
Engineering
Workstation
Industrial Instrument Air Monitoring and Control System (IIAMCS)5

Requirements Analysis
6

Requirements AnalysisAnalysis Process
Identification of 109 requirements for the IAMCS involved directcommunication with Customer/SMEs, Independent Research, andReview, using CORE/MBSE tools
SME InterviewStandards
(ASME/API/ISA)Literature
SurveyInternal Design
PracticesSME Review
Key Artifacts: CONOPS, Requirements, Hierarchy Allocation, KPPs
7

Requirements AnalysisBreakdown / Metrics
Requirement Metric # of Reqs
Functional 36
Interface 14
Operational 27
Performance 32
Constraint 14
Qualitative Requirement 77
Quantitative Requirement 32
Binary Requirement 49
KPPs 9
Total Requirements 109
27
36
32
14
Operational Functional
Performance Interface
8

Requirements AnalysisKey Performance Parameters (KPPs)
Req ID Requirement Title Qual / Quant
R IAMCS Qual
R.1 Performance and Surge Control Qual
R.1.2 Surge Control Algorithm Qual
R.1.2.5 Response Time Quant
R.2 Equipment Health Monitoring Qual
R.2.3 Alarming Qual
R.4.1 I&CV Equipment Qual
R.4.3 Alarming and Shutdown Signals Qual
R.6 Communication Qual
- KPPs are mostly qualitative
- Requirements are high-level
- Many subsystem descriptions
- Ill-Defined, requiring refinement
and recycle through project
9

Requirements AnalysisConcept of Operations
Compressor
Instrument Air Header
M
Workstation
Local HMI
ValveV
alveSensors
Sensors
Sensors
PLC EHM
N/W SwitchControl System &
Alarm Panel
Field Local RIE
Atmosphere
10
Three Scenarios of Operation:- Startup Compressor- Monitor System / Generate Alarms through Continuous Operation- Surge Condition Management and Shutdown

Requirements AnalysisRequirements Tracking
11
109 Total Requirements identified as part of the RAR

Functional Analysis
12

Functional AnalysisAnalysis Process
Key Artifacts: Functional Context, Functions, Hierarchy Allocation,FFBDs, N2 Diagrams, Requirements Traceability
Decompose Top-Level Functions
Trace Functions to Requirements
Develop Functions for Unallocated Requirements
Update Requirements for
Unallocated Functions
Development of 101 Functions by maintaining tight integrationbetween requirements and functions with CORE for completecoverage of the system.
13

Functional AnalysisContext Diagram
14

Functional AnalysisHierarchy
Type Quantity
Root 1
Level-1 6
Level-2 40
Level-3 38
Level-4 16
Total 101
15

Functional AnalysisFFBDs (FUNC.4 – Perform Antisurge)
16

Functional AnalysisN2 Diagrams (FUNC.4)
17

Functional AnalysisTraceability (FUNC.4)
FUNC IAMCS Inputs Outputs R IAMCS
FUNC.4.1 Increase Flow through Compressor
Antisurge Alarm SignalBlowoff Valve Position MeasurementBlowoff Valve Setpoint
Blowoff Valve MovementBlowoff Valve Position Mismatch Signal
R.1.1 Hardware Equipment R.1.2.1 SIL Availability
FUNC.4.1.1 Determine Current Blowoff Valve Position
Antisurge Alarm SignalBlowoff Valve Position Measurement
Scaled Blowoff Valve Position Data R.1.1.4 Scan Time
FUNC.4.1.2 Generate New Blowoff Valve Signal
Blowoff Valve SetpointScaled Blowoff Valve Position Data
Blowoff Valve Analog Output Signal R.4.1.2 Signals
FUNC.4.1.3 Send Ramped Signal to Open Blowoff Valve
Blowoff Valve Analog Output Signal
Blowoff Valve Movement R.4.1.5 Conduits R.4.1.6 Wire Gauge R.4.1.7 Weatherproofing R.4.1.8 Conduit Drain R.4.3.2 Valve Fail Direction
FUNC.4.1.4 Monitor Blowoff Valve Open Position for Movement
Blowoff Valve Position Measurement
Blowoff Valve Position Mismatch Signal
R.1.1.4 Scan Time
FUNC.4.2 Detect if Antisurge Alarm Clears
Antisurge Alarm Signal Antisurge SD Signal R.1.1 Hardware Equipment
[…] […] [… CONTINUES …] [… CONTINUES …] [… CONTINUES …]18

Functional AnalysisRequirements Tracking
19
2 Requirements updated as part of the FAR- Panel run status indications (R.1.3.4)- Analog Signal Scaling (R.4.1.2)

Conceptual Design
20

Conceptual DesignDesign Process
Key Artifacts: Physical Context, Components, Interfaces, HierarchyAllocation, PBDs, Functional Traceability, Interface Traceability
Decompose Components/ Interfaces by Subsystem
Trace Components to
Functions
Develop Components for
Unallocated Functions
Trace Physical to Functional Interfaces
Definition of 67 Components (HW/SW) by accounting for variousfunctions performed by the IAMCS. Requirements also reviewedfor specific details associated with the component set.
21

Conceptual DesignHierarchy
Type Quantity
System 1
Subsystem 6
Assembly 6
HW Element 23
SW Element 5
SW Item 4
Element 12
External System 10
22
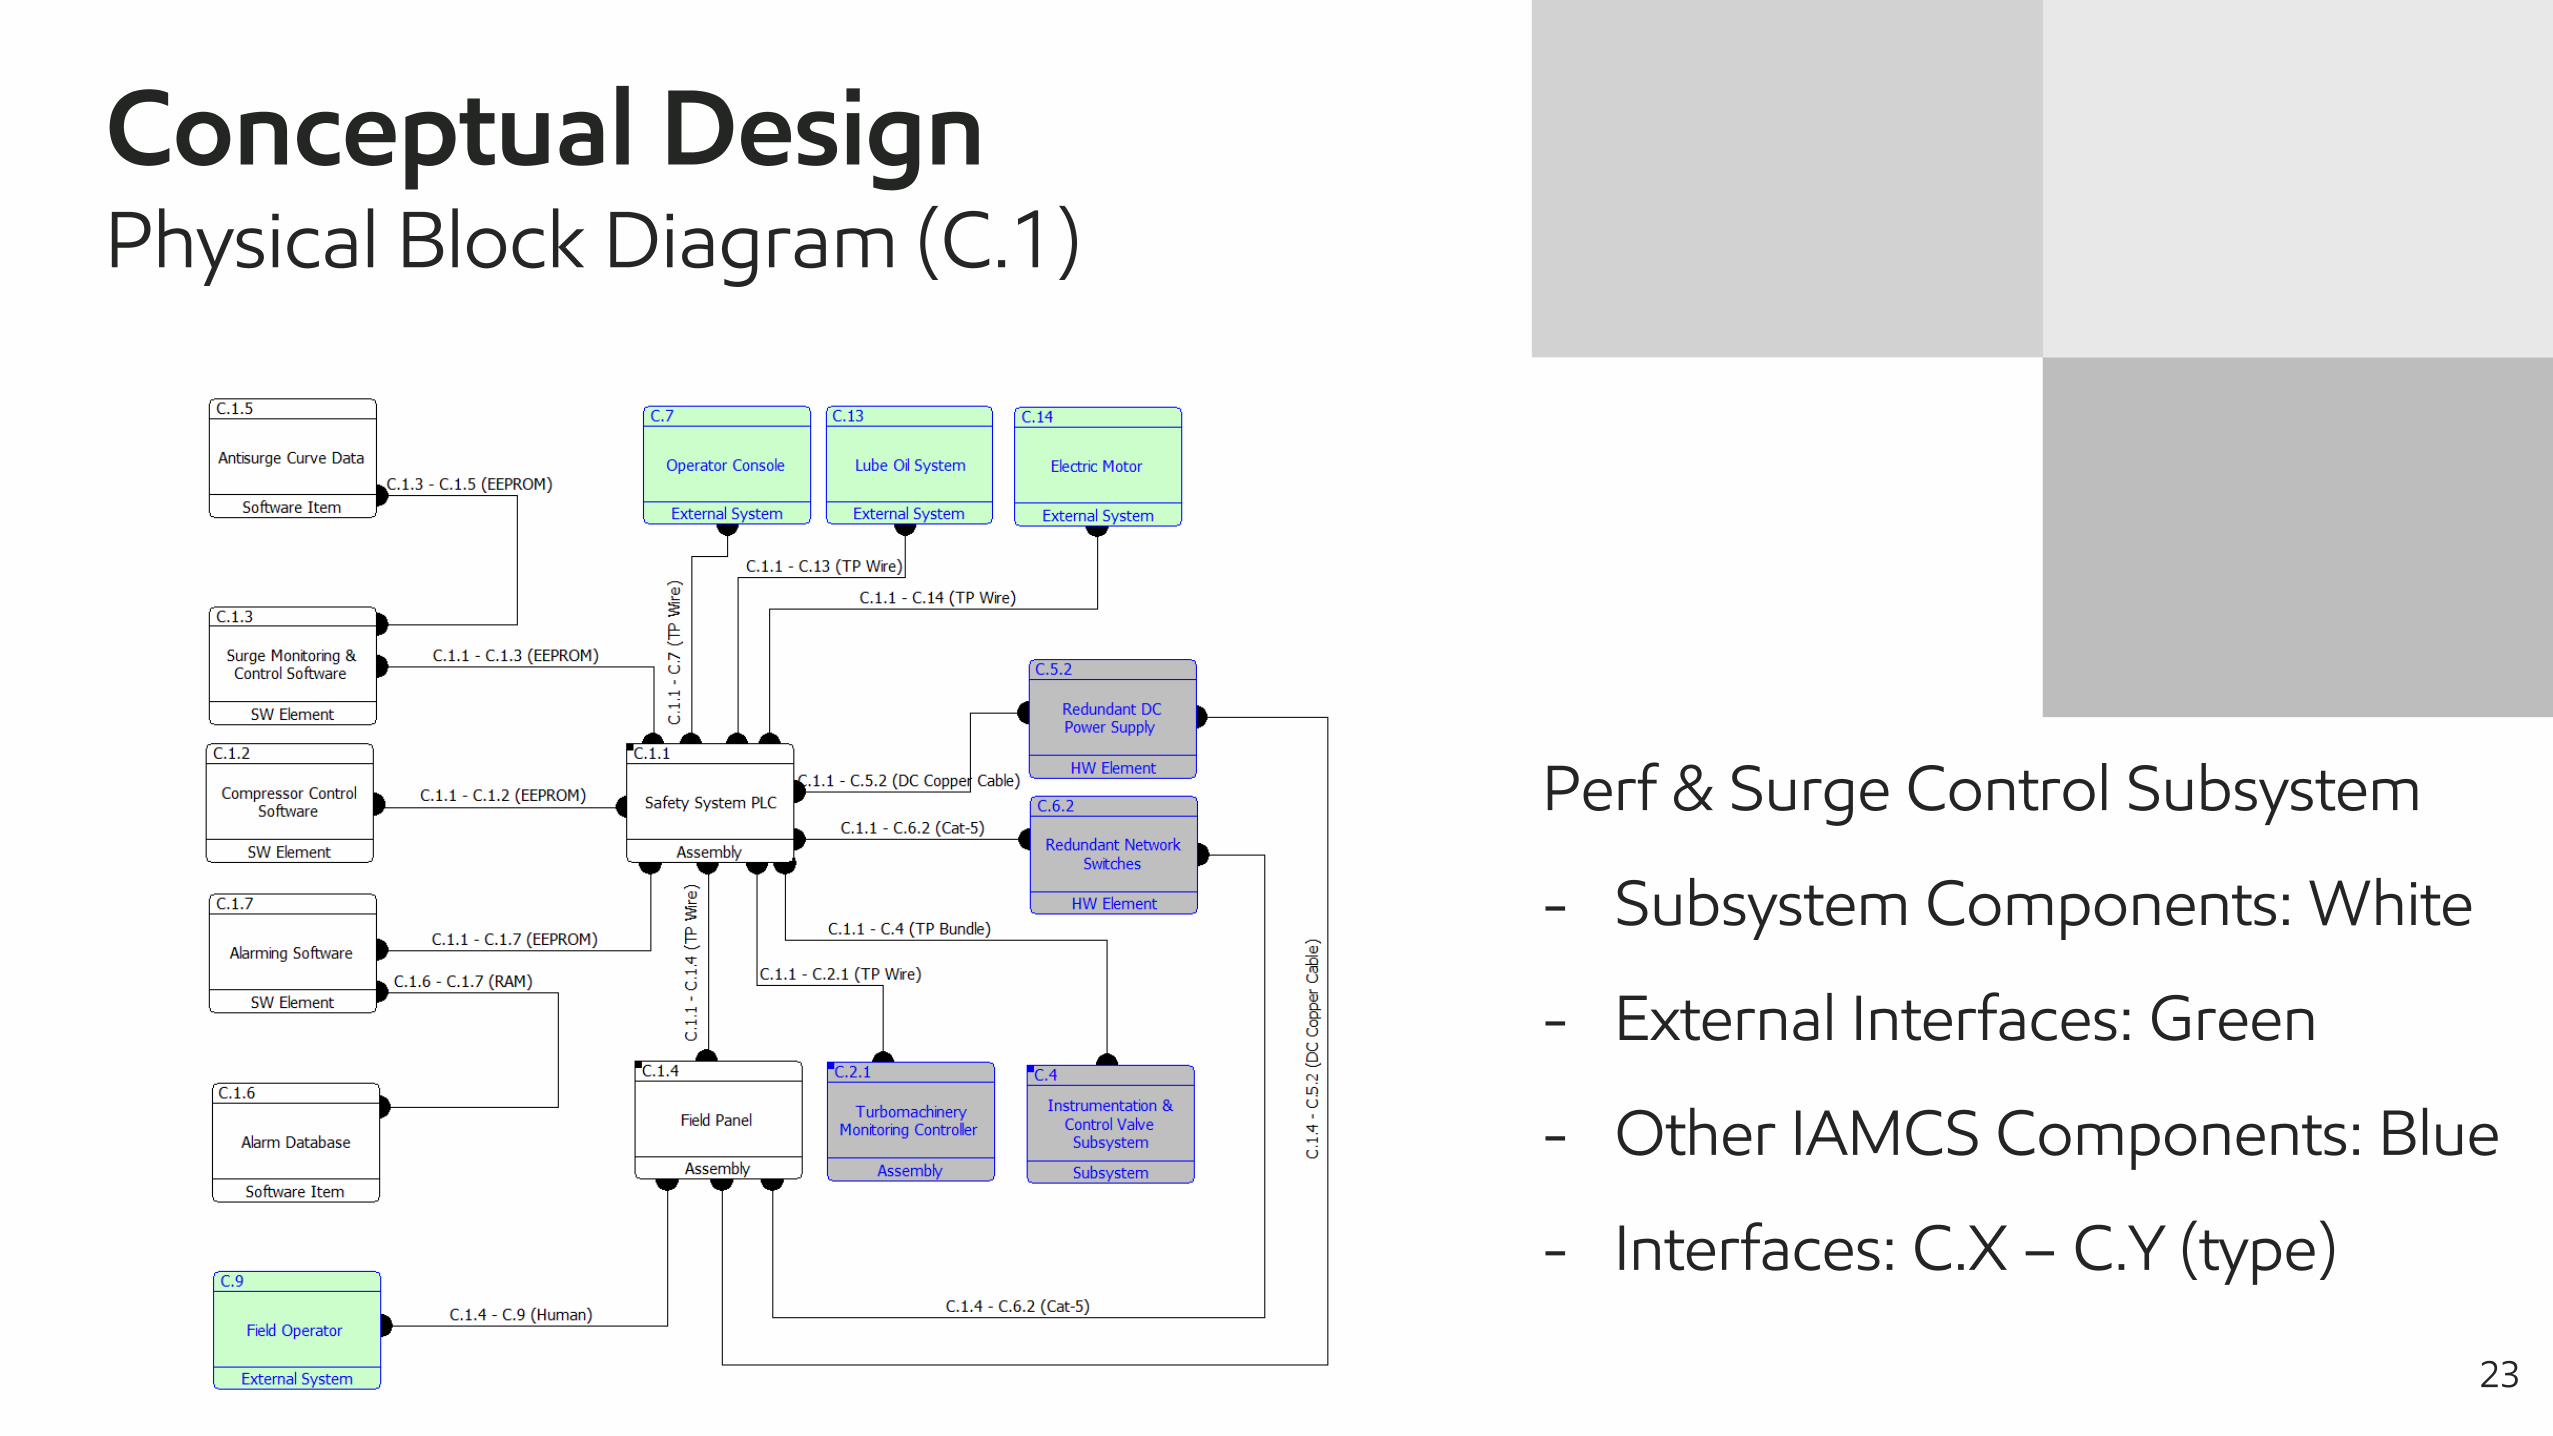
Conceptual DesignPhysical Block Diagram (C.1)
Perf & Surge Control Subsystem
- Subsystem Components: White
- External Interfaces: Green
- Other IAMCS Components: Blue
- Interfaces: C.X – C.Y (type)
23

Component ID Component Name Functional Traceability
C.1 Performance & Surge Control Subsystem 1 Startup Compressor
C.1.1 Safety System PLC 2 Monitor Surge
C.1.1.1 Triplicated Processors 3 Initiate Alarms & Shutdowns
C.1.1.2 Input Signal Modules 4 Perform Antisurge
C.1.1.3 Output Signal Modules 5 Shutdown Compressor
C.1.1.4 Communications Module 6 Support Engineering Interface
C.1.2 Compressor Control Software 1.4.1 Send Run Indication to Console
C.1.3 Surge Monitoring & Control Software 1.4.2 Send Run Indication to Local Field Panel
C.1.4 Field Panel 3.1 Detect New Measurement Value
C.1.4.1 Panel ESD Button 4.1 Increase Flow through Compressor
C.1.4.2 Local Run Status 5.4 Unload Compressor
C.1.4.3 HMI Display 5.7 Update Stop Indications on Control Interfaces
C.1.5 Antisurge Curve Data 1.3.1.1 Convert Numerical Setpoint to 4-20mA Signal
C.1.6 Alarm Database 1.3.2.3 Convert Valve Signal to Unitless Counts
C.1.7 Alarming Software 1.4.2.1 Enable Digital Output Signal from PLC
[… CONTINUES …] [… CONTINUES …] [… CONTINUES …]
Conceptual DesignFunctional Traceability (C.1)
24

Physical InterfacePhysical
MediumFunctional Interface
C.1 Performance & Surge
Control Subsystem
C.13 Lube Oil System TP Wires Lube Oil Pump Run Status
Lube Oil Skid Stop Command
Scaled Lube Oil Pressure Data
Scaled Lube Oil Temperature Data C.1 Performance & Surge
Control Subsystem
C.14 Electric Motor TP Wires Motor Run Status
Primary VFD Start Command
Primary VFD Status Feedback
Primary/Secondary VFD Stop Command
Secondary FVD Status Feedback
Secondary VFD Standby Command
VFD Healthy Signal C.1 Performance & Surge
Control Subsystem
C.4 Instrumentation &
Control Valve Subsystem
TP Wires Blowoff Valve Analog Output Signal
Intake Valve Analog Output Signal
Intake Valve Position 4-20mA Data
Surge/EHM 4-20mA Data [… CONTINUES …] [… CONTINUES …] […] [… CONTINUES …]
Conceptual DesignInterface Traceability (C.1)
25

Conceptual DesignRequirements Tracking
26
15 Requirements updated as part of the CDR- Content Updates associated with components- KPP Updates

Test Plan
27

Test PlanVerification Methodology
Build 1(PLC Core Utility
Functionality)
Build 2(PLC Performance
Functionality)
Build 3(PLC Sustainability
Functionality)
End(Commence
Qualification Testing)
Start(Commence
Integration Testing)
Test Plan developed for Safety System PLC. Integration testinginvolves 3 builds with 13 verifications. Qualification testing involved27 I/A/D/T verifications.
Type Quantity
Integration Build 1 4
Integration Build 2 4
Integration Build 3 5
Qualification Inspections 8
Qualification Analysis 4
Qualification Demonstrations 4
Qualification Tests 1128

Test PlanIntegration Build Details (I.B1)
29

Test PlanQualification Test/Demo Details (Q.T/D)
30

Test PlanRequirements Tracking
31
2 Requirements updated as part of the TPR- DAC resolution (R.1.1.9)- Vibration requirements (R.1.3.1)

Trade Study
32

Formal Trade Study to select the Safety SystemPLC for a Performance/Surge ControlSubsystem with optimal Cost-Effectivenessamongst 4 alternatives using 5 selection criteria.Consulted SMEs and technology providers
TMR
2oo3 Voted Sensors
2oo2 Voted Solenoids
Inputs Logic Solver Outputs
2oo3 Voted Processor
Trade StudyObjective
Triconex Tricon Honeywell Safety Manager
Rockwell TRUSTED System Emerson Delta V SIS
33

Trade StudySelection Criteria
Criteria Requirement
Processor Power
Consumption
R.5 Power Distribution
R.5.1 UPS
R.5.2 Bus Redundancy
R.5.5 Power Supplies
Vibration
ResiliencyR.1.3 Equipment Cabinets/Panels
Operating
Temperature
Range
R.1.1.8 Environment Temperature
R.1.3 Equipment Cabinets/Panels
Cybersecurity
Readiness
R.1.1.12 Controlled Access
R.3.4 Cybersecurity
Form FactorR.1.3.1 PLC Mounting
R.1.3.2 Footprint
- Demand on UPS and power Distribution Subsystem
- Indication of robust design- Long-term resiliency
- Operability in variety of climates- Account for failed climate control
- Protection for a highly networked environment with increasing threats
- Efficient use of real-estate
34

Trade StudyCriteria Comparison, Weights, Utility
0
0.2
0.4
0.6
0.8
1
1.2
0 20 40 60 80 100 120
Uti
lity
Power Consumption (Watts)
Power Consumption Utility Curve
Relative
Importance Scale
Relative Importance
Description
1 Equal Preference
3 Moderate Preference
5 Strong Preference
7 Very Strong Preference
9 Absolute Preference
35

Trade Study Results / Sensitivity Analysis
The Triconex Tricon consistently earned the highest Cost-Effectiveness Score in thefinal results and in each of the sensitivity analyses
36

Trade StudyRequirements Tracking
37
1 Requirement updated as part of the TSR- PLC Cybersecurity (R.1.1.12)

System A-Spec
38

A-SpecSystem Specification Summary
Requirement Metric# of
Reqs
# of
Updates
# of Final
Reqs
Functional 36 12 36
Interface 14 3 14
Operational 27 9 27
Performance 32 4 32
Constraint 14 5 19
Qualitative Requirement 77 23 54
Quantitative Requirement 32 23 55
Binary Requirement 49 3 52
KPPs 9 14 7
Total Requirements 109 28 109
Compilation of Requirement updatesthrough the Development process
Many requirements recharacterized(Quan/Qual, KPPs, Constraints, etc.)
KPPs transitioned from high-levelqualitative requirements to specificquantitative requirements
Documents key traceability betweenrequirements, functions, components
39

A-SpecFinal KPPs (Quantitative)
40

A-SpecGuidance for Further Development
41
Business/Technology Factors- Determine preventative maintenance/equipment strategy for
Greater System of Systems (Machinery, Fixed Equipment, Aux, Etc.)
Design Flexibility- Instrumentation: Manifolds, Remote Mount, Brackets, Tubing, etc.- Valve Design Complexity: Ball/Globe/Butterfly, Actuation Pressure,
Shutoff Class, Response Time, etc.
Additional Analysis- Revisit Feasibility Study: Maintenance budget, operations
resources, incremental energy costs, etc.

A-SpecRequirements Tracking
42
29 Requirements updated as part of the SSR- Content Updates- Qualitative -> Quantitative

Risk Management
43

Risk ManagementOverview
Risk Identification Risk Assessment Risk Mitigation Risk Tracking
4 identifiable technical risks were assessed and categorized ashigh/medium. 16 activities conducted to mitigate risks to acceptablelevels. Risks were tracked using “Risk Worksheets”
44
X X
X
O O
5
4
3
2
1
1 2 3 4 5
Consequence
Lik
elih
ood

Risk ManagementResults of Mitigations
45

Risk ManagementTracking Worksheet (T-01)
Risk ID: T-01
Risk Title: SIF Availability
Risk Type: Technical
Risk Description: If the selected
components of a Safety
Instrumented Function (Instrument,
Logic Solver, Final Element) do not
have a high enough availability
target for a given test interval, then
the SIF will not meet the required
SIL availability target.
Risk Status: Closed
Risk Data
X
C
5
4
3
2
1
1 2 3 4 5
Consequence
Lik
elih
oo
d
High
Moderate
Low
X
O
C
Initial
End-Goal
Current
Risk Matrix Tracking
RAR FAR TS CDR TP
Hig
hM
ed
Lo
w
SS
Initial
End-Goal
Current
Risk Waterfall Tracking
Mitigation Strategy Tracking
– RAR: Identify all SIFs and functional
components through adequate research and
interviews with SMEs
– TS: identify technical options that have
anticipated levels of availability.
– CDR: Explore and adjust potential test intervals
and determine if they are practical and feasible.
– TP: Specify the need for industrial modeling
tools that can be used to calculate SIF availabilities
ActionDate
Planned Actual
Risk Level
Likelihd Conseq
9/30
10/24
-
11/12
9/16
10/13
10/27
11/10
3
3
3
3
2
Complete
Yes
Yes
No
Yes
46

Schedule / EVM
47

Project PerformanceSchedule
48
Overall schedule performance lagged through October (CDR)before efficiency and productivity brought project back on schedule.

Project PerformanceEarned Value Management
49
EVM metrics support schedule assessment. Productivity, assupported by Cost Performance Indicator, was boosted after CDR.254 total hours budgeted. 263 actual hours required.

Next Steps / Recommendations
50

Project ReviewLessons Learned
MBSE Tools: CORE- Highly Valuable: Database tracking, traceability through elements
(Reqs, Funcs, Components, Links, etc.), diagram generation
Additional Tools and Organization- Track other metrics in an external Database (i.e. Qual/Quant,
Binary, Verification Method)
Work Ethic and Efficiency- Finding time is difficult. Finding time with “peak productivity” is
even more difficult51

Project ReviewEvaluation and Next Steps
Value-AddedDesign artifacts are thoroughand provide a foundation forfurther development
Case-Study style comparison toEmployer’s Capital ProjectDevelopment System
Next StepsFurther Engineering required totake this conceptual design tofruition
Applicable Learnings can beapplied to ongoing/ futureprojects
52

Project ReviewRecommendations
Sponsored Projects- Work on project with Faculty, other Industry Partner, or APL- Benefit: Challenging/Unfamiliar Projects, Formal Interactions with
3rd Parties
Proposal Presentations- Formulate proposal as 645.767 deliverable, or require formal
Presentation to staff- Benefit: Offers students opportunity to practice presenting scope
of project. Work embedded into curriculum
53

54