sheep prevalence 1.4 - wormwise
TRANSCRIPT

Prevalence of anthelmintic resistance on sheep farms in New Zealand
February 2006
Part 2a of a series
Funders
Sustainable Farming Fund – project SFF03/064
Meat & Wool New Zealand – project MWI 03/WS-62
Schering Plough Animal Health limited
Project leader Tony Rhodes
PGG Wrightson Consulting
Project team Dave Leathwick, Tania Waghorn AgResearch Ltd
Bill Pomroy, Dave West Institute of Veterinary, Animal and Biomedical Sciences, Massey University Ron Jackson, Kevin Lawrence Epicentre, Massey University John Moffat Schering Plough Animal Health Ltd
Institute of Veterinary, Animal and Biomedical Sciences

Contents
Prevalence of anthelmintic resistance on sheep farms in New Zealand .......1
Introduction.........................................................................................................1
Materials and methods .......................................................................................2
Farm selection................................................................................................2 Treatment and analysis ..................................................................................3 Statistical analysis ..........................................................................................4
Results.................................................................................................................5
Farm Locations...............................................................................................6 Faecal Egg Count Reduction Test..................................................................7 Month of Testing...........................................................................................13 Larval culture................................................................................................20
Discussion.........................................................................................................31
Acknowledgements ..........................................................................................33
References.........................................................................................................34
Appendix 1 Protocol for lamb Faecal Nematode Egg Count Reduction Test ...36
Appendix 2 Sheep Farm Questionnaire ...........................................................39
1
Introduction The development and spread of internal parasite resistance to anthelmintics continues, as evidenced by submissions to animal health laboratories, practice surveys and field observations. Farmer drenching practices were surveyed nationally in the early 1980’s (Brunsdon, Kissling et al. 1983) and a much smaller postal survey in the mid 1990’s and early 2000’s (Macchi, Pomroy et al. 1999; Sharma, Pomroy et al. 2005). Submissions to animal health laboratories over a decade or more have been tabulated and published giving perhaps our strongest indication of the progress in resistance development. The most recent of these reports (McKenna 1998), which was based on a relatively small number of submissions, detected resistance to benzimidazole, levamisole and benzimidazole + levamisole combinations in 66%, 29% and 16% of cases respectively. While these data are undoubtedly open to questions regarding their representation of the greater pool of New Zealand farms, they clearly indicate that resistance has increased substantially since the early survey of Brunsdon et al (Brunsdon, Kissling et al. 1983). Surveys (Brunsdon, Kissling et al. 1983); (Macchi, Pomroy et al. 1999) have indicated that the number of drench treatments given annually by sheep farmers had changed little over the intervening 15-20 year period. Further, the use of long-acting drench products, which were not available in the 1980’s, has now become common place on many farms, leading to the suggestion (Leathwick, Pomroy et al. 2001) that, even though the number of treatments may have remained static, parasite exposure to drenches is likely to have increased with time. Recently we have seen confirmation of resistance to the macrocyclic lactone (avermectin) family of drenches occurring in sheep, which marks a significant milestone in that we now have resistance to all the major drench action families. In addition, the recent identification in goats of strains of Ostertagia circumcincta and Trichostrongylus colubriformis which were highly resistant to a combination of all 3 action families given at higher than normal dose rates, is a cause of concern, especially as these parasites readily infect sheep. The issue of resistance is not limited to just species that infect sheep and goats. The spectre of resistance was initially highlighted in New Zealand in 1980 (Kemp and Smith 1980). Through the 2 decades since then farmers have been encouraged to drench-test, develop annual drench-family rotations, adopt preventive-drenching practices, use faecal egg counts and trigger drenching, and quarantine management as tactics for reducing the rate of development of resistance on their farm. From time to time the advice has changed, often as new information has become available. The problem is that many farmers perceive elements of conflict in some of the messages and consequently find it easy to defer to continuing their status quo practices and management. The result of this is that farmers' drenching practices have remained largely unchanged for the last 15�20 years while, over the same time period, resistance has gone from being an oddity to being common place. It is now clear that the status quo approach is applying substantial selection pressure for resistance and is therefore unsustainable in the longer term. Much of the technical advice presented to farmers is
2
based on studies that show short term economic gains from liberal use of anthelmintics. This advice is unbalanced technically due to a dearth of longitudinal studies of long term effects on productivity, animal health and economics. Australian researchers have generally been more proactive than their New Zealand counterparts at surveying for resistance prevalence. One of these surveys went further in attempting to identify the influence and association of climatic and farm management factors on the development of anthelmintic resistance on sheep farms in Western Australia (Suter, Besier et al. 2004). However, a weakness of this study was that selection of participants was biased favouring farms that had previously submitted a faecal egg count reduction test (FECRT). This project set out to establish a New Zealand-wide profile of the prevalence and severity of internal parasite resistance across a sample of breeding ewe flocks and to identify common factors associated with the development of resistance. By linking current resistance status with a survey of farming practices this project sought to identify risk factors for those farms which have resistance, data which will complement the results of trial-based research into factors contributing to the development of resistant nematodes. In the sheep study, additional farms with either known or suspected ML resistance were tested and their parasite control practices documented. This was to enable a case-controlled study to be undertaken for the risk factors associated with the occurrence of ML resistance on these farms by comparing them to similar farms without ML resistance. Combined, both this project and other empirical trials into factors selecting for resistance provide a basis for an extension programme targeting farmers, veterinarians and industry about the situation, risks and strategies that sheep and beef farmer’s face. The objectives of the study were to determine the prevalences of inefficacy to macrocyclic-lactone, albendazole and levamisole in sheep farms in New Zealand using faecal egg count reduction tests and larval cultures.
Materials and methods
Farm selection The target group was defined as 100 breeding-ewe based flocks with greater than 1000 ewes wintered. A random sample of farms was drawn from the AgriQuality Agribase (Sanson and Pearson 1997; Sanson 2000) Regional bias was minimised by ensuring that the regional distribution of farms in the sample was proportionate to the total number of farms with greater than 1,000 ewes by region. Sheep farms in all regions of New Zealand, with the exception of South Island High Country farms, were included in the sampling frame. High country South Island farms were excluded since their management is typically extensive and a separate project was investigating similar issues for this enterprise type. From an initial Agribase sample of 500 farms, a total of 400 farmers were telephoned. Farms were screened for suitability for the survey against criteria of: greater than 1,000 ewes lambing in 2004; access to scales and a facility for weighing lambs; and availability

3
of lambs in the 3 months post weaning. Where the number of lambs purchased in each of the previous 2 seasons was greater than 25% of the number of own-bred lambs, the farm was excluded. An additional non-random group of a maximum of 40 sheep farms was targeted on the additional criterion of having a high probability of macrocyclic-lactone resistance. Veterinarians were invited to refer farms for this group, with awareness promoted through correspondence from the New Zealand Veterinary Association, and advice to veterinarians and veterinary practices participating in the project. From 37 farms nominated by veterinarians as highly likely to have macrocyclic-lactone resistance, 32 farms, hereinafter referred to as the purposive group, were enrolled in the study. When these criteria were met, the project was described and the farmer was invited to participate. Where the farmer indicated an interest in participating, contact details were confirmed and the name of the veterinarian they would prefer to undertake the survey was obtained. Details of the project were confirmed in writing with the farmers. Veterinary practices were contacted, the project outlined and a list of the participating farmers nominating them as their preferred practice was provided. Practices were required to nominate a project sponsor and key contact. Standard commercial arrangements and protocols were presented to each veterinary practice, which partially recompensed the veterinarian for their input. The project was undertaken with no direct cost to farmers, although they were required to manage stock to facilitate achievement of the pre-treatment egg count, submit faecal samples, and muster and handle stock on at least two occasions. A standard operating protocol (Appendix 1) and questionnaire (Appendix 2) were developed for the study. Standardised kits containing all drench, sample pottles, syringes, forms, questionnaire and courier materials for the survey were prepared by AgResearch and supplied to veterinarians once the monitor FEC reached the required threshold. At either of the two visits to the farm the veterinarian worked with the farmer to complete the questionnaire which examined parasite and farm management practices. Faecal egg counts were required prior to the faecal egg count reduction test (FECRT) commencing to ensure egg numbers were sufficient to minimise errors in the test. The mean level to enable commencement of the FECRT was specified as 700 epg for lambs.
Treatment and analysis Treatments involved 60 animals on each farm, with 10 lambs in each treatment. Animals were dosed orally with a syringe at dose rates calculated for individual body weights. Control animals were untreated. Treatment groups and the proprietary names of the treatments employed are listed in Table 1.
4
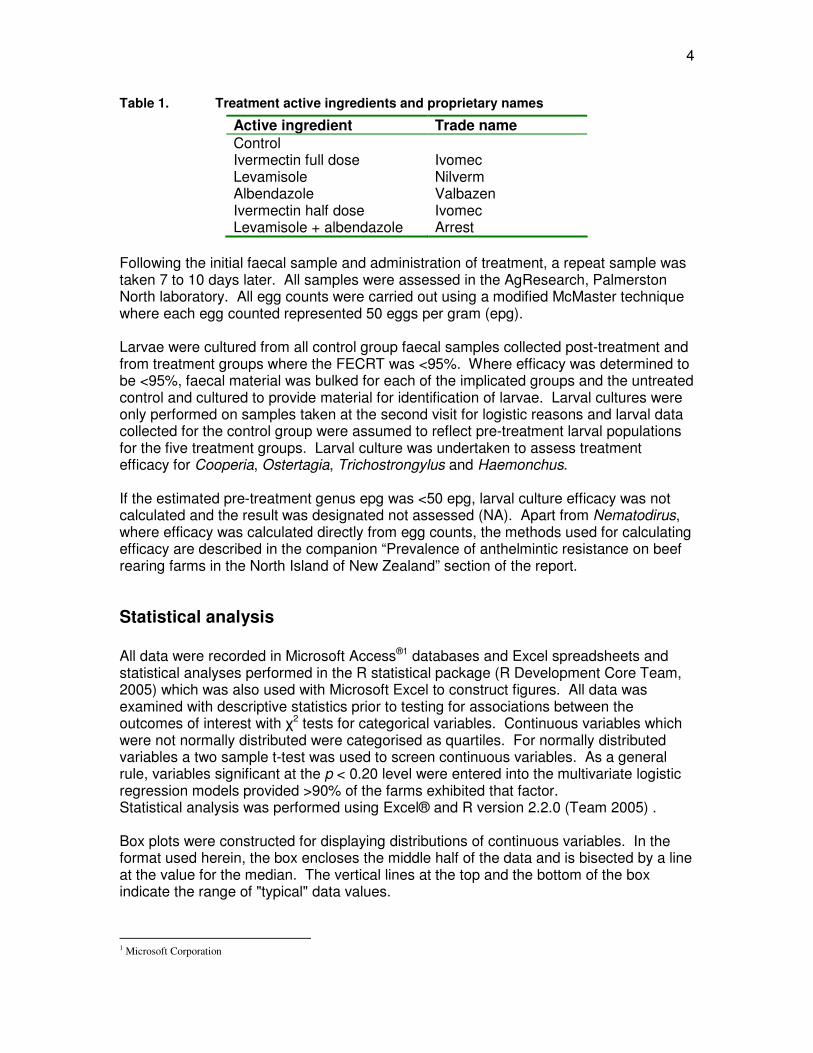
Table 1. Treatment active ingredients and proprietary names
Active ingredient Trade name Control Ivermectin full dose Ivomec Levamisole Nilverm Albendazole Valbazen Ivermectin half dose Ivomec Levamisole + albendazole Arrest
Following the initial faecal sample and administration of treatment, a repeat sample was taken 7 to 10 days later. All samples were assessed in the AgResearch, Palmerston North laboratory. All egg counts were carried out using a modified McMaster technique where each egg counted represented 50 eggs per gram (epg). Larvae were cultured from all control group faecal samples collected post-treatment and from treatment groups where the FECRT was <95%. Where efficacy was determined to be <95%, faecal material was bulked for each of the implicated groups and the untreated control and cultured to provide material for identification of larvae. Larval cultures were only performed on samples taken at the second visit for logistic reasons and larval data collected for the control group were assumed to reflect pre-treatment larval populations for the five treatment groups. Larval culture was undertaken to assess treatment efficacy for Cooperia, Ostertagia, Trichostrongylus and Haemonchus. If the estimated pre-treatment genus epg was <50 epg, larval culture efficacy was not calculated and the result was designated not assessed (NA). Apart from Nematodirus, where efficacy was calculated directly from egg counts, the methods used for calculating efficacy are described in the companion “Prevalence of anthelmintic resistance on beef rearing farms in the North Island of New Zealand” section of the report.
Statistical analysis All data were recorded in Microsoft Access®1 databases and Excel spreadsheets and statistical analyses performed in the R statistical package (R Development Core Team, 2005) which was also used with Microsoft Excel to construct figures. All data was examined with descriptive statistics prior to testing for associations between the outcomes of interest with �2 tests for categorical variables. Continuous variables which were not normally distributed were categorised as quartiles. For normally distributed variables a two sample t-test was used to screen continuous variables. As a general rule, variables significant at the p < 0.20 level were entered into the multivariate logistic regression models provided >90% of the farms exhibited that factor. Statistical analysis was performed using Excel® and R version 2.2.0 (Team 2005) . Box plots were constructed for displaying distributions of continuous variables. In the format used herein, the box encloses the middle half of the data and is bisected by a line at the value for the median. The vertical lines at the top and the bottom of the box indicate the range of "typical" data values.
1 Microsoft Corporation

5
Prevalences and proportions are displayed wherever possible as point estimates with 95% confidence intervals in brackets. Confidence intervals along with point estimates give an indication of the precision of the effect and the uncertainty about the point estimate. If the confidence intervals are 95%, then we can say in general terms that in 95% of replications of the study the interval will include the true value of the point estimate. Confidence intervals were calculated using the formula from EpiSheet© 2002 written by Ken Rothman.
Results A total of 80 random selection farms, derived from 119 that met the preconditions set for inclusion, plus 32 purposive selection farms participated in the study. The distributions of participating farms according to their North or South Island location and random or purposive selection criteria are shown in Table 2.
Table 2. Study population makeup of number of farms aimed for in the study design (target) and numbers of participant farms according to their North or South Island location
Study Group Target Participants North Island South Island Random 100 80 41 39
Purposive 40 32 29 3 Total 140 112 70 42
Full quotas of samples were not submitted for all farms and in some cases there were insufficient faeces for testing. Of a potential 13440 lamb faecal egg counts, viz 120 per farm, 13073 were submitted, equating to about an overall 2.7% sample submission failure rate. About 20% of farms tested submitted fewer than 116 lamb samples with sufficient faeces to enable analysis. The relative frequencies of the number of samples submitted per farm are shown in Figure 1.
120
119
118
117
116
114
112
110
108
104
103
102 96 94
Total Number of Lamb Faecal Egg Counts Per Farm
Rel
ativ
e Fr
eque
ncy
0.0
0.1
0.2
0.3
0.4
0.5
Figure 1. Frequencies of the number of samples submitted per farm
6
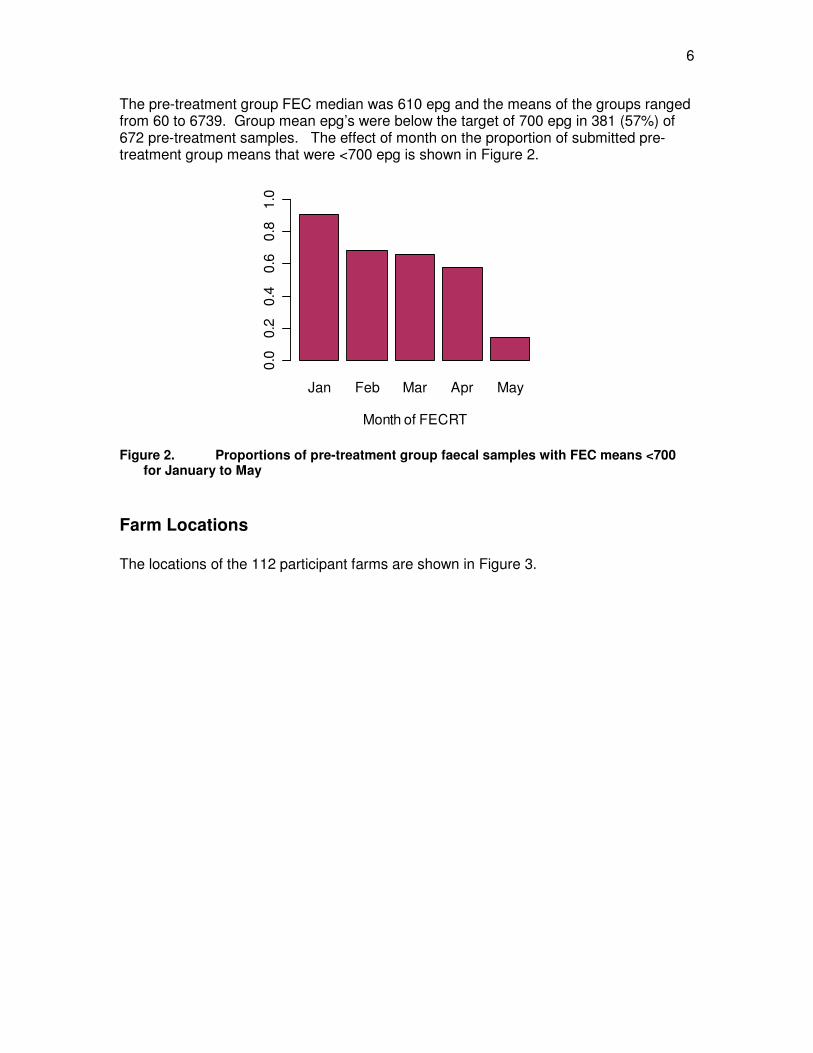
The pre-treatment group FEC median was 610 epg and the means of the groups ranged from 60 to 6739. Group mean epg’s were below the target of 700 epg in 381 (57%) of 672 pre-treatment samples. The effect of month on the proportion of submitted pre-treatment group means that were <700 epg is shown in Figure 2.
Jan Feb Mar Apr May
Month of FECRT
0.0
0.2
0.4
0.6
0.8
1.0
Figure 2. Proportions of pre-treatment group faecal samples with FEC means <700
for January to May
Farm Locations The locations of the 112 participant farms are shown in Figure 3.
7
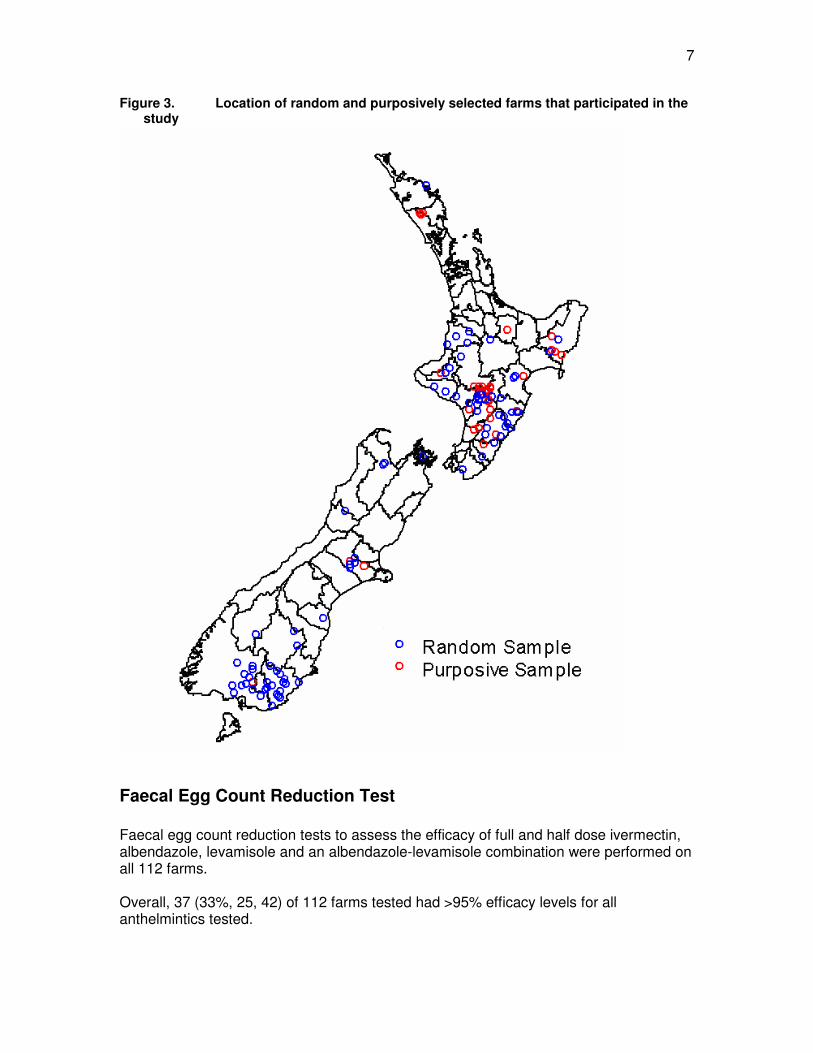
Figure 3. Location of random and purposively selected farms that participated in the study
Faecal Egg Count Reduction Test Faecal egg count reduction tests to assess the efficacy of full and half dose ivermectin, albendazole, levamisole and an albendazole-levamisole combination were performed on all 112 farms. Overall, 37 (33%, 25, 42) of 112 farms tested had >95% efficacy levels for all anthelmintics tested.

8
Figure 4 shows no significant difference between the proportions of North and South Island randomly selected farms with <95% efficacy against all anthelmintics tested.
Figure 4. Proportion of farms with <95%efficacy for each anthelmintic treatment group (Full and Half = full and half dose ivermectin ,Lev = levamisole , Alb = albendazole and Com = combination albendazole and levamisole) among North and South Island farms with the Y axis indicating the proportion of farms with <95% efficacy for the anthelmintic treatment
Alb Com Half Full Lev
Anthelmintic Treatment Group
0.0
0.2
0.4
0.6
0.8
1.0
South Island n=39North Island n=41
The various treatment group efficacies for the random and purposively chosen farms categories are shown in Figure 5. Differences can be seen for full and half dose ivermectin and levamisole treatments. Overall, 29 of 80 (36% 27, 47) randomly selected farms and 8 of 32 (25% 13, 42) purposively selected farms had efficacy levels >95% for all anthelmintic treatments tested. Three farms, one random and two purposively sampled, had efficacy levels <95% for all five anthelmintic treatment groups tested.

9
Figure 5. Proportion of farms with <95%efficacy for each anthelmintic treatment group (Full and Half = full and half dose ivermectin ,Lev = levamisole , Alb = albendazole and Com = combination albendazole and levamisole,) among purposively and random selected farms
Alb Com Half Full Lev
Anthelmintic Treatment Group
0.0
0.2
0.4
0.6
0.8
1.0
Random Sample Purposive SampleTotal
Individual farms differed greatly in FECRT efficacy levels calculated for each of the five anthelmintic treatments and the between-farm variation is illustrated in Figure 6.

10
Figure 6. Distribution of FECRT efficacies for each of the 112 sheep farms
12 3 4 5 6 9 11121314
1516
1718
2122
2324
2526
2728293032
3334353637
3839
4042
4446
4748
4951
5255
5657
58596061
6264656667697071
7273747677798081838688
8990
9192
9496
99105
106107
109112
78
1019203141
43455053
5463
6875
7882
8485
8793
959798100
101102103104108110111
Ivermectin Albendazole Levamisole 1/2 Ivermectin Combination
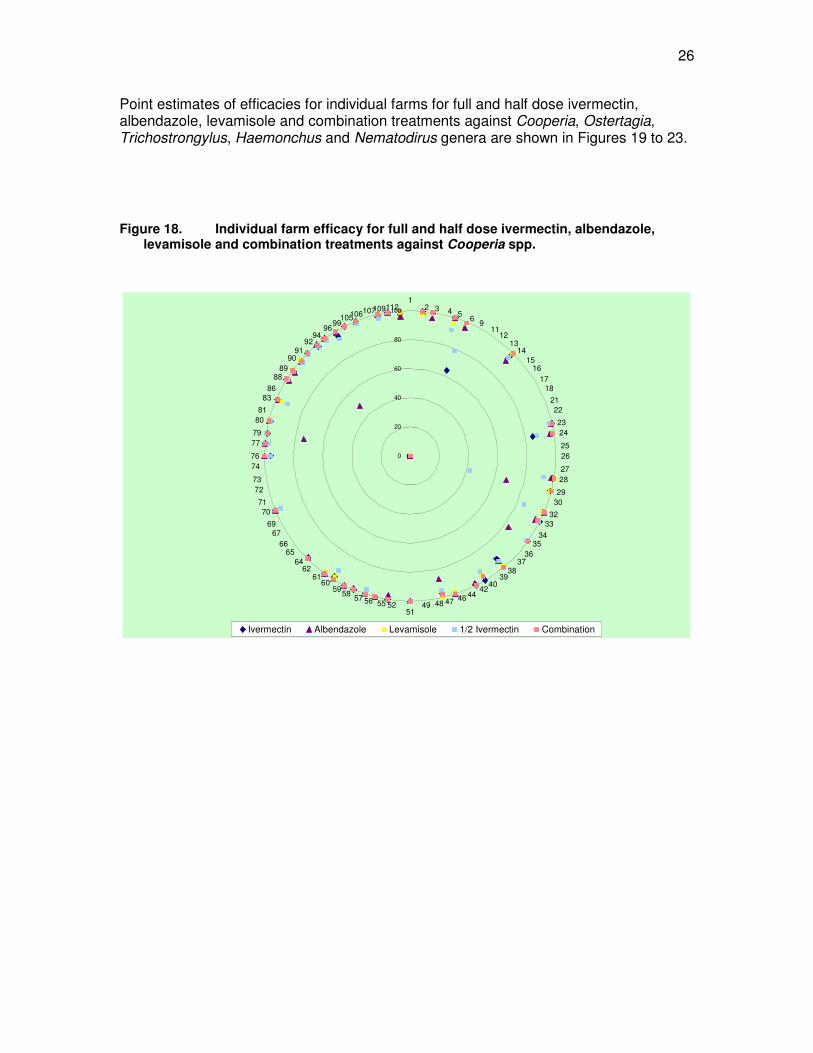
In Figure 6, treatments which achieved 100% efficacy are placed on the circumference, with reducing levels of efficacy indicated by placement towards the centre of the figure, where efficacy is nil. As an example, on farm 1 efficacy from FECRT’s for ivermectin, albendazole, levamisole, half-dose ivermectin and combination treatments were 83%, 84%, 100%, 65% and 100%. Differences between the purposive and random selection farms in prevalence of resistance to an individual anthelmintic were reflected in the proportion of farms with resistance to more than one anthelmintic treatment. About 30% of purposive farms showed evidence of resistance to both half dose ivermectin and levamisole, or half dose ivermectin and albendazole. The distribution of prevalences of <95% drench efficacy for more than one anthelmintic family in random, purposive and all study farms are shown in Figure 7.
11
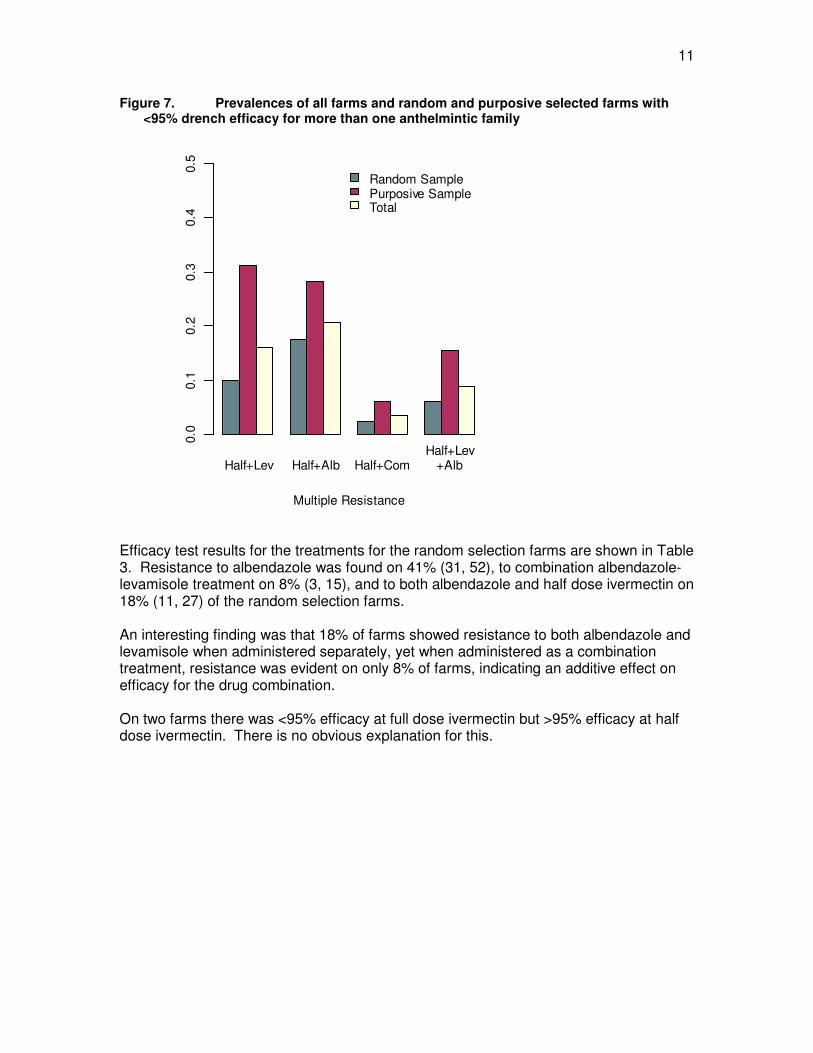
Figure 7. Prevalences of all farms and random and purposive selected farms with <95% drench efficacy for more than one anthelmintic family
Half+Lev Half+Alb Half+ComHalf+Lev
+Alb
Multiple Resistance
0.0
0.1
0.2
0.3
0.4
0.5
Random SamplePurposive SampleTotal
Efficacy test results for the treatments for the random selection farms are shown in Table 3. Resistance to albendazole was found on 41% (31, 52), to combination albendazole-levamisole treatment on 8% (3, 15), and to both albendazole and half dose ivermectin on 18% (11, 27) of the random selection farms. An interesting finding was that 18% of farms showed resistance to both albendazole and levamisole when administered separately, yet when administered as a combination treatment, resistance was evident on only 8% of farms, indicating an additive effect on efficacy for the drug combination. On two farms there was <95% efficacy at full dose ivermectin but >95% efficacy at half dose ivermectin. There is no obvious explanation for this.
12
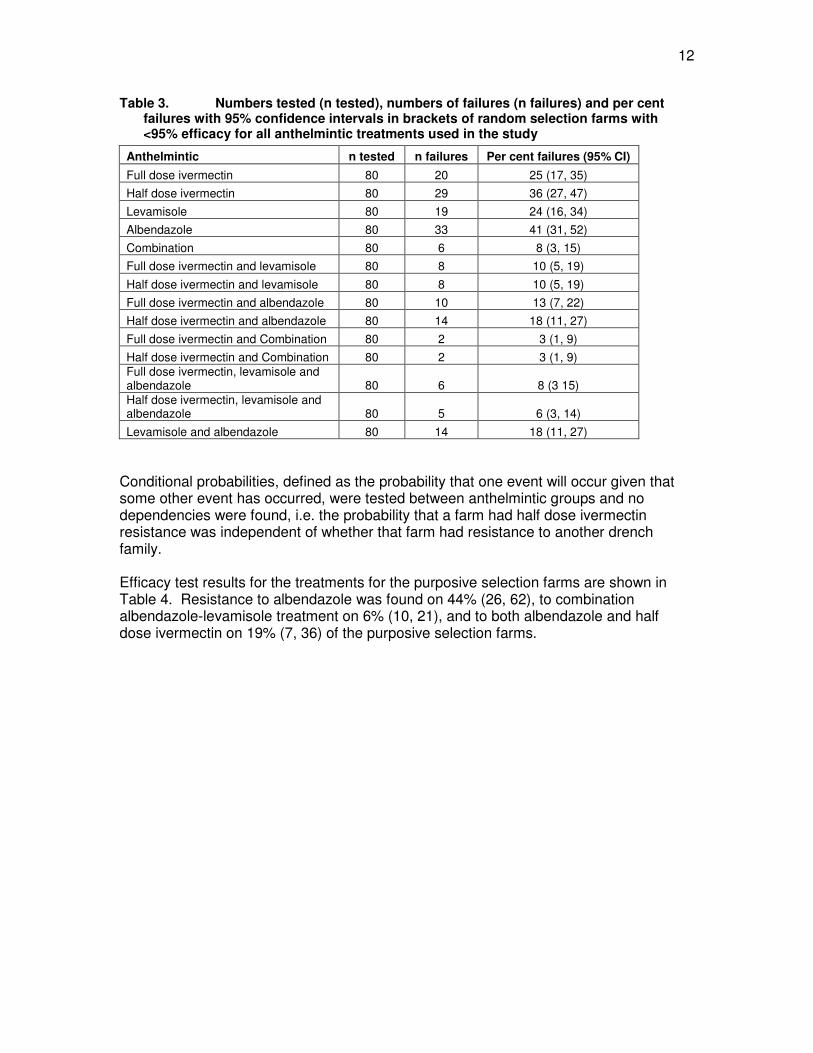
Table 3. Numbers tested (n tested), numbers of failures (n failures) and per cent failures with 95% confidence intervals in brackets of random selection farms with <95% efficacy for all anthelmintic treatments used in the study
Anthelmintic n tested n failures Per cent failures (95% CI) Full dose ivermectin 80 20 25 (17, 35) Half dose ivermectin 80 29 36 (27, 47) Levamisole 80 19 24 (16, 34) Albendazole 80 33 41 (31, 52) Combination 80 6 8 (3, 15) Full dose ivermectin and levamisole 80 8 10 (5, 19) Half dose ivermectin and levamisole 80 8 10 (5, 19) Full dose ivermectin and albendazole 80 10 13 (7, 22) Half dose ivermectin and albendazole 80 14 18 (11, 27) Full dose ivermectin and Combination 80 2 3 (1, 9) Half dose ivermectin and Combination 80 2 3 (1, 9) Full dose ivermectin, levamisole and albendazole 80 6 8 (3 15) Half dose ivermectin, levamisole and albendazole 80 5 6 (3, 14) Levamisole and albendazole 80 14 18 (11, 27)
Conditional probabilities, defined as the probability that one event will occur given that some other event has occurred, were tested between anthelmintic groups and no dependencies were found, i.e. the probability that a farm had half dose ivermectin resistance was independent of whether that farm had resistance to another drench family. Efficacy test results for the treatments for the purposive selection farms are shown in Table 4. Resistance to albendazole was found on 44% (26, 62), to combination albendazole-levamisole treatment on 6% (10, 21), and to both albendazole and half dose ivermectin on 19% (7, 36) of the purposive selection farms.
13
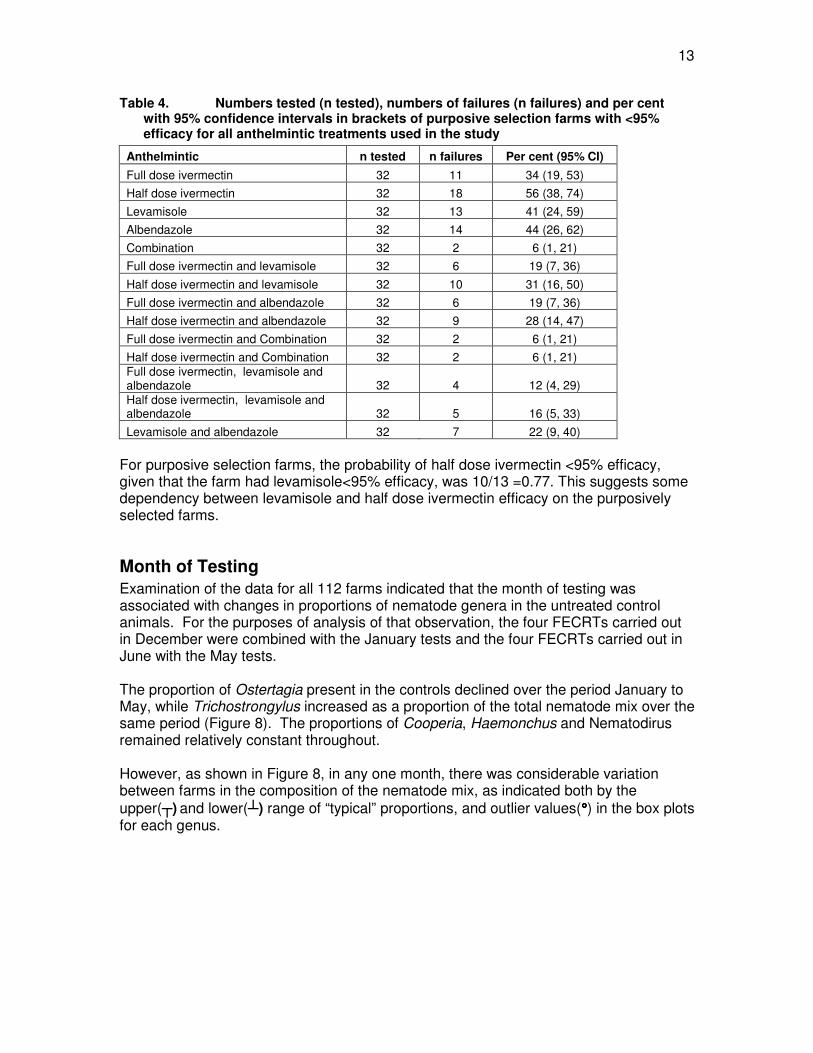
Table 4. Numbers tested (n tested), numbers of failures (n failures) and per cent with 95% confidence intervals in brackets of purposive selection farms with <95% efficacy for all anthelmintic treatments used in the study
Anthelmintic n tested n failures Per cent (95% CI) Full dose ivermectin 32 11 34 (19, 53) Half dose ivermectin 32 18 56 (38, 74) Levamisole 32 13 41 (24, 59) Albendazole 32 14 44 (26, 62) Combination 32 2 6 (1, 21) Full dose ivermectin and levamisole 32 6 19 (7, 36) Half dose ivermectin and levamisole 32 10 31 (16, 50) Full dose ivermectin and albendazole 32 6 19 (7, 36) Half dose ivermectin and albendazole 32 9 28 (14, 47) Full dose ivermectin and Combination 32 2 6 (1, 21) Half dose ivermectin and Combination 32 2 6 (1, 21) Full dose ivermectin, levamisole and albendazole 32 4 12 (4, 29) Half dose ivermectin, levamisole and albendazole 32 5 16 (5, 33) Levamisole and albendazole 32 7 22 (9, 40)
For purposive selection farms, the probability of half dose ivermectin <95% efficacy, given that the farm had levamisole<95% efficacy, was 10/13 =0.77. This suggests some dependency between levamisole and half dose ivermectin efficacy on the purposively selected farms.
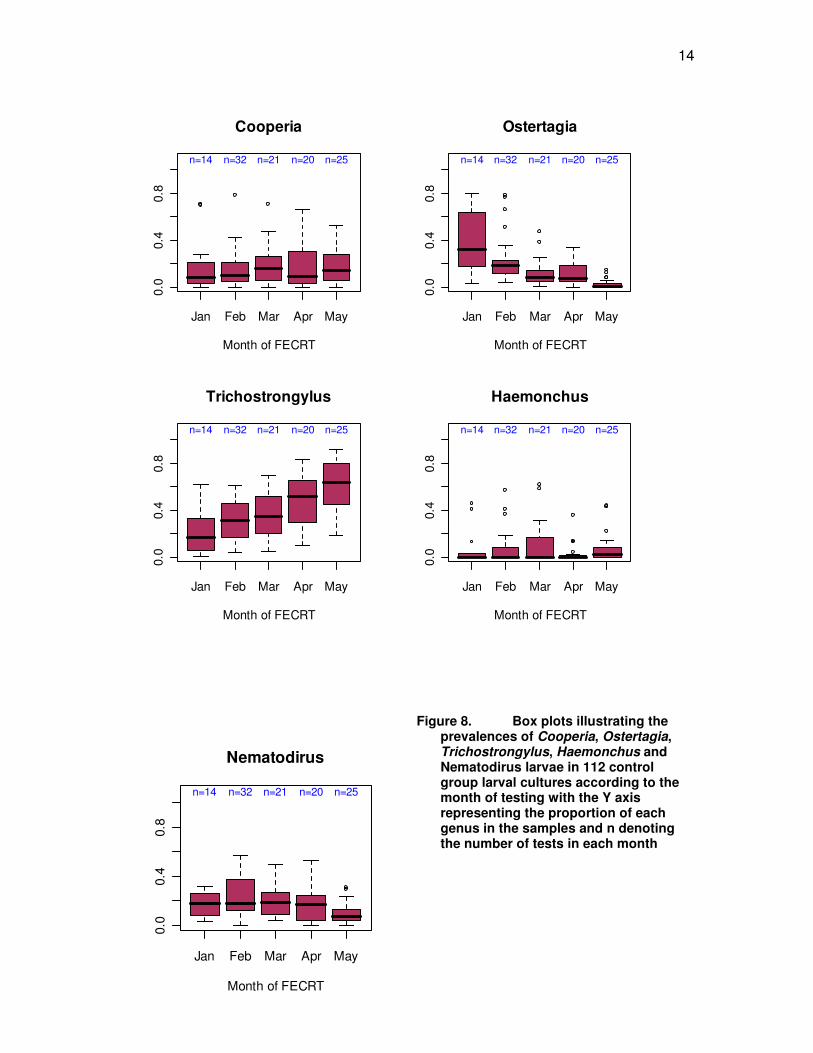
Month of Testing Examination of the data for all 112 farms indicated that the month of testing was associated with changes in proportions of nematode genera in the untreated control animals. For the purposes of analysis of that observation, the four FECRTs carried out in December were combined with the January tests and the four FECRTs carried out in June with the May tests. The proportion of Ostertagia present in the controls declined over the period January to May, while Trichostrongylus increased as a proportion of the total nematode mix over the same period (Figure 8). The proportions of Cooperia, Haemonchus and Nematodirus remained relatively constant throughout. However, as shown in Figure 8, in any one month, there was considerable variation between farms in the composition of the nematode mix, as indicated both by the upper(�) and lower(�) range of “typical” proportions, and outlier values(°°°°) in the box plots for each genus.
14
Jan Feb Mar Apr May
0.0
0.4
0.8
Cooperia
Month of FECRT
n=14 n=32 n=21 n=20 n=25
Jan Feb Mar Apr May
0.0
0.4
0.8
Ostertagia
Month of FECRT
n=14 n=32 n=21 n=20 n=25
Jan Feb Mar Apr May
0.0
0.4
0.8
Trichostrongylus
Month of FECRT
n=14 n=32 n=21 n=20 n=25
Jan Feb Mar Apr May
0.0
0.4
0.8
Haemonchus
Month of FECRT
n=14 n=32 n=21 n=20 n=25
Figure 8. Box plots illustrating the prevalences of Cooperia, Ostertagia, Trichostrongylus, Haemonchus and Nematodirus larvae in 112 control group larval cultures according to the month of testing with the Y axis representing the proportion of each genus in the samples and n denoting the number of tests in each month
Jan Feb Mar Apr May
0.0
0.4
0.8
Nematodirus
Month of FECRT
n=14 n=32 n=21 n=20 n=25
15
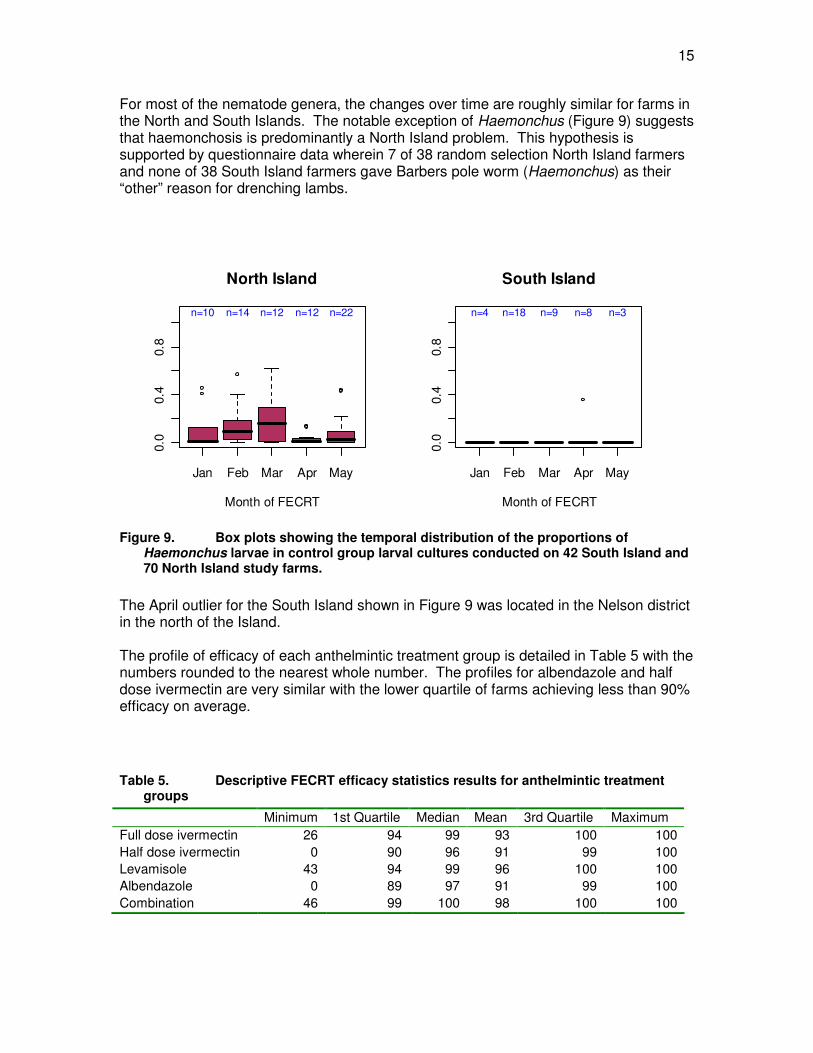
For most of the nematode genera, the changes over time are roughly similar for farms in the North and South Islands. The notable exception of Haemonchus (Figure 9) suggests that haemonchosis is predominantly a North Island problem. This hypothesis is supported by questionnaire data wherein 7 of 38 random selection North Island farmers and none of 38 South Island farmers gave Barbers pole worm (Haemonchus) as their “other” reason for drenching lambs.
Jan Feb Mar Apr May
0.0
0.4
0.8
North Island
Month of FECRT
n=10 n=14 n=12 n=12 n=22
Jan Feb Mar Apr May
0.0
0.4
0.8
South Island
Month of FECRT
n=4 n=18 n=9 n=8 n=3
Figure 9. Box plots showing the temporal distribution of the proportions of
Haemonchus larvae in control group larval cultures conducted on 42 South Island and 70 North Island study farms.
The April outlier for the South Island shown in Figure 9 was located in the Nelson district in the north of the Island. The profile of efficacy of each anthelmintic treatment group is detailed in Table 5 with the numbers rounded to the nearest whole number. The profiles for albendazole and half dose ivermectin are very similar with the lower quartile of farms achieving less than 90% efficacy on average.
Table 5. Descriptive FECRT efficacy statistics results for anthelmintic treatment groups
Minimum 1st Quartile Median Mean 3rd Quartile Maximum Full dose ivermectin 26 94 99 93 100 100 Half dose ivermectin 0 90 96 91 99 100 Levamisole 43 94 99 96 100 100 Albendazole 0 89 97 91 99 100 Combination 46 99 100 98 100 100
16
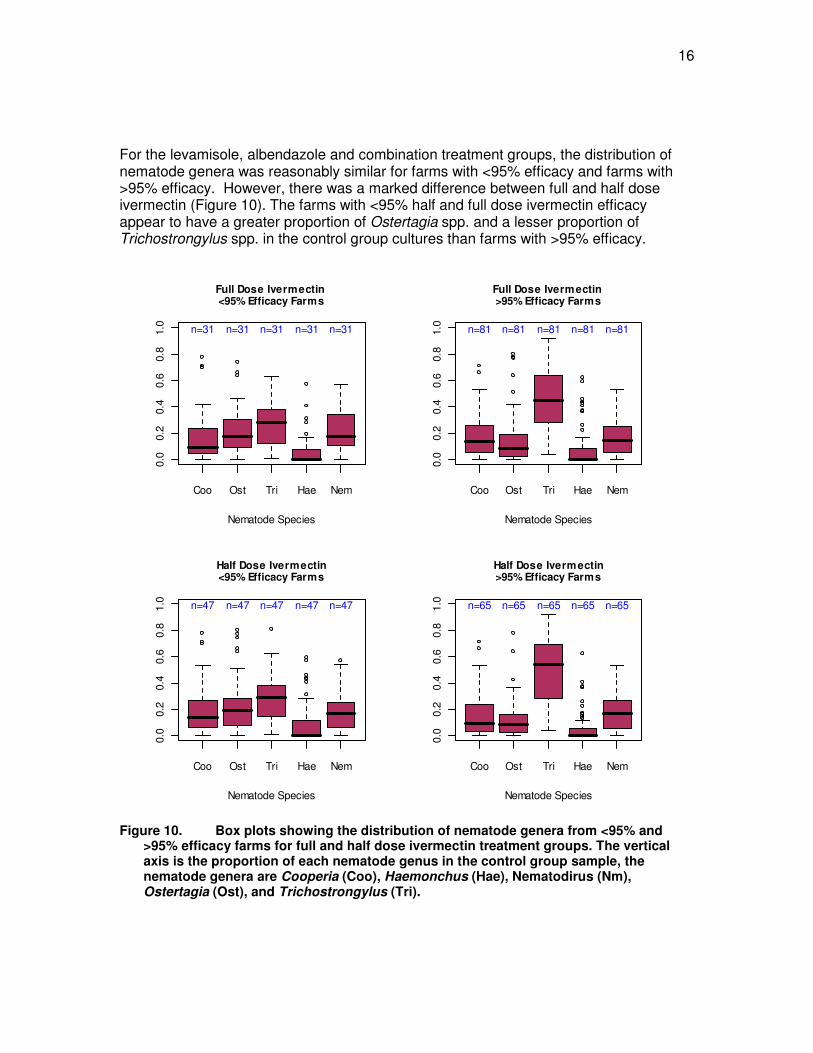
For the levamisole, albendazole and combination treatment groups, the distribution of nematode genera was reasonably similar for farms with <95% efficacy and farms with >95% efficacy. However, there was a marked difference between full and half dose ivermectin (Figure 10). The farms with <95% half and full dose ivermectin efficacy appear to have a greater proportion of Ostertagia spp. and a lesser proportion of Trichostrongylus spp. in the control group cultures than farms with >95% efficacy.
Coo Ost Tri Hae Nem
0.0
0.2
0.4
0.6
0.8
1.0
Full Dose Ivermectin <95% Efficacy Farms
Nematode Species
n=31 n=31 n=31 n=31 n=31
Coo Ost Tri Hae Nem
0.0
0.2
0.4
0.6
0.8
1.0
Full Dose Ivermectin >95% Efficacy Farms
Nematode Species
n=81 n=81 n=81 n=81 n=81
Coo Ost Tri Hae Nem
0.0
0.2
0.4
0.6
0.8
1.0
Half Dose Ivermectin<95% Efficacy Farms
Nematode Species
n=47 n=47 n=47 n=47 n=47
Coo Ost Tri Hae Nem
0.0
0.2
0.4
0.6
0.8
1.0
Half Dose Ivermectin>95% Efficacy Farms
Nematode Species
n=65 n=65 n=65 n=65 n=65
Figure 10. Box plots showing the distribution of nematode genera from <95% and
>95% efficacy farms for full and half dose ivermectin treatment groups. The vertical axis is the proportion of each nematode genus in the control group sample, the nematode genera are Cooperia (Coo), Haemonchus (Hae), Nematodirus (Nm), Ostertagia (Ost), and Trichostrongylus (Tri).
17
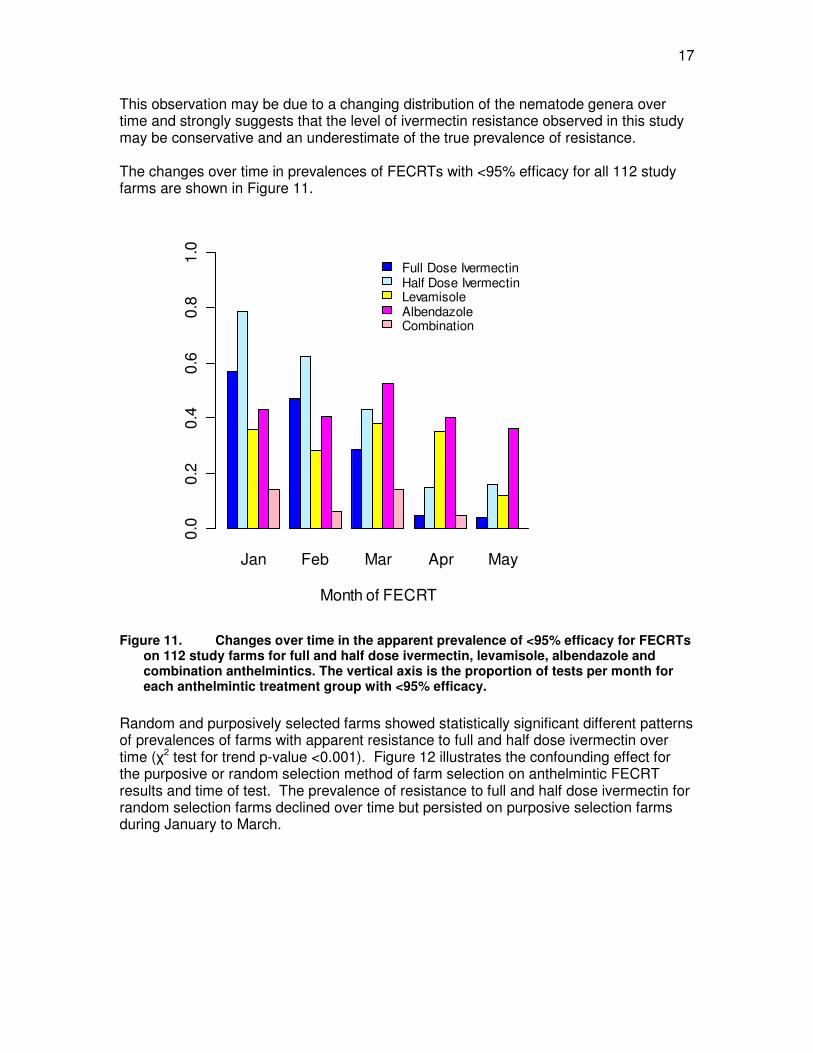
This observation may be due to a changing distribution of the nematode genera over time and strongly suggests that the level of ivermectin resistance observed in this study may be conservative and an underestimate of the true prevalence of resistance. The changes over time in prevalences of FECRTs with <95% efficacy for all 112 study farms are shown in Figure 11.
Jan Feb Mar Apr May
Month of FECRT
0.0
0.2
0.4
0.6
0.8
1.0
Full Dose IvermectinHalf Dose IvermectinLevamisoleAlbendazoleCombination
Figure 11. Changes over time in the apparent prevalence of <95% efficacy for FECRTs
on 112 study farms for full and half dose ivermectin, levamisole, albendazole and combination anthelmintics. The vertical axis is the proportion of tests per month for each anthelmintic treatment group with <95% efficacy.
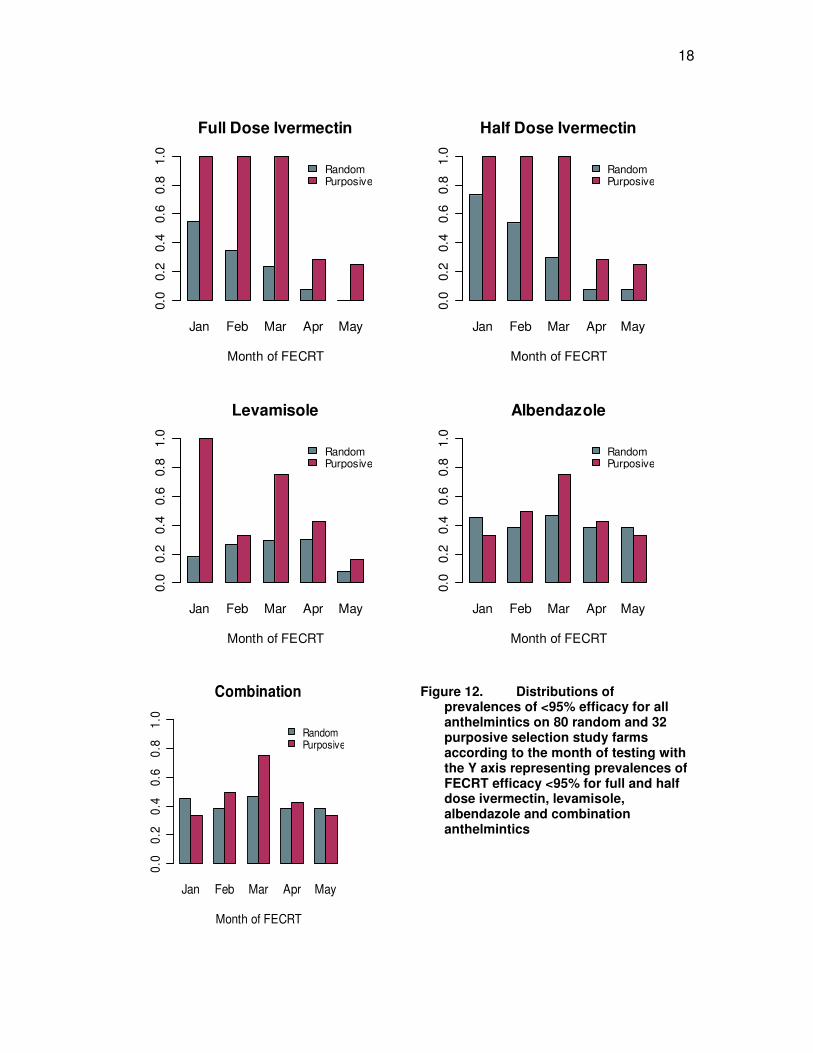
Random and purposively selected farms showed statistically significant different patterns of prevalences of farms with apparent resistance to full and half dose ivermectin over time (�2 test for trend p-value <0.001). Figure 12 illustrates the confounding effect for the purposive or random selection method of farm selection on anthelmintic FECRT results and time of test. The prevalence of resistance to full and half dose ivermectin for random selection farms declined over time but persisted on purposive selection farms during January to March.
18
Jan Feb Mar Apr May
Full Dose Ivermectin
Month of FECRT
0.0
0.2
0.4
0.6
0.8
1.0
Random Purposive
Jan Feb Mar Apr May
Half Dose Ivermectin
Month of FECRT
0.0
0.2
0.4
0.6
0.8
1.0
Random Purposive
Jan Feb Mar Apr May
Levamisole
Month of FECRT
0.0
0.2
0.4
0.6
0.8
1.0
RandomPurposive
Jan Feb Mar Apr May
Albendazole
Month of FECRT
0.0
0.2
0.4
0.6
0.8
1.0
RandomPurposive
Figure 12. Distributions of prevalences of <95% efficacy for all anthelmintics on 80 random and 32 purposive selection study farms according to the month of testing with the Y axis representing prevalences of FECRT efficacy <95% for full and half dose ivermectin, levamisole, albendazole and combination anthelmintics
Jan Feb Mar Apr May
Combination
Month of FECRT
0.0
0.2
0.4
0.6
0.8
1.0
RandomPurposive

19
Purposively selected farms tested between January and March were 3.8 (1.79, 8.06) times more likely to test positive for ivermectin resistance than farms tested later in the year between April and June (Table 6). Whether this finding applies equally to North and South Island farms is unclear since 29 of the purposively selected farms were located in the North Island.
Table 6. Relationship between number of farms indicating resistance on purposively selected farms and period of testing
Period of testing January to March April to June Farms with ivermectin resistance detected 13 5 Farms with ivermectin efficacy >95% 0 14 The changes in mean pre-treatment faecal egg counts with date of the FECRT are illustrated in Figures 13 and 14.
Jan Feb Mar Apr May
010
0020
0030
00
Month of FECRT
FE
C
n=84 n=192 n=126 n=120 n=150
Figure 13. Box plots showing the change in distribution of the mean pre-treatment
faecal egg counts with month of testing; n is the number of treatment groups having faecal egg counts completed each month

20
Date of FECRT
FE
C
Dec Jan Feb Mar Apr May Jun
010
0020
0030
00
Figure 14. Scatter plot of the mean faecal egg counts for all pre-treatment groups
versus date of FECRT. The shaded area shows the variability around a kernel-smoothed regression line (red line) fitted to the data using a bandwidth of 18days.
The increase in mean faecal egg counts from January to May appears almost linear although both graphs (Figures 13 and 14) illustrate the considerable variability observed about the median faecal egg counts at any particular date (correlation coefficient, 0.44 (0.38, 0.5).
Larval culture It is difficult to calculate precise prevalences of inefficacy for specific drugs and genera since it is not possible to classify the efficacy levels of the not-assessed results and the exclusion of cultures from treatment groups where the FECRT was >95%. Furthermore, the calculation methods produce estimates with wide confidence intervals. For these reasons, the adjusted prevalences levels for genus and treatments in Table 7 are reported as point estimates with a qualitative scale of severity ranging from very low, low, moderate, high and very high in brackets. Post-treatment control faeces were cultured for all 80 random selection farms and the larval proportions were assumed to represent the pre-test proportions.

21
Summary results from larval culture testing (with the exception of Nematodirus where egg count reduction data were used) among 80 random selection farms, according to drug and larval genus. The table reports the number of farms for which the particular genus was estimated to be present at >50 epg in the pre-treatment samples, the number of farms where efficacy was <95%, and quantitative and qualitative estimates of prevalences of resistance Drug Larva genus n farms with
>50epg n genera with efficacy <95%
Estimated prevalences of resistance
Full Iv Cooperia 47 3 6% (low) Full Iv Ostertagia 52 14 27% (high) Full Iv Trichostrongylus 70 2 3% (low) Full Iv Haemonchus 24 0 0% (low) Full Iv Nematodirus* 27 2 7% (low) Half Iv Cooperia 47 11 23% (high) Half Iv Ostertagia 52 25 48% (very high) Half Iv Trichostrongylus 70 4 6% (low) Half Iv Haemonchus 24 0 0% (low) Half Iv Nematodirus* 27 13 48% (very high) Lev Cooperia 47 0 0% (low) Lev Ostertagia 52 11 21% (high) Lev Trichostrongylus 70 10 14% (moderate) Lev Haemonchus 24 0 0% (low) Lev Nematodirus* 27 3 11% (moderate) Alb Cooperia 47 10 21% (high) Alb Ostertagia 52 21 40% (very high) Alb Trichostrongylus 70 15 21% (high) Alb Haemonchus 24 2 8% (low) Alb Nematodirus* 27 24 89% (very high) Comb Cooperia 47 0 0% (low) Comb Ostertagia 52 2 4% (low) Comb Trichostrongylus 70 4 6% (low) Comb Haemonchus 24 0 0% (none) Comb Nematodirus* 27 2 7% (low) Full Iv, full dose ivermectin; Half Iv, half dose ivermectin; Lev, levamisole; Alb, albendazole; Comb, combination Table explanation n farms with >50 epg reports the number of farms where a particular genus was assessed as being present at >50epg in the pre-treatment samples. n genera with efficacy <95% reports the number of farms for which the genera that were assessed had <95% efficacy on larval culture for a particular anthelmintic treatment. Estimated prevalences of resistance are farm level quantitative and qualitative estimates of the prevalences of resistance for combinations of genus and treatment. The point estimates, shown as percentages, were calculated by dividing the number of farms with efficacy <95% by the number of farms where the genus was assessed to be present at >50 epg in the pre-treatment samples. It underestimates the true level of resistance by an uncertain amount because it ignores farms for which cultures were not done when FECRT efficacy was >95%. Resistance for some genera may have been detected on some of these farms if cultures had been performed. The data indicate significant problems with Ostertagia resistance to all action families, with Cooperia resistance to ivermectin, with Trichostrongylus resistance to levamisole and resistance among all genera to albendazole. A qualitative assessment of efficacy of the combination treatment is particularly difficult because of the very few larval cultures performed for that treatment.

22
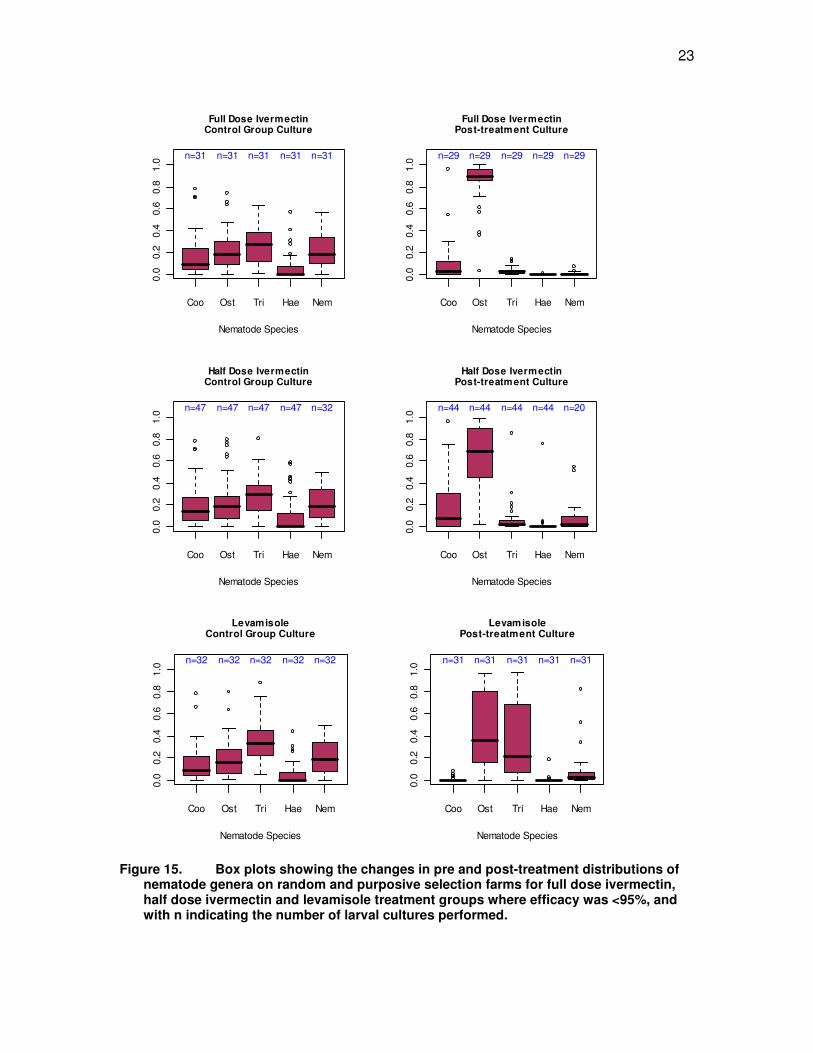
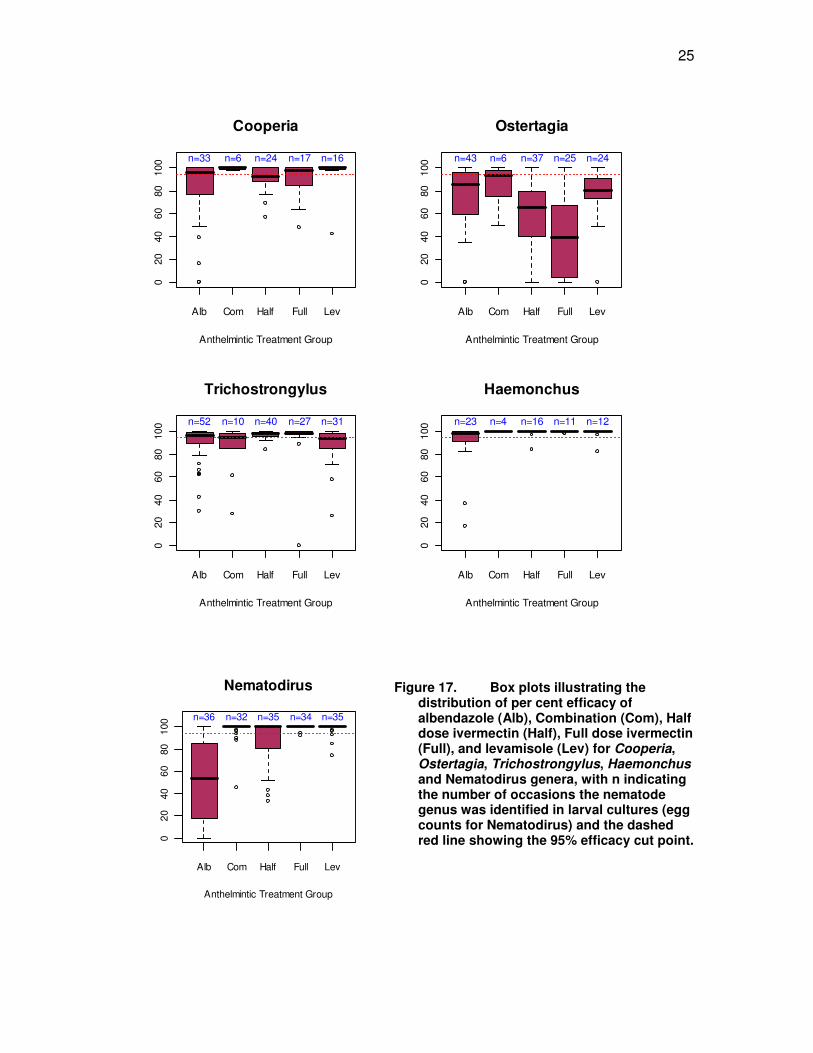
Figures 15 and 16 compare nematode distributions from the control samples from all 112 farms with those for the treatment samples, whenever the anthelmintic treatment achieved efficacy of less than 95%. This provides compelling evidence about which nematode genera are expressing resistance to particular anthelmintic treatment groups. The distributions of anthelmintic efficacy levels for Cooperia, Ostertagia, Trichostrongylus and Haemonchus species for treatment groups where efficacy was <95% and the sample was processed are shown in Figure 17.
23
Coo Ost Tri Hae Nem
0.0
0.2
0.4
0.6
0.8
1.0
Full Dose IvermectinControl Group Culture
Nematode Species
n=31 n=31 n=31 n=31 n=31
Coo Ost Tri Hae Nem
0.0
0.2
0.4
0.6
0.8
1.0
Full Dose IvermectinPost-treatment Culture
Nematode Species
n=29 n=29 n=29 n=29 n=29
Coo Ost Tri Hae Nem
0.0
0.2
0.4
0.6
0.8
1.0
Half Dose IvermectinControl Group Culture
Nematode Species
n=47 n=47 n=47 n=47 n=32
Coo Ost Tri Hae Nem
0.0
0.2
0.4
0.6
0.8
1.0
Half Dose IvermectinPost-treatment Culture
Nematode Species
n=44 n=44 n=44 n=44 n=20
Coo Ost Tri Hae Nem
0.0
0.2
0.4
0.6
0.8
1.0
LevamisoleControl Group Culture
Nematode Species
n=32 n=32 n=32 n=32 n=32
Coo Ost Tri Hae Nem
0.0
0.2
0.4
0.6
0.8
1.0
LevamisolePost-treatment Culture
Nematode Species
n=31 n=31 n=31 n=31 n=31
Figure 15. Box plots showing the changes in pre and post-treatment distributions of
nematode genera on random and purposive selection farms for full dose ivermectin, half dose ivermectin and levamisole treatment groups where efficacy was <95%, and with n indicating the number of larval cultures performed.

24
Coo Ost Tri Hae Nem
0.0
0.2
0.4
0.6
0.8
1.0
AlbendazoleControl Group Culture
Nematode Species
n=47 n=47 n=47 n=47 n=47
Coo Ost Tri Hae Nem
0.0
0.2
0.4
0.6
0.8
1.0
AlbendazolePost-treatment Culture
Nematode Species
n=47 n=47 n=47 n=47 n=47
Coo Ost Tri Hae Nem
0.0
0.2
0.4
0.6
0.8
1.0
CombinationControl Group Culture
Nematode Species
n=8 n=8 n=8 n=8 n=8
Coo Ost Tri Hae Nem
0.0
0.2
0.4
0.6
0.8
1.0
CombinationPost-treatment Culture
Nematode Species
n=7 n=7 n=7 n=7 n=7
Figure 16. Box plots showing pre and post treatment distributions of nematode
genera for albendazole and combination treatment groups with less than 95% anthelmintic efficacy, and with n indicating the number of larval cultures performed
25
Alb Com Half Full Lev
020
4060
8010
0
Cooperia
Anthelmintic Treatment Group
n=33 n=6 n=24 n=17 n=16
Alb Com Half Full Lev
020
4060
8010
0
Ostertagia
Anthelmintic Treatment Group
n=43 n=6 n=37 n=25 n=24
Alb Com Half Full Lev
020
4060
8010
0
Trichostrongylus
Anthelmintic Treatment Group
n=52 n=10 n=40 n=27 n=31
Alb Com Half Full Lev
020
4060
8010
0
Haemonchus
Anthelmintic Treatment Group
n=23 n=4 n=16 n=11 n=12
Figure 17. Box plots illustrating the distribution of per cent efficacy of albendazole (Alb), Combination (Com), Half dose ivermectin (Half), Full dose ivermectin (Full), and levamisole (Lev) for Cooperia, Ostertagia, Trichostrongylus, Haemonchus and Nematodirus genera, with n indicating the number of occasions the nematode genus was identified in larval cultures (egg counts for Nematodirus) and the dashed red line showing the 95% efficacy cut point.
Alb Com Half Full Lev
020
4060
8010
0
Nematodirus
Anthelmintic Treatment Group
n=36 n=32 n=35 n=34 n=35
26
Point estimates of efficacies for individual farms for full and half dose ivermectin, albendazole, levamisole and combination treatments against Cooperia, Ostertagia, Trichostrongylus, Haemonchus and Nematodirus genera are shown in Figures 19 to 23.
Figure 18. Individual farm efficacy for full and half dose ivermectin, albendazole, levamisole and combination treatments against Cooperia spp.
0
20
40
60
80
100
12 3 4 5 6 9
1112
1314
1516
1718
2122
2324
2526
2728
2930
3233
3435
3637
3839
4042
444647484951
52555657585960
6162
6465
6667
6970
71
7273
7476
7779
8081
8386
8889
9091
9294
9699
105106107109112
Ivermectin Albendazole Levamisole 1/2 Ivermectin Combination

27
Figure 19. Individual farm efficacy for full and half dose ivermectin, albendazole, levamisole and combination treatments against Ostertagia spp.
0
20
40
60
80
100
12 3 4 5 6 9
1112
1314
1516
1718
2122
2324
2526
2728
2930
3233
3435
3637
3839
4042
444647484951
52555657585960
6162
6465
6667
6970
71
7273
7476
7779
8081
8386
8889
9091
9294
9699
105106107109112
Ivermectin Albendazole Levamisole 1/2 Ivermectin Combination
Figure 20. Individual farm efficacy for full and half dose ivermectin, albendazole, levamisole and combination treatments against Trichostrongylus spp.
0
20
40
60
80
1001
2 3 4 5 6 911
1213
1415
1617
182122
2324
2526
2728
2930
3233
3435
3637
3839
40424446474849
51525556575859
6061
6264
6566
6769
7071
7273
7476
7779
80818386
8889
9091
9294
9699105106107109112
Ivermectin Albendazole Levamisole 1/2 Ivermectin Combination

28
Figure 21. Individual farm efficacy for full and half dose ivermectin, albendazole, levamisole and combination treatments against Haemonchus spp.
0
20
40
60
80
100
12 3 4 5 6 9
1112
1314
1516
1718
2122
2324
2526
2728
2930
3233
3435
3637
3839
4042
444647484951
52555657585960
6162
6465
6667
6970
71
7273
7476
7779
808183
8688
8990
9192
9496
99105106107109112
Ivermectin Albendazole Levamisole 1/2 Ivermectin Combination
Figure 22. Individual farm efficacy for full and half dose ivermectin, albendazole, levamisole and combination treatments against Nematodirus spp.
0
20
40
60
80
100
12 3 4 5 6 9
1112
1314
1516
1718
2122
2324
2526
2728
2930
3233
3435
3637
3839
4042
444647484951
52555657585960
6162
6465
6667
6970
71
7273
7476
7779
8081
8386
8889
9091
9294
9699
105106107109112
Ivermectin Albendazole Levamisole 1/2 Ivermectin Combination

29
Temporal nature of resistance to ivermectin The data in Table 8 shows a trend for an increasing percentage of drench failures with increasing proportions of Ostertagia in control samples.
Table 7. Showing the change in proportion of drench treatments with <95% efficacy as the prevalence of Ostertagia in the pre-treatment control sample changes
Ostertagia prevalence (number of samples) Treatment group Efficacy 0�5% 5�10% 10�20% >20% Full dose ivermectin <95% 14 (6, 29) 22 (9, 45) 36 (21, 54) 40 (25, 58) Half dose ivermectin <95% 28 (16, 44) 33 (16, 56) 43 (27, 61) 63 (46, 78) Levamisole <95% 19 (10, 35) 28 (12, 51) 25 (13, 43) 43 (27, 61) Albendazole <95% 39 (25, 55) 22 (9, 45) 43 (27, 61) 57 (39, 73) Combination <95% 6 (2, 18) 11 (3, 33) 4 (1, 18) 10 (3, 26) Number of samples 36 18 28 30 Table 9 shows that as the pre-treatment FEC increases the percentage of drench failures decreases for most drenches.
Table 8. Showing the change in proportion of drench treatments with <95% efficacy as the mean pre-treatment faecal egg count changes
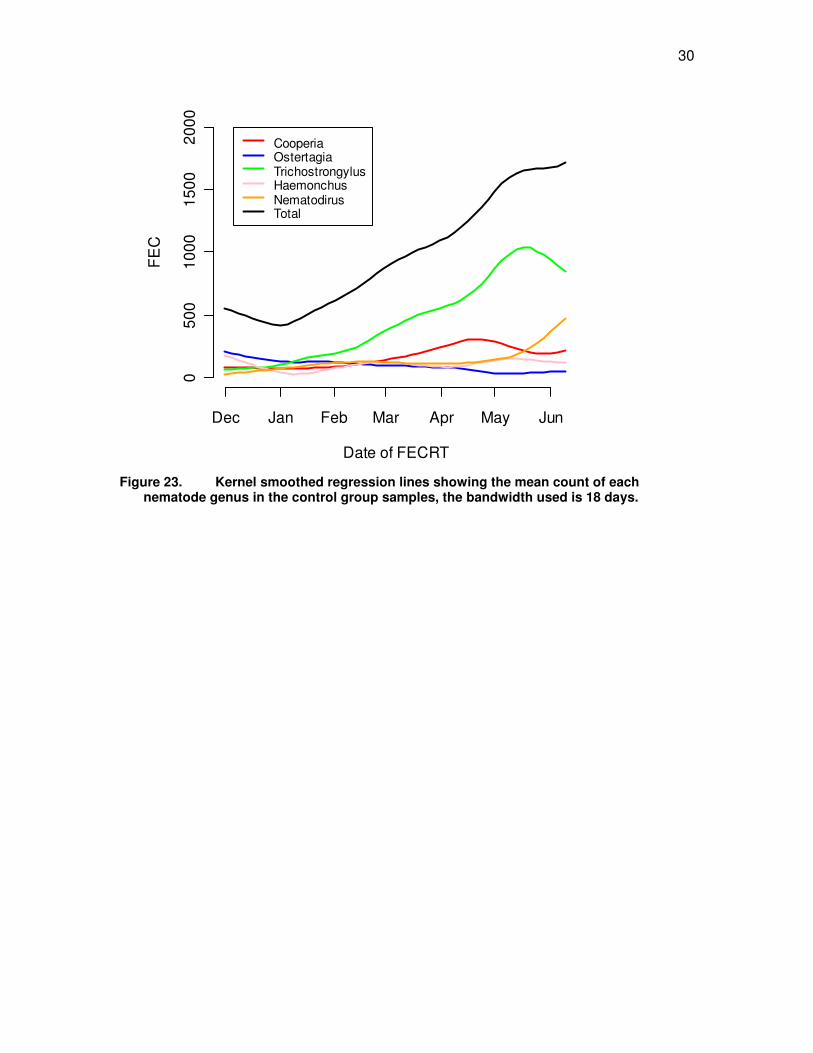
Mean pre-treatment faecal egg count Treatment group Efficacy 0�300 300�600 600�1000 >1000 Full dose ivermectin <95% 42% 32% 25% 17% Half dose ivermectin <95% 49% 45% 25% 33% Levamisole <95% 50% 30% 29% 16% Albendazole <95% 40% 39% 42% 48% Combination <95% 11% 5% 9% 7% Figure 18 shows that the count of Ostertagia eggs in the faecal samples fell relatively slowly over time whereas the count of Trichostrongylus climbed dramatically. It is hypothesised that although Ostertagia are nearly always present in faecal samples, their influence on the FECRT is largely lost unless testing is completed before mid-March. A potential property of the Presidente formula is the return of favourable results for FECRTs when the pre-treatment FEC is high and the predominant nematode, viz Trichostrongylus, is 100% sensitive to the test anthelmintic. Put simply, in order to hear the Ostertagia signal, one needs to “tune-in” before mid-March.
30
Date of FECRT
FE
C
Dec Jan Feb Mar Apr May Jun
050
010
0015
0020
00
CooperiaOstertagiaTrichostrongylusHaemonchusNematodirusTotal
Figure 23. Kernel smoothed regression lines showing the mean count of each
nematode genus in the control group samples, the bandwidth used is 18 days.
31
Discussion Anthelmintic resistance in sheep involving albendazole and Haemonchus in New Zealand was first recorded in 1979 (Vlassoff and Kettle 1980). Since then it has been confirmed many times in case reports from practices and diagnostic laboratories (Middelberg and McKenna 1983; McKenna and Seifert 1985; Pomroy, Charleston et al. 1985; West, Pomroy et al. 1989; West and Probert 1989; McKenna 1994; McKenna, Allan et al. 1995; Leathwick, Moen et al. 2000; Hughes, McKenna et al. 2004; Hughes and McKenna 2005), from a practice based survey (Hughes, McKenna et al. 2005), and in prevalence studies (Kettle, Vlassoff et al. 1981; Kemp and Smith 1982; Kettle, Vlassoff et al. 1982). Leathwick et al (Leathwick, Pomroy et al. 2001) commented in a review of anthelmintic resistance that despite no formal surveys having been conducted for 20 years, there was little doubt that resistance is now common in sheep in New Zealand. The objective of this study was to provide updated estimates of prevalences of inefficacy to macrocyclic-lactone, albendazole and levamisole in sheep farms in New Zealand using faecal egg count reduction tests and larval cultures. The target numbers for the study of 100 random selection and 40 purposive selection farms nominated by veterinarians on the basis of a past diagnosis of resistance was not achieved for a variety of reasons which included failure to meet threshold faecal egg count levels for the random selection farms and insufficient recent or current case farms reported. The 80 random selection study farms were randomly selected from throughout the country, and apart from the exclusion of fine wool breeds, are considered to be reasonably representative of the national population of sheep breeding farms, despite an unknown degree of bias from exclusion due to failure to meet entry criteria or threshold FEC’s. Larval cultures were only undertaken when the FECRT was less than 95%. These biases are likely to make the prevalences of resistance reported here conservative estimates. The FECRT identified high levels of inefficacy in random selection farms to all drug families with 25% (17, 35) of farms showing <95% efficacy for full dose ivermectin, 36% (27, 47) for half dose ivermectin, 24% (16, 34) for levamisole and 41% (31, 52) for albendazole. The combination drench containing albendazole and levamisole performed reasonably well with only 8% (3, 15) of farms showing < 95% efficacy. Levels of inefficacy in the purposive group tended to be higher although the confidence intervals around the point estimates for both groups of farms show lack of statistical significance for that issue at the 95% level. These results contrast with those of previous prevalence studies conducted in the early 1980’s. Resistance as measured by an in vitro egg-hatch technique found evidence of thiabendazole resistance in Haemonchus contortus and Trichostrongylus spp. on 11 of 50 randomly selected North Island properties (Kemp and Smith 1982) equating to a prevalence of 21.2% (12, 34). Because a different method for assessing resistance was used their results are not directly comparable to those reported here. However, the in vitro technique is generally considered to be useful for early detection of resistance (Taylor, Hunt et al. 2002) and the Kemp and Smith study provided that warning. The combined results for the early North and South Island studies (Kettle, Vlassoff et al. 1981; Kettle, Vlassoff et al. 1982) showed less than 90% efficacy to thiabendazole on 6 (7% [3, 14]) farms and less than 90% efficacy to levamisole on 6 farms from the same

32
study. Thiabendazole was first used in New Zealand about 1962, levamisole about 1970 and ivermectin around 1980. Other features of note in the early studies were the relatively narrow range of the mean faecal egg count reduction for thiabendazole (lowest 87%) and for levamisole (72%), the high proportion of occasions where efficacy was 100%, and the presence of dual resistance to thiabendazole and levamisole on only 2 farms. The results from the 1980 studies and the present one clearly demonstrate a significant increase in the prevalence of resistance over time. The differences may have been influenced to some degree by the timing of the early studies which were later for the North Island and Nelson region study (April to mid-June) (Kettle, Vlassoff et al. 1981) than for the South Island study (beginning of March to end of first week in June, 1981) (Kettle, Vlassoff et al. 1982). The results from this study are disturbing and indicate the extent of anthelmintic resistance on sheep farms. While 29 of 80 (36% 27, 47) randomly selected farms and 8 of 32 (25% 13, 42) purposively selected farms had efficacy levels >95% for all anthelmintic treatments tested, it should be kept in mind that FECRT results of greater than 95% efficacy give no cause for complacency on the farms where they occur, as the FECRT does not give a direct measure of the prevalence of resistant alleles. It is generally considered that the prevalence of resistant alleles will be high when the FECRT is less than 95%. On the other hand, the result for 29 of the random selection farms having efficacy levels greater than 95% is encouraging. The relatively higher efficacy of combination drenches probably reflects the distribution of resistance to a particular anthelmintic amongst the population and the chance that an individual worm will be resistant to two anthelmintic action groups. There is a perception among some veterinarians that resistance is less common in the South Island than in the North Island. This study suggests some difference although the validity of that finding has to be considered in relation to the relatively small sample sizes for each Island. The perception may have come from the early 1980’s prevalence studies where fewer South island farms were affected although the prevalences recorded then were not significantly different. It is difficult to advance any plausible hypothesis for differences based on geographical location unless there were marked differences in agro-pastoral zones such as would occur between arid and high rainfall zones. This study supports general experience that Haemonchus is predominantly a North Island problem. There was a marked difference in the proportions of Haemonchus larvae cultured from control samples between the two Islands and it was significant that the only outlier in the South Island data was from a farm in the Nelson region in the northern part of the South Island. Not all purposive selection farms showed evidence of resistance as measured by less than 95% efficacy in the FECRT and it may be that as yet unidentified factors may influence the persistence of resistance at farm level from year to year. On the other hand, given that the original diagnosis was correct, any apparent changes in resistance status could be due to effects of changing makeup of worm burden genera, and faecal egg counts over time as was demonstrated in this study. Farms with less than 95% efficacy to half and full dose ivermectin apparently had greater proportions of Ostertagia spp. and lesser proportions of Trichostrongylus spp. in the control larval cultures. Furthermore, purposive selected farms were about four times
33
more likely (Relative Risk 3.8 [1.79, 8.06]) to test positive between January and March than farms tested later in the year between April and June. Despite considerable variability around median egg counts, faecal egg counts rose almost linearly from December to June. A model of efficacy to half dose ivermectin (less than 95% efficacy) indicated that the probability of inefficacy decreased over time (December to June) and as the proportion of Trichostrongylus larvae in control group faecal samples increased. Despite the uncertainties in the precision of FECRT’s, the study points to significant problems with Ostertagia resistance to all action families, with Cooperia resistance to ivomec, with Trichostrongylus resistance to levamisole and resistance among all genera to albendazole. Decision making about which course of action to follow when faced with a case of drench resistance is not simple. The FECRT and larval cultures are far from perfect tests and it is strongly recommended that the raw data always be examined along with summary estimates of efficacy. Faecal egg count reduction tests and larval cultures are now routine tests for sheep farms and decision making should be based on as much evidence as is possible. It should be remembered that a test is only valid for the genus of nematode that is present at the time of the test. In this study, the prevalence of drench failures to full dose ivermectin dropped from 46% prior to mid-March to 6% post mid-March. If the genus of interest is not present then a retest should be done at a time when it is likely to be present.
Acknowledgements This project was only able to be undertaken as a result of the commitment and financial support of the Sustainable Farming Fund, Meat & Wool New Zealand and Schering Plough Animal Health Ltd. Wrightson and Allflex supported the project through the provision of animal identification systems. Assistance with the supply of anthelmintic was provided by Merial, Ancare and Schering Plough Animal Health. The field work was supported by veterinarians in practice throughout New Zealand who willingly found time during a busy period of the year to plan and undertake the work with farmers. The farmers who were initially contacted by phone and who agreed to participate in the survey must be acknowledged for their willingness to support an initiative that has established important benchmarks for the whole industry. These farmers worked through the inconvenience of screening sampling as well as the management inconvenience of testing through what were, at times, challenging climatic conditions. AgriQuality provided a random selection of farms for initial contact from AgriBase.
34
The staff at AgResearch, Palmerston North, planned and undertook the tasks of creating, managing and receiving all the kits and samples. They undertook all the faecal egg counting, and in conjunction with staff from Massey University carried out all the larval counts. In addition, AgResearch completed all sample and initial data analysis. The management and support team including Bill Pomroy, Dave Leathwick, Dave West, Tania Waghorn, Ron Jackson, Kevin Lawrence and John Moffat who have nurtured and developed this project to completion. In particular, acknowledgement must be made of Ron Jackson and Kevin Lawrence for their dedication in both data analysis and report writing.
References Brunsdon, R. V., R. Kissling, et al. (1983). "A Survey of Anthelmintic Usage for Sheep - a
Time for Change." New Zealand Veterinary Journal 31 (3): 24-29. Hughes, P. L. and P. B. McKenna (2005). "Confirmation of resistance to ivermectin by
Cooperia curticei in sheep." New Zealand Veterinary Journal 53 (5): 344-346. Hughes, P. L., P. B. McKenna, et al. (2005). "A survey of the prevalence of emerging
macrocyclic lactone resistance and of benzimidazole resistance in sheep nematodes in the lower North Island of New Zealand." New Zealand Veterinary Journal 53 (1): 87-90.
Hughes, P. L., P. B. McKenna, et al. (2004). "Resistance to moxidectin and abarnectin in naturally acquired Ostertagia circumcincta infections in sheep." New Zealand Veterinary Journal 52 (4): 202-204.
Kemp, G. K. and C. F. Smith (1980). "Benzimidazole Anthelmintic Resistance." New Zealand Veterinary Journal 28 (3): 53-53.
Kemp, G. K. and C. F. Smith (1982). "Anthelmintic Resistance Survey in New-Zealand." New Zealand Veterinary Journal 30 (9): 141-144.
Kettle, P. R., A. Vlassoff, et al. (1982). "A Survey of Nematode Control Measures Used by Sheep Farmers and of Anthelmintic Resistance on Their Farms .2. South Island Excluding the Nelson Region." New Zealand Veterinary Journal 30 (6): 79-81.
Kettle, P. R., A. Vlassoff, et al. (1981). "A Survey of Nematode Control Measures Used by Sheep Farmers and of Anthelmintic Resistance on Their Farms .1. North Island and the Nelson Region of South Island." New Zealand Veterinary Journal 29 (5): 81-83.
Leathwick, D. M., I. C. Moen, et al. (2000). "Ivermectin-resistant Ostertagia circumcincta from sheep in the lower North Island and their susceptibility to other macrocyclic lactone anthelmintics." New Zealand Veterinary Journal 48 (5): 151-154.
Leathwick, D. M., W. E. Pomroy, et al. (2001). "Anthelmintic resistance in New Zealand." New Zealand Veterinary Journal 49 (6): 227-235.
Macchi, C., W. E. Pomroy, et al. (1999). "Anthelmintic use in sheep: results of a questionnaire." New Zealand Journal of Zoology 26: 70.
McKenna, P. (1998). "Anthelmintic resistance surveillance in sheep." Surveillance 25 (5): 98.
McKenna, P. B. (1994). "The Occurrence of Anthelmintic-Resistant Sheep Nematodes in the Southern North-Island of New-Zealand." New Zealand Veterinary Journal 42 (4): 151-152.
35
McKenna, P. B., C. M. Allan, et al. (1995). "The Prevalence of Anthelmintic Resistance in Ovine Case Submissions to Animal Health Laboratories in New-Zealand in 1993." New Zealand Veterinary Journal 43 (3): 96-98.
McKenna, P. B. and D. A. Seifert (1985). "Morantel resistance in Trichostrongylus colubriformis." New Zealand Veterinary Journal 33 (10): 166-167.
Middelberg, A. and P. B. McKenna (1983). "Oxfendazole resistance in Nematodirus spathiger." New Zealand Veterinary Journal 31 (5): 65-66.
Pomroy, W. E., W. A. G. Charleston, et al. (1985). "A strain of Haemonchus contortus resistant to thiophanate." New Zealand Veterinary Journal 33: 59-60.
Sanson, R. L. (2000). Agribase - Introduction and history. Proceedings of the Epidemiology and Animal Health Management Branch of the New Zealand Veterinary Association, Foundation for Continuing Education of the NZVA, Palmerston North, NZ.
Sanson, R. L. and A. Pearson (1997). Agribase - a national spatial farm database. Proceedings of the 8th International Symposium on Veterinary Epidemiology and Economics, Paris, France, Epidémiologie et Santé Animale.
Sharma, S. S., W. E. Pomroy, et al. (2005). "A limited survey of parasite control practices on New Zealand sheep farms and also the prevalence of anthelmintic resistance on some of these farms. In: Proceedings of the New Zealand Society for Parasitology, Annual Meeting No 32, Palmerston North November 2004." In: New Zealand Journal of Zoology 32: 273-286.
Suter, R. J., R. B. Besier, et al. (2004). "Sheep-farm risk factors for ivermectin resistance in Ostertagia circumcincta in Western Australia." Preventive Veterinary Medicine 63 (3/4): 257-269.
Taylor, M. A., K. A. Hunt, et al. (2002). "Review Anthelmintic resistance detection methods." Veterinary Parasitology 103: 183–194.
R Development Core Team. (2005). R: A language and environment for statistical computing. V. R Foundation for Statistical Computing, Austria. http://www.R-project.org.
Vlassoff, A. and P. R. Kettle (1980). "Benzimidazole Resistance in Haemonchus-Contortus." New Zealand Veterinary Journal 28 (1-2): 23-24.
West, D. M., W. E. Pomroy, et al. (1989). "Multigeneric resistance to benzimidazole anthelmintics in four sheep flocks." New Zealand Veterinary Journal 42 (5): 76-78.
West, D. M. and A. D. Probert (1989). "The Rapid Appearance of Anthelmintic Resistance on a Sheep Farm." New Zealand Veterinary Journal 37 (3): 126-127.

36
Appendix 1 Protocol for lamb Faecal Nematode Egg Count Reduction Test Please read carefully - it is important that all farms in this national survey use the same methods. Our definition of a lamb is an animal born since 1 July 2004. Pre-FECRT Screening Protocol
• Discuss with the farmer the options for which sex group/mob of animals will be used and consider previous drench and grazing management in determining when to undertake the test.
• Select 70-80 well grown lambs of even body weight that have not been treated
with a long-acting drench and have not been drenched for at least 28, but preferably 35 days.
• Run as one mob close to the yards for easy availability until all samples have
been collected. • Collect 10 fresh faecal samples, off the ground will do, and submit to the
veterinarian in the Practice supervising the survey for analysis to determine the level of infection. You may choose to analyse these samples in your Practice or any other convenient laboratory. Sample containers for this are not included in the kit. This step may need to be repeated until the threshold is reached. If in doubt, contact us to review the options. To reduce the cost of this screening, it would be appropriate to make a composite sample and determine the mean count. When the mean is reached, a check should be undertaken with 10 samples to ensure all have eggs present.
• When the average egg count (FEC) reaches at least 700 eggs per gram the
FECRT can proceed. At this point you will need to contact AgResearch in Palmerston North and they will send out the test kit.
FECRT Protocol – note all treatments are to be administered orally Please sample Mondays to Wednesdays only. Samples put on the courier on a Thursday or Friday often don’t arrive at the lab until the following Monday. Monday is the day of choice for the pre-drench samples because this makes it easier to organise a post-drench sample at 7-10 days (without working weekends).
• Check that the farmer’s scales are working. Your own weight in working clothes should suffice as a check weight.
37
• Bring lambs in fresh off pasture. Unless there are obvious reasons, assume that mustering and yarding will generate a random order of animals. This will allow each treatment to be administered sequentially.
• All lambs need to be individually identified, and a record kept of the tag, live
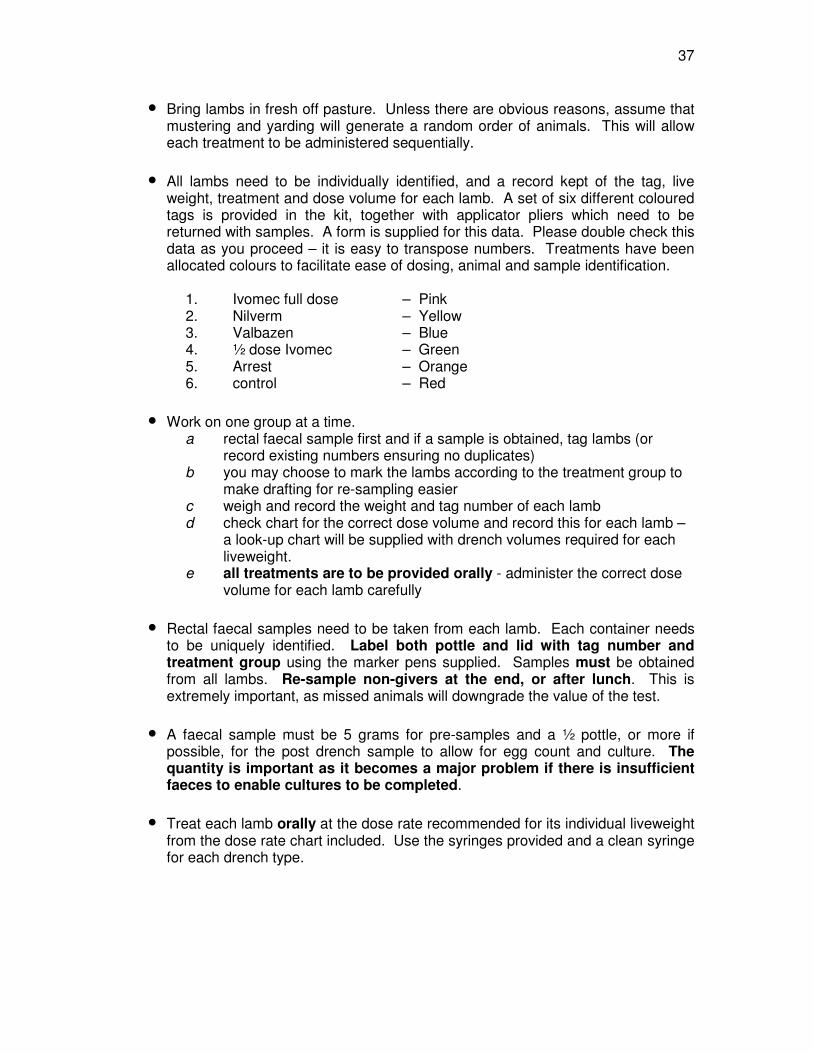
weight, treatment and dose volume for each lamb. A set of six different coloured tags is provided in the kit, together with applicator pliers which need to be returned with samples. A form is supplied for this data. Please double check this data as you proceed – it is easy to transpose numbers. Treatments have been allocated colours to facilitate ease of dosing, animal and sample identification.
1. Ivomec full dose – Pink 2. Nilverm – Yellow 3. Valbazen – Blue 4. ½ dose Ivomec – Green 5. Arrest – Orange 6. control – Red
• Work on one group at a time.
a rectal faecal sample first and if a sample is obtained, tag lambs (or record existing numbers ensuring no duplicates)
b you may choose to mark the lambs according to the treatment group to make drafting for re-sampling easier
c weigh and record the weight and tag number of each lamb d check chart for the correct dose volume and record this for each lamb –
a look-up chart will be supplied with drench volumes required for each liveweight.
e all treatments are to be provided orally - administer the correct dose volume for each lamb carefully
• Rectal faecal samples need to be taken from each lamb. Each container needs
to be uniquely identified. Label both pottle and lid with tag number and treatment group using the marker pens supplied. Samples must be obtained from all lambs. Re-sample non-givers at the end, or after lunch. This is extremely important, as missed animals will downgrade the value of the test.
• A faecal sample must be 5 grams for pre-samples and a ½ pottle, or more if
possible, for the post drench sample to allow for egg count and culture. The quantity is important as it becomes a major problem if there is insufficient faeces to enable cultures to be completed.
• Treat each lamb orally at the dose rate recommended for its individual liveweight
from the dose rate chart included. Use the syringes provided and a clean syringe for each drench type.
38
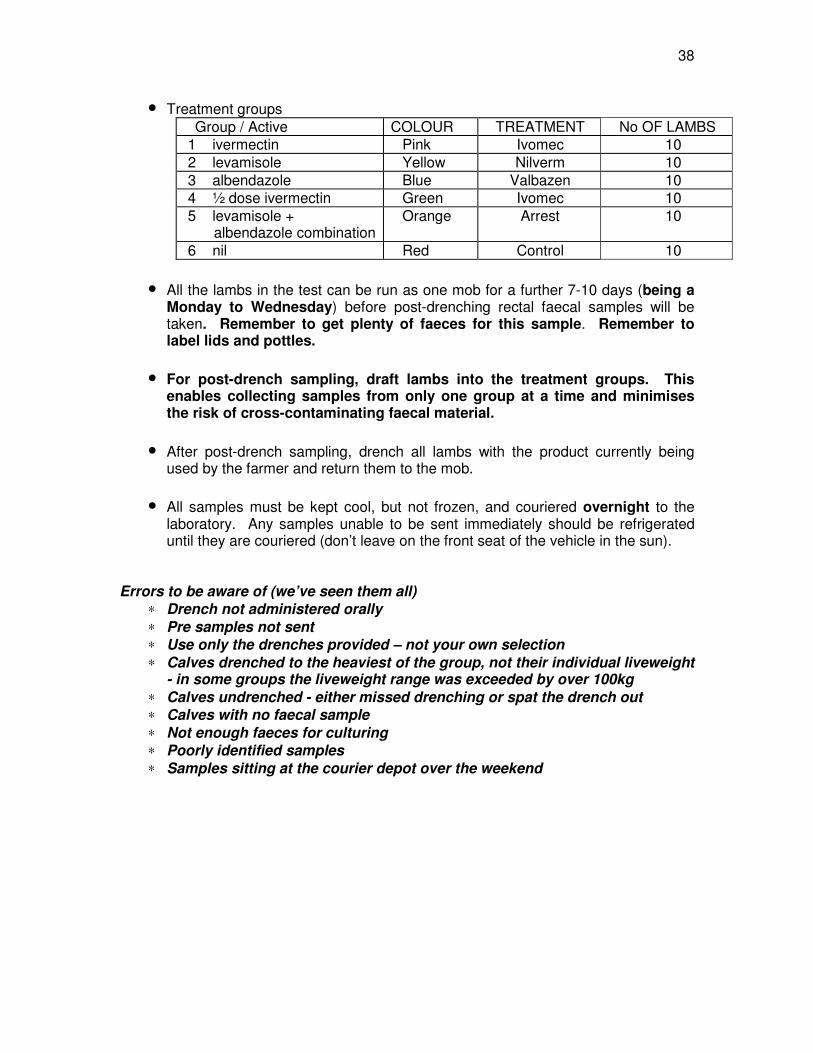
• Treatment groups Group / Active COLOUR TREATMENT No OF LAMBS
1 ivermectin Pink Ivomec 10 2 levamisole Yellow Nilverm 10 3 albendazole Blue Valbazen 10 4 ½ dose ivermectin Green Ivomec 10 5 levamisole +
albendazole combination Orange Arrest 10
6 nil Red Control 10 • All the lambs in the test can be run as one mob for a further 7-10 days (being a
Monday to Wednesday) before post-drenching rectal faecal samples will be taken. Remember to get plenty of faeces for this sample. Remember to label lids and pottles.
• For post-drench sampling, draft lambs into the treatment groups. This
enables collecting samples from only one group at a time and minimises the risk of cross-contaminating faecal material.
• After post-drench sampling, drench all lambs with the product currently being
used by the farmer and return them to the mob.
• All samples must be kept cool, but not frozen, and couriered overnight to the laboratory. Any samples unable to be sent immediately should be refrigerated until they are couriered (don’t leave on the front seat of the vehicle in the sun).
Errors to be aware of (we’ve seen them all)
∗ Drench not administered orally ∗ Pre samples not sent ∗ Use only the drenches provided – not your own selection ∗ Calves drenched to the heaviest of the group, not their individual liveweight
- in some groups the liveweight range was exceeded by over 100kg ∗ Calves undrenched - either missed drenching or spat the drench out ∗ Calves with no faecal sample ∗ Not enough faeces for culturing ∗ Poorly identified samples ∗ Samples sitting at the courier depot over the weekend
39
Appendix 2 Sheep Farm Questionnaire SHEEP ANTHELMINTIC RESISTANCE STUDY Thank you for agreeing to participate in this study of anthelmintic resistance in sheep. This study comprises the sheep component of a wider study of anthelmintic resistance in sheep and cattle.
There are good reasons for improving our understanding of anthelmintic resistance:
• The incidence of resistance appears to be increasing in sheep systems;
• Anthelmintic resistance is likely to be adversely affecting productivity;
• The options for managing parasite resistance are somewhat limited;
• Farmers are uncertain about the effects of resistance;
• Farmers are uncertain about the most effective strategies for dealing with its emergence.
The objectives of the study are:
• To identify and report on the prevalence of anthelmintic resistance across 100 randomly selected sheep systems throughout New Zealand.
• To ascertain farmers’ parasite and livestock management practices and identify factors that may be associated with anthelmintic resistance, and report findings by September 2005.
• To contribute to farmers’ awareness and understanding of the implications of various management practices on their parasite control strategies and options.
This study is part of a wider project involving both sheep and cattle to establish a New Zealand-wide profile of the status of internal parasite resistance and which will also attempt to identify common factors associated with the development of resistance. By linking current resistance status with a survey of farming practices this project aims to identify characteristics of those farms which have resistance, data which will complement the results of trial-based research into the rate of development of resistant nematodes. Combined, both this project and other trials will provide substantial evidence to farmers about the situation, risks and strategies that sheep and specialist beef farmer’s face. Resistance will be assessed with a faecal egg count reduction test. Faecal samples from treatments indicating resistance will be cultured to identify the genus involved. Determination of the level of resistance will be correlated with survey data for each farm to identify likely risk factors . On each property on which the faecal egg count reduction test is completed, a survey of current and historic parasite management practices will be undertaken. This project is funded by Meat and Wool Innovation and the Sustainable Farming Fund. It is a joint project involving scientists from Wrightson, AgResearch, and IVABS, Massey University. Confidentiality of information supplied We give an undertaking that all information will be treated by us as strictly confidential. No information will be used in any way that could reasonably be expected to identify any individual farm or herd. Project leader for further details: Tony Rhodes, Wrightson, Dannevirke. Phone: 06 374 4046; Fax: 06 374 4045
E-mail: [email protected]
40
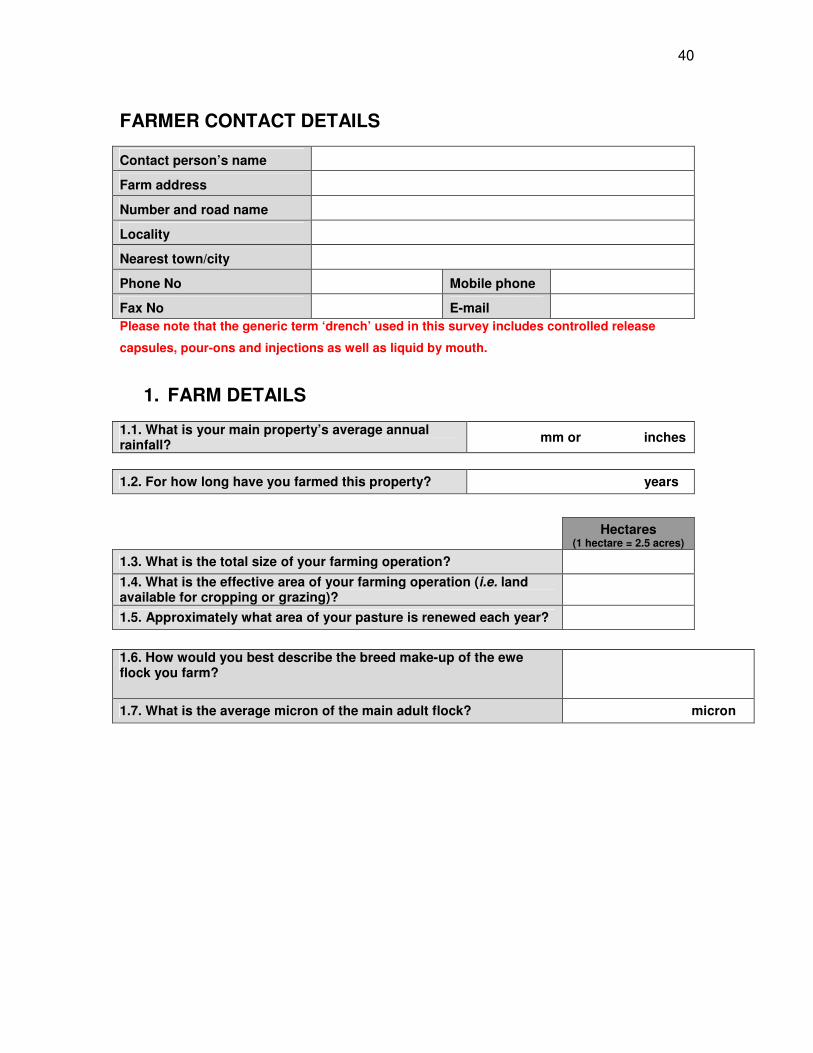
FARMER CONTACT DETAILS
Contact person’s name
Farm address
Number and road name
Locality
Nearest town/city
Phone No Mobile phone
Fax No E-mail Please note that the generic term ‘drench’ used in this survey includes controlled release
capsules, pour-ons and injections as well as liquid by mouth.
1. FARM DETAILS
1.1. What is your main property’s average annual rainfall? mm or inches
1.2. For how long have you farmed this property? years
Hectares (1 hectare = 2.5 acres)
1.3. What is the total size of your farming operation? 1.4. What is the effective area of your farming operation (i.e. land available for cropping or grazing)?
1.5. Approximately what area of your pasture is renewed each year?
1.6. How would you best describe the breed make-up of the ewe flock you farm?
1.7. What is the average micron of the main adult flock? micron
41
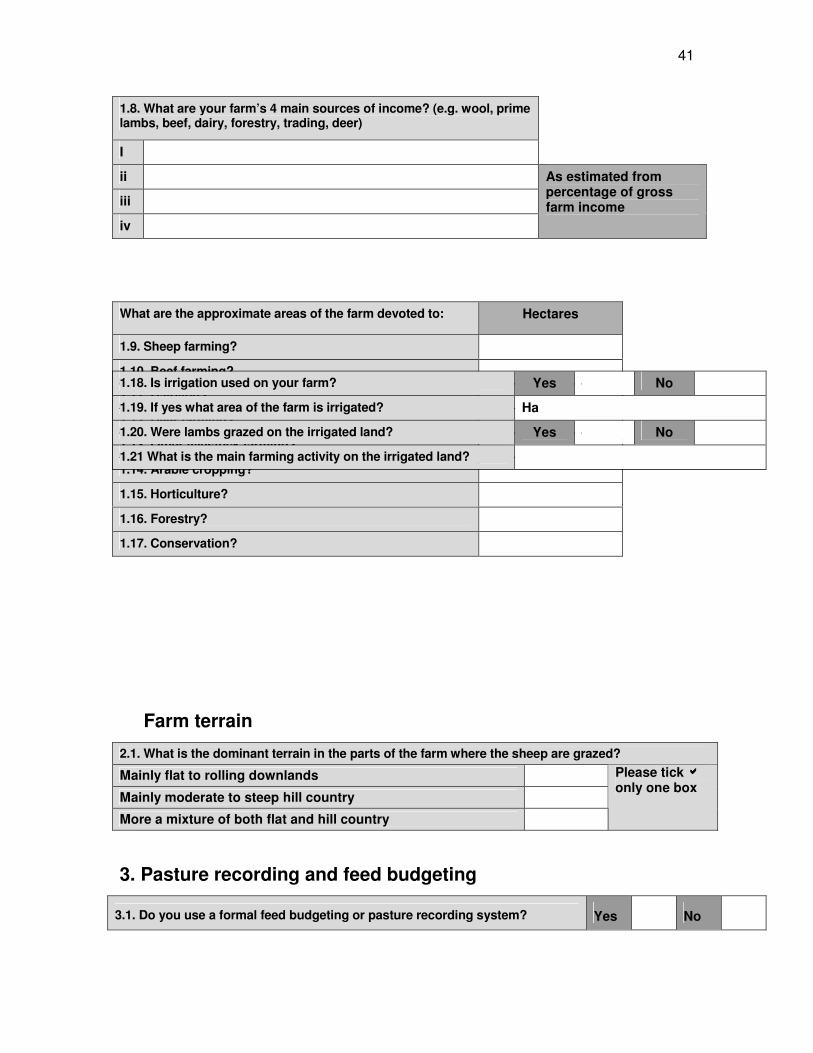
Farm terrain
2.1. What is the dominant terrain in the parts of the farm where the sheep are grazed?
Mainly flat to rolling downlands
Mainly moderate to steep hill country
More a mixture of both flat and hill country
Please tick ���� only one box
3. Pasture recording and feed budgeting
3.1. Do you use a formal feed budgeting or pasture recording system? Yes No
1.8. What are your farm’s 4 main sources of income? (e.g. wool, prime lambs, beef, dairy, forestry, trading, deer)
I
ii
iii
iv
As estimated from percentage of gross farm income
What are the approximate areas of the farm devoted to: Hectares
1.9. Sheep farming?
1.10. Beef farming?
1.11. Dairying?
1.12. Deer farming?
1.13. Other livestock farming?
1.14. Arable cropping?
1.15. Horticulture?
1.16. Forestry?
1.17. Conservation?
1.18. Is irrigation used on your farm? Yes No
1.19. If yes what area of the farm is irrigated? Ha
1.20. Were lambs grazed on the irrigated land? Yes No
1.21 What is the main farming activity on the irrigated land?
42
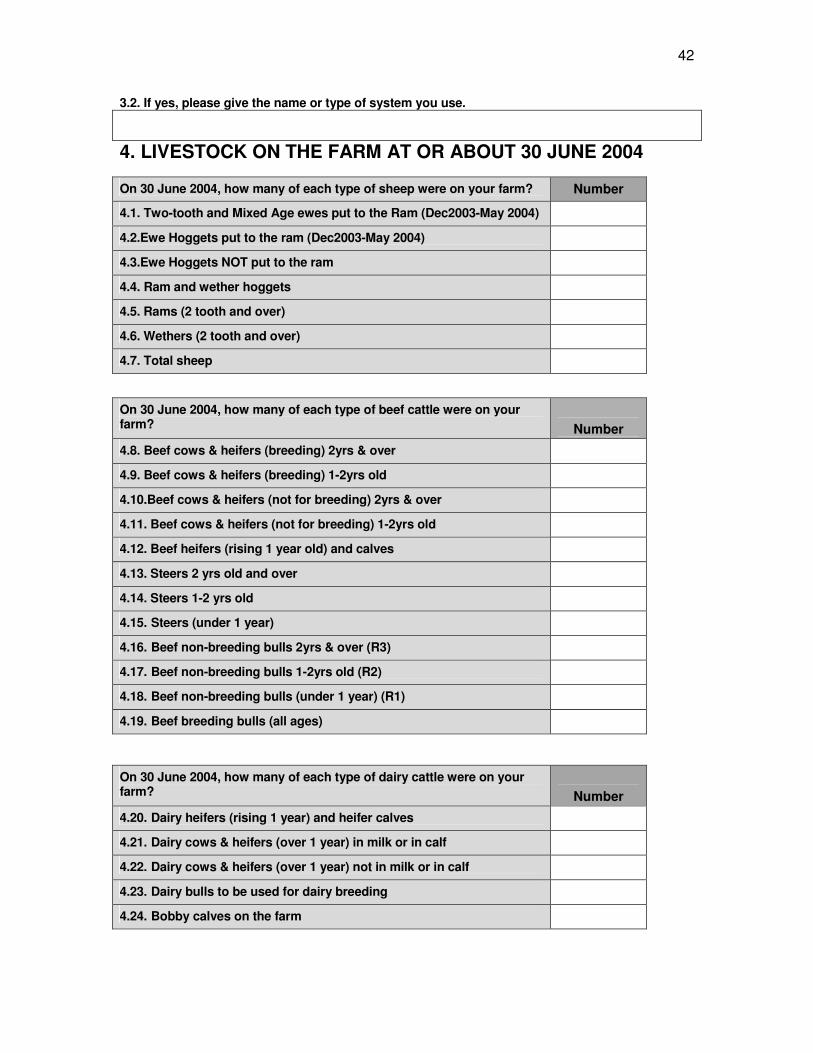
3.2. If yes, please give the name or type of system you use.
4. LIVESTOCK ON THE FARM AT OR ABOUT 30 JUNE 2004
On 30 June 2004, how many of each type of beef cattle were on your farm?
Number
4.8. Beef cows & heifers (breeding) 2yrs & over
4.9. Beef cows & heifers (breeding) 1-2yrs old
4.10.Beef cows & heifers (not for breeding) 2yrs & over
4.11. Beef cows & heifers (not for breeding) 1-2yrs old
4.12. Beef heifers (rising 1 year old) and calves
4.13. Steers 2 yrs old and over
4.14. Steers 1-2 yrs old
4.15. Steers (under 1 year)
4.16. Beef non-breeding bulls 2yrs & over (R3)
4.17. Beef non-breeding bulls 1-2yrs old (R2)
4.18. Beef non-breeding bulls (under 1 year) (R1)
4.19. Beef breeding bulls (all ages) On 30 June 2004, how many of each type of dairy cattle were on your farm?
Number
4.20. Dairy heifers (rising 1 year) and heifer calves
4.21. Dairy cows & heifers (over 1 year) in milk or in calf
4.22. Dairy cows & heifers (over 1 year) not in milk or in calf
4.23. Dairy bulls to be used for dairy breeding
4.24. Bobby calves on the farm
On 30 June 2004, how many of each type of sheep were on your farm? Number
4.1. Two-tooth and Mixed Age ewes put to the Ram (Dec2003-May 2004)
4.2.Ewe Hoggets put to the ram (Dec2003-May 2004)
4.3.Ewe Hoggets NOT put to the ram
4.4. Ram and wether hoggets
4.5. Rams (2 tooth and over)
4.6. Wethers (2 tooth and over)
4.7. Total sheep
43
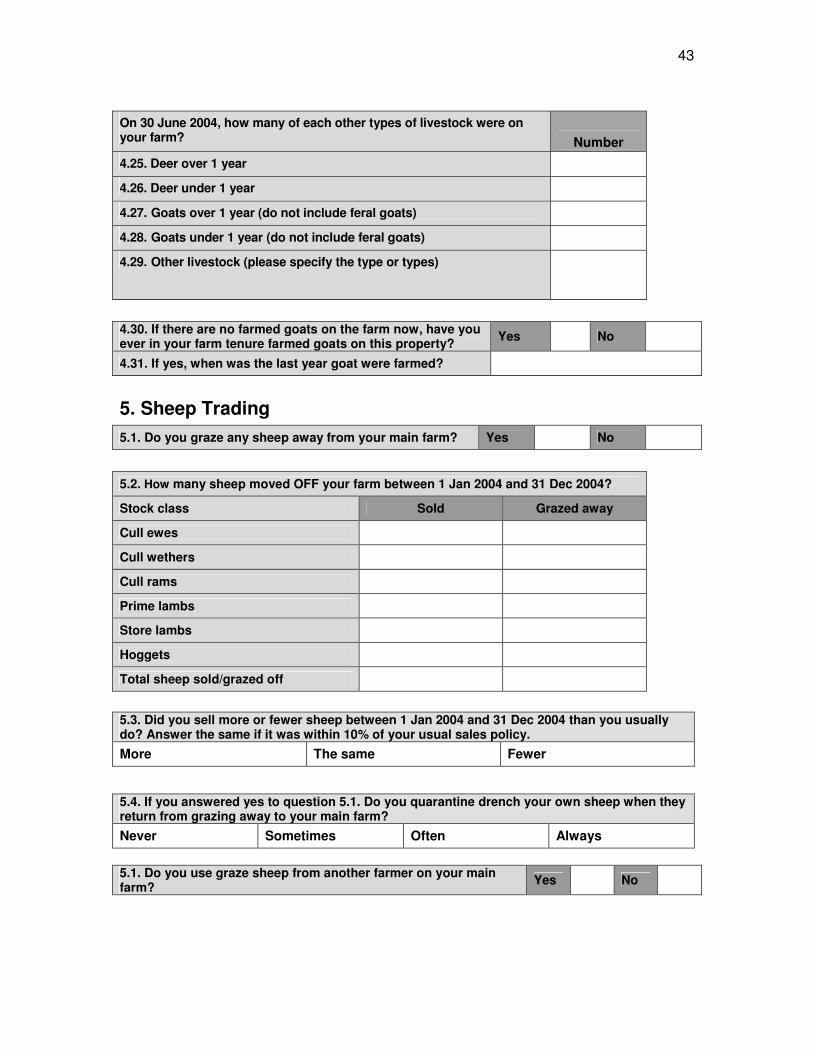
On 30 June 2004, how many of each other types of livestock were on your farm?
Number
4.25. Deer over 1 year
4.26. Deer under 1 year
4.27. Goats over 1 year (do not include feral goats)
4.28. Goats under 1 year (do not include feral goats)
4.29. Other livestock (please specify the type or types)
5. Sheep Trading
5.2. How many sheep moved OFF your farm between 1 Jan 2004 and 31 Dec 2004?
Stock class Sold Grazed away
Cull ewes
Cull wethers
Cull rams
Prime lambs
Store lambs
Hoggets
Total sheep sold/grazed off
4.30. If there are no farmed goats on the farm now, have you ever in your farm tenure farmed goats on this property? Yes No 4.31. If yes, when was the last year goat were farmed?
5.1. Do you graze any sheep away from your main farm? Yes No
5.3. Did you sell more or fewer sheep between 1 Jan 2004 and 31 Dec 2004 than you usually do? Answer the same if it was within 10% of your usual sales policy. More The same Fewer
5.4. If you answered yes to question 5.1. Do you quarantine drench your own sheep when they return from grazing away to your main farm? Never Sometimes Often Always
5.1. Do you use graze sheep from another farmer on your main farm? Yes No

44
6. Management of Lambs
5.5. How many sheep were moved ONTO your property between 1 Jan 2004 and 31 Dec 2004?
Stock class Purchased Grazed onto your farm
Cast for age ewes (one year ewes)
Replacement ewe lambs
Replacement ewe hoggets
Replacement two-tooths
Store lambs
Others (please specify)
Total sheep purchased/grazed on
5.6. Did you purchase more or fewer sheep between 1 Jan 2004 and 31 Dec 2004 than you usually do? Answer the same if it was within 10% of your usual purchase policy. More The same Fewer
5.7. Do you use High Country Summer Pasture? Yes No
5.8. If yes what class of stock grazes the High Country?
6.1. What were the scanning and weaning results for the 2004 mating season?
Stock class Empty% Scanning% Weaning%
Hoggets mated
Two-tooths
MA ewes
Total flock
If separate results are not available please use brackets to group classes together
6.2. Do you use split mating? Yes No
45
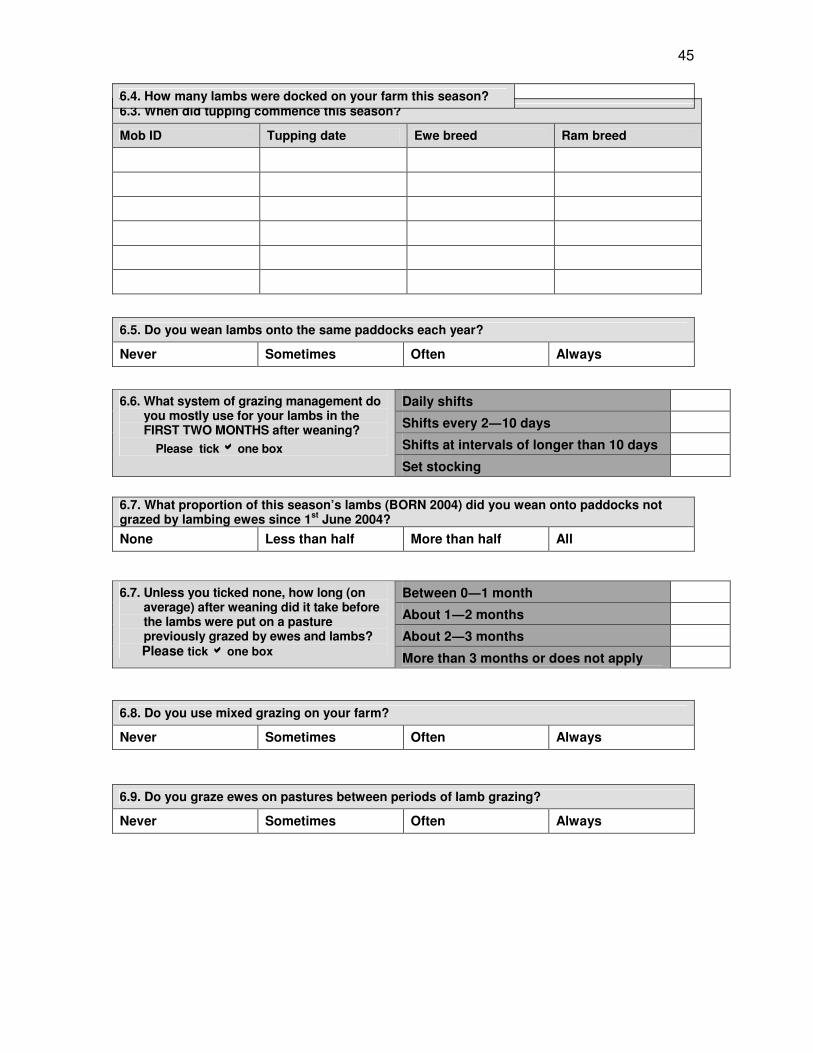
6.3. When did tupping commence this season?
Mob ID Tupping date Ewe breed Ram breed
6.4. How many lambs were docked on your farm this season?
6.5. Do you wean lambs onto the same paddocks each year?
Never Sometimes Often Always
Daily shifts
Shifts every 2�10 days
Shifts at intervals of longer than 10 days
6.6. What system of grazing management do you mostly use for your lambs in the FIRST TWO MONTHS after weaning?
Please tick ���� one box Set stocking
6.7. What proportion of this season’s lambs (BORN 2004) did you wean onto paddocks not grazed by lambing ewes since 1st June 2004? None Less than half More than half All
Between 0�1 month
About 1�2 months
About 2�3 months
6.7. Unless you ticked none, how long (on average) after weaning did it take before the lambs were put on a pasture previously grazed by ewes and lambs?
Please tick ���� one box More than 3 months or does not apply
6.8. Do you use mixed grazing on your farm?
Never Sometimes Often Always
6.9. Do you graze ewes on pastures between periods of lamb grazing?
Never Sometimes Often Always

46
6.14. When did you sell last season’s lambs? Include both farm born and bought in lambs.
Full date or just month No of lambs sold Ave. dead weight
/ /
/ /
/ /
/ /
/ /
/ /
/ /
/ /
7. Drenching policies and procedures If you never purchase in sheep, other than replacement rams, please tick box and go to question 7.8.
6.10. Do you graze cattle/deer on pastures between periods of lamb grazing?
Never Sometimes Often Always
6.11. For last season’s lambs (BORN 2003) did you make hay, baylage, silage or another crop on land subsequently grazed by lambs?
Yes No
6.12. If yes what size of area? Hectares
6.13. What proportion of your farm was or will be grazed by lambs between 1 July 2004 and 30 June 2005? Less than ¼ Between ¼ & ½ Between ½ & ¾ Greater than ¾
7.1. Do you drench newly purchased or introduced sheep soon after arrival on your farm i.e. give a quarantine drench? Never Sometimes Often Always
If answer “Never” go to question 7.4.
7.2. What drenches do you currently or usually use as a quarantine drench? (You can tick more than one option)
White drench Clear drench Macrocyclic lactones (ML) Combination Triple
e.g. Albendazole® Oxfen ® Rycoben ® Valbazen V
e.g. Levicare ® Nilvax ® Nilverm ®
e.g Ivomec ® Cydectin ® Eweguard ® Genesis ® Vetdectin ®
e.g. Arrest ® Leviben ® Scanda ® Valbazen combo
e.g. Triton ®
7.3. If you ticked more than one drench family how often do you give these products together

47
as quarantine drench?
Never Sometimes Often Always
7.4. If you use one or more ML products as part (or all) of a quarantine drench which do you use? You may circle more than one product.
Cydectin ® Eweguard ®
Genesis ® Ivomec ®
Paramectin ®
Vetdectin ® Rycomectin ® Bomectin ®
Noromectin ® Other (please specify)
7.5. How long have you been using quarantine drenches? Please tick box.
1 to 3 years 4 to 6 years 7 to 9 years 10 years and over
7.6. Did you use ML products as part of (or all) of your quarantine drenching in this period?
Never Sometimes Often Always
If answer “Never” go to question 7.8.
7.7. Which ML product did you use then? You may circle more than one product if required.
Cydectin ® Eweguard ® Genesis ® Ivomec ®
Paramectin ® Vetdectin ® Rycomectin ® Bomectin ®
Noromectin ® Other (please specify)
7.8. If you changed drench families between last season (2003-2004) to this season (2004-2005), please give the reason(s): (you may tick more than one box) The previous drench did not appear to work
A vet recommended that you change to a different drench
A person other than a vet recommended that you change
It was part of a planned drench family rotation
The new drench saved money
The new drench had an attractive promotion
Other Specify
7.9. Do you intend to use the same drench family next season?
Yes No Don’t know

48
LAMBS
7.10. Given a choice do you usually buy drench with added minerals?
Never Sometimes Often Always
7.11. How do you assess the level of parasitism in your lambs/hoggets? (You may tick more than one box) FEC Condition score Growth rate Dags
Scouring Other (please specify)
7.12. Do you use pre-weaning drenches in your lambs? Please tick one box.
Never Sometimes Often Always
7.13. On how many occasions, between 1 July 2003 and 30 June 2004, were last season’s lambs/hoggets (born in 2003) drenched?
7.14. Please specify the commercial names of the drenches you used on your lambs/hoggets?
July to Sept 2003 Oct to Dec 2003 Jan to March 2004 April to June 2004
7.15. When do you drench your lambs/hoggets? (You may tick more than one box)
You follow a 5-6 drench programme, drenching every 3 to 4 weeks from weaning regardless of the weather or other factors
You monitor with FEC and drench when counts are high
You drench the lambs when they show signs of scouring or illthrift
You drench the lambs regularly (~ monthly) throughout their first year
You drench the lambs regularly during the period of greatest risk *
Other *

49
TWO-TOOTHS
EWES
If you ticked options with * please could you briefly explain your decision making process.
7.16. After drenching do you return the lambs back to the same paddock they came from? Tick only one box please Never Sometimes Often Always
7.17. Of the lambs that do not return to the same paddock where do they go? Please tick an entry for each row. Pasture re-growth from an earlier grazing with lambs Never Sometimes Often Always
Pasture re-growth from an earlier grazing with another class of stock
Never Sometimes Often Always
Specify stock class/es
New pasture Never Sometimes Often Always
Crop Never Sometimes Often Always
Other* Never Sometimes Often Always
*Please specify
7.18. How many times (on average) did you drench your two-tooths between 1 year of age and mating in Dec 2003-May 2004? Please tick one box.
0 1 2 3 Over 3
7.19. If you did drench your two-tooths between 1 year of age and mating in Dec 2003-May 2004, what was the reason? (You may tick more than one option)
High FEC
Dags
Poor condition
Following a predetermined drench programme
Other Please specify
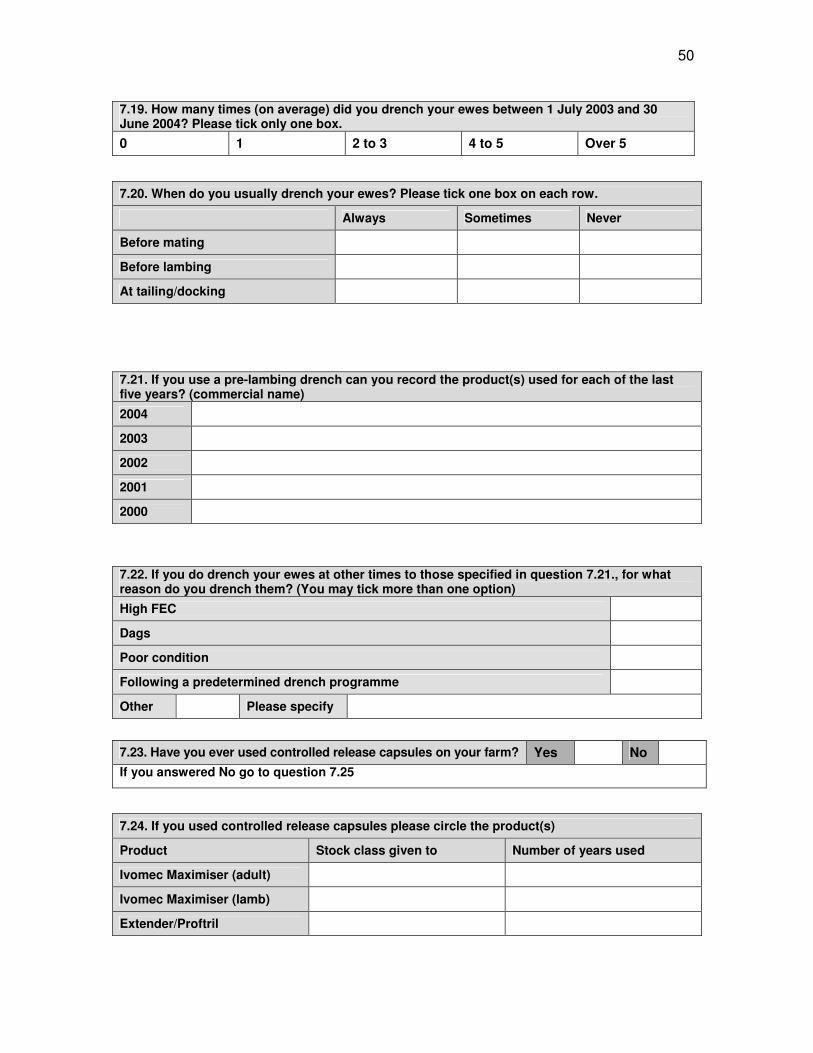
50
7.23. Have you ever used controlled release capsules on your farm? Yes No
If you answered No go to question 7.25
7.19. How many times (on average) did you drench your ewes between 1 July 2003 and 30 June 2004? Please tick only one box. 0 1 2 to 3 4 to 5 Over 5
7.20. When do you usually drench your ewes? Please tick one box on each row.
Always Sometimes Never
Before mating
Before lambing
At tailing/docking
7.21. If you use a pre-lambing drench can you record the product(s) used for each of the last five years? (commercial name)
2004
2003
2002
2001
2000
7.22. If you do drench your ewes at other times to those specified in question 7.21., for what reason do you drench them? (You may tick more than one option) High FEC
Dags
Poor condition
Following a predetermined drench programme
Other Please specify
7.24. If you used controlled release capsules please circle the product(s)
Product Stock class given to Number of years used
Ivomec Maximiser (adult)
Ivomec Maximiser (lamb)
Extender/Proftril
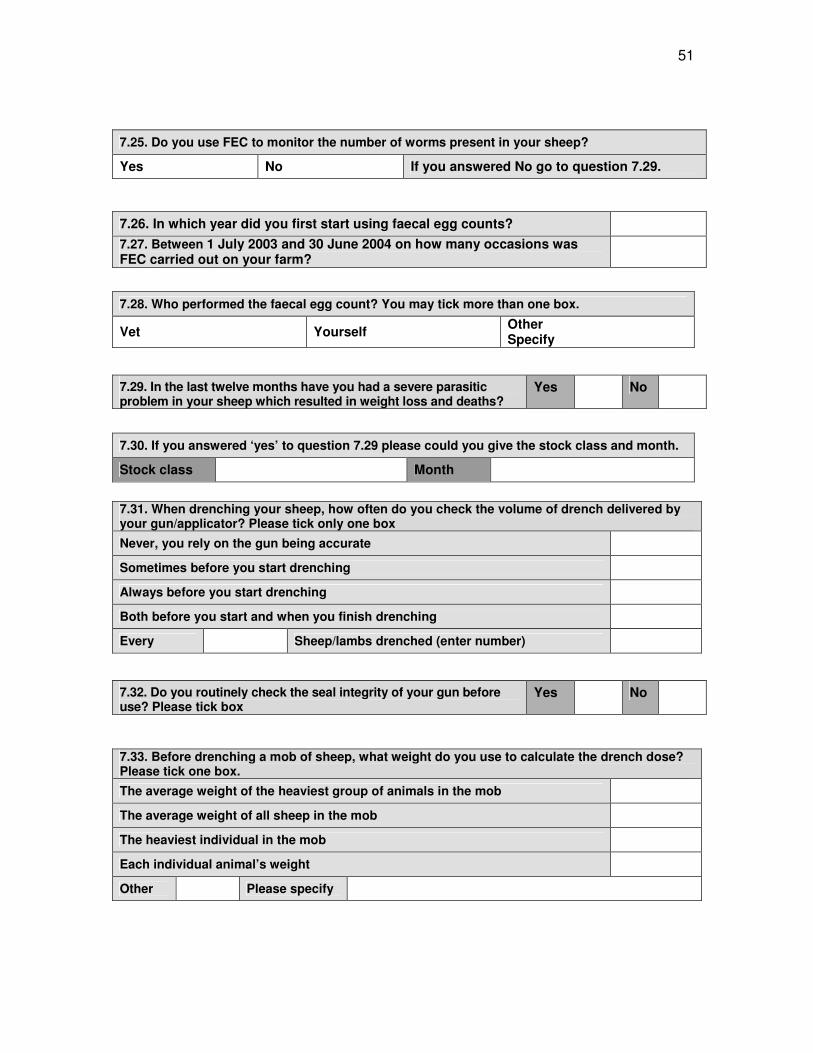
51
7.25. Do you use FEC to monitor the number of worms present in your sheep?
Yes No If you answered No go to question 7.29.
7.26. In which year did you first start using faecal egg counts? 7.27. Between 1 July 2003 and 30 June 2004 on how many occasions was FEC carried out on your farm?
7.28. Who performed the faecal egg count? You may tick more than one box.
Vet Yourself Other Specify
7.29. In the last twelve months have you had a severe parasitic problem in your sheep which resulted in weight loss and deaths?
Yes No
7.30. If you answered ‘yes’ to question 7.29 please could you give the stock class and month.
Stock class Month
7.31. When drenching your sheep, how often do you check the volume of drench delivered by your gun/applicator? Please tick only one box Never, you rely on the gun being accurate
Sometimes before you start drenching
Always before you start drenching
Both before you start and when you finish drenching
Every Sheep/lambs drenched (enter number)
7.32. Do you routinely check the seal integrity of your gun before use? Please tick box
Yes No
7.33. Before drenching a mob of sheep, what weight do you use to calculate the drench dose? Please tick one box. The average weight of the heaviest group of animals in the mob
The average weight of all sheep in the mob
The heaviest individual in the mob
Each individual animal’s weight
Other Please specify
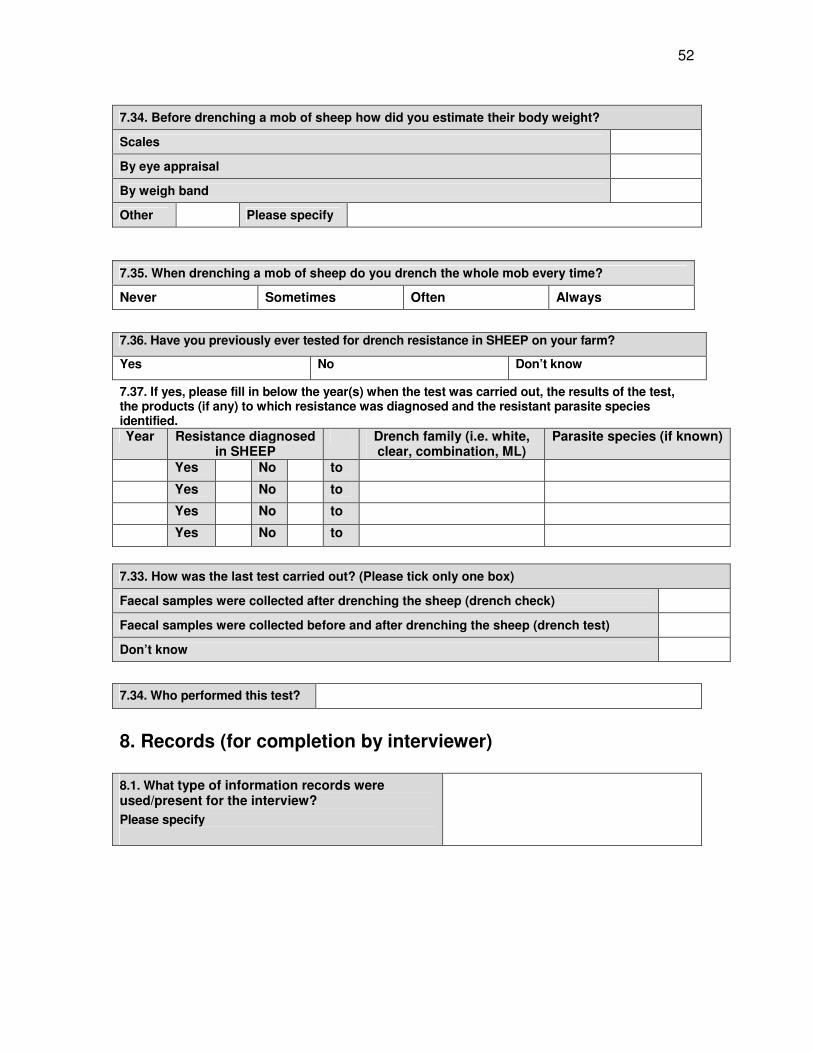
52
7.37. If yes, please fill in below the year(s) when the test was carried out, the results of the test, the products (if any) to which resistance was diagnosed and the resistant parasite species identified. Year Resistance diagnosed
in SHEEP Drench family (i.e. white,
clear, combination, ML) Parasite species (if known)
Yes No to
Yes No to
Yes No to
Yes No to
7.34. Who performed this test?
8. Records (for completion by interviewer) 8.1. What type of information records were used/present for the interview? Please specify
7.34. Before drenching a mob of sheep how did you estimate their body weight?
Scales
By eye appraisal
By weigh band
Other Please specify
7.35. When drenching a mob of sheep do you drench the whole mob every time?
Never Sometimes Often Always
7.36. Have you previously ever tested for drench resistance in SHEEP on your farm?
Yes No Don’t know
7.33. How was the last test carried out? (Please tick only one box)
Faecal samples were collected after drenching the sheep (drench check)
Faecal samples were collected before and after drenching the sheep (drench test)
Don’t know
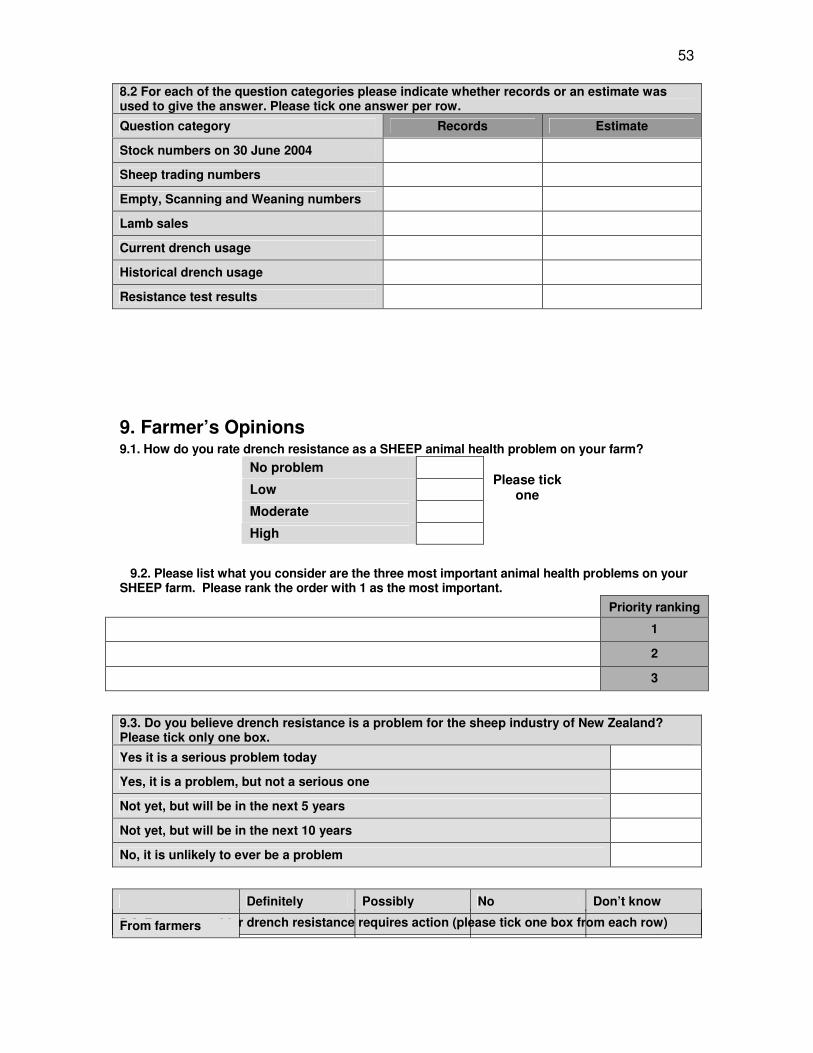
53
9. Farmer’s Opinions 9.1. How do you rate drench resistance as a SHEEP animal health problem on your farm?
No problem
Low
Moderate
Please tick
one
High
9.2. Please list what you consider are the three most important animal health problems on your SHEEP farm. Please rank the order with 1 as the most important.
Priority ranking
1
2
3
8.2 For each of the question categories please indicate whether records or an estimate was used to give the answer. Please tick one answer per row.
Question category Records Estimate
Stock numbers on 30 June 2004
Sheep trading numbers
Empty, Scanning and Weaning numbers
Lamb sales
Current drench usage
Historical drench usage
Resistance test results
9.3. Do you believe drench resistance is a problem for the sheep industry of New Zealand? Please tick only one box.
Yes it is a serious problem today
Yes, it is a problem, but not a serious one
Not yet, but will be in the next 5 years
Not yet, but will be in the next 10 years
No, it is unlikely to ever be a problem
9.4. Do you consider drench resistance requires action (please tick one box from each row)
Definitely Possibly No Don’t know
From farmers

54
9.6. Please tick the methods used on your farm for prevention or control of drench resistance in SHEEP. In addition please mark the three main methods relied on with 1, 2 and 3 to indicate the methods given the top priority, next highest and third highest. Please mark any that you consider useless with an X. Specify any other methods used that are not included in this list. METHOD Priority rank
Change drug action families frequently within the same season
Change drug action families each year or every second year
Treat lambs regularly every 4 to 6 weeks to keep worm populations suppressed
Treat only when faecal egg counts indicate a problem
Treat only when sheep are not doing well or are scouring
Use combination drenches
Use generous doses of drench
Use other stock classes in the grazing rotation to clean up pastures
Follow lambs with older animals or other stock classes as part of the grazing strategy
Integrate crop or hay/silage making with grazing management
Use quarantine treatment when buying in new batches of animals
Use feed budgeting to keep animals growing to their potential
Use mineral supplements
Follow advice of veterinarians and advisors
Pasture renewal and/or cropping as part of the grazing feeding system
Other (please specify)
Other (please specify)
From drench manufacturers
From MAF
From private vets
Other*
*Please specify
9.5. From which sources do YOU obtain your information on worm control in sheep? Please tick and rank the three most important to you (1, 2, 3) Farm consultant Field days Farming journals Veterinarians
Neighbour Television MAF Stock agents
Internet Radio Seminars Discussion groups
Other, please specify.

55
9.7. Thank you for taking the time to fill in this questionnaire. Please make any comments about anthelmintic resistance that you feel may be useful to us. We value your opinions and would like to hear from you.
Name of interviewer
Date