shear properties of an organic soil and the same soil with
TRANSCRIPT

Scholars' Mine Scholars' Mine
Masters Theses Student Theses and Dissertations
1971
Shear properties of an organic soil and the same soil with the Shear properties of an organic soil and the same soil with the
organic matter removed organic matter removed
David Eugene Daniels
Follow this and additional works at: https://scholarsmine.mst.edu/masters_theses
Part of the Civil Engineering Commons
Department: Department:
Recommended Citation Recommended Citation Daniels, David Eugene, "Shear properties of an organic soil and the same soil with the organic matter removed" (1971). Masters Theses. 7211. https://scholarsmine.mst.edu/masters_theses/7211
This thesis is brought to you by Scholars' Mine, a service of the Missouri S&T Library and Learning Resources. This work is protected by U. S. Copyright Law. Unauthorized use including reproduction for redistribution requires the permission of the copyright holder. For more information, please contact [email protected].

SHEAR PROPERTIES OF AN ORGANIC SOIL AND THE
SAME SOIL WITH THE ORGANIC MATTER REMOVED
BY
DAVID EUGENE DANIELS, 1946-
A THESIS
Presented to the Faculty of the Graduate School of the
UNIVERSITY OF I1ISSOURI-ROLLA
In Partial fulfillment of the Requirements for the Degree
~~STER OF SCIENCE IN CIVIL ENGINEERING
1971 T2542 c.l
Approved by 98 pages

ABSTRACT
The e~~ect o~ strain rate on the shearing proper
ties of an organic A horizon Bryce clay and the same
soil treated with hydrogen peroxide to remove the or
ganic matter was studied. For both soils, the pore
pressures were ~ound to be independent o~ strain rate,
and dependent only on the increment of strain during
shear.
The e~~ect of the hydrogen peroxide treatment on
the shear properties o~ an inorganic Bryce B horizon
clay was also studied. It was concluded that the hy
drogen peroxide does not a~~ect the mineral proper
ties of the Bryce clay and serves only to selectively
remove organic matter from the A horizon Bryce soil.
The greater strength of the organic soil over
the same soil treated to remove the organic matter
was also demonstrated. The hypothesis was o~fered that
the organic matter creates an adhesive, compressible
bond which produces a resistant soil structure in an
organic clay soil subjected to shear.
11

ACKNOWLEDGEMENTS
The author wishes to express his appreciation to
his advisor, Dr. N.O. Schmidt, ~or his guidance during
the preparation o~ this paper.
The writer is also grate~ul to Pro~essor J.B. Heag
ler and Dr. N.B. Aughenbaugh ~or their valuable assis
tance in correction o~ the manuscript and participation
in the oral committee.
The author also wishes to thank ~ellow graduate
students, S.K. Chaudary and Kai-Ming So ~or their assis
tance in the laboratory.
The author is especially grateful to his wife,
Mary Ellen and M~ Judy Notestine ~or their assistance
in typing the manuscript.
iii

iv
TABLE OF CONTENTS
Page
ABSTRACT ••••••.• • • • • • • • • • • • • • • • • • • • • • • • • • • • • • • • • • • • • • • • • •• ii
ACKNOWLEDGEI1ENT. • • • • • • • • • • • • • • • • • • • • • • • • • • • • • • • • • • • • • • • • • iii
LIST
LIST
I.
II.
III.
OF FIGURES. • • • • • • • • • • • • • • • • • • • • • • • • • • • • • • • • • • • • • • • • • vii
OF TABLES •• • • • • • • • • • • • • • • • • • • • • • • • • • • • • • • • • • • • • • • • • • .ix
INTRODUCTION. • • • • • • • • • • • • • • • • • • • • • • • • • • • • • • • • • • • • • •• 1
REVIEW OF LITERATURE. • • • • • • • • • • • • • • • • • • • • • • • • • • • • • • .4
A.
B.
Introduction ••• • • • • • • • • • • • • • • • • • • • • • • • • • • • • • • •
Shear Strength. • • • • • • • • • • • • • • • • • • • t • • • • • • • • • • •
1. Failure ••• • • • • • • • • • • • • • • • • • • • • • • • • • • • • • • •
2. Pore Pressure Parameters. • • • • • • • • • • • • • • • •
3. Stress History. • • • • • • • • • • • • • • • • • • • • • • • • • •
. 4
.4
. 4
.5
.6
4. Strain Rate •••• • • • • • • • • • • • • • • • • • • • • • • • • • • • 8
C.. E:f:fect o:r Organic Content on Shear Strength ••• 10
D. E:f:f'ect on the
o:r the Hydrogen Peroxide Treatment Physical Properties o:r a Soil •••••• •• •• 11
PROCEDURES ..• • • • • • • • • • • • • • • • • • • • • • • • • • • • • • • • • • • • • . • 13
A. General. • • • • • • • • • • • • • • • • • • • • • • • • • • • • • • • • • • • • • • 13
B. Soil Preparation •• • • • • • • • • • • • • • • • • • • • • • • • • • • • .13
c. Hydrogen Peroxide Treatment •• • • • • • • • • • • • • • • • • .14
D. Organic Carbon Determination. • • • • • • • • • • • • • • • • • 15
E. Sample Preparation •••••••••• • • • • • • • • • • • • • • • • • .15
F. Triaxial Compression Tests., • • • • • • • • • • • • • • • • • .18
1. Consolidation. • • • • • • • • • • • • • • • • • • • • • • • • • •• 18
2. Shear . ...........•...................... • 20
IV.
v.
VI.
VII.
v
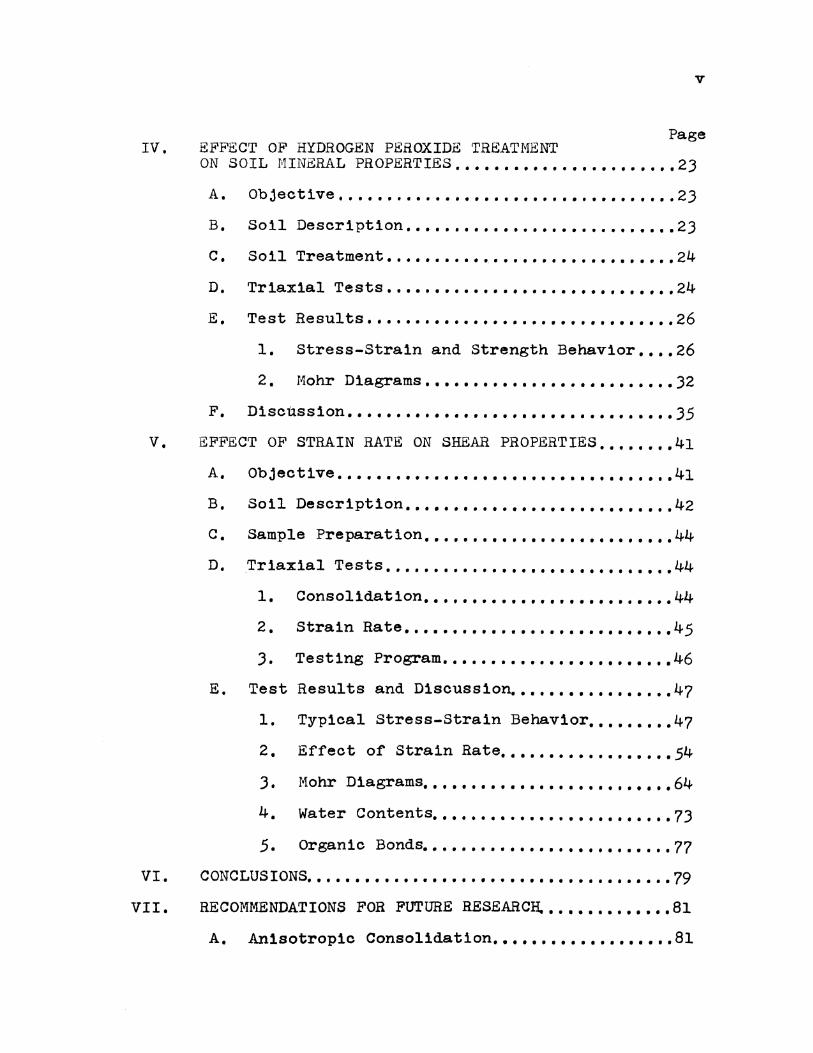
Page EFFECT OF HYDROGEN PEROXIDE TREATMENT ON SOIL MINERAL PROPERTIES •••••••••••• • • • • • • • • • • .2.3
A. Objective ••••••.••• I I I I I I t I I I I I I I I I I I I I I I I I .2.3
B. Soil Description ••• . . . . . . . . . . . . . . . . . . . . . . . . .2.3
c. Soil Treatment •• I t I I I I I I I, I I I I I I I I I I I I I I I I I I • 24
D. Triaxial Tests. • • • • • • • • • • • • • • • • • • • • • • • • • • • • .24
E. Test Results •••••••••••••••••••••••••••••••• 26
1. Stress-Strain and Strength Behavior. • • .26
2 • I1ohr Diagrams •••••••••••••••••••••••••• .32
F. Discussion •••••••••••••• • • • • • • • • • • • • • • • • 0 0 0 • .35
EFFECT OF STRAIN RATE ON SHEAR PROPERTIES •••• 0 • • .41
A, Object1 ve . ......•. , ......•. , . , ..•••..... , , .. 41
B. Soil Description ••••• • • • • • • • • • • • • • • • • • • • • ••. 42
c. Sample Preparation ••••• . . . . ' . . . . . . . . . . . . . • • • 44
D. Triaxial Tests ••••• • • • • • • • • • • • • • • • • • • • • • • 0 •• 44
1. Consolidation •• ' ' . . . . . . . . . . . . . . . . . . . • • • 44
2. Strain Rate •••••••••••••••••••••••••••• 45
.3. Testing Program •••••••• I I t I I I I I I I I I I ••• 46
E. Test Results and Discussion. I I I I I I I I I I I I I •• 0 47
1. Typical Stress-Strain Behavior ••••••••• 47
2. Effect of Strain Rate. • • • • • • • • • • • • • • • • 0 54
.3. Mohr Diagrams •• I I I t I I I I I I I I I I I I I I I I I I • 0 64
4. Water Contents. I I I I I I I t I I I I t I I I I I I I I I • • 7.3
5. Organic Bonds •••••••••••••••••••••••••• 77
CONCLUSIONS •••••••••••••••••••••••••••••••••••••• 79
RECOMMENDATIONS FOR FUTURE RESEARCa ••••••••••••• 81
A. Anisotropic Consolidation ••••••••••••••••••• 81

B.
c. Appendix 1
Appendix 2
Appendix J
Sample Preparation ••••••••••.••••••••••• • ••
Structure of Organic and Inorganic Soils • • •
vi
Page .81
• 82
List of Symbols ••••••••••••••••••••••••••• 83
Shear Data for Chapter IV ••••••••••••••••• 84
Shear Data for Chapter V, a-b. . . . . . . . . .85-86
BIBLIOGRAPHY • . . . . . . . . . . . . . . . . . . . . . . . . . . . . . . . . . . . . . . . ... 87
VITA .. , . , ••...•......••.......•..•..• , • , .. , •.••.•..•..• 89
vii
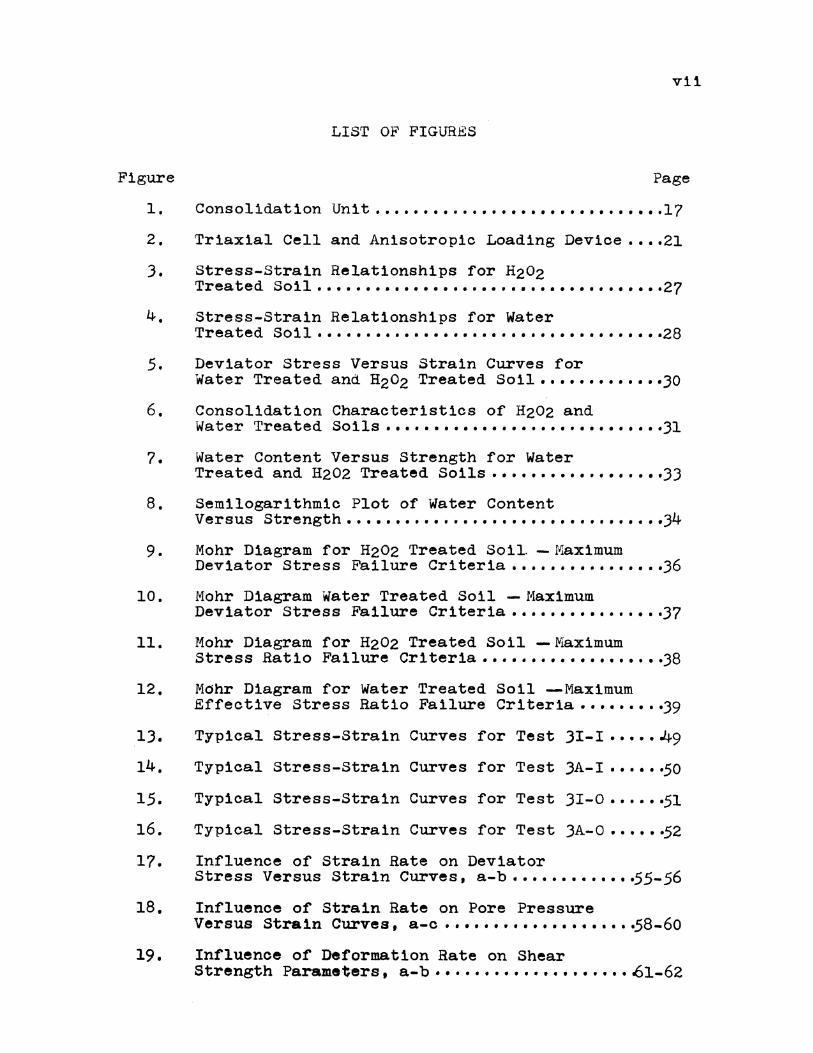
LIST OF FIGURES
Figure Page
1. Consolidation Unit •••••••••••••••••••••••••••••. 17
2. Triaxial Cell and Anisotropic Loading Device •••• 21
3. Stress-Strain Relationships for HzOz Treated Soil ••••••••••••••••••••••••••••••••••• ·27
4. Stress-Strain Relationships for Water Treated Soil ••••••••••••••••••••••••••••••••••• ·28
5. Deviator Stress Versus Strain Curves for Water Treated and HzOz Treated Soil·············30
6. Consolidation Characteristics of Hzoz and Water Treated Soils •••••••••••••••••••••••••••••31
7. Water Content Versus Strength for Water Treated and H202 Treated Soils ••••••••••••••••••33
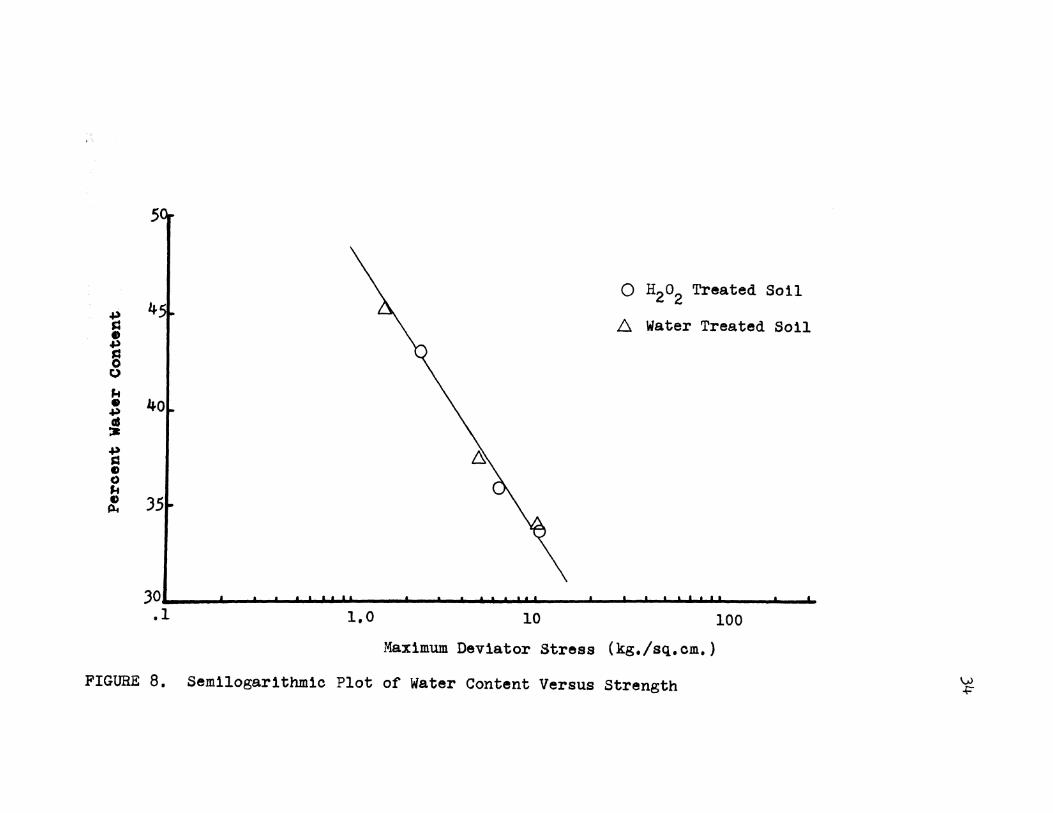
8. Semilogarithmic Plot of Water Content Versus Strength ••••••••••••••••••••••••••••••••• 34
9. Mohr Diagram for HzOz Treated Soil. - !>1aximum Deviator Stress Failure Criteria ••••••••••••••··36
10. Mohr Diagram Water Treated Soil -Maximum Deviator Stress Failure Criteria••••••••••••••••37
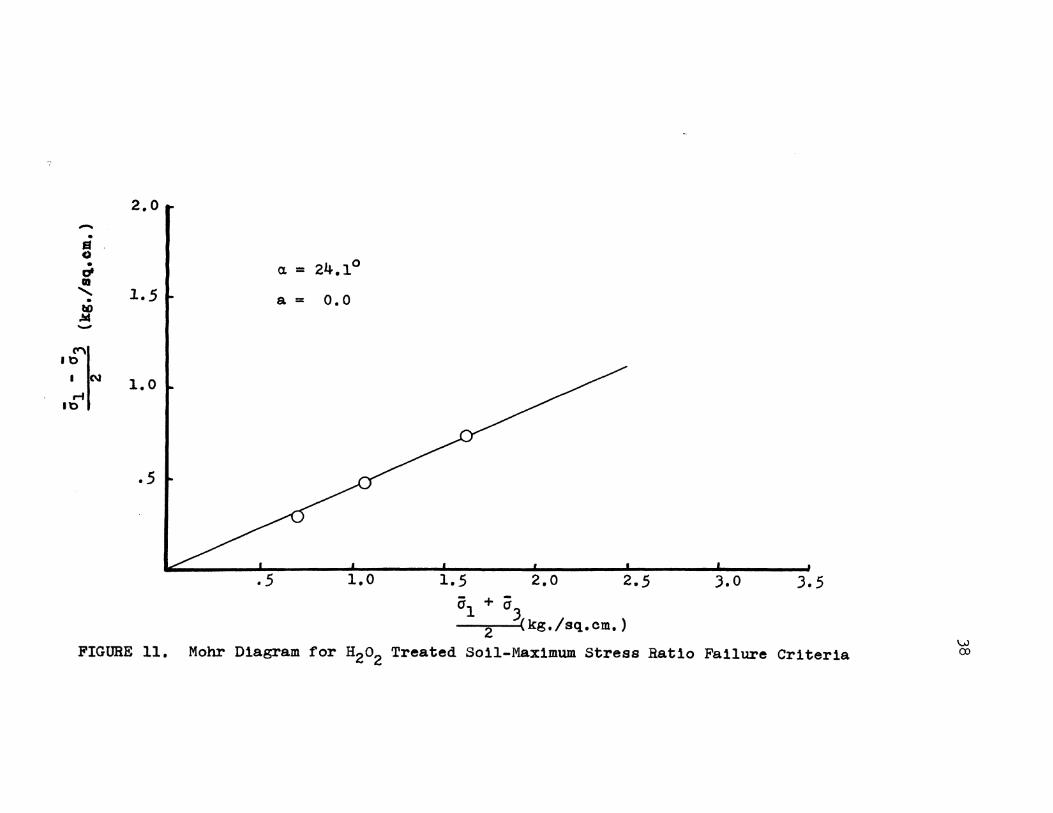
11. Mohr Diagram for H202 Treated Soil -Maximum Stress Ratio Failure Criteria ••••••••••••••••••• 38
12.
13.
14.
15.
16.
Mohr Diagram for Water Treated Soil --Maximum Effective Stress Ratio Failure Criteria•••••••••39
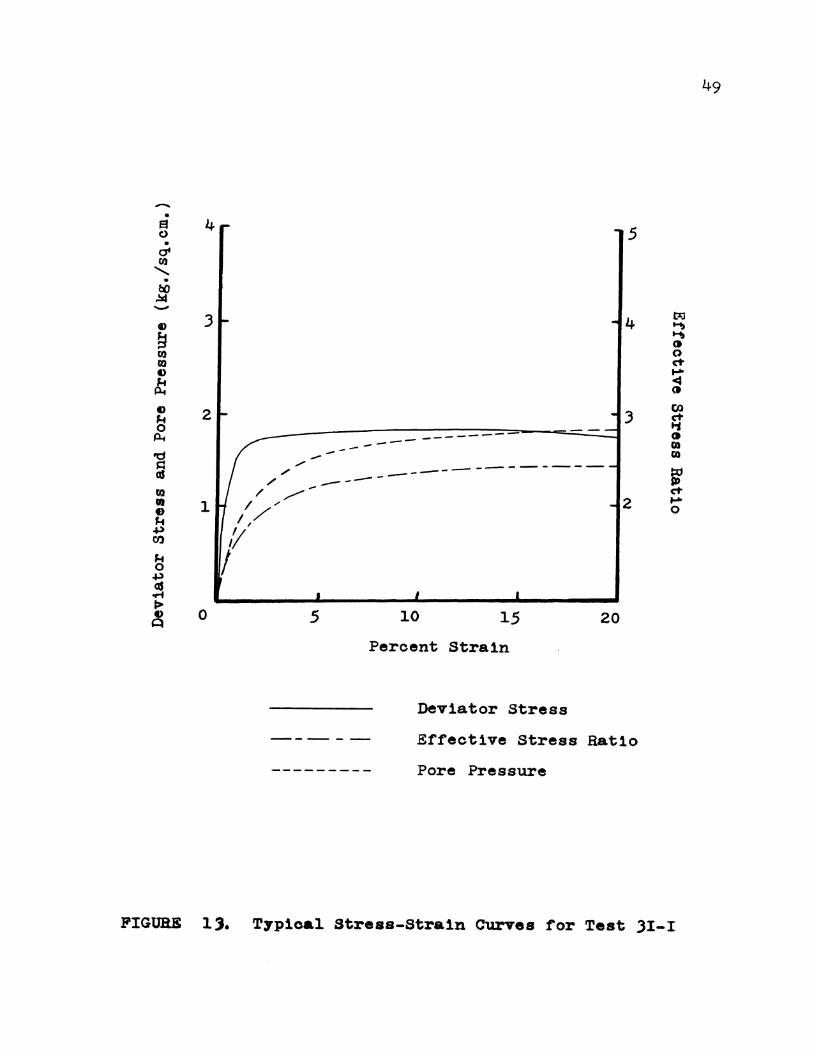
Typical Stress-Strain Curves for Test 3I-I • • • • • 49
Typical Stress-Strain Curves for Test 3A-I • • • • • ·50
Typical Stress-Strain Curves for Test 3!-0 • • • • • •51
Typical Stress-Strain Curves for Test 3A-O ••• • • ·52
17. Influence of Strain Rate on Deviator Stress Versus Strain Curves, a-b············~5-56
18. Influence of Strain Rate on Pore Pressure Versus Strain Curves, a-c ••••••••••••••••••• ·58-60
19. Influence of Deformation Rate on Shear Strength Parame''ers, a-b • • •••••••••••••••••• 61-62

viii
20. Comparison of Friction Angles--Inorganic Soil, a-d •.•••••••.••••••.•••.•.••• 65-68
21. Comparison of Friction Angles--Organic Soil, a-b •••••••.•••••••••••••••••••• 69-70
22. Water Content Versus Consolidation Pressure-Organic and Inorganic Soils •••••••••••••••••••.• ?4
2). Water Content Versus Max. Deviator Stress-Organic and Inorganic Soils ••••••••.••.••••••••• 75
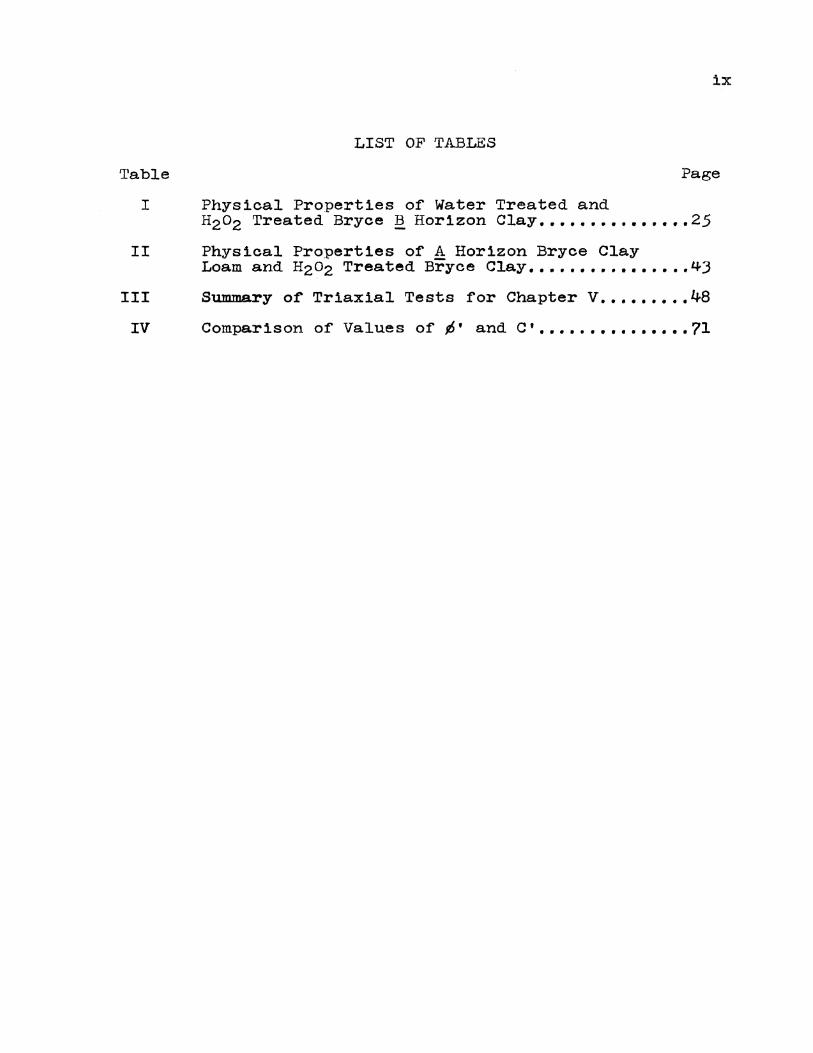
Table
I
II
III
IV
ix
LIST OF TABLES
Page
Physical Properties or Water Treated and H202 Treated Bryce B Horizon Clay ••••••••••••••• 25
Physical Properties or A Horizon Bryce Clay Loam and H202 Treated Bryce C1ay •••••••••••••••• 4J
Summary or Triaxial Tests ror Chapter V ••••••••• 48
Comparison of Values or¢' and C'•••••••••••••••71

CHAPTER I
INTRODUCTION
In recent years, a considerable amount of research
has been conducted on the effects of carbon content on
the engineering properties of clay soils. Schmidt
(1965) used hydrogen peroxide to remove the organic
matter and study the effect of carbon content on fund
amental physical properties such as the Atterberg limits,
consolidation parameters, and moisture density relation
ships. Green (1969), in his study of the secondary
consolidation characteristics of a clay soil, isolated
carbon, as well as several other variables, which
included sample thickness, load increment ratio, and
temperature.
Schrotberger (1966) initiated research on shear
strength properties of organic soils with his inves
tigation of the effect of carbon content on the shear
strength of a cohesive soil consolidated isotropically.
His study clearly revealed that the organic soil exhib
ited a higher effective shear strength envelope than
the same soil treated to remove the organic matter.
Rezvan (1969) extended the study of shear strength by
performing triaxial shear tests on anisotropically,
as well as isotropically consolidated samples of an
A horizon Bryce clay. The tests were performed on
art1t1c1ally sed1mented samples of treated soil,
1
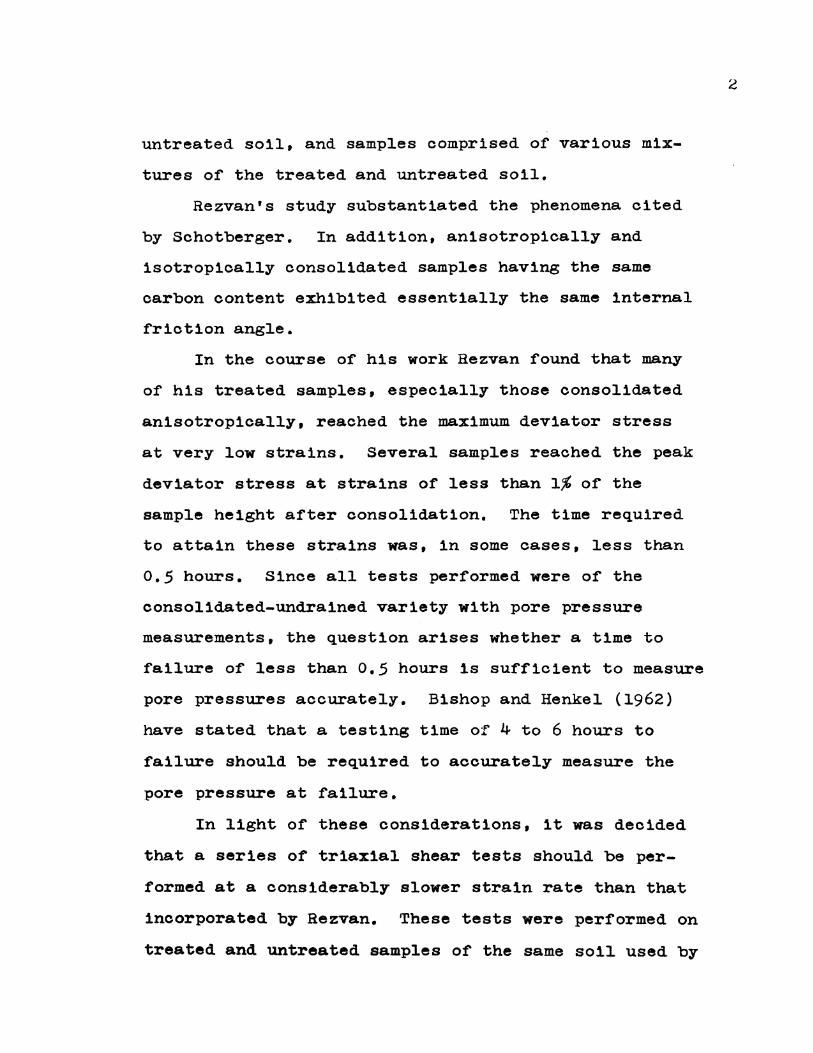
untreated soil, and samples comprised of various mix
tures of the treated and untreated soil.
Rezvan's study substantiated the phenomena cited
by Schotberger. In addition, anisotropically and
isotropically consolidated samples having the same
carbon content exhibited essentially the same internal
friction angle.
In the course of his work Rezvan found that many
of his treated samples, especially those consolidated
anisotropically, reached the maximum deviator stress
at very low strains. Several samples reached the peak
deviator stress at strains of less than 1~ of the
sample height after consolidation. The time required
to attain these strains was, in some cases, less than
0.5 hours. Since all tests performed were of the
consolidated-undrained variety with pore pressure
measurements, the question arises whether a time to
failure of less than 0.5 hours is sufficient to measure
pore pressures accurately. Bishop and Henkel (1962)
have stated that a testing time of 4 to 6 hours to
failure should be required to accurately measure the
pore pressure at fail.ure.
In light of these considerations, it was decided
that a series of triaxial shear tests should be per
formed at a considerably slower strain rate than that
incorporated by Rezvan. These tests were performed on
treated and untreated samples of the same soil. used by
2
Rezvan. The effect of strain rate on the pore pressure
parameters, stress-strain characteristics, and friction
angle was determined and analyzed.
Since this project involves a shear strength
comparison between an organic soil and that same soil
treated to remove the organic matter, it is essential
that the hydrogen peroxide treatment itself have no
significant effect on shear strength properties.
Schmidt (1965) has determined statistically that
the hydrogen peroxide treatment method had no signifi
cant effect on the Atterberg limits, clay mineralogy,
or consolidation characteristics of an inorganic B
horizon Paulding clay. He then concluded that since
the peroxide treatment did not change the clay min
eralogy or physical properties. of the inorganic soil,
it probably would not affect the very similar soil
mineral fraction of the organic ! horizon Paulding
clay. Although one could then infer that the internal
friction angle would probably be similarly unaffected
by the peroxide treatment itself, the decision was
made to verify this hypothesis.
A second objective of this project will thus be
to compare the friction envelope of an inorganic Bryce
clay to that of the same material treated with hydrogen
peroxide.
3

CHAPrER II
REVIEW OF LITERATURE
A. Introduction
This investigation compares the shear strength of
an organic cohesive soil with an identical soil, which
has been treated to remove the organic matter. In
Section B of this chapter is presented a synopsis of
some of the past research on shear strength parameters
of cohesive soils as determined from the consolidated
undrained triaxial test. The subject matter is limited
to only that material which is relevant to this project.
Section C is concerned with the previous research
done on the shear strength of organic soils, and
Section D contaLns a short review of the research per
formed by Schmidt (1965) on the effects of the hydrogen
peroxide treatment method on the physical properties
of a cohesive soil.
B. Shear Strength
1. Failure a
Coulomb (1776) first expressed the theory of the
shear failure of soil by the equation
s=c+atanp (1)
where s is the shear resistance on the plane of
failure, c is the cohesive strength, a is the normal
stress on the plane or failure, and p is the angle or
shearing rea1stanoe.
4
Terzaghi (1923) stated that all measurable e:r:rects
of' a change in stress, such as compression, distortion,
and change in shearing resistance, are due exclusively
to changes in the e:r:rective stress rather than the
total stress. For saturated soil, the e:r:rective normal
stress is de:f'ined by the equation
a= a-u (2)
where a is the total normal stress, and u is the
:fluid pressure in the pore space o:r the soil. Coulomb's
equation ma7 be written as
s = c + (a - u) tan ~
This equation is the basis :for most analyses of' the
shear strength of' saturated cohesive soils.
2. Pore Pressure Parametersa
(3)
Skempton (1954) proposed that the change in pore
pressure ~ u may be expressed by the equation
AU= B [.6.0'3 + A( .6.0'1 - .6.0'3)] (4)
where .6.0'1 = change in major principal stress,
.6.0'3 = change in minor principal stress.
A and B are the pore pressure parameters.
For saturated soils B is equal to unity. When B
is equal to unity and the minor principal stress is
kept constant as in the triaxial shear test, A is
denoted as A and is de:f'ined by the equation
X= (5)
5
Terzaghi and Peck (1968) have stated that for in
sensitive normally loaded clays, A is less than unity
at low strains, but with increasing strains A increases
to approximately unity and maintains this value through
out the triaxial test. They have also said that the
coefficient A may exceed unity in sensitive clays due
to the collapse of the metastable structure of the
material.
In the existing methods of predicting pore pressures,
the pore pressure parameters are invariably considered
as so~e functions of applied stresses. Lo (1969) rejects
these "stress theories". He showed mathematically and
experimentally that the pore pressures induced by shear
may be expressed as a sole function of major principal
strain.
J. Stress Historya
Much research has been done on the effect of aniso
tropic consolidation on the shear strength of cohesive
soils. Henkel (1960) discovered that a unique relation
ship existed between the maximum deviator stress and the
water content in his study of the shear strength pro
perties of a remolded Weald clay. He stated that this
relationship was not dependent on whether the sample
was consolidated isotropically or anisotropically. He
also found that samples consolidated in either manner
to the same water content followed identical effective
stress paths to failure, and that the effective friction
6

angle was also independent or the consolidation method.
A stress path depicts the successive states or
stress that exist in a specimen as the specimen is load-
ed. A plot of (o1+o 3)/2 versus (o1-o3)/2 at various
stages or loading represents an effective stress path
for the sample being loaded. When a series or soil
samples are sheared after being consolidated at sue-
cessively higher pressures, a straight line can be
drawn connecting the ~ailure points of the effective
stress paths for these samples. The effective friction
angle of the soil can then be computed since it is
geometrically related to the slope or the straight
line connecting the failure points.
Whitman, Ladd, and da Cruz (1960) round for a
given water content that anisotropically consolidated
samples gave higher maximum deviator stresses. This is
not in agreement with Henkel (1960). They also found
that the shape or the effective stress path depended
on the method of consolidation, but that the friction
envelope was independent or the consolidation path,
i.e. it was the same for isotropic and anisotropic
consolidation.
Henkel and Sowa (1963) used a fresh batch of the
same Weald clay used by Henkel (1960). They discovered
again that the effective friction angle appeared to be
independent of the stress history, but that the effective
stress paths for samples consolidated isotropically and
7
anisotropically to the same water content di£rered
considerably. This latter finding contradicts again
Henkel's previous conclusions concerning the uniqueness
of the effective stress path. Henkel and Sowa also
round that the average A parameter for samples sheared
after anisotropic consolidation was 1.8, while those
samples sheared after isotropic consolidation showed
an average A parameter of 0.92. Obviously, the stress
path differences are not minor.
Ladd (1965) found that anisotropically consoli
dated samples failed at much less strain than samples
consolidated isotropically. He also reported that the
effective friction angle decreased by 0 - 4° for samples
consolidated anisotropically. Chung (1970) also noted
that the effective friction angle appeared to be depen
dent on the stress history of the soil tested. He
found that samples consolidated anisotropically produced
a friction angle approximately '5° higher than identical
samples consolidated isotropically.
4. Strain Ratea
Casagrande and Wilson (1951) studied the influence
of strain rate on the strength of undisturbed coh~aive
soils by performing standard long time triaxial compres
sion tests and creep-strength tests. They found that
undisturbed normally consolidated cohesive soils appear
to lose stre~gth as the strain rate is progressively
decreased. They also found that increasing the time to
8
failure (decreasing the strain rate) tends to cause
an increase in the strain at failure.
Crawford (1959) studied the effects of strain rate
on an undisturbed Leda clay, which is found in Canada,
He described the clay as being very brittle and highly
sensitive, often remolding to a liquid consistency.
He found that the pore pressures and the A coefficients
at failure increased with decreasing strain rates.
He also found that the maximum deviator stress decreased,
the cohesion intercept decreased, and the effective
friction angle increased as the time to failure was
increased. Crawford observed also that the pore pressure
continued to rise at strains higher than the maximum
deviator stress. He suggested that the pore pressure
level in the sample is a function of the breakdown of
the soil structure and this in turn is related to strain.
Olson (1963) found similar results in his study
of the influence of the rate of deformation on the
consolidated-undrained shearing parameters of arti
ficially sedimented specimens of sodium illite. He
found that pore pressure versus strain plots for samples
consolidated at the same pressure coincided for rates
of deformation ranging from ,05 inches per hour to
,005 inches per hour. This was true even though the
maximum deviator stress was decreasing with the decreas
ing strain rates. Olson concluded that the common
assumption that the pore water pressure is a function
9

of the increment of stress during shear may not be a
good approximation in all soils. The pore pressure
in the sodium illite appeared to be a function of the
increment of strain during the shearing process.
c. Effect of Organic Content on Shear Strength
Schrotberger (1966) investigated the effect of
organic matter on the shear strength of a cohesive
soil by performing isotropically consolidated undrained
triaxial tests on a Paulding clay from Ohio. Rezvan
(1969) extended the study by performing anisotropically
consolidated as well as isotropically consolidated
undrained triaxial tests on a Bryce clay from IllinQis.
Both investigators treated the A horizon soil with
hydrogen peroxide to remove the organic matter. They
then compared the shear strength properties of· samples
composed of the untreated soil, the treated soil, and
varying mixtures of the treated and untreated soils,
Schrotberger found that the effective stress
friction angle of the treated soil of low organic
content was clearly smaller than that of the untreated
soil of high organic content. Rezvan substantiated
this finding and also determined that the effective
friction angle was independent of the method of
consolidation.
Schrotberger also demonstrated that during the
same time period of consolidation in the triaxial cell,
the treated soil underwent a greater volume change
10

and there~ore had a lower void ratio and water content
than the untreated soil during shear. However, the
untreated soil required a higher deviator stress to
produce ~ailure. He concluded that the strength con
tribution o~ the organic material in the untreated soil
was greater than the strength obtained by the denser
treated soi1. Rezvan also noted that the Bryce un
treated soil had an undrained strength approximate1y
5 times larger than the undrained strength o~ the
treated soi1 at the same water content. Intermediate
mixtures o~ the treated and untreated soi1s displayed
intermediate strengths according to their carbon contents.
Rezvan a1so ~ound that when the treated soil was
consolidated anisotropica1ly, the deviator stress
reached its maximum at very low strains. In some
cases, times to ~ailure of 1ess than one hal~ hour
were recorded. He suggested that the pore pressure
may not have equi1ibrated throughout the sample in
such a short time to failure. It follows that pore
pressure measurements at the bottom of the samp1e may
have been in error. Rezvan suggested that a series
of tests be performed at a s1ower strain rate to
investigate this possibi1ity.
D. Effect of the Hydrogen Peroxide Treatment on the Physica1 Properties of a Soi1
Research in this area has been performed exclus-
ively by Schmidt (1965). He compared the properties
11

of a hydrogen peroxide treated inorganic soil with
the properties of the same soil, which had been
treated by water only. The soil used was a Paulding
B horizon clay. Schmidt found that there were no
significant differences in Atterberg limits between
the soil subjected to these two treatments. The clay
minerology, as determined in several series of x-ray
diffraction studies, was not significantly different
for the two materials. Also, the consolidation char
acteristics of the hydrogen peroxide treated soil and
the control soil were quite similar.
Schmidt concluded from these findings that the
hydrogen peroxide treatment technique is effective
only in the selective removal of organic matter from
a soil and does not affect the physical properties
of the mineral fraction of the soil.
12

A. General
CHAPTER III
PROCEDURES
13
As was previously explained, this research project is
a study of two separate but related topics. Chapter V
deals with the effect of strain rate on the difference in
shear strength between an organic soil and the same soil
treated with hydrogen peroxide to remove the organics.
It is imperative to the study that the hydrogen peroxide
treatment have no effect on the soil treated, except to
remove organic matter. This problem will be dealt with in
Chapter IV by studying the effect of the peroxide treat
ment method on the shear strength of an inorganic clay.
The inorganic clay studied in Chapter IV is the B horizon
counterpart of the A horizon organic clay studied in
Chapter v. Since the testing procedures and equipment were
essentially the same for both phases of this project,
they will be described in detail in this chapter.
B. Soil Preparation
Material was prepared for this study by initial air
drying and then pulverizing 1n a Lancaster PC Mixer. Only
the material passing the #40 sieve was used. Approximately
95% of the soil passed the #40 sieve after limited grind
ing. The 5% of the material that was discarded remained
in the form of small hard clay chunks, which would not
break down after a reasonable time was allowed for grind
ing. It was believed that the soil discarded contained
no material which was not fully represented in the soil
used for testing purposes.
c. Hydrogen Peroxide Treatment
The purpose of the hydrogen peroxide treatment is
to remove a major portion of the organic content of a
soil. This is accomplished by the oxidation of the
organic matter in the soil by the hydrogen peroxide.
The treatment method adopted for this study was the same
as that used by Green (1969) and Rezvan (1969). That
method is as follows• 100 grams of the soil to be
treated was added to 100 ml. of a JO% hydrogen peroxide
solution in a 2000 ml. flat bottom flask. The flask and
its contents were then placed in a 50°C water bath to
accelerate the time of reaction. After about three hours
another 50 ml. of hydrogen peroxide was added to insure
that sufficient organic removal had been accomplished.
An additional 100 grams of soil and 100 ml. of hydrogen
peroxide was then added to the flask. The reaction was
allowed to proceed for about one hour, after which the
final 150 ml. of hydrogen peroxide was added and the
flask allowed to remain for eight hours in the 50°c bath.
The mixture was then poured into evaporating dishes and
allowed to air dry. The dried soil was then reground
to pass the #40 sieve and the entire treatment process
was repeated. Green {1969) found that this process
14

reduced the carbon content of the Bryce clay loam from
4.7% to 1.1% indicating a total carbon removal of about
77%.
D. Organic Carbon Determination
The organic carbon content of the soils used in this
study was determined using Allison's Method (1960). This
is a wet - combustion process which requires that the
15
soil be treated with a strong reducing agent in the pre
sence of an acid mixture. The evolved gases which result
from the oxidation of the organic carbon in the soil are
passed in a carrier stream.through successive vials con
taining KI, Ag2so4, concentrated H2So4, zinc and anhydrous
magnesium perchlorate. These chemicals serve to trap the
impurities so that co2 is the only remaining gas. The
co2 is then passed into a Nesbitt bulb where it is sorbed
onto Mikohbite, a solid carbon dioxide sorbent. The in
crease in weight of the Nesbitt bulb is the weight of
evolved co2 • The weight of the carbon was then simply
calculated and expressed as a percentage by weight of
the soil solids treated. This method is explained in
greater detail by Schmidt (1965) and Green (1969).
E. Sample Preparation
Saturated samples were prepared by mixing predeter
mined amounts of the air dried soil and distilled water
in a soil dispersion mixer. The soil-water slurry was
then poured into a plexiglass cylinder with an outside
diameter of 2 inches and an inside diameter of 1.4 inches.

16
The cylinder had been· previously mounted onto a base plate
which contained a porous stone and a drainage outlet. The
cylinder and base plate were fastened tightly together by
means of a plexiglass top flange and three threaded brass
rods o Refer to Figure 1 •
After the slurry was poured into the cylinder, the
bottom drainage outlet was closed off and a vacuum source
was applied to the top of the cylinder to de-air the
slurry o It must be noted that the slurry had to have a
high enough water content to facilitate de-airing but be
thick enough to prevent segregation of soil particles
during consolidation. Trial mixtures had previously been
prepared to determine the proper soil-to-water ratio
which would fulfill these requirements. The water con
tent of a properly proportioned slurry was usually about
2 to 2.5 times the liquid limit of the soil being prepared.
After air bubbles ceased to develop in the slurry,
the vacuum source was removed. A plexiglass piston with
a porous stone insert and drainage outlets was then placed
into the top of the cylinder. The piston, which fitted
in the cylinder to a close tolerance, was guided by a
stainless steel ram until it rested on top of the slurry.
A plexiglass loading platform was then affixed to the top
of the steel ram, and the base plate drainage way was
opened. A sufficient weight to subject the sample to
an axial pressure of o·. 6 kg./sq. em. was placed on the
loading platform, and the consolidation process was
begun.

brass rod
r----...... , w ~
loading platform
guide
flange
loading piston
plexiglass cylinder
porous stone
soil sample
porous stone
outlet drainage
FIGURE 1. Consolidation Unit
17

When a plot of the downward movement of the piston
versus time indicated that the sample was fully consoli
dated, the cylinder with the encased sample and piston
18
was detached from the base plate. The sample was then
extruded by pushing the piston and sample out of the
cylinder with the steel ram. Previous calculations had
been made to ensure that the weight of soil solids used
would be sufficient to produce a specimen which was
approximately 9 em. long. As a result, all of the samples
used in this study were at least 9 om. in length when
they were extruded from the sedimentation cylinder.
After the sample had been extruded, it was trimmed to a
length of 8 em., and the length, diameter, and weight
were recorded.
F. Triaxial Compression Tests
All of the compression tests performed for this in
vestigation were of the consolidated~undrained variety
with pore pressure measure~ents. Samples were normally
consolidated under either isotropic or anisotropic stress
conditions and then sheared at a constant rate of strain.
1. Consolidations
After being extruded from the plexiglass cylinder,
the sample was weighed and then placed upon the pedestal
of a Geonor triaxial cell. Whatman No. 54 filter paper
was placed around the sample to accelerate the consoli
dation process. Slots had b~en cut lengthwise into the
filter paper·to minimize restriction of sample deformations.
The sample could now drain radially to the rilter paper
as well as vertically to a porous stone placed on the
bottom pedestal, Two drainage tubes in the pedestal then
provided outlets for water driven from the sample during
the consolidation process.
No porous stone was used on top of the sample,
Instead, the top or the sample was lubricated with sili
cone oil, and a similarly lubricated thin rubber membrane
was placed between the smoothly polished loading cap and
the top of the sample, This method was incorporated in
an attempt to counteract the effects of frictional end
restraint, which affects strength and pore pressure
measurements (Bishop and Henkel, 1962),
A Trojan brand rubber membrane of 0.002 inches
thickness was used to encase the sample so that the ex
pulsion of water within the sample could only take place
through the cell drainage system. The rubber membrane
19
was sealed against the loading cap and the pedestal by
rubber 0-rings, While one of the drainage tubes leading
from the porous stone at the bottom of the sample was
closed, the other was then connected to a 50 ml, burette
filled with water, and an initial burette reading was
recorded, The triaxial cell was then filled with de-aired
water, and a hydrostatic stress was applied to the
jacketed sample utilizing a constant pressure cell to
maintain the desired pressure.
A Geonor anisotropic loading device was used to

20
apply the extra vertical pressure necessary for anisotropic
consolidation. Whereas loading for isotropic consolida
tion was performed in one step, loads for anisotropic
consolidation were applied in small increments such that
the ratio of vertical to horizontal pressure was kept
constant. The number of steps and the time to consoli
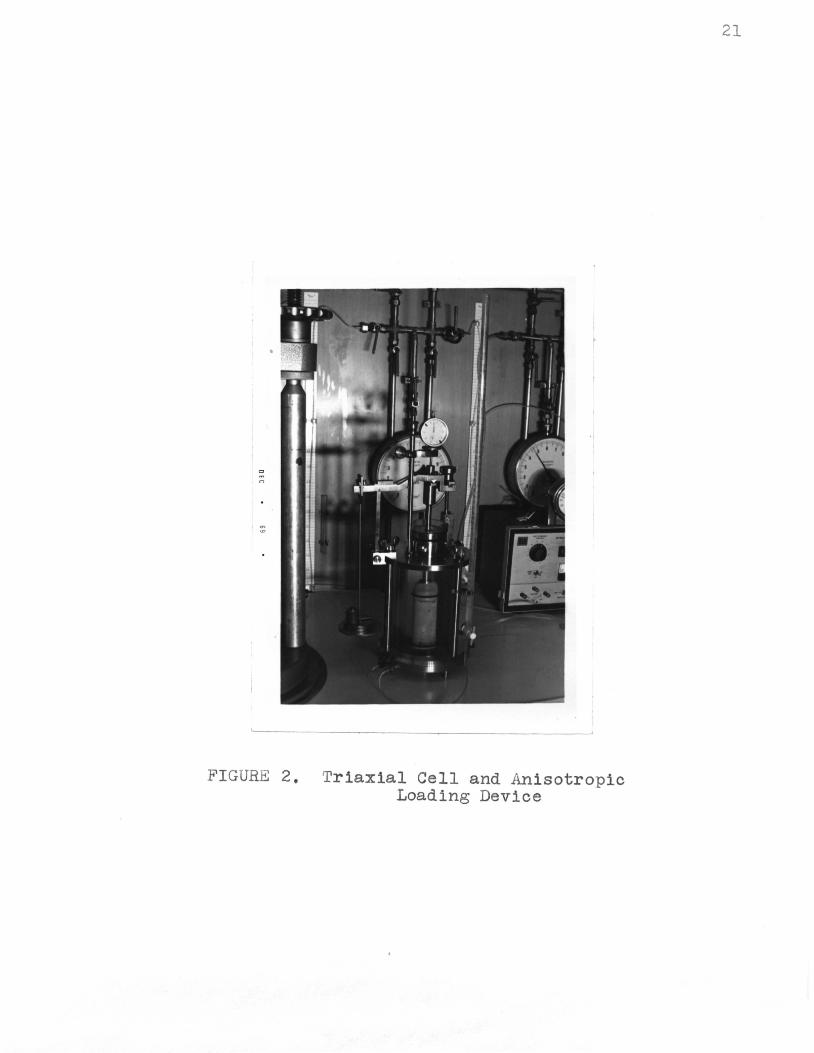
dation varied with the soil being tested. Figure 2
shows the triaxial cell and the anisotropic loading
device.
After the completion of consolidation, the drainage
tube to the burette was closed, and the final burette
reading was recorded, The difference between the initial
and final burette readings was the volume change due to
consolidation.
2. Shear:
After consolidation, the burette was disconnected
and de-aired water was flushed through the drainage tubes
under a low pressure to remove any air entrapped in the
system. One drainage tube was then closed, and the other
was connected to a pressure transducer cell of C.E.C.
type 4-312-001, The transducer, which was connected to
a BLH Model 120C strain indicator, was calibrated to
measure pore pressure during subsequent undrained loading.
Before the sample was sheared, the cell pressure
was increased 2 kg./cm.2 above the consolidation pressure
to dissolve air trapped in the drainage tubes and between
the membrane and sample. The sample was then left for
0
n
FIGURE 2. Triaxial Cell and Anisotropic Loading Device
21

approximately eight hours to allow the pore pressure and
confining pressure to come to equilibrium. The increase
in the pore pressure of the sample was then noted. If
this increase was equal to at least 90% of the cell
pressure increase, the specimen was judged to be suffi
ciently saturated. Samples which did not meet this
criterion were discarded.
22
The triaxial cell was then placed in a Farnell press.
The axial load was applied at a selected strain rate, and
the cell pressure was kept constant throughout the shear
ing process. A proving ring, which was equipped with an
extensometer dial gage for measuring the deformation of
the ring and calibrated to applied load, was used to
measure the axial load. Another dial gage mounted on
the proving ring was used to measure the vertical defor-
. mation of the test specimen. Readings of vertical defor
mation, axial load, and pore pressure were taken at
selected intervals until 20 to 25 per cent axial strain
of the sample was reached. The test was then stopped
and the sample removed from the triaxial cell. The
final length of the specimen was recorded, and the
sample was cut into three sections from which the water
content was determined.
CHAPTER IV
EFFECT OF HYDROG~N PEROXIDE TREATMENT ON SOIL MINERAL PROPERTIES
A. Objective
Previous studies have proven the effectiveness of
the hydrogen peroxide treatment method in removing
organic matter from a soil. Schmidt (1965) has further
shown that the hydrogen peroxide itself does not affect
the physical properties of the soil treated. He demon
strated this by performing Atterberg limit tests, x-ray
diffraction studies, consolidation, and compaction tests.
Although it seems probable that shear strength properties
would be similarly unaltered by such treatment, it is the
purpose of this chapter to study the results of a series
of triaxial tests performed to verify this assumption.
B. Soil Description
The soil chosen for this study was a B horizon
Bryce clay taken from the NW i of sw t of Sec. 19,
23
T. 24, R. 13 W of Iroquois County, Illinois (Green, 1969).
The B horizon is a plastic clay mottled with pale yellow
and rusty brown, and is not clearly defined until a
depth of about 12 to 16 inches is reached. The sample
used was taken at a depth of about 15 inches. It is
essentially inorganicr the carbon content is only 0.8~.
The natural soil was prepared for testing as described
in Section B of Chapter III. It was then separated into
two equal homogeneous portions and stored to await
treatment.
c. Soil Treatment
One half of the soil was treated with hydrogen
peroxide using the procedure described in Section C of
Chapter III. Simultaneously, the other half was treated
with distilled water in place of the hydrogen peroxide
using exactly the same procedure. It was found that the
carbon content of the peroxide treated soil was reduced
from 0.8% to 0.6%. It was concluded that this slight
difference in carbon content was negligible, and pro
bably would not affect the shear strength properties.
It was postulated that any significant differences
in the shear properties and strength of the two materials
must be attributed to the action of the hydrogen peroxide
on the mineral portion of the soil. Conversely, if no
significant difference in the shear properties are found,
it may be concluded that there is no significant reaction
of the hydrogen peroxide with the soil mineral fraction.
A listing of the pertinent physical properties of
the two soils is presented in Table I.
D. Triaxial Tests
Samples were prepared for triaxial testing in the
manner described previously in Section E of Chapter III.
It was found by trial that the proper soil-to-water mix
ture was 190 ml. of distilled water to 140 grams of the
B horizon soil. Approximately nine days was required
for consolidation in the sedimentation cylinders (Fig. 1).
A total of six consolidated undrained triaxial tests
24

Water Treated
H202 Treated
TABLE I
Physical Properties of Water Treated and
H2o2 Treated Bryce B Horizon Clay
Particle Size Distribution <%> Atterberg Limits
Sand Silt Clay >.05mm 50-2 microns <2 microns
Lw Pw P. I. t%> on
5 41 54 55.0 21.0 )4.0
4 40 56 53.0 20.5 32.5
organic Carbon
%
0,8
0,6
f\) \...r\

were per~ormed. Three samples o~ the soil treated with
hydrogen peroxide were consolidated isotropically at cell
pressures o~ 1, 2, and J kg./cm. 2 • Correspondingly,
three samples o~ the soil treated with distilled water
were consolidated at identical cell pressures. It was
found that the time required for 100% consolidation in
the triaxial cell was about J6 hours for all samples
tested. The samples were sheared under constant volume
conditions at a de~ormation rate of .053 inches per hour.
This represents an average axial strain rate of approxi
mately 1.5% per hour for the six samples tested.
E. Test Results
The results of the triaxial shear tests indicated
that the inorganic soil treated with hydrogen peroxide
(H2o2 ) and the same soil treated only with distilled
water have very similar shear strength properties.
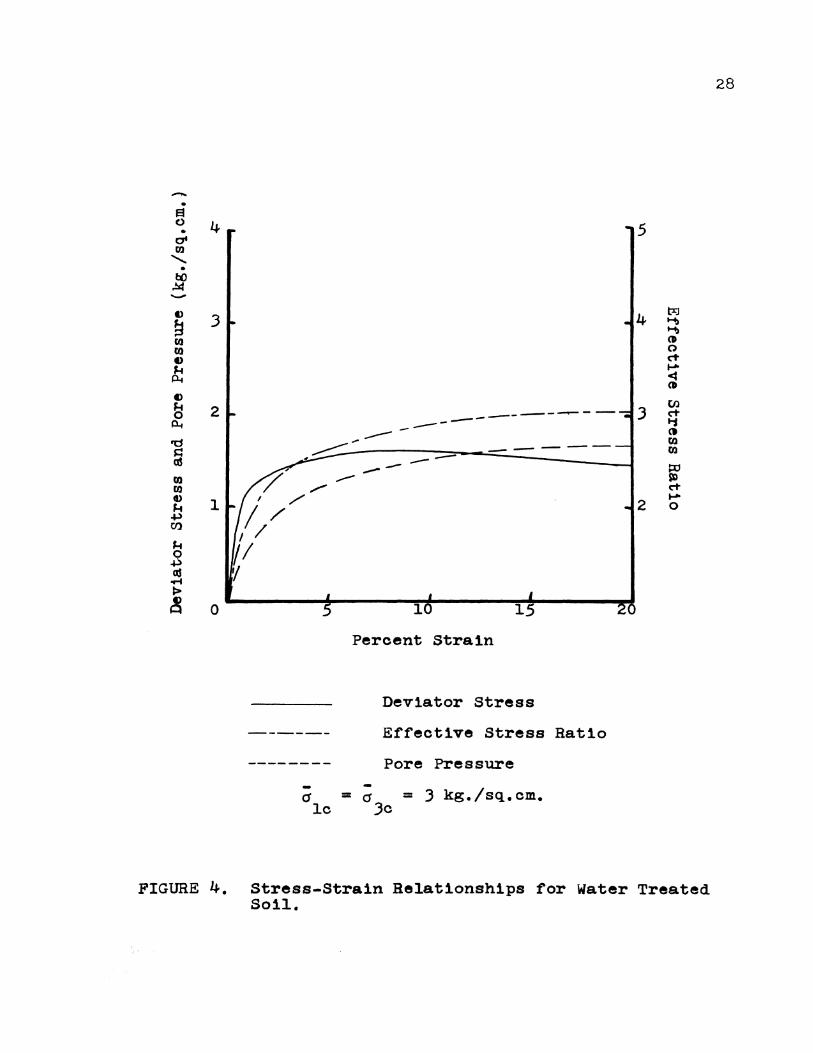
1. Stress-Strain and Strength Behaviors
In figures J and 4, examples of the stress-
strain behavior of the two soils are presented. The
deviator stress (al- oJ), effective stress ratio
(a1;;3), and pore pressure are plotted versus percent
strain for these typical tests.
It is evident from the figures that the soil
treated with H2o2 (Fig. J) reacts to the application of
axial load in very much the same manner as the soil
treated only with water (Fig. 4). The maximum deviator
stresses cal - ;J) are approximately equal and occur at
26

-. a C)
. J9 -
4
J
2
1
0
----------------,_...-- ___.-
---/"' -----
/ ............ I , ..... I /
I / I /
I I
10 15
Percent Strain
Deviator Stress
E~~ective Stress Ratio
Pore Pressure
5
4
J
2
20
FIGURE J. Stress-Strain Relationships ~or H2o2 Treated Soil.
27
-. El (.) 4 • at m
' . t() ~ -C)
~ 3 m fO C)
F-t P-t C) F-t 2 0 P-t
'd s:: ~
m fO ., F-t 1 ~ CJl
F-t 0 ~ ~ ..... p
! 0
-(J lc
--- ------- ----
1 1
Percent Strain
Deviator Stress
E~fective Stress Ratio
Pore Pressure
= o = 3 kg./sq.cm. 3c
5
4 trJ ""'\ ""'\ () a C"t .-~ ()
til 3 C"t ....
() fO I'IJ
~ C"t .-
2 0
FIGURE 4. Stress-Strain Relationships for Water Treated Soil.
28

almost identical axial strains. The maximum e~~ective
stress ratios (a1!a3) o~ the two soils are also approxi
mately equal ~or each consolidation pressure and occur
at approximately the same strain. The strains at the
maximum e~~ective stress ratio are signi~icantly higher
than the strains at the maximum deviator stress. For
both soils, the pore pressure continues to rise a~ter
the maximum deviator stress is reached. At high strains,
the pore pressure actually exceeds the axial stress
di~~erence, i.e. Skempton•s A coe~~icient is larger
than unity (Skempton, 1954). This is believed to be
due to the breakdown o~ the metastable structure o~ the
soil during shear. Hence, increasingly more pressure
must be taken by the pore water at higher strains.
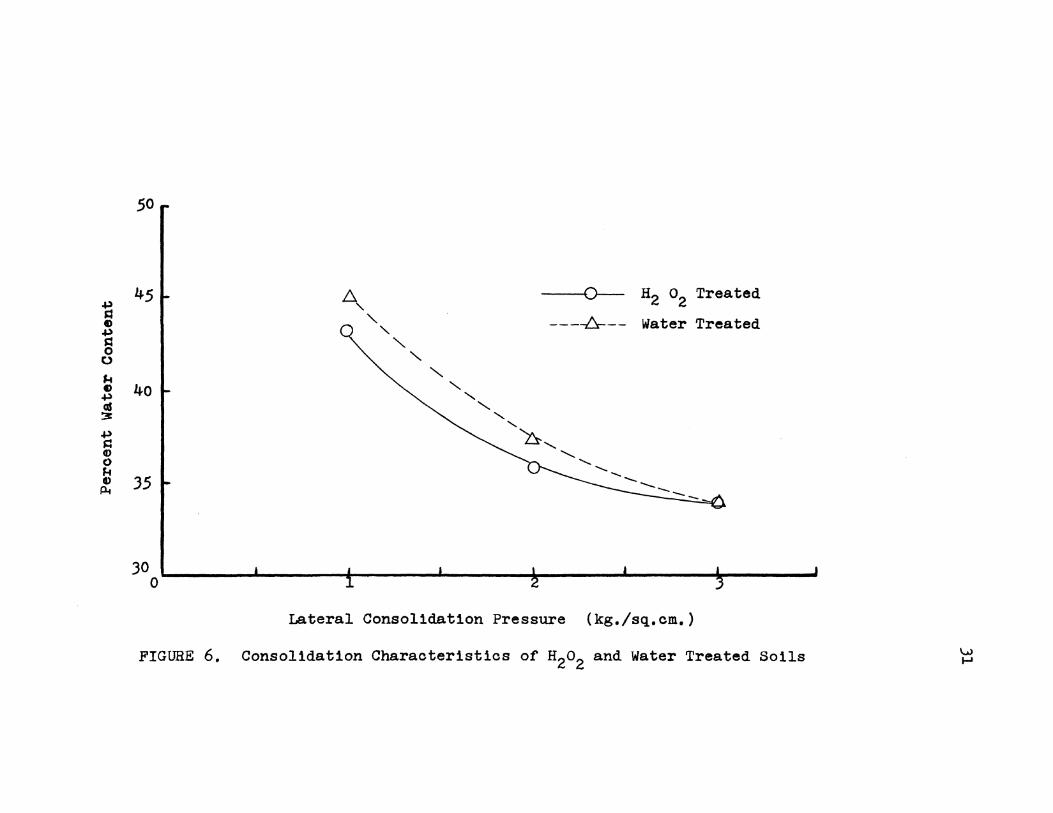
The deviator stress versus strain plots ~or
all six triaxial tests are compared in figure 5. It
can be seen that for each consolidation pressure, the
curves very nearly coincide. However, the undrained
strength of the H2o2 treated soil appears to be slightly
greater, with the largest dif~erence exhibited for
samples consolidated at the lowest hydrostatic stress.
This slight difference is explained by a plot of the
water content after consolidation versus the consolida-
tion pressure (Fig. 6). It is evident that at the same
consolidation pressure, slightly more water is expelled
from the soil treated with H2o2 than the soLl treated
with H2o. It is an accepted concept in the field of
29

-.
4,..
a J .. C)
-
0 I
5
.
-
. Cflc = 0Jc = J
--- -
. 10 15 20
Percent Strain
Water Treated Soil
FIGURE 5. Deviator Stress Versus Strain Curves for Water Treated and H 0 Treated Soils.
2 2
30
.p s= ., .p ~ 0 0
J.t ., .p cd :3 .p
5:::1 CD C) J.t ., P4
50
45
40
35
JO 0
1:::.. ---()-- H2 o2 Treated '\.
"\. ----br--- Water Treated " "\..
"\.
" ' ' ' ' ' ~ ....... ...........
' -...... _ ---
Lateral Consolidation Pressure (kg./sq.cm.)
FIGURE 6. Consolidation Characteristics of H2o2 and Water Treated Soils w ......

Soil Mechanics that a decrease in the water content of
a particular soil increases the strength. A slightly
larger strength for the soil treated with H2o2 would
thus be expected.
The uniqueness of the water content versus
strength relationship is further illustrated by figure 7.
It can be seen that the data points from all of the tests
fall on the same line. Hence, the water content versus
strength relationship appears to exhibit no dependency
on whether the soil is treated with H2o2 or water.
Figure 8 is a semilogarithmic plot of the same data
plotted in figure 7.
2. Mohr Diagramss
It was found most convenient to express the
relationship between shear strength and effective stress
by plotting (al - oJ)/2 versus (al + aJ)/2 at failure,
i.e. the peak point of the Mohr failure circle. If a
and a are the y - axis intercept and the slope of the
angle, respectively, of a straight line drawn through
such points it can be shown that
sin ~· = tan a
and
c• = a/cos a
where C' = the effective cohesion intercept
and P' = the effective friction angle.
32

..., s:a • i 0 ,.. G .p
:1 .p s= G 0 ,.. G llc
so
0 H202 Treated
45~ ~ 6. Water Treated
40
35
30l I I I I I I 1
.5 1.0 1.5 2.0 2.5 3.0 3.5 Maximum Deviator Stress (kg./sq.cm.)
FIGURE 7. Water Content Versus Strength for Water Treated and H2o2 Treated Soils. \..) \..)
5
45f- ~ 0 H2o2 Treated Soil
.p 1:::.. Water Treated Soil R • .p
g 0
Jot • 40 .p CIS :. .p s:l • ()
Jot ., 35 ~
30 I , I I I I I I I t
1 I I 1
I - e e e !I I I I - lttlr!l I I
l,o 10 100
Maximum Deviator Stress (kg./sq,cm,)
FIGURE 8. Semllogarithmic Plot of Water Content Versus Strength 'vJ .f:"
:J.I','
)5
Figures 9 and 10 show that the effective friction
angles plotted according to the maximum deviator stress
failure criteria are essentially identical for the H2o2
and the water treated soil. The same statement can
be made about the effective friction angles as determined
using the maximum effective stress ratio railure criteria
(Figures 11 and 12).
A complete presentation of all the data from
the six triaxial tests is included in Appendix 2.
F. Discussion
The triaxial test results show that no significant
differences in stress-strain and shear strength properties
exist between the inorganic Bryce clay treated with water
and the same soil treated with H2o2• Only a slight
difference was seen to exist in the consolidation pro-
perties. Table 1 shows that the Atterberg limits of the
two materials are also very nearly the same. These re-
sults seem to verify the original contention by Schmidt
(1965) that the hydrogen peroxide does not react with
the clay mineral fraction of the soil being treated.
If this is true for an inorganic B horizon soil, then
it is probably also true for the organic A horizon soil
which lies immediately above it, because both materials
are likely to contain almost the same mineral constituents.
It appears safe to say, then, that treatment of the ~~' ~8ryoe A horizon organic ola;y with hydrogen peroxide
~ould-have no efteot on the soil mineral traction. The .._ .~,:_;

2.0
-. I 0 a a. = 21.8 0
• 1. 51 at a= o.o lD
' • J: -~~ 1\:)
',.., 1.0
10
.s
.5 2.0 2.5 3.0 3.5 ~1 + aJ (kg./sq.cm.)
2
FIGURE 9. Mohr Diagram ror H2o2 Treated Soil-Maximum Deviator Stress Failure Criteria. w ()'\

-• s 0 . .,.
2.0
• '1.5 • w ~ -
• '0 ("'\ r 'r-f 1.0
1'0
o.s
0
a.= 21.8°
a= 0.0
<h + a3
2
3.0 3.5
(kg./sq.cm.)
FIGURE 10. Mohr Diagram for Water Treated Soil-Maximum Deviator Stress Failure Criteria \....) --.)
2.0 -. s 0
I a. = 24.1° • o' .. ......... 1.5 t a= o.o • tO .w -
·~~ 1.0 1'0
.5
J.O 3.5 - + a > al ~kg./sq.cm.
2 FIGURE 11. Mohr Diagram for H2o2 Treated Soil-Maximum Stress Ratio Failure Criteria
I..JJ (X)

2.0
-• t:1 0 •
ot co 1.5
' • Jf -·~~r I 1. 0
It> r-f
.s
I I a. = 24.00
I a.= o.o
2.5 - + - ) 0'1 ~ (kg./sq.cm.
2
J.O 3.5
~ FIGURE 12. Mohr Diagram for Water Treated Soil-Maximum Effective Stress Ratio Failure Criteria ~

only consequence of such treatment would be the selective
removal of a major portion of the organic matter from
the soil. Hence, any differences in physical properties
found to exist between the A horizon soil and the same
soil treated to remove the organic matter must be due
to the effect of carbon content alone.
40

CHAPI'ER V
EFFECT OF STRAIN RATE ON SHEAR PROPERTIES
A. Objective
41
Rezvan (1969) discovered very definite shear strength
differences between an! horizon Bryce clay of 4.7% carbon
content and the same soil treated with hydrogen peroxide
to reduce the carbon content to 1.1%. His results showed
conclusively that the untreated (organic) soil displayed
a higher shear strength than that exhibited by the
treated (inorganic) soil. Rezvan observed, however, that
specimens of the treated soil, especially those consoli
dated anisotropically, failed at very low strains when
the maximum deviator stress was used as the failure
criteria. It was believed that recorded times to fail-
ure of as low as 0.5 hours may not have been sufficient
to allow pore pressures to equilibrate throughout the
clay specimen. Higher pore pressures are initially
generated in the failure zone (middle of the sample)
where the shear strains are maximum. A sufficient amount
of time must be allowed so that these pore pressures
can equalize throughout the sample by transfer of moisture.
Thus, pore pressure measurements, which were taken at
the bottom of the sample, may have been in error. Rezvan
recommended that a series of triaxial tests be performed
at a slower strain rate to investigate this possibility.
A series of triaxial tests have been performed on
specimens or the Br7ce cLay (treated and untreated samples)

42
at a substantially slower strain rate than that used by
Rezvan, It is the purpose o~ this chapter to study the
e~fects o~ the decrease i.n strain rate on the strength
behavior of the treated as well as the untreated Bryce
clay. This will be accomplished by comparing the stress
strain and strength behavior obtained using the slower
rate of strain to the stress-strain and strength
behavior demonstrated by Rezvan (1969).
B. Soil Description
The soil used ~or this investigation was the same
Bryce clay used by Rezvan (1969). The A horizon material
is a dark gray soil which was ~ound to have an organic
carbon content o~ 4.7%.
The material, which had been ground to pass the
#40 sieve, was divided into two portions. One portion
was treated with hydrogen peroxide to remove the organic
matter, and the other portion was le~t untreated. The
treatment method has been described in Section C of
Chapter III. The treated material will be hereina~ter
referred to as the inorganic soil, even though a small
amount of resistant organic matter remains in the soil.
The untreated material will be referred to as the organic
soil. A comparison of the physical properties of the
two materials is presented in Table II.

TABLE I;r
Physical Properties of A Horizon Bryce Clay ' -
Loam and H2o2 Treated Bryce Clay
Particle Size Distribution (~) Sand Silt Clay
Atterb·erg Limits Lw Pw P.I.
>.osmm 50-2 microns <2 microns (.%J (.%)
Untreated 17 47 36 60.3 40.0 20.3
Treated 15 36 49 44.2 23.0 21.2
Organic Carbon
(%)
4.7
1.1
Specific Gravity
2.57
2.66
.{:::" \....)

c. Sample Preparation
Samples were prepared for triaxial testing in the
manner described previously in Section E of Chapter III.
The workable soil-to-water mixture for the organic soil
was 140 grams of soil to 160 ml. of distilled water.
The proper ratio for the inorganic soil was 140 grams
of soil to 150 ml. of water.
44
Approximately seven days was required to consolidate
the organic soil samples in the sedimentation cylinders
(Fig. 1), whereas the inorganic soil required nine days
for consolidation. Inorganic soil specimens were found
to have a water content of about 4).5% when they were
extruded from the sedimentation cylinders. Reference
to Tablen shows that this water content is very near
the liquid limit of the treated soil. The inorganic
soil specimens were very soft and remolded to a liquid
consistency when pressed between the fingers. On the
other hand, organic •o1l specimens were relatively stiff
and retained most of their strength upon remolding. The
organic specimens had a water content of about 48%
(Lw • 60%) when they were extruded from the plexiglas&
cylinders.
D. Triaxial Tests
1. Consolidation&
All samples which were consolidated under isotropic
conditions in the triaxial cell were allowed to consoli
date for 24 hours. Whereas loading tor isotropic
45
consolidation was performed in one step, it was found
that this was not practical for the case of anisotropic
consolidation. To prevent sample failure due to excessive
vertical load, the specimens were loaded in increments
such that the ratio of vertical to horizontal consolida
tion pressures were always kept at 1.50. From S to 10
increments were used depending on the magnitude of con
solidation stress desired. A time period of about SO
hours was required to load inorganic soil samples, while
organic soil specimens could be loaded in about 10 hours.
All samples consolidated anisotropically were kept under
the consolidation pressure for 24 hours after the last
increment of load was applied,
2. Strain Ratea
Rezvan (1969) performed triaxial tests on the Bryce
clay using a deformation rate of about .054 inches per
hour, which was approximately 2% of the sample height
after consolidation per hour. He noted that several
samples of the treated soil, especially those consolidated
anisotropically, failed (according to the maximum deviator
stress failure criteria) in less than 0.5 hours. Bishop
and Henkel (1962) have recommended that a testing time
of 4 to 6 hours to failure be used for clay specimens
so that the pore pressures at failure can be measured
accurately. They have found that this amount of time
ts sutricient to allow pore pressures to equalize
throughout ·a ClaJ' auip!l.e. The Geonor Co. ot' Norway, in

their triaxial equipment manual, recommend that an axial
strain rate o~ 0.5% per hour be used when shearing clay
specimens which have been consolidated anisotropically.
In an effort to comply with these recommendations, a
deformation rate o~ .0063 inches per hour was incorpor
ated ~or this investigation. This de~ormation rate is
about 8 times slower than the rate used by Rezvan. If
treated soil samples are found to ~ail at the same
strains as those tested by Rezvan, this deformation rate
would produce times to failure o~ about 4 hours. It was
felt, however, that the decrease in strain rate would
probably increase the strains at failure so that even
greater times to failure would be obtained. The chosen
de~ormation rate represents an average axial strain rate
of approximately .25% per hour for samples consolidated
anisotropically and about .15% per hour for samples
consolidated isotropically. The total shearing time to
reach 20% strain, which is defined as failure i~ the
stresses have not yet peaked, ranged from 72 to 80 hours
for all samples tested.
3. Testing Programs
A minimum of 12 tests were scheduled ~or this in
vestigation. Six tests each were per~ormed on the
organic and the inorganic soils, respectively. For
46
each soil, three samples were consolidated isotropically
under pressures of 1, 2, and 3 kg./sq.om., and the remain
ing three were consolidated anisotropica11y w1th a vertical

to lateral pressure ratio or 1.5. The lateral consoli
dation pressures for the anisotropic tests were also
1, 2, and J kg./sq.cm. The above pressures are identical
to those used by Rezvan (1969). This was done so that
stress-strain curves as well as rriction angles could
be compared,
E. Test Results and Discussion
Table m contains a list of all the triaxial tests
perrormed ror this chapter. Each test has been assign
ed a symbol which consists of three characters. The
first character is the lateral consolidation pressure
47
in kg./sq,cm.J the second character represents the method
of consolidation (I= isotropic, A= anisotropic); the third
character describes the type of soil sample tested
(I= inorganic, 0= organic). For example, test JI-0 ~s
an organic (0) soil sample which was consolidated iso
tropically (I) at J kg./sq.cm. (J). Speciric tests will
be referred to by their particular symbols in many or
the graphs used in this chapter.
1. Typical Stress-Strain Behavior•
In figures 13 through 16, representative examples
of the stress-strain behavior of the organic and inor
ganic soils are presented. Efrective stress ratios,
deviator stresses, and pore pressures are plotted
versus percent strain for these typical tests.
These curves show that the undrained strength

48
TABLE III
Summary of Triaxial Tests
- OJc O'lc Test Soil Type (kg./sq.cm.) (kg./sq.cm.)
li-0 organic 1.0 1.0
2!-0 organic 2.0 2.0
JI-0 organic J.O ).0
lA-O organic 1.5 1.0
2A-O organic ).0 2.0
JA-0 organic 4.5 J.O
li-I inorganic 1.0 1.0
2!-I inorganic 2.0 2.0
JI-I inorganic J.O J.O
0.4A-I inorganic 0.6 o.4
lA-I inorganic 1..5 1.0
2A-I inorganic J.O 2.0
JA-I inorganic 4.5 J.O
-• a 4 s C)
• at fll
' . f:C .!lit - t:J:.l t) 3 4 t;
~ t; (I
fll 0 Ol C't t) ..... &: ~
(I
t) 2 til
~ C't ... jl.., -- - G --- ID
! --- ID -/
~ / --------/ ----fll / / C't ..... • 1 / / 0 • ,/ J-4 , .p ,'j til
~ I .p <d ..... p
0 5 10 15 t) 20 Q
Percent Strain
Deviator Stress
Erreotive Stress Ratio
Pore Pressure
PIGUBB lJ. Typical Stress-Strain CUrves ~or Test )I-I

50
-• a ()
4 5 •
at Cll
......... •
til .!14 - J 4
t,:l;l ., ~
~ t;
--- ct Cll -- ()
Cll ..,.....-' cT ., ... ~
.,........, ~ .... ct
/ ., 2 ; Cfl
~ / ----------------- ~ "' --P-.4 / ...... -- ct / 1111
'd / ,/"' ...... 1111
s::: Qf , / if 1/ Ill ,/ cT Ill 1
.... ., 1/ 2 0 F-4 .p 'I Cll 1 F-4 0 .p Qf ..... I>
5 ., 0 10 15 20 A
Percent Strain
Deviator Stress
Effective Stress Ratio
Pore Pressure
FIGURE 14. Typical Stress-Strain Curves for Test )A-I

-. s C) 4
J
2
1
---------------- ------------...-- ....,.,- ---------.,..,..---- -~-
,.,.,. -/ ~
/ ,/
I,/ f/ " II
~I
5 10 15
Percent Strain
Deviator Stress
Effective Stress Ratio
Pore Pressure
5
4
J
2
20
FIGURE 15. T7pica1 Stress-Strain Curves for Test JI-0
51

52
-. a 0
4 5 .
04 00
........ . w
..!sl - 3 4 t:r.l "11 ., "11
~ (t ()
r.o ---- cT r.o _.-- ----- ...... v -- < --~ ... - (t
............... Cf.l 2 _.,.......
3 I) ,....... .... cT ~ , 'i 0 / (t
Pot / ------------- Ol
/ --- Ol
! ---/ ----- ~ //,.., ...
cT Ol 1 1/ 2 ...... Ol f/ 0 ., ~ f
.1-) 1 0)
~ 0
.1-) cd .... I> 0 5 10 15 20 !
Percent Strain
Deviator Stress
Effective Stress Ratio
Pore Pressure
FIGURE 16. Typical Stress-Strain Curves for Test JA-0
(maximum deviator stress) of the organic soil is great
er than that of the inorganic soil at both states of con
solidation. The organic soil, however, appears to exhi
bit a lower modulus of deformation than that exhibited
by the inorganic soil. Hence, the organic soil would pro
bably display a greater bearing capacity and a larger im
mediate settlement than the inorganic soil under field
loading conditions.
For the inorganic soil, the maximum deviator stres
ses for samples consolidated anisotropically occur at
lower strains than for samples consolidated isotropical
ly. This behavior has been demonstrated for remolded
clays by several investigators, including Ladd (1965).
However, test results show that the organic soil does not
behave in this manner, strains to failure for both con
ditions of consolidation are practically the same. Also,
the failure strains for the organic soil are much higher
than those for the inorganic soil. For both states of
consolidation, the organic soil appears to exhibit a
strain-hardening effect with the application of increas
ing load.
For both soils, the maximum effective stress ratios
occur at high strains. For the organic soil, the maximum
effective stress ratios and the maximum deviator stresses
occur at approximately the same strain. For the inorganic
soil, the maximum effective stress ratios occur at high
er strains than do the maximum deviator stresses.
53

54
The test results also show that for the organic soil,
the pore pressure never exceeds the axial stress differ
ence during undrained shear, i.e. the A coefficient for
these tests is always less than 1.0. However, the pore
pressure actually exceeds the axial stress difference at
high strains for the inorganic soil, i.e. the A coef
ficient is greater than 1.0. This is believed to be due
to the breakdown of the structure in an inorganic soil
sample and a transfer of a major portion of the applied
stress to the pore water. For the organic soil, however,
the soil str¥cture continues to carryamajor portion
of the axial load, even at very high strains.
2. Effect of Strain Rate
The effect of strain rate on the shear strength of
the organic and inorganic soils was determined by com
paring data obtained by Rezvan (1969) to the data ob
tained in this investigation. For the particular tests
compared, the soils and testing procedures used in
this investigation are identical to those used by
Rezvan. The only difference is the deformation rate.
A deformation rate of .006J "/hr was incorporated for
this study while Rezvan sheared identical specimens at
a rate of .054 "/hr, over eight times faster.
Fi~es 17a and 17b demonstrate the influence of
strain rate on deviator stress versus strain curves.
Typical tests performed for this investigation are com
pared to the sauae testa perfo~d at a fas.ter rate of

-. a C) . o' C'1J
.......... .
4
J
--2
1
5
JI-0 ---------- --
10 Percent Strain
JI-I
15 20
55
------ Def. Rate= .054 "/hr (from Rezvan, 1969)
Def. Rate = .006J "/hr
FIGURE 17a. In£luenoe o~ Strain Rate on Deviator Stress Versus Strain CurTes

-• El () . ct OJ
........ • :: -
4
.3
2
1
-/ ./--I
II I' ,,
--
5
3A-O
------------
--- --------
JA-I
10
Percent Strain 15
56
Def. Rate = .054 "/hr (from Bezvan, 1969)
Def'. Rate = .006.3 "/hr
PIGUBE 17b. Influence ot Strain Bate on Deviator Stress Verau..Stra1n Curves
.· ':.(.

strain by Rezvan. It is evident that the decreased strain
rate reduces the magnitude o~ the deviator stresses ~or
the organic and inorganic soils at both states o~ con
solidation, For the inorganic soil {tests JI-I and JA-I),
the strain to ~ailure appears to increase with the de
creasing strain rate. For the organic soil, the strains
to ~ailure are not signi~icantly a~~ected, since they
are very high ~or both rates o~ de~ormation.
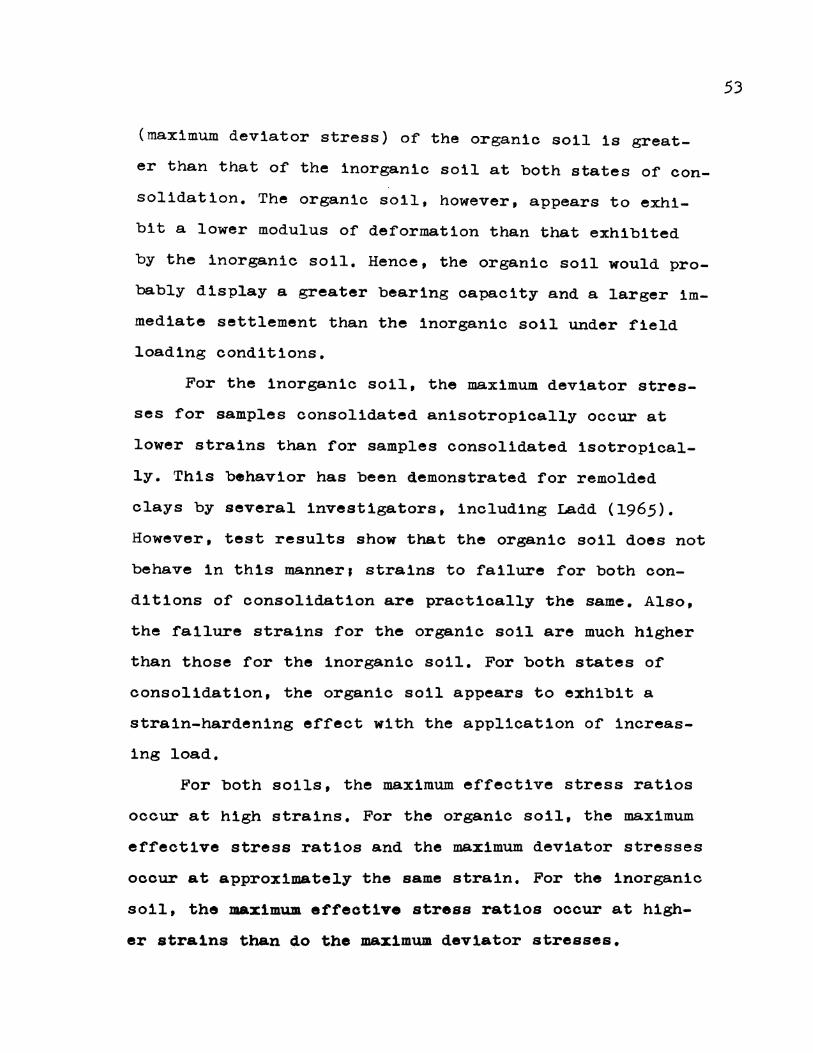
The pore pressure versus strain curves ~or the
same tests compared in figures l?a and 17b are compared
in ~igures 18a through 18c. For the inorganic soil, the
decrease in strain rate has almost no ef~ect on pore
pressure measurements. The curves plotted from data ob
tained by Rezvan very nearly coincide with the curves
plotted ~or tests per~ormed at the slower rate o~ strain.
This is true ~or both states o~ consolidation. For the
organic soil (tests JI-0 and 3A-O), the pore pressure
curves ~or tests performed at di~~ering rates o~ strain
57
do not coincide exactly. The dif~erences are small, how•ver,
and may be due to experimental error. In general, then,
it appears that the pore pressures are independent o~
the strain rate for both soils. Hence, the original hy
pothesis that the pore pressures may not have equilibrat
ed for several o~ the tests per~ormed by Rezvan can be
discarded.
Figures 19a and 19b present a summary o~ the in
fluence of defo~t16n'rate on the shear strength

-. a ()
• ct fll
......... . ~
.!:cl -C)
f:l fll fll ., &: ., ~
P-4
.58
4
3
31-I 2
.5 10 1.5 20
Percent Strain
·------ De:f. Rate = .0.54 "/hr (:from Rezvan, 1969)
De:f. Rate = .0063 "/hr
PIGUBE 18a. Influence o:f Strain Rate on Pore Pressure Veraua Strain Curves
-. s C) . o' Vl
......... . tO
,!It -G)
~ Vl Vl G)
&: G) F-t 0 ~
59
4
J
JI-0 2 -------------1
5 10 15 20
Percent Strain
-- ---- Der. Rate = .054 "/hr (from Rezvan, 1969)
Def. Rate = • 006J "/hr
PIGURE 18~. I.Zluenoe o~ Stra~ Bate on Pore Pressure Verau. Strain CUrves

-• a 0 •
o' fll
.......... • ~ -f)
~ fll fll f)
,t: f)
~ P..
4
J
2
1
60
.3A-I
---------)A-0
5 10 15 20
Percent Strain
Def. Rate = .054 "/hr (from Rezvan, 1969)
Def. Rate = • 0063 ••fhr
FIGURE 18&. Influence o~ Strain Bate on Pore Pressure Versus Strain Curves

61
Naximum Deviator Stress Failure Criteria
4
-. a (,) . J ot I'll
' . ti) ..!s:l ........ I M I
~ 2 I I I JI-I q - ? (""\
lb
I
r-1 fb ......... 1
. 601 .054 .1
2.0
JI-0
-. 1.5 a
(,)
• JA-I ot I'll
' . ti) ..!s:l ........ 1.0
Cf-4 ';::::)~
Rate of Deformation ("/hr)
PIGURE 19a. lnfluence of Deformation late on Shear Strength Parameters
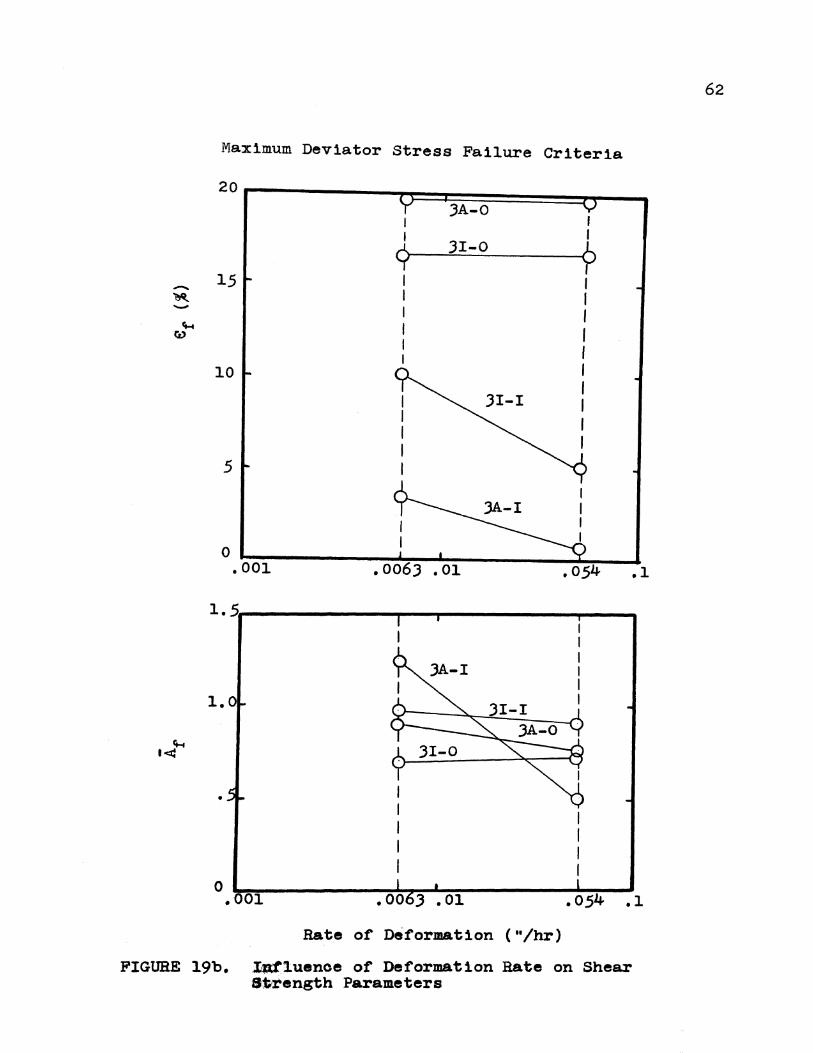
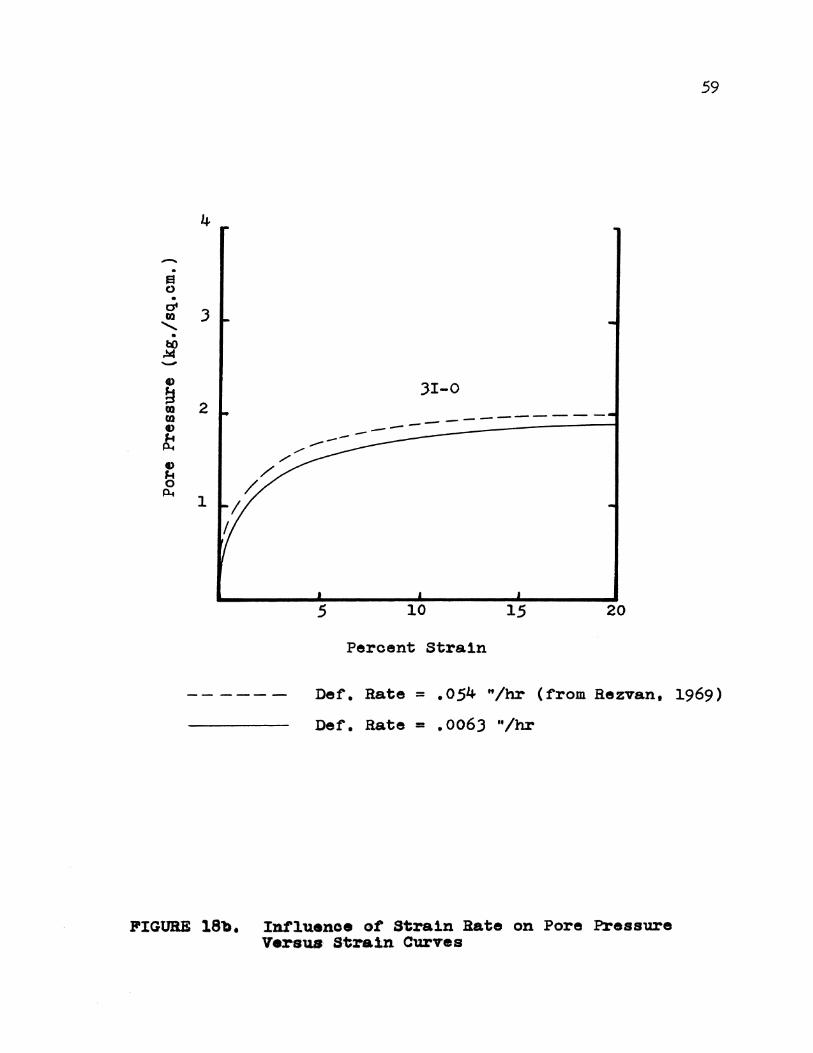
Maximum Deviator Stress Failure Criteria
20
JA-0 I I
I I
9 JI-0 ? - 15 I ~ I - I ct-.
I C".z)
I 10 I
I I I I
5
1.0
Rate of Deformation ("/hr)
FIGURE 19b. l~luence of Deformation Rate on Shear St·rength Parameters
62

parameters at failure (maximum deviator stress failure
criteria). The data points plotted are from the same typi
cal tests analyzed in figures 17 and 18. Figure 19a shows
that the maximum deviator stresses decrease with decreas
ing strain rate. This is true for both soils and both
methods of consolidation. For the organic soil at both
states of consolidation and the inorganic soil consoli
dated isotropically, the pore pressures at failure do
not change significantly with the differing strain rates.
For the inorganic soil consolidated anisotropically,
there is a significant increase in the pore pressure at
failure for tests performed at the slower strain rate.
Since it has been shown that the pore pressures are in
dependent of the strain rate, the variation in the pore
pressure at peak stress difference can occur only if the
strains at failure are a function of the strain rate.
Figure 19b shows that the strains at peak deviator
stress for the inorganic soil increase as the rate of
deformation decreases. For test 3A-I, the strain to
failure increases from 0.8% to 3.5% with the decreasing
strain rate. Reference to figure 18c shows that in this
range of strain, the pore pressures are still increas-
ing rapidly. This explains the large increase in the
pore pressure at failure for test 3A-I (Fig. 19a) and
the similarly large increase in the ! coefficient at
failure af) shown in figure l9b. For test JI-I, the
strain to ta1.J.ure increases from S to 10% w1 th the
63

decrease in strain rate (Fig. 19b). Within this range or
strain, the pore pressures begin to level ofr (Fig. 18a).
Thus, the pore pressure at railtire and the A coerricient
at railure increase only slightly with the decrease in
strain rate. For the organic soil (tests JI-0 and JA-0),
the strains at failure are very high and are not arfect
ed significantly by the decrease in strain rate. Hence,
the pore pressures at railure and the A coefficients at
failure are similarly unafrected.
Based on these test results, it appears that the
pore water pressure is not a runction or the strain
rate or the increment of stress during shear. The pore
pressure appears to be a function of the increment of
strain ror organic and inorganic soils. Olson (196J),
also found this to be true for artificially sedimented
specimens of sodium illite. Crawford (1959) demonstrat
ed essentially the same results when he tested undis
turbed samples of a very sensitive Leda clay.
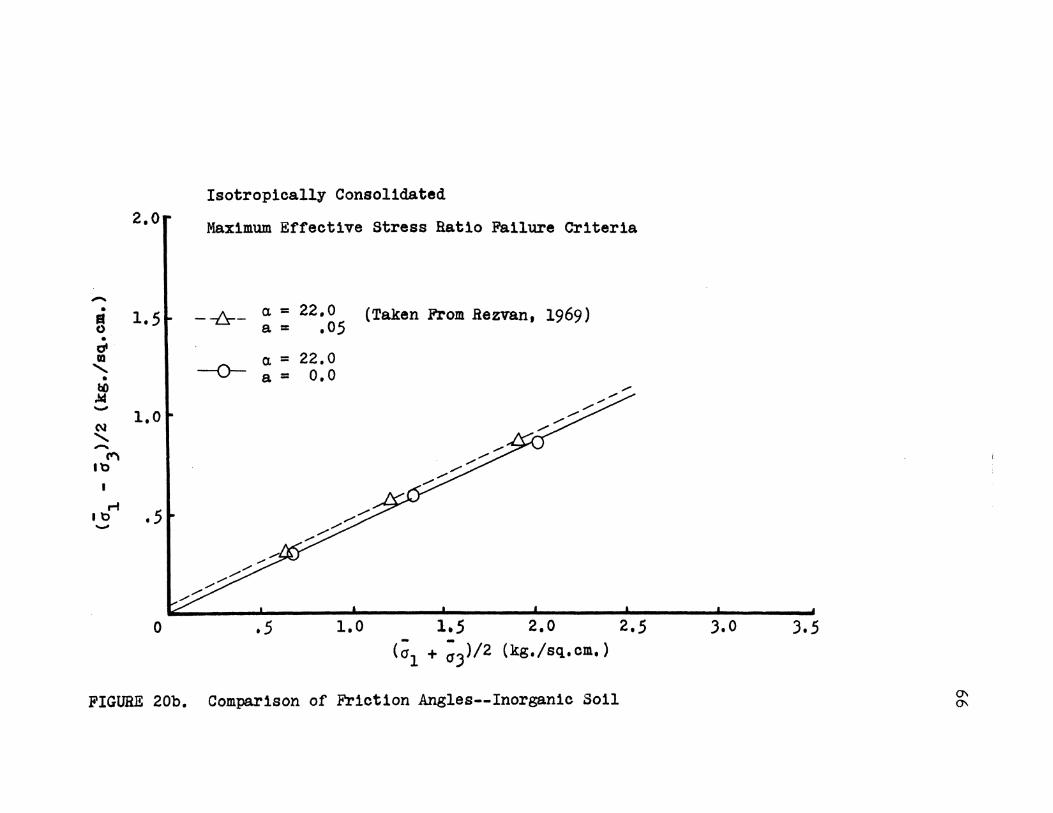
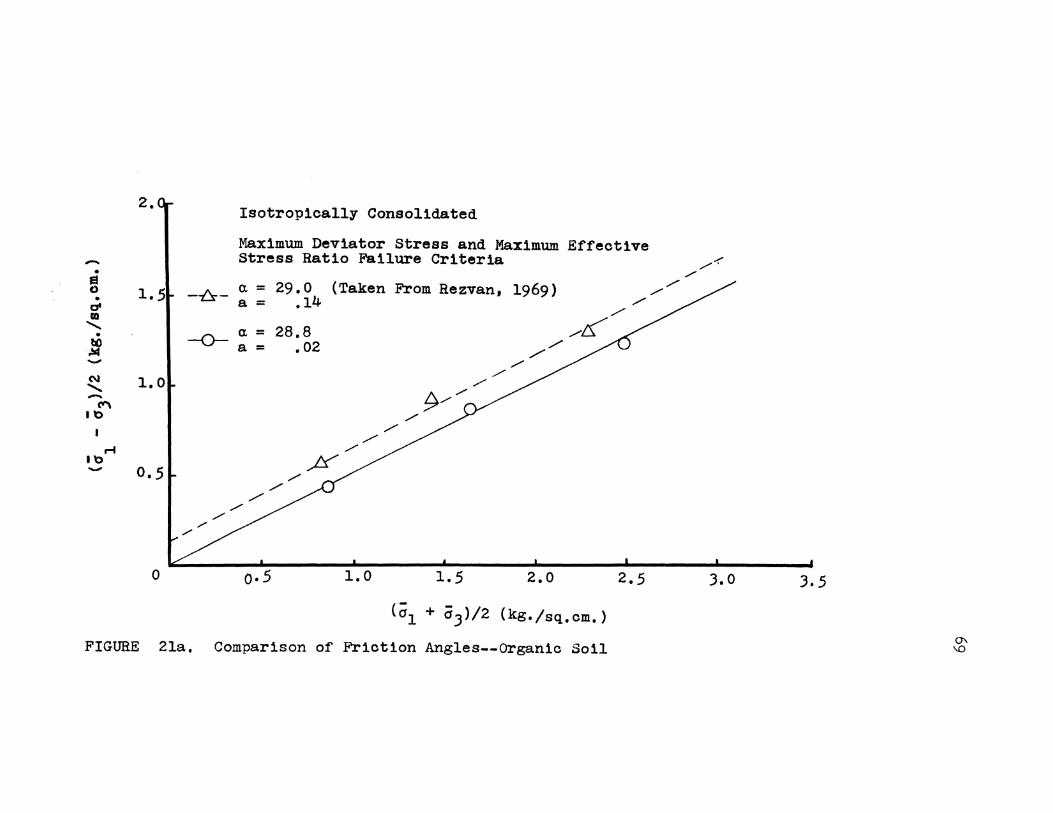
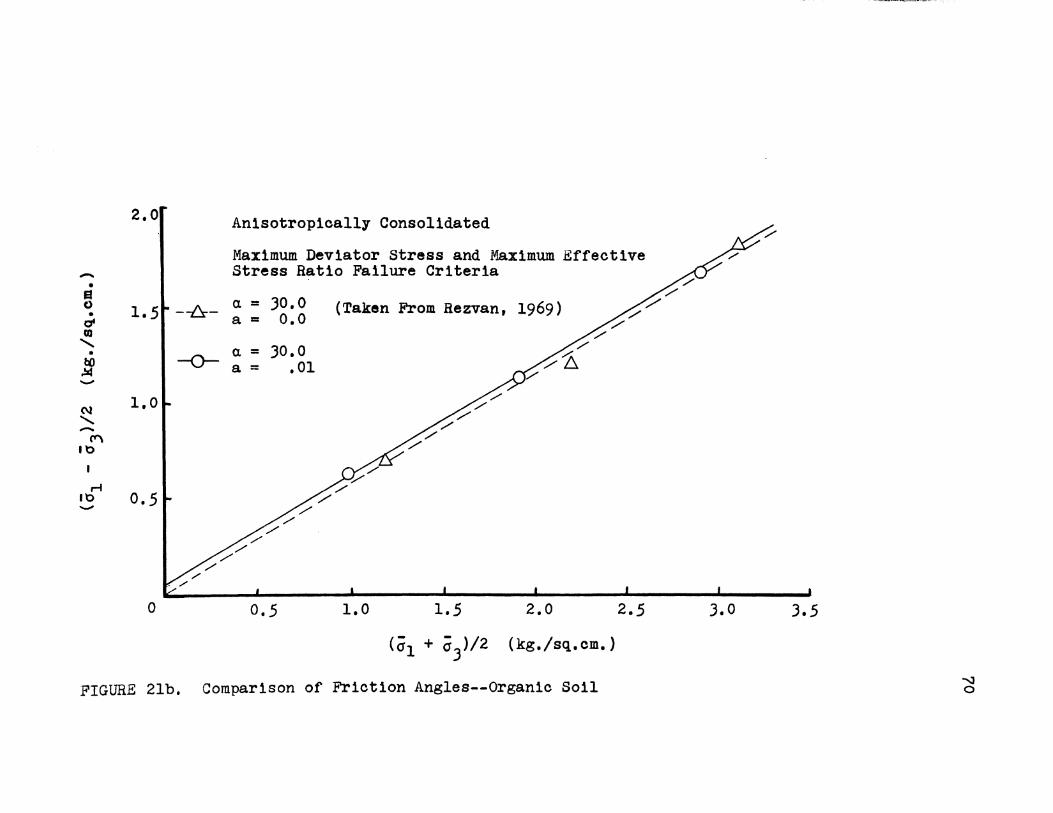
). Mohr Diagramsa
The influence of strain rate on the Mohr diagrams
is demonstrated in figures 20 and 21. The dashed lines
represent the best straight line fits through data
points taken from Rezvan (1969). The solid lines are the
best straight line fits for data points from this inves
tigation. It is evident that the effective stress con
solidated undrained.trict1on angles are generally not
atteoted by the de~r,ase in strain rate. The inorganic
64

Isotropically Consolidated
2.0 Maximum Deviator Stress Failure Criteria
-.. 1.5~ ---6---
a. = 22,0 I a= .05 (Taken From Rezvan; 1969}
• at ~ I -o- a.= 22,0
• a= o.o 110 ... -N 1,0 ....... -C""\ 10
I ,..,
IO .5 -
0 1.5 2,0
(al + a;)/2 (kg./sq,cm.)
FIGURE 20a. Comparison of Friction Angles--Inorganic Soil
2.5 ;.o 3.5
()'\
'-"
Isotropically Consolidated 2.0 Maximum Effective Stress Ratio Failure Criteria
-• 1.5~ - -f::s-- a. = 22,0 (Taken F.rom Rezvan, 1969) • 0 a= .os •
0'
I a. = 22.0 • ....... -o-- a= o.o • bO
.!14 - 1,0 C\1 ....... -C"\ ll)
I
.... .5 lb -
0 .5 1,0 1.5 2.0 2.5 Ca1 + ~3 )/2 (kg./sq,cm.)
FIGURE 20b. Comparison of Friction Angles--Inorganic Soil
),0 ).5
0\ 0\

Anisotropically Consolidated
2.0 Maximum Deviator Stress Failure Criteria
-• s ~ 1.5 at co
--t::s:- a. = 2 a. 6 a = .08
fl/ (Taken From Rezvan, 1969) ~ ,....- :::::--
' . 19 -~ 1,0 -("'\ lb
r-i tb - .5
0
-0- a. = 24.2 a = .08
?
1.0
/
..,...,. ..,...,.
.,.,.,,....--/
1.5
..-.,......,. ------ /:),.
2.0
(al + aJ)/2 (kg./sq,cm.)
..,...,.
FIGURE 20c. Comparison of Friction Angles--Inorganic Soil
..-..,...,. ..,...,. ..,...,. .,.,.,..-
~ ..-..-...-"
2.5 ).0 ).5
"' "'-.J

2.
-'l' = 1, •
o4 .. ....... • ~ -~ -('1'\
1'0
I
..... tb -
1.
• 5i
0
Anisotropically Consolidated
Maximum Effective Stress Ratio Failure Criteria
--t:r- a. = 28,85 (Taken From Rezvan, 1969) a= .o
-o- a. = 28.8 a= ,01
.5 1.0 1.5 2.0
(al + a3)/2 (kg./sq.cm.)
2.5
FIGURE 20d. Comparison of Friction Angles--Inorganic Soil
3.0 3.5
~ (l)
-• s 0 •
a' fD
........... . ~ -(\J
........... -~ 1'0
I
r-4 1'0 -
2. Isotropically Consolidated
Maximum Deviator Stress and Maximum Effective Stress Ratio Failure Criteria /.-r
/
1. 51- --fr- 0. = 29.0 a= .14
(Taken From Bezvan, 1969) / /
/
/
-o- 0. = 28.8 a = .02
I 1.0
0.5 ~
0 0·5
/
/ /
1.0
!>----/ /
1.5
/ /
/ /
/
2.0
/~
(c1 + o3 )/2 (kg./sq.cm.)
2.5 3.0
FIGURE 2la. Comparison of Friction Angles--Organic Soil
3.5
~ '-0
-• El 0 •
gl CD ....... • ~ -C\1 ....... -"' 1\:)
r-f 1\:) -
2.0 Anisotropically Consolidated
Maximum Deviator Stress and Maximum Effective Stress Ratio Failure Criteria
1.5t --fr- ~ : Jg:g (Taken From Rezvan, 1969)
1.0
0.5
0
I -o- a = JO.O
a = .01
0.5 1.0 1.5 2.0 2.5
(ol + oJ)/2 (kg./sq.cm.)
FIGURE 2lb. Comparison of Friction Angles--Organic Soil
J.O J.S
____ . .....,,_.;.. __ ·-·--··
.....;J 0

TABLE IV
Comparison of Values of p• and c• Inorganic Soil
.(<11-<iJ>max <a1la3>max
.054 "/hr ,0063 "/hr ,054 "/hr
li' c• li' c• P' C'
isotropic 23.8 .06 23.8 o.o 23.8 .06
anisotropic 23.8
isotropic
anisotropic
.08 26.6 0,01 33.0 ,06
o.rpn10 Soil
<al-a3>max and <al/a3>max
.054 "/hr ,0063 "/hr
p' c•
33.6 .17
35.3 o.o
p'
33.4
35.3
C'
.02
.01
-- 1_0063 "/hr
P' C'
23.8 o.o 33.0 ,01
-..:1 f-1
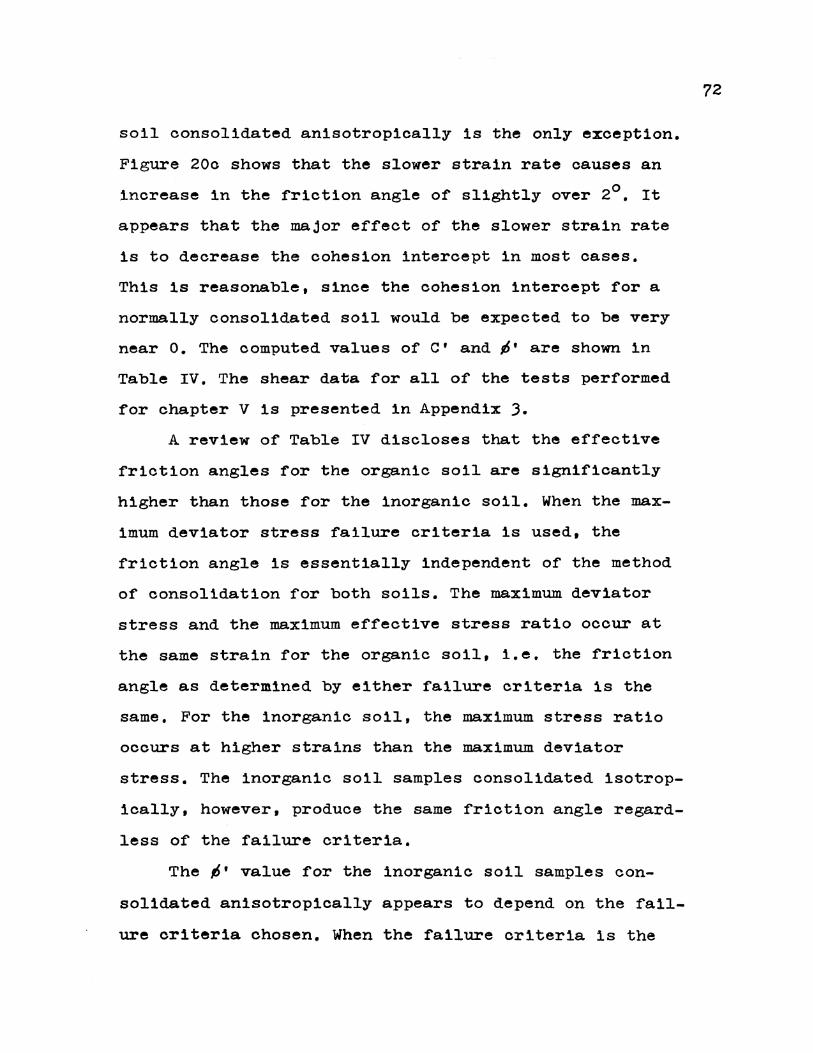
soil consolidated anisotropically is the only exception.
Figure 20c shows that the slower strain rate causes an
increase in the friction angle of slightly over 2°. It
appears that the major effect of the slower strain rate
is to decrease the cohesion intercept in most cases.
This is reasonable, since the cohesion intercept for a
normally consolidated soil would be expected to be very
near 0. The computed values of C' and p' are shown in
Table IV. The shear data for all of the tests performed
for chapter V is presented in Appendix J.
A review of Table IV discloses that the effective
friction angles for the organic soil are significantly
higher than those for the inorganic soil. When the max
imum deviator stress failure criteria is used, the
friction angle is essentially independent of the method
of consolidation for both soils. The maximum deviator
stress and the maximum effective stress ratio occur at
the same strain for the organic soil, i.e. the friction
angle as determined by either failure criteria is the
same. For the inorganic soil, the maximum stress ratio
occurs at higher strains than the maximum deviator
stress. The inorganic soil samples consolidated isotrop
ically, however, produce the same friction angle regard
less of the failure criteria.
The p• value for the inorganic soil samples con
solidated anisotropically appears to depend on the fail
ure criteria chosen. When the failure criteria is the
72

maximum e:r:rective stress ratio, the p' value is signifi
cantly higher than the p' value determined using the
maximum deviator stress failure criteria. In fact, the
effective friction angle :for the anistropically consoli
dated inorganic soil is very nearly equal to the p'
values determined for the organic soil. It is evident
that the criterion of failure selected is critical for
the anistropically consolidated inorganic soil. Since
the maximum stress ratio occurs at much higher strains
than the maximum deviator stress for the inorganic soil,
the p' value for anistropically consolidated samples ap
pears to be directly related to the strain at failure.
4. Water Contents:
Figure 22 presents the relationships between the
percent water content and the average consolidation
pressure for the organic and inorganic soils. The re
lationship is independent of the method of consolidation,
i.e. data points for anisotropic and isotropic consoli
dation fall on the same line for both soils. It is also
seen that at the same consolidation pressure, the organ
ic soil holds more water than the inorganic soil.
Figure 23 shows the relationship between the per
cent water content and the maximum deviator stress. The
organic soil displays a significantly higher strength
73
even though it exists at a higher water content and void
ratio than the inorganic soil. The strength-water content
relationship is independent of the method of consolidation

45 I
Organic
\ Inorganic
I
~ 40 ., ·.P
s:l 0
0
k 3 35 i ~ ., 0 k ., p.. 30
25 I f t I I I I I I I I I I I f I I I I I e I I e e I t! I I
.1 1.0 10 100
Average Consolidation Pressure (kg./sq.om.)
FIGURE 22. Water Content Versus Consolidation Pressure--organic and Inorganic Soils ...., ~

45
I organic
I ·~ 40
Inorganic ., I ..., s:l 0 t)
Fi t)
~ 35 :;a
~ G)
0 ... t) p..
30
anisotropic
25 I I I I I I I I I I I I I I I I I I I , ' I , I I I I I I I
.1 1.0 10 100
Maximum Deviator Stress (kg./sq,cm,)
FIGURE 23. Water Content Versus rmx. Deviator Stress--organic and Inorganic Soils 'l \J\

~or the organic soil. For the inorganic soil, however,
the samples consolidated anisotropically yield a higher
strength than those consolidated isotropically. Henkel
and Sowa (1963) ~ound the same behavior ror a remolded
Weald clay. Rowe, in his discussion o~ the paper by
Henkel and Sowa, attributed the behavior to the ~act that
anistropic consolidation was perrormed incrementally
over a period o~ several days while isotropic consoli
dation was per~ormed in one step and in much less time.
He postulated that more time was given ror secondary
consolidation to occur ror samples consolidated anisotro
pically. He stated that the resulting di~ference in
structure between the isotropieally and anisotropically
consolidated samples probably cau•ed the latter to
yield a greater strength.
The same conclusions can apply to this investiga
tion. Anistropic consolidation o~ inorganic soil speci
mens was perrormed incrementally over a period or J
days, whereas isotropic consolidation was perrormed in
one day. The time period required ~or anisotropic con
solidation or organic soil samples was only about 5 to
10 hours longer than that required ror isotropic con
solidation. The greater dir~erence in time or consoli
dation ~or the inorganic soil samples may have created
a structural di~~erence which caused the anisotropically
consolidated samples to give higher strengths. This
structural dirference might also.be a contributing
76

factor in regards to the increased effective friction
angle for the anisotropically consolidated inorganic
soil cited in subsection 3.
5. organic BondSI
It has been shown that the organic soil is consis
tently stronger than the inorganic soil at all levels
of strain. This behavior must be due to some action by
the organic matter, which creates a more resistant
structure for the organic soil.
Although both soils were remolded at a high water
content, it is believed that the clay particles are
probably oriented in a semi-random configuration when
the specimens are extruded from the plexiglass cylinders.
During the shearing process, the inorganic soil exhibits
high strengths at low strains and a loss of strength at
higher strains. The high pore pressures at high strains
indicate that the sem~flooculated structure probably
breaks down during shear and that a more dispersed
structure is developed. The organic soil exhibits high
er strengths than the inorganic soil at low strains
and continues to increase in strength even at high
strains. This behavior, coupled with the observed low
pore pressures, indicates that not only is the struc
ture of the organic soil stronger at low strains but it
continues to resist complete breakdown even at high
strains.
The foregoing observations might be explained by
77

considering the behavior of the organic matter in the
soil-water system and its relationship to interparticle
bonding. The organic matter probably envelops clay part
icles causing a much more viscous condition at inter
particle contact zones than would exist for the inorgan
ic soil. A physical bond may be created which retards
the movement of one particle over another when a soil
sample is subjected to shear stresses. This viscous
bond exists in addition to the normal physico-chemical
bonds that exist between the soil minerals. The more
flocculated condition created by the viscous bonds at
a certain level of normal load thus causes the organic
soil to have a higher strength than the inorganic soil.
The continually increasing strength even at high
strains might be explained if it is postulated that
the organic bonds are very adhesive but are very com
pressible at the same time. It is possible that the
semi-flocculated structure of the organic soil is
never broken down completely. Thus mineral to mineral
or double layer to double layer chemical bonds may
continue to develop because the organo-mineral parti
cles remain in contact in an edge to face or corner
to face arrangement, This would not be true for the
inorganic soil since the particles are probably well
oriented with respect to each other at higher strains.
78

CHAPTER VI
CONCLUSIONS
The following conclusions were drawn from this in
vestigation.
The treatment of the Bryce clay with hydrogen
peroxide has no effect on the soil mineral fraction. The
sole effect of the hydrogen perox~de treatment on the
Bryce ~horizon soil is the selective removal of a
major portion or the organic matter.
Within the range or deformation rates studied, the
pore pressures are independent or the strain rate. The
pore pressure appears to be a function or the increment
of strain during shear for the organic and inorganic
soils.
The increased strength or an organic soil as com
pared to the same soil treated to remove the organic
matter has been shown. The higher strength or the
organic soil is thought to be due to a physical bond
ing action or the organic matter, which causes an in
creased resistance to structural breakdown.
A unique relationship exists. between the water con
tent and the undrained strength for the organic soil
regardless of the state of consolidation. The inorgan
ic soil presents two separate relationships for the
isotropic and anisotropic states of consolidation.
This is thought to be due to the structural differences
resulting from the much longer time required to con-
79
80
solidate inorganic soil samples anisotropically.

CHAPTER VII
RECOMMENDATIONS FOR FUTURE RESEARCH
A. Anisotropic Consolidation
It was ~ound that samples consolidated anisotro
pically ~or a long period o~ time exhibited higher
strengths than samples consolidated isotropically ~or
a shorter period o~ time. This was thought to be due
to secondary consolidation e~~ects on the anisotropi
cally consolidated samples. The e~~ect on structure o~
the time o~ consolidation and the method o~ consoli
dation could be studied by per~orming shear tests on
samples consolidated isotropically and anisotropically
~or di~~erent periods of time.
B. Sample Preparation
Samples were made ~or this study by remolding the
soil at a high water content and then consolidating
the slurry in a sedimentation tube. The method o~
sample preparation probably has a signi~icant e~~ect
on the structural characteristics o~ a specimen. It
seems that di~~erent methods o~ soil sedimentation
with varying diameters o~ plexiglass cylinders could
be studied to determine the effect of sample prepar
ation techniques on soil structure. The small diameter
sedimentation cylinders used in this study may affect
the structure of clay specimens by impeding particle
movement at the contact between the slurry and the
81
inside of the cylinder. Larger diameter tubes might be
incorporated to determine the effect of the diameter
of the cylinder on structure.
C, Structure of Organic and Inorganic Soils
The hypothesis that the organic soil has a dif
ferent structure than the inorganic soil might be
verified. It might be possible to take electron mic
roscope pictures of the particle orientation exhibited
in samples of the organic and the inorganic soil. This
could be done for samples at different stages of de
rormation, such as immediately after extrusion from
the plexiglass cylinders, after consolidation in the
triaxial cell, and after the specimen has been shear
ed in the triaxial cell.
82
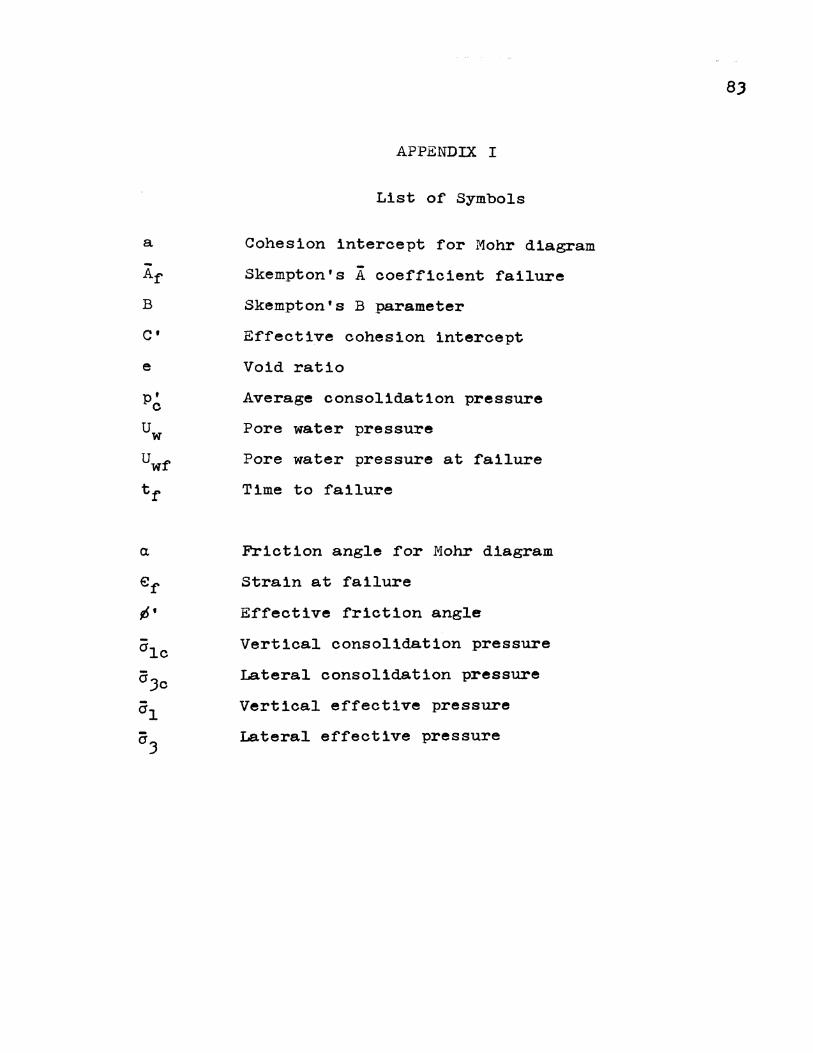
a
-Af
B
C'
e
a.
APPENDIX I
List of Symbols
Cohesion intercept for Mohr diagram
Skempton's A coerficient failure
Skempton's B parameter
Effective cohesion intercept
Void ratio
Average consolidation pressure
Pore water pressure
Pore water pressure at railure
Time to railure
Friction angle ror Mohr diagram
Strain at failure
Erfective friction angle
Vertical consolidation pressure
Lateral consolidation pressure
Vertical effective pressure
Lateral effective pressure
8J
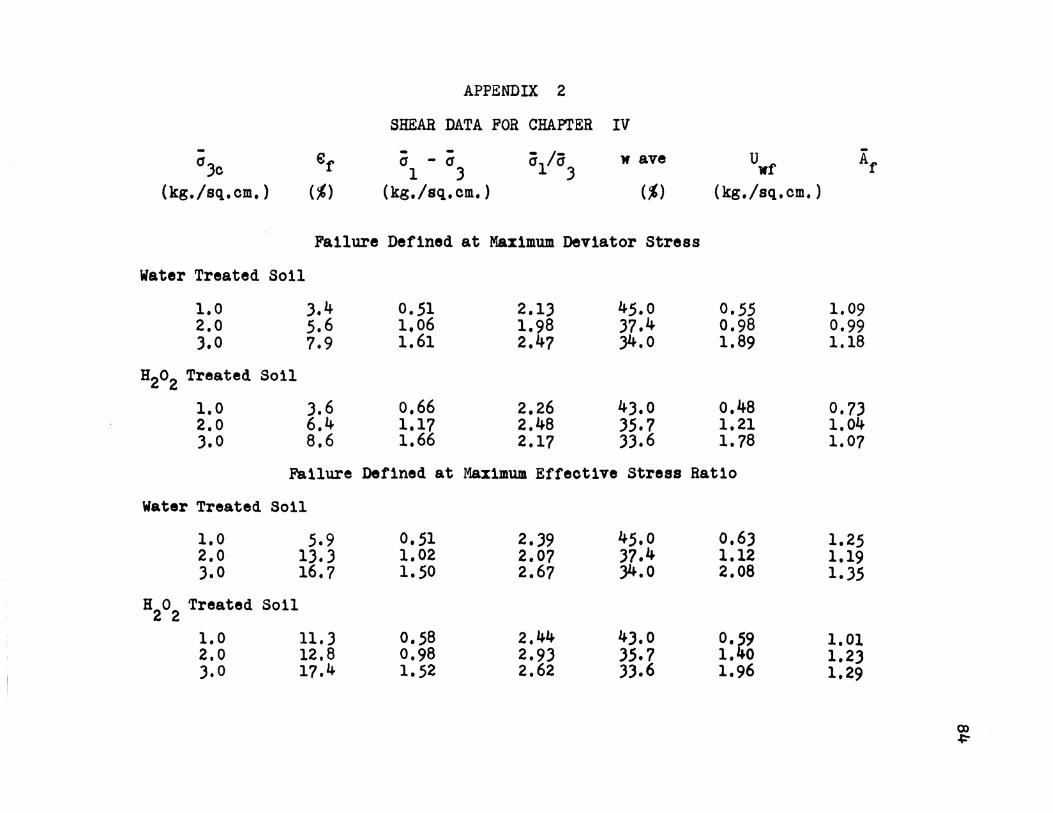
APPENDIX 2
SHEAR DATA FOR CHAPTER IV
- ef - - alla3 uwf 0'3c 0' - 0' w ave 1 3
(kg./sq.cm.) (%) (kg./sq.cm.) (%) (kg./sq,cm.)
Failure Defined at Maximum Deviator Stress
Water Treated Soil
1.0 3.4 0.51 2.13 45.0 0.55 2.0 5.6 1.06 1.98 :n.4 0.98 3.0 7.9 1.61 2.47 )4.0 1.89
H2o2 Treated Soil
1.0 3.6 0,66 2.26 43.0 0.48 2.0 6.4 1.17 2.48 35.7 1.21 3.0 8.6 1.66 2.17 33.6 1.78
Failure Defined at Maximum Effective Stress Ratio
Water Treated Soil
1.0 5.9 0,51 2.39 45.0 0.63 2.0 13.3 1.02 2.07 37.4 1.12 3.0 16.7 1.50 2.67 )4.0 2.08
H2o2 Treated Soil
1.0 11.3 o.58 2.44 43.0 0.~9 2.0 12.8 0.98 2.93 35.7 1. 0 3.0 17.4 1.52 2.62 3).6 1.96
Ar
1.09 0.99 1.18
0.73 1.04 1.07
1.25 1.19 1.35
1.01 1.2) 1.29
to .c::-

APPENDIX Ja
SHEAR DATA FOR CHAPTER V
Failure Defined at Maximum Effect1ve Stress Ratio
- - ; 1;;3 -Teat tf €f (Jl - CJ; w ave e ave u Af wf
(hrs) (%) kg,/sq.cm. ( :') kg,/sq.cm.
11-0 71.0 15.9 0,89 ).04 40.7 1.05 0.56 0,64 21-0 7,.5 16.6 1.79 ).29 )5.8 0,92 1.22 0,68 31-0 7 .o 16.7 2.39 2.55 )).1 0.85 1.69 0.72
lA-O 70.5 17.8 1.29 4.)1 )8.5 0.99 0,61 0.77 2A-O 67.5 15.8 2.)2 ).89 )4.7 0,89 1.19 0,91 JA-0 75.0 19.9 ).)9 3.70 )1.8 0,82 1.74 0.92
11-I 50.0 11.9 0.59 1.95 )).2 0,88 0,61 0.97 21-I 69.0 17.3 1.20 2.60 29.0 0.77 1.2~ 1.04 )I-I 74.0 19.6 1.75 2.51 26.5 0.71 1.8 1.05
,4A-I 66.0 14.1 0,)8 4.)6 )8.2 1.02 0.29 1.56 lA-I 60.0 1).1 0.99 ),70 )1.3 0,8) 0,6) 1.27 2A-I 71.0 18.5 1.76 ).65 28.7 0.76 1,)4 1.76 )A-I 64.0 14.1 2.65 ).78 26,) 0,70 2.05 1. 79
co \1\
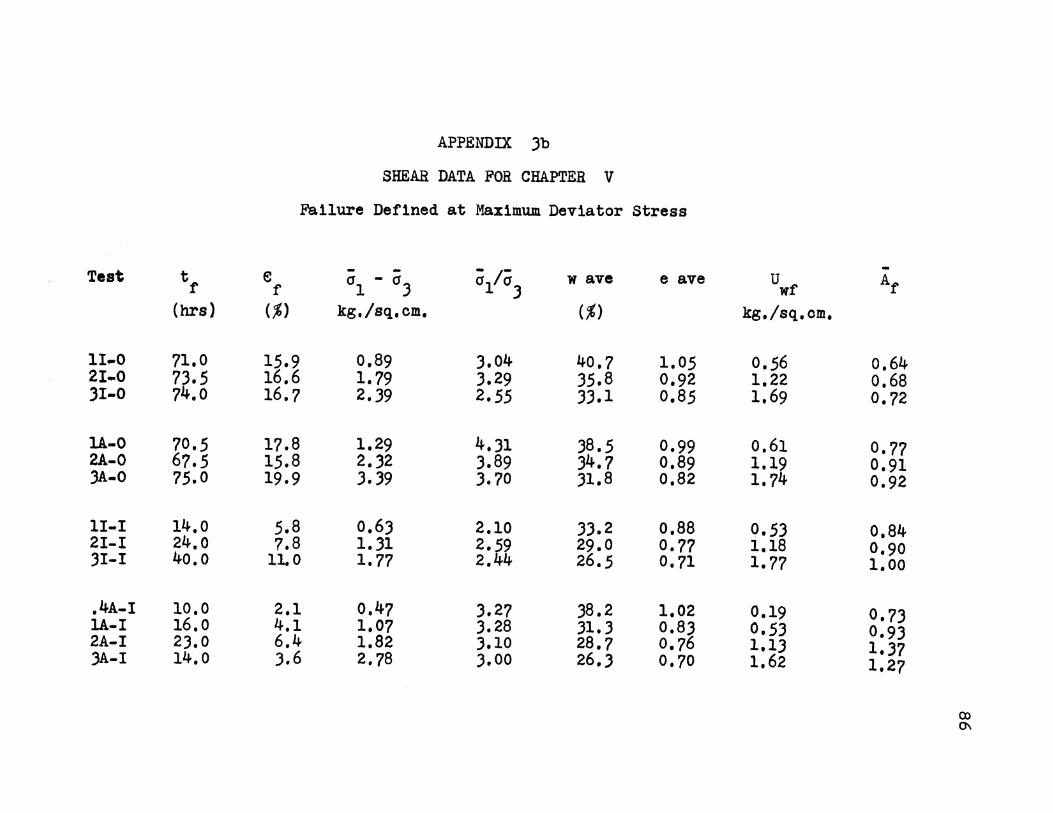
APPENDIX 3b
SHEAR DATA FOR CHAPTER V
Failure Defined at Maximum Deviator Stress
-Test tf e - - a11a3 uwf Af CJl - C13 w ave e ave f
(hrs) (,%) kg,/sq,cm. (,%) kg./sq.cm,
11 ... 0 71.0 15.9 0,89 3.04 40.7 1.05 0.56 0,64 2I-O 73.5 16.6 1.79 3.29 35.8 0.92 1.22 0.68 31-0 74.0 16.7 2.39 2.55 33.1 0,85 1.69 0.72
U-0 70.5 17.8 1.29 4.31 38.5 0.99 0,61 0.77 2A-O 67.5 15.8 2.32 3.89 34.7 0.89 1.19 0.91 JA-0 75.0 19.9 3.39 3.70 31.8 0.82 1.74 0.92
11-I 14.0 5.8 0.63 2.10 33.2 0.88 0.53 0.84 21-1 24.0 7.8 1.31 2.59 29.0 0.77 1.18 0,90 31-I 40.0 11.0 1.77 2.44 26.5 0.71 1.77 1.00
,4A-I 10,0 2.1 0.47 3.27 38.2 1,02 0.19 0.73 lA-1 16.0 4.1 1.07 3.28 31.3 0.83 0.53 0.93 2A-I 23.0 6.4 1.82 3.10 28.7 0,76 1.13 1.37 JA-I 14.0 3.6 2.78 3,00 26.3 0,70 1.62 1.27
(X)
0\
BIBLIOGRAPHY
Bishop, A. w. and Henkel, D. J., (1962), The Measurement of Soil Pro erties in the Triaxial Test, E ward Arnold Publisher D D., Second edition 1962.
Casagrande, A. and Wilson, s. E., (1951), "Effect of Rate of Loading on Strength of Clays and Shales at Constant Water Content", Geotetechnique, Vol. 2, No. J, pp. 251-26).
Crawford, c. B., (1959), "The Influence of Strain on Effective Stresses in Sensitive Clay", ASTM, STP, No. 254, pp. 36-47.
Green, W. J., (1969), "The Influence of Several Factors on the Rate of Secondary Compression of Soil." Master's Thesis, University of Missouri-Rolla.
Henkel, D. J., (1960), "The Shear Strength of Saturated Remolded Clays", ASCE Research Conference on Shear Strength of Cohesive Soils, Boulder, Colorado, pp. SJJ-554.
Henkel, D. J. and Sowa, V. A., "The Influence of Stress History on Stress Paths in Undrained Triaxial Tests on Clay", Laboratory Shear Testing of Soils, ASTM, STPr No. )61, pp. 286-291
Holtz, W. G., (1948), "The Use of the Maximum Principal Stress Ratio as the Failure Criterion in Evaluating Shear Tests on Earth Materials", ASTM Proceedings, Vol. 47, pp. 1067-1076.
Ladd, c. c., (1964), "Stress-Strain Modulus of Clay in Undrained Shear", Journal of The Soil Mechanics and Foundation Division, ASCE, Vol. 90, No. Sm 5, pp. lJJ-155.
Ladd, c. c., (1965}, "Stress-Strain Behavior of Anisotropically Consolidated Clays During Undrained Shear", Proc. 6th International Conferences on Soil Mechanics and Foundation Engineering, Vol. 1, pp. 282-286.
Lo, K. Y., (1969), "The Pore Pressure-Strain Relation-ship of Normally Consolidated Undisturbed Clays, Part I, Theoretical Considerations", C&pad1an Geotechnical Journal, Vol. 6, No. 4, pp. 383-394.
87

88
Lowe, J., III and Korafiath, L., (1960), "Effect of Anisotropic Consolidation on the Undrained Shear Strength of Compacted Clays: ASCE Research Conference on Shear Strength of Cohesive Soils, Boulder, Colorado, pp. 747-762.
Olson, R. E., Discussion on Effect of Nonuniform Pore Pressures, ASTM STP No. 361, pp. 185-189.
Rezvan, K., (1969), "The Influence of Organic Matter on Shear Strength of a Cohesive Soil", Master's Thesis, University of Missouri-Rolla.
Schmidt, N. o., (1965), "A Study of the Isolation of Organic Matter as a Variable Affecting Engineering Properties of a Soil", Ph.D. Thesis, University of Illinois, Department of Civil Engineering, Urbana, Illinois.
Schrotberger, D. L., (1966), "The Effect of organic Material on the Shear Strength of a Cohesive s·oil'', Unpublished report of National Science Foundation, University of Illinois.
Seed, H. B., Mitchell, J. K. and Chan, c. K., (1960), '"The Strength of Compacted Cohesi-ve Soils", Research Conference on the Shear Strength of Cohesive Soil, ASCE.
Skempton, A. W,, (1954), "The Pore-Pressure Coefficients A and B", Geotechnigue, Vol. 4, pp. 143-147.
Terzaghi, K., (1925), Erdbaumechanih auf Badenphysihalischer Grundlage, Deuticka, Wien, pp. 399.
Terzaghi, K. and Peck, R. B., (1968), Soil Mechanics in Engineering Practice, John Wiley & Sons, Inc., New York.
Wascher, H. L., Smith, R, s. and Odell, R. T., (1951), ''Iroquois County Soils", University of Illinois Agricultural Experiment Station, Soil Report 74.
Whitman,
Whitman,
', ' ~ ...
R. v., (1960), "Some Considerations and Data Regarding the Shear Strength of Clays", ASCE Research Conference on Shear Strength of Cohesive Soils, Boulder, Colorado, pp. 381-614.
R. v., Ladd, c. c. and Cruz, P. da, (1960), "Discussion, Session ), Shear Strength of Saturated, Remolded Clays", ASCE Research Conference on Shear Strength of Cohesive Soils, Boulder, Colorado, pp. 1049-1056.

VITA
David Eugene Daniels was born on October 12, 1946
in Springfield, Illinois, where he received his primary
and secondary education. He has received his college
education from Springfield Junior College in Springfield,
Illinois; the University of Illinois in Champaign,
Illinois; and the University of Missouri-Rolla in Rolla,
Missouri. He received a Bachelor of Science degree in
Civil Engineering from the University of Missouri-Bolla
in Rolla, Missouri in August, 1969. He is a member of
Tau Beta Pi and Chi Epsilon, National Honor Fraternities.
He has been enrolled in the Graduate School of the
University of Missouri-Rolla since September, 1969 and
has held the position of Teaching Assistant since that
time.
89