shear performance of existing prestressed concrete …
TRANSCRIPT

Un
ivers
ity o
f Flo
rid
a
C
ivil
an
d C
oast
al
En
gin
eeri
ng
University of Florida
Civil and Coastal Engineering
Final Report May 2009
SHEAR PERFORMANCE OF EXISTING PRESTRESSED CONCRETE BRIDGE GIRDERS Principal investigator:
H. R. Hamilton III Research assistants:
Gustavo Llanos Brandon E. Ross Department of Civil and Coastal Engineering University of Florida P.O. Box 116580 Gainesville, Florida 32611 Sponsor: Florida Department of Transportation (FDOT) Marcus H. Ansley, P.E. – Project Manager Contract: UF Project No. 00056470 FDOT Contract No. BD 545-56

DISCLAIMER The opinions, findings, and conclusions expressed in this publication are those of the
authors and not necessarily those of the State of Florida Department of Transportation.

iii
Technical Report Documentation Page 1. Report No.
BD 545-56 2. Government Accession No.
3. Recipient's Catalog No. 5. Report Date
May 2009 4. Title and Subtitle
Shear Performance of Existing Prestressed Concrete Bridge Girders
6. Performing Organization Code
7. Author(s) Gustavo Llanos, Brandon E. Ross, and H. R. Hamilton III
8. Performing Organization Report No. 00056470
10. Work Unit No. (TRAIS)
9. Performing Organization Name and Address University of Florida Department of Civil & Coastal Engineering P.O. Box 116580 Gainesville, FL 32611-6580
11. Contract or Grant No. BD 545-56
13. Type of Report and Period Covered Final Report
12. Sponsoring Agency Name and Address Florida Department of Transportation Research Management Center 605 Suwannee Street, MS 30 Tallahassee, FL 32301-8064 14. Sponsoring Agency Code
15. Supplementary Notes
16. Abstract This report presents the results of testing conducted on three types of concrete bridge girders: AASHTO Type IV, AASHTO Type
III, and circa 1950’s Post-Tensioned Girders. Testing generally focused on shear capacity and behavior under shear loading.
The AASHTO Type IV test girders were built to replicate existing girders that are in service in Florida. It was found that capacity
was not controlled by the typical shear failure mechanisms, but rather was due to the cracking and separation of the bottom bulb flange of the
girder. This was a result of the unusual debonding pattern that placed the fully bonded strands out in the bulb flange and the debonded
strands under the web. A CFRP fabric strengthening scheme was tested to mitigate issues associated with the strand debonding pattern.
The bonded CFRP reinforcement provided an increase in capacity of nine and 21 percent for shear span-to-depth (a/d) ratios of one and
three, respectively.
The AASHTO Type III test girders were salvaged from an existing bridge. Specimens were tested at a/d ratios ranging from one to
five. For a/d ratios of three or less, the failure mode was strand slip, which was precipitated by the formation of cracks in the strand
development length zone. While these cracks resulted in strand slip, transverse and longitudinal mild steel reinforcement at the girder end
were engaged, which improved the capacity and ductility beyond first strand slip.
Post-Tensioned test girders were constructed to replicate a circa 1950s bridge design. Unique features included presence of both
straight and parabolic PT bars, and lack of shear reinforcement away from the end block. The girder tested with a direct bearing on concrete
displayed a 7% larger capacity and nearly half the displacement capacity of the girder tested on neoprene.
17. Key Words prestressed concrete, shear, pretensioned, post-tensioned, bridge girder
18. Distribution Statement No restrictions. This document is available to the public through the National Technical Information Service, Springfield, VA, 22161
19. Security Classif. (of this report) Unclassified
20. Security Classif. (of this page) Unclassified
21. No. of Pages 148
22. Price
Form DOT F 1700.7 (8-72) Reproduction of completed page authorized

ACKNOWLEDGMENTS The authors would like to acknowledge and thank the Florida Department of
Transportation for funding this research project. In addition, the authors would like to thank,
David Allen, Frank Cobb, Steve Eudy, Tony Hobbs, Will Potter, Paul Tighe, and Chris Weigly,
of the FDOT Structures Research Center in Tallahassee for their assistance with the design,
fabrication, and testing of these girders. The authors would also like to thank Marc Ansley for
his technical input and support. The assistance of Adrian Lawrence and Sujatha Kalyanam in the
construction and testing of the Type IV girders is gratefully acknowledged.

v
EXECUTIVE SUMMARY This report presents the results of testing conducted on three types of concrete bridge
girders: AASHTO Type IV, AASHTO Type III, and circa 1950’s Post-Tensioned Girders.
Testing generally focused on shear capacity and behavior under shear loading.
The AASHTO Type IV test girders were built to replicate existing girders that are in
service in Florida. It was found that capacity was not controlled by the typical shear failure
mechanisms, but rather was due to the cracking and separation of the bottom bulb flange of the
girder. This was a result of the unusual debonding pattern that placed the fully bonded strands
out in the bulb flange and the debonded strands under the web. A CFRP fabric strengthening
scheme was tested to mitigate issues associated with the strand debonding pattern. The bonded
CFRP reinforcement provided an increase in capacity of nine and 21 percent for shear span-to-
depth (a/d) ratios of one and three, respectively.
The AASHTO Type III test girders were salvaged from an existing bridge. Specimens
were tested at a/d ratios ranging from one to five. For a/d ratios of three or less, the failure mode
was strand slip, which was precipitated by the formation of cracks in the strand development
length zone. While these cracks resulted in strand slip, transverse and longitudinal mild steel
reinforcement at the girder end were engaged, which improved the capacity and ductility beyond
first strand slip.
Post-Tensioned test girders were constructed to replicate a circa 1950s bridge design.
Unique features included presence of both straight and parabolic PT bars, and lack of shear
reinforcement away from the end block. The girder tested with a direct bearing on concrete
displayed a 7% larger capacity and nearly half the displacement capacity of the girder tested on
neoprene.

vi
TABLE OF CONTENTS EXECUTIVE SUMMARY .........................................................................................................................................v
1 INTRODUCTION..............................................................................................................................................1 1.1 OVERVIEW ..................................................................................................................................................1 1.2 OBJECTIVES AND APPROACH .......................................................................................................................1 1.3 REPORT ORGANIZATION..............................................................................................................................1
2 BACKGROUND ................................................................................................................................................2 3 NOMENCLATURE AND TEST DATA..........................................................................................................6 4 AASHTO TYPE IV GIRDERS.........................................................................................................................8
4.1 OBJECTIVES.................................................................................................................................................8 4.2 BACKGROUND .............................................................................................................................................8 4.3 APPROACH ................................................................................................................................................10 4.4 GIRDER DESIGN.........................................................................................................................................10 4.5 GIRDER CONSTRUCTION AND MATERIAL PROPERTIES ..............................................................................11 4.6 CFRP REPAIR............................................................................................................................................13 4.7 TEST SETUP AND PROCEDURES .................................................................................................................17 4.8 RESULTS AND DISCUSSION........................................................................................................................23 4.9 CALCULATED SHEAR CAPACITY ...............................................................................................................33 4.10 SUMMARY AND CONCLUSIONS..................................................................................................................34
5 AASHTO TYPE III GIRDERS ......................................................................................................................36 5.1 OBJECTIVES...............................................................................................................................................36 5.2 APPROACH ................................................................................................................................................36 5.3 BACKGROUND ...........................................................................................................................................36 5.4 GIRDER ACQUISITION AND CONDITION .....................................................................................................37 5.5 GIRDER DETAILS.......................................................................................................................................38 5.6 TEST SETUP AND PROCEDURES .................................................................................................................44 5.7 RESULTS AND DISCUSSION........................................................................................................................49 5.8 SUMMARY OF RESULTS .............................................................................................................................68 5.9 COMPARISON OF RESULTS WITH CALCULATED SHEAR CAPACITY ............................................................70 5.10 SUMMARY AND CONCLUSIONS..................................................................................................................72
6 POST-TENSIONED GIRDERS .....................................................................................................................74 6.1 OBJECTIVE ................................................................................................................................................74 6.2 APPROACH ................................................................................................................................................74 6.3 BACKGROUND ...........................................................................................................................................74 6.4 GIRDER DESIGN.........................................................................................................................................75 6.5 GIRDER CONSTRUCTION............................................................................................................................77 6.6 PRESTRESSING...........................................................................................................................................82 6.7 MATERIAL PROPERTIES.............................................................................................................................91 6.8 TEST SETUP AND PROCEDURES .................................................................................................................91 6.9 RESULTS AND DISCUSSION – SHEAR TESTS...............................................................................................95 6.10 EFFECT OF SUPPORT CONDITIONS ON BEHAVIOR ....................................................................................102 6.11 STRUT AND TIE ANALYSIS - C3U2 ..........................................................................................................107 6.12 COMPARISON WITH THEORETICAL CAPACITIES.......................................................................................109 6.13 SUMMARY AND CONCLUSIONS................................................................................................................111
7 OVERVIEW OF MAJOR FINDINGS ........................................................................................................113 7.1 TYPE IV GIRDERS....................................................................................................................................113 7.2 TYPE III GIRDERS....................................................................................................................................115

vii
7.3 PT GIRDERS ............................................................................................................................................118 8 REFERENCES...............................................................................................................................................120 APPENDIX A – TEST DATA - AASHTO TYPE IV GIRDERS ........................................................................122 APPENDIX B – TEST DATA – AASHTO TYPE III GIRDERS .......................................................................133

viii
LIST OF FIGURES FIGURE 1 – STRENGTH OF CONCRETE BEAMS WITH SHORT SHEAR SPANS. (COLLINS AND MITCHELL
(1991))..................................................................................................................................... 2 FIGURE 2 – GIRDER NOMENCLATURE............................................................................................... 6 FIGURE 3 – PUSH-OFF TEST. ............................................................................................................. 9 FIGURE 4 – GIRDER CROSS SECTION AND STRAND DETAILS............................................................ 10 FIGURE 5 – STIRRUP SIZE AND CONFIGURATION............................................................................. 11 FIGURE 6 – REINFORCEMENT AND PRESTRESSING PLACEMENT ...................................................... 12 FIGURE 7 – PRESTRESS TRANSFER AND GIRDER READY FOR SHIPPING............................................ 12 FIGURE 8 – CFRP REPAIR CONFIGURATION.................................................................................... 14 FIGURE 9 – CFRP INSTALLATION: (A) EASING CORNERS WITH GRINDER (B) PATCHING VOIDS (C)
CUTTING FABRIC. ................................................................................................................... 16 FIGURE 10 – FINISHED CFRP REPAIR............................................................................................. 16 FIGURE 11 – PULL-OFF TEST LOCATIONS........................................................................................ 17 FIGURE 12 – SHEAR TEST SETUP AND INSTRUMENTATION.............................................................. 18 FIGURE 13 – STRANDS INSTRUMENTED WITH LVDT’S. SOLID CIRCLES INDICATE INSTRUMENTED
STRANDS ................................................................................................................................ 19 FIGURE 14 – A2U1 STRAIN GAGE PLACEMENT............................................................................... 19 FIGURE 15 – A2S1 STRAIN GAGE SETUP......................................................................................... 20 FIGURE 16 – A1U3 STRAIN GAGE SETUP. ....................................................................................... 21 FIGURE 17 – A1S3 STRAIN GAGE SETUP......................................................................................... 22 FIGURE 18 – STIRRUP STRAIN GAGES FOR GIRDERS A1 AND A2. .................................................... 23 FIGURE 19 – A1U3 AND A1S3 LOAD VS. DISPLACEMENT............................................................... 24 FIGURE 20 – PRINCIPAL STRAINS FROM ROSETTES: (A) A1U3R8 AND (B) A1S3R4. (TENSION IS
POSITIVE) ............................................................................................................................... 24 FIGURE 21 – FIRST CRACK PATTERN FOR LOAD LOCATION A/D = 3 (A) A1U3 AND (B) A1S3. ........ 25 FIGURE 22 – FINAL CRACK PATTERN FOR LOAD LOCATION A/D = 3 (A) A1U3 AND (B) A1S3. ....... 26 FIGURE 23 – STRUT AND TIE MODEL FOR TENDON WITH (A) FULLY BONDED STRANDS AND (B) AN
EXCESSIVE NUMBER OF STRANDS DEBONDED UNDER THE WEB. ............................................. 27 FIGURE 24 – BULB CRACKING PATTERN CAUSED BY EXCESSIVE DEBONDING UNDER THE WEB. ..... 28 FIGURE 25 – CRACKING AT SUPPORT AND STRAND INSTRUMENTATION. ........................................ 28 FIGURE 26 – STRAND SLIP AND GIRDER DISPLACEMENT FOR (A) A1U3 AND (B) A1S3. ................. 29 FIGURE 27 – A2U1 AND A2S1 LOAD VS. DISPLACEMENT............................................................... 30 FIGURE 28 – STRAIN ROSETTES (A) A2U1R5 AND (B) A2S1R2. .................................................... 30 FIGURE 29 – FIRST CRACK PATTERN FOR LOAD LOCATION A/D = 1 (A) A2U1 AND (B) A2S1. ........ 31 FIGURE 30 – FINAL CRACK PATTERN FOR LOAD LOCATION A/D = 1 (A) A2U1 AND (B) A2S1. ....... 31 FIGURE 31 – STRAND SLIP AND LOAD DISPLACEMENT FOR (A) A2U1 AND (B) A2S1 ..................... 32 FIGURE 32 – DECK CUTTING OPERATION IN PREPARATION FOR GIRDER REMOVAL......................... 38 FIGURE 33 – REMOVAL OF TYPE III GIRDERS................................................................................. 38 FIGURE 34 – TRANSVERSE DECK SECTION PHOTOGRAPH AND SCHEMATIC. .................................... 39 FIGURE 35 – LONGITUDINAL DECK SECTION PHOTOGRAPH AND SCHEMATIC. ................................ 39 FIGURE 36 – TYPE III STIRRUP LAYOUT. ........................................................................................ 40 FIGURE 37 – TYPE III STRAND PROFILE. ......................................................................................... 41 FIGURE 38 – TYPE III END AND CENTERLINE CROSS SECTIONS. ...................................................... 41 FIGURE 39 – TYPE III DEBONDING PATTERN. ................................................................................. 41

ix
FIGURE 40 – B4S2 REPAIR LAYOUT. .............................................................................................. 43 FIGURE 41 – B4S2 REPAIR. ............................................................................................................ 43 FIGURE 42 – DETAILS OF REPAIR.................................................................................................... 43 FIGURE 43 – SHEAR TEST SETUP..................................................................................................... 44 FIGURE 44 – STRANDS INSTRUMENTED TO MEASURE SLIP ON TESTS (A) B1U1, B2U3, AND B4U4
(B) B1U4, B2U2, B3U5, AND B4S2. ..................................................................................... 45 FIGURE 45 – B1U1 STRAIN GAGE LAYOUT. .................................................................................... 45 FIGURE 46 – B2U2 STRAIN GAGE LAYOUT. .................................................................................... 46 FIGURE 47 – B4S2 STRAIN GAGE LAYOUT...................................................................................... 46 FIGURE 48 – B2U3 STRAIN GAGE LAYOUT. .................................................................................... 47 FIGURE 49 – B1U4 STRAIN GAGE LAYOUT. .................................................................................... 47 FIGURE 50 – B4U4 STRAIN GAGE LAYOUT. .................................................................................... 48 FIGURE 51 – B3U5 STRAIN GAGE LAYOUT. .................................................................................... 48 FIGURE 52 – SHEAR VS. DISPLACEMENT B1U1. ............................................................................. 49 FIGURE 53 – B1U1 FIRST AND FINAL CRACK PATTERN................................................................... 50 FIGURE 54 – STRAIN ROSETTE R9. ................................................................................................. 50 FIGURE 55 – B1U1 STRAND SLIP AND DISPLACEMENT. .................................................................. 51 FIGURE 56 – GIRDER B1U1 (A) PHOTO WITH THE PRIMARY CRACK ENHANCED AND (B) FREE BODY
DIAGRAM INCLUDING CONTRIBUTION OF VERTICAL AND HORIZONTAL REINFORCEMENT ....... 52 FIGURE 57 – LOAD VS. DISPLACEMENT B2U2................................................................................ 53 FIGURE 58 – B2U2 STRAIN ROSETTE PLOT R10.............................................................................. 53 FIGURE 59 – B2U2 STRAND SLIP AND DISPLACEMENT. .................................................................. 54 FIGURE 60 – FIRST AND FINAL CRACK PATTERN FOR B2U2. .......................................................... 54 FIGURE 61 - LOAD VS. DISPLACEMENT B4S2. ................................................................................ 55 FIGURE 62 – STRAIN ROSETTE PLOT R5. ........................................................................................ 56 FIGURE 63 – B4S2 STRAND SLIP AND DISPLACEMENT. ................................................................... 56 FIGURE 64 – FIRST AND FINAL CRACK PATTERN FOR B4S2. ........................................................... 57 FIGURE 65 – LOAD VS. DISPLACEMENT B2U3................................................................................ 58 FIGURE 66 – STRAIN ROSETTE PLOT R7. ........................................................................................ 58 FIGURE 67 – B2U3 STRAND SLIP AND DISPLACEMENT. .................................................................. 59 FIGURE 68 – FIRST AND FINAL CRACK PATTERN FOR B2U3. .......................................................... 59 FIGURE 69 – LOAD VS. DISPLACEMENT B1U4................................................................................ 60 FIGURE 70 – STRAIN ROSETTE PLOT R5. ........................................................................................ 61 FIGURE 71 – B1U4 STRAND SLIP AND DISPLACEMENT. .................................................................. 61 FIGURE 72 – B1U4 FAILURE (A) CRUSHED COMPRESSION ZONE AND (B) SEPARATION OF BOTTOM
BULB. ..................................................................................................................................... 62 FIGURE 73 – FIRST AND FINAL CRACK PATTERNS OF B1U4 (FLEXURAL CRACKS NOT SHOWN)....... 62 FIGURE 74 – LOAD VS. DISPLACEMENT B4U4................................................................................ 63 FIGURE 75 – STRAIN GAGES S12, S13, AND S14. ........................................................................... 64 FIGURE 76 – STRAIN GAGES S6, S7, AND S8. ................................................................................. 64 FIGURE 77 – B4U4 STRAND SLIP AND DISPLACEMENT. .................................................................. 65 FIGURE 78 – GIRDER B4U4 AFTER TESTING (A) SHEAR SPAN AND (B) LOAD POINT. ....................... 65 FIGURE 79 – FIRST AND FINAL CRACK PATTERN FOR B4U4. .......................................................... 66 FIGURE 80 – LOAD VS. DISPLACEMENT B3U5................................................................................ 66 FIGURE 81 – B3U5 STRAIN GAGE S3.............................................................................................. 67 FIGURE 82 – B3U5 STRAIN ROSETTE PLOT R8................................................................................ 67

x
FIGURE 83 – FIRST AND FINAL CRACK PATTERN FOR B3U5. .......................................................... 68 FIGURE 84 – B3U5 STRAND SLIP AND DISPLACEMENT. .................................................................. 68 FIGURE 85 – STM A/D=1 ............................................................................................................... 71 FIGURE 86 – STM A/D=2 ............................................................................................................... 71 FIGURE 87 – GIRDER ELEVATION ................................................................................................... 75 FIGURE 88 – CROSS SECTION AND POST-TENSIONING BARS DETAILS AT MIDSPAN (LEFT) AND END.76 FIGURE 89 – END BLOCK GEOMETRY, REINFORCEMENT, AND PT BAR CONFIGURATION................. 76 FIGURE 90 – DECK GEOMETRY AND REINFORCEMENT.................................................................... 77 FIGURE 91 – WELDED STEEL GIRDER FORMWORK.......................................................................... 77 FIGURE 92 – END BLOCK REINFORCEMENT CAGE. .......................................................................... 78 FIGURE 93 – END BLOCK REINFORCEMENT RESTING AGAINST A CHAIR.......................................... 78 FIGURE 94 – GALVANIZED STEEL DUCT, HDPE DUCT AT ANCHOR PLATE, AND HDPE GROUT
TUBES. ................................................................................................................................... 78 FIGURE 95 – BOTTOM ANCHORAGE INCLUDING ANCHOR PLATE, CONICAL NUTS, PT BAR, AND
GROUTING TUBES. .................................................................................................................. 79 FIGURE 96 – STRAIN GAGES LEADS EXITING DUCT. ........................................................................ 80 FIGURE 97 – U-BAR POSITIONING................................................................................................... 80 FIGURE 98 – GIRDER CONCRETE PLACEMENT................................................................................. 81 FIGURE 99 – GROUT INJECTION USING HAND PUMP. ....................................................................... 81 FIGURE 100 – DECK FORMWORK AND MILD STEEL REINFORCEMENT. ............................................ 82 FIGURE 101 – FINISHED GIRDER AND DECK.................................................................................... 82 FIGURE 102 – HYDRAULIC JACK USED TO STRESS PT BARS............................................................ 83 FIGURE 103 – PT BAR DESIGNATION FOR C GIRDERS. .................................................................... 83 FIGURE 104 – LOCATION OF GAGES FOR C GIRDERS....................................................................... 84 FIGURE 105 – PT BAR STRESS DURING POST-TENSIONING OF GIRDER C1. ...................................... 85 FIGURE 106 – PT BAR STRESS DURING POST-TENSIONING OF GIRDER C2. ...................................... 86 FIGURE 107 – MEASUREMENT OF ANCHORAGE SET, SHORT TERM CREEP, AND ELASTIC LOSS. ....... 87 FIGURE 108 – SUMMARY OF ANCHORAGE SETS.............................................................................. 88 FIGURE 109 – SUMMARY OF ELASTIC LOSSES................................................................................. 89 FIGURE 110 – TIME DEPENDENT STRAINS IN GIRDER C2. ............................................................... 90 FIGURE 111 – TEST SETUP AND INSTRUMENTATION FOR C GIRDERS. ............................................. 91 FIGURE 112 – SUPPORT CONDITIONS, C1U3 (LEFT) AND C2U3 (RIGHT)....................................... 92 FIGURE 113 – TEST C1U3 (A) SETUP (B) INSTRUMENTATION. ........................................................ 93 FIGURE 114 – TEST C2U3 (A) SETUP (B) INSTRUMENTATION. ........................................................ 94 FIGURE 115 – TEST C3U2 (A) SETUP (B) INSTRUMENTATION. ........................................................ 95 FIGURE 116 – SUPERIMPOSED SHEAR VS. DISPLACEMENT FOR C1U3............................................. 96 FIGURE 117 – C1U3S14 PLOT........................................................................................................ 97 FIGURE 118 – FIRST AND FINAL CRACK PATTERN FOR C1U3. ........................................................ 97 FIGURE 119 – SUPERIMPOSED SHEAR VS. DISPLACEMENT FOR C2U3............................................. 98 FIGURE 120 – C2U3S14 PLOT........................................................................................................ 99 FIGURE 121 – FIRST AND FINAL CRACK PATTERN FOR C2U3. ........................................................ 99 FIGURE 122 – SUPERIMPOSED SHEAR VS. DISPLACEMENT FOR C3U2........................................... 100 FIGURE 123 – FIRST AND FINAL CRACK PATTERN FOR C3U2. ...................................................... 100 FIGURE 124 – STRAIN GAGES S13, S14, AND S15. ....................................................................... 101 FIGURE 125 – FIRST CRACK AND CRACK OCCURRING AT 156 KIPS ............................................... 101 FIGURE 126 – CRACKS AROUND PT ANCHORAGE......................................................................... 102

xi
FIGURE 127 – SUPPORT CONDITION FOR C1U3. ........................................................................... 102 FIGURE 128 – SUPPORT CONDITION FOR C2U3. ........................................................................... 103 FIGURE 129 – COMPUTER MODEL OF GIRDER C AT AN A/D RATIO OF 3.0...................................... 103 FIGURE 130 – HORIZONTAL REACTIONS GENERATED BY THE VARYING SUPPORT CONDITIONS. ... 104 FIGURE 131 – DEFINITION OF TRANSVERSE SUPPORT DISPLACEMENTS ........................................ 104 FIGURE 132 – EFFECT OF SUPPORT RESTRAINT ON THE GIRDER CAPACITY. .................................. 104 FIGURE 133 – LOAD VS. DISPLACEMENT FOR C1U3 AND C2U3. .................................................. 106 FIGURE 134 – PLOT OF C1U3S14, C2U3S14, TOTAL BOTTOM DISPLACEMENT FOR C1U3 AND
C2U3. .................................................................................................................................. 106 FIGURE 135 – CHANGE IN STRAIN AS LOADING. ........................................................................... 108 FIGURE 136 – STRUT AND TIE MODEL. ......................................................................................... 109 FIGURE 137 – STRAIN GAGE PLOT FOR S5, S6, AND S18. ............................................................. 109 FIGURE 138 – FORCES IN STRUT-AND-TIE MODEL FOR SUPERIMPOSED LOAD (SELF-WEIGHT NOT
INCLUDED). .......................................................................................................................... 111 FIGURE 139 – STRUT AND TIE MODEL FOR TENDON WITH (A) FULLY BONDED STRANDS AND (B) AN
EXCESSIVE NUMBER OF STRANDS DEBONDED UNDER THE WEB. ........................................... 114 FIGURE 140 – BULB CRACKING PATTERN CAUSED BY EXCESSIVE DEBONDING UNDER THE WEB. . 115 FIGURE 141 – B1U1 STRAND SLIP AND DISPLACEMENT. .............................................................. 117 FIGURE 142 – GIRDER B1U1 (A) PHOTO WITH THE PRIMARY CRACK ENHANCED AND (B) FREE BODY
DIAGRAM INCLUDING CONTRIBUTION OF VERTICAL AND HORIZONTAL REINFORCEMENT ..... 117 FIGURE 143 – HORIZONTAL REACTIONS GENERATED BY THE VARYING SUPPORT CONDITIONS. ... 118 FIGURE 144 – LOAD VS. DISPLACEMENT FOR C1U3 AND C2U3. .................................................. 119 FIGURE 145 – CONCRETE COMPRESSIVE STRENGTH GAIN CURVE............................................... 122

xii
LIST OF TABLES TABLE 1 – LABELING OF TYPE III GIRDERS. ..................................................................................... 7 TABLE 2 – AVERAGE GIRDER CONCRETE COMPRESSIVE STRENGTH (PSI) AT INDICATED AGES........ 13 TABLE 3 – MANUFACTURER’S TEST DATA. .................................................................................... 14 TABLE 4 – TEST SETUP GEOMETRY................................................................................................. 18 TABLE 5 – ULTIMATE SHEAR CAPACITY......................................................................................... 33 TABLE 6 – COMPARISON OF EXPERIMENTAL CAPACITY WITH CALCULATED SHEAR CAPACITY....... 33 TABLE 7 – CONCRETE CORE TEST RESULTS FOR WEB. .................................................................... 42 TABLE 8 – CONCRETE CORE TEST RESULTS FOR DECK.................................................................... 42 TABLE 9 – STIRRUP TEST RESULTS. ................................................................................................ 42 TABLE 10 – STEEL STRAND STRENGTH AND MODULUS................................................................... 42 TABLE 11 – TEST SETUP GEOMETRY. ............................................................................................. 44 TABLE 12 – FAILURE MODES.......................................................................................................... 69 TABLE 13 – DISTANCE FROM END OF GIRDER TO CLOSEST CRACK. ................................................ 69 TABLE 14 – COMPARISON OF CALCULATED SHEAR CAPACITY WITH EXPERIMENTAL RESULTS. ...... 72 TABLE 15 – COMPARISON OF CALCULATED MOMENT CAPACITY WITH EXPERIMENTAL RESULTS. .. 72 TABLE 16 – CONSTRUCTION CHRONOLOGY. .................................................................................. 80 TABLE 17 – JACKING FORCE MEASURED WITH LOAD CELL. ............................................................ 84 TABLE 18 – WORKING P-GAGES FOR EACH C GIRDER. ................................................................... 84 TABLE 19 – MEASURED CHANGES IN STRESS DUE TO ANCHORAGE SET. ......................................... 87 TABLE 20 – MEASURED ANCHORAGE SET. ..................................................................................... 88 TABLE 21 – ELASTIC LOSSES FOR C GIRDERS. ................................................................................ 89 TABLE 22 – TIME-DEPENDENT LOSSES IN C2. ................................................................................ 90 TABLE 23 – AVERAGE CYLINDER STRENGTH (KSI). ........................................................................ 91 TABLE 24 – PT BAR MATERIAL PROPERTIES. .................................................................................. 91 TABLE 25 – COMPARISON OF CALCULATED SHEAR CAPACITY WITH EXPERIMENTAL RESULTS. .... 110 TABLE 26 – POST-TENSIONED GIRDER NOMINAL MOMENT CAPACITIES (KIP-FT).......................... 111 TABLE 27 – CONCRETE MIXTURE DESIGN..................................................................................... 122 TABLE 28 – CONCRETE PLASTIC PROPERTIES. .............................................................................. 122 TABLE 29 – MODULUS OF RUPTURE RESULTS 3 DAYS BEFORE FLEXURE TESTS. ........................... 123 TABLE 30 – STEEL STRENGTH AND MODULUS. ............................................................................. 123

BD 545-56 Page 1
1 INTRODUCTION
1.1 OVERVIEW Florida has a significant number of bridges with prestressed concrete girders as the
primary superstructure elements. This form of construction has been used for nearly 60 years.
Consequently, the design approach and construction style has varied over the years as codes have
changed and needs have changed.
1.2 OBJECTIVES AND APPROACH This research report covers load testing of bridge girders that have been used to construct
bridges in Florida. Some of the testing was conducted on girders that were recovered during
bridge demolition and others were constructed using the same design as girders that are currently
in service. The common element of the testing was to determine the capacity of the girders
under three-point bending. The shear span-to-depth ratio for the tests ranged from one to five
depending on the number of specimens and specific target behavior.
1.3 REPORT ORGANIZATION This report is divided into chapters that cover each of the three testing programs. In
addition, the background chapter covers the approach used to test the girders and the current
code provisions used to calculated the design capacity for these girders. Following the
background chapter is the nomenclature and the test data chapter. This chapter describes the
notation used to describe the instrumentation to aid in interpreting the data files. Data gathered
during each of the load tests will be available in electronic format in separate data files.
Next are the three primary chapters that each report on the respective testing. The first
covers the testing of two AASHTO Type IV girders to evaluate the effect of unconventional
debonding patterns used in the early 1980’s and a repair scheme used to improve the capacity.
The next chapter covers the testing of four AASHTO Type III girders that were constructed in
1979. These tests were conducted to evaluate the capacity of the girder and the effect of the light
shear reinforcement. Finally, three post-tensioned girders were constructed to replicate early
(circa 1950’s) post-tensioned concrete girders. They were tested with a/d of two and three. The
effects of different bearing conditions were also evaluated.

BD 545-56 Page 2
2 BACKGROUND
AASHTO Type III, Type IV pretensioned girders along with a custom post-tensioned
girder were tested in this research program. The primary focus was on short shear spans to
determine the shear behavior of the girders that had been used in FDOT bridges in service.
Three-point loading was chosen to ensure that majority of the failure modes were not flexural.
Brown et al. (2006) indicated that generally the shear strength of girders with uniform loads are
greater than when loaded with concentrated loads. Consequently, using a test configuration with
concentrated loads will ensure that the results are applicable for uniform load conditions.
Figure 1 shows that strut and tie action begins to dominate behavior as the shear span
ratio (a/d) drops below approximately 2.5. Above this mark, the plot indicates that a sectional
model controls. This is presumed to indicate that either shear or flexure will control the failure
mode. Although the exact point is dependent on the specific conditions of the testing and
specimen, this provides reasonable guidance on the selection of a shear span ratio for conducting
shear testing.
Figure 1 – Strength of concrete beams with short shear spans. (Collins and Mitchell (1991))

BD 545-56 Page 3
When a/d is less than about 2.5 in pretensioned concrete girders, the peak capacity is
typically marked by slipping of the prestressing strand at the end of the girder. This behavior has
been characterized as a type of flexural failure in which the distance from the support to the
critical section is less than the development length of the strand (Ramirez and Russell 2007). It
can also be modeled as a strut and tie in which the tie capacity (prestressing tendon) is limited by
the anchorage. In either case, the fundamental controlling issue is the anchorage of the
prestressing tendon and supplemental reinforcement provided in the end region. End blocks and
various end reinforcement schemes will marginally improve the capacity of a girder that is prone
to this failure mode.
The literature covering shear in concrete is expansive. The particular focus of each set of
tests in this research was slightly different depending on the objectives and was not particularly
focused on revising shear design provisions, but rather in evaluating the capacity of existing
bridge girders. Consequently, rather than providing an exhaustive treatise on the history of
research in shear of beams the reader is directed to a recent NCHRP report that focused on
simplifying the AASHTO provisions for shear (Hawkins et al. 2005). Further information
specific to shear provisions for prestressed concrete can be found in Avendano and Bayrak
(2008). The remainder of this chapter is devoted to a general background of methods currently
used to calculate the shear capacity of prestressed concrete girders.
This report compares the results obtained from load testing to ACI 318 Building Code
Requirements for Structural Concrete (2008), AASHTO LRFD Bridge Design Specifications
(2007). For the remainder of this report these provisions will be referred to as “ACI” and
“LRFD,” respectively.
ACI presents a section-based approach for calculating the design shear strength of
prestressed concrete girders. The contribution of the concrete and the steel reinforcement are
calculated independently, then added together to determine the total design strength. For
prestressed concrete, the concrete contribution is calculated using a single simplified equation, or
by using more detailed equations. The detailed method considers the strength of the concrete
against web cracking due to diagonal principal tensile stresses, and against flexural-shear
cracking due to combined moment and shear. The ACI detailed method was added to the LRFD
as an alternative method to MCFT and is referred to in AASHTO as the “simplified method”.
This method is also used in The AASHTO Standard Specifications for Highway Bridges, which

BD 545-56 Page 4
is sometimes still used for load rating existing bridges in Florida. The two primary equations for
calculating the resistance provided by the concrete are:
max
'6.0M
MVVdbfV creidpwcci ++= Eqn. 1
ppwpcccw VdbffV ++= )3.0'5.3( Eqn. 2
Where:
Vci = Nominal shear strength provided by concrete when diagonal cracking results from
combined shear and moment.
f’c = Specified compressive strength of concrete.
bw = Web width.
dp = Distance from extreme compression fiber to centroid of prestressing steel.
Vd = Shear force at section due to unfactored dead load.
Vi = Factored shear force at section due to externally applied loads occurring
simultaneously with Mmax.
Mcre = Moment causing flexural cracking at section due to externally applied loads.
Mmax= Maximum factor moment at section due to externally applied loads.
Vcw = Nominal shear strength provided by concrete when diagonal cracking results from
high principal tensile stress in web.
fpc = Resultant compressive stress at centroid of composite section due to both
prestress and moments resisted by non-composite section acting alone.
Vp = Vertical component of effective prestress force at section.
The shear design provisions in LRFD are based on the Modified Compression Field
Theory (MCFT). The basis of MCFT is the assumption that diagonal cracks form a series (or
field) of concrete compression struts in the web. The transverse tension in the struts is zero at
the cracks, but is nonzero between cracks. The net effect of the concrete tension, summed over
multiple cracks is the concrete contribution to the shear resistance. As part of the calculations
for the concrete contribution, LRFD gives equations for calculating the angle of the inclined
cracks. The primary equation, LRFD Equation 5.8.3.3-3, used to calculate the concrete
contribution to shear capacity by MCFT is:

BD 545-56 Page 5
vvcc dbfV '0316.0 β= Eqn. 3
where:
Vc = Nominal shear strength provided by concrete.
β = Factor indicating ability of diagonally cracked concrete to transmit tension and
shear as specified by AASHTO article 5.8.3.4
f’c = Specified compressive strength of concrete.
bv = Effective web width taken as the minimum web width within the depth dv.
dv = Effective shear depth as determined in AASHTO article 5.8.2.9.
Calculating β is an iterative process requiring the use of factors from LRFD. Results
from calculations using this method are denoted as “MCFT” through this report.
Several of the load tests in this research involved load points that are close to the
reaction. In these tests, sectional models are insufficient to capture the complexity of the stress
state. The flow of forces, however, can be reduced to series of struts and ties. Struts are
assumed to be regions of concrete that can safely transfer compressive load from node to node.
Likewise, ties carry tension and are assumed to occur in reinforcement that extend uninterrupted
from node to node. The transfer of forces can then be studied using statics and the truss formed
by the struts, ties, and nodes. Individual capacities of struts, ties, and nodes are checked to
ensure sufficient strength. LRFD was used to calculate the strut and tie capacity for tests with
short shear spans. Results from this method are denoted as “Strut and Tie”, or “STM”
throughout this report.

BD 545-56 Page 6
3 NOMENCLATURE AND TEST DATA
The data gathered during testing are available from the FDOT Research Office website in
comma delimited (.csv) format (http://www.dot.state.fl.us/Research-Center/). The data from
each test are included in a single electronic file that includes that particular test name in the
filename. The data in each file are arranged so that the readings from a single instrument occupy
one column. That instrument name is included in the column heading. Each row of data
represents a single data acquisition scan. The nomenclature used in the electronic files is the
same as that used in the following sections of this report (Figure 2).
_ _ _ _ _ _ _Girder
TestInstrumentation Label
Girder Number<Single Digit>
Approx. Shear Span toDepth Ratio. (a/d)
<Single Digit>
Gage Number Sequentially Numbered<One or Two Digits>
A - Type IVB - Type III
C - Post-Tensioned
S - StrengthenedU - Unstrengthened
L - LVDTM - Strain Gage on Mild SteelP - Strain Gage on Post-Tensioning BarT - Strain Gage on Steel TubeR - Strain Gage Rosette on Concrete or FRP S - Single Strain Gage on Concrete or FRP
Figure 2 – Girder nomenclature.
Some examples of nomenclature use are as follows:
1. C1 denotes specimen one of PT girders. 2. A2S2 denotes a strengthened Type IV girder with an a/d of approximately two. 3. B2U3L3 denotes LVDT number three on Type III unstrengthened girder two with an a/d
of approximately three. 4. C1U3R2_45 is a strain gage (within a rosette) that is oriented to read strain at a 45 deg
angle from the beam axis. The gage number is two and it was used on specimen one of the PT girders with an a/d ratio of approximately three.

BD 545-56 Page 7
Instrumentation layout for each test is located in the respective sections of the report and
can be used to cross-reference the data to the particular girder, test, orientation, and location for
which that instrument was used. Each strain gage rosette is an array of three individual strain
gages. The rosette gage numbers in the data files are followed by an underscore and the angle of
that particular gage relative to the beam axis.
The recovered Type III girders were delivered with labels that were used by the
demolition contractor during removal. Table 1 provides the cross reference between the names
used in this report and the original girder designation used by the contractor.
Table 1 – Labeling of Type III girders.
New Girder Designation
Original Girder Designation
1 3H 2 3L 3 1J 4 1H

BD 545-56 Page 8
4 AASHTO TYPE IV GIRDERS
4.1 OBJECTIVES The objective of this testing was to determine the behavior of AASHTO Type IV girders
constructed with excessive debonded strands and loaded in three-point bending. Furthermore,
carbon FRP (CFRP) composites were used to strengthen one end of each girder. Identical tests
were conducted on strengthened and unstrengthened ends of each girder to compare the
improvement in capacity and difference in behavior provided by the CFRP composites. Current
design methods were evaluated by comparison with the experimental results.
4.2 BACKGROUND Razaqpur and Isgor (2006) proposed a method for calculating the shear capacity of FRP-
reinforced concrete without stirrups. This method accounts for the contribution of plain concrete
and the contribution of the aggregate interlock mechanism. The method was compared to other
methods such as the Canadian Standards Association (CSA), American Concrete Institute (ACI),
a method proposed by Frosch and Tureyen, and the Japanese Society for Civil Engineers (JSCE).
Comparisons were made using experimental results in the literature for 63 beams. The average
standard deviation of the other methods ranged from 0.39 to 1.95 while the proposed method had
an average standard deviation of 0.27. Saenz and Pantelides (2005) administered push-off tests
with varying CFRP laminate wrap configurations (Figure 3). Experimental results found that the
CFRP does not begin to contribute capacity until the concrete shear capacity is reached. This
finding shows that the failure with these CFRP wraps has two stages, imposed shear stress is
controlled by concrete alone and then the CFRP begins to carry shear force by acting as a clamp
and an interlocking mechanism for the aggregate. The member can carry force until cohesive
concrete failure or bond failure between the CFRP laminate and concrete. The capacity of
specimens strengthened with CFRP increased by a factor of 1.32 to 3.25 for a CFRP
reinforcement ratio of 0.3-1.2%.

BD 545-56 Page 9
Figure 3 – Push-off test.
Khalifa and Nanni (2000) tested reinforced concrete (RC) beams with different
confirgurations of CFRP applied. A control beam without CFRP failed at an ultimate strength,
Vn, of 20 kips. The minimum shear capacity of the strengthened beams was 27 kips, showing
that CFRP provides the beam with additional capacity. Two of the five configurations were
continuous sheets in the form of U-wraps. In the first configuration, the ends of the wraps were
anchored into the side of the beam. The other configuration was unanchored. The anchored
specimen reached a peak Vn of 50 kips and failed due to flexure while the unanchored specimen
reached a peak Vn of 35 kips and failed due to the CFRP debonding. The results show that
anchoring the laminate the CFRP provides additional capacity, and can lead to a different failure
mode.

BD 545-56 Page 10
4.3 APPROACH Test girders were constructed to replicate existing Type IV girders that are in service in
Florida. These girders are of particular interest because they have a debonding pattern that is in
violation of the LRFD specification.
Two precast girders were constructed at Dura Stress in Leesburg, FL and shipped to the
FDOT Structures Laboratory in Tallahassee, FL for testing. One end of each girder was
strengthened using externally applied CFRP fabric. Both the strengthened and unstrengthened
ends were tested in three point bending. A shear span-to-depth (a/d) ratio of 1.5 was used for
testing one girder, and a ratio of three was used for testing the other girder. The effect of the
CFRP strengthening was evaluated by comparing results of the strengthened and unstrengthened
tests.
4.4 GIRDER DESIGN The original girders were designed to support an 8-in. thick bridge deck over a
approximately 100-ft. span. They were spaced at 9.25 ft. on center and prestressed with 9/16-in.
diameter strands. Testing restrictions dictated that the test girders be shortened to a length of 60-
ft. Furthermore, the lack of availability of 9/16-in. strand required that 0.6-in. diameter strand be
used. The design jacking force for 9/16-in. diameter strand was used during construction.
ASTM A416 Grade 270 strands were used in the pattern shown in Figure 4. The
debonding pattern matches that used in the original girders, which violates current LRFD
requirements. The shortened girder length required that four of the strands be debonded over the
entire length.
3"3" 10 S P @ 2"
3"3 S
P @
2"
1' - 8
"10
"1'
- 3"
S TR AN D LE G EN D FU LL Y BO N D ED D E B O N D ED 10.42 ft D E B O N D ED 6 .875 ft D E B O N D ED 4 .208 ft D E B O N D ED 0 .875 ft D E B O N D ED FO R E N T IR E B E A M
Figure 4 – Girder cross section and strand details.

BD 545-56 Page 11
Figure 5 shows the stirrups and end region reinforcement, in which ASTM – A615 Grade
60 epoxy coated reinforcement was used. The ends were densely reinforced with #6 and #5 bars.
The remainder of the girder was reinforced with #4 stirrups spaced at 6 inches on center. The
stirrups protruded from the top of the precast section to provide shear transfer between the girder
and the deck.
2" 3" 2" 4" 3" (4) #5 Z BARS (2)
#4 Z BARS11 SP @ 3"(2)
#6 Z BARs
3" 5" 6" 6" 6" 6" 6" 6" 6" 6" 51 SP @ 6" = 25' - 6"
(3) #6 K BARS (3) #5 K BARS (54) #4 K BARS
4 1/8
"11
"6"
6"6"
1' - 4
5/8
"4"
#5 L BARS
2 - STRANDS5000 LBS3/8" DIA. ORGREATER
Z BARS
K BARS
2' - 8"
2 15/16" CLR
4"
4' - 6
"
Strain Gage
1' - 1
0"4"
4"
8"
#5 @ 7"
#5 @ 5.75"
#4 typical
Figure 5 – Stirrup size and configuration.
4.5 GIRDER CONSTRUCTION AND MATERIAL PROPERTIES The Type IV test girders were constructed in the same stressing bed at Dura-Stress in
Leesburg, FL (Figure 6). Each girder required two batches of concrete. Girders were
consolidated both internally and externally. The top surface was intentionally roughened to
provide horizontal shear transfer between the girder and the topping slab. Prestress was
transferred after the required compressive strength (4500 psi) was reached. Girders were
transported to the FDOT Structures Laboratory for testing. The concrete cap was cast on each
girder at the FDOT structures laboratory using a commercial ready mix concrete with a specified
compressive strength of 4000 psi. The cap was allowed to cure for 28-days minimum before the
girders were tested.

BD 545-56 Page 12
Figure 6 – Reinforcement and prestressing placement
Figure 7 – Prestress transfer and girder ready for shipping.
Concrete properties were obtained from compression tests on 8-in. tall x 4-in. diameter
cylinders and from modulus of rupture (MOR) tests on 4-in. x 4-in. x 8-in. beam. Twenty
cylinders and two beams were made from the second batch of concrete, and were representative
of the first girder. Twenty additional cylinders and two additional beams were made from the
fourth batch of concrete, and were representative of the second girder.
Eight cylinders were tested for each girder to obtain the strength gain curve of the
concrete. For both mixtures, the coefficient of variation of the test results of was found to be

BD 545-56 Page 13
within the limiting percentage set by ASTM. Two cylinders were tested for each girder to
determine the release strength (Table 2). Three cylinders were tested for each girder to
determine the 28-day strength and compressive strength on the day the girders were tested. The
design 28-day compressive strength (f’c) was 5,500 psi. The compressive strength of the deck
was 6400 psi.
The remaining cylinders, as well as the MOR beams, were tested on the days coinciding
with the load tests of the girders. These test results, as well as the plastic properties of the
concrete, are located in Appendix A.
Table 2 – Average girder concrete compressive strength (psi) at indicated ages.
Girder Release 28-day Test Day A1 5340 6270 7220 A2 5430 6030 7180
Four samples of the prestressing strand were tested. The ultimate strength and modulus
of elasticity values are reported in the Appendix A. The data indicate that the strand complied
with the requirements of ASTM A416, with an average ultimate strength of 280 ksi and an
average ultimate elongation of 6.1%.
4.6 CFRP REPAIR The repair is composed of bi-directional 18.7 oz/sq yd carbon fabric bonded to the girder
as shown in Figure 8. The first layer of fabric has five 24-in. wide strips that wrap continuously
around the bottom of the girder and terminate at the underside of the deck on each side of the
girder. The top layer is composed of three longitudinal strips. Two of the strips are placed on
the top bulb and the third strip is wrapped around the bottom bulb. A commercially available
system was used for the repair. The manufacturer’s test data for the system are included in Table
3.

BD 545-56 Page 14
Figure 8 – CFRP repair configuration.
Table 3 – Manufacturer’s test data.

BD 545-56 Page 15
The installation procedure used to apply the CFRP was as follows:
1. Surface was sandblasted and then sharp corners were ground to facilitate bonding of
fabric (Figure 9a).
2. A system compatible paste epoxy was used to fill surface voids (Figure 9b). After
epoxy set, the sharp edges were sanded with 60 grit sandpaper.
3. Primer epoxy was trowel applied to concrete surface. This primer typically has a
higher viscosity than that of the saturant and is used for vertical or overhead
applications where additional tack is needed.
4. Plastic sheeting was placed on a large work surface. Fabric was cut and saturated
with epoxy on the plastic sheeting. Epoxy was worked into fabric with a roller. The
saturated fabric was then rolled onto a short length of PVC pipe.
5. While the primer was still tacky, the saturated fabric was unrolled onto the primed
surface.
6. A squeegee was then used to smooth the surface and remove air bubbles.
Figure 10 shows the finished CFRP repair. The CFRP installation for girder A1 was
conducted by a repair contractor. The installation for girder A2 was conducted by the FDOT
structures laboratory staff.
(a) (b)

BD 545-56 Page 16
(c)
Figure 9 – CFRP installation: (a) easing corners with grinder (b) patching voids (c) cutting fabric.
Figure 10 – Finished CFRP repair.
After load testing the girders, pull-off tension tests were conducted to determine the bond
capacity of the repair (Figure 11). Using a hole saw, a circular cut of approximately 2-in.

BD 545-56 Page 17
diameter was made through the CFRP and into the concrete. A disk was adhered to the circular
section of CFRP formed by the cut. After the adhesive had cured, the disk was pulled in direct
tension until failure. A valid test is one in which either the concrete fails (cohesive) or the CFRP
repair pulls off the surface (adhesive). Tests in which the adhesive bonding the disk to the
surface of the CFRP failed were considered invalid. For girder A1, the tensile capacity was 380
psi based on three valid results out of five tests. For girder A2, the tensile capacity was 425 psi
based on five valid tests out of five.
Figure 11 – Pull-off test locations.
4.7 TEST SETUP AND PROCEDURES Both ends of both girders were tested using a three point loading scheme with the
intention of causing shear failure. The load was transferred from the actuator to the deck through
a 1.5-in. thick x 10-in. x 20-in. (20-in. dimension perpendicular to the length of the girder)
reinforced neoprene bearing pad at a loading rate of 0.25 kips/second.
Linear Variable Displacement Transducers, LVDTs, were used to measure
displacements. Displacements were measured at each of the supports and at the load point. The
actual displacement was determined by subtracting the support settlement from the
displacements measured at the load point.
Each end of the girder was supported on a 1.5-in. thick x 9-in. x 24-in. (24-in. dimension
perpendicular to the length of the girder) reinforced neoprene bearing pad. A load cell was used
to measure load applied by the actuator (See Figure 12). Two different load points were used,
one at 7 ft 2 in. and the other at 15 ft. Table 4 and Figure 12 give specific distances for the
loading schemes.

BD 545-56 Page 18
LVDTs were also placed at the ends of the strands to measure strand slip. Figure 13
shows the strands that were instrumented.
Strain gages were placed on the stirrups based upon points of intersection of an assumed
crack at an angle of 35o originating at the support. Six 6-mm gages were adhered to the bars at
each end of the girders for a total of 24 strain gages. Figure 5 indicates the location of the strain
gages on the stirrups.
Sixty mm strain gages were used to measure strain in both single and rosette
arrangements. Gage and rosette layouts for tests A2U1 and A2S1 are shown in Figure 14 and
Figure 15, respectively. Gage and rosette for test A2U3 and A2S3 are shown in Figure 16 and
Figure 17, respectively. Strain gages were installed on stirrups at each end of each beam as
shown in Figure 18.
A7.5"
B
8"L11 L10 L9
Figure 12 – Shear test setup and instrumentation.
Table 4 – Test setup geometry.
Test-Girder A B A2U1 7’–2” 45 –0” A2S1 7’-2” 45’-0” A1U3 15’-0” 45’-0” A1S3 15’-0” 45’-0”

BD 545-56 Page 19
L8
L5
L7L4
L6
L3
L2
L1
Figure 13 – Strands instrumented with LVDT’s. Solid circles indicate instrumented strands
7' - 2"
7.5" 4"
4' - 2
"
1' - 0
.5"2'
- 4"
6' - 2"
5' - 0"
3' - 6"
2' - 0"
6' - 6"
5' - 2"
4' - 2"
8' - 2"
5' - 2
"
R11 R10 R9 R8
R7
R6 R5 R4
R3 R2 R1
S3 S1S2S4
Top View at Load Point
S5
1' - 4
"
DECK/GIRDERINTERFACE
Figure 14 – A2U1 strain gage placement.

BD 545-56 Page 20
7' - 2"
7.5"2'- 0"
3' - 6"
5' - 0"
4"2' - 4
"
6' - 6"
R6 R5
R4R3R2R1
S5 S7S6
4' - 2"
5' - 2"6' - 2"
8' - 2"
6' - 0
"
S3S1 S2 S4
Top View at Load Point
DECK/GIRDERINTERFACE
1' - 4
"
Figure 15 – A2S1 strain gage setup.

BD 545-56 Page 21
15' - 0"
7.5"2' - 0"
3' - 6"5' - 0"
6' - 6"8' - 0"
11' - 0"14' - 0"
R15
R14 R13 R12
R11 R10 R9 R8 R7 R6 R5
R4 R3 R2 R1
S2 S1
4"2'
- 4" 4'
- 2" 5'
- 0"
DECK/GIRDERINTERFACE
Figure 16 – A1U3 strain gage setup.

BD 545-56 Page 22
15' - 0"
7.5"2' - 0"
3' - 6"
5' - 0"6' - 6"
8' - 0"11' - 0"
14' - 0"
2' - 4
"
5' - 0
"
R8
R7 R6 R5 R4 R3 R2 R1
S2 S1
DECK/GIRDERINTERFACE
Figure 17 – A1S3 strain gage setup.

BD 545-56 Page 23
4' - 2"
3' - 2"3' - 8"
M1M2
M3M4
M5M6
4"4"
1'-10
"
Figure 18 – Stirrup strain gages for girders A1 and A2.
4.8 RESULTS AND DISCUSSION The superimposed shear vs. displacement curves for A1U3 and A1S3 are shown in
Figure 19. The superimposed shear is the shear force at the support nearest the loading point and
does not include the self-weight of the girder. The displacement was measured at the load point.
Both the control (A1U3) and CFRP strengthened (A1S3) girders behaved linear-
elastically up to first cracking. A1U3 cracked initially at a shear of 165 kips, while A1S3
cracked at a shear of 205 kips, a 24% increase. Cracking shears were confirmed by strain rosette
readings shown in Figure 20. It is interesting to note that neither the precracked nor post-cracked
stiffness of the strengthened girder is markedly greater than that of the unstrengthened girder.
The unstrengthened girder (A1U3) reached a maximum shear of 256 kips, whereas the
strengthened girder (A1S3) reached a maximum shear of 310 kips, a 10% increase. Thus, the
FRP repair provided an increase in capacity but not stiffness for the a/d of 3 condition.

BD 545-56 Page 24
Displacement (in)
Sup
erim
pose
d S
hear
(kip
s)
0 0.1 0.2 0.3 0.4 0.5 0.6 0.7 0.8 0.9 10
50
100
150
200
250
300
350
400A1U3A1S3
Figure 19 – A1U3 and A1S3 load vs. displacement.
Superimposed Shear (kip)
Prin
cipa
l Stra
ins
(mic
rost
rain
)
0 50 100 150 200 250 300 350-500
-400
-300
-200
-100
0
100
200 Maximum StrainMinimum Strain
R8
Superimposed Shear (kips)
Prin
cipl
e St
rain
s (m
icro
stra
ins)
0 50 100 150 200 250 300 350 400-500
-400
-300
-200
-100
0
100
200Maximum StrainMinimum Strain
R4
(a) (b)
Figure 20 – Principal strains from rosettes: (a) A1U3R8 and (b) A1S3R4. (Tension is positive)

BD 545-56 Page 25
The initial crack patterns for A1U3 and A1S3 are shown in Figure 21. The cracks in both
girders formed at angle of approximately 30 degrees from horizontal. The distribution of
additional cracks varied between the control and strengthened specimens. The strengthened
specimen had a crack distribution that was evenly spread between the load point and the support,
while the control specimens crack pattern spread only halfway from the support to the load. This
indicates that the post-cracking behavior was influenced by the CFRP bonded reinforcement.
Examination of the cracking pattern reveals that the failure was not symptomatic of what
is typically considered a shear failure. Cracks did not extend into the compression zone, nor did
a compression failure occur in the top of the girder. Rather, the cracks extended into the bottom
flange of the girders near the support (Figure 22).
The early failure of the girder was attributed to two characteristics of the girder design.
One was the irregular debonding pattern that placed fully bonded strands in the flanges of the
bottom bulb and debonded strands under the web (Figure 4). The other was the lack of
confinement steel in the bottom bulb near the support. Figure 23a illustrates the flow of forces as
capacity is imminent in a girder with all strands fully bonded. The strut and tie model shows a
diagonal strut and a longitudinal tie that are typical of a girder with a short shear span. The strut
passes through the web and terminates under the load point at one end and at a node just over the
support at the other end. The tendon forms the tie, which must be anchored into the node over
the support point to ensure equilibrium. The typical mode of behavior for this configuration is
for the strand to slip. This typically occurs when the load point is very near the support, which
results in a short strand development length. 15 ft
7.5 in
FRP Laminate
15 ft
7.5 in
(a) (b)
Figure 21 – First crack pattern for load location a/d = 3 (a) A1U3 and (b) A1S3.
BD 545-56 Page 26
15 ft
7.5 in
FRP Laminate
15 ft
7.5 in
(a) (b)
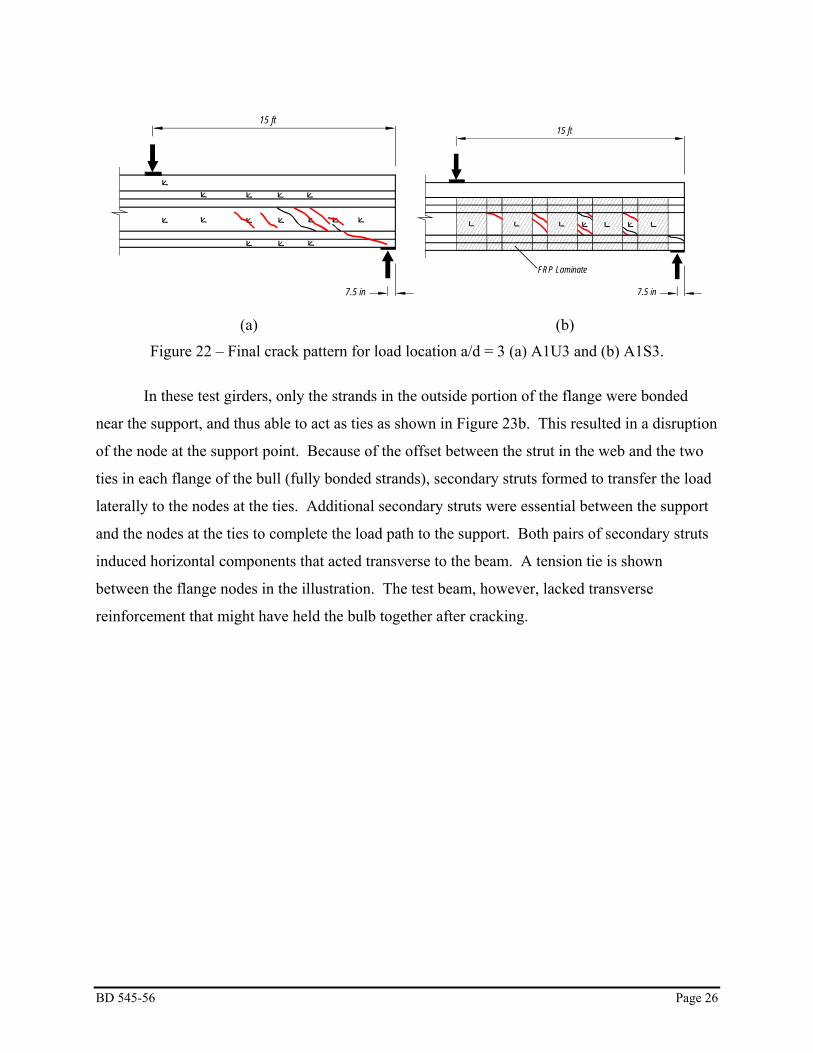
Figure 22 – Final crack pattern for load location a/d = 3 (a) A1U3 and (b) A1S3.
In these test girders, only the strands in the outside portion of the flange were bonded
near the support, and thus able to act as ties as shown in Figure 23b. This resulted in a disruption
of the node at the support point. Because of the offset between the strut in the web and the two
ties in each flange of the bull (fully bonded strands), secondary struts formed to transfer the load
laterally to the nodes at the ties. Additional secondary struts were essential between the support
and the nodes at the ties to complete the load path to the support. Both pairs of secondary struts
induced horizontal components that acted transverse to the beam. A tension tie is shown
between the flange nodes in the illustration. The test beam, however, lacked transverse
reinforcement that might have held the bulb together after cracking.

BD 545-56 Page 27
(a) (b)
Figure 23 – Strut and tie model for tendon with (a) fully bonded strands and (b) an excessive number of strands debonded under the web.
Figure 24 shows the cracking pattern exhibited by girder A2U1 after reaching capacity.
The girder capacity was controlled by the formation of a large crack at the outer pair of strands in
the bulb flange. It is believed that this crack formed as a result of the transverse tensile stresses
in the concrete resulting from the splitting of the strut shown in Figure 22b. The crack formed at
the edge of the bearing pad. As the crack progressed along the beam it angled toward the web
and terminated at the web at a distance of approximately half the girder depth. This crack caused
a loss of the tie from the outside node, thus resulting in the strand peeling away from the bulb as
indicated by the arrow. This behavior may have caused problems with strand slip measurements,
since the frame supporting the displacement devices was attached to the bulbs (Figure 25).

BD 545-56 Page 28
Figure 24 – Bulb cracking pattern caused by excessive debonding under the web.
Figure 25 – Cracking at support and strand instrumentation.
BD 545-56 Page 29
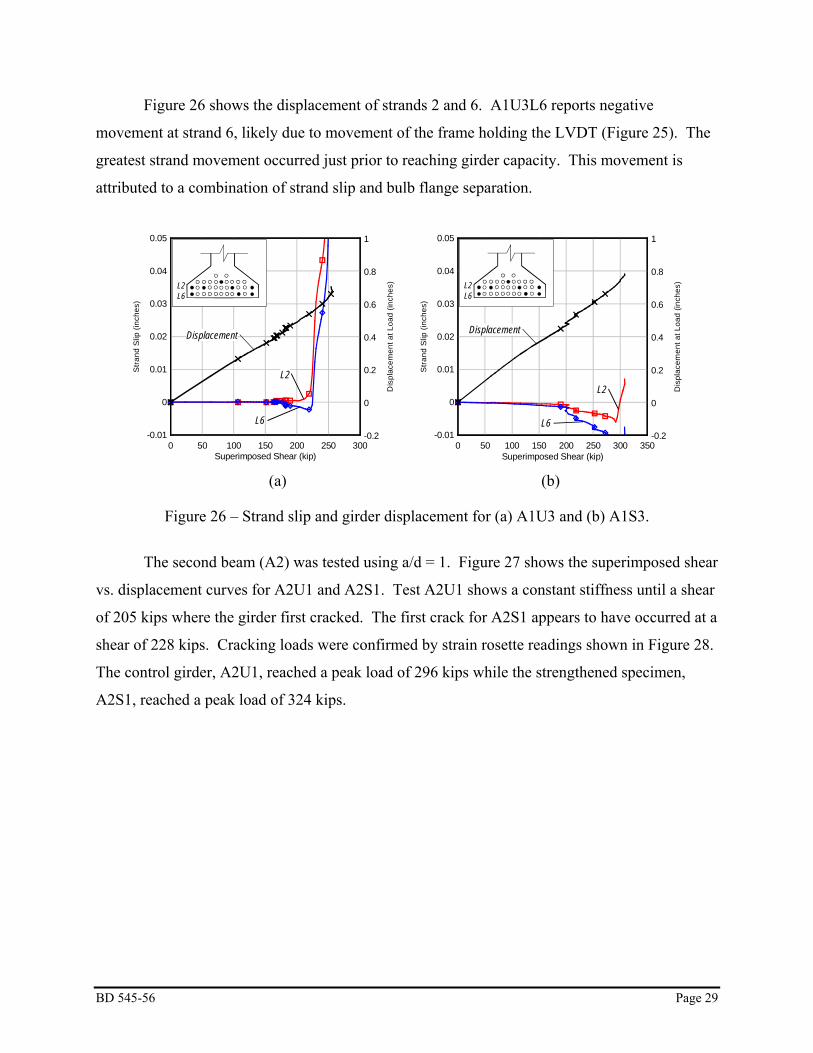
Figure 26 shows the displacement of strands 2 and 6. A1U3L6 reports negative
movement at strand 6, likely due to movement of the frame holding the LVDT (Figure 25). The
greatest strand movement occurred just prior to reaching girder capacity. This movement is
attributed to a combination of strand slip and bulb flange separation.
Superimposed Shear (kip)
Stra
nd S
lip (i
nche
s)
Dis
plac
emen
t at L
oad
(inch
es)
0 50 100 150 200 250 300-0.01 -0.2
0 0
0.01 0.2
0.02 0.4
0.03 0.6
0.04 0.8
0.05 1
L6L2
Displacement
L2
L6
Superimposed Shear (kip)
Stra
nd S
lip (i
nche
s)
Dis
plac
emen
t at L
oad
(inch
es)
0 50 100 150 200 250 300 350-0.01 -0.2
0 0
0.01 0.2
0.02 0.4
0.03 0.6
0.04 0.8
0.05 1
L6L2
Displacement
L2
L6
(a) (b)
Figure 26 – Strand slip and girder displacement for (a) A1U3 and (b) A1S3.
The second beam (A2) was tested using a/d = 1. Figure 27 shows the superimposed shear
vs. displacement curves for A2U1 and A2S1. Test A2U1 shows a constant stiffness until a shear
of 205 kips where the girder first cracked. The first crack for A2S1 appears to have occurred at a
shear of 228 kips. Cracking loads were confirmed by strain rosette readings shown in Figure 28.
The control girder, A2U1, reached a peak load of 296 kips while the strengthened specimen,
A2S1, reached a peak load of 324 kips.

BD 545-56 Page 30
Displacement (in)
Sup
erim
pose
d S
hear
(kip
)
0 0.1 0.2 0.3 0.4 0.50
50
100
150
200
250
300
350
400A2U1A2S1
Figure 27 – A2U1 and A2S1 load vs. displacement.
Superimposed Shear (kips)
Prin
cipa
l Stra
ins
(mic
rost
rain
)
0 50 100 150 200 250 300 350-500
-400
-300
-200
-100
0
100
200
300
400
500Maximum StrainMinimum Strain
R5
Superimposed Shear (kip)
Prin
cipa
l Stra
ins
(mic
rost
rain
)
0 50 100 150 200 250 300 350-500
-400
-300
-200
-100
0
100
200
300
400
500Maximum StrainMinimum Strain
R2
(a) (b)
Figure 28 – Strain rosettes (a) A2U1R5 and (b) A2S1R2.

BD 545-56 Page 31
Figure 29 shows the locations of the initial cracks for A2U1 and A2S1. For both tests,
the initial crack occurred at the same location and at similar angles. The CFRP did not influence
the cracking pattern, as the final cracks are also similar for both tests (Figure 30). The CFRP
strengthening scheme provided an increase in cracking load of 23 kips, a 10 percent increase.
The peak load for A2U1 was 296 kips while A2S1 reached a peak load of 324 kips. The FRP
provided a 9 percent increase in capacity
7 ft 2 in
7.5 in
FRP Laminate
7 ft 2 in
7.5 in (a) (b)
Figure 29 – First crack pattern for load location a/d = 1 (a) A2U1 and (b) A2S1.
7 ft 2 in
7.5 in
FRP Laminate
7 ft 2 in
7.5 in (a) (b)
Figure 30 – Final crack pattern for load location a/d = 1 (a) A2U1 and (b) A2S1.
The failure mode for pretensioned girders with such a short a/d ratio is typically strand
slip. Similar to the tests conducted with the point load at 15 ft, however, the failure mode for this
loading condition was also influenced by excessive number of strands debonded in the web as
well as the lack of confinement steel in the bottom bulb. After cracks penetrated the bottom

BD 545-56 Page 32
bulb, the bulb flange cracked and separated from the web. The lack of confinement steel allowed
this transverse movement to occur after the bulb flange had cracked. Cracking in the bottom
bulb also led to slipping of the strands (Figure 31).
Superimposed Shear (kip)
Stra
nd S
lip (i
nche
s)
Dis
plac
emen
t at L
oad
(inch
es)
0 50 100 150 200 250 300-0.01 -0.1
0 0
0.01 0.1
0.02 0.2
0.03 0.3
0.04 0.4
0.05 0.5
L6L2
Displacement
L2
L6
Superimposed Shear (kip)S
trand
Slip
(inc
hes)
Dis
plac
emen
t at L
oad
(inch
es)
0 50 100 150 200 250 300 350-0.01 -0.1
0 0
0.01 0.1
0.02 0.2
0.03 0.3
0.04 0.4
0.05 0.5
L6L2
Displacement
L2
L6
(a) (b)
Figure 31 – Strand slip and load displacement for (a) A2U1 and (b) A2S1
Table 5 summarizes the capacities of both the strengthened and control tests of the Type
IV girders. In both loading conditions CFRP provided some increase in capacity but was most
effective for the a/d = 3, which is typically where shear capacity (as opposed to strut and tie)
behavior will control the beam capacity. Some of the increase in capacity was likely due to the
confinement of the bottom bulb by the CFRP wrap closest to the support. In addition, the change
in cracking pattern caused by the a/d=3 tests indicate that there was some effect from the CFRP
wraps bonded to the webs. This is supported by the larger increase in capacity for the a/d=3 test
over that of a/d =1 and may indicate that the vertical strips of CFRP are contributing modestly to
the overall girder capacity. The control girder was damaged slightly at the end used to conduct
the a/d = 3 test. This damage may have reduced the capacity of the control girder, which may
explain why the improvement for the a/d=3 test is greater than the a/d=1 test.

BD 545-56 Page 33
Table 5 – Ultimate shear capacity.
a/d Vcontrol (kip)
VCFRP (kip)
VCFRP/Vcontrol
1 296 324 1.09 3 256 310 1.21
4.9 CALCULATED SHEAR CAPACITY Table 6 shows a comparison of the experimental girder capacity with calculated
capacities using the following methods:
1. Modified compression field theory (MCFT) from AASHTO LRFD Bridge Design
Specification (2007).
2. Strut and Tie method (STM) from AASHTO LRFD Bridge Design Specification
(2007).
3. Detailed method (ACI) from American Concrete Institute ACI 318 (2008)
The failure modes assumed by these methods do not match those observed in the tests.
The comparison, however, gives perspective regarding the predicted vs. actual capacities. The
experimental data presented in earlier sections was typically the superimposed shear and does
not include the self-weight of the girder. The self-weight was added to the experimental results
to reflect the total shear applied to the girder at capacity for the purpose of comparing to the
calculated capacities. The following material properties were used to calculate the shear
capacity: compressive strength of concrete of 7.2 ksi, yield strength of the shear reinforcement of
60 ksi, and tensile strength of the prestressing steel of 270 ksi.
Table 6 – Comparison of experimental capacity with calculated shear capacity.
MCFT STM ACI a/d
VEXP (kip) Vn
(kip)VEXP /
Vn Vn
(kip)VEXP /
Vn Vn
(kip) VEXP /
Vn 1 319 335 0.95 153 0.48 337 0.95 3 272 263 1.03 --- --- 349 0.78

BD 545-56 Page 34
For the STM, only the fully bonded strands in the bottom bulb, and lowest layer of mild
steel were considered as part of the tie. The force in the tie was limited by the lack of
development length, and thus was the controlling factor for the STM prediction. The strut and
tie method was not used for a/d of 3 because it is not typically applicable for this load
configuration.
It is important to note that the failure mode of the girder did not match that assumed by
either the ACI or MCFT methods. Because the failure mode was separation of the bottom bulb
flange, the peak shear load was less than that predicted by the sectional shear models.
Due to the strand debonding pattern, the effective prestress force was greater for the
section at a/d of 3 than for the section at a/d of 1. For the ACI method, the web cracking
equation is a function of the prestress force. As the web cracking equation controlled the ACI
predicted capacity, the predicted shear capacity is greater for the longer shear span.
4.10 SUMMARY AND CONCLUSIONS Two girders were constructed to replicate existing, in-service, Type IV bridge girders.
The existing girders were strengthened using CFRP fabric to mitigate the effects of a problematic
debonding pattern, in which fully bonded strands were placed at the edges of the bottom bulb.
One end of each test girder was strengthened using the same CFRP strengthening scheme as was
used on the in-service girders. Each end of each test girder was loaded to failure in three-point
bending. One girder was tested using and a/d of 1, the other was tested using an a/d of 3. The
experimental capacity of the strengthened ends was compared to the experimental capacity of the
unstrengthened ends. Current design methods were compared to the experimental results.
Following are the salient findings from the research:
1. The bonded CFRP reinforcement provided an increase in capacity of 9 and 21 percent for
the 7 ft 2in. and 15 ft shear spans, respectively.
2. The CFRP reinforcement improved the distribution of cracking for the test at an a/d ratio
of 3.
3. Capacity was not controlled by the typical shear failure mechanisms, but rather was due
to the cracking and separation of the bottom bulb flange of the girder. This was a result
of the unusual debonding pattern that placed the fully bond strands out in the bulb and the

BD 545-56 Page 35
debonded strands under the web. It is likely that the presence of confinement steel
around the strands would have resisted this separation. It is not clear, however, if the
strand slip would have still restricted the capacity of the girder if confinement steel were
provided.
4. The improvement in capacity of the strengthened girders was likely due, in part, to partial
confinement of the bottom bulb by the bonded CFRP reinforcement.
5. The observed failure mode did not match those assumed by any of the three models (ACI,
S&T, MCFT).

BD 545-56 Page 36
5 AASHTO TYPE III GIRDERS
5.1 OBJECTIVES Salvaged AASHTO Type III bridge girders that were in service for nearly 30 years were
tested to evaluate behavior, capacity, and failure mode under varying a/d ratios. Development of
strand was of particular interest for girders tested using smaller a/d (shear span) ratios, while
mode of failure was of particular interest for girders tested using larger a/d ratios. In addition,
the behavior of the precast deck system used with the girders was evaluated.
5.2 APPROACH Four AASHTO Type III girders were salvaged and tested. Girders were tested in three-
point bending. The a/d ratio ranged from 1.2 to 5.4 (Table 9). Where possible, each end of each
girder was tested.
5.3 BACKGROUND Fagundo and Lybas (1995) conducted sixteen tests on concrete girders with varying load
points and spans. They found that the formation of diagonal cracks always preceded longitudinal
strand slip. They also found that cracks forming directly under the load point would create a
hinge effect cause the beam to act as two rigid bodies. This behavior is typical with under-
reinforced beams.
Russell and Ramirez (2007) performed tests on the ends of 43 rectangular beams and 8 I-
shaped beams. Loading geometry was varied to test different development lengths. Bond, shear
and flexural failure modes were observed and a criterion was set to classify them. Bond failure
was classified as excessive strand slip. Strand slipping occurred after the formation of flexural
cracks. Shear failure was classified as sudden diagonal compression failure in the web. Flexural
failure was classified as crushing of the compression zone.
Ramirez (1994) presents a full member strut-tie design of a precast pretensioned beam
with depressed strands at midspan. He compares his results with the ACI code, which uses a
sectional approach. At the time the article was presented there were no requirements considering
the interaction of adjacent strands. A strut and tie model is presented which shows the detailing
needed to prevent splitting. A strut and tie model of the forces in the compression flange is also

BD 545-56 Page 37
presented. Proper detailing of the web flange connection is necessary to insure that cracking
does not occur. This could leave the flange ineffective in resisting longitudinal stresses.
Alshegeir and Ramirez (1992) performed testing of 3 full scale pretensioned AASHTO
type I and II beams. Analysis of the tests led to the following conclusions. The use of higher
strength concrete would improve ultimate capacities by strengthening the nodes and the struts.
The size of the bearing plates at the load and support determine the dimensions of the nodal
zones at those locations. Stresses in the nodal zone are a function of the size of the nodal zone.
Because all of the elements near the load and support are in compression, the nodes at these
locations can be modeled using the full uniaxial compressive strength of concrete. A reduced
uniaxial compressive strength should be used when tension ties are present in the node.
5.4 GIRDER ACQUISITION AND CONDITION Girders were salvaged from an I-75 overpass bridge on State Road 93 in Sarasota
County, Florida. The bridge was built in 1979 and was made up of five AASHTO Type III
prestressed concrete bridge girders, four of which were salvaged. The overpass had twin spans
identified by FDOT bridge numbers 170079 or 170080. The bridge deck was saw-cut along the
length of each girder to facilitate removal (Figure 32). The deck was carefully removed using a
saw rather than the typical jack hammering and prying. This ensured that the girders were
undamaged during removal. After removal, the girders were transported by truck to the FDOT
Structures laboratory in Tallahassee, Florida (Figure 33). The rigging caused damage to the deck
during lifting but was considered minor and did not appear to affect the results of the testing.
The latest inspection of the bridge was completed in February 2007. The overall ratings
for the bridge deck and superstructure were very good. The bare concrete deck was described to
“have a few repaired areas, there are few spalls/delaminations in the deck surface or underside
and the only cracking is superficial or surface map cracking.” The girders were found to have
little or no visible deterioration, but did have minor cracking and some discoloration due to
efflorescence. The report indicated that the cracking was not anticipated to affect strength or
serviceability.

BD 545-56 Page 38
Figure 32 – Deck cutting operation in preparation for girder removal.
Figure 33 – Removal of Type III girders.
5.5 GIRDER DETAILS Figure 35 shows the deck configuration and reinforcement. The figure shows average
values since the deck dimensions varied slightly with location. The 7-in. thick deck was
reinforced longitudinally with #7 bars. These bars were spaced at approximately 5 to 6 in. on
center near the supports, but at midspan were spaced at 11 to 12 in on center. It is not known
where the spacing changed along the span of the girder. The deck was cut such that 28-in. wide
section remained with each girder. The deck consisted of a precast panel spanning between
girders, with a cast-in-place topping. The precast section had shear keys to provide interlock
between the two sections. The precast section was reinforced with 3/8-in. diameter strand,
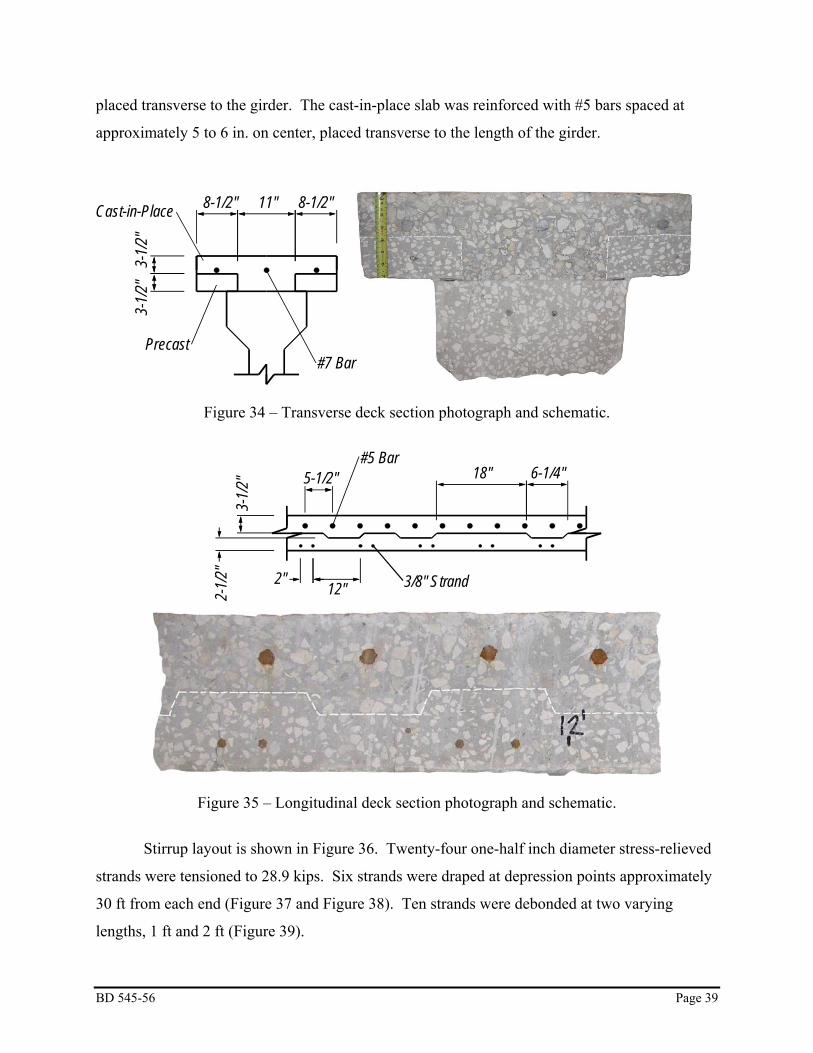
BD 545-56 Page 39
placed transverse to the girder. The cast-in-place slab was reinforced with #5 bars spaced at
approximately 5 to 6 in. on center, placed transverse to the length of the girder.
8-1/2" 11" 8-1/2"
3-1/
2"3-
1/2"
#7 BarPrecast
Cast-in-Place
Figure 34 – Transverse deck section photograph and schematic.
5-1/2" 18" 6-1/4"
2" 12"
3-1/
2"2-
1/2"
#5 Bar
3/8" Strand
Figure 35 – Longitudinal deck section photograph and schematic.
Stirrup layout is shown in Figure 36. Twenty-four one-half inch diameter stress-relieved
strands were tensioned to 28.9 kips. Six strands were draped at depression points approximately
30 ft from each end (Figure 37 and Figure 38). Ten strands were debonded at two varying
lengths, 1 ft and 2 ft (Figure 39).

BD 545-56 Page 40
Samples of the concrete, stirrups and prestressing strands were taken after the girders
were tested. These samples were tested to determine material properties. Cores were taken from
girder B2 at mid-height of the section at approximate distances of 18, 25, and 25.5 ft from end
where test B2U2 was conducted (Table 7). The deck cores were also taken from girder B2
centered in the top of the slab. These cores were taken at distances of 22, 30 and 31 ft from the
end where test B2U2 was conducted (Table 8). Stirrup specimens were taken from girder B1
(Table 9), and strand specimens were taken from girder B3 (Table 10).
2" 4" 4" 4" 6" 6" 6" 6" 6"
Bars Z2 (#5) Bars Z1 (#4)
8" 10" 12" 12" 16 SP. @ 1' - 6"
Bars K2 (#5) Bars K1 (#4)
Centerline
Bars L (#4)
Bars N (#5)
Bars Z1 & Z2
Bars K1 & K2
2" 2"
5 3/4" 5 3/4"4 1/2"
5" 6" 6" 5"
3"11
1/2
"6"
7"6"
9"2 1
/2"
3' - 9
"
Figure 36 – Type III stirrup layout.

BD 545-56 Page 41
59' - 7 3/8"
29' - 9 11/16"
7' - 4"
Centerline of Beam
Symmetric aboutCenterline
Figure 37 – Type III strand profile.
10"
2 SP
@ 2
"2'
- 0"
2 SP
@ 2
"3"
2" 2"9 SP @ 2"
1' - 10"
3' - 2
"2
SP @
2"
3"
2" 2"9 SP @ 2"
1' - 10"
SECTION AT END OF SPAN
SECTION AT CENTERLINE OF SPAN
Figure 38 – Type III end and centerline cross sections.
STRAND DEBONDING PATTERNSTRANDS DEBONDED 24 in. FROM END OF BEAM
STRANDS DEBONDED 12 in. FROM END OF BEAM
Figure 39 – Type III debonding pattern.

BD 545-56 Page 42
Table 7 – Concrete core test results for web.
Sample Load (lbs) Stress (psi) Diameter (in) Length (in) 1 45200 5690 3.18 6.08 2 44000 5540 3.18 6.12 3 45100 5670 3.18 6.14 Average 5630
Table 8 – Concrete core test results for deck.
Sample Load (lbs) Stress (psi) Diameter (in) Length (in) 1 38100 4830 3.17 6.09 2 36700 4650 3.17 6.13 3 42700 5410 3.17 6.20 Average 4960
Table 9 – Stirrup test results.
Sample Tensile Strength (psi)
Yield Strength (psi)
Elongation (%)
1 90000 54700 14.5 2 95200 58700 11
Average 92600 56700 12.8
Table 10 – Steel strand strength and modulus.
Sample 1 2 3 4 AVG Strength (ksi) 286 285 286 283 285
Stress at 1% EUL (ksi) 257 262 254 253 257 Total Elongation (%) 5.43 5.99 6.59 7.04 6.26
Initial tests using a short shear span ratio indicated that the primary failure mode was
strand slip. B4S2 was strengthened with the intention of providing confinement at the support
and preventing the strands from slipping. The confinement was provided by two 5-in. square, ¼-
in. thick steel tubes that were clamped to each side of the bottom bulb (Figure 40 and Figure 41).
Bearing plates were located at each end of each steel tube between the tube and the bottom bulb
of the girder. The tubes were clamped using approximately 1.5-in. thick plates and two 1-in.
diameter hand-tightened steel threaded rods. Tubes were instrumented with 60-mm strain gages
as shown in Figure 42.

BD 545-56 Page 43
2' - 0"
5"
5" x 5" x 1/2" 2" x 5" x 1/2"
1" Dia. Rod
Figure 40 – B4S2 repair layout.
Figure 41 – B4S2 repair.
4"
1' - 11.5"
T1
T2 on tube on opposite side in same location relative to beam end.
Steel Tube
Figure 42 – Details of repair.

BD 545-56 Page 44
5.6 TEST SETUP AND PROCEDURES Seven shear tests were conducted using a three-point loading scheme. Tests were
conducting using five different shear span to depth (a/d) ratios ranging from 1.2 to 5.4. The
general test configuration is shown in Figure 43 with specific dimensions given in Table 11. The
load was applied by an actuator through a 1.5-in. thick x 10 in. x 20 in. (20-in. dimension
perpendicular to girder length) reinforced neoprene bearing pad at a loading rate of 0.25
kips/second. Each end of each girder was supported by a 1.5-in. thick x 7 in. x 20 in. (20 in.
dimension perpendicular to girder length) reinforced neoprene bearing pad. Load cells were
used to measure the load applied by the actuator. Linear variable displacement transducers,
LVDTs, were used to measure displacement at the load point and at each support. LVDTs were
also used to measure strand slip (Figure 44).
Strain was measured at discrete locations using 60-mm strain gages and strain rosettes.
Figure 45 through Figure 51 show the strain gage and strain rosette layouts for each test
A 5.5 in.
B
5.5 in.
2 in.7 in.
L14 L12L13 L11
Figure 43 – Shear test setup.
Table 11 – Test setup geometry.
Test A B a/d* B1U1 4’ - 9” 44’ – 9” 1.2 B2U2 8’ - 3.5” 47’ - 0.5” 2.1 B4S2 8’ - 3.5” 44’ – 8” 2.1 B2U3 12’ - 5.5” 51’ – 0.5” 3.1 B1U4 16’ - 9” 56’ – 4” 4.2 B4U4 16’ - 9” 56’ – 9” 4.2 B3U5 21’ - 5.5” 59’ – 0.5” 5.4
*d = 48 in.

BD 545-56 Page 45
L1
L2
L3 L4 L5 L6 L7 L8
L9
L10 L1
L2
L3L4L5L6L7L8
L9
L10
(a) (b)
Figure 44 – Strands instrumented to measure slip on tests (a) B1U1, B2U3, and B4U4 (b) B1U4, B2U2, B3U5, and B4S2.
4' - 9"
5.5"
4"
3' - 3
.5"
2' - 0
"
4' - 1
"
4' - 5"3' - 9"
2' - 9"1' - 9"
R9R10
S3
R11
R8 R7 R6 R5
R4 R3 R2
R1
4' - 4
"
S1S2Top View at Load Point
1' - 4
"
DECK/GIRDERINTERFACE
Figure 45 – B1U1 strain gage layout.

BD 545-56 Page 46
8' - 3.5"
5.5"
4"
3' - 3
.5"
2' - 0
"
4' - 1
"
5' - 5.5"
4' - 5.5"2' - 11.5"
1' - 11.5"
5' - 11.5"6' - 3.5"
7' - 3.5"
R11
S3
R10R9
R8R7R6R5
R4R3R2
R1
4' - 4
"
S1 S2
Top View at Load Point
S4
1' - 4
"1'
- 3"
DECK/GIRDERINTERFACE
Figure 46 – B2U2 strain gage layout.
5.5"
4"
3' - 3
.5"
2' - 0
"
4' - 2
.5"
4' - 5.5"2' - 11.5"
1' - 11.5"1' - 0"
6' - 3.5"
7' - 3.5"8' - 3.5"
3' -
10.8
"4'
- 1"
S14
S11S10S9 R6
R5
R4
S16
S15
S2S1
S8S7S6R3R2R1S5S4S3
S13S12
Top View at Load Point
4' - 4
"
1' - 3
"1'
- 4"
DECK/GIRDERINTERFACE
4"
1' - 11.5"
T1
T2 on tube on opposite side in same location relative to beam end.
Repair Instrumentation
Steel Tube
Figure 47 – B4S2 strain gage layout.

BD 545-56 Page 47
12' - 5.5"
5.5"
4"
3' - 3
.5"
2' - 0
"
4' - 1
"
7' - 3.5"5' - 11.5"
4' - 5.5"2' - 11.5"
8' - 11.5"10' - 5.5"
11' - 5.5"
S3
R11 R10 R9
R8 R7 R6 R5
R4 R3 R2
R1
4' - 4
"
S1S2
Top View at Load Point
S4
1' - 4
"1'
- 3"
DECK/GIRDERINTERFACE
Figure 48 – B2U3 strain gage layout.
5.5"4' - 9"
6' - 5"7' - 9"
10' - 9"
16' - 9"15' - 9"
14' - 9"
4' - 1
"3'
- 3.5
"2'
- 0"
4"
R5
R9S3
R10 R11
R6 R7 R8
R2 R3 R4
R1
4' - 4
"
S1 S2
Top View at Load Point
1' - 4
"
DECK/GIRDERINTERFACE
Figure 49 – B1U4 strain gage layout.

BD 545-56 Page 48
S8S7S6R3R2R1S5S4S3
16' - 9"15' - 9"
14' - 9"
5.5"1' - 0"
2' - 0"
3' - 0"11' - 9"
4' - 3
.5"3'
- 11"
3' - 1
0"3'
- 5.5"
2' - 0
"4"
S13 S14S12
S9 S10 S11 R6
R5
R4
4' - 4
"
S16
S15
S2S1
Top View at Load Point
1' - 3
"1'
- 4"
DECK/GIRDERINTERFACE
Figure 50 – B4U4 strain gage layout.
21' - 5.5"
5.5"11' - 5.5"
12' - 11.5"14' - 5.5"
15' - 11.5"17' - 5.5"
19' - 5.5"20' - 5.5"
4"2' - 0
"3' - 3
.5"4' - 1
"
S3R9 R10 R11
R5 R6 R7 R8
R2 R3 R4
R1
4' - 4
"
S2S1
Top View at Load Point
S4
1' - 4
"1'
- 3"
DECK/GIRDERINTERFACE
Figure 51 – B3U5 strain gage layout.

BD 545-56 Page 49
5.7 RESULTS AND DISCUSSION Load, displacement, strain, and strand slip data are presented in this section. Load is
presented in terms of superimposed shear. Superimposed shear is defined as the shear between
the load point and the support as caused by the actuator. Note that girder self weight is not
included in the superimposed shear. Furthermore, the displacements presented in the subsequent
plots have been corrected for the rigid body movement using the measured support
displacements and so reflect only the deformation of the girder caused by the superimposed load.
Test B1U1 was conducted using an a/d ratio of 1.2. Figure 52 shows the shear-
displacement curve for B1U1. The girder behaved linear-elastically up until first cracking
occurred at 182 kips. First and final cracking patterns are shown in Figure 53. Strain rosette R9
was the closest instrumentation to the initial crack. Data from this gage confirms the linear
elastic behavior up to, and the cracking at, 182 kips (Figure 54).
The girder eventually reached a peak shear capacity of 331 kips.
Displacement (in)
Sup
erim
pose
d S
hear
(kip
)
0 0.1 0.2 0.3 0.4 0.5 0.60
50
100
150
200
250
300
350
400
Figure 52 – Shear vs. displacement B1U1.

BD 545-56 Page 50
4 ft 9 in
5.5 in
4 ft 9 in
5.5 in
Figure 53 – B1U1 first and final crack pattern.
Superimposed Shear (kip)
Prin
cipa
l Stra
in (m
icro
stra
in)
200 250 300
-100
0
100
200
300
400
500Maximum StrainMinimum Strain
0 50 100 150-500
-400
-300
-200
R9
First Cracking Shear
Figure 54 – Strain rosette R9.
Figure 55 shows a plot of shear vs. displacement and shear vs. strand slip for three
selected strands. Recalling that the first crack formed at 182 kips, Figure 55 shows a slight slip
in the strands at that load. The crack formed near the face of the bearing and likely shortened the
available development length for the strands sufficiently to result in slip. Reserve load capacity,

BD 545-56 Page 51
however, was provided by the supplemental vertical and horizontal mild steel reinforcement
included in the end region of the girder. If the girder was constructed without this end
reinforcement, it is likely that a mechanism would have formed and the girder would have been
unable to carry additional load. The capacity would have been dependent solely on the slip
resistance of the strand between the crack and the girder end.
Superimposed Shear (kip)
Stra
nd S
lip (i
nche
s)
Dis
plac
emen
t at L
oad
(inch
es)
0 50 100 150 200 250 300 350-0.01 -0.1
0 0
0.01 0.1
0.02 0.2
0.03 0.3
0.04 0.4
0.05 0.5
L1L2
L3
Displacement
L1L2
L3
Figure 55 – B1U1 strand slip and displacement.
The photograph in Figure 56 shows the girder with the primary crack and the associated
free body diagram with the forces generated when the flexure-shear crack formed. As shown in
the free body diagram, the mild steel reinforcement in the end of the beam is activated when the
crack forms and the strands slip. As the load was increased, however, the steel eventually either
yielded or failed in bond or both. Figure 54 and Figure 55 both exhibit a range between 182 kips
and 230 kips where the strand continues to slip and there is a slight loss in stiffness. After 230
kips, though, the strand slip increases markedly and the stiffness begins to decrease rapidly. This
is thought to be where the mild steel reinforcement yielded. Due to the gradual reduction in
stiffness exhibited in the load-displacement plot, it is believed that some of the bars reached

BD 545-56 Page 52
yield. If some or all of the bars had experienced a bond failure, the load displacement would
have indicated a sudden decrease in load.
(a) (b)
Figure 56 – Girder B1U1 (a) photo with the primary crack enhanced and (b) free body diagram including contribution of vertical and horizontal reinforcement
Test B2U2 was conducted using an a/d ratio of 2.1. Figure 57 shows the shear vs.
displacement curve for B2U2. The girder behaved linear-elastically up until first cracking,
which occurred at 182 kips as indicated by strain rosette R10 (Figure 58). This was the closest
instrumentation to the initial crack. The girder reached a peak shear of 244 kips.
Figure 59 shows that strand slip was detected at the same load as initial cracking. The
formation of cracks near the support reduced the available development length of the strands,
leading to bond failure between the strands and the concrete. The girder was able to sustain
additional load in a manner similar to that of girder B1U1 due to the mild steel located at the end
of the girders. Cracking patterns are shown in Figure 60.

BD 545-56 Page 53
Displacement (in)
Sup
erim
pose
d S
hear
(kip
)
0 0.1 0.2 0.3 0.4 0.5 0.60
50
100
150
200
250
Figure 57 – Load vs. displacement B2U2.
Superimposed Shear (kip)
Prin
cipa
l Stra
in (m
icro
stra
in)
0 50 100 150 200 250-500
-400
-300
-200
-100
0
100
200
300
400
500Maximum StrainMinimum Strain
R10
Figure 58 – B2U2 strain rosette plot R10.

BD 545-56 Page 54
Superimposed Shear (kip)
Stra
nd S
lip (i
nche
s)
Dis
plac
emen
t at L
oad
(inch
es)
0 50 100 150 200 250-0.01 -0.2
0 0
0.01 0.2
0.02 0.4
0.03 0.6
0.04 0.8
0.05 1
L1L2
L3
Displacement
L1
L2
L3
Figure 59 – B2U2 strand slip and displacement.
8 ft 3 in
5.5 in
8 ft 3 in
5.5 in
Figure 60 – First and final crack pattern for B2U2.
The shear vs. displacement curve for test B4S2 is shown in Figure 61. The change in
slope at 40 kips is likely an anomaly caused by the data acquisition and does not indicate a
change in behavior. Beyond this load the slopes of both plots remain relatively stable until a
shear of 162 kips is reached, at which point initial cracking occurs. This is about 10% less than
the initial cracking shear for B2U2. Furthermore, strands L1 and L2 appear to begin to slip at a

BD 545-56 Page 55
faster rate after this crack formed (Figure 63), indicating that the mild steel reinforcement at the
end of the girder was engaged.
Loading continued, with additional cracks forming at a shear of 198 kips. The strain
reported by strain rosette R5 increased sharply at this load, indicating the formation of additional
cracks (Figure 62). Accelerated strand slip was noted at a shear of 198 kips (Figure 63). The
girder reached a maximum shear of 232 kips. At this shear, the strands lost bond resulting in
failure of the girder. Final crack patterns are shown in Figure 64.
Comparing Figure 59 and Figure 63, it appears that the repair scheme provided a small
improvement in the bond between the strands and the concrete. During test B2U2 (unrepaired,
a/d=2.1, Figure 59) sharp increases in strand slipped occurred at 182 kips compared to 198 kips
for test B4S2 (repaired, a/d-2.1, Figure 63). Even with the repair, however, the failure mode for
test B4S2 was strand slip.
Displacement (in)
Sup
erim
pose
d S
hear
(kip
)
0 0.1 0.2 0.3 0.4 0.5 0.6 0.70
50
100
150
200
250
Figure 61 - Load vs. displacement B4S2.

BD 545-56 Page 56
Superimposed Shear (kip)
Prin
cipa
l Stra
in (m
icro
stra
in)
0 50 100 150 200 250-400
-300
-200
-100
0
100
200
300
400Maximum StrainMinimum Strain
R5
Figure 62 – Strain rosette plot R5.
Superimposed Shear (kip)
Stra
nd S
lip (i
nche
s)
Dis
plac
emen
t at L
oad
(inch
es)
0 50 100 150 200 250-0.01 -0.2
0 0
0.01 0.2
0.02 0.4
0.03 0.6
0.04 0.8
0.05 1
Displacement L1
L2 L3
L1L2
L3
Figure 63 – B4S2 strand slip and displacement.

BD 545-56 Page 57
8 ft 3 in
5.5 in
8 ft 3 in
5.5 in
Figure 64 – First and final crack pattern for B4S2.
The shear vs. displacement curve for test B2U3 is shown in Figure 65. As demonstrated
by this figure, the girder behaved linear elastically until the shear reached 159 kips (Figure 66),
where the first cracks were detected. Figure 67 shows shear vs. strand displacement. The
strands began to slip moderately from 159 kips up to a shear of approximately to 174 kips
indicating that the end reinforcement had been engaged. The strand slip increased sharply at 174
kips, indicating that the mild steel had yielded. The girder’s stiffness dropped rapidly as shear
was increased beyond 174 kips. The maximum shear supported by the girder was 197 kips.
Initial and final crack patterns are shown in Figure 68.
Similar to tests B1U1, B2U2, and B4S2, the mode of failure for test B2U3 was bond
failure between the strand and the concrete. Initial cracks reduced the length available for strand
development. The loss in development length led to the initial strand slip. After the initial strand
slip, the tensile force in the strands began to transfer to the horizontal reinforcement. Although
the horizontal reinforcement improved the girder’s ductility, it was insufficient to develop the
full moment capacity of the girder.

BD 545-56 Page 58
Displacement (in)
Sup
erim
pose
d S
hear
(kip
)
0 0.2 0.4 0.6 0.8 1 1.2 1.40
50
100
150
200
Figure 65 – Load vs. displacement B2U3.
Superimposed Shear (kip)
Prin
cipa
l Stra
in (m
icro
stra
in)
0 50 100 150 200-600
-400
-200
0
200
400
600
800Maximum StrainMinimum Strain
R7
Figure 66 – Strain rosette plot R7.

BD 545-56 Page 59
Superimposed Shear (kip)
Stra
nd S
lip (i
nche
s)
Dis
plac
emen
t at L
oad
(inch
es)
0 50 100 150 200 250-0.01 -0.3
0 0
0.01 0.3
0.02 0.6
0.03 0.9
0.04 1.2
0.05 1.5
Displacement
L1
L2 L3
L1L2
L3
Figure 67 – B2U3 strand slip and displacement.
12 ft 5 in
5.5 in
12 ft 5 in
5.5 in
Figure 68 – First and final crack pattern for B2U3.
The shear vs. displacement curve for test B1U4 is shown in Figure 69. The girder
behaved linear-elastically until the shear reached 104 kips. At this load, the slope of the shear-
displacement curve begins to change to a more gradual slope. The slope continued to change
until the shear reached 125 kips, beyond which the slope and was approximately constant for the
remainder of the test. The reduction of stiffness (change of slope) resulted from the formation of

BD 545-56 Page 60
cracks and yielding of the prestressing steel. Strain rosette R5 (Figure 70) was the instrument
closest to the initial diagonal crack. The data show a sharp increase in strain at a shear of 148
kips, indicating the formation of a web crack. In addition, moderate strand slip was noted
(Figure 71) at this same load indicating that the mild steel at the beam end had been engaged.
The web cracks propagated into the bottom flange and compression zone as the load was
increased. The girder failed at a shear of 171 kips due to crushing of the compression zone
(Figure 72a), which was accompanied by the bottom face of the bulb delaminating from the
girder (Figure 72b). The crack in the compression zone propagated through the joint between the
precast panels and ultimately caused the longitudinal bars in the deck to buckle. Failure mode of
test B1U4 is categorized as a shear-compression failure. Although the strand did slip
moderately, resulting in the mild steel being engaged, the mild steel had sufficient strength to
ensure that the capacity was not controlled by strand slip.
Displacement (in)
Sup
erim
pose
d S
hear
(kip
)
0 0.5 1 1.5 2 2.5 3 3.50
50
100
150
200
Figure 69 – Load vs. displacement B1U4.
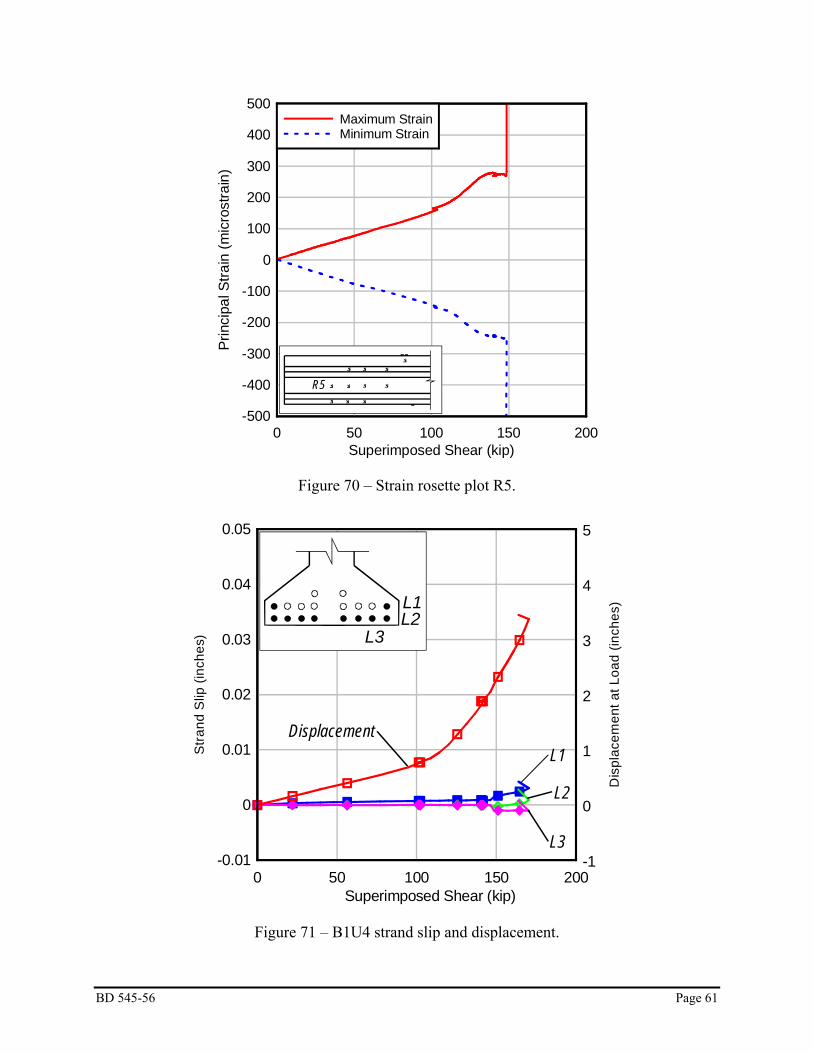
BD 545-56 Page 61
Superimposed Shear (kip)
Prin
cipa
l Stra
in (m
icro
stra
in)
0 50 100 150 200-500
-400
-300
-200
-100
0
100
200
300
400
500Maximum StrainMinimum Strain
R5
Figure 70 – Strain rosette plot R5.
Superimposed Shear (kip)
Stra
nd S
lip (i
nche
s)
Dis
plac
emen
t at L
oad
(inch
es)
0 50 100 150 200-0.01 -1
0 0
0.01 1
0.02 2
0.03 3
0.04 4
0.05 5
L1L2
L3
DisplacementL1
L2
L3
Figure 71 – B1U4 strand slip and displacement.

BD 545-56 Page 62
(a) (b)
Figure 72 – B1U4 failure (a) crushed compression zone and (b) separation of bottom bulb.
16 ft 9 in
5.5 in
16 ft 9 in
5.5 in
Figure 73 – First and final crack patterns of B1U4 (flexural cracks not shown).
The shear vs. displacement plot for test B4U4 is shown in Figure 74. The girder behaved
linear-elastically until the shear reached 100 kips, at which point the girder begins to lose
stiffness due to flexural cracking and yielding of the prestressing steel. This behavior was
observed at approximately the same shear as the previous test conducted at an a/d of 4, B1U4.
Based on the data from strain gages S12, S13, and S14 (Figure 75) the initial flexural
cracks formed at a shear of approximately 92 kips. These gages were located on the bottom of
the girder below the load point and reported steady growth in strain until the shear reached
approximately 92 kips. At this point the gages report a loss of tension, indicative of crack
formation. The slope of the shear-displacement plot continued to decrease as the shear increased
from 100 to 120 kips. The slope remained approximately constant at shears beyond 120 kips.
Additional cracking occurred at 120 kips, as indicated by the abrupt changes in strain as
shown in Figure 76 and Figure 77. Figure 77 shows the strains registered by gages S6, S7, and

BD 545-56 Page 63
S8. These gages were located on the underside of the deck near the load point. They registered
constant growth of compression strain until the shear reached 120 kips, at which point they
began to lose compressive strain. The load was held at 137 kips to mark the cracks. Loading
was resumed until the beam reached its maximum capacity of 188 kips. Failure was sudden and
resulted in the loss of a portion of the bottom flange.
Moderate strand slip appears to begin at approximately 130 kips. This moderate change
occurs until shortly before failure (See Figure 77). First and final cracks can be seen in Figure
79.
Although the damage in the compression zone near the load point was not as extreme as
that of the B1U4, this failure mode is categorized as shear-compression. For this test, the cracks
initially started as flexure cracks. As the girder was loaded, cracks began to form in the web and
grow towards the support. The concentration of cracks near the support is what caused the
strands eventually to slip.
Displacement (in)
Sup
erim
pose
d S
hear
(kip
)
0 0.5 1 1.5 2 2.5 3 3.5 4 4.5 50
50
100
150
200
Figure 74 – Load vs. displacement B4U4.

BD 545-56 Page 64
Superimposed Shear (kip)
Stra
in (m
icro
stra
in)
0 50 100 150 200-200
0
200
400
600
800
1000
S13 S14S12
S12
S13
S14
Figure 75 – Strain gages S12, S13, and S14.
Superimposed Shear (kip)
Stra
in (m
icro
stra
in)
0 50 100 150 200-400
-200
0
200
400
600
800
1000
S6 S7 S8
S6
S7
S8
Figure 76 – Strain gages S6, S7, and S8.

BD 545-56 Page 65
Superimposed Shear (kip)
Stra
nd S
lip (i
nche
s)
Dis
plac
emen
t at L
oad
(inch
es)
0 50 100 150 200-0.01 -1
0 0
0.01 1
0.02 2
0.03 3
0.04 4
0.05 5
L1L2
L3
Displacement
L1 L2
L3
Figure 77 – B4U4 strand slip and displacement.
(a) (b)
Figure 78 – Girder B4U4 after testing (a) shear span and (b) load point.

BD 545-56 Page 66
16 ft 9 in
5.5 in
16 ft 9 in
5.5 in
Figure 79 – First and final crack pattern for B4U4.
The shear vs. displacement plot for test B3U5 is shown in Figure 80. The girder behaved
linear-elastically until the shear reached 81 kips. Strain from gage S3 (Figure 81) indicated that
cracking occurred at a lower shear (72 kips) than indicated by the load-displacement. Strain
from rosette R8 (Figure 82), however, indicated that the crack had not entered the web until the
shear was 89 kips. The girder reached a peak shear of 151 kips when compression zone failed.
The failure was categorized as flexure.
Moderate strand slip occurred at approximately 120 kips as shown in Figure 84. The
girder reached flexural capacity, however, before the strands showed significant slip indicating
that sufficient development length was available to develop the full flexural capacity of the
section.
Displacement (in)
Sup
erim
pose
d S
hear
(kip
)
0 1 2 3 4 5 60
50
100
150
200
Figure 80 – Load vs. displacement B3U5.

BD 545-56 Page 67
Superimposed Shear (kip)
Stra
in (m
icro
stra
in)
0 25 50 75 100 125 150 1750
200
400
600
800
S3
Figure 81 – B3U5 strain gage S3.
Superimposed Shear (kip)
Prin
cipa
l Stra
in (m
icro
stra
in)
0 25 50 75 100 125 150 175-300
-200
-100
0
100
200
300
Maximum StrainMinimum Strain
R8
Figure 82 – B3U5 strain rosette plot R8.

BD 545-56 Page 68
21 ft 5 in
5.5 in
21 ft 5 in
5.5 in
Figure 83 – First and final crack pattern for B3U5.
Superimposed Shear (kip)
Stra
nd S
lip (i
nche
s)
Dis
plac
emen
t at L
oad
(inch
es)
0 50 100 150 200-0.01 -1.5
0 0
0.01 1.5
0.02 3
0.03 4.5
0.04 6
0.05 7.5
L1L2
L3
Displacement
L1
L2L3
Figure 84 – B3U5 strand slip and displacement.
5.8 SUMMARY OF RESULTS Seven tests were conducted using shear span to depth ratios ranging from 1 to 5. Table
12 summarizes the mode of failure for each test.
Tests conducted with an a/d ratio of 3 or less all resulted in a bond failure. The
characteristics used to categorize a bond failure included: excessive strand slip (greater than 0.03
in.) and failure to reach the predicted moment capacity. Strand slip occurred due to the
formation of cracks in the bottom bulb near the support (Table 11). These cracks reduced the
development length such that the strands could not fully develop. After these cracks formed, the

BD 545-56 Page 69
mild steel reinforcement crossing the crack in the end region of the girder was engaged and
began carrying load. The engagement of this mild steel delayed the formation of a collapse
mechanism, increased the ultimate capacity, and improved the ductility of the post-cracking
behavior. Without this end reinforcement, the girders tested with a/d < 3.0 would likely have
failed at lower capacities.
For tests with an a/d = 4, the failure mode was shear-compression and bond. The
characteristics used to define this failure mode were: a high concentration of shear cracks in the
web and flexural cracking under the load point, complete loss of bond through delamination of
the bottom bulb in the shear span, and failure of the compression zone near the load point.
Although present, strand slip did not affect the failure mode until failure was imminent. Failure
was precipitated, at least partially, by the complete loss of bond in the shear span. For both tests,
however, girders either were near or exceeded their calculated moment capacity.
For tests with an a/d = 5, the failure mode was flexure. Flexural failure was denoted by
the even distribution of flexure and flexure-shear cracks that formed at or near the load point.
Table 12 – Failure modes.
Test Failure Mode B1U1 Bond B2U2 Bond B4S2 Bond B2U3 Bond B1U4 Shear-compression and bond B4U4 Shear-compression and bond B3U5 Flexure
Table 13 – Distance from end of girder to closest crack.
Test Distance from end of
girder to closest crack (in.)
B1U1 10.5 B2U2 14.0 B4S2 7.5 B2U3 16.0 B1U4 34.0 B4U4 12.0 B3U5 41.0

BD 545-56 Page 70
5.9 COMPARISON OF RESULTS WITH CALCULATED SHEAR CAPACITY Table 14 shows a comparison of the experimental girder capacity with calculated
capacities using the following methods:
1. Modified compression field theory (MCFT) from AASHTO LRFD Bridge Design
Specification (2007).
2. Strut and Tie method (STM) from AASHTO LRFD Bridge Design Specification
(2007).
3. Detailed method (ACI) from American Concrete Institute ACI 318 (2008)
The failure modes assumed by these methods do not necessarily match those observed in
the tests. The comparison, however, gives perspective regarding the predicted vs. actual
capacities. The experimental shear capacity shown in the table includes the measured
superimposed shear and the calculated shear from self weight at the load point. STM was
calculated for short shear spans only to reflect the applicability of the model.
MCFT provided conservative predictions for all a/d ratios. The accuracy of the MCFT
predictions increased as the a/d ratio increased.
Calculated capacities using the strut and tie method were only for tests with a/d ratios of
1 and 2 since other failure modes were likely to control with higher ratios. STM significantly
underestimated the girder capacity (Figure 85, Figure 86). Only the fully bonded strands and
lowest layer of mild steel were considered as ties. The forces in the ties were limited by the lack
of development length, and were the controlling factor for the STM prediction. The models did
not account for the enhanced strength caused by the mild steel bars detailed in the girder end.
The ACI method produced the most accurate predictions. The ACI method was the only
method that over-estimated the shear capacity. This occurred at a/d ratio of 3.
Nominal moment capacity, Mn, was calculated using the principles of strain
compatibility. Table 15 summarizes the applied moment at failure for each test, along with the
corresponding nominal moment capacity. The applied moment includes the self weight of the
girder. The following material properties were used to calculate moment capacity: compressive
strength of concrete was 5.6 ksi, prestress in the strands was 190 ksi, ultimate tensile strength
was assumed to be 270 ksi, and Young’s modulus for the strands was 28,500 ksi.

BD 545-56 Page 71
125 k
90 k
104 k@ 6 deg.
134 k
194 k@ 6 deg.
224 k
154 k
Figure 85 – STM a/d=1
109 k
116 k
133 k@ 6 deg.
250 k@ 6 deg.
94 k
260 k
149 k
Figure 86 – STM a/d=2
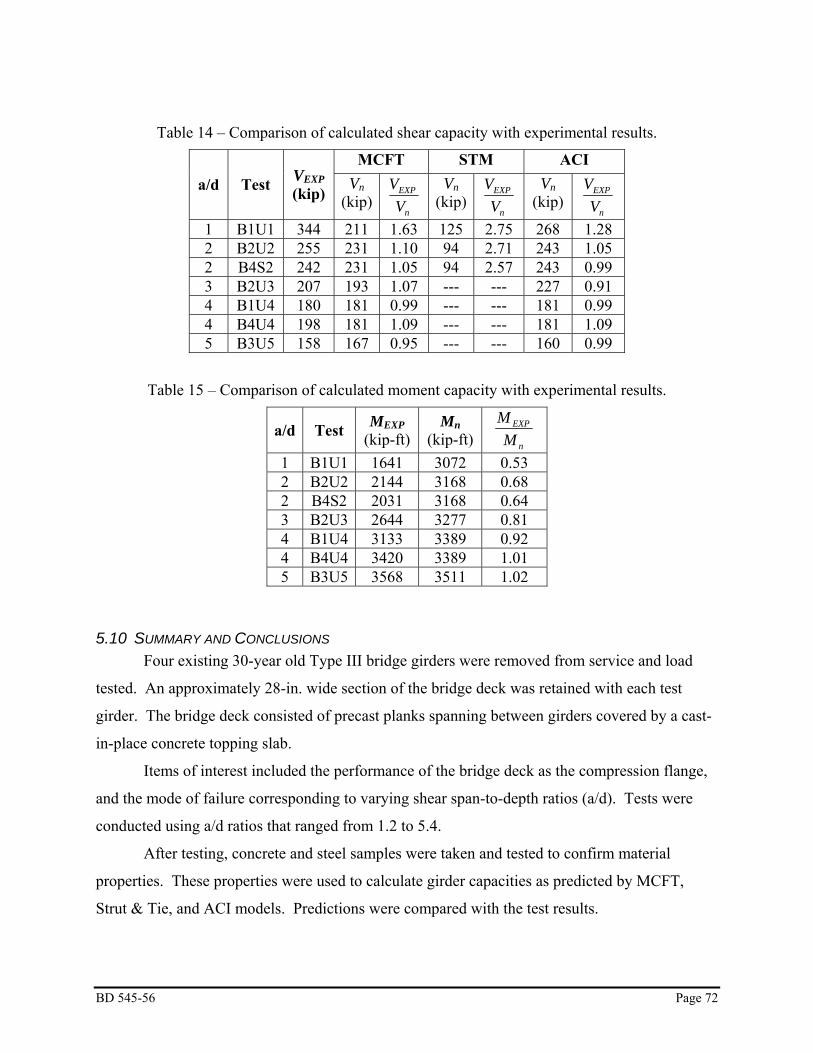
BD 545-56 Page 72
Table 14 – Comparison of calculated shear capacity with experimental results.
MCFT STM ACI a/d Test VEXP
(kip) Vn (kip)
n
EXP
VV Vn
(kip)n
EXP
VV Vn
(kip) n
EXP
VV
1 B1U1 344 211 1.63 125 2.75 268 1.28 2 B2U2 255 231 1.10 94 2.71 243 1.05 2 B4S2 242 231 1.05 94 2.57 243 0.99 3 B2U3 207 193 1.07 --- --- 227 0.91 4 B1U4 180 181 0.99 --- --- 181 0.99 4 B4U4 198 181 1.09 --- --- 181 1.09 5 B3U5 158 167 0.95 --- --- 160 0.99
Table 15 – Comparison of calculated moment capacity with experimental results.
a/d Test MEXP (kip-ft)
Mn (kip-ft) n
EXP
MM
1 B1U1 1641 3072 0.53 2 B2U2 2144 3168 0.68 2 B4S2 2031 3168 0.64 3 B2U3 2644 3277 0.81 4 B1U4 3133 3389 0.92 4 B4U4 3420 3389 1.01 5 B3U5 3568 3511 1.02
5.10 SUMMARY AND CONCLUSIONS Four existing 30-year old Type III bridge girders were removed from service and load
tested. An approximately 28-in. wide section of the bridge deck was retained with each test
girder. The bridge deck consisted of precast planks spanning between girders covered by a cast-
in-place concrete topping slab.
Items of interest included the performance of the bridge deck as the compression flange,
and the mode of failure corresponding to varying shear span-to-depth ratios (a/d). Tests were
conducted using a/d ratios that ranged from 1.2 to 5.4.
After testing, concrete and steel samples were taken and tested to confirm material
properties. These properties were used to calculate girder capacities as predicted by MCFT,
Strut & Tie, and ACI models. Predictions were compared with the test results.

BD 545-56 Page 73
A strengthening scheme was applied to one test girder to increase the confinement of the
strand development zone. The scheme consisted of steel tubes placed on each side of the bulb
near the bearing, the tubes being compressed against the bottom bulb via two hand-tightened
through bolts. Following are the salient findings from the research:
1. For a/d ratios of 3 or less, the failure mode was bond failure between the strands and
the concrete, which was precipitated by the formation of cracks in the strand
development zone.
2. For tests conducted with short a/d ratios, the formation of cracks in the strand
development length caused the strands to slip, but also engaged the transverse and
longitudinal mild steel reinforcement at the girder end. This provided a mild
improvement in capacity and ductility beyond first strand slip.
3. Both tests conducted at an a/d ratio of 4 resulted in shear-compression failure. The
change in failure mode between bond failure and shear-compression failure occurred
at an a/d ratio between 3 and 4.
4. Flexural failure occurred in the single test conducted at an a/d ratio of 5. The
transition to flexural controlled behavior occurred at an a/d ratio between 4 and 5.
5. The girder strengthened with the bolted tube steel apparatus exhibited better behavior
than its unstrengthened counterpart did, but its capacity was not increased beyond that
of the unstrengthened girder.
6. One of the a/d = 4 tests resulted in extensive crushing of the deck, which included
buckling of the longitudinal bars. The crack aligned with one of the joints between
the precast panels. The data, however, indicated that the panel system did not
produce any negative effects compared to that of a cast-in-place deck.
7. For tests conducted with short a/d ratios, the actual failure mode (bond failure) was
different from the mode assumed by the MCFT, Strut & Tie, and ACI models. The
capacities predicted by the models, however, were still conservative for almost all
cases when compared with the experimental results.

BD 545-56 Page 74
6 POST-TENSIONED GIRDERS
6.1 OBJECTIVE Tests were conducted to determine the behavior and capacity of early (circa 1950’s) post-
tensioned concrete girders subjected to shear loading. The effects of different bearing conditions
were also evaluated.
6.2 APPROACH Three test girders were constructed using existing bridge plans. These girders were tested
in three-point bending. Two of the girders were tested using a shear span-to-depth (a/d) ratio of
3.0. The final girder was tested using a shear span-to-depth (a/d) ratio of 2.0. The first two
girders (a/d equal to 3.0) were tested with and without neoprene bearing pads to determine the
effects of different bearing conditions on behavior and shear capacity.
6.3 BACKGROUND The test girders were constructed to replicate an early form of prestressed girder used in
Florida. These girders were precast, post-tensioned, I-girders with end blocks, used in simply
supported short-span bridges. Each end of the girder would bear directly on the concrete pier
cap with only a layer of tar paper separating the two. These girders are of particular interest
because they have both parabolic and straight post-tensioning bars, and because they have no
shear reinforcement. Mild steel reinforcement was provided only at the end blocks for
approximately 3 ft from each end, presumably to protect against anchorage failure.
Jaeger and Bakht (1988) studied the bearing restraint in slab-on-girder bridges.
Analytical models were created for steel-on-steel and steel-on-concrete bearings. The results
indicated that the horizontal restraint provided by relatively new bearing pads reduced the total
beam moments by 9%. It was also suggested that bearings permitting free movement of the
girder not be provided for short spans bridges that can be designed for thermal effects and
bearing restraint forces. Appropriate bearing restraints can provide a single span bridge with a
substantial increase in capacity.

BD 545-56 Page 75
6.4 GIRDER DESIGN The test girders were constructed to replicate a type of post-tensioned girder used in
Florida bridge construction in the 1950’s. The nearly 47-ft long test girders had four 1-in.
diameter post-tensioning bars (Figure 87). This was a slight alteration from the existing plans,
which called for 1.125-in. diameter bars. The post-tensioned steel bars used to construct the
original bridge were not available, so commercially available Grade 150 bars (fpu = 170ksi) were
used to construct the test girders. Following the original girder plans, two PT bars were placed
in a parabolic configuration with the other two PT bars placed at the bottom of the girder in a
straight configuration (Figure 88). Each bar had a cross-sectional area of 0.85 square inches.
Mild steel was placed in the end block for 34 in. at each end of the girder (Figure 89). The
longitudinal steel in the end block extended just beyond the last stirrup. U-shaped bars were
placed along the top of the girder to ensure composite action between the deck and the girder, but
did not extend a sufficient distance into the girder to provide additional shear capacity. A 2-ft 4-
in. wide by 7-in. thick deck was cast on the girder to simulate the 7-in. thick bridge deck used in
the original design (Figure 90). The deck was reinforced with two layers of transverse #5 bars
and longitudinal #4 bars.
46' - 10"
10 - #6 bars 8 - #5 bars 10 - #6 bars
8" 8"
Figure 87 – Girder elevation

BD 545-56 Page 76
1" Dia. PT bars (typ)
8" 8"
6" 6"4"6.
5"6"
4"
1'-4"3.5
"
1'-4"
5"4"
2'-1.5
"4"
3'-4"
4"4"
Figure 88 – Cross section and post-tensioning bars details at midspan (left) and end.
4" 4 SP @ 3" 3 SP @ 6"
2 7/16"
6"4"1'
- 4"
2 1/
2"
1" PT BAR
3'-0" 1'-6"
Figure 89 – End block geometry, reinforcement, and PT bar configuration

BD 545-56 Page 77
2 - #4 @ 14"3 - #5 @ 12"
#5 bar @ 12" sp.
#5 bar @ 6" sp.
2' - 4"
7"
Figure 90 – Deck geometry and reinforcement.
6.5 GIRDER CONSTRUCTION Girder construction was performed at the Florida Department of Transportation
Structures laboratory in Tallahassee, Florida. Figure 91 shows the formwork that was fabricated
using welded steel panels. The bottom form was placed on the top flange of a steel I-beam,
which served as a base during construction. After erecting one side of the formwork, mild steel
cages (Figure 92) were placed in the end block at each end of the girder. The cages were
fastened to the formwork and rested on chairs to keep them in place while concrete was placed
(Figure 93). Single post-tensioning bars were placed in 40-mm diameter galvanized steel duct
(Figure 94). The ducts were fastened to the formwork and strapped to chairs at incremental
points along the girder length to maintain the parabolic or straight configuration during casting.
Plywood bulkheads were positioned to enclose the ends of the forms.
Figure 91 – Welded steel girder formwork

BD 545-56 Page 78
Figure 92 – End block reinforcement cage.
Figure 93 – End block reinforcement resting against a chair.
Figure 94 – Galvanized steel duct, HDPE duct at anchor plate, and HDPE grout tubes.

BD 545-56 Page 79
Anchorage bearing plates consisted of 1.75 in. x 6 in. x 10 in. steel plates with
countersunk, conical-shaped holes (Figure 94). The PT bars were anchored with coarse
threaded, dome-shaped nuts to maintain bar alignment relative to the anchor plate (Figure 95).
After installing bulkheads and anchorages at each end of the girder, ducts were installed from
anchorage to anchorage along with tubes and vents necessary to facilitate grouting. Strain gages
were applied to the prestressing bars as detailed in the instrumentation section. Holes were cut
into the duct near the gages to allow connecting wires to pass through and the bars were inserted
into the duct. The holes were sealed and the wires were arranged to exit formwork (Figure 96).
U-bars were tied to a longitudinal bar placed near the top of the girder (Figure 97). The opposite
form was then installed with all-thread rod used as form ties. Final adjustments in duct and
reinforcement were made after the form ties were in place.
Figure 95 – Bottom anchorage including anchor plate, conical nuts, PT bar, and grouting tubes.

BD 545-56 Page 80
Figure 96 – Strain gages leads exiting duct.
Figure 97 – U-bar positioning.
Table 16 – Construction chronology.
Girder Cast Girder Post-Tension Grout Cast Deck Load Test C1 12-5-07 12-10-07 12-10-07 1-15-08 2-20-08 C2 1-30-08 2-5-08 2-5-08 3-26-08 4-30-08 C3 4-11-08 4-16-08 4-16-08 6-2-08 7-25-08
The girders were cast using ready mix concrete that was bucketed to the form using the
laboratory crane (Figure 98). The water cement ratio was 0.41 and the aggregate was ¾ in.
Florida Limestone. One truckload of concrete was needed for each girder. Twelve cylinders
were taken to test concrete compressive strength. PT bars were stressed after cylinders tested at

BD 545-56 Page 81
3600 psi or greater, which was typically in 3 to 5 days. Stressing of PT bars is described in the
following section.
The PT ducts were grouted immediately after stressing using a portland cement and water
mixture with a water-to-cement ratio of 0.45. Mixing was done in a 5-gallon bucket and injected
into the duct using a hand pump (Figure 99). Grout was injected from one end of the girder and
was continuously pumped until the discharge at the opposite end indicated that air and water had
been removed.
Figure 98 – Girder concrete placement.
Figure 99 – Grout injection using hand pump.

BD 545-56 Page 82
After grouting, the deck formwork and mild steel reinforcement were placed (Figure
100). As with the girder, concrete for the deck was delivered using the laboratory crane. The
finished girder is shown in Figure 101.
Figure 100 – Deck formwork and mild steel reinforcement.
Figure 101 – Finished girder and deck.
6.6 PRESTRESSING
6.6.1 PRESTRESSING APPLICATION A 60 Mp Series 04 hydraulic jack was used to stress the PT bars (Figure 102). This jack
is a 80 ton hydraulic actuator designed to stress a single threadbar. The jack was fitted with a

BD 545-56 Page 83
socket at the nose that fits the PT bar nut and can tighten just prior to release. The target
prestress force for each bar was 93 kips and was measured with a load cell placed between the
PT nut and jack. The PT bars were stressed with the jack located at the North end of the girder.
To avoid exceeding allowable concrete stresses, the bars were stressed in two stages in
the following order: 2,3,1,4 (Figure 103). The first stage consisted of stressing each PT bar to
50% of the desired final stress in the order indicated. The stressing sequence was then repeated
to reach the final desired stress. Table 17 shows the jacking force at each stage for each girder as
measured by the load cell.
Figure 102 – Hydraulic jack used to stress PT bars.
Bar 1Bar 2
Bar 4Bar 3
Figure 103 – PT bar designation for C girders.

BD 545-56 Page 84
Table 17 – Jacking force measured with load cell.
Jacking Force (kip) Stage C1 C2 C3 1 46.7 45.7 46.7 2 94.5 93.4 93.5
6.6.2 INSTRUMENTATION Strain gages were applied to the PT bars to measure prestress losses during and after
stressing, and stresses in the bars during load testing. Tandem gages were placed on the bars
near each end of the girder (Figure 104). The gages were placed in diametrically opposed
positions on the bar to account for possible bending stresses in the bar. Stresses were calculated
by multiplying the measured strains by Young’s modulus. Some of the gages were damaged
during installation and prestressing of the PT bars. Table 18 shows the surviving strain gages for
C1 and C2. None of the gages in C3 survived or provided data that could be used to measure
stresses.
P13 & P14
P9 & P10
P5 & P6
P1 & P2
P15 & P16
P11 & P12
P7 & P8
P3 & P4
BACK BAR
FRONT BAR1' - 0" +-
1' - 0" +-
Figure 104 – Location of gages for C girders.
Table 18 – Working P-gages for each C girder.
C1 C2 P11 P3 P12 P9 P14 P10 P15 P13 P16 P14
6.6.3 RESULTS – ANCHORAGE SET Measurements were taken during post-tensioning to determine anchorage set, elastic
losses, friction losses and early creep losses. Anchorage set in prestressing bar anchorages occur
when the bar is released and the anchor nut settles against the anchor plate. Further set occurs as

BD 545-56 Page 85
the anchorage components deform during transfer. As the PT bar was being stressed, the anchor
nut was tightened to minimize the take up when the bar was released.
Anchorage set can be measured by observing the change in strain as the prestress is
transferred. Strain data from the gages located nearest the stressing end of the girder will more
accurately show anchorage set because the strain gages at the dead end will be affected by
friction losses from wobble or drape. Figure 105 and Figure 106 show a time trace of the stress
in each PT bar during prestressing of girder C1. The stress was calculated from strain data using
a Young’s modulus of 29,700 ksi (as recommended by the bar manufacturer). The plots display
only the data from strain gages that were operating properly and include the average of each
tandem pair of strain gages when both were operating correctly and single readings when only
one of the gages was working properly. The plots illustrate the staging used to stress the PT
bars. Each PT bar was initially stressed to approximately half of the target prestress, followed by
another round of prestressing to reach the target prestress.
Time (seconds)
Stre
ss (k
si)
Stre
ss (M
Pa)
0 500 1000 1500 2000 25000
20
40
60
80
100
120
0
150
300
450
600
750C1U3P11C1U3P12C1U3P14C1U3P15C1U3P16
Figure 105 – PT bar stress during post-tensioning of girder C1.

BD 545-56 Page 86
Time (seconds)
Stre
ss (k
si)
Stre
ss (M
Pa)
0 500 1000 1500 2000 2500 30000
20
40
60
80
100
120
0
150
300
450
600
750C2U3P3C2U3P9C2U3P10C2U3P13C2U3P14
Figure 106 – PT bar stress during post-tensioning of girder C2.
Figure 107 illustrates how elastic losses and anchorage set were determined from the
strains measured in the bars during post-tensioning. The graph shows the plot of the average
strains from two tandem strain gages converted to stress. As noted on the plot, anchorage set
was the immediate reduction in stress as the prestress force was transferred from the jack to the
anchorage. The three subsequent sharp drops in stress are the elastic losses caused by stressing
each of the adjacent PT bars. The shallower downward trends indicate initial creep losses.
The jacking stresses and loss in stress due to anchorage set are summarized in Table 19.
The anchorage sets for girder C1 bars 3 and 4, and girder C2 bar 1 were measured using strain
gages at the stressing end of the girder. Anchorage set losses for bars 3 and 4 in girder C2 were
measured using the strain gages at the dead end. In addition, Table 17 also shows the prestress
loss as a percentage of the jacking stress for both stages. Anchorage set losses for the straight PT
bars (3 and 4) were consistently in the range of 2% regardless of the jacking stress. The
parabolic PT bar, however, had anchorage set losses 2 to 3 times this value. This may be due to
the difficulty in maintaining proper alignment of the bar and nut with the anchor plate when the
anchor plate is not perpendicular to the girder axis.

BD 545-56 Page 87
Time (seconds)
Stre
ss (k
si)
0 500 1000 1500 200040
42
44
46
48
50Average Stress in C1 Bar 3
Seating Loss
Elastic Loss
Creep
Figure 107 – Measurement of anchorage set, short term creep, and elastic loss.
Table 19 – Measured changes in stress due to anchorage set.
Jacking Stress (ksi)
Anchorage Set Loss (ksi)
Prestress Loss (%)
Bar Stage
C1 C2 C1 C2 C1 C2 1 --- 44.6 --- 3.13 --- 7.3 1 2 --- 103.9 --- 4.46 --- 4.5 1 50.6 52.0 1.0 0.74 2.1 1.5 3 2 104 103 1.3 0.47 1.3 0.5 1 50.0 55.8 1.4 1.50 2.4 2.8 4 2 107 107 2.2 2.46 2.1 2.4

BD 545-56 Page 88
1 2 3 4Tendons
Pre
stre
ss L
oss
(%)
0
1
2
3
4
5
6
7
8
9
10C1 Stage 1C2 Stage 1C1 Stage 2C2 Stage 2
Figure 108 – Summary of anchorage sets.
The anchorage set at the stressing end anchorage was calculated using this sudden change
in strain and multiplying it by the length of the PT bars, 46 ft-10 in. and are presented in Table
20. Typical anchorage set can be about 0.03 in. but varies depending on the type of anchorage
(Lin and Burns 1981).
Table 20 – Measured anchorage set.
Stage 1 (in.) Stage 2 (in.) PT bar C1 C2 C1 C2
1 --- 0.06 --- 0.09 3 0.02 0.02 0.02 0.01 4 0.03 0.03 0.04 0.05
Table 21 shows the elastic losses due to stressing of adjacent PT bars. The change in
strain for each PT bar was measured as each of the following bars in the sequence was stressed.
For example, during stage 1 stressing of bar 4 in girder C1, the measured decrease in stress of bar
3 was 1.8 ksi. The attendant loss of prestress was 3.9% based on the stress in bar three just prior
to stressing bar four. In general, the highest losses were observed during the stressing (jacking)

BD 545-56 Page 89
of immediately adjacent PT bars. For instance, the loss in stress in bar 3 was greatest when bar 4
was being jacked.
Using the LRFD method for calculating losses due to elastic shortening, a loss of 2.6 ksi
was predicted for the first and second stage. A comparison could not be made due to a lack of
data.
Table 21 – Elastic losses for C girders.
Stage 1 Stage 2 C1 C2 C1 C2
PT bar Jacking PT bar
Δf (ksi)
Loss (%)
Δf (ksi)
Loss (%)
Δf (ksi)
Loss (%)
Δf (ksi)
Loss (%)
1 4 --- --- 0.51 1.3 --- --- 0.46 0.5 3 1 0.9 2.0 0.81 1.7 1.1 1.1 1.21 1.2 3 4 1.8 3.9 1.75 3.4 2.4 2.4 1.91 2.0
Pre
stre
ss L
oss
(%)
0
2
4
6
8
10
12
14C1C2
1 2 3 4Tendons
Figure 109 – Summary of elastic losses.
Wobble in a straight duct will generate friction, which will cause a reduction in the post-
tensioning force as the distance from the jacking location increases. The wobble coefficient was
calculated for PT bar 4 in C1 by determining the difference between the bar stress (using the
strain gages) at the jacking end and dead end of the PT bar. A wobble coefficient of 0.0007 per

BD 545-56 Page 90
ft was then back-calculated. ACI gives a range for the wobble coefficient of 0.0001 to 0.0006
for high-strength bars grouted in metal sheathing.
To observe time-dependent losses, PT bar stresses in C2 were measured for
approximately 2.5 days after stressing (Figure 110). The losses due to creep and shrinkage
effects were 6.3 and 5.6 percent (See Table 22) for this short period of measurement. For
comparison, a loss of 1.7% was obtained using the LRFD method for calculating shrinkage and
creep losses.
Time (seconds)
Stre
ss (k
si)
Stre
ss (M
Pa)
0 50000 100000 150000 200000 2500000
20
40
60
80
100
120
0
150
300
450
600
750
C2U3P3C2U3P13C2U3P14
Figure 110 – Time dependent strains in girder C2.
Table 22 – Time-dependent losses in C2.
PT bar Δf (ksi) %loss 1 5.99 6.3 4 5.52 5.6

BD 545-56 Page 91
6.7 MATERIAL PROPERTIES Cylinder tests were conducted to determine the concrete compressive strength of the
girder and the deck. The average strengths for the girder and deck are presented in Table 23.
Samples of the post-tensioning bars were also taken and tested, their average material properties
are presented in Table 24.
Table 23 – Average cylinder strength (ksi).
Girder Girder Deck C1 7.96 3.34 C2 8.64 5.47 C3 8.64 4.89
Table 24 – PT bar material properties.
EUL @ 0.50% Stress (ksi) 140.2 Tensile Strength (ksi) 169.9
Elongation (%) 7.8
6.8 TEST SETUP AND PROCEDURES Three tests were conducted using a three point loading scheme shown in Figure 111.
Two tests were conducted using a shear span to depth (a/d) ratio of 3.0. One of these tests
(C1U3) was set up with the girder bearing directly on the concrete pedestal support (Figure 112).
The second test (C2U3) was set up with the girder bearing on 2-in. thick neoprene pads. Bearing
conditions were varied to observe their effects on girder behavior. The third girder (C3U2) was
loaded at a/d = 2.0 and was supported on neoprene pads. This test was conducted to evaluate the
girder shear behavior with a short shear span and with no shear reinforcement.
4" 4"
9"2'
- 9"
9"2'
- 9"
46' - 10"
a
LVDT
LVDTLVDT
LVDT
Load Cell
Figure 111 – Test setup and instrumentation for C girders.

BD 545-56 Page 92
Figure 112 – Support Conditions, C1U3 (Left) and C2U3 (Right)
The load was applied by an actuator through a 1.5-in. thick x 10 in. x 20 in. (20 in.
dimension perpendicular to length of girder) reinforced neoprene bearing pad at a loading rate of
0.25 kips/second. For tests with neoprene bearing pads at the supports, the pad dimensions were:
2 in. x 8 in. x 16 in. (16-in. dimension perpendicular to length of girder). A load cell was used to
measure load under the actuator. Displacements were measured at the load point and each of the
supports. Horizontal movement of the girder was measured at the top and bottom. The detailed
instrumentation for each test is shown in Figure 113 through Figure 115. Strain was measured
with 60-mm strain rosettes and strain gages. For test C2U3, five 30-mm strain gages were used
in the deck and top flange of the girder in addition to the 60-mm gages. Test C3U2 used sixteen
30-mm strain gages in the top flange and deck of the girder in addition to the 60-mm gages.

BD 545-56 Page 93
4" 4"
9"2'
- 9"
9"2'
- 9"
46' - 10"
12' - 1"
L1
L2
L3
L4
L5 L8
L6 and L7 on each side of load plate
(a)
1"6" 4"
10"
2' - 8
" 1' - 7
"
3' - 1
0"
1' - 10"1' - 1"
2' - 7"7' - 10"
10' - 1"11' - 1"
12' - 1"
S14S13S12
S10 S11S9 R7
R6
R5
R4
S16S15
S8S7S6R3R2R1S5S4S3
S1 S2
Top View at Load Point
1' - 1
"1'
- 2"
DECK/GIRDERINTERFACE
(b)
Figure 113 – Test C1U3 (a) setup (b) instrumentation.

BD 545-56 Page 94
4"
9"2'
- 9"
9"2'
- 9"
46' - 10"
12' - 1"
L1
L2
L3
L4
L5 L6 L10
L7 and L8 on each side of load plate
L9
10' - 7"
13' - 7"
4"
(a)
10' - 1"11' - 1"
12' - 1"13' - 1"
14' - 1"15' - 1"
1' - 1
0"9' - 1"
20' - 0"
S15S14S13
R2R1R3
S6S5S4S1S2S3
S29
S31
S30
S26
Top View at Load PointS2
8
S27 S20
S19
S17S18
2' - 6"
6"6"
S21
S22
S23
S24
S25
2"2"2"2"2"
DECK
NOTE
NOTE
S10
S12
S11S9 S7S8
1' - 2"2' - 2"
3' - 2"
10"1' - 10"
2' - 10"
1' - 1
"1'
- 2"
S16
DECK/GIRDERINTERFACE
(b)
Figure 114 – Test C2U3 (a) setup (b) instrumentation.
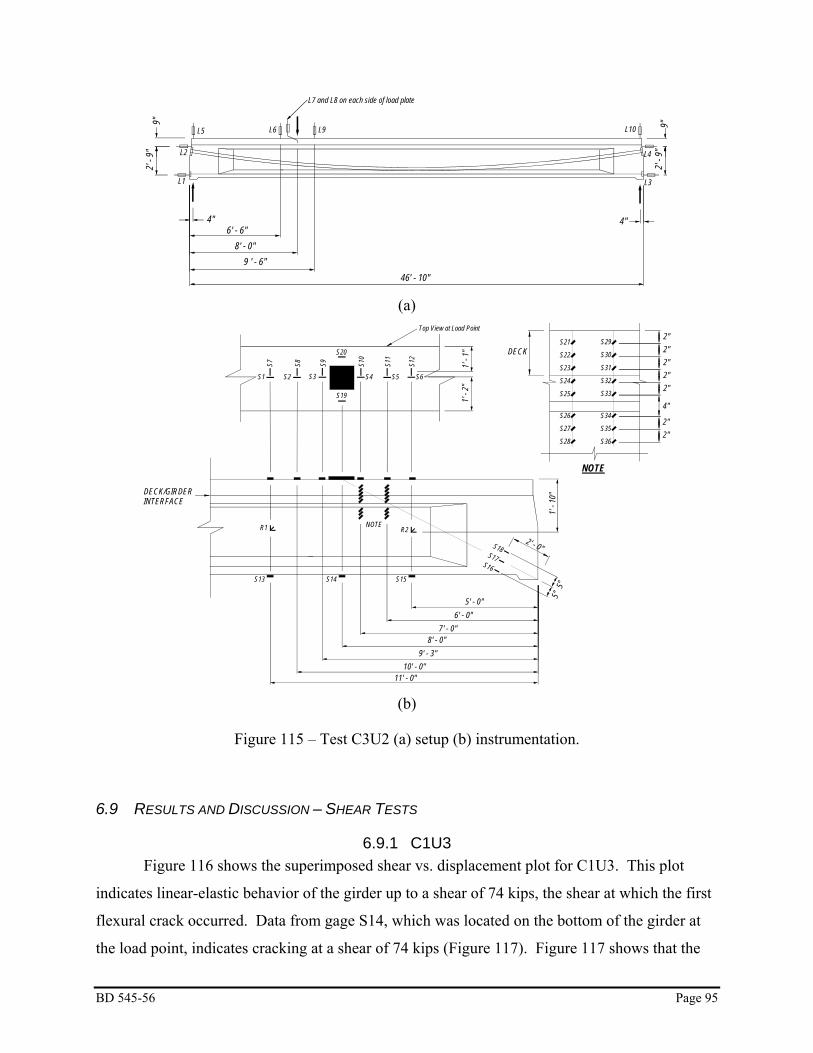
BD 545-56 Page 95
4"
9"2'
- 9"
9"2'
- 9"
46' - 10"
8' - 0"
L1
L2
L3
L4
L5 L6 L10
L7 and L8 on each side of load plate
L9
6' - 6"
9 ' - 6"
4"
(a)
6' - 0"7' - 0"
8' - 0"9' - 3"
10' - 0"11' - 0"
1' - 1
0"
5' - 0"
S15S14S13
R2R1
S17
S8S7
S2S1
S9
S3
S10
S4S1
1S5
S12
S6
S20
S19
Top View at Load Point
5"5"
S18
S16
2' - 0"
S29
S30
S31
S32
S33
2"2"2"2"2"
DECK
NOTE
NOTE
1' - 1
"1'
- 2"
DECK/GIRDERINTERFACE
S21
S22
S23
S24
S25
4"
2"2"
S26
S27
S28
S34
S35
S36
(b)
Figure 115 – Test C3U2 (a) setup (b) instrumentation.
6.9 RESULTS AND DISCUSSION – SHEAR TESTS
6.9.1 C1U3 Figure 116 shows the superimposed shear vs. displacement plot for C1U3. This plot
indicates linear-elastic behavior of the girder up to a shear of 74 kips, the shear at which the first
flexural crack occurred. Data from gage S14, which was located on the bottom of the girder at
the load point, indicates cracking at a shear of 74 kips (Figure 117). Figure 117 shows that the

BD 545-56 Page 96
flexural crack formed at a tensile strain of nearly 400 microstrain. Figure 118 shows the location
of the first crack. As loading continued, further flexure cracks formed under the load point,
resulting in a decrease in stiffness. The girder reached its maximum capacity at a shear of 135
kips where a flexure-compression failure occurred in the deck under the load point. Figure 118
shows the final crack pattern.
Displacement (inches)
Sup
erim
pose
d S
hear
(kip
)
0 0.5 1 1.5 2 2.5 30
25
50
75
100
125
150
Figure 116 – Superimposed shear vs. displacement for C1U3.

BD 545-56 Page 97
Superimposed Shear (kip)
Stra
in (m
icro
stra
in)
0 25 50 75 100 125 150-500
-400
-300
-200
-100
0
100
200
300
400
500
S14
Figure 117 – C1U3S14 plot.
Figure 118 – First and final crack pattern for C1U3.
6.9.2 C2U3 The initial behavior of C2U3 was similar to C1U3 up to and including cracking. Figure
119 shows linear elastic behavior up to a load of 74 kips where the first flexural crack occurred.
The crack was detected by gage S14, which was located on the girder bottom under the load
point (Figure 120). Although the initial strain at S14 was linear, a soften behavior occurred as
the shear approach the cracking shear of 74 kips. At this shear, S14 reported a spike in strain.
Figure 121 shows the location of the first crack.

BD 545-56 Page 98
Figure 119 shows a decrease in stiffness at a shear of approximately 92 kips as indicated
by the decrease in the slope of the load displacement curve. As loading continued, the curve
eventually reached a plateau, indicating yielding of the PT bars. The girder reached its
maximum capacity at a shear of 127 kips where a flexure-compression failure occurred in the
deck under the load point. Figure 121 shows the final crack pattern.
Displacement (inches)
Sup
erim
pose
d S
hear
(kip
)
0 1 2 3 4 5 60
25
50
75
100
125
150
Figure 119 – Superimposed shear vs. displacement for C2U3.

BD 545-56 Page 99
Superimposed Shear (kip)
Stra
in (m
icro
stra
in)
0 50 100 150-1000
-750
-500
-250
0
250
500
750
1000
S14
Figure 120 – C2U3S14 plot.
Figure 121 – First and final crack pattern for C2U3.
6.9.3 C3U2 Figure 122 shows the superimposed shear vs. displacement plot for test C3U2. The plot
indicates linear elastic behavior up to a shear of 87 kips. The initial crack (Figure 123) was
visually observed at this load and was confirmed by data from strain gage S14 (Figure 124). As
demonstrated by the abrupt changes in strain shown in Figure 124, additional cracks formed at
109 kips (S13) and at 156 kips (S15). The shear displacement curve (Figure 122) shows a
reduction in stiffness over this same range of loads. At a shear of 156 kips, a large crack was
observed to have formed, which extended from the tension face below the end block up into the

BD 545-56 Page 100
web (Figure 125). At a displacement of approximately 1.5 in., the curve had reached a plateau
with little increase in shear relative to displacement, indicating that the PT bars had yielded.
Cracks were observed around the anchor plate of the parabolic PT bars at a shear of 187
kips (Figure 126). The test was terminated at this point to avoid an explosive failure. The final
crack pattern can be seen in Figure 123. The peak load measured during testing was 187 kips.
The final failure mode, however, was not determined because the test was terminated prior to
reaching the peak capacity.
Displacement (in.)
Sup
erim
pose
d S
hear
(kip
)
0 0.5 1 1.5 2 2.5 30
50
100
150
200
Figure 122 – Superimposed shear vs. displacement for C3U2.
Figure 123 – First and final crack pattern for C3U2.
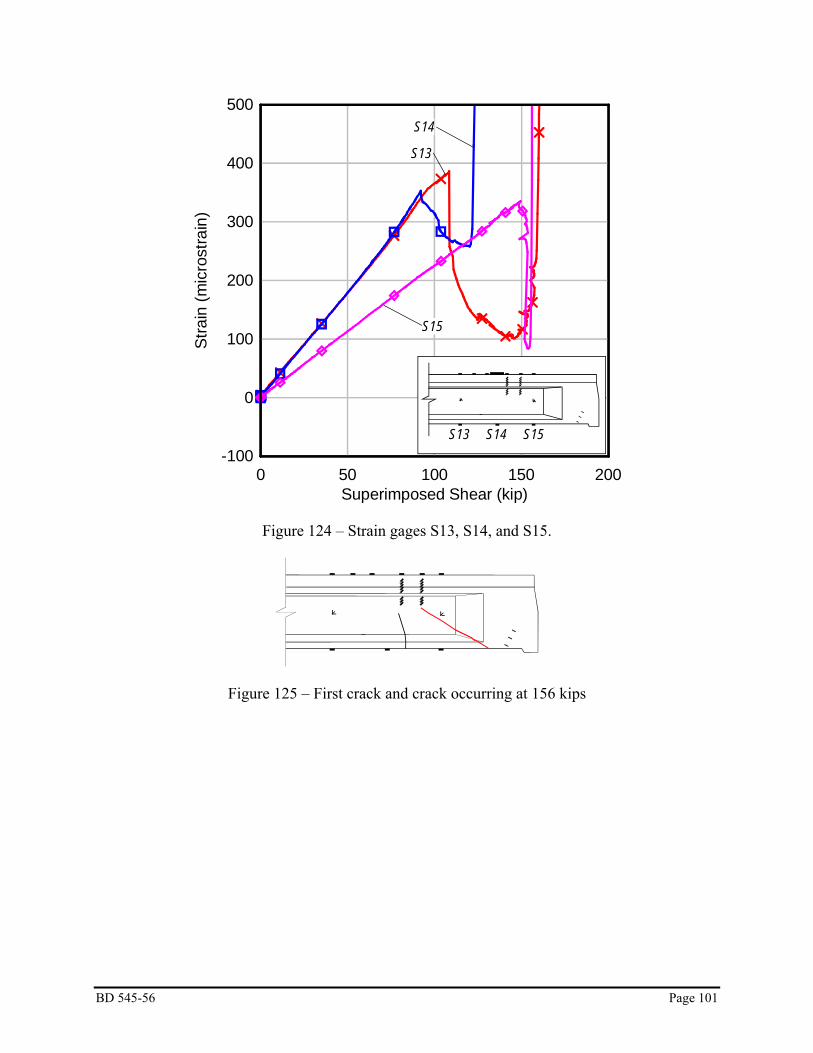
BD 545-56 Page 101
Superimposed Shear (kip)
Stra
in (m
icro
stra
in)
0 50 100 150 200-100
0
100
200
300
400
500
S15S14S13
S13
S14
S15
Figure 124 – Strain gages S13, S14, and S15.
Figure 125 – First crack and crack occurring at 156 kips

BD 545-56 Page 102
Figure 126 – Cracks around PT anchorage.
6.10 EFFECT OF SUPPORT CONDITIONS ON BEHAVIOR Tests C1U3 and C2U3 were conducted with a shear span to depth ratio (a/d) of 3.0. The
first test, C1U3, used support conditions shown in Figure 127 in which the girder was bearing
directly on concrete. The second test, C2U3, used neoprene pads under each of the supports
(Figure 128). Both tests had the same loading scheme and loading rate, the support conditions
were the only variable between the two tests. The intent of the test was to explore the difference
in behavior between the two support conditions. This information will be useful in the
interpretation of data from future bridge tests.
Concrete Block
FloorTies for Concrete Blocks
(a) (b)
Figure 127 – Support condition for C1U3.

BD 545-56 Page 103
Concrete Block
Floor
Neoprene Pad
(a) (b)
Figure 128 – Support condition for C2U3.
Beams are typically modeled assuming that the beam is supported by a pin and roller,
which offers no resistance to elongation of the bottom of the beam. Conversely, arches are
modeled with pinned supports, which provide an infinitely stiff support and ensure pure arching
action. These modeling choices are made with the understanding that the actual conditions are
situated somewhere between these bounds. Shallow arches require very stiff support conditions
to ensure pure compression. Furthermore, very small transverse movements at the support will
shift the behavior from arching to flexure.
To estimate the magnitude of load that must be resisted by the supports in the laboratory,
the girder specimen was modeled using membrane elements as shown in Figure 129. A
rectangular cross-section was used with a thickness of 17 in., which is the average thickness of
the specimen. Each element was 5.8-ft long by 3.92-ft deep. A modulus of elasticity of 4030 ksi
was used, which corresponds to a compressive strength of 5 ksi. The transverse and vertical
reactions for a unit load required to maintain pure arching are shown in Figure 129.
1
0.250.751.671.67
Figure 129 – Computer model of girder C at an a/d ratio of 3.0.
While pure arching was not expected to occur using the tested support conditions, some
arching effect was anticipated. Figure 130 shows the expected restraint provided by the supports
used in the testing. For the direct bearing condition, the transverse reaction is expected to be a

BD 545-56 Page 104
function of the frictional force generated by the direct concrete contact. For the condition with
neoprene bearing pads, the reaction is expected to be a function of the neoprene shear stiffness
and the transverse displacement of the bottom of the girder. Figure 131 defines the transverse
support displacement.
P
HL=mRLor
HL=DLKNEOPRENE
RL
HR=mRRor
HR=DRKNEOPRENE
RR
Figure 130 – Horizontal reactions generated by the varying support conditions.
DRDL Figure 131 – Definition of transverse support displacements
Figure 132 shows the effect of the transverse reactions on the internal forces. The tension
force (T) required to maintain equilibrium is reduced as the reaction (HL ) increases. T will go to
zero if the horizontal stiffness of the reaction is sufficiently high.
RL
HLT
C + HL
P
(a) (b)
Figure 132 – Effect of support restraint on the girder capacity.

BD 545-56 Page 105
The overall behavior of tests C1U3 and C2U3 are illustrated in Figure 133. As discussed
previously, the shear at which cracking occurred was approximately 74 kips for both tests.
Furthermore, the behavior up to cracking appears similar between the two girders, indicating that
the different support conditions had little effect before the girder cracked. This lack of difference
is likely due to the relatively small amount of support movement needed to relieve arching action
before cracking occurs.
Figure 134 shows the flexural tensile strain under the load point and the total lateral
displacement of the girder bearing (ΔT) defined as:
RLT Δ+Δ=Δ Eqn. 4
where the variables are defined in Figure 131. The total transverse movement of the bearings on
both girders was nearly identical up to cracking. The total movement measured for C1U3 and
C2U3 at a superimposed shear of 70 kips was 0.080 and 0.085 inches respectively.
For comparison, one of the transverse support restraints was removed from the model
shown in Figure 129 to determine the total transverse movement expected. The resulting total
movement was 0.108 in., which is comparable with the experimental values. For the direct
concrete bearing condition, it is suspected that support blocks settled as load was applied, which
relieved the arching action prior to cracking. Furthermore, the movement was so small that the
neoprene bearing pad generated little transverse reaction. In conclusion, the bearing conditions
used in these tests appear to have had little effect on the behavior of the girders under service
level loads (before cracking). This behavior is expected from girders in the field with similar
bearing conditions.

BD 545-56 Page 106
Displacement (inches)
Sup
erim
pose
d S
hear
(kip
)
0 1 2 3 4 5 60
50
100
150
C1U3C2U3
Figure 133 – Load vs. displacement for C1U3 and C2U3.
Superimposed Shear (kip)
Stra
in (m
icro
stra
in)
DT (
inch
es)
0 50 100 150-1000 -2
-500 -1
0 0
500 1
1000 2
S14 for both C1 and C2
StrainC1U3
StrainC2U3
DTC2U3
DTC1U3
Figure 134 – Plot of C1U3S14, C2U3S14, total bottom displacement for C1U3 and C2U3.

BD 545-56 Page 107
Girder behavior began to diverge at loads beyond cracking (Figure 133). The direct
bearing test (C1U3) had a higher post-cracking stiffness and had a 6.8% higher capacity than that
of the neoprene bearing test (C2U3). The ultimate displacement, however, was approximately
59.0% of the neoprene bearing test.
Evidence of post-cracking bearing restraint is seen in the divergence of ΔT as ultimate
capacity is approached (Figure 134). After cracking, the total outward support movement of
C2U3 was greater than that of C1U3 indicating that the transverse force generated at the support
for C1U3 was beginning to affect the behavior. This difference is an indication that the frictional
force generated was greater than that provided by the neoprene bearing pads. In conclusion, the
direct contact bearing provided more restraint than that of the neoprene bearing pad, thus
resulting in higher capacity and less ductility.
6.11 STRUT AND TIE ANALYSIS - C3U2 Figure 122 is the superimposed shear vs. displacement plot for test C3U2. This plot
demonstrates that the girder behaved linear-elastically until a shear of 86 kips. Flexural cracks
were observed at loads greater than 86 kips. Strain gages S13, S14, and S15 were located on the
bottom of the girder and provide information on the initial flexure cracks (Figure 124). A large
crack was observed running through the web and into the transition zone between the web and
the end block at a shear of 153 kips (Figure 125). After this crack occurred, the girder ceased
flexural behavior and commenced strut and tie behavior.
Because the region under examination is a disturbed region, strain profiles at increasing
loads were plotted in Figure 135 to evaluate the effect. The plot shows that the overall strain
profile is unaffected by the flexural cracking that occurred at lower loads under the load point
and by the proximity of the load and reaction points. As the shear increases, the strain profiles
appear to be unaffected until a shear of 153 kips is reached where the strain profile is then
distorted due to the nearby cracks that formed.
This is also confirmation that the girder had full composite action between the deck and
girder, that beam theory applies, and the section behaved as a B-region. B-regions typically
begin at a distance of one member-depth away from a discontinuity. This distance is used as a
guideline and is not precise. The load point for this test lies at approximately one member –
depth away from the transition between the end block and the I-shape in the section.

BD 545-56 Page 108
Figure 136 shows a proposed strut and tie model to describe the behavior of the girder as
it reaches ultimate capacity. Strut and tie models are only valid for concrete that has cracked and
is on the verge of ultimate capacity. As indicated above, the strain profile became nonlinear with
the formation of a significant crack at a shear of 153 kips. Figure 137 shows strain vs. shear data
from gages S5 and S6, which were located on the top of the deck. Strain at S5 and S6 grew
constantly in compression until a shear of 153 kips, where the strain suddenly dropped. Data
from S18, which is aligned with the proposed strut near the support is also shown in Figure 137.
The sudden drop in strain at gages S5 and S6, is coincident with a jump in compressive strain at
gage S18, which is believed to indicate the change from beam behavior to strut and tie behavior.
Strain (microstrain)
Hei
ght f
rom
Bot
tom
of B
eam
(in)
-300 -200 -100 0 100 200 3000
10
20
30
40
50 153 kip 120 kip 80 kip 0 kip
Strain Plot
Figure 135 – Change in strain as loading.
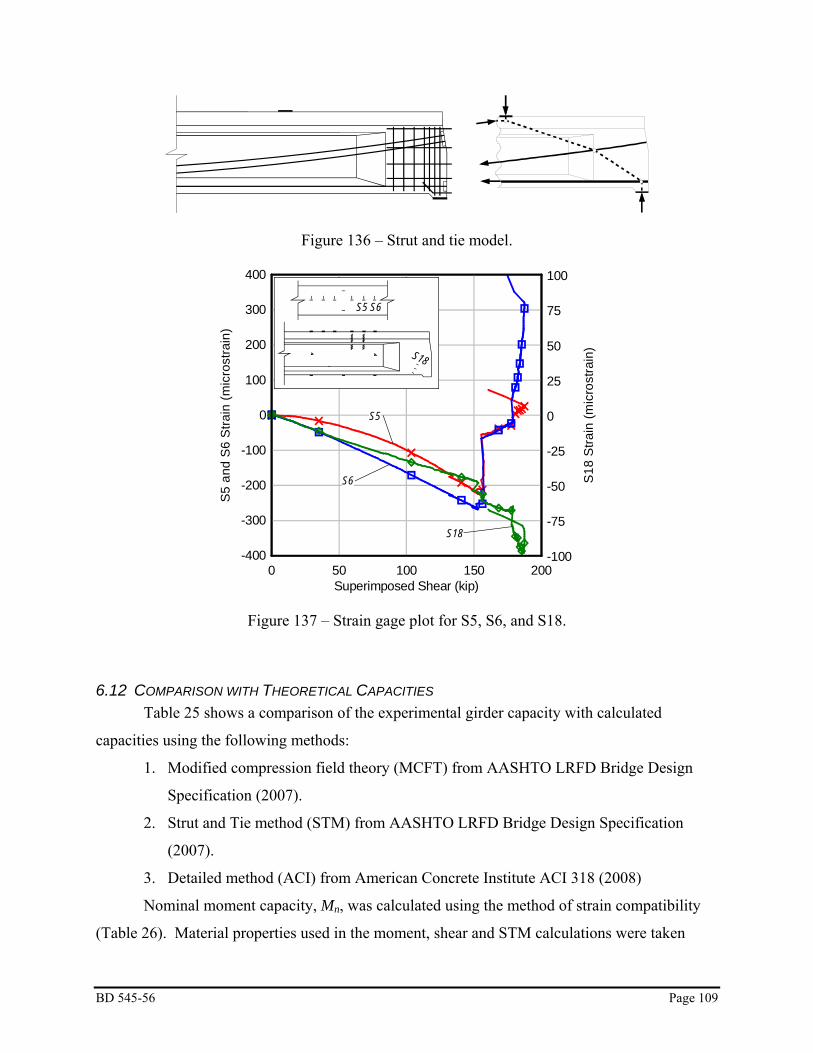
BD 545-56 Page 109
Figure 136 – Strut and tie model.
Superimposed Shear (kip)
S5
and
S6
Stra
in (m
icro
stra
in)
S18
Stra
in (m
icro
stra
in)
0 50 100 150 200-400 -100
-300 -75
-200 -50
-100 -25
0 0
100 25
200 50
300 75
400 100
S5 S6
S18
S5
S6
S18
Figure 137 – Strain gage plot for S5, S6, and S18.
6.12 COMPARISON WITH THEORETICAL CAPACITIES Table 25 shows a comparison of the experimental girder capacity with calculated
capacities using the following methods:
1. Modified compression field theory (MCFT) from AASHTO LRFD Bridge Design
Specification (2007).
2. Strut and Tie method (STM) from AASHTO LRFD Bridge Design Specification
(2007).
3. Detailed method (ACI) from American Concrete Institute ACI 318 (2008)
Nominal moment capacity, Mn, was calculated using the method of strain compatibility
(Table 26). Material properties used in the moment, shear and STM calculations were taken

BD 545-56 Page 110
from the concrete cylinder and PT bar test data as follows: 4.0 ksi compressive strength of
concrete topping slab, 8.1 ksi compressive strength of the concrete girder, 170 ksi ultimate
strength of PT bars, and 29,700 ksi Young’s modulus of PT bars. The concrete compressive
strengths are representative of the range of tested values. A Ramberg-Osgood equation was fit to
the stress-strain curve for use in the strain compatibility calculations. Based on the experimental
data, 11% was used for the initial losses. Based on the AASHTO equation, 33% was used for
the long term losses.
Data gathered and observations made during testing indicate that the girders had reached
(or nearly reached) their flexural capacity. This is corroborated by the large difference between
the tested capacity and calculated shear capacities. Consequently, the experimental capacities
shown in Table 25 provide a lower bound strength for comparison with the calculated strengths.
The STM procedure was applied only to the a/d=2 test. The STM in Figure 138 shows
the internal forces in the girder at capacity. Based on the load displacement curve, it is thought
that the PT bars had reached yield before loading was terminated, which simplified determining
the force in the bars. Consequently, it was assumed that the PT bars controlled the capacity
rather than the nodal regions and struts. This assumption established the force in the PT bars at
yield or beyond, and a stress of 170 ksi was used for the STM. Knowing the forces in the bars
and the reaction at the support, the forces in the struts were found using a truss analysis. The
STM gave the most accurate prediction of capacity, overestimating the capacity by
approximately 8%. This is not surprising, however, because the bars controlled the capacity
similar to that of the flexural capacity.
Table 25 – Comparison of calculated shear capacity with experimental results.
ACI STM MCFT a/d VEXP
(kip) Vn (kip) n
EXP
VV Vn
(kip) n
EXP
VV Vn
(kip) n
EXP
VV
2 196 92 2.13 213 0.92 111 1.77 3 142 66 2.15 --- --- 93 1.53
3 (2nd Test) 133 66 2.02 --- --- 93 1.43

BD 545-56 Page 111
Table 26 – Post-Tensioned girder nominal moment capacities (kip-ft).
a/d Mexp Mn n
EXP
MM
2 1507 1402 1.07 3 1685 1503 1.12
3 (2nd Test) 1587 1503 1.06
Figure 138 – Forces in strut-and-tie model for superimposed load (self-weight not included).
6.13 SUMMARY AND CONCLUSIONS Three girders were constructed and post-tensioned using plans for an existing bridge.
The test girders closely matched a girder design that was used in Florida in the 1950s. The
girders had no shear reinforcement outside of the end block, approximately 3 ft from each end of
the girder. Each girder had two straight PT bars and two parabolic PT bars. The bars were
anchored using 1.75-in. thick steel plates. Post-tensioning stresses were monitored and recorded.
Losses were calculated using strains measured during stressing. Seating and elastic losses were
determined from measured strain data. In addition, creep and shrinkage losses were monitored
for approximately 2.5 days. Losses due to creep and shrinkage were higher than values
calculated using LRFD.
The effect of support conditions on girder behavior was also evaluated. The support
conditions were of interest because existing girders in the field have been observed to bear
directly on concrete. A test was conducted with a shorter a/d ratio to determine the behavior of
the girder subjected to loads near the support. Shear behavior was of interest because the girders

BD 545-56 Page 112
lacked shear reinforcement outside of the end blocks. The lack of shear reinforcement has led to
low ratings for bridges built with this type of girder. Following are the salient findings from the
research:
1. Girders bearing directly on concrete behaved the same as girders bearing on neoprene
pads up until cracking occurred. The girder bearing directly on concrete displayed a 7%
larger capacity than the girder bearing on a neoprene pad. The girder bearing on
concrete, however, displayed nearly half the displacement capacity than that of the girder
on neoprene.
2. Variation of the bearing condition did not change the failure mode, which was a flexural
failure.
3. The girder tested at an a/d ratio of two did not fail in shear, even with the absence of
shear reinforcement.
4. A strut & tie model best represented the behavior of the girder tested with an a/d ratio of
two.
5. The moment capacity of each girder was accurately predicted using the principles of
strain compatibility. The calculated moment capacities were between 6% and 12% lower
than the experimentally determined capacities.

BD 545-56 Page 113
7 OVERVIEW OF MAJOR FINDINGS
The testing reported in the research report focused primarily on the capacity and failure
modes of prestressed concrete girders tested in three-point bending with the load point offset so
as to cause high shear to moment ratios. The objective was to determine the “shear” capacity of
the girders and to determine the behavior mode relative to the models currently available in the
AASHTO LRFD design specifications to predict shear capacity. All of these girder designs (or
very similar designs) are in use in Florida Bridges.
Three different sets of bridge girders were tested. Each had their own unique
configuration. The Type IV girders had a debonding pattern that did not meet LRFD
requirements. The Type III girders used a combination of harped and straight strands with a
precast panel deck system. The PT girders used a bar post-tensioning system that was designed
and installed nearly 40 years ago, and is not currently used in new construction. This design had
no shear reinforcement away from the end block.
The Type IV girders failed due to separation of the bottom bulb flange, which is
described in more detail below and in the report. This premature failure restricted the capacity of
the girder, not allowing it to reach the full shear capacity as predicted by the three code models
in the table. The Type III girders failed from strand slip for a/d up to approximately 3. The
strand slip and ultimate capacity were favorably influenced by vertical and horizontal end block
reinforcement as discussed below. Finally, the PT girders had capacities well beyond those
predicted. Note that the girders were not taken to their full capacity due to lab safety concerns.
Nevertheless, the results indicate that the girder had reserve capacity well beyond that predicted
by the code equations for shear, even though there were no stirrups provided in the web.
7.1 TYPE IV GIRDERS The type IV girders failed in an unusual manner not associated with typical shear or
flexure failure modes. Furthermore, the capacity of the girder was lower than predicted by code
shear models. The early failure of the girder was attributed to two characteristics of the girder
design. One was the irregular debonding pattern that placed fully bonded strands in the flanges
of the bottom bulb and debonded strands under the web. The other was the lack of confinement
steel in the bottom bulb near the support. Figure 139a illustrates the flow of forces as capacity is
imminent in a girder with all strands fully bonded. The strut and tie model shows a diagonal

BD 545-56 Page 114
strut and a longitudinal tie that are typical of a girder with a short shear span. The strut passes
through the web and terminates under the load point at one end and at a node just over the
support at the other end. The tendon forms the tie, which must be anchored into the node over
the support point to ensure equilibrium. The typical mode of behavior for this configuration is
for the strand to slip. This typically occurs when the load point is very near the support, which
results in a short strand development length.
In these test girders, only the strands in the outside portion of the flange were bonded
near the support, and thus able to act as ties as shown in Figure 139b. This resulted in a
disruption of the node at the support point. Because of the offset between the strut in the web
and the two ties in each flange of the bulb (fully bonded strands), secondary struts formed to
transfer the load laterally to the nodes at the ties. Additional secondary struts were essential
between the support and the nodes at the ties to complete the load path to the support. Both pairs
of secondary struts induced horizontal components that acted transverse to the beam. A tension
tie is shown between the flange nodes in the illustration. The test beam, however, lacked
transverse reinforcement that might have held the bulb together after cracking.
(a) (b)
Figure 139 – Strut and tie model for tendon with (a) fully bonded strands and (b) an excessive number of strands debonded under the web.

BD 545-56 Page 115
Figure 140 shows the cracking pattern exhibited by girder A2U1 after reaching capacity.
The girder capacity was controlled by the formation of a large crack at the outer pair of strands in
the bulb flange. It is believed that this crack formed as a result of the transverse tensile stresses
in the concrete resulting from strut divergence shown in Figure 139b. The crack formed at the
edge of the bearing pad. As the crack progressed along the beam it angled toward the web and
terminated at the web at a distance of approximately half the girder depth. This crack caused a
loss of the tie from the outside node, thus resulting in the strand peeling away from the bulb as
indicated by the arrow. This behavior may have caused problems with strand slip measurements,
since the frame supporting the displacement devices was attached to the bulbs.
Figure 140 – Bulb cracking pattern caused by excessive debonding under the web.
7.2 TYPE III GIRDERS As indicated in the summary table, many of the Type III girders with small a/d ratios
failed due to strand slip. Generally, a flexure-shear crack formed near the support that

BD 545-56 Page 116
interrupted the strand development length. Figure 141 shows a plot of shear vs. displacement
and shear vs. strand slip for three selected strands. The first crack formed at 182 kips where a
slight slip in the strands can be seen. Reserve load capacity, however, was provided by the
supplemental vertical and horizontal mild steel reinforcement included in the end region of the
girder. If the girder was constructed without this end reinforcement, it is likely that a mechanism
would have formed and the girder would have been unable to carry additional load. The capacity
would have been dependent solely on the slip resistance of the strand between the crack and the
girder end.
The photograph in Figure 142 shows the girder with the primary crack and the associated
free body diagram with the forces generated when the flexure-shear crack formed. As shown in
the free body diagram, the mild steel reinforcement in the end of the beam is activated when the
crack forms and the strands slip. As the load was increased, however, the steel eventually either
yielded or failed in bond or both. Figure 141 and Figure 142 both exhibit a range between 182
kips and 230 kips where the strand continues to slip and there is a slight loss in stiffness. After
230 kips, though, the strand slip increases markedly and the stiffness begins to decrease rapidly.
This is thought to be where the mild steel reinforcement yielded. Due to the gradual reduction in
stiffness exhibited in the load-displacement plot, it is believed that some of the bars reached
yield. If some or all of the bars had experienced a bond failure, the load displacement would
have indicated a sudden decrease in load.

BD 545-56 Page 117
Superimposed Shear (kip)
Stra
nd S
lip (i
nche
s)
Dis
plac
emen
t at L
oad
(inch
es)
0 50 100 150 200 250 300 350-0.01 -0.1
0 0
0.01 0.1
0.02 0.2
0.03 0.3
0.04 0.4
0.05 0.5
L1L2
L3
Displacement
L1L2
L3
Figure 141 – B1U1 strand slip and displacement.
(a) (b)
Figure 142 – Girder B1U1 (a) photo with the primary crack enhanced and (b) free body diagram including contribution of vertical and horizontal reinforcement

BD 545-56 Page 118
7.3 PT GIRDERS In addition to capacity, the effect of longitudinal support restraint was investigated in the
PT girders (Figure 143). P
HL=mRLor
HL=DLKNEOPRENE
RL
HR=mRRor
HR=DRKNEOPRENE
RR
Figure 143 – Horizontal reactions generated by the varying support conditions.
The overall behavior of tests C1U3 and C2U3 are illustrated in Figure 133. Test C1U3
was placed directly on concrete supports while C2U3 was placed on neoprene. The shear at
which cracking first occurred was approximately 74 kips for both tests. Furthermore, the
behavior up to cracking appears similar between the two girders, indicating that the different
support conditions had little effect before the girder cracked. This lack of difference is likely due
to the relatively small amount of support movement needed to relieve arching action before
cracking occurs. Post-cracking behavior diverges for the two girders. The girder supported on
concrete continues to a peak capacity slightly larger (about 6.5%) than that of the girder on
neoprene. The girder on neoprene, however, appears to have nearly twice the displacement
capacity of the girder bearing directly on concrete.

BD 545-56 Page 119
Displacement (inches)
Sup
erim
pose
d S
hear
(kip
)
0 1 2 3 4 5 60
50
100
150
C1U3C2U3
Figure 144 – Load vs. displacement for C1U3 and C2U3.

BD 545-56 Page 120
8 REFERENCES
AASHTO LRFD Bridge Design Specifications, American Association of State Highway
Transportation Officials, Washington, DC, 2007.
AASHTO Standard Specifications for Highway Bridges, American Association of State
Highway Transportation Officials, Washington, DC, 2002.
ACI 318, Building Code Requirements for Structural Concrete and Commentary,
American Concrete Institute, Farmington Hills, MI, 2008.
Alshegeir, A. and Ramirez, J. (1992). “Strut-Tie Approach in Pretensioned Deep
Beams.” ACI Structural Journal. 89(3), May-Jun, 296-304.
Avendano, A. R. and Bayrak, O. B. (2008). “Shear Strength and Behavior of Prestressed
Concrete Beams,” University of Texas at Austin, report IAC-88-5DD1A003-3, Sep 2008, 170
pp.
Bakht, B. and Jaeger, L. (1988). “Bearing Restraint in Slab-on-Girder Bridges.” Journal
of Structural Engineering. 114(12), Dec, 2724-2740.
Brown, M. D., Bayrak, O., and Jirsa, J. O., (2006). “Design for Shear Based on Loading
Conditions,” ACI Structural Journal, 103(4), Jul-Aug 2006.
Collins, M. and Mitchell, D. (1991). Prestressed Concrete Structures. Prentice-Hall,
Englewood Cliffs, NJ., 766 pp.
Lybas J., Fagundo F, Cook R., and Hoffman V. (1998). “Effects of Internal and External
Constraints on the Shear and Bond Strength of Precast Prestressed Concrete Girders.”
University of Florida. Report for the Florida DOT Research Management Center, Tallahassee,
FL
Giaccio, C., Al-Mahaidi, R., and Taplin, G. (2002). “Experimental study on the effect of
flange geometry on the shear strength of reinforced, concrete T-beams subjected to concentrated
loads.” Canadian Journal of Civil Engineering. 29(6), Dec, 911-918.
Hawkins, N. M., Kuchma, D. A., Mast, R. F., Marsh, M. L., and Reineck, K. H. (2005).
“Simplified Shear Design of Structural Concrete Members,” National Cooperative Highway
Research Program Report 549, July 2005.
Khalifa, A. and Nanni, A. (2000). “Improving shear capacity of existing RC T-section
beams using CFRP composites.” Cement & Concrete Composites. 22(3), Jun, 165-174.

BD 545-56 Page 121
MacGregor, J. and Wright, J. (2005). Reinforced Concrete Mechanics and Design
Fourth Edition. Pearson Prentice-Hall, Upper Saddle River, NJ. 1132 pp.
Polak, M. and Dubas,, J. (1996). “Shear design of high strength concrete beams –
Canadian code perspective.” Canadian Journal of Civil Engineering. 23(4) Aug, 809-819.
Ramirez, J. (1994). “Strut-Tie Design of Pretensioned Concrete Members.” ACI
Structural Journal. 91(4), Sep-Oct, 572-578.
Razaqpur, A. and Isgor, O. (2006). “Proposed Shear Design Method for FRP-Reinforced
Concrete Members without Stirrups.” ACI Structural Journal. 103(1) Jan-Feb, 93-102.
Ramirez, J. A. and Russell, B. W. (2007). “Transfer Development, and Splice Length for
Strand/Reinforcement in High-Strength Concrete,” National Cooperative Highway Research
Program Report 12-60, July 2007.
Saenez, N. and Pantelides, C. (2005). “Shear Friction Capacity of Concrete with External
Carbon FRP Strips.” Journal of Structural Engineering. 131(12) Dec, 1911-1919.
Schlaich, J., Schafer, K., Jennewien, M. (1987). “Toward a Consistent Design of
Structural Concrete.” Journal Prestressed Concrete Institute. 32(3), May-Jun, 74-150.
Shahawy, M. and Cai, C.(1999). “A new approach to shear design of prestressed
concrete members.” PCI Journal. 44(4) Jul-Aug, 92-117.
Wolf, T and Frosch, R (2007). “Shear Design of Prestressed Concrete: A Unified
Approach.” Journal of Structural Engineering. 133(11) Nov, 1512-1519.

BD 545-56 Page 122
APPENDIX A – TEST DATA - AASHTO TYPE IV GIRDERS
Table 27 – Concrete mixture design.
Test girder - 1 Test girder – 2 Constituents
Truck-1 (lbs)
Truck-2 (lbs)
Truck-3 (lbs)
Truck-4 (lbs)
Cement 3870 3865 3865 3865 Fly ash 990 985 1025 980 Coarse aggregate 11500 11500 11360 11480 Fine aggregate 7340 7260 7300 7340 Water 964 1060 1088 1082 Admixtures (fl. oz) (fl. oz) (fl. oz) (fl. oz) Air entraining agent 13 13 13 13 Superplasticizer 130 130 130 130 Water reducer 115 115 115 115
Table 28 – Concrete plastic properties.
Test girder-1 Test girder -2 Plastic properties Truck-1 Truck-3 Truck-3 Truck-4 Unit weight 139.63 pcf 139.63 pcf 139.63 pcf 139.63 pcf Air content 3.7% 3.4% 3.6% 3.0% Temperature 91°F 91°F 91°F 90°F Slump 6.5-in. 6.5-in. 5.5-in. 6.75-in. Water/cement ratio
0.32 0.34 0.34 0.34
Days
Com
pres
sive
Stre
ngth
(psi
)
0 5 10 15 20 25 300
2000
4000
6000
8000
Figure 145 – Concrete Compressive Strength Gain Curve

BD 545-56 Page 123
Table 29 – Modulus of rupture results 3 days before flexure tests.
MOR fr (psi) fr/√f’c MOR-2 799 9.61 MOR-4 650 7.82 MOR-5 677 8.14
Table 30 – Steel strength and modulus.
Sample Number 1 2 3 4 AVG ASTM A416Strength (ksi) 277 275 287 282 280 >250
Elongation (%) 5.99 5.68 7.08 5.88 6.14 >3.5% Yield point at 1% elongation 57630 57320 54270 57110 56582 >
Modulus of Elasticity (ksi) 29,200 29,200 30,000 29,900 29,575 n/a

BD 545-56 Page 124
Type IV AASHTO Girders – 15 ft Shear Test with FRP Load Deflection Plot
0 0.1 0.2 0.3 0.4 0.5 0.6 0.7 0.80
100
200
300
400
Displacement (inches)
Shea
r at S
uppo
rt (k
ips)
This plot shows the deflection at the point of loading. As the girder was loaded the plot
indicates linear-elastic behavior up to a load of 264 kips where the girder first cracked. The cracks were visibly noted to occur in the locations shown in the figure below. A loss in load was noted immediately after first crack indicating a loss in stiffness. Based on the slope of the initial linear elastic behavior and comparing it to the new slope you see there is a slight reduction in new stiffness. Another crack opens up at 281 kips followed by a slight reduction in load possibly indicating a further loss in stiffness. The slope of the load displacement curve following this second crack, however, does not seem to indicate a significant change. Diagram of Crack Pattern (Shear at the Support = 205 kips)
FRP Laminate
15 ft
7.5 in
Diagram of Final Crack Pattern (Shear at the Support = 310 kips)

BD 545-56 Page 125
FRP Laminate
15 ft
7.5 in These diagrams illustrate the pattern of cracking. The black lines show the initial
cracking and the red lines show where more cracks developed.

BD 545-56 Page 126
Type IV AASHTO Girders – 15 ft Shear Test (Control) Load Deflection Plot
0 0.1 0.2 0.3 0.4 0.5 0.6 0.7 0.80
100
200
300
400
Displacement (inches)
Shea
r at S
uppo
rt (k
ips)
Diagram of Crack Pattern (Shear at the Support = 170 kips) 15 ft
7.5 in

BD 545-56 Page 127
Diagram of Final Crack Pattern (Shear at the Support = 256 kips)
15 ft
7.5 in These diagrams illustrate the pattern of cracking. The black lines show the initial
cracking and the red lines show where more cracks developed.

BD 545-56 Page 128
Type IV AASHTO Girders – 7 ft 2 in Shear Test on FRP Load Deflection Plot
0 0.1 0.2 0.3 0.4 0.5 0.6 0.7 0.80
100
200
300
400
Displacement (inches)
Shea
r at S
uppo
rt (k
ips)
Diagram of Crack Pattern (Shear at the Support = 228 kips)
FRP Laminate
7 ft 2 in
7.5 in

BD 545-56 Page 129
Diagram of Final Crack Pattern
FRP Laminate
7 ft 2 in
7.5 in These diagrams illustrate the pattern of cracking. The black lines show the initial
cracking and the red lines show where more cracks developed. The gage rosettes are also shown.

BD 545-56 Page 130
Type IV AASHTO Girders – 7 ft 2 in Shear Test (Control) Load Deflection Plot
0 0.1 0.2 0.3 0.4 0.5 0.6 0.7 0.80
100
200
300
400
Displacement (inches)
Shea
r at S
uppo
rt (k
ips)
Diagram of Crack Pattern (Shear at the Support = 205 kips) 7 ft 2 in
7.5 in

BD 545-56 Page 131
Diagram of Final Crack Pattern
7 ft 2 in
7.5 in These diagrams illustrate the pattern of cracking. The black lines show the initial
cracking and the red lines show where more cracks developed. The gage rosettes are also shown.

BD 545-56 Page 132
Strain Rosette First Crack Strain
(Max, Microstrain) First Crack Angle
(Degrees) RFS42_28 250 -89 RFS78_28 130 72 RCS42_50 30 -45 RCS60_50 40 -55 RCS78_50 40 -78 RCS24_28 120 79 RCS42_28 125 89 RCS60_28 120 75 RCS24_12.5 150 75 RCS7.5_4 35 88 RCS24_4 30 10 RCS42_4 105 10 RCS60_4 150 8 RFL42_28 135 88 RFL78_28 155 88 RFL168_60 88 -10 RCL60_50 30 -45 RCL78_50 60 -47 RCL96_50 30 16 RCL132_50 30 8 RCL24_28 110 85 RCL42_28 160 90 RCL60_28 300 -80 RCL78_28 100 85 RCL96_28 140 -90 RCL132_28 130 90 RCL168_28 190 82 RCL60_4 115 12 RCL78_4 150 10 RCL96_4 190 3 RCL168_60 60 -3

BD 545-56 Page 133
APPENDIX B – TEST DATA – AASHTO TYPE III GIRDERS
Type III AASHTO Girders – a/d=1 in Shear Test Load Deflection Plot
0 1 2 3 4 5 60
50
100
150
200
250
300
350
Displacement (inches)
Shea
r at S
uppo
rt (k
ips)
Diagram of Crack Pattern (Shear at the Support = 182 kips) 4 ft 9 in
5.5 in

BD 545-56 Page 134
Diagram of Final Crack Pattern
4 ft 9 in
5.5 in These diagrams illustrate the pattern of cracking. The black lines show the initial
cracking and the red lines show where more cracks developed. The gage rosettes are also shown.

BD 545-56 Page 135
Type III AASHTO Girders – a/d=2 in Shear Test Load Deflection Plot
0 1 2 3 4 5 60
50
100
150
200
250
300
350
Displacement (inches)
Shea
r at S
uppo
rt (k
ips)
Diagram of Crack Pattern (Shear at the Support =181 kips) 8 ft 3 in
5.5 in

BD 545-56 Page 136
Diagram of Final Crack Pattern
8 ft 3 in
5.5 in

BD 545-56 Page 137
Type III AASHTO Girders – a/d=2 in Shear Test (Second Test) Load Deflection Plot
0 1 2 3 4 5 60
50
100
150
200
250
300
350
Displacement (inches)
Shea
r at S
uppo
rt (k
ips)
Diagram of Crack Pattern (Shear at the Support =162 kips) 8 ft 3 in
5.5 in

BD 545-56 Page 138
Diagram of Final Crack Pattern
8 ft 3 in
5.5 in

BD 545-56 Page 139
Type III AASHTO Girders – a/d=3 in Shear Test Load Deflection Plot
0 1 2 3 4 5 60
50
100
150
200
250
300
350
Displacement (inches)
Shea
r at S
uppo
rt (k
ips)
Diagram of Crack Pattern (Shear at the Support = 138 kips) 12 ft 5 in
5.5 in

BD 545-56 Page 140
Diagram of Final Crack Pattern
12 ft 5 in
5.5 in

BD 545-56 Page 141
Type III AASHTO Girders – a/d=4 in Shear Test Load Deflection Plot
0 1 2 3 4 5 60
50
100
150
200
250
300
350
Displacement (inches)
Shea
r at S
uppo
rt (k
ips)
Diagram of Crack Pattern (Shear at the Support = 105 kips) 16 ft 9 in
5.5 in

BD 545-56 Page 142
Diagram of Final Crack Pattern
16 ft 9 in
5.5 in

BD 545-56 Page 143
Type III AASHTO Girders – a/d=4 in Shear Test (Second Test) Load Deflection Plot
0 1 2 3 4 5 60
50
100
150
200
250
300
350
Displacement (inches)
Shea
r at S
uppo
rt (k
ips)
-
Diagram of Crack Pattern (Shear at the Support =162 kips) 16 ft 9 in
5.5 in

BD 545-56 Page 144
Diagram of Final Crack Pattern
16 ft 9 in
5.5 in

BD 545-56 Page 145
Type III AASHTO Girders – a/d=5 in Shear Test Load Deflection Plot
0 1 2 3 4 5 60
50
100
150
200
250
300
350
Displacement (inches)
Shea
r at S
uppo
rt (k
ips)
Diagram of Crack Pattern (Shear at the Support = 91 kips) 21 ft 5 in
5.5 in

BD 545-56 Page 146
Diagram of Final Crack Pattern
21 ft 5 in
5.5 in

BD 545-56 Page 147
Strain Rosette First Crack Strain
(Max, Microstrain) First Crack Angle
(Degrees) 1R45_49 45 12 1R33_39.5 12 -65 1R45_39.5 75 -72 1R53_39.5 20 60 1R21_24 400 8.5 1R33_24 30 30 1R45_24 170 77 1R53_24 150 67 1R21_4 105 65 1R33_4 160 -8 1R45_4 195 0 2R87.5_49 70 -32 2R65.5_39.5 70 -44 2R75.5_39.5 40 25 2R87.5_39.5 20 -40 2R35.5_24 135 90 2R53.5_24 285 90 2R71.5_24 185 90 2R87.5_24 160 -82 2R5.5_4 275 90 2R23.5_4 130 20 2R35.5_4 135 10 3R137.5_49 135 5 3R107.5_39.5 50 -20 3R125.5_39.5 75 -12 3R137.5_39.5 105 90 3R53.5_24 210 -90 3R71.5_24 240 90 3R87.5_24 180 90 3R137.5_24 250 55 3R35.5_4 120 45 3R53.5_4 150 -10 3R71.5_4 212 -8 4R177_49 45 -10 4R77_39.5 30 -45 4R93_39.5 50 -30 4R129_39.5 75 -10 4R57_24 160 -87 4R77_24 900 90 4R93_24 130 79 4R129_24 135 80 4R57_4 130 25

BD 545-56 Page 148
4R77_4 160 5 4R93_4 200 -10 5R245.5_49 300 -10 5R209.5_39.5 155 -15 5R233.5_395 120 -20 5R245.5_39.5 100 -20 5R155.5_24 225 45 5R173.5_24 190 65 5R191.5_24 190 75 5R245.5_24 240 -90 5R137.5_4 335 0 5R155.5_4 465 -5 5R173.5_4 450 -8