shawn osell department of business and economics university of wisconsin – superior...
TRANSCRIPT

1
Shawn OsellDepartment of Business and Economics
University of Wisconsin – [email protected]
Interest on Reserves: A Fourth Tool of Monetary Policy
2
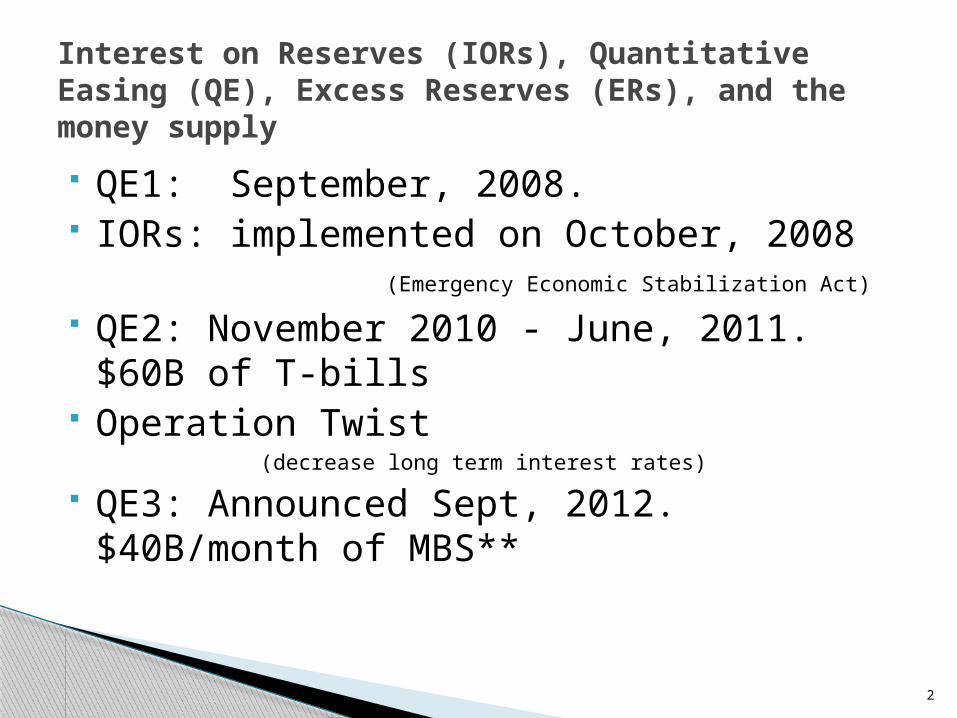
QE1: September, 2008. IORs: implemented on October, 2008
(Emergency Economic Stabilization Act)
QE2: November 2010 - June, 2011. $60B of T-bills
Operation Twist (decrease long term interest rates)
QE3: Announced Sept, 2012. $40B/month of MBS**
Interest on Reserves (IORs), Quantitative Easing (QE), Excess Reserves (ERs), and the money supply

3
M2; 1960 – 2012http://research.stlouisfed.org/

4
M2; 2006 – 2012

5
What is the money multiplier? (m) The maximum change in the money supply due to
an initial change in the excess reserves banks hold
What is the money multiplier equal to? m = 1 / required reserve ratio ≡ 1/r
i.e. 1/10% = 1/(1/10) = 10 M1 =initial ER x m
i.e. $90 X 10 = $900.
Where does money come from? -- What we learn about the money multiplier and money supply creation

6
Bank TR (Deposits) RR ER loans (or bonds)
M1 CumulativeΔM1
A $100 from O.M.O. $0 $100 $100 $0
B $100 $10 $90 $100 $0
C 90 9 81 190 90
D 81 8.10 72.9 271 171
E 72.9 7.29 65.61 343.9 243.9
F 65.61 ⁞ ⁞ ⁞ ⁞
Total: $1,000 $900
Money Creation via the Banking System -
A Lecture from a macroeconomics course

7
Can the multiplier be smaller than indicated?
The simple money multiplier assumes that:
1.* banks want to lend out all of their ER’s
2. borrowers’ want to borrow all of a bank’s ER’s
3. All loans are deposited back into the banking system.
Three Caveats regarding the money multiplier

8
Reserve Market and IOR Theory

9
0.5
11.
52
2.5
inte
rest
rate
jan2008 jan2009 jan2010 jan2011 jan20122008 - 2012
Interest rate on ERsEffective Federal Funds Rate
Effective Fed Funds Rate and Interest on Reserves
Interest on Required Reserves
Interest on Excess Reserves
Effective Federal Reserve Rate
Target Federal Funds Rate
Date Value 2008-10-22 1.40
2008-11-05 1.11
2008-11-19 1.00
2008-12-03 1.00
2008-12-17 0.89
2008-12-31 0.252009-01-14 0.25
To present 0.25
Date Value2008-10-15 0.752008-10-22 0.752008-10-29 0.652008-11-05 0.652008-11-12 1.002008-11-19 1.002008-11-26 1.002008-12-03 1.002008-12-10 1.002008-12-17 0.252008-12-24 0.25
0.25
Date Value2008-10-01 0.97
2008-11-01 0.39
2008-12-01 0.16
2009-01-01 0.15
.07 - .20
Date 12/16/2008
0 - .25
Federal Funds Rate and Interest on Reserves

10
05
10
15
20
Bill
ion
s o
f D
olla
rs
jan1960 jan1970 jan1980 jan1990 jan2000 jan2010January 1960 -April 2008
Excess Reserves
Excess Reserves (Bil.)1960-2008

11
05
00
1000
1500
Bill
ion
s o
f D
olla
rs
jan1960 jan1970 jan1980 jan1990 jan2000 jan20101960 - 2012
Excess Reserves
01
000
2000
3000
perc
en
t cha
nge
jan1960 jan1970 jan1980 jan1990 jan2000 jan20101960 - 2012
percent change Excess Reserves
Excess Reserves; 1960 - 2012

12
050
010
00
15
00
Bill
ion
s of
Dolla
rs
jan2008 jan2009 jan2010 jan2011 jan20122008 - 2012
Excess Reserves
Excess Reserves; 2008 - Present

13
Consequences of too much easy credit during the 2000s
Current economy Europe Future uncertainty i.e. presidential
election. Low interest rates are not profitable for
lenders – no incentive to lend. How much impact do/can IORs have? *** The opportunity cost of lending or buying liquid assets has
decreased.
Why are banks not lending their Excess Reserves?

14
0.2
.4.6
.81
Inte
rest ra
te o
n E
Rs
050
010
00
15
00
Excess R
eserv
es in B
illio
ns o
f $
jan2008 jan2009 jan2010 jan2011 jan2012month, year
Excess Reserves of Depository Institutions
Interest rate on ERs
Source: St. Louis FRB
ERs are in Billions of dollarsExcess Reserves amount and interest rate paid
Is there a relationship between Excess Reserves and interest on reserves? Causation vs. Correlation

15
0
.2
.4
.6
.8
1
ER
an
d R
R a
s p
erc
ent
of T
R
jan1960 jan1970 jan1980 jan1990 jan2000 jan20101960 - 2008
ER as percent ot TR RR as percent ot TR
ERs and RRs as a percent of TRs
0
.2
.4
.6
.8
1
ER
an
d R
R a
s p
erc
ent
of T
R
jan2008 jan2009 jan2010 jan2011 jan20122008 - 2012
ER as percent ot TR RR as percent ot TR
Excess reserves and Required Reserves as a Percentage of Total Reserves

16
Excess Reserve ratio = e = ER/D; where D = Checkable Deposits. Public can & does hold currency which slows the money creation
process.
Public preference for currency is measured by Currency ratio = c = C/D Currency has become a larger part of M1 than checkable deposits C > D.
Where is all the currency?: i.e. Overseas, Drug Trade.
m = 1 + c r + e + c
Include the Currency Ratio and Excess Reserve Ratio into the Money Multiplier

17
Now, how well can the Fed control the money supply, M1? MB X m = M1 (MBn + DL) X 1 + c = M1 r + e + c The Federal Reserve controls: MBn, r = req. reserve ratio
Financial Intermediaries control: e = ER ratio, and DLs = (note: Discount Loans are a right),
The public controls: c = Currency Ratio.
Money Creation with More Players

18
MB * m = M1 m = M1/MB0
1000
2000
3000
Billions o
f dollars
jan1960 jan1970 jan1980 jan1990 jan2000 jan2010years 1960 - 2012
M1 Money Stock
Monetary Base
M1 money supply and the monetary base
01
23
4
M1 m
m
jan1960 jan1970 jan1980 jan1990 jan2000 jan2010years 1960 - 2012
M1 money multiplier
0500
1000
1500
Billions o
f dollars
jan1960 jan1970 jan1980 jan1990 jan2000 jan2010years 1960 - 2008
M1 Money Stock
Monetary Base
M1 money supply and the monetary base
1000
1500
2000
2500
3000
Billions o
f dollars
jan2008 jan2009 jan2010 jan2011 jan2012years 2008 - 2012
M1 Money Stock
Monetary Base
M1 money supply and the monetary base

19
01
23
e/DD
and
c/D
D
jan1960 jan1970 jan1980 jan1990 jan2000 jan2010years 1960 - 2012
Excess Reserve ratio
Currency Ratio
Currency and ER ratios
01
23
e/DD
and
c/D
D
jan2008 jan2009 jan2010 jan2011 jan2012years 2008 - 2012
Excess Reserve ratio Currency Ratio
Currency and ER ratios
Variable Obs. Mean Std. Dev. Min Max
Jan. 1960 – Aug. 2008
ER (Bil.) 584 .8232414 .9451131 .12 19.015
ER ratio 584 .0030797 .0025858 .000558 .0511982
Sept. 2008 – May, 2012
ER (Bil.) 45 1,091.961 368.0216 59.482 1,618.129
ER ratio 45 2.034559 .470678 .1650902 19
Currency ratio and excess ratioa comparison before and after QE1

20
-500
0500
1000
1500
Bill
ions
of D
olla
rs
jan1960 jan1970 jan1980 jan1990 jan2000 jan2010Month, Year
Non-borrowed Reserves of Depository InstitutionsBorrowed Reserves of Depository Institutions
of Depository Institutions Borrowed and Non-Borrowed Reserves
-500
0500
1000
1500
Bill
ions
of D
olla
rs
jan2008 jan2009 jan2010 jan2011 jan20122008 - 2012
Non-borrowed Reserves of Depository InstitutionsBorrowed Reserves of Depository Institutions
of Depository Institutions Borrowed and Non-Borrowed Reserves
Supply of reserves:Borrowed and Non-Borrowed reserves

21
Banking and Excess reservesBank Loans and ER ratio after QE1
Regression on loans after QE1
01
23
ER
/Dep
osi
t rat
io
6600
6800
7000
7200
7400
Tot
al L
oans
in B
illio
ns o
f $
jul2008 jul2009 jul2010 jul2011 jul2012month, year
Total Loans and Leases of Commercial Banks
ER/Deposit ratio
Source: BoG and St. Louis FRB
Loans are in Billions of dollarsTotal Loans and Leases of Banks and ER ratio Coef. t
Constant 7625.366* 41.8*
ER ratio - 294.78* - 6.66*
C ratio - 83.57 - 1.09
Adj.-R = .49

22
IORs benefit Financial Intermediaries by lowering the opportunity cost of holding Excess Reserves and the Implicit tax on Required Reserves
Effective/additional Monetary Policy tool Disincentive for lending Loss of funds for US Treasury Can/will be used to moderate future
inflation
Concluding statements