sharp healthcare hospice and palliative...
TRANSCRIPT

Sharp HealthCare Hospice and Palliative Care
Daniel R. Hoefer, MD CMO, Outpatient Palliative Care and Hospice
Suzi K. Johnson, MPH, RN Vice President Sharp HealthCare Hospice and Palliative Care
The Continuum for Advanced Illness and End Stage Disease Management
(AAC)

Principles of Transitions
1. Proactive Disease Management
2. Proactive Psychosocial Management
3. Accurate description of what the health care industry can provide

27% of patients with incurable terminal disease believed they could have been cured
Unresectionable non-small-cell lung cancer 54%
AIDS 32% CHF 22% ALS 16% COPD 12%
Daniel P Sulamsy, OFM, MD, PhD, et al, The Accuracy of Substituted Judgment in Patients with Terminal Diagnoses, April 1998, Annals of Internal Medicine, Vol 128(8), PP 621-29

Medicare Cost in Matched Hospice and Non-Hospice Cohorts
Bruce Pyeson FSA, MAAA et al, Journal of Pain and Symptom Management, May 2004, Vol 28(3) pp 200-210
Comparing Hospice and Non-Hospice Patient Survival Among Patients Who Die Within a Three Year Window
Steven Connor PhD, et al, Journal of Pain and Symptom Management, March 2007, Vol (3) pp 238-246
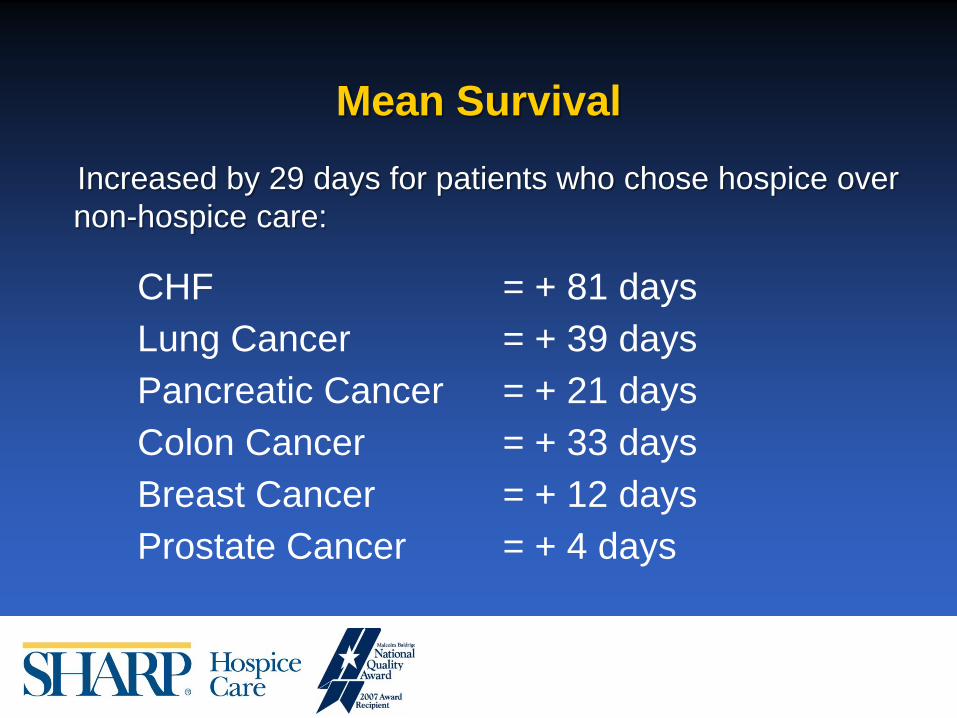
Increased by 29 days for patients who chose hospice over non-hospice care:
CHF = + 81 days Lung Cancer = + 39 days Pancreatic Cancer = + 21 days Colon Cancer = + 33 days Breast Cancer = + 12 days Prostate Cancer = + 4 days
Mean Survival

Birth of the Concept for the Transitions Program
1. Medicare is based on an archaic model of health management
2. Professional Experience and Evidenced Based Hospice Care

4 Pillars of Transitions
1. Comprehensive in-home patient and family education about their disease process; proactive medical management
2. Evidence-based Prognostication 3. Professional Proactive Management of the Caregiver 4. Advance Health Care Planning
Transitions - Extending the evidenced based benefits of Hospice Care to patients at an earlier point in their healthcare.

1. In Home Proactive Disease Management
a. Do not need to be home bound b. Do not need a Medicare Part A skilled
requirement

2. Evidenced-Based Medical Prognostication
British Medical Journal; Extent and Determinants of Error in Doctors Prognoses in Terminally Ill patients; Prospective Cohort Study; Vol 320(7233), 19 Feb 2000 pp.469-473
1. 343 doctors 2. Estimates on 468 terminally ill patients 3. Mean patient survival – 24 days 4. Considered accurate if estimate within 33% for any
give patient 5. 20% of the time accurate
1. 80% of the time inaccurate 2. 63% over-optimistic
6. The average over-optimistic estimate was off by 530%

The Clinical Consequences of Institutionalized Over-optimism
a. Increases the risk that treatment decisions by patients, families and healthcare providers are NOT consistent with reality
b. Leaves patients and families emotionally unready for inevitable outcomes
c. Increase risk that providers will lose credibility

3. Professional Evidence-Based Care for the Caregiver
Evidenced-based medicine - Hospice care is associated with an absolute reduction in death rates in the caregiver at 18 months post death of the patient of 0.5% (1 in 200)
Nicholas Christakis, et al, The Health Impact of Health care on families: a Matched Cohort Study of Hospice Use by Decedents and Mortality Outcomes in Surviving, Widowed Spouses, Social Science and Medicine 2003, vol57 pp.465-475

4. Advance Health Care Planning
Evidenced-based medicine shows that AHCDs (which would include POLST) do not consistently match the health care desired by the patient with the care received by the patient

Problems with Advance Health Care Directives
1. They are not disease specific 2. They are too vague or contradictory to be interpreted in the context of the care which is being provided
Resolve Moral Conflict Proactively

What Transitions does not do …
1. We do not prevent or discourage the patient from seeing their cardiologists or PCPs
2. We do not prevent or discourage state-of-the-art cardiology therapies or interventions
3. We do not discourage hospitalizations 4. We do not "take over" the medical management of
the patient

Results from June 2007 to December 2008
229 Referrals
109 Admissions
26 Referrals to Hospice
94 Not Admitted

Transitions Program
SRS

94% reduction in ER visits and Hospitalizations

CHF Can you see it?
Nov 2006
Feb 2007
May 2007
June 2008
Dec 2008
May 2009
Dec 2009
Mar 2010
Dec 2010
Jan 2011
BUN 16 30 11 23 23 26 17 48 44 44
Creatinine 1.2 1.2 1.0 1.1 1.1 1.2 1.1 1.9 2.0 1.5
HGB 14.4 13.4 13.1 12.6 12.0 12.5
BNP 148 170 111 173 103 386 631 1270
ADL defecit
2 2 2 2 2 3 3

Fried, Linda P., et al, Frailty In Older Adults: Evidence of a Phenotype, 2001 Journal of Gerontology, Vol 56A(3), M146-M156
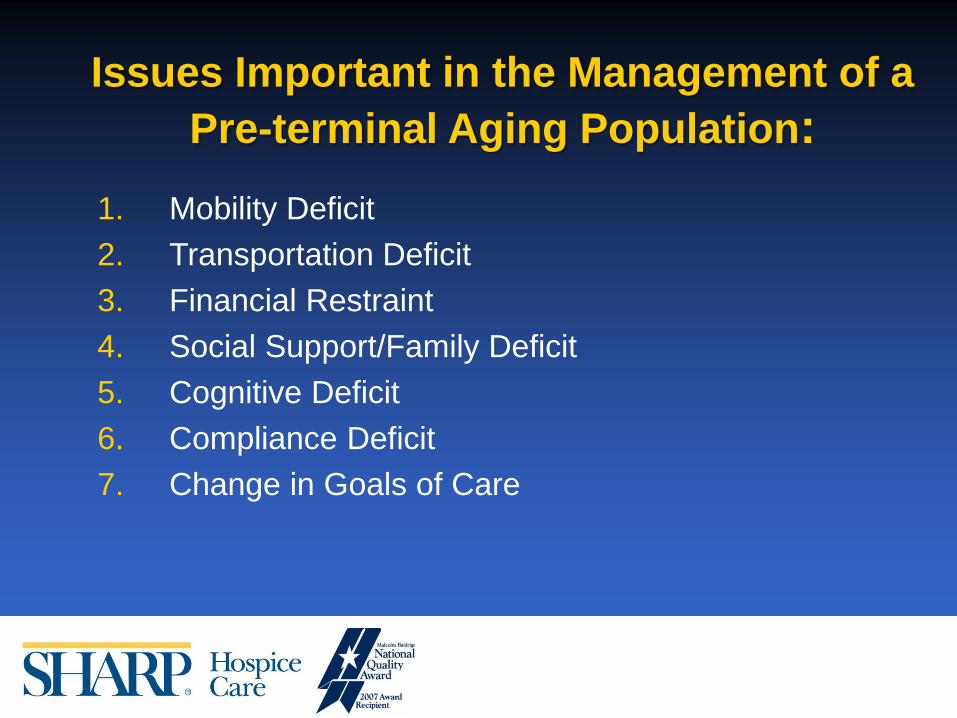
Issues Important in the Management of a Pre-terminal Aging Population:
1. Mobility Deficit 2. Transportation Deficit 3. Financial Restraint 4. Social Support/Family Deficit 5. Cognitive Deficit 6. Compliance Deficit 7. Change in Goals of Care

Title Pt # Patient Charges
Pre-Transitions
Pre-Transitions Hospital/ER
Visits
Patient Charges During
Transitions
Hospital/ER Visits
During Transitions
Cost Differential
1 $59,444.81 1 $631.57 0 $58,813.24
2 $5,791.69 1 $2,564.47 2 $3,227.22
3 $8,428.68 1 $7,874.01 1 $554.67
4 $0.00 1 $2,549.50 0 -$2,549.50
5 $6,388.42 1 $2,792.40 0 $3,596.02
6 $1,897.07 1 $1,917.93 0 -$20.86
7 $578.27 2 $0.00 0 $578.27
8 $6,104.97 1 $857.01 0 $5,247.96
9 $0.00 0 $992.95 0 -$992.95
10 $719.54 1 $293.41 0 $426.13
11 $0.00 2 $0.00 0 $0.00
12 $4,412.67 1 $1,420.61 0 $2,992.06
13 $21,926.08 5 $2,390.11 0 $19,535.97
14 $0.00 2 $5,166.58 2 -$5,166.58
15 $0.00 0 $1,375.86 0 -$1,375.86
16 $0.00 0 $1,760.46 0 -$1,760.46
17 $0.00 0 $880.23 0 -$880.23
18 $1,203.86 1 $3,783.05 2 -$2,579.19
19 $5,650.07 1 $1,941.15 0 $3,708.92
20 $0.00 0 $699.54 0 -$699.54
Totals $330,755.54 61 $168,776.39 16 $161,979.15
** Grayed cell charges include Hospital/Lab/ MD claims while on Transitions
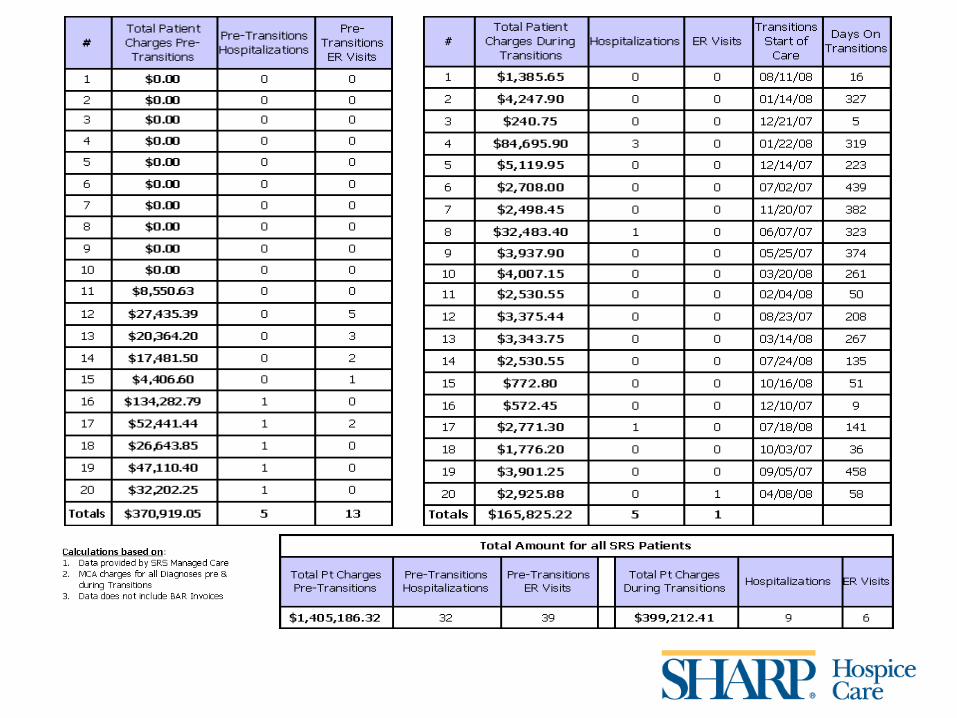
Calculations based on:
1. Data for 60 patients provided by SRS Managed Care
2. MCA charges for all Diagnoses pre & during Transitions
Transitions Program
SRS

Comparative Data 76% reduction in ER visits and
hospitalizations

Discharge Data
• 80% go to Hospice • 20% die on service

Paradigm Shift #1
• Historically 63% of CHF patients died in the hospital (2005)
• Three Hospital Deaths on Transitions – Cardiac Cath – COPD – Cardiac Arrest

Paradigm Shift #2
• Historical average hospitalizations for CHF during the last year of life 3.5
• Average number of CHF admissions for Transitions patients is < 1 during the last year of life
71.5% reduction in cost
CHF ICD-9 as primary reason for admission

Pt #
Patient Charges
Pre-Transitions
Pre-Transitions Hospital/ER
Visits
Patient Charges During
Transitions
Hospital/ER Visits During Transitions
Cost Differential
1 $59,444.81 1 $631.57 0 $58,813.24
2 $5,791.69 1 $2,564.47 2 $3,227.22
3 $8,428.68 1 $7,874.01 1 $554.67
4 $0.00 1 $2,549.50 0 -$2,549.50
5 $6,388.42 1 $2,792.40 0 $3,596.02
6 $1,897.07 1 $1,917.93 0 -$20.86
7 $578.27 2 $0.00 0 $578.27
8 $6,104.97 1 $857.01 0 $5,247.96
9 $0.00 0 $992.95 0 -$992.95
10 $719.54 1 $293.41 0 $426.13
11 $0.00 2 $0.00 0 $0.00
12 $4,412.67 1 $1,420.61 0 $2,992.06
13 $21,926.08 5 $2,390.11 0 $19,535.97
14 $0.00 2 $5,166.58 2 -$5,166.58
15 $0.00 0 $1,375.86 0 -$1,375.86
16 $0.00 0 $1,760.46 0 -$1,760.46
17 $0.00 0 $880.23 0 -$880.23
18 $1,203.86 1 $3,783.05 2 -$2,579.19
19 $5,650.07 1 $1,941.15 0 $3,708.92
20 $0.00 0 $699.54 0 -$699.54
Totals $330,755.54 61 $168,776.39 16 $161,979.15
** Grayed cell charges include Hospital/Lab/ MD claims while on Transitions
Calculations based on:
1. Data for 60 patients provided by SRS Managed Care
2. MCA charges for all Diagnoses pre & during Transitions
Transitions Program
SRS

50% Cost Reduction
CHF ICD-9 as primary or secondary reason for admission

• The patients live longer and better • The caregivers live better and survive • The families are happier with the care provided • Cardiologists and PCPs still provide state-of-the-art
Cardiology care • Care provided is increasingly consistent with the goals of
care of the patient • Cost effective
Outcomes

Transitions Admissions 2007 - 2011
Admissions to Transitions
13
73
109
204
142
0
50
100
150
200
250
FY '07 FY '08 FY '09 FY '10 FY'11
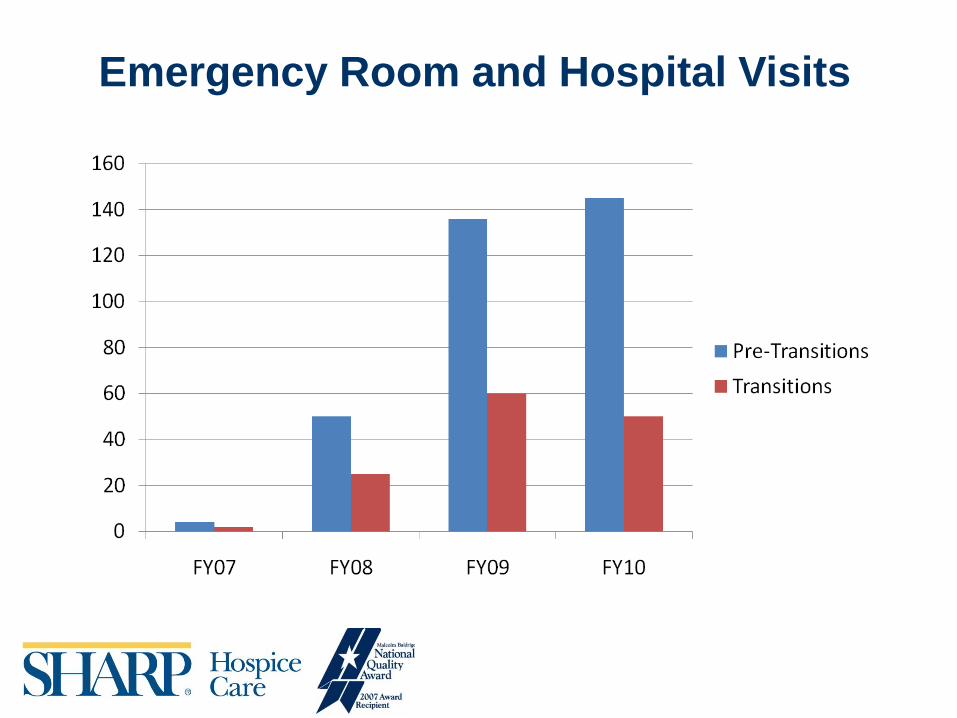
Emergency Room and Hospital Visits
Hospitalizations/ED Visits

Hospice Transitions Transfers to Hospice
2
31
54
99 101
0
20
40
60
80
100
120
FY '07 FY '08 FY '09 FY'10 FY'11

Hospice Total Admissions - Heart Failure
118 111
147158
178169
507090
110130150170190210230250
FY '06 FY '07 FY '08 FY '09 FY '10 FY'11

Hospice Length of Stay – Heart Failure
78.4
25
88.6
24
94
22
92
23
120
33
0
20
40
60
80
100
120
FY '07 FY '08 FY '09 FY'10 FY'11
ALOS
MLOS

Patient Family Satisfaction Transitions FY2011
Percent VERY satisfied CHF COPD Dementia
Overall
1. The extent to which you were taught to manage your medications and symptoms related to your diagnosis
76% 75% 88% 79%
2. The education you received regarding contacting the Transitions team at any time for assistance in managing your symptoms
75% 88% 90% 82%
3. The assistance you received with long term care planning and advanced directives
81% 86% 88% 84%
4. Improvement in your quality of life 69% 57% 89% 72% 5. Assistance received from the nurse or medical social worker when problems occurred
69% 75% 82% 74%
6. Likelihood of recommending the Sharp Transitions Program to others for managing advanced chronic illness
78% 100% 91% 86%


Transitions - Dementia
Launched July 1, 2009

4 Pillars of Transitions
• In home proactive disease management • Evidenced based medical prognostication • Care for the caregiver • Advanced healthcare planning

“Standard of Care” versus Evidenced-Based Medicine
• Perceived benefit of feeding tubes by physicians – 195 returned surveys from 500 physicians in the AMA master file
• Decreased aspiration pneumonia (76.4%) • Improves pressure ulcer healing (74.%) • Increases survival (61.4%) • Improves nutritional status (93.7%) • Improves functional status (27.1%) • Most physicians felt that feeding tubes were standard of care in advanced
dementia and 62% underestimated the 1 month mortality rate (actual rate is 20% to 40%.
• Is there any medical evidence that mortality decreases by hospitalizing demented patients with pneumonia?
Joseph Shega, MD, et al, Barriers to limiting the Practice of Feeding tube Placement in Advanced Dementia, Journal of Palliative Medicine, vol.1, Nov. 6, 2003, pp.885-893

“Standard of Care” versus Evidenced-Based Medicine – Cont’d
Robert Thompson, DO, et al, Hospitalization and Mortality Rates for Nursing Home –acquired Pneumonia, The Journal of Family Practice, April 1999vol.48(4) (Acute mortality rates the same) Terri Fried, MD, et al, Whether to Transfer? Factors Associated with Hospitalization and Outcome of Elderly Long-Term Care Patients with Pneumonia, J. Gen Intern Med, 1995, vol. 10, pp.246-50 (Acute mortality rates the same) Terri Fried, MD, et al, Short-Term Functional Outcomes of Long-term Care Residents with Pneumonia Treated With and Without Hospitalization, JAGS, March 1997, vol.45(3), pp.302-07 (Acute mortality rates the same) However, at two months, the patients transferred to the hospital had increased mortality rates than those not transferred and markedly decreased functional decline compared to those not transferred.. The worst functional loss was seen for those who were independent or mildly demented at baseline. Robert R Muder, MD, et al, Pneumonia in a Long-term Care Facility: A Prospective Study of Outcome, 1996, Arch Intern Med, vol.156, pp.2365-70 (Acute mortality rates the same) David R Mehr, MD, MS, Risk Factors for Mortality in Lower Respiratory Infections in Nursing Home Patients, 1992, J Fam Pract vol.34, pp585-91 (Acute mortality was slightly higher for hospitalized patients)
Iatrogenic Consequences of Hospitalization
1. Infections 2. Falls and Trauma 3. Delirium 4. Treatment “errors”

Predictive Model For Delirium Criteria: (1 point for each)
1. Hearing or visual deficit 2. Severe Illness 3. Cognitive Impairment (MMSE < 24) 4. BUN/Cr ratio > 18
0 points – 9% risk 1-2 points – 23% risk 3-4 points – 83% risk
Inouye, Sharon K, MD, et al, A Predictive Model for Delirium in Hospitalized Elderly Patients Based on Admission Characteristics, 1999, Ann Intern Med, vol.119, pp474-81

“Standard of Care” versus Evidenced-Based Medicine
• Delirium is always reversible–FALSE • Delirium is associated with permanent:
– Mental Decline – Physical decline – Markedly increased mortality – Increased Institutionalization – Prolonged Hospitalization

• Delirium accounts for 49% of all hospital days in hospitalized older patients
Inouye, Sharon K, MD, Delirium in Older Persons, NEJM, 2006, vol.354(11), PP.1157-68
• Demented Patients are at 500% the risk of developing Delirium
Cole, Martin G, MD, FRCP, Delirium in Elderly Patients, 2004, J Ger Psychiatry, vol.12(1), pp.7-21
“Standard of Care” versus Evidenced Based-Medicine – Cont’d

“My Mother was Never the Same”
Understanding that delirium is not necessarily reversible mandates a revised medical and ethical standard when recommending treatments to the at risk population

The minimum we should know ...
• Delirium is NOT always reversible • Delirium is induced by the treatments we provide • Dementia increases the risk of developing delirium by
500% • 60-70% of hospital cases of delirium are NOT
preventable