shareholder information -...
TRANSCRIPT

2006 ANNUAL REPORTMAY 2007
20
06
AN
NU
AL R
EP
OR
T
MORE INFORMATION:INVESTOR RELATIONS
BIOVAIL CORPORATION7150 Mississauga Road
Mississauga, Ontario, Canada L5N 8M5
WWW.BIOVAIL.COM
SHAREHOLDER INFORMATION
HEAD OFFICE
Biovail Corporation
7150 Mississauga Road
Mississauga, Ontario, Canada L5N 8M5
SUBSIDIARIES
Biovail Laboratories International SRL
Chelston Park, Building 2, Ground Floor
Collymore Rock, St. Michael
Barbados, West Indies
Biovail Pharmaceuticals Canada
7150 Mississauga Road
Mississauga, Ontario
Canada L5N 8M5
Biovail Pharmaceuticals, Inc.
700 Route 202/206 North
Bridgewater, New Jersey
U.S.A. 08807
Biovail Technologies (Ireland) Limited
3200 Lake Drive
Citywest Business Campus
Dublin 24, Ireland
Biovail Technologies Ltd.
3701 Concorde Parkway
Chantilly, Virginia
U.S.A. 20151
AUDITORS
Ernst & Young LLP
Chartered Accountants
Toronto, Ontario
LEGAL COUNSEL
Davies Ward Phillips & Vineberg LLP
Toronto, Ontario
Proskauer Rose LLP
New York, New York
REGISTRARS AND TRANSFER AGENTS
CIBC Mellon Trust Company
Toronto, Ontario
1.800.387.0825
Mellon Investor Services LLC
New York, New York
THE ANNUAL MEETING OF SHAREHOLDERS
The annual meeting of shareholders will be held at 10:00 a.m. EDT
on Wednesday May 16, 2007, at the Dominion Club.
1 King Street West
Toronto, Ontario, Canada M5H 1A1
STOCK EXCHANGE LISTINGS
Toronto Stock Exchange
New York Stock Exchange
TRADING SYMBOL
Common Shares: BVF
SHARES OUTSTANDING AT DECEMBER 31, 2006
160.1 million
HOW TO REACH US FOR MORE INFORMATION
For additional copies of this report, the annual report on Form 20-F as
filed with the United States Securities and Exchange Commission, quarterly
reports or for further information, please contact Investor Relations.
Biovail Corporation
7150 Mississauga Road
Mississauga, Ontario
Canada L5N 8M5
Phone
905.286.3000
Fax
905.286.3050
Web site
www.biovail.com
The following words are trademarks of the Company and are subject of either registration, or application for registration, in one or more of Canada, the U.S. or certain other jurisdictions: Attenade®, A Tablet Design (Apex Down)®, A Tablet Design (Apex Up)®, Aplezin, Ativan®, Asolza, Biovail®, Biovail Corporation International®, Biovail & Swoosh Design®, BPI®, BVF®, Cardizem®, Ceform, Crystaal Corporation & Design®, Crystaal Pharmaceuticals, Ditech, Flash Dose®, Flashdose, Glumetza, Instatab, Isordil®, Jovola, Jublia, Mivura, Onelza, Onexten, Oramelt, Palvata, Smartcoat, Solbri, Tesivee, Tiazac®, Tovalt, Upzimia, Upziva, Vaseretic®, Vasocard, Vasotec®, Vemreta, Volzelo, Z-Flakes and Zileran.
Wellbutrin®, Wellbutrin® SR, Wellbutrin XL® (a once daily formulation of bupropion developed by Biovail), Zovirax®, and Zyban® are trademarks of The GlaxoSmithKline Group of Companies and are used by the Company under license. Ultram®, Ultram® ER, and Ultram® ODT are trademarks of Ortho-McNeil, Inc. and are used by the Company under license.
In addition, the Company has filed trademark applications for many of its other trademarks in the United States and Canada and has implemented on an ongoing basis a trademark protection program for new trademarks.

Biovail Corporation is a specialty pharmaceutical company that applies advanced drug-delivery
technologies to improve the clinical effectiveness of medicines, and to develop controlled-
release generic products. The Company’s therapeutic areas of focus are central nervous system
(CNS) disorders, pain management and cardiovascular disease. Biovail drives business
growth by commercializing these products both directly through its own sales and marketing
division (in Canada) and/or through strategic partners. Biovail’s core competency lies in the
development and large-scale manufacturing of pharmaceutical products incorporating oral
drug-delivery technologies. Biovail has a broad portfolio of proprietary drug-delivery technologies
that represent the foundation upon which the Company’s strategy is based.
Product candidates that meet a rigorous screening process are considered for addition
to the Company’s development pipeline. To this end, development efforts are currently
ongoing for a number of pipeline products, including novel formulations of bupropion and
venlafaxine, separate combination products involving bupropion and tramadol, and a number
of feasibility, or earlier-stage programs.
With approximately 1,600 employees worldwide, Biovail operates facilities in Barbados,
Canada, the United States, Ireland and Puerto Rico. Shares of Biovail Corporation trade
on the New York Stock Exchange (NYSE) and the Toronto Stock Exchange (TSX) under the
symbol BVF.
1 Financial Highlights
2 Corporate Profile
8 Chairman’s Letter to Shareholders
12 Chief Executive Officer’s Letter to Shareholders
21 2006 Highlights
21 Restructuring of U.S. Operations
22 Payment of Dividends
22 Revised Dividend Policy
23 Elimination of Debt
24 Wellbutrin XL®
26 Ultram® ER
28 Regulatory, R& D Successes
30 The Power of Ten
33 Research and Development Strategy
34 Drug-Delivery Technologies
37 Product Pipeline
39 Commercial Portfolio
40 Financial Review
Executive Testimonials
19 Wendy Kelley
20 Kenneth G. Howling
29 Dr. Peter Silverstone
32 Gilbert Godin
BIOVAIL AT A GLANCE
This Annual Report contains forward-looking statements and investors are cautioned to review the “Forward Looking Statements” section in
Management's Discussion and Analysis on page 41. Investors should note that such caution is applicable to this Annual Report in its entirety.

1
2006 Annual Report
FINANCIAL HIGHLIGHTSYears ended December 31 [All dollar amounts expressed in thousands of U.S. dollars, except per share data]
2006 2005 2004
As Restated As Restated As Restated
Product sales $ 1,021,278 $ 887,074 $ 837,102
Total revenue 1,067,722 938,343 879,156
Operating income 238,867 309,882 221,279
Operating income excluding specific items2 466,193 363,784 270,604
Net income 211,626 246,440 159,799
Diluted earnings per share (EPS) $ 1.32 $ 1.54 $ 1.00
Diluted EPS excluding specific items2 $ 2.75 $ 1.92 $ 1.34
Cash dividends declared per share $ 1.00 $ 0.50 $ -
Total assets $ 2,192,442 $ 2,036,820 $ 1,711,060
Long-term obligations 400,645 412,508 445,471
Shareholders’ equity 1,302,257 1,228,364 1,053,913
Cash flows from operating activities 522,517 501,879 279,566
Shareholders’ Equity
Number of Employees
Closing Share Price
Long-Term Obligations
Total Revenue
Diluted EPS Excluding Specific Items2
Cash and Cash Equivalents
Cash Flows from Operating Activities
Diluted EPS
Product Sales
837 887 1,021 879 938 1,068 $1.00 $1.54 $1.32 $1.34 $1.92 $2.75 34 445 835
445 413 401 1,054 1,228 1,302 280 502 523 2,291 1,744 1,603 $16.53 $23.73 $21.16
Millions of U.S. dollars, except EPS figures, closing share price and number of employees.1 Data has been adjusted to reflect the restatement of the Company's previously issued financial statements, as more fully described in note 3 to the Company's restated
audited consolidated financial statements for the year ended December 31, 2006.2 Specific items include asset impairments, contract-loss provisions, restructuring charges, acquired research and development, litigation settlements, and inventory write-offs.
For a reconciliation of GAAP diluted EPS to diluted EPS excluding specific items, please see page 49.
1 1 1

2The Company’s core competency lies in its expertise
in the development and large-scale manufacturing of
pharmaceutical products incorporating oral drug-
delivery technologies. Biovail has a broad portfolio of
proprietary drug-delivery technologies that represent the
foundation upon which the Company’s strategy is based.
Biovail continues to differentiate itself from competitors
in the drug-delivery industry through its proven track
record of success in developing and manufacturing large
commercial quantities of controlled-release drug products,
including Wellbutrin XL®, Tiazac®, Tiazac® XC, Cardizem® LA
and more recently, Ultram® ER.
The Company’s broad portfolio of oral drug-delivery tech-
nologies includes controlled release, graded release,
enhanced absorption, rapid absorption, taste masking, and
oral disintegration, among others. These technologies can
be combined to develop, for example, a controlled-release,
orally disintegrating, taste-masked tablet. These drug-
delivery technologies are applicable to a wide range of
molecules, and can, in many areas, address the pharma-
ceutical industry’s more complex drug-delivery challenges.
As a result, to prioritize those products with the highest
market potential, the Company employs a market-driven
selection process for its drug-development pipeline
candidates. The first step is to identify disease states
and medical disorders for which there are unmet medical
needs, or in which therapeutic gaps exist in the treatment
of those conditions. The next step is to review the currently
available treatment options, and assess the feasibility of
using the Company’s drug-delivery technologies to develop
a product that improves upon those options, potentially
providing clinically meaningful benefits to patients.
Product candidates that meet these rigorous screening
criteria are then considered for addition to Biovail’s
development pipeline.
To this end, Biovail focuses its research-and-development
activities on three core segments – enhanced formulations
of existing products; combination products incorporating
different classes of drugs; and difficult-to-manufacture
generic pharmaceuticals.
Biovail Corporation is a specialty pharmaceutical companythat applies advanced drug-delivery technologies to improvethe clinical effectiveness of medicines, and to develop controlled-release generic products. The Company drivesbusiness growth by commercializing these products bothdirectly (in Canada) and through partners (in the U.S.and other markets). Biovail’s main therapeutic areas offocus are central nervous system (CNS) disorders, painmanagement and cardiovascular disease.
Corporate Profile

3
2006 Annual Report
Biovail aspires to be the world’s premier specialty pharmaceutical company.
VisionBiovail is a specialty pharmaceutical company that applies advanced drug-delivery technologies to improve the clinical effectiveness of medicines. Biovail drives business growth by commercializing these products both directly and through partners.
Mission

4
DRUG-DELIVERY TECHNOLOGIES
Biovail regards its drug-delivery technologies as a key
differentiator and core competency given its past success
with the development, large-scale manufacture and
commercialization of a number of products such as
Wellbutrin XL®, Tiazac®, Tiazac® XC, Cardizem® LA and,
Ultram® ER.
Biovail has numerous and complementary drug-delivery
technologies that have enabled it to overcome significant
product-development challenges. These technologies have
in the past provided enhancements to existing compounds
that have included reducing the number of doses a patient
must take per day (once-daily dosing versus multiple
doses per day), a reduction in potentially adverse side-
effects and/or less variability of a drug in a patient’s
bloodstream over the course of 24 hours. Once-daily dosing
has been shown to provide higher levels of patient
compliance due to a simplified dosage schedule, compared
with medications that must be dosed multiple times per
day. Beyond these benefits, the primary objective of the
Company’s R&D efforts is to develop products with clinically
meaningful benefits over existing treatment options.
INTELLECTUAL PROPERTY
As with all pharmaceutical companies, a key success factor
for Biovail is the strength of its intellectual-property
portfolio. Biovail Laboratories International SRL (BLS), which
is located in St. Michael, Barbados, West Indies, directs
and controls business development and research-and-
development activities, and owns, manages and controls the
Company’s intellectual-property portfolio, and controls the
manufacturing of its products.
BIOVAIL PHARMACEUTICALS, INC.
In the United States, Biovail’s wholly owned subsidiary,
Biovail Pharmaceuticals, Inc. (BPI), distributes a number of
pharmaceutical products. Through most of 2006, BPI
employed an 85-member specialty sales force that promoted
certain products primarily to women’s health-care practi-
tioners and dermatologists. However, in December 2006,
the Company announced that it would leverage strategic
partners to promote its products to specialist physicians in
the U.S., which is consistent with its approach to commer-
cializing products in the U.S. primary-care market since
May 2005. As a result, the BPI specialty sales force and
related support functions were eliminated. Following this
decision, BPI ceased its co-promotional efforts for Ultram®
ER and Zoladex® 3.6mg, and on December 20, 2006,
entered into an exclusive promotional services agreement
with Sciele Pharma, Inc. whereby Sciele’s sales force now
promotes Biovail’s topical antiviral line, Zovirax® Ointment
and Zovirax® Cream, to U.S. physicians.
In May 2005, Biovail had similarly realigned its U.S. sales
and marketing operations, changing the manner in which
its products were commercialized to the primary-care
segment of the U.S. market. Following this realignment,
the Company ceased direct promotion of its products to
a broad audience of primary-care physicians in the
U.S., and entered into a multi-faceted transaction with
Kos Pharmaceuticals, Inc. (Kos) with respect to certain
products being promoted to the primary-care market.
Under the agreements with Kos, Biovail manufactures,
supplies and sells Cardizem® LA to Kos for distribution at
contractually determined prices, which exceed 30% of
Kos’ net selling price. Biovail also divested all of its rights
to Teveten® and Teveten® HCT to Kos.
BPI also distributes a number of branded off-patent
products. These products — which Biovail refers to as its
“Legacy products” — include the well-known brands
Cardizem® CD, Ativan®, Vaseretic®, Vasotec®, Isordil® and
Tiazac®. These products are not actively promoted by
Biovail and represent assets for which patent protection
has expired. While the products remain well respected
by the medical community, their prescription volumes and/
or sales are in decline due to the availability of competing
generic formulations.

5
2006 Annual Report
In November 2005, Biovail announced its intention to
pursue a spin-off of substantially all these Legacy products
to shareholders. However, following further analysis of the
opportunity, and faced with the prospect of a sooner-than-
anticipated launch of a generic formulation of Wellbutrin XL®,
in 2006, the Company decided that it would retain these
assets. The profitability and cash flows associated with these
products will be reinvested in strategic growth initiatives
and other purposes.
BIOVAIL PHARMACEUTICALS CANADA
In Canada, where the market dynamics are much different
than in the U.S., the Company has maintained a direct-selling
commercial presence through Biovail Pharmaceuticals
Canada (BPC), which successfully targets both specialist
and primary-care physicians. BPC has established itself
as a leading pharmaceutical marketing and sales operation
in the Canadian market. Market research indicates that
BPC is the largest independent pharmaceutical company
that markets medicines to physicians in Canada.
In 2006, BPC expanded its sales force to 96 sales repre-
sentatives, in anticipation of new product launches. BPC
currently promotes a well-respected portfolio of products
to approximately 11,000 physicians across the country.
Products include Tiazac® XC, Wellbutrin® XL, and Glumetza™.
BPC also promotes the Lescol® franchise, pursuant to an
agreement entered into with Novartis Pharmaceuticals
Canada, Inc. in May 2006. In addition, the Company is
evaluating a number of product marketing and acquisition
opportunities that have a strategic fit and offer potential
for further growth with BPC’s commercial operations.
CONTRACT RESEARCH DIVISION
Biovail’s Contract Research Division (CRD) provides Biovail
and other pharmaceutical companies with a broad range of
Phase I and Phase II clinical research services. These involve
principally conducting pharmacokinetic studies and bioan-
alytical laboratory testing to establish a drug’s bioavailability
or its bioequivalence to another drug moiety. Clinical studies
are reviewed by an independent Research Ethics Board,
which assures that all studies are conducted in an ethical
and safe manner, without compromising the health of the
human subjects participating in them. As well, all clinical
studies are approved by Health Canada under a Clinical
Trial Application and executed under Good Laboratory
Practices (GLP) and Good Clinical Practices (GCP).
Operating as an independent division in Toronto, Ontario,
the CRD is located in a 41,000-square-foot, stand-alone
facility owned by Biovail, and a 10,500-square-foot leased
facility. These facilities include a 200-bed capacity clinic
(five study clinics and a 12-bed Phase I first-in-man unit),
a Medical Recruiting and Subject Screening Unit, a fully
equipped Bioanalytical Laboratory, and a Department of
Biopharmaceutics.
To date, the CRD has designed and conducted in excess
of 3,000 bioavailability, bioequivalence and/or drug-inter-
action studies. The therapeutic areas in which the studies
have been completed include cardiovascular disease;
cardiopulmonary; bone and joint disease; pain management;
infectious diseases; CNS; gastroenterology; and endocrinology.
In addition, the CRD has performed Phase I first-in-man
studies to establish the safety of new chemical entities.
The CRD maintains a database in excess of 85,000 adult
male and female volunteers for potential study enrolment as
well as an inventory of patient and specialty populations,
including post-menopausal, renal-impaired and diabetic
patients. The Bioanalytical Laboratory continues to add to
its inventory of over 150 developed and validated assays.
The CRD has its own independent Quality Assurance
Department to assure that the operations of the CRD are
subject to full compliance with the rules and regulations of
the U.S. Food and Drug Administration (FDA), Canadian
Therapeutic Products Directorate (TPD) and other com-
parable foreign regulatory bodies.

6
WORLD-CLASS MANUFACTURING
Biovail currently operates three pharmaceutical manu-
facturing facilities located in Steinbach, Manitoba; Dorado,
Puerto Rico; and Carolina, Puerto Rico. All these facilities
meet United States Food and Drug Administration (FDA) –
mandated and Canadian Therapeutic Products Directorate
(TPD) – mandated Good Manufacturing Practices (GMP).
At these facilities, the Company manufactures branded
products that are commercialized by Biovail’s partners,
including Wellbutrin XL®, Ultram® ER and Cardizem® LA;
and several branded products that are distributed by BPI
and BPC. Biovail also manufactures a portfolio of generic
products that are distributed by Teva and Forest in the
United States and by Novopharm Limited, a subsidiary of
Teva, in Canada.
The Company maintains quality control and experienced
manufacturing supervision at each site so that manu-
facturing, packaging and shipping activities comply with
GMP requirements.
Raw materials for Biovail’s manufacturing operations are
sourced from various FDA-approved companies worldwide.
The Company strives to have a minimum of two suppliers
for all major active pharmaceutical ingredients for its man-
ufactured products. This facilitates both the continuity of
supply of raw materials and best pricing from suppliers
based on volume and time period.


IN RECENT YEARS, THE BOARDS OF DIRECTORS OF PUBLICLY TRADED COMPANIES HAVE TAKEN ON
INCREASING AMOUNTS OF RESPONSIBILITY FOR THE DIRECTION AND SUCCESS OF THE ENTITIES
THEY SERVE. NOT ONLY MUST THEY FOCUS ON HELPING TO SECURE THE RIGHT LEADERSHIP TO
MANAGE THEIR RESPECTIVE COMPANIES, THEY HAVE TO BE SUPPORTIVE OF THAT MANAGEMENT
TEAM, AND PROVIDE THEM WITH THE TOOLS THAT THEY NEED TO EXECUTE THEIR MANDATE.
Dear Fellow Shareholders:
Eugene N. Melnyk
Chairman of the Board
CHAIRMAN’S LETTER TO SHAREHOLDERS

9
2006 Annual Report
Biovail Corporation is no exception. In what has become an increasingly strict
regulatory environment for publicly held companies in many industry sectors, all
aspects of an organization and its decision-making practices – from policies upon
which the business and its supporting functions are run, to openness and
transparency in its financial reporting, to the standards and practices and codes
of ethics that govern the behaviors of its people – are under scrutiny from multiple
groups of external stakeholders.
In June 2004, I initiated an ambitious corporate-governance enhancement program.
The enhancements we have made over the past two years have been extensive
and are ongoing. Although the Sarbanes-Oxley Act of 2002 has had a significant
influence on the breadth, depth and scope of some of these changes, new legislation
hasn’t changed our perspective. Many of these changes have been motivated by
our desire to do the right thing – to set the bar high and to look for ways to continue
to raise it. And we can’t rest on our laurels: once good corporate governance is
achieved, it needs to be maintained. The obligation to continue to raise the bar
becomes even more prevalent.
And rightly so.
Currently, there is a steadily growing trend toward ensuring that there is adequate
separation between boards of directors and the executive management team charged
with the day-to-day operations of a company. In June 2006, I relinquished the title of
Executive Chairman to serve as Chairman of the Board, a move that fulfilled my
stated intention to reduce my interaction with management.

10
At Biovail, one of the more important lessons that we have learned is that one
process does not fit all. The changes that we have made to our policies and
procedures at Biovail – both from operational and governance perspectives – have
been driven, and will continue to be driven to a large degree, by the current
status of our evolution as a company.
The dynamic nature of the pharmaceutical industry presents Biovail with multiple
challenges and opportunities. For companies to realize their goals and objectives,
they need people with strong values and integrity. As Biovail continues its quest
to become one of the world’s premier specialty pharmaceutical companies, every
employee, officer and director needs to understand the Company’s Vision,
Mission and Core Values upon which our strategies for growth have been built.
To this end, they must also understand the standards, policies and behaviors by
which we must abide as we endeavor to achieve them.
Throughout 2006, Biovail delivered an expanded Code of Employee Governance
to all of its people. Our code is comprised of three key items – our Standards of
Business Conduct, our Disclosure Policy and our Employee Report Line.
Our Standards of Business Conduct clearly and concisely articulate the expectations
and parameters that govern the conduct of all Biovail employees. It also covers
subjects such as ethical practices, competitive practices, conflict of interest, and
the overriding commitment to uphold standards of excellence, honesty and integrity.
Let me reiterate that we believe that merely meeting the requirements is not
enough. More to the point, we are fully committed to not only meeting expectations
but, wherever possible, making a concerted effort to exceed them.

11
2006 Annual Report
Biovail’s Board of Directors understands that its role is centered on setting direction
and working closely with the Company’s executives to develop business strategies.
The execution of those business strategies is the domain and mandate of the executive
management team.
The strength of Biovail’s business model was further evidenced in 2006 by the
Company’s ability to reach its financial and operational objectives in the face of
profound change. While 2007 will represent a transition year for Biovail, the
Company’s future is indeed bright largely due to the individual and collective efforts
of all Biovail’s people – their ongoing dedication and commitment to excellence
and to drive long-term growth is reflected in the Company’s many successes.
On behalf of Biovail’s Board of Directors, its management team and our many
employees, I would like to thank you, our shareholders, for your confidence and
your continued support.
Eugene N. MelnykChairman of the Board

IN 2006, BIOVAIL EXECUTED AGAINST ITS STATED FINANCIAL AND OPERATIONAL OBJECTIVES AS THE COMPANY
GENERATED RECORD REVENUES AND ROBUST CASH FLOW FROM OPERATIONS. OVERALL, OUR PRODUCTS
PERFORMED VERY WELL, ENABLING THE COMPANY TO SURPASS THE $1-BILLION MARK IN ANNUAL REVENUES FOR
THE FIRST TIME IN ITS HISTORY. OUR STRONG FINANCIAL RESULTS ALLOWED US TO END THE YEAR WITH MORE
THAN $830 MILLION IN CASH, WHICH HAS PROVIDED US WITH THE RESOURCES TO PURSUE A NUMBER OF
STRATEGIC INITIATIVES, INCLUDING THE PLANNED APRIL 2007 ELIMINATION OF ALL LONG-TERM DEBT. AND
THOSE RESULTS MADE IT POSSIBLE FOR US TO PAY $80 MILLION IN DIVIDENDS TO OUR SHAREHOLDERS IN
2006, AND INTRODUCE A NEW DIVIDEND POLICY COMMENCING IN 2007 THAT CONTEMPLATES TRIPLING
THE PAYMENT OF AN ANNUAL DIVIDEND TO $1.50 PER COMMON SHARE.
Dear Fellow Shareholders:
Douglas J.P. Squires
Chief Executive Officer
CEO’S LETTER TO SHAREHOLDERS

13
2006 Annual Report
Clearly, the past year presented Biovail with many challenges – most notably
the loss of market exclusivity for the 300mg strength of Wellbutrin XL® in the United
States. Although this development was disappointing, every company in the pharma-
ceutical industry – and virtually every product that those companies produce – will,
at some point, face competition from generic products. And Biovail is no exception.
In March 2007, Biovail entered into comprehensive legal settlements related to
Wellbutrin XL® with Anchen Pharmaceuticals LLP, Impax Laboratories, Inc., Watson
Pharmaceuticals, Inc. and Teva Pharmaceutical Industries Ltd. The settlements
include, among other things, the dismissal of Biovail’s patent-infringement actions
against each of Impax and Watson related to their abbreviated new drug applications
for generic formulations of Wellbutrin XL®. Under the terms of the agreement, with
defined exceptions, none of Teva, Anchen, Impax and Watson may market a generic
version of the 150mg strength of Wellbutrin XL® until 2008. The resolution of these
legal actions – which allow for the entry of generic competition before the expiration
of Biovail’s patents – eliminates costs and the uncertainty associated with any
litigation, and will have a positive impact on Biovail’s financial performance in 2007.
FOCUS ON RESEARCH & DEVELOPMENT
In the face of these developments, Biovail’s business model remains sound, and
continues to generate strong cash flows, which we will deploy in pursuit of our growth
objectives, while we provide an attractive dividend to our shareholders. We will invest
significantly in research and development (R&D), which we continue to view as the
lifeblood of the Company. To this end, we are targeting an investment in R&D of up to
$500 million through 2010.
Following a comprehensive review of all aspects of the Company’s business, in
December 2006, Biovail announced that it would no longer maintain a sales organiza-
tion in the United States and that it intends to enter into supply-and-distribution
agreements with strategic partners to target physicians groups in the U.S. This
approach is consistent with the strategy we announced in May 2005 to engage strategic
partners to commercialize products to primary-care physicians (general practitioners).
This “back-to-basics” approach provides significant cost savings and operational
efficiencies; furthermore, it is consistent with our heritage, and is what has made
Biovail so successful over the past decade – the development and large-scale manu-
facture of pharmaceutical products that incorporate our drug-delivery technologies.
14
Further to this revised commercialization strategy in the U.S., in late December,
Biovail entered into a five-year, exclusive promotional services agreement with Sciele
Pharma, Inc., whereby Sciele’s sales force now promotes our antiviral product line,
Zovirax® Ointment and Zovirax® Cream, to U.S. physicians. Since Biovail acquired
these products in 2001, prescription volume has increased by 26%.
These changes to our U.S. commercialization strategy did not impact Biovail
Pharmaceuticals Canada (BPC), which marked its 10th anniversary in 2006. The
relative size of the Canadian pharmaceutical market, which differs vastly from the
U.S., makes it more feasible for Biovail to maintain a direct sales force that effectively
targets both specialists and high-prescribing primary-care physicians. To this end, in
April 2006, BPC’s 96-member sales force launched Wellbutrin® XL to physicians
across Canada. In addition, our business development team is actively seeking to
identify new product opportunities to add to BPC’s portfolio.
RECORD FINANCIAL RESULTS
Total revenues for the year ended December 31, 2006, were $1.07 billion, compared
with $938.3 million for the full year 2005, an increase of 14%.
In 2006, Biovail’s U.S. GAAP net income declined 14% to $211.6 million, compared
with $246.4 million for 2005. Fully diluted GAAP earnings per share (EPS) for 2006
were $1.32 versus $1.54 in 2005. However, net income in 2006 was negatively
impacted by a number of items, including a $147.0-million non-cash write-down of
intangible assets; a $54.8-million charge related to contract-loss provisions in our
agreements with GlaxoSmithKline plc (GSK) for Wellbutrin XL® and with Kos
Pharmaceuticals, Inc. (Kos) for Cardizem® LA; a $15.1-million charge related to the
December 2006 restructuring of the Company’s U.S. commercial operations; $14.4
million in litigation-settlement costs related to the Wellbutrin XL® patent-infringement
actions; and the Company’s licensing in 1999 of Adalat CC products from Elan
Pharmaceuticals, plc (Elan). These were partially offset by a $4.0-million gain related
to the termination of our agreement with Athpharma. Excluding these items, net
income was $440.6 million in 2006, compared with similarly adjusted net income of
$307.1 million in 2005, an increase of 43%.
15
2006 Annual Report
Product sales for the full year 2006 were a record $1.02 billion, compared with
$887.1 million in 2005, an increase of 15%. The solid performance of Biovail’s
product portfolio in 2006 was primarily driven by Wellbutrin XL®, Ultram® ER and
the Zovirax® franchise, and partially offset by declines in BPC revenues.
Wellbutrin XL® again performed above expectations, generating revenues of $450.3
million in 2006, compared with $354.2 million for 2005. This can be attributed to
strong prescription growth, combined with price increases implemented by marketing
partner GSK.
In late February 2006, Biovail and marketing partner, Ortho-McNeil, Inc. (OMI), a
division of Johnson & Johnson, launched Ultram® ER, the first once-daily formulation
of tramadol to be approved in the U.S. for the treatment of moderate to moderately
severe chronic pain in adults. In 2006, Ultram® ER generated $53.7 million in
revenues for Biovail. In the last several months, OMI has undertaken a number of
initiatives in an attempt to accelerate prescription growth for Ultram® ER, including an
unbranded direct-to-consumer (DTC) advertising campaign, a discount-card program
and an increase to 30 tablets (from seven) in the size of samples to allow patients to
be optimally titrated to higher dosage strengths. We are monitoring the impact of
these initiatives.
Revenues for Biovail’s Zovirax® franchise were $112.4 million in 2006, an increase of
17%, compared with the $95.9 million in 2005. In the fourth quarter of 2006,
Zovirax® Ointment and Zovirax® Cream held a combined 71.4% share of the topical
herpes market, an increase of 4.6 percentage points in market share, compared with
the corresponding period for the previous year.
In 2006, BPC generated revenues of $68.7 million, compared with $99.5 million in
the full year of 2005. The performance of this division continued to be significantly
impacted by the recent introduction of generic competition for Wellbutrin® SR and
Tiazac®. Partially offsetting this decline is the continued growth of Tiazac® XC and
Wellbutrin® XL. Total prescription volume for Tiazac® XC, which was launched in
January 2005, increased 181% in 2006. Launched in April 2006, Wellbutrin® XL held a
21.6% share of the bupropion market (including generics), in the fourth quarter of 2006.

16
Cardizem® LA generated revenues of $56.5 million in 2006, compared with $62.5
million in the full year of 2005. Biovail manufactures and supplies Cardizem® LA to
Kos at contractually determined prices that are in excess of 30% of their net selling
prices. The decrease primarily reflects manufacturing issues that resulted in market
shortages of the lower-strength (120mg and 180mg) tablets, partially offset by price
increases taken by Kos. Biovail has now returned to full production of these strengths.
REGULATORY, PRODUCT-DEVELOPMENT MILESTONES
The positive momentum generated in 2005 when the Company received an unprece-
dented five product approvals and one tentative product approval in the U.S. and
Canada carried over into the early part of 2006 as Biovail received approval from the
Therapeutic Products Directorate (TPD) for Wellbutrin® XL in Canada.
In 2006, our marketing partner, GSK submitted applications to a number of European
countries for Wellbutrin XL®. In January 2007, GSK announced that The Netherlands
was the first European country to approve the product, which will be most commonly
marketed as Wellbutrin XR®. GSK anticipates that the regulatory agencies in various
other European countries will grant national licenses throughout 2007, and that the
medicine could begin to be available to patients starting in April 2007. Pursuant
to the agreement signed in 2001 between Biovail and GSK, Biovail will manufacture
and supply the product to GSK at a fixed, contractually determined price.
In November 2006, Biovail’s New Drug Submission (NDS) to the Therapeutic Products
Directorate (Canada) for BVF-127, a once-daily extended-release tramadol for the
management of moderate to moderately severe chronic pain in adults, was accepted
for review.
Development efforts continued for a number of high-priority programs, including
BVF-033, a new salt formulation of bupropion that we believe may provide unique
safety benefits. In September 2006, we submitted a New Drug Application (NDA) for
this product to the FDA. The action date for the NDA is July 28, 2007.
The key to success in the pharmaceutical industry is a robust development pipeline.
To this end, Biovail recently completed a comprehensive review of its pipeline, and

17
2006 Annual Report
is focusing its R&D efforts on a number of core programs, several of which remain
undisclosed, for competitive reasons. There are three key focus areas for Biovail’s
pipeline activities – the development of enhanced formulations of existing drugs; the
development of combination products that incorporate different classes of drugs; and
difficult-to-manufacture generic products, where competition is more limited, and
consequently, commercial pricing and gross margins potentially higher.
Products under development include BVF-146, a combination product that incorpo-
rates Biovail’s once-daily tramadol formulation with an undisclosed non-steroidal
anti-inflammatory drug, or NSAID, and for which Phase III studies were initiated in
October 2006; BVF-045, a combination product comprised of Biovail’s bupropion salt
with another undisclosed anti-depressant agent; and BVF-012, an enhanced absorption,
alcohol-resistant formulation of venlafaxine.
Additionally, further to an agreement with France-based Ethypharm S.A., we’re
developing four products – BVF-087 and BVF-065, which target large markets in
central nervous system disorders; BVF-239, a cardiovascular product; and BVF-300,
a product that targets the gastrointestinal-disease market. These products have
aggregate annual revenues, according to IMS, of over $9 billion. And in February
2007, we reached an agreement with Depomed, Inc. that provides Biovail with access
to Depomed’s proprietary AcuForm™ drug-delivery technology for the development of
up to two undisclosed products.
We have now completed the previously announced expansion and optimization of
our manufacturing facility in Steinbach, Manitoba. This expansion enables the
Company to better meet current and anticipated demand for its portfolio of products.
The project, the third such expansion of Steinbach in the past five years, resulted in
the addition of approximately 65,000 square feet to the facility.
THE ROAD AHEAD
Let me reiterate that Biovail is on solid financial and operational footings. The Company’s
record level of operating cash flows in 2006 (over $520 million) has further solidified
its financial position, and has provided Biovail with the resources to pursue a number

18
of strategies to take us through the next phases of our evolution. These cash flows have
also provided us with the resources to continue to build the Company through a focused
investment in R&D, and to return value to our shareholders in the form of dividends.
Although 2006 was a year of great accomplishment, much work remains to be done.
Make no mistake: Biovail’s Board of Directors, its management team and employees are
determined to continue to succeed. The road to success is built on hard work. Our
employees reiterate that commitment individually and collectively each and every day
by embracing The Spirit of Biovail, and through the individual and collective actions we
take toward the realization of these mission-critical objectives.
Without question, 2006 posed its share of challenges for Biovail. But I’m pleased to
say that we responded strongly to each and every one of them. Going forward, we are
grateful for the extraordinary opportunities that exist to build our business, and to
enhance the quality of life for those who take the medicines we produce.
On behalf of Biovail’s executive team and our employees, I would like to take this
opportunity to extend our thanks to our Board of Directors and shareholders for their
continued support.
Douglas J.P. SquiresChief Executive Officer

"IN 2006, BIOVAIL CONTINUED TO STAY ATOP OF BEST PRACTICES IN
CORPORATE GOVERNANCE. THE COMPANY REVIEWED, UPDATED AND
ENHANCED ITS CODE OF EMPLOYEE GOVERNANCE, TO WHICH ALL
EMPLOYEES WERE RECERTIFIED. THESE ACTIONS REFLECT ONE OF OUR KEY
OBJECTIVES – TO CONTINUE TO STRENGTHEN OUR BUSINESS POLICIES AND
PRACTICES IN SUPPORT OF A CULTURE WHICH ADVOCATES TRANSPARENCY
AND ACCOUNTABILITY."
Wendy KelleySenior Vice-President, General Counsel and Corporate Secretary

“2006 WAS A REMARKABLE YEAR FOR BIOVAIL. IN EXECUTING ITS BUSINESS
PLAN, THE COMPANY SURPASSED $1-BILLION IN REVENUES FOR THE FIRST
TIME, GENERATING RECORD CASH FLOW FROM OPERATIONS OF OVER $520
MILLION AND ENDING 2006 WITH OVER $830 MILLION IN CASH. OUR BUSINESS
MODEL ALLOWS US TO PLAN FOR A SIGNIFICANT INCREASE IN FUTURE R&D
SPENDING, ELIMINATE DEBT, AND SIGNIFICANTLY INCREASE OUR PLANNED
DIVIDEND PAYMENTS TO SHAREHOLDERS. ALL OF US AT BIOVAIL REAFFIRM
OUR COMMITMENT TO BECOMING ONE OF THE WORLD’S PREMIER SPECIALTY
PHARMACEUTICAL COMPANIES WITH A PRIMARY GOAL OF MAXIMIZING
SHAREHOLDER VALUE.”
Kenneth G. HowlingSenior Vice-President,Chief Financial Officer

21
2006 Annual Report
RESTRUCTURING OF U.S. OPERATIONS
In 2006, as part of a comprehensive review of all aspects of its business, and in an effort to reduce operating costs
and improve operating efficiencies, Biovail made the decision to leverage strategic partners to promote its products
to specialist physicians in the United States. As a result, the Company decided that it would no longer maintain a
U.S.-based sales organization. This restructuring has enhanced the operational efficiency of Biovail’s business
model, and has laid the foundation for a more cost-effective way for the Company’s products to be commercialized
in the U.S. market.
This approach – to enter into supply-and-distribution agreements with strategic partners – is consistent with the
Company’s May 2005 decision to commercialize products in the U.S. primary-care market. It is also reflective of the
fact that the existing infrastructure was under-utilized, and that product-acquisition opportunities, many of which
were evaluated by the Company, did not meet Biovail’s financial criteria.
As a consequence of the restructuring, Biovail Pharmaceuticals, Inc.’s (BPI) specialty sales force and related support
functions were eliminated. Accordingly, BPI ceased co-promotional efforts for Ultram® ER and Zoladex® 3.6mg. Ortho
McNeil, Inc. now manages all promotional activity for Ultram® ER. With respect to Zovirax®, in late December, Biovail
entered into an exclusive promotional services agreement with Sciele Pharma, Inc.
In addition, after a comprehensive analysis of each of Biovail’s corporate and functional areas, overhead and infrastructure
costs were reduced to improve operating efficiencies. The cost-cutting measures resulted in a restructuring charge of
$15.1 million (primarily related to severance costs) – the majority of which was booked in the fourth quarter of 2006.
2006 Highlights
SCIELE PARTNERSHIP
Under the terms of the agreement with
Sciele Pharma, Inc., which has an initial
term of five years, Sciele’s primary-care
and women’s health sales forces now
provide detail and sampling support for
Zovirax® Ointment and Zovirax® Cream –
promoting it to U.S. physicians. In addition,
Sciele is entitled to incentive fees if
certain baseline revenue targets are met.
Within the topical antiviral market, the
Zovirax® line held a 71.4% share at the
end of 2006. Since October 2001, the
time at which Biovail acquired the topical
formulations of Zovirax®, market share has
increased by 26%.
ZOVIRAX® – MONTHLY SHARE OF TOPICAL ANTIVIRAL MARKET

22
PAYMENT OF DIVIDENDS
Biovail’s strong cash balances and robust operating cash
flows provided the Company with an opportunity to offer
total dividends of $80 million to its shareholders throughout
2006 as per its dividend policy established in 2005.
On March 23, 2006, Biovail announced that the Company’s Board
of Directors had declared a quarterly cash dividend of US$0.125 per
share payable on April 28, 2006, to shareholders of record at the
close of business on April 7, 2006.
On May 11, Biovail announced that the Company’s Board of
Directors had declared a quarterly cash dividend of US$0.125 per
share payable on May 31, to shareholders of record at the close of
business on May 23.
On August 10, Biovail announced that the Company’s Board of
Directors had declared a quarterly cash dividend of US$0.125 per
share payable on September 1, to shareholders of record at the
close of business on August 18.
On November 9, Biovail announced that the Company’s Board of
Directors had declared a quarterly cash dividend of US$0.125 per
share payable on November 30, to shareholders of record at the
close of business on November 22.
Dividends declared by Biovail since it adopted a dividend
policy in November 2005 are shown in the table below.
REVISED DIVIDEND POLICY
Given the December 2006 restructuring of the Company’s
U.S. commercial operations and the decision to focus on
driving business growth through a targeted investment in
high-priority research-and-development programs, Biovail is
no longer pursuing commercial-product acquisitions in the
U.S. market.
As a result of this change of focus, the Company undertook
a comprehensive analysis of its research-and-development
spending requirements for the coming years. Given Biovail’s
strong cash balances at the end of 2006, and the robust
cash-flow generation of the Company’s business model,
Biovail’s Board of Directors decided that there was likely
to be significant excess cash on hand after funding the
Company’s growth strategy over the foreseeable future.
Accordingly, in December 2006, the Company adopted a
new dividend policy that contemplates the payment of an
annual dividend of $1.50 per common share (paid quarterly
in increments of $0.375 per common share subject to
Board approval), a 200% increase relative to the former
dividend policy. In addition, Biovail may approve the payment
of future special dividends, subject to positive business
trends and at the discretion of the Board. For example, as
a result of the strong financial performance in 2006, the
Company declared the payment of a special cash dividend
of $0.50 per share, which was paid in January 2007.
The change in Biovail’s dividend policy is representative
of management’s confidence in the sustainability of
strong cash flows and the strength of the Company’s
business model.
December 14, 2005 $0.50 Special
April 28, 2006 $0.125 Quarterly
May 31, 2006 $0.125 Quarterly
September 1, 2006 $0.125 Quarterly
November 30, 2006 $0.125 Quarterly
January 22, 2007 $0.50 Special
April 3, 2007 $0.375 Quarterly
May 29, 2007 $0.375 Quarterly

23
2006 Annual Report
ELIMINATION OF DEBT
In 2006, Biovail announced its intention to eliminate its
long-term debt, and in February 2007, called for the
redemption of all outstanding 7 7/8% Senior Subordinated
Notes due April 1, 2010. Upon the redemption, effective
April 1, 2007, Biovail will be debt-free. As per the Notes’
indenture, the Company will be required to a pay a 1.969%
premium for the early redemption of the Notes. From a cash
earnings-per-share perspective in 2007, the redemption is
expected to be neutral, as the significant savings in interest
expense will be offset by the call premium and lower
interest income on cash balances.
This fiscally prudent initiative will save Biovail over $31
million in annual interest payments – money that can be
reinvested into the Company’s development pipeline or other
growth initiatives. Biovail’s strong cash balances at the end
of 2006 – over $830 million – in conjunction with the strong
cash-generation power of its business model, allowed for
the early redemption of the Notes, while not compromising
the Company’s long-term growth strategy, nor the ability to
provide its shareholders with an attractive dividend.

WELLBUTRIN XL®(BUPROPION HYDROCHLORIDE)

25
2006 Annual Report
Wellbutrin XL® was once again Biovail’s key growth driver, generatingrevenues of $450.3 million in 2006, a 27% increase relative to 2005.This performance reflects the product’s continued uptake in the U.S. anti-depressant market, prior to the mid-December launch of a genericformulation of the 300mg strength of Wellbutrin XL®. Total prescriptionsfor Wellbutrin XL® in 2006 increased 15% compared with the previous year.
In June 2006, Biovail marketing partner GSK announced that WellbutrinXL® had received FDA approval for the treatment of seasonal affectivedisorder (SAD), a condition that affects about 6% of American adults.Wellbutrin XL® is the first and only medication approved by the FDA toprevent seasonal major depressive episodes.
Wellbutrin® XL strengthened its position in the Canadian anti-depres-sant market throughout 2006. Launched in April 2006 by the BPCsales force, Wellbutrin® XL managed to capture just over 11% of totalbupropion prescriptions in Canada in 2006; in December 2006, thatfigure was approximately 24%. This strong performance partially offsetthe impact of the introduction of generic competition for Wellbutrin SR®
in 2005.
In terms of seeking opportunities in new markets, in February 2006,Biovail marketing partner GSK announced that it had submitted anapplication for the regulatory approval of Wellbutrin XL® in severalEuropean markets. In January 2007, GSK announced that The Netherlandswas the first European country to approve the product, which will be mostcommonly marketed as Wellbutrin XR®. GSK anticipates that the regula-tory agencies in various other European countries will grant nationallicenses throughout 2007, and that the medicine could begin to beavailable to patients starting in April 2007. Pursuant to the agreementsigned in 2001 between Biovail and GSK, Biovail will manufacture andsupply the product to GSK at a fixed, contractually determined price.

In November 2005, Biovail entered into a 10-year supply agreement withmarketing partner Ortho-McNeil, Inc. (OMI), a Johnson & Johnson company,for the distribution of Biovail’s extended-release formulation of tramadol,which has been branded Ultram® ER. Pursuant to that agreement, Biovailmanufactures and supplies the product to OMI for distribution in the UnitedStates and Puerto Rico at contractually determined supply prices that rangefrom 27.5% to 37.5% of OMI’s net selling price for Ultram® ER, dependingon the year of sale. The supply price was at the lowest end of the range in2006, and will be at the highest end of the range in each of 2007 and 2008.
ULTRAM® ER (TRAMADOL HYDROCHLORIDE)

27
Ultram® ER, which was approved by the FDA in September 2005, is the firstonce-daily tramadol product available in the United States for the treatment ofmoderate to moderately severe chronic pain in adults. Available in 100mg,200mg and 300mg dosage strengths, Ultram® ER was launched to U.S. physicians in February 2006, and has made steady progress in the U.S. painmarket. Net revenues for the product in 2006 were $53.7 million, whichincludes a $7.8-million negative impact associated with costs related to a voluntary recall of certain tablet strengths in June 2006.
Biovail and OMI believe that Ultram® ER is well positioned on the pain ladderbetween non-steroidal anti-inflammatory drugs, or NSAIDs, and more potentproducts, such as hydrocodone.
Biovail and OMI are optimistic and confident that a significant market opportu-nity exists for Ultram® ER. When compared with several highly successful chronic-pain product launches, Ultram® ER performed well in its first 12 monthson the market, as demonstrated in the chart below.
Source: The National Prescription Audit Plus, IMS Health
CHRONIC PAIN MEDICATIONS – LAUNCH COMPARISON
2006 Annual Report
28
In 2006, several of Biovail’s products made
critical strides on the regulatory and research-
and-development fronts. These developments
have set the stage for a number of exciting
possibilities in 2007 and beyond.
January The Therapeutic Products Directorate (TPD), Canada’s
regulatory agency for pharmaceuticals, issues a Notice of
Compliance for Biovail’s New Drug Submission (NDS) for
the 150mg and 300mg tablet strengths of Wellbutrin® XL
for the treatment of major depressive illness in adults. The
TPD completes its review six months ahead of schedule. In
2006, the Canadian anti-depressant market was valued at
approximately C$900 million.
February Biovail’s marketing partner, GlaxoSmithKline plc (GSK), files
for regulatory approval of Wellbutrin XR® in several key European
markets, including Germany, Italy and Spain.
The application is the first for a once-daily noradrenaline
dopamine reuptake inhibitor (NDRI) for the treatment of
depression in Europe.
April Biovail officially launches Wellbutrin® XL – the first once-daily
extended-release formulation of bupropion hydrochloride for
the treatment of depression in adults – to the Canadian market.
Wellbutrin® XL is marketed and distributed by Biovail
Pharmaceuticals Canada (BPC), the Canadian sales and
marketing division of Biovail Corporation.
June GSK announces that it has received approval from the U.S.
Food and Drug Administration (FDA) for Wellbutrin XL® for
the prevention of seasonal major depressive episodes in
patients with a diagnosis of seasonal affective disorder
(SAD), a condition affecting about 6% of American adults.
Wellbutrin XL® is the first and only medication approved to
prevent seasonal major depressive episodes.
September Biovail submits its New Drug Application (NDA) to the
FDA for BVF-033 – a novel bupropion salt. Biovail believes
that BVF-033 may offer a superior safety profile to bupropion
hydrochloride, the active ingredient in Wellbutrin® XL. BVF-033
is also resistant to interactions with alcohol. The FDA action
date is July 28, 2007.
Biovail’s bupropion salt formulation is also being used as
the platform for a bupropion combination product, BVF-045,
which combines two anti-depressant drugs that target different
neural pathways important in depression. The Company believes
that BVF-045 may provide physicians a novel treatment
option that may be particularly effective in the treatment of
this prevalent disease.
Biovail submits an NDS to the TPD for BVF-127, a once-
daily extended-release tramadol formulation for the treatment
of moderate to moderately severe chronic pain in adults.
The size of the Canadian pain market in 2006 was valued
at over C$1 billion.
October Biovail initiates the Phase III clinical program for BVF-146,
a combination product consisting of the Company’s once-
daily tramadol formulation with an undisclosed non-steroidal
anti-inflammatory drug, or NSAID. The Company believes
that BVF-146 may provide physicians with a single-tablet
option that incorporates two separate classes of drugs – a
centrally acting analgesic, tramadol, with an anti-inflammatory
agent – which may provide a synergistic approach to the
management of pain and inflammation.
December Biovail amends its April 2002 agreement with Ethypharm
S.A. to include the development of four undisclosed products.
Among these are BVF-087 and BVF-065, which target large
markets in central nervous system disorders; BVF-239, a
cardiovascular product; and BVF-300, a product targeting the
gastrointestinal-disease market. In aggregate, these novel
formulations target brands with annual U.S. sales in excess of
$9 billion, according to IMS Health.
Regulatory, R&D Successes

“THE DRUG-DELIVERY TECHNOLOGIES WHICH FUEL OUR PRODUCT PIPELINE ARE
BIOVAIL’S KEY COMPETITIVE DIFFERENTIATORS AND ARE OUR PLATFORM FOR
FUTURE GROWTH. OUR STRATEGY TO TAKE THOSE PROPRIETARY TECHNOLOGIES
AND AGGRESSIVELY PURSUE WAYS TO ENHANCE FORMULATIONS OF EXISTING
DRUGS EXTENDS THEIR EXCLUSIVITY THROUGH THE STAGED INTRODUCTION OF
PRODUCT ENHANCEMENTS. THIS ENABLES US TO DEVELOP NEXT-GENERATION
MEDICINES THAT PROVIDE CLINICALLY MEANINGFUL BENEFITS; POTENTIALLY
MAKING IMPROVEMENTS TO THE LIVES OF THE PATIENTS WHO USE THEM.”
Dr. Peter SilverstoneSenior Vice-President,
Medical and Scientific Affairs

THE POWER OF
2006 was not only significant from a financial perspective: it also marked the 10-year anniversary
for a number of significant events in Biovail's history.
TIAZAC’S 10-YEAR ANNIVERSARY
2006 marked the 10th anniversary of the U.S. launch of
Tiazac®, a once-daily formulation of diltiazem developed
by Biovail indicated for the treatment of hypertension and
angina. Tiazac® was launched by Forest Laboratories, Inc.
(Forest) to physicians in the United States in February 1996.
The launch of Tiazac® was a watershed event in Biovail’s
history, as it represented the first product that Biovail man-
ufactured in commercial-scale quantities. Prior to Tiazac®,
Biovail’s revenues were largely limited to single-digit
royalties on a number of controlled-release products.
Tiazac® marked the initiation of Biovail’s ascent into one of
the world’s leading specialty pharmaceutical companies.
Through Forest’s focused promotional efforts, Tiazac® went
on to capture a 21% share of the once-daily diltiazem
market, and became Biovail’s largest product for several
years. In 2002, Tiazac® generated U.S. revenues of over
$80 million for Biovail.
However, as with virtually every pharmaceutical product,
Tiazac® succumbed to generic competition in April 2003.
Upon the introduction of the first generic formulation
of Tiazac®, Forest ceased promotional support for the product
and began to distribute a Tiazac® generic on our behalf.
That distribution agreement continues today.
10

31
2006 Annual Report
In Canada, Tiazac® was officially launched in May 1997
by Biovail’s Canadian sales and marketing division, then
called Crystaal Pharmaceuticals. Tiazac®’s success in the
Canadian market, as measured by its market share, would
eventually surpass that of Tiazac®’s U.S. experience – a
testament to the effort of the Company’s Canadian sales
force.
In 2005, prior to the introduction of generic competition to
Tiazac® in Canada, Biovail launched the next-generation
formulation of the franchise, Tiazac® XC. The new formu-
lation featured a new Diffusion Technology (DiTech™)
delivery system designed for night-time administration,
resulting in improved 24-hour blood-pressure (BP) control
with additional BP control during the early-morning hours,
when the incidence of adverse cardiac events is highest.
In 2006, Tiazac® XC captured 26.5% of new prescriptions
written for the Tiazac® brand (including generics), mitigating
the effect of generic competition, which began in January
2006, to Tiazac®. Concurrently, Biovail launched its own
generic formulation of Tiazac® through a distribution
agreement with Novopharm Limited, a subsidiary of Teva
Pharmaceutical Industries Ltd.
10 YEARS ON THE NYSE
On December 11, 2006, Biovail celebrated its 10th
anniversary of listing on the New York Stock Exchange
(NYSE), by ringing the Opening Bell at one of the
world’s pre-eminent stock exchanges. This marks the
second time that Biovail has been involved in a ceremonial
stock exchange opening at the NYSE; the first time was
the date of its initial listing on December 12, 1996.
To commemorate the occasion, Chairman Eugene Melnyk
and Myrna Escandor, Biovail’s longest-serving employee,
rang the Opening Bell at 9:30 a.m. EST to officially
launch the day’s trading. Several members of Biovail’s
management team, and the Company’s Board of Directors,
were also in attendance.
Biovail was originally listed on the NASDAQ exchange in
1994, transferred to the American Stock Exchange that
same year and then moved to the NYSE.
BPC’S 10TH ANNIVERSARY
In 2006, Biovail Pharmaceuticals Canada celebrated its
first decade of existence. For 10 years, BPC (previously
Crystaal Pharmaceuticals) has aggressively pursued new
opportunities to market products that make a positive
impact on the lives of Canadians.
With a proven-track record, which includes an impressive
list of high-performing pharmaceuticals, including Tiazac®,
Tiazac® XC, Celexa, Wellbutrin SR®, Wellbutrin® XL, Monocor®
and Retavase®, BPC was, and continues to be, a key player
in the Canadian pharmaceuticals market.
To commemorate the special occasion, on April 10, 2006,
more than 200 Biovail employees attended a celebration
at The Carlu – a historic venue in downtown Toronto. The
event paid homage to the past, but also drew attention to
the future, recognizing that BPC’s accomplished history
gives it a solid platform upon which to launch the next
phases of its growth. To this end, Biovail is actively pursuing
a number of potential product-acquisition opportunities for
the Canadian market.

“THROUGHOUT THE PAST 10 YEARS – A TESTAMENT TO ITS R&D FORTITUDE –
BIOVAIL HAS BROUGHT OVER 15 PHARMACEUTICAL PRODUCTS TO THE U.S. AND
CANADIAN MARKETPLACES, AND HAS GENERATED APPROXIMATELY $5 BILLION IN
PRODUCT REVENUES. WITH OUTSTANDING SCIENTIFIC PERSONNEL ACROSS OUR
LOCATIONS, BIOVAIL CONTINUES TO LEVERAGE ITS STATE-OF-THE-ART DRUG-
DELIVERY TECHNOLOGIES TO DEVELOP HIGH-VALUE ENHANCEMENTS AND
MODIFICATIONS TO NEW AND EXISTING MOLECULES FOR NEAR AND LONG-
TERM GROWTH.”
Gilbert GodinSenior Vice-President,Technical Operations
and Drug Delivery
Research and Development StrategyIN LATE 2006, BIOVAIL AFFIRMED ITS COMMITMENT TO
DRIVE BUSINESS GROWTH THROUGH A RENEWED FOCUS
ON RESEARCH AND DEVELOPMENT. CONSISTENT WITH
ITS HERITAGE, THIS ‘BACK-TO-BASICS’ APPROACH
PLACES AN INCREASED EMPHASIS ON THE COMPANY’S
CORE COMPETENCY – THE DEVELOPMENT AND LARGE-
SCALE MANUFACTURE OF NOVEL MEDICINES THAT
EMPLOY THE COMPANY’S DRUG-DELIVERY TECHNOLO-
GIES – AND A FOCUS ON COST COMPETITIVENESS IN AN
EFFORT TO MAXIMIZE SHAREHOLDER VALUE.
TO THIS END, THE COMPANY ANNOUNCED THAT IT WOULD
DRIVE BUSINESS GROWTH THROUGH A TARGETED FOCUS
ON A NUMBER OF CORE RESEARCH-AND-DEVELOPMENT
PROGRAMS. THE COMPANY DECLARED ITS INTENTION
TO SIGNIFICANTLY INCREASE ITS INVESTMENT IN
RESEARCH AND DEVELOPMENT, AND EXPECTS TO SPEND
$500 MILLION ON R&D THROUGH 2010, AN INCREASE OF
APPROXIMATELY 50% OVER THE PREVIOUS FOUR YEARS.
THE COMPANY WILL FOCUS ITS EFFORTS ON THREE CORE
SEGMENTS: (1) ENHANCED FORMULATIONS OF EXISTING
DRUGS THAT CONFER MEANINGFUL THERAPEUTIC
BENEFITS TO PATIENTS; (2) COMBINATION PRODUCTS
THAT INCORPORATE TWO OR MORE DIFFERENT THERA-
PEUTIC CLASSES OF DRUGS; AND (3) DIFFICULT-TO-
MANUFACTURE GENERIC PHARMACEUTICALS.
MANY LARGE PHARMACEUTICAL COMPANIES PURSUE
LINE-EXTENSION STRATEGIES TO EXPAND UPON THE
SIGNIFICANT CLINICAL AND MARKETING INVESTMENTS
THEY HAVE MADE IN ESTABLISHING HIGH-VALUE
BRANDS. COMBINATION THERAPY IS ALSO GAINING IN
PROMINENCE WITHIN THE MEDICAL COMMUNITY, AS
PHYSICIANS SEEK TO CAPITALIZE ON THE SYNERGISTIC
EFFECTS AND POTENTIAL SUPERIOR SIDE-EFFECT
PROFILES. SUCH PRODUCTS ALSO PROVIDE AN OPPOR-
TUNITY TO LESSEN THE ‘PILL BURDEN’ ON PATIENTS.
WITH RESPECT TO GENERIC PHARMACEUTICALS,
BIOVAIL FOCUSES, AND INTENDS TO CONTINUE TO
FOCUS, ITS EFFORTS EXCLUSIVELY ON DIFFICULT-TO-
MANUFACTURE PRODUCTS, WHERE COMPETITION IS
MORE LIMITED, AND CONSEQUENTLY, COMMERCIAL
PRICING AND GROSS MARGINS ARE POTENTIALLY HIGHER.
WITH RESPECT TO DISCLOSED PIPELINE PRODUCTS,
BIOVAIL IS IN ACTIVE DISCUSSIONS WITH A NUMBER
OF PHARMACEUTICAL COMPANIES FOR COMMERCIALIZA-
TION RIGHTS. GIVEN THE INHERENT DEVELOPMENT RISK
WITH ANY PHARMACEUTICAL PRODUCT, ENGAGING
STRATEGIC PARTNERS EARLIER IN THE PRODUCT-DEVEL-
OPMENT CYCLE MAY ALLOW PROGRAMS TO PROGRESS
IN A MORE COST-EFFECTIVE MANNER, WHILE MAXIMIZING
THE AVAILABLE NUMBER OF PIPELINE OPPORTUNITIES
AND THEIR RESPECTIVE POTENTIAL FOR SUCCESS.

34
DRUG-DELIVERY TECHNOLOGIES
Biovail has numerous proprietary drug-delivery technologies
that are used to develop controlled-release, enhanced/modified
absorption and rapid-dissolve products. The Company also
has access to technologies of its development partners through
licensing agreements. These technologies enable Biovail to
develop both branded and generic pharmaceutical products.
The Company’s formulations for these products are either
patented or proprietary. Accordingly, generic manufacturers
may be inhibited from duplicating Biovail’s products or may
have difficulty duplicating its formulations by other means.
Oral controlled-release technologies permit the development of
specialized oral delivery systems that improve the absorption
and utilization of drugs by the human body. Release patterns
are characterized as either “zero order”, which indicates
constant drug release over time, or “first order”, which indicates
decreasing release over time. These systems offer a number of
advantages, in particular, they allow the patient to take only
one or two doses of the drug per day. This, combined with
enhanced therapeutic effectiveness, reduced side effects,
improved patient compliance and potential cost effectiveness,
makes controlled-release drug products ideally suited for the
treatment of chronic conditions.
Biovail’s controlled-release technologies can provide a broad
range of release profiles, taking into account the physical and
chemical characteristics of a drug product, the therapeutic
use of the particular drug and the optimal site for release of
the basic drug in the gastrointestinal tract (the “GI tract”).
The objective is to provide a delivery system allowing for a
single dose per 12-hour to 24-hour period, while assuring
gradual and controlled-release of the subject drug at a suitable
location(s) in the GI tract.
The Company’s rapid-dissolve (FlashDose®) formulations
contain the same basic chemical compound found in the
original branded products. The dry chemical compounds are
encapsulated in microspheres utilizing Biovail’s CEFORM™
technology. The Company’s Shearform™ and other orally
disintegrating tablet (ODT) technologies are used to produce
matrices or excipient blends that are subsequently combined
with the CEFORM™ microspheres. This final blend can be
compressed into rapid-dissolve tablet formulations. The benefits
of rapid-dissolve formulations include the ease of adminis-
tration for the elderly, young children, or people who may have
difficulty swallowing tablets or capsules.
Biovail’s Enhanced Absorption technology platform is unique
in the sense that various formulation and physico-chemical
tools can be applied alone or in combination to improve the
absorption profile of a drug. As examples, it may be possible to
increase the solubility, increase the amount absorbed, control
the pre-systemic metabolism, and/or increase the rate of
absorption, with or without modification of the total amount of
drug into the bloodstream.
DIMATRIX
Dimatrix is a diffusion-controlled matrix technology for water-
soluble drugs in the form of tablets. The drug compound is
uniformly dispersed in a polymer matrix. The mechanism of
release involves the swelling of polymers within the matrix,
thus enabling the drug to be dissolved and released by diffusion
through an unstirred boundary layer. The release pattern is
characterized as first order as the rate of drug diffusion out of
the swollen matrix is dependent upon the concentration gradient.
SMARTCOAT™
Smartcoat™ is a technology Biovail acquired from and
developed with Pharma Pass. This technology allows the
manufacturing of very high potency, controlled-release
tablets, allowing for smaller sized tablets while controlling the
release over a 24-hour period. The Smartcoat™ technology
is also suitable for the development of combination products.
A thin, very strong molecular diffusion membrane controls
the release and this rate can be adapted to a zero-order or
Weibull (“S-shaped”) function. In general, the Smartcoat™
technology is resistant to interactions with alcohol.
SMARTCOAT™ AQ
Smartcoat™ AQ is a water-based, proprietary version of the
Smartcoat™ technology. To date, Biovail has successfully
formulated a number of products utilizing this technology,
including an aqueous-based formulation of metformin. The
technology can also be adapted to provide alcohol-interaction
resistance properties.

35
2006 Annual Report
CHRONOTABS
Chronotabs are made of Multipart or Smartcoat™ tablets
particularly adapted to chronotherapy (the science of treating
diseases that follow the body’s circadian rhythms), using a
second layer of smart polymers made of dry or filmcoating in
order to optimize the active drug absorption profile for bedtime
administration.
CONSURF
Consurf is a zero-order drug-delivery system for hydrophilic
and hydrophobic drugs in the form of matrix tablets. The drug
compound is uniformly dispersed in a matrix consisting of a
unique blend of polymers. The mechanism of release involves
the concurrent swelling and erosion of the matrix such that
a constant surface matrix area is maintained during transit
through the GI tract. This results in a zero-order release of
the drug of interest.
SHEARFORM™
Shearform™ is used to produce matrices of saccharides, poly-
saccharides or other carrier materials that are subsequently
processed into amorphous fibers or flakes and recrystallized to
a predetermined level. This process is used to produce rapid-
dissolve formulations, including FlashDose®. Shearform™
can also be applied to food-product ingredients to provide
enhanced flavoring. Other ODT technologies have been developed
and applied by Biovail, allowing for simpler manufacturing of
ODTs as well.
MACROCAP
Macrocap consists of immediate-release beads made by
extrusion/spheronization/pelletization techniques, or by layering
powders or solutions onto nonpareil seeds. Release-modulating
polymers are applied on the beads using a variety of specialized
coating techniques. The coated beads are filled into hard
gelatin capsules. Drug release occurs by diffusion associated
with bioerosion or by osmosis via the surface membrane. The
release mechanism can be pH-activated or pH-independent.
The beads can be formulated to produce first-order or zero-
order release.
CEFORM™
CEFORM™ is a microsphere technology used to produce
uniformly sized and shaped microspheres of a wide range of
pharmaceutical compounds. The microspheres are nearly
perfectly spherical in shape and, typically, each one has a
target diameter between 50-600 microns, depending on the
application. For example, 150-180 micron microspheres may
be used for FlashDose®, with high drug content and a taste-
mask coating applied for oral cavity dispersion. CEFORM™
microspheres are produced using a continuous, single-step and
solvent-free manufacturing process. It can be used to formulate
drugs that are generally thermally unstable because of the very
brief application of heat and the wide range of temperatures
which can be used in the manufacturing process. Depending
on the desired release characteristics and oral dosage format,
CEFORM™ microspheres can be formulated for controlled
release, enhanced absorption, delayed release, rapid absorption
or taste masking.
ZERO-ORDER RELEASE SYSTEM (“ZORS™”)
ZORS™ is a technology that allows Biovail to develop zero-order
kinetic systems, based on a proprietary controlled-release matrix
coating. ZORS™ allows the Company to develop controlled-
release tablets that alleviate food effect in drugs known to have
their pharmacokinetic profile influenced by meals.
MULTIPART
Multipart consists of a tablet carrier for the delivery of controlled-
release beads that preserves the integrity and release properties
of the beads. The distribution of the beads is triggered by
disintegration of the tablet carrier in the stomach. Drug release
from the beads can be pH-activated or pH-independent, and
can occur by disintegration or osmosis. The beads can be
formulated to produce first-order or zero-order release.
OTHER DRUG-DELIVERY SYSTEMS
Biovail is in the process of filing new patents for drug-delivery
technologies amenable to very low doses of drugs in once-daily,
extended-release formulations with optimal absorption profiles,
as well as the optimization of site-specific absorption of con-
trolled-release oral drugs.

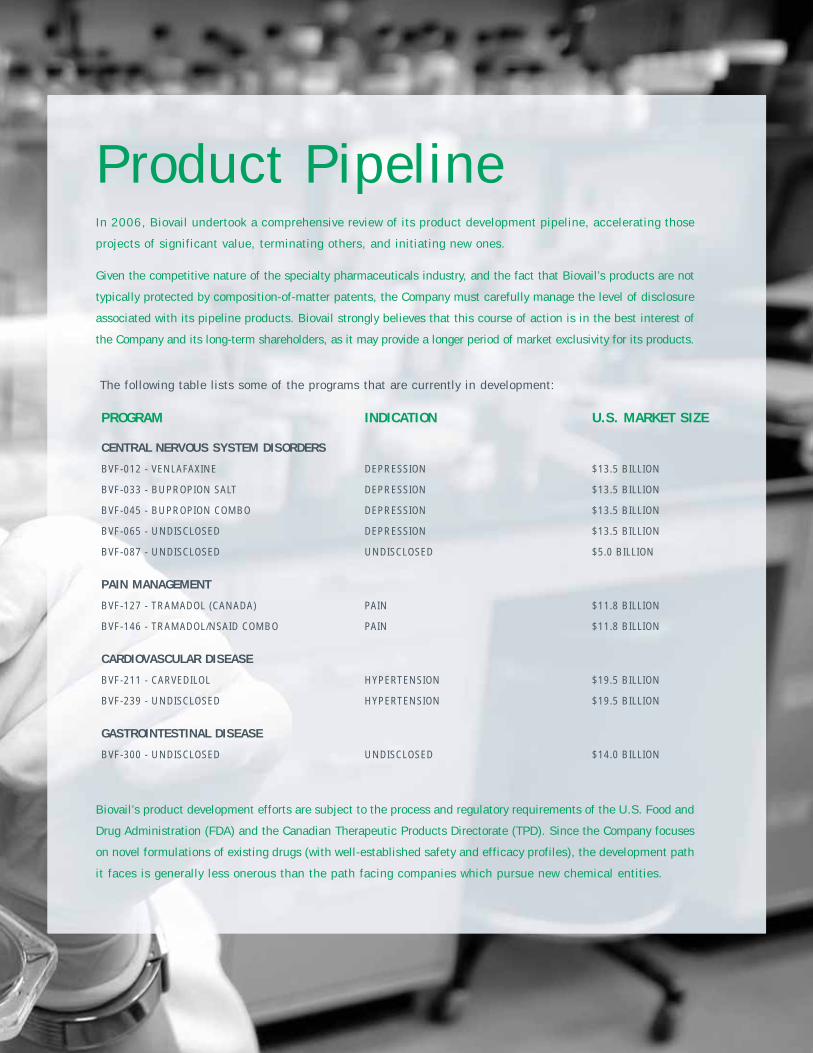
In 2006, Biovail undertook a comprehensive review of its product development pipeline, accelerating those
projects of significant value, terminating others, and initiating new ones.
Given the competitive nature of the specialty pharmaceuticals industry, and the fact that Biovail’s products are not
typically protected by composition-of-matter patents, the Company must carefully manage the level of disclosure
associated with its pipeline products. Biovail strongly believes that this course of action is in the best interest of
the Company and its long-term shareholders, as it may provide a longer period of market exclusivity for its products.
Product Pipeline
PROGRAM INDICATION U.S. MARKET SIZE
CENTRAL NERVOUS SYSTEM DISORDERS
BVF-012 - VENLAFAXINE DEPRESSION $13.5 BILLION
BVF-033 - BUPROPION SALT DEPRESSION $13.5 BILLION
BVF-045 - BUPROPION COMBO DEPRESSION $13.5 BILLION
BVF-065 - UNDISCLOSED DEPRESSION $13.5 BILLION
BVF-087 - UNDISCLOSED UNDISCLOSED $5.0 BILLION
PAIN MANAGEMENT
BVF-127 - TRAMADOL (CANADA) PAIN $11.8 BILLION
BVF-146 - TRAMADOL/NSAID COMBO PAIN $11.8 BILLION
CARDIOVASCULAR DISEASE
BVF-211 - CARVEDILOL HYPERTENSION $19.5 BILLION
BVF-239 - UNDISCLOSED HYPERTENSION $19.5 BILLION
GASTROINTESTINAL DISEASE
BVF-300 - UNDISCLOSED UNDISCLOSED $14.0 BILLION
The following table lists some of the programs that are currently in development:
Biovail’s product development efforts are subject to the process and regulatory requirements of the U.S. Food and
Drug Administration (FDA) and the Canadian Therapeutic Products Directorate (TPD). Since the Company focuses
on novel formulations of existing drugs (with well-established safety and efficacy profiles), the development path
it faces is generally less onerous than the path facing companies which pursue new chemical entities.

38

39
2006 Annual Report
2006 Commercial Portfolio
(1) As of December 2006, Zovirax® Ointment and Zovirax® Cream are promoted by ScielePharma, Inc. for BPI.
(2) Wellbutrin® XL was launched by BPC in Canada in April 2006.(3) As of May 2005, Cardizem® LA is promoted and distributed by Kos (Kos was acquired
by Abbott Laboratories in December 2006).
(4) Tiazac® is distributed by Forest Laboratories, Inc. in the United States.(5) Distributed by Teva in the U.S.(6) Distributed by Teva in the U.S. and Novopharm, a subsidiary of Teva, in Canada.(7) Distributed by Forest in the U.S. and Novopharm in Canada.
PRODUCT THERAPEUTIC AREA INDICATION(S)
DISTRIBUTED BY BIOVAIL PHARMACEUTICALS, INC.
CARDIZEM® CD CARDIOVASCULAR HYPERTENSION/ANGINA
ATIVAN® CENTRAL NERVOUS SYSTEM ANXIETY
VASOTEC® CARDIOVASCULAR HYPERTENSION/CONGESTIVE
HEART FAILURE
VASERETIC® CARDIOVASCULAR HYPERTENSION/CONGESTIVE
HEART FAILURE
ISORDIL® CARDIOVASCULAR ANGINA
ZOVIRAX® CREAM(1) ANTIVIRAL HERPES LABIALIS (COLD SORES)
ZOVIRAX® OINTMENT(1) ANTIVIRAL GENITAL HERPES
PROMOTED / DISTRIBUTED BY BIOVAIL PHARMACEUTICALS CANADA
TIAZAC® CARDIOVASCULAR HYPERTENSION/ANGINA
TIAZAC® XC CARDIOVASCULAR HYPERTENSION
GLUMETZA™ CARDIOVASCULAR TYPE II DIABETES
WELLBUTRIN® XL(2) AND WELLBUTRIN® SR CENTRAL NERVOUS SYSTEM DEPRESSION
MONOCOR® CARDIOVASCULAR HYPERTENSION
RETAVASE® CARDIOVASCULAR ACUTE MYOCARDIAL INFARCTION
ZYBAN® CENTRAL NERVOUS SYSTEM SMOKING CESSATION
CARDIZEM® CD CARDIOVASCULAR HYPERTENSION/ANGINA
DISTRIBUTED BY PARTNERS
WELLBUTRIN XL® CENTRAL NERVOUS SYSTEM DEPRESSION
CARDIZEM® LA(3) CARDIOVASCULAR HYPERTENSION/ANGINA
ULTRAM® ER PAIN MANAGEMENT CHRONIC PAIN
TIAZAC®(4) CARDIOVASCULAR HYPERTENSION/ANGINA
BIOEQUIVALENT (GENERIC) PRODUCTS
ADALAT® CC CARDIOVASCULAR HYPERTENSION/ANGINA
(NIFEDIPINE EXTENDED RELEASE)(5)
CARDIZEM® CD CARDIOVASCULAR HYPERTENSION/ANGINA
(DILTIAZEM CONTROLLED RELEASE)(6)
PROCARDIA® XL CARDIOVASCULAR HYPERTENSION/ANGINA
(NIFEDIPINE EXTENDED RELEASE)(5)
TIAZAC® (DILTIAZEM)(7) CARDIOVASCULAR HYPERTENSION/ANGINA
TRENTAL® (PENTOXIFYLLINE)(5) CARDIOVASCULAR PERIPHERAL VASCULAR DISEASE
VOLTAREN® XR INFLAMMATION ARTHRITIS
(DICLOFENAC CONTROLLED RELEASE)(5)

41 Management’s Discussion and Analysis
83 Management Report
85 Report of Independent Registered Public Accounting Firm
88 Consolidated Financial Statements
92 Notes to Consolidated Financial Statements
140 Board of Directors and Executive Officers
142 Selected Quarterly Data
143 Ten-Year Financial Summary
ibc Shareholder Information
FINANCIALREVIEW

MANAGEMENT’S DISCUSSION AND ANALYSIS OFRESULTS OF OPERATIONS AND FINANCIAL CONDITION
(All dollar amounts expressed in U.S. dollars)
The following Management’s Discussion and Analysis of Results of Operations and Financial Condition(‘‘MD&A’’) should be read in conjunction with our audited consolidated financial statements and related notesthereto prepared in accordance with United States (‘‘U.S.’’) generally accepted accounting principles.
Additional information relating to Biovail Corporation (‘‘Biovail’’), including our Amended Annual Reporton Form 20-F/A, is available on SEDAR at www.sedar.com.
The discussion and analysis contained in this MD&A are as of March 21, 2007, except as to the restatementdiscussion and analysis discussed below under the headings ‘‘Forward-Looking Statements’’, ‘‘Restatement’’,‘‘Selected Annual Information’’, ‘‘Revenue’’, ‘‘Operating Expenses’’, ‘‘Summary of Quarterly Results’’, ‘‘FinancialCondition’’, ‘‘Cash Flows’’, ‘‘Management’s Revised Report on Disclosure Controls and Procedures and InternalControl over Financial Reporting’’ and ‘‘Canadian GAAP Supplemental Information’’, which restatementdiscussion and analysis is as of May 22, 2007.
FORWARD-LOOKING STATEMENTS
To the extent any statements made in this MD&A contain information that is not historical, thesestatements are forward-looking statements within the meaning of Section 27A of the Securities Act of 1933, asamended, and Section 21E of the Securities Exchange Act of 1934, as amended, and may be forward-lookinginformation within the meaning of the ‘‘safe harbour’’ provisions of applicable Canadian securities legislation(collectively ‘‘forward-looking statements’’). These forward-looking statements relate to, among other things,our objectives, goals, strategies, beliefs, intentions, plans, estimates, and outlook, including, without limitation,statements concerning the following:
• Future revenue and operating results following the loss of Wellbutrin XL� market exclusivity;
• Cost savings and other impacts of restructuring activities in the U.S.;
• Commercialization strategy in the U.S.;
• Increased focus on research and development;
• Ability to make future dividend payments;
• Redemption of our 77⁄8% Senior Subordinated Notes due April 1, 2010 (‘‘Notes’’);
• Launch of Wellbutrin XR� in Europe;
• Finalization of supply contracts;
• Sufficiency of inventory levels of Wellbutrin SR� and Zyban�;
• Timing and progress of clinical trials;
• Timing of regulatory submissions of our products;
• Timing of regulatory responses and approval of our products;
• Success of our development efforts;
• Manufacturing and commercialization of pipeline products that are successfully developed;
• Estimates of future restructuring costs;
• Estimates of contract losses;
• Results of certain litigations and regulatory proceedings;
• Timing and amount of future capital expenditures;
47
41

MANAGEMENT’S DISCUSSION AND ANALYSIS OFRESULTS OF OPERATIONS AND FINANCIAL CONDITION (Continued)
(All dollar amounts expressed in U.S. dollars)
• Sufficiency of cash resources to support future spending requirements;
• Timing and amount of potential milestone payments; and
• Timing of implementation of measures to remediate internal control deficiency.
Forward-looking statements can generally be identified by the use of words such as ‘‘believe’’, ‘‘anticipate’’,‘‘expect’’, ‘‘intend’’, ‘‘plan’’, ‘‘will’’, ‘‘may’’ and other similar expressions. In addition, any statements that refer toexpectations, projections or other characterizations of future events or circumstances are forward-lookingstatements. An MD&A by its nature has many forward-looking statements and although we have indicatedabove certain of these statements set out herein, all of the statements in this MD&A that contain forward-looking statements are qualified by these cautionary statements. Although we believe that the expectationsreflected in such forward-looking statements are reasonable, such statements involve risks and uncertainties, andundue reliance should not be placed on such statements. Certain material factors or assumptions are applied inmaking forward-looking statements, including, but not limited to, factors and assumptions regarding prescriptiontrends, pricing and the formulary and/or Medicare/Medicaid positioning for our products; the competitivelandscape in the markets in which we compete, including, but not limited to, the availability or introduction ofgeneric formulations of our products; and timelines associated with the development of, and receipt ofregulatory approval for, our new products; and actual results may differ materially from those expressed orimplied in such statements. Important factors that could cause actual results to differ materially from theseexpectations include, among other things: the difficulty of predicting U.S. Food and Drug Administration(‘‘FDA’’) and Canadian Therapeutic Products Directorate (‘‘TPD’’) approvals, acceptance and demand for newpharmaceutical products, the impact of competitive products and pricing, new product development and launch,reliance on key strategic alliances, availability of raw materials and finished products, the regulatoryenvironment, the outcome of legal proceedings, consolidated tax-rate assumptions, fluctuations in operatingresults and other risks detailed from time to time in our filings with the U.S. Securities and ExchangeCommission (‘‘SEC’’), the Ontario Securities Commission, and other securities regulatory authorities in Canada,as well as our ability to anticipate and manage the risks associated with the foregoing. Additional informationabout these factors and about the material factors or assumptions underlying such forward-looking statementsmay be found in the body of this document, as well as under the heading ‘‘Risk Factors’’ under Item 3,Sub-Part D of our Amended Annual Report on Form 20-F/A. We caution that the foregoing list of importantfactors that may affect future results is not exhaustive. When relying on our forward-looking statements to makedecisions with respect to Biovail, investors and others should carefully consider the foregoing factors and otheruncertainties and potential events. We undertake no obligation to update or revise any forward-lookingstatement.
RESTATEMENT
The information contained in this MD&A has been adjusted to reflect the restatement of our previouslyissued financial statements and other financial information, as more fully described below and in theExplanatory Note preceding Part I, Item 1 of our Amended Annual Report on Form 20-F/A and note 3 to ourrestated audited consolidated financial statements for the year ended December 31, 2006.
During the 2007 first quarter financial statement close process, we detected a data error in a supportingschedule used to (a) track quantities of Zovirax� products that we may purchase at reduced supply prices fromGlaxoSmithKline plc (‘‘GSK’’), and (b) calculate amortization expense on a related long-term asset that is beingamortized to cost of goods sold. As a result of the error, cost of goods sold has been adjusted for anoverstatement of amortization expense. The reversal of the cumulative effect of this adjustment will affect netincome negatively over the period that the long-term asset is being amortized, which is based on a revisedamortization schedule that commences in fiscal 2007.
48
42

MANAGEMENT’S DISCUSSION AND ANALYSIS OFRESULTS OF OPERATIONS AND FINANCIAL CONDITION (Continued)
(All dollar amounts expressed in U.S. dollars)
As a result of the preceding restatement, we are required to correct other known errors in prior periods thatwere previously deemed to be immaterial. We identified two such instances — one related to Cardizem� LArevenue recognition and the other related to foreign currency translation.
We have revised our previous accounting for a cumulative pricing adjustment related to Cardizem� LA soldto Kos Pharmaceuticals, Inc. (‘‘Kos’’). That adjustment resulted from price increases implemented by Kos duringthe period from May 2, 2005 to September 30, 2006. As previously disclosed, we originally recorded the entireamount of that adjustment in product sales revenue in the third quarter of 2006. We have now reallocated ashare of that adjustment to each of the affected interim periods.
We have also corrected the classification of certain foreign currency translation gains and losses fromaccumulated other comprehensive income to net income. Those gains and losses were primarily related to long-term intercompany balances between Biovail and its Irish subsidiary group.
There was no income tax impact resulting from the foregoing adjustments.
The following table presents the impact of the foregoing adjustments to our previously reported annualresults for fiscal years 2006, 2005 and 2004:
2006 2005 2004
($ in 000s, exceptper share data; Income (Expense))
Net income as reported . . . . . . . . . . . . . . . . . . . . . . . . . . . . . . . . . . . . . . $203,948 $236,221 $160,994
AdjustmentsProduct sales revenue . . . . . . . . . . . . . . . . . . . . . . . . . . . . . . . . . . . . . . . (2,807) 2,807 —Cost of goods sold . . . . . . . . . . . . . . . . . . . . . . . . . . . . . . . . . . . . . . . . . 12,129 5,201 —Foreign exchange . . . . . . . . . . . . . . . . . . . . . . . . . . . . . . . . . . . . . . . . . . (1,644) 2,211 (1,195)
7,678 10,219 (1,195)
Net income as restated . . . . . . . . . . . . . . . . . . . . . . . . . . . . . . . . . . . . . . $211,626 $246,440 $159,799
Basic and diluted earnings per share . . . . . . . . . . . . . . . . . . . . . . . . . . . .Net income as reported . . . . . . . . . . . . . . . . . . . . . . . . . . . . . . . . . . . . . . $ 1.27 $ 1.48 $ 1.01Net income as restated . . . . . . . . . . . . . . . . . . . . . . . . . . . . . . . . . . . . . . $ 1.32 $ 1.54 $ 1.00
49
43

MANAGEMENT’S DISCUSSION AND ANALYSIS OFRESULTS OF OPERATIONS AND FINANCIAL CONDITION (Continued)
(All dollar amounts expressed in U.S. dollars)
The following table presents the impact of the foregoing adjustments to our previously reported quarterlyresults for 2006 and 2005:
2006 2005
Q1 Q2 Q3 Q4 Q1 Q2 Q3 Q4
($ in 000s, except per share data; Income (Expense))
Net income (loss) asreported . . . . . . . . . . $64,486 $80,594 $(56,451) $115,319 $11,132 $3,707 $101,663 $119,719
AdjustmentsProduct sales revenue . . 2,106 2,337 (7,250) — — 981 1,162 664Cost of goods sold . . . . . 2,137 3,251 3,523 3,218 — 242 1,598 3,361Foreign exchange . . . . . (293) (905) 115 (561) 778 1,175 63 195
3,950 4,683 (3,612) 2,657 778 2,398 2,823 4,220
Net income (loss) asrestated . . . . . . . . . . . $68,436 $85,277 $(60,063) $117,976 $11,910 $6,105 $104,486 $123,939
Basic and dilutedearnings (loss) pershare
Net income (loss) asreported . . . . . . . . . . $ 0.40 $ 0.50 $ (0.35) $ 0.72 $ 0.07 $ 0.02 $ 0.64 $ 0.75
Net income (loss) asrestated . . . . . . . . . . . $ 0.43 $ 0.53 $ (0.37) $ 0.74 $ 0.07 $ 0.04 $ 0.65 $ 0.77
COMPANY PROFILE
We are a specialty pharmaceutical company, engaged in the formulation, clinical testing, registration,manufacture and commercialization of pharmaceutical products. Our core competency is the development andlarge-scale manufacture of pharmaceutical products incorporating oral drug-delivery technologies. Our maintherapeutic areas of focus are central nervous system disorders, pain management, and cardiovascular disease.We have various research and development, clinical research, manufacturing and commercial operations locatedin Barbados, Canada, the U.S., Puerto Rico and Ireland.
We have a portfolio of products that includes the following established brand names:
• Wellbutrin� (bupropion) for the treatment of depression;
• Zovirax� (acyclovir) for the treatment of herpes;
• Ultram� (tramadol) for the treatment of moderate to moderately severe chronic pain; and
• Cardizem�/Tiazac� (diltiazem) for the treatments of hypertension and angina.
Our products are marketed in the U.S. principally through supply and distribution agreements with otherpharmaceutical companies that have established sales and marketing infrastructures. Under such agreements,we manufacture and supply Wellbutrin XL� to GSK; Ultram� ER to Ortho-McNeil, Inc. (‘‘OMI’’); andCardizem� LA to Kos (which was acquired by Abbott Laboratories in December 2006). In Canada, ourproducts, such as Wellbutrin� XL and Tiazac� XC, are marketed through our internal sales organization.
50
44

MANAGEMENT’S DISCUSSION AND ANALYSIS OFRESULTS OF OPERATIONS AND FINANCIAL CONDITION (Continued)
(All dollar amounts expressed in U.S. dollars)
OVERVIEW
Our revenue from product sales increased 15% to over $1 billion in 2006, primarily due to the performanceof our portfolio of branded products. As branded products comprise approximately 80% of our product salesand are priced higher than generic products, generic competition is one of our leading challenges. A largeportion of a branded product’s commercial value is usually realized during the period in which the product hasmarket exclusivity. Upon the loss of that exclusivity, we can expect to lose a significant portion of a product’spre-genericization sales in a short period of time, which can have a material adverse effect on our future revenueand profitability. To address this challenge, we will continue to:
• Aggressively defend our intellectual property against infringement, as intellectual property contributes agreat deal to our competitive advantage;
• Invest heavily in research and development to generate new innovative products to ensure our productportfolio is renewed over time to offset future revenue losses due to generic competition; and
• Manufacture and sell generic versions of certain of our branded products.
Within our branded product portfolio, Wellbutrin XL� has been a key contributor to our revenue, results ofoperations and cash flows, accounting for approximately 40% of total product sales and gross profit since itsintroduction in September 2003. In December 2006, the FDA granted approval for the first generic versions ofWellbutrin XL�. As a result, Teva Pharmaceuticals Industries Ltd. (‘‘Teva’’) immediately launched a genericversion of 300mg Wellbutrin XL� product, which has resulted in a substantial loss in our sales of that strength inthe first quarter of 2007, compared with the fourth quarter of 2006. In February 2007, however, we entered intoa comprehensive settlement with a number of companies, including Teva, related to Wellbutrin XL�. As a resultof this settlement, with certain defined exceptions, none of those companies may market a generic version of150mg Wellbutrin XL� product until 2008.
In anticipation of the loss of Wellbutrin XL� exclusivity, we implemented a strategy to reduce our overallcost structure and to develop new products more quickly. As a result, we will no longer maintain a directcommercial presence in the U.S. primary-care or specialty pharmaceutical markets. Instead we intend to enterexclusively into supply and distribution agreements with other pharmaceutical companies to promote ourproducts to both primary-care and specialist physicians in the U.S. We believe this model will deliver greatervalue to our products by utilizing marketing partners with expertise in our therapeutic areas of focus, whileenabling us to lower our overhead and infrastructure costs. Another important aspect of our strategy is atargeted focus on a number of core research and development programs. We intend to increase our investmentin research and development over the next several years, as the development of new products is essential for thecontinued strong operation and growth of our business. However, it is important to recognize that a successfulproduct-development program reflects investments that we make over many years.
In spite of the expected cost savings from the strategic decisions we have made, our financial performancein 2007 will be materially impacted by the loss of exclusivity in the U.S. of our 300mg Wellbutrin XL� product.
KEY PERFORMANCE DRIVERS
We will continue to execute our strategy for long-term growth by focusing on the following key performancedrivers:
• Development of new products through the application of our drug-delivery technologies to create:(i) enhanced formulations of existing products; (ii) combination products; and(iii) difficult-to-manufacture generic pharmaceuticals.
• Forming strategic commercial alliances with other pharmaceutical companies on favourable terms.
51
45

MANAGEMENT’S DISCUSSION AND ANALYSIS OFRESULTS OF OPERATIONS AND FINANCIAL CONDITION (Continued)
(All dollar amounts expressed in U.S. dollars)
• Protection of our intellectual property and successful defence of our products and proprietarytechnologies from infringement.
• Prudent use of our cash resources to provide a return to shareholders while eliminating long-term debtand maintaining sufficient capital to invest in growing our business.
• Control of expenses through initiatives to achieve lower operating costs, more focused developmentefforts, and improved manufacturing efficiencies.
• Generation of higher revenue and profitability in Canada from our existing promoted products, andthrough the acquisition or development of new products that provide a strategic fit.
Despite our efforts, however, no assurance can be given that the loss of market exclusivity of key products,or certain other significant factors will not have a material adverse effect on our business and financialperformance.
EXECUTIVE MANAGEMENT TEAM
During the past year, we made the following changes to our executive management team:
• Kenneth Howling was appointed Senior Vice-President, Chief Financial Officer (‘‘CFO’’), following thedeparture of Charles Rowland, our former CFO, in December 2006.
• Wendy Kelley joined Biovail as Senior Vice-President, General Counsel and Corporate Secretary.Kenneth Cancellara, our former General Counsel, retired from Biovail in January 2007.
• Dr. Peter Silverstone joined Biovail as Senior Vice-President, Medical and Scientific Affairs.Dr. Silverstone succeeded Dr. Gregory Szpunar, our former Chief Scientific Officer, who left Biovail inMarch 2006. Dr. Silverstone’s responsibilities focus on the clinical development and registration of ourpipeline products.
• Gilbert Godin joined Biovail as Senior Vice-President, Technical Operations/Drug Delivery. Mr. Godin’sresponsibilities focus on Biovail’s product-development capability, as well as manufacturing and contract-development services.
• Michel Chouinard was appointed Chief Operating Officer of Biovail Laboratories International SRL.
RESTRUCTURING
In May 2005, we sold the distribution rights to Cardizem� LA in the U.S. and Puerto Rico, and transferredall of our product rights and certain inventories related to Teveten and Teveten HCT, to Kos. Concurrent withthe Kos transaction, we restructured our commercial operations in the U.S. At that time, we reduced ourprimary-care and specialty sales forces and related functions by 493 positions (including 186 sales representativeswho were offered employment by Kos) and administrative functions by 30 positions. We retained 85 specialtysales representatives at that time to focus on the promotion of Zovirax� Ointment and Zovirax� Cream tospecialist practitioners, as well as to provide co-promotion services to other pharmaceutical companies.
In December 2006, we eliminated our remaining U.S. specialty sales force, and implemented othermeasures to reduce the operating and infrastructure costs of our U.S. operations, including the abandonment oflarge-scale manufacturing at our Chantilly, Virginia facility. We reduced our sales force and related functions by115 positions, and administrative and other functions by 73 positions. These measures were considered necessaryto address a lack of product-acquisition or co-promotion opportunities, available to us on reasonable terms, tofully utilize our sales force. In December 2006, we consequently entered into a five-year exclusive promotionalservices agreement with Sciele Pharma, Inc. (‘‘Sciele’’), whereby we will pay Sciele an annual fee to provide
52
46

MANAGEMENT’S DISCUSSION AND ANALYSIS OFRESULTS OF OPERATIONS AND FINANCIAL CONDITION (Continued)
(All dollar amounts expressed in U.S. dollars)
detailing and sampling support for Zovirax� Ointment and Zovirax� Cream to U.S. physicians. Sciele is alsoentitled to additional payments if certain tiered revenue targets are met each calendar year.
We anticipate that the cost savings associated with the reduction in headcount in our U.S. operations willhave a material positive impact on our results of operations, financial position and cash flows. These savings,however, will be mitigated by the compensation we will pay Sciele for its promotional services.
STOCK-BASED COMPENSATION
Effective January 1, 2006, we adopted Statement of Financial Accounting Standards (‘‘SFAS’’) No. 123(revised 2004), ‘‘Share-Based Payment’’ (‘‘SFAS 123R’’), which requires all share-based payments to employees,including grants of employee stock options, to be recognized in the financial statements based on their fairvalues. Prior to January 1, 2006, we recognized employee stock-based compensation under the intrinsic value-based method of Accounting Principles Board (‘‘APB’’) Opinion No. 25, ‘‘Accounting for Stock Issued toEmployees’’ (‘‘APB 25’’). Accordingly, no compensation expense for stock options granted to employees at fairmarket value was included in the determination of net income prior to January 1, 2006. We elected to use themodified-prospective transition method of adoption. This method requires that compensation expense berecorded for all share-based payments granted, modified or settled after the date of adoption and for allunvested stock options at the date of adoption. Prior periods have not been restated to recognize stock-basedcompensation expense.
In 2006, we recognized total stock-based compensation expense related to stock options, net of estimatedforfeitures, as follows:
($ in 000s)
Cost of goods sold . . . . . . . . . . . . . . . . . . . . . . . . . . . . . . . . . . . . . . . . . . . . . . . . . . . . . . . . . . $ 1,072Research and development expenses . . . . . . . . . . . . . . . . . . . . . . . . . . . . . . . . . . . . . . . . . . . . . 1,834Selling, general and administrative expenses . . . . . . . . . . . . . . . . . . . . . . . . . . . . . . . . . . . . . . . 11,888
$14,794
As a result of the adoption of SFAS 123R, net income was $14.6 million (basic and dilutive earnings pershare of $0.09) lower in 2006 than if we had continued to account for stock-based compensation under APB 25.
At December 31, 2006, the total remaining unrecognized compensation expense related to non-vested stockoptions amounted to approximately $13.6 million, which will be amortized on a straight-line basis over theweighted-average remaining requisite service period of approximately 19 months.
53
47

MANAGEMENT’S DISCUSSION AND ANALYSIS OFRESULTS OF OPERATIONS AND FINANCIAL CONDITION (Continued)
(All dollar amounts expressed in U.S. dollars)
SELECTED ANNUAL INFORMATION
The following table provides selected financial information for the last three years:
Years Ended December 31
2006 2005 2004
($ in 000s, except per share data)As As As
Restated(1) Restated(1) Restated(1)
Revenue . . . . . . . . . . . . . . . . . . . . . . . . . . . . . . . . . . . . . . . . . . . . . $1,067,722 $ 938,343 $ 879,156Income from continuing operations . . . . . . . . . . . . . . . . . . . . . . . . . . 215,474 257,015 165,014Net income . . . . . . . . . . . . . . . . . . . . . . . . . . . . . . . . . . . . . . . . . . . 211,626 246,440 159,799
Basic and diluted earnings per shareIncome from continuing operations . . . . . . . . . . . . . . . . . . . . . . . . . . $ 1.35 $ 1.61 $ 1.04Net income . . . . . . . . . . . . . . . . . . . . . . . . . . . . . . . . . . . . . . . . . . . $ 1.32 $ 1.54 $ 1.00
Cash dividends declared per share . . . . . . . . . . . . . . . . . . . . . . . . . . $ 1.00 $ 0.50 $ —
Total assets . . . . . . . . . . . . . . . . . . . . . . . . . . . . . . . . . . . . . . . . . . . $2,192,442 $2,036,820 $1,711,060Long-term obligations . . . . . . . . . . . . . . . . . . . . . . . . . . . . . . . . . . . 411,791 436,868 478,936
(1) See above under ‘‘Restatement’’.
Revenue
Total revenue increased 14% from 2005 to 2006, due mainly to higher revenue from sales of Wellbutrin XL�to GSK, and the added contribution from sales of Ultram� ER to OMI. These factors were partially offset bylower product sales in Canada, due mainly to the negative impact of generic competition to Tiazac� andWellbutrin� SR. Product sales were also negatively impacted by certain manufacturing issues we experiencedduring 2006 related to the production of lower dosage 120mg and 180mg Cardizem� LA products. We resumedfull production of Cardizem� LA in early 2007, following the completion of our investigation and remediationefforts, and have substantially addressed any shortfall in our supply to Kos.
Total revenue increased 7% from 2004 to 2005, due mainly to higher Wellbutrin XL� and Zovirax� productsales, as well as sales of our off-patent branded pharmaceutical (Legacy) products. These factors were partiallyoffset by the elimination of Teveten and Teveten HCT product sales following the Kos transaction, and lowersales of our Generic products. In 2004, Zovirax� and Legacy product sales in the U.S. were negatively impactedby a work-down of wholesaler inventory levels.
Results of operations
Our income from continuing operations and net income were impacted by specific factors that affected thecomparability of those results between years. We believe that the identification of these factors enhances ananalysis of our results of operations when comparing our results with those of a previous or subsequent period.In addition, management excludes these factors when analyzing operating performance. However, it should benoted that the determination of these factors involves judgment by management.
Our income from continuing operations and net income in 2006 were impacted by the following significantfactors:
• Asset impairments of $147.0 million related to the write-down of Vasotec� and Vaseretic� trademarksand product rights, and Glumetza� product rights;
54
48
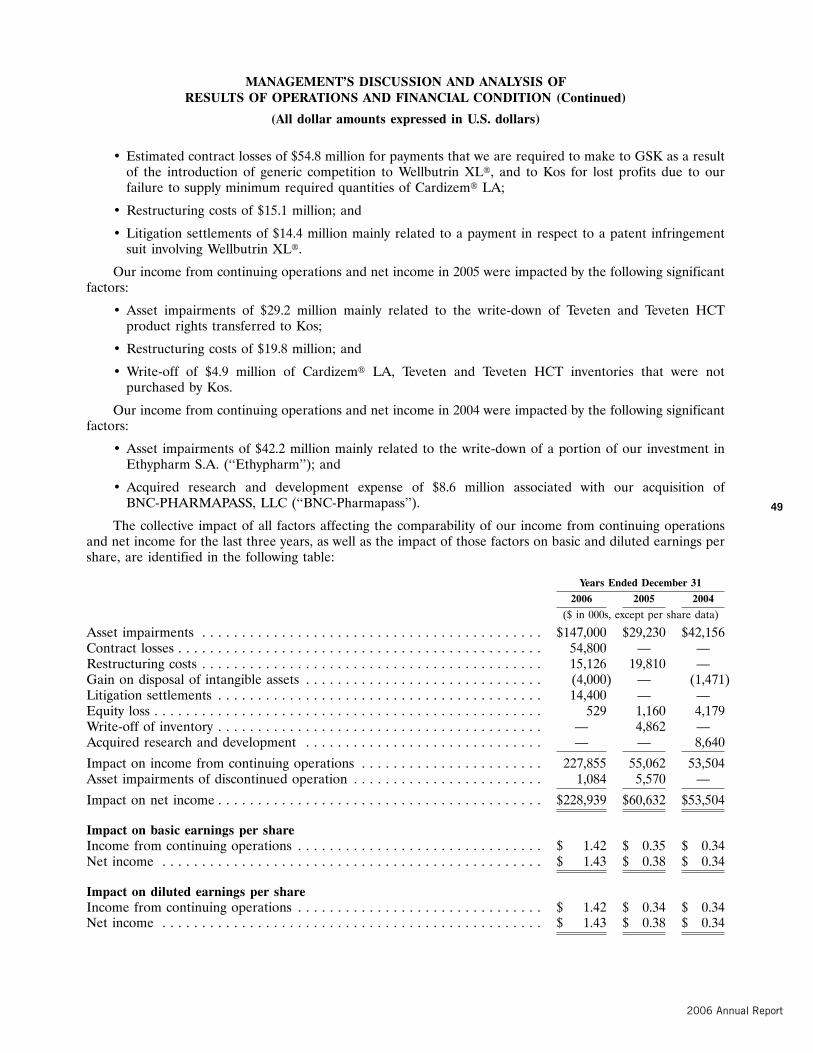
MANAGEMENT’S DISCUSSION AND ANALYSIS OFRESULTS OF OPERATIONS AND FINANCIAL CONDITION (Continued)
(All dollar amounts expressed in U.S. dollars)
• Estimated contract losses of $54.8 million for payments that we are required to make to GSK as a resultof the introduction of generic competition to Wellbutrin XL�, and to Kos for lost profits due to ourfailure to supply minimum required quantities of Cardizem� LA;
• Restructuring costs of $15.1 million; and
• Litigation settlements of $14.4 million mainly related to a payment in respect to a patent infringementsuit involving Wellbutrin XL�.
Our income from continuing operations and net income in 2005 were impacted by the following significantfactors:
• Asset impairments of $29.2 million mainly related to the write-down of Teveten and Teveten HCTproduct rights transferred to Kos;
• Restructuring costs of $19.8 million; and
• Write-off of $4.9 million of Cardizem� LA, Teveten and Teveten HCT inventories that were notpurchased by Kos.
Our income from continuing operations and net income in 2004 were impacted by the following significantfactors:
• Asset impairments of $42.2 million mainly related to the write-down of a portion of our investment inEthypharm S.A. (‘‘Ethypharm’’); and
• Acquired research and development expense of $8.6 million associated with our acquisition ofBNC-PHARMAPASS, LLC (‘‘BNC-Pharmapass’’).
The collective impact of all factors affecting the comparability of our income from continuing operationsand net income for the last three years, as well as the impact of those factors on basic and diluted earnings pershare, are identified in the following table:
Years Ended December 31
2006 2005 2004
($ in 000s, except per share data)
Asset impairments . . . . . . . . . . . . . . . . . . . . . . . . . . . . . . . . . . . . . . . . . . . $147,000 $29,230 $42,156Contract losses . . . . . . . . . . . . . . . . . . . . . . . . . . . . . . . . . . . . . . . . . . . . . . 54,800 — —Restructuring costs . . . . . . . . . . . . . . . . . . . . . . . . . . . . . . . . . . . . . . . . . . . 15,126 19,810 —Gain on disposal of intangible assets . . . . . . . . . . . . . . . . . . . . . . . . . . . . . . (4,000) — (1,471)Litigation settlements . . . . . . . . . . . . . . . . . . . . . . . . . . . . . . . . . . . . . . . . . 14,400 — —Equity loss . . . . . . . . . . . . . . . . . . . . . . . . . . . . . . . . . . . . . . . . . . . . . . . . . 529 1,160 4,179Write-off of inventory . . . . . . . . . . . . . . . . . . . . . . . . . . . . . . . . . . . . . . . . . — 4,862 —Acquired research and development . . . . . . . . . . . . . . . . . . . . . . . . . . . . . . — — 8,640
Impact on income from continuing operations . . . . . . . . . . . . . . . . . . . . . . . 227,855 55,062 53,504Asset impairments of discontinued operation . . . . . . . . . . . . . . . . . . . . . . . . 1,084 5,570 —
Impact on net income . . . . . . . . . . . . . . . . . . . . . . . . . . . . . . . . . . . . . . . . . $228,939 $60,632 $53,504
Impact on basic earnings per shareIncome from continuing operations . . . . . . . . . . . . . . . . . . . . . . . . . . . . . . . $ 1.42 $ 0.35 $ 0.34Net income . . . . . . . . . . . . . . . . . . . . . . . . . . . . . . . . . . . . . . . . . . . . . . . . $ 1.43 $ 0.38 $ 0.34
Impact on diluted earnings per shareIncome from continuing operations . . . . . . . . . . . . . . . . . . . . . . . . . . . . . . . $ 1.42 $ 0.34 $ 0.34Net income . . . . . . . . . . . . . . . . . . . . . . . . . . . . . . . . . . . . . . . . . . . . . . . . $ 1.43 $ 0.38 $ 0.34
55
49

MANAGEMENT’S DISCUSSION AND ANALYSIS OFRESULTS OF OPERATIONS AND FINANCIAL CONDITION (Continued)
(All dollar amounts expressed in U.S. dollars)
Cash dividends
Cash dividends declared per share were $1.00 and $0.50 in 2006 and 2005, respectively. No dividends weredeclared in 2004. In December 2006, our Board of Directors adopted a new dividend policy that contemplatesthe payment of an annual dividend of $1.50 per share (to be paid in quarterly increments). The declaration offuture dividends pursuant to this policy will be subject to the discretion of the Board, and will be dependent onour financial condition and operating results.
Financial condition
Total assets increased $155.6 million from 2005 to 2006, due mainly to an increase in cash and cashequivalents, partially offset by the amortization and impairment of intangible assets. The increase in cash andcash equivalents reflected cash generated from continuing operations less payments of cash dividends; additionsto property, plant and equipment; and repayments of long-term obligations. We ended 2006 with cash resourcesin excess of $800 million.
At December 31, 2006, long-term obligations included the outstanding $398.9 million principal amount ofour Notes. On February 27, 2007, we issued a notice of redemption of all our outstanding Notes effectiveApril 1, 2007 at a price of 101.969% of the principal amount. We intend to utilize our existing cash resources tofinance the redemption of our Notes.
RESULTS OF OPERATIONS
In 2006, we operated our business on the basis of a single reportable segment — pharmaceutical products.This basis reflected how management reviewed the business, made investing and resource allocation decisions,and assessed operating performance.
REVENUE
Our revenue is derived primarily from the following sources:
• Sales of pharmaceutical products developed and manufactured by us, as well as sales of proprietary andin-licensed products;
• Pharmaceutical clinical research and laboratory testing services, and product development activities incollaboration with third parties; and
• Royalties from the sale of products we developed or acquired, as well as the co-promotion ofpharmaceutical products owned by other companies.
56
50

MANAGEMENT’S DISCUSSION AND ANALYSIS OFRESULTS OF OPERATIONS AND FINANCIAL CONDITION (Continued)
(All dollar amounts expressed in U.S. dollars)
The following table displays the dollar amount of each source of revenue for the last three years, thepercentage of each source of revenue, compared with total revenue in the respective year, and the percentagechanges in the dollar amount of each source of revenue. Percentages may not add due to rounding.
PercentageYears Ended December 31 Change2006 2005 2004 2005 2004
$ % $ % $ % to 2006 to 2005
($ in 000s)As As
Restated(1) Restated(1)
Product sales . . . . . . . . . . . . . . . . . . . 1,021,278 96 887,074 95 837,102 95 15% 6%Research and development . . . . . . . . . 21,593 2 27,949 3 19,279 2 (23%) 45%Royalty and other . . . . . . . . . . . . . . . . 24,851 2 23,320 2 22,775 3 7% 2%
1,067,722 100 938,343 100 879,156 100 14% 7%
(1) See above under ‘‘Restatement’’.
Product sales
The following table displays product sales by category for the last three years, the percentage of eachcategory, compared with total product sales in the respective year, and the percentage changes in the dollaramount of each category. Percentages may not add due to rounding.
PercentageYears Ended December 31 Change2006 2005 2004 2005 2004
$ % $ % $ % to 2006 to 2005
($ in 000s)As As
Restated(1) Restated(1)
Wellbutrin XL� . . . . . . . . . . . . . . . . . . 450,329 44 354,213 40 317,298 38 27% 12%Zovirax� . . . . . . . . . . . . . . . . . . . . . . . 112,388 11 95,858 11 75,451 9 17% 27%Cardizem� LA . . . . . . . . . . . . . . . . . . 56,509 6 62,479 7 53,625 6 (10%) 17%Ultram� ER . . . . . . . . . . . . . . . . . . . . 53,724 5 — — — — NM NMBiovail Pharmaceuticals Canada . . . . . . 68,723 7 99,508 11 101,865 12 (31%) (2%)Legacy . . . . . . . . . . . . . . . . . . . . . . . . 139,853 14 133,419 15 121,588 15 5% 10%Generic . . . . . . . . . . . . . . . . . . . . . . . 141,075 14 135,209 15 149,675 18 4% (10%)Teveten . . . . . . . . . . . . . . . . . . . . . . . (1,323) — 6,388 1 17,600 2 NM (64%)
1,021,278 100 887,074 100 837,102 100 15% 6%
(1) See above under ‘‘Restatement’’.
NM — Not meaningful
Wellbutrin XL�
Our revenue from sales of Wellbutrin XL� increased 27% and 12% in 2006 and 2005, respectively,compared with the immediately preceding years, due to higher volumes sold by GSK and price increases effectedby GSK in both 2006 and 2005, which positively affected our supply price to them.
57
51

MANAGEMENT’S DISCUSSION AND ANALYSIS OFRESULTS OF OPERATIONS AND FINANCIAL CONDITION (Continued)
(All dollar amounts expressed in U.S. dollars)
Our supply price for Wellbutrin XL� brand product is based on an increasing tiered percentage of GSK’snet selling price. The supply price is reset to the lowest tier at the start of each calendar year and the sales-dollarthresholds to achieve the second and third tier supply prices generally increase each year. As a result of theaforementioned introduction of generic competition to 300mg Wellbutrin XL� product in December 2006,GSK’s total sales of Wellbutrin XL� brand product in 2007 may not meet the sales dollar-thresholds to achievethe second tier supply price, and are not expected to meet the third tier supply price.
GSK may decide to launch generic versions of Wellbutrin XL� in the U.S., and GSK anticipates that theEuropean version of Wellbutrin XL�, which will be most commonly marketed as Wellbutrin XR�, could beavailable to patients in Europe as early as April 2007. We will be the exclusive manufacturer and supplier ofgeneric Wellbutrin XL� and branded Wellbutrin XR� to GSK at fixed contractual supply prices. Those supplyprices are substantially lower than the tiered supply price we currently receive on sales of Wellbutrin XL�brand product.
Zovirax�
Combined sales of Zovirax� Ointment and Zovirax� Cream increased 17% and 27% in 2006 and 2005,respectively, compared with the immediately preceding years, due to a combination of higher prescriptionvolumes and price increases we effected for these products in each of the past three years, as well as the impactof a work-down of Zovirax� inventory in the wholesale distribution channel during 2004.
Cardizem� LA
Our revenue from sales of Cardizem� LA declined 10% in 2006, compared with 2005, and increased 17% in2005, compared with 2004. The decline in revenue in 2006 primarily resulted from the backorder of 120mg and180mg Cardizem� LA products. The increase in our revenue from sales of Cardizem� LA in 2005 was a result ofa reduction in wholesaler inventory levels that occurred in 2004.
Ultram� ER
OMI launched Ultram� ER in the U.S. in February 2006. Our revenue from sales of Ultram� ER wasimpacted in the second quarter of 2006 by a provision of $7.8 million related to a voluntary Class II recallinitiated by OMI of all lots of 300mg tablets (as well as one lot of 200mg tablets) due to a tablet printing-relatedmatter. In June 2006, we resumed production of Ultram� ER (after the completion of the qualification andprocess validation of a new tablet printer), and we agreed to replace the recalled product, as well as certain lotsof Ultram� ER that were still in OMI’s inventory, and to bear the costs of the recall (which are recorded inselling, general and administrative expenses).
Biovail Pharmaceuticals Canada (‘‘BPC’’) products
Key BPC products are Tiazac� XC, Tiazac�, Wellbutrin� XL, Wellbutrin� SR and Zyban�, which are soldin Canada to drug wholesalers, retail pharmacies and hospitals. We currently promote Tiazac� XC,Wellbutrin� XL and Glumetza� directly to Canadian physicians. Sales of BPC products declined 31% and 2%in 2006 and 2005, respectively, compared with the immediately preceding years. The declines in BPC productsales reflected lower sales of Tiazac� and Wellbutrin� SR due to generic competition, partially offset byincreased sales of our promoted Wellbutrin� XL and Tiazac� XC products. Sales of Tiazac� XC in 2006 were,however, negatively impacted by a backorder of 120mg and 180mg products, due to the same manufacturingissues that affected our production of Cardizem� LA. This backorder situation has been substantially addressedin early 2007.
58
52
MANAGEMENT’S DISCUSSION AND ANALYSIS OFRESULTS OF OPERATIONS AND FINANCIAL CONDITION (Continued)
(All dollar amounts expressed in U.S. dollars)
GSK is no longer manufacturing and supplying us with Wellbutrin� SR and Zyban�. We have not presentlylocated an alternative supplier for these products; however, we believe we have purchased sufficient inventory tomeet anticipated customer requirements through 2007.
Legacy products
Our key Legacy products are Ativan�, Cardizem� CD, Isordil�, Tiazac�, Vasotec� and Vaseretic�, whichare sold primarily in the U.S. We do not actively promote these products as they have been genericized. We sellTiazac� (branded and generic) to Forest Laboratories, Inc. (‘‘Forest’’) for distribution in the U.S. Our otherLegacy products are primarily sold directly to drug wholesalers and warehousing chains. Sales of our Legacyproducts increased 5% and 10% in 2006 and 2005, respectively, compared with the immediately preceding years.The increases in Legacy product sales reflected price increases we effected for certain of these products in eachof the past three years, as well as the impact of reductions in wholesaler inventories of these products in 2004.
Generic products
Our key Generic products are bioequivalent versions of Adalat CC, Cardizem� CD , Procardia XL andVoltaren XR, which we manufacture and sell to a subsidiary of Teva for distribution in the U.S., as well as anauthorized generic version of Tiazac�, which we manufacture and sell to a subsidiary of Teva for distribution inCanada. Generic Tiazac� was introduced in Canada in January 2006. Sales of our Generic products increased4% in 2006, compared with 2005, and declined 10% in 2005, compared with 2004, which reflected the effect ofchanges in prescription volumes and pricing for these products, as well as changes in inventory levels of theseproducts owned by Teva.
Teveten
Since May 2005, we no longer have an ongoing financial interest in Teveten and Teveten HCT. In 2006, weincreased our estimate for returns related to our pre-May 2005 sales of these products by $1.3 million.
Research and development revenue
Research and development revenue declined 23% in 2006, compared with 2005, and increased 45% in 2005,compared with 2004, reflecting overall fluctuations in the level of clinical research and laboratory testing servicesprovided to external customers by our contract research operation, as well as the negative impact of competitivepricing for those services in 2006.
Royalty and other revenue
Royalty and other revenue increased 7% and 2% in 2006 and 2005, respectively, compared with theimmediately preceding years. In 2006, other revenue included $4.3 million related to our co-promotion ofUltram� ER in the U.S. and AstraZeneca Pharmaceuticals LP’s Zoladex� 3.6mg in the U.S. and Puerto Rico.We are no longer co-promoting Ultram� ER and Zoladex� as a result of the elimination of our U.S. specialtysales force. We are, however, continuing to promote Novartis Pharmaceuticals Canada Inc.’s Lescol� productsin Canada.
59
53

MANAGEMENT’S DISCUSSION AND ANALYSIS OFRESULTS OF OPERATIONS AND FINANCIAL CONDITION (Continued)
(All dollar amounts expressed in U.S. dollars)
OPERATING EXPENSES
The following table displays the dollar amount of each operating expense item for the last three years, thepercentage of each item compared with total revenue in the respective year, and the percentage changes in thedollar amount of each item. Percentages may not add due to rounding.
PercentageYears Ended December 31 Change2006 2005 2004 2005 2004
$ % $ % $ % to 2006 to 2005
($ in 000s)As As
Restated(1) Restated(1)
Cost of goods sold . . . . . . . . . . . . . . . 211,152 20 201,330 21 221,935 25 5% (9%)Research and development . . . . . . . . . 95,479 9 88,437 9 68,382 8 8% 29%Selling, general and administrative . . . 238,441 22 227,394 24 253,531 29 5% (10%)Amortization . . . . . . . . . . . . . . . . . . . 56,457 5 62,260 7 64,704 7 (9%) (4%)Asset impairments, net of gain on
disposal . . . . . . . . . . . . . . . . . . . . . 143,000 13 29,230 3 40,685 5 389% (28%)Restructuring costs . . . . . . . . . . . . . . . 15,126 1 19,810 2 — — (24%) NMContract losses . . . . . . . . . . . . . . . . . . 54,800 5 — — — — NM NMLitigation settlements . . . . . . . . . . . . . 14,400 1 — — — — NM NMAcquired research and development . . — — — — 8,640 1 NM (100%)
828,855 78 628,461 67 657,877 75 32% (4%)
(1) See above under ‘‘Restatement’’.
NM — Not meaningful
Cost of goods sold and gross margins
Gross margins based on product sales were 79%, 77% and 73% in 2006, 2005 and 2004, respectively.
The overall gross margin in 2006, compared with 2005, was positively impacted by the following factor:
• Higher volumes of Wellbutrin XL� sold to GSK, as well as the positive impact on our supply price of theprice increases effected by GSK in 2006 and 2005.
Partially offset by:
• A write-off to cost of goods sold of $11.4 million of rejected lots of Ultram� ER and Cardizem� LA;
• An increase of $2.7 million in the amortization of the Cardizem� LA intangible asset;
• The aforementioned product sales provision related to the return of withdrawn lots of Ultram� ER; and
• Start-up manufacturing inefficiencies related to Ultram� ER.
The overall gross margin in the 2005, compared with 2004, was positively impacted by the following factors:
• Manufacturing efficiencies achieved in the production of Wellbutrin XL�, as well as a decrease in theproportion of lower margin Wellbutrin XL� sample supplies versus trade product sales.
60
54

MANAGEMENT’S DISCUSSION AND ANALYSIS OFRESULTS OF OPERATIONS AND FINANCIAL CONDITION (Continued)
(All dollar amounts expressed in U.S. dollars)
Partially offset by:
• A provision of $5.7 million for Cardizem� CD inventory in excess of demand; and
• The write-off of $4.9 million of Cardizem� LA, Teveten and Teveten HCT inventories not purchasedby Kos.
Research and development expenses
Research and development expenses increased 8% and 29% in 2006 and 2005, respectively, compared withthe immediately preceding years. Research and development expenses include employee compensation costs,overhead and occupancy costs, clinical trial, clinical manufacturing and scale-up costs, contract research servicesand other third-party development costs. Research and development expenses also include costs associated withproviding contract research services to external customers.
Our research and development activities in 2006 primarily related to the following programs:
• BVF-033 (bupropion salt). The FDA accepted our New Drug Application (‘‘NDA’’) for BVF-033 forreview in November 2006. The FDA is expected to respond to our NDA in late July 2007.
• BVF-146 (combination tramadol and non-steroidal anti-inflammatory drug) for the treatment of pain.We initiated Phase III clinical trials for BVF-146 in the fourth quarter of 2006.
• BVF-127 (Tramadol ER). The TPD in Canada accepted our New Drug Submission for review inNovember 2006.
• BVF-211 (carvedilol) for the treatment of hypertension.
• BVF-045 (combination bupropion and another anti-depressant agent).
• BVF-012 (venlafaxine enhanced absorption) for the treatment of depression.
In November 2006, we amended our April 2002 agreement with Ethypharm to include the development of:BVF-087 and BVF-065, which target central nervous system disorders; BVF-239, a cardiovascular product; andBVF-300, a product targeting the gastrointestinal-disease market. In February 2007, we obtained an option tolicense Depomed Inc.’s (‘‘Depomed’’) AcuForm� technology to develop up to two pharmaceutical products.
On an ongoing basis, we review and optimize the projects in our development portfolio to reflect changes inthe competitive environment and emerging opportunities. Our future level of research and developmentexpenditures will depend on, among other things, the outcome of clinical testing of our products underdevelopment; delays or changes in government required testing and approval procedures; technologicaldevelopments; and strategic marketing decisions.
Selling, general and administrative expenses
Selling, general and administrative expenses increased 5% in 2006, compared with 2005, and declined 10%in 2005, compared with 2004. As a percentage of total revenue, selling, general and administrative expenses were22%, 24% and 29% in 2006, 2005 and 2004, respectively.
The increase in selling, general and administrative expenses in 2006, compared with 2005, was primarilydue to:
• Higher legal expenses related to ongoing Wellbutrin XL� patent infringement actions, and otherlitigation and regulatory matters;
61
55

MANAGEMENT’S DISCUSSION AND ANALYSIS OFRESULTS OF OPERATIONS AND FINANCIAL CONDITION (Continued)
(All dollar amounts expressed in U.S. dollars)
• Inclusion of $11.9 million of stock-based compensation for stock options granted to employees, partiallyoffset by a decline of $3.0 million in compensation expense related to deferred share units granted todirectors due to a decrease in the underlying trading price of our common shares; and
• Incremental spending to support the advertising and promotion of Ultram� ER, and costs associated withprocessing the Ultram� ER recall.
Partially offset by:
• Cost savings associated with a reduction in headcount in our primary-care and cardiovascular specialtysales forces following the May 2005 restructuring of our U.S. commercial operations; and
• Discontinuance of spending on sales and marketing activities to support Cardizem� LA, Teveten andTeveten HCT following the Kos transaction.
The decline in selling, general and administrative expenses in 2005, compared with 2004, was primarilydue to:
• The positive impact of the Kos transaction and concurrent restructuring of our U.S. commercialoperations.
Partially offset by:
• Higher legal expenses related to litigation and regulatory matters, and costs associated with our corporategovernance and Sarbanes-Oxley Act of 2002 compliance initiatives; and
• Inclusion of $3.0 million of compensation expense related to deferred share units granted to directors.
Amortization expense
Amortization expense declined 9% and 4% in 2006 and 2005, respectively, compared with the immediatelypreceding years. As a percentage of total revenue, amortization expense declined to 5% in 2006, compared with7% in each of 2005 and 2004. The decline in amortization expense in 2006 reflected the discontinuance of theamortization of the Teveten and Teveten HCT product rights following the Kos transaction, as well as reducedamortization in the fourth quarter of 2006 related to the Vasotec� and Vaseretic� intangible assets following thewrite-down of those assets.
Asset impairments, net of gain on disposal
We perform an evaluation of long-lived assets and investments for impairment whenever events or changesin circumstances indicate that the carrying value of those assets may not be recoverable. Impairment exists whenthe carrying amount of an asset is not recoverable based on related undiscounted future cash flows, and itscarrying amount exceeds its estimated fair value based on related discounted future cash flows. In 2006, werecorded an impairment charge of $147.0 million as a result of the following events or changes in circumstances:
• In September 2006, we were informed by Kos that it had decided to discontinue its involvement withVasocard� (a combination of Vasotec� and Cardizem� LA). We had been developing Vasocard� as aline extension to our Vasotec� and Vaseretic� product lines. We determined that without Kos’s continuedinvolvement Vasocard� had limited commercial potential and, consequently, we suspended itsdevelopment. Our evaluation of the estimated future cash flows associated solely with the existingVasotec� and Vaseretic� product lines resulted in an impairment charge of $132.0 million to the relatedtrademarks and product rights.
62
56

MANAGEMENT’S DISCUSSION AND ANALYSIS OFRESULTS OF OPERATIONS AND FINANCIAL CONDITION (Continued)
(All dollar amounts expressed in U.S. dollars)
• In October 2006, Depomed was granted a new Canadian patent pertaining to Glumetza�. As a result,the prices we set for Glumetza� are now subject to regulation by the Patented Medicine Prices ReviewBoard (‘‘PMPRB’’) in Canada. Since its launch in the Canadian market in November 2005, the salesperformance of Glumetza� (in terms of prescription volumes) has been less than originally anticipateddue to the competitive pricing and existing formulary listing of immediate-release generic formulations ofmetformin (the active drug compound in Glumetza�). We revised our sales forecast for Glumetza� toreflect both the possible future pricing concessions that may be required by the PMPRB and theunderlying prescription trend since the launch of this product. On the basis of this forecast, ourevaluation of the estimated future cash flows associated with the Glumetza� product line resulted in animpairment charge of $15.0 million to the related product right.
Partially offsetting the impairment charge in 2006 was a $4.0 million gain we recorded on the disposal offour cardiovascular products to Athpharma Limited (‘‘Athpharma’’). We originally acquired these products fromAthpharma in April 2003.
In 2005, we recorded an impairment charge of $29.2 million primarily related to the write-down of thecarrying value of the Teveten and Teveten HCT product rights that were transferred to Kos. In 2004, werecorded a net impairment charge of $40.7 million primarily related to an other-than-temporary decline in theestimated fair value of our equity investment in Ethypharm.
Restructuring costs
In 2006 and 2005, we incurred restructuring charges of $15.1 million and $19.8 million, respectively, whichconsisted of employee termination benefits, asset impairments, contract termination costs and professional fees.At December 31, 2006, the liability balance related to restructuring costs incurred, but not paid or settled, was$11.9 million, of which $8.4 million related to employee termination benefits that will be substantially paid in thefirst half of 2007. Also in the first half of 2007, we expect to incur incremental restructuring costs ofapproximately $1.0 million, primarily related to employee retention bonuses and contract termination costs.
Contract losses
In 2006, we recorded a charge of $54.8 million related to the following contract losses:
• As a result of the aforementioned introduction of generic competition to Wellbutrin XL�, we arerequired to make a payment to GSK under the terms of the Wellbutrin XL� agreement. The maximumamount of this payment was reduced by the total dollar amount of Wellbutrin XL� sample supplies thatwere purchased by GSK. At December 31, 2006, we accrued a contract loss of $46.4 million for theestimated amount of this payment based on GSK’s historical and forecasted sample supply purchases.
• In September 2006, we received notification from Kos that a supply failure had occurred as a result of ourinability to supply at least 50% of the quantity of Cardizem� LA ordered by Kos. At December 31, 2006,we accrued a contract loss of $8.4 million based on our estimate of the payment we may be required tomake to compensate Kos for the lost profits it may have experienced as a result of our supply failure. Thisliability may be revised in subsequent periods based on the receipt of Kos’s own estimate of the amountof its lost profits; however, we estimate our maximum potential liability to Kos to be approximately$14.0 million.
63
57

MANAGEMENT’S DISCUSSION AND ANALYSIS OFRESULTS OF OPERATIONS AND FINANCIAL CONDITION (Continued)
(All dollar amounts expressed in U.S. dollars)
Litigation settlements
In 2006, we recorded a charge of $14.4 million related to the following litigation settlements:
• In February 2007, GSK reached a settlement with Andrx Corporation (‘‘Andrx’’) (which was acquired byWatson Pharmaceuticals, Inc. in November 2006) related to a patent infringement suit by Andrx inrespect to its U.S. patent purportedly covering 150mg Wellbutrin XL� product. GSK agreed to make aone-time payment of $35.0 million to Andrx, while Andrx granted GSK a royalty-bearing license to itspatent. Under the terms of the Wellbutrin XL� agreement with GSK, we agreed to reimburse GSK for$11.7 million (one-third) of the payment to Andrx, which we accrued at December 31, 2006, and to payone-third of the ongoing royalty on sales of 150mg Wellbutrin XL� product.
• At December 31, 2006, we accrued $2.7 million for our estimated share of the total consideration to bepaid to settle certain antitrust claims related to our licensing of generic Adalat CC products.
Acquired research and development expense
Acquired research and development represents the cost of assets related to research and developmentprojects that, as of the acquisition date, had not reached technological feasibility and had no alternativefuture use.
In 2004, we acquired Pharma Pass II, LLC’s (‘‘PPII’’) remaining interest in BNC-Pharmapass, a companythat we formed in 2003 with PPII to advance the development of certain products. At the date of acquisition, werecorded a charge of $8.6 million to acquired research and development expense for the increase in our share ofthe fair values of the products under development.
NON-OPERATING ITEMS
Interest income and expense
Interest income was $29.2 million in 2006, compared with $7.2 million and $1.0 million in 2005 and 2004,respectively. The year-over-year increases in interest income reflected higher amounts of surplus cash availablefor investment.
Interest expense was $35.2 million in 2006, compared with $37.1 million and $40.1 million in 2005 and 2004,respectively. Interest expense mainly comprised interest on our Notes.
Following the redemption of our Notes effective April 1, 2007, we expect to save approximately $32 millionin annual interest payments; however, those interest savings will be partially offset by lower interest income onour remaining cash resources.
Equity loss
We recorded equity losses of $0.5 million, $1.2 million and $4.2 million in 2006, 2005 and 2004, respectively,related to our investment in a venture fund that invests in early-stage biotechnology companies. Included inthese equity losses was our share of goodwill impairment charges related to certain subsidiaries of this fund, aswell as write-downs to the carrying values of other investments held by this fund. At December 31, 2006, we hadinvested a total of $6.8 million in this fund. As the nature of this fund is no longer consistent with our businessstrategy, we will not be making any additional capital contributions in it beyond our remaining commitment of$1.1 million.
64
58

MANAGEMENT’S DISCUSSION AND ANALYSIS OFRESULTS OF OPERATIONS AND FINANCIAL CONDITION (Continued)
(All dollar amounts expressed in U.S. dollars)
Income taxes
Our effective tax rate reflected the fact that most of our income was derived from foreign subsidiaries withlower statutory tax rates than those that apply in Canada. We recorded provisions for income taxes of$14.5 million in 2006, compared with $22.6 million and $9.0 million in 2005 and 2004, respectively. Our effectivetax rate was affected by the availability of unrecognized tax loss carryforwards that can be used to offset taxableincome in Canada and the U.S.
DISCONTINUED OPERATION
On May 2, 2006, we completed the sale of our Nutravail division to Futuristic Brands USA, Inc.(‘‘Futuristic’’). In consideration for Nutravail’s inventory, long-lived assets and intellectual property, we areentitled to future payments based on the net revenues generated from those assets by Futuristic for a period of10 years.
Subsequent to May 2, 2006, Nutravail’s operations and direct cash flows have been eliminated from ourongoing operations as a result of the sale transaction. The extent to which we are involved in the operations ofNutravail is limited to our ability to receive indirect cash flows from the future payments. We have no continuingobligations in connection with the receipt of those payments, which are not expected to be significant to ourcontinuing operations or those of Nutravail. Accordingly, the following amounts related to Nutravail have beenreported as a discontinued operation in our consolidated statements of income and cash flows.
Years Ended December 31
2006 2005 2004
($ in 000s)
Revenue . . . . . . . . . . . . . . . . . . . . . . . . . . . . . . . . . . . . . . . . . . . . . . . . . . . $ 1,289 $ 5,532 $ 7,387
Loss from discontinued operation before asset impairments . . . . . . . . . . . . . . (2,764) (5,005) (5,215)Asset impairments . . . . . . . . . . . . . . . . . . . . . . . . . . . . . . . . . . . . . . . . . . . . (1,084) (5,570) —
Loss from discontinued operation . . . . . . . . . . . . . . . . . . . . . . . . . . . . . . . . . $(3,848) $(10,575) $(5,215)
65
59

MANAGEMENT’S DISCUSSION AND ANALYSIS OFRESULTS OF OPERATIONS AND FINANCIAL CONDITION (Continued)
(All dollar amounts expressed in U.S. dollars)
SUMMARY OF QUARTERLY RESULTS
The following table presents a summary of our quarterly results of operations and cash flows fromcontinuing operations in 2006 and 2005:
Q1 2006 Q2 2006
($ in 000s, except per share data)As As As As
Reported Adjustments(1) Restated Reported Adjustments(1) Restated
REVENUEProduct sales . . . . . . . . . . . . . . . $209,705 $ 2,106 $211,811 $241,118 $ 2,337 $243,455Research and development . . . . . 4,909 — 4,909 3,951 — 3,951Royalty and other . . . . . . . . . . . . 5,909 — 5,909 7,737 — 7,737
220,523 2,106 222,629 252,806 2,337 255,143
EXPENSESCost of goods sold . . . . . . . . . . . 49,329 (2,137) 47,192 61,819 (3,251) 58,568Research and development . . . . . 22,328 — 22,328 18,402 — 18,402Selling, general and administrative 56,550 — 56,550 66,670 — 66,670Amortization . . . . . . . . . . . . . . . 14,824 — 14,824 14,825 — 14,825Contract losses . . . . . . . . . . . . . . — — — 4,500 — 4,500
143,031 (2,137) 140,894 166,216 (3,251) 162,965
Operating income . . . . . . . . . . . . 77,492 4,243 81,735 86,590 5,588 92,178Interest income . . . . . . . . . . . . . . 5,196 — 5,196 6,116 — 6,116Interest expense . . . . . . . . . . . . . (9,024) — (9,024) (8,485) — (8,485)Foreign exchange gain (loss) . . . . (590) (293) (883) 1,401 (905) 496Equity income (loss) . . . . . . . . . . (318) — (318) 50 — 50
Income from continuingoperations before provision forincome taxes . . . . . . . . . . . . . . 72,756 3,950 76,706 85,672 4,683 90,355
Provision for income taxes . . . . . . 4,150 — 4,150 5,350 — 5,350
Income from continuingoperations . . . . . . . . . . . . . . . . 68,606 3,950 72,556 80,322 4,683 85,005
Income (loss) from discontinuedoperation . . . . . . . . . . . . . . . . (4,120) — (4,120) 272 — 272
Net income . . . . . . . . . . . . . . . . $ 64,486 $ 3,950 $ 68,436 $ 80,594 $ 4,683 $ 85,277
Basic and diluted earnings pershare
Income from continuingoperations . . . . . . . . . . . . . . . . $ 0.43 $ 0.02 $ 0.45 $ 0.50 $ 0.03 $ 0.53
Net income . . . . . . . . . . . . . . . . $ 0.40 $ 0.02 $ 0.43 $ 0.50 $ 0.03 $ 0.53
Net cash provided by continuingoperating activities . . . . . . . . . . $ 94,692 $ — $ 94,692 $110,806 $ — $110,806
(1) See explanations above under ‘‘Restatement’’.
66
60

MANAGEMENT’S DISCUSSION AND ANALYSIS OFRESULTS OF OPERATIONS AND FINANCIAL CONDITION (Continued)
(All dollar amounts expressed in U.S. dollars)
Q3 2006 Q4 2006
($ in 000s, except per share data)As As As As
Reported Adjustments(1) Restated Reported Adjustments(1) Restated
REVENUEProduct sales . . . . . . . . . . . . . . . $277,265 $ (7,250) $270,015 $295,997 $ — $295,997Research and development . . . . . 5,691 — 5,691 7,042 — 7,042Royalty and other . . . . . . . . . . . . 6,596 — 6,596 4,609 — 4,609
289,552 (7,250) 282,302 307,648 — 307,648
EXPENSESCost of goods sold . . . . . . . . . . . 59,332 (3,523) 55,809 52,801 (3,218) 49,583Research and development . . . . . 26,350 — 26,350 28,399 — 28,399Selling, general and administrative 50,168 — 50,168 65,053 — 65,053Amortization . . . . . . . . . . . . . . . 14,824 — 14,824 11,984 — 11,984Restructuring costs . . . . . . . . . . . — — — 15,126 — 15,126Asset impairments, net of gain on
disposal . . . . . . . . . . . . . . . . . 143,000 — 143,000 — — —Contract losses . . . . . . . . . . . . . . 46,800 — 46,800 3,500 — 3,500Litigation settlements . . . . . . . . . — — — 14,400 — 14,400
340,474 (3,523) 336,951 191,263 (3,218) 188,045
Operating income (loss) . . . . . . . (50,922) (3,727) (54,649) 116,385 3,218 119,603Interest income . . . . . . . . . . . . . . 7,577 — 7,577 10,310 — 10,310Interest expense . . . . . . . . . . . . . (8,951) — (8,951) (8,743) — (8,743)Foreign exchange loss . . . . . . . . . (250) 115 (135) (1,277) (561) (1,838)Equity loss . . . . . . . . . . . . . . . . . (205) — (205) (56) — (56)
Income (loss) from continuingoperations before provision forincome taxes (52,751) (3,612) (56,363) 116,619 2,657 119,276
Provision for income taxes . . . . . . 3,700 — 3,700 1,300 — 1,300
Income (loss) from continuingoperations . . . . . . . . . . . . . . . . (56,451) (3,612) (60,063) 115,319 2,657 117,976
Loss from discontinued operation — — — — — —
Net income (loss) . . . . . . . . . . . . $ (56,451) $ (3,612) $(60,063) $115,319 $ 2,657 $117,976
Basic and diluted earnings (loss)per share
Income (loss) from continuingoperations . . . . . . . . . . . . . . . . $ (0.35) $ (0.02) $ (0.37) $ 0.72 $ 0.02 $ 0.74
Net income (loss) . . . . . . . . . . . . $ (0.35) $ (0.02) $ (0.37) $ 0.72 $ 0.02 $ 0.74
Net cash provided by continuingoperating activities . . . . . . . . . . $ 81,382 $ — $ 81,382 $235,637 $ — $235,637
(1) See explanations above under ‘‘Restatement’’.
67
61

MANAGEMENT’S DISCUSSION AND ANALYSIS OFRESULTS OF OPERATIONS AND FINANCIAL CONDITION (Continued)
(All dollar amounts expressed in U.S. dollars)
Q1 2005 Q2 2005
($ in 000s, except per share data)As As As As
Reported Adjustments(1) Restated Reported Adjustments(1) Restated
REVENUEProduct sales . . . . . . . . . . . . $160,531 $— $160,531 $204,519 $ 981 $205,500Research and development . . 7,200 — 7,200 6,369 — 6,369Royalty and other . . . . . . . . . 5,955 — 5,955 5,290 — 5,290
173,686 — 173,686 216,178 981 217,159
EXPENSESCost of goods sold . . . . . . . . 41,101 — 41,101 59,872 (242) 59,630Research and development . . 19,954 — 19,954 22,268 — 22,268Selling, general and
administrative . . . . . . . . . . 74,694 — 74,694 57,167 — 57,167Amortization . . . . . . . . . . . . 15,966 — 15,966 15,409 — 15,409Restructuring costs . . . . . . . . — — — 18,607 — 18,607Asset impairments, net of
gain on disposal . . . . . . . . — — — 26,560 — 26,560
151,715 — 151,715 199,883 (242) 199,641
Operating income . . . . . . . . . 21,971 — 21,971 16,295 1,223 17,518Interest income . . . . . . . . . . 378 — 378 912 — 912Interest expense . . . . . . . . . . (8,897) — (8,897) (9,574) — (9,574)Foreign exchange gain (loss) . (538) 778 240 (153) 1,175 1,022Equity loss . . . . . . . . . . . . . . (270) — (270) (263) — (263)
Income from continuingoperations beforeprovision for incometaxes . . . . . . . . . . . . . . . 12,644 778 13,422 7,217 2,398 9,615
Provision for income taxes . . 585 — 585 2,295 — 2,295
Income from continuingoperations . . . . . . . . . . . . 12,059 778 12,837 4,922 2,398 7,320
Loss from discontinuedoperation . . . . . . . . . . . . . (927) — (927) (1,215) — (1,215)
Net income . . . . . . . . . . . . . $ 11,132 $778 $ 11,910 $ 3,707 $2,398 $ 6,105
Basic and diluted earningsper share
Income from continuingoperations . . . . . . . . . . . . $ 0.08 $— $ 0.08 $ 0.03 $ 0.02 $ 0.05
Net income . . . . . . . . . . . . . $ 0.07 $— $ 0.07 $ 0.02 $ 0.02 $ 0.04
Net cash provided bycontinuing operatingactivities . . . . . . . . . . . . . . $ 67,796 $— $ 67,796 $ 88,247 $ — $ 88,247
(1) See explanations above under ‘‘Restatement’’.
68
62

MANAGEMENT’S DISCUSSION AND ANALYSIS OFRESULTS OF OPERATIONS AND FINANCIAL CONDITION (Continued)
(All dollar amounts expressed in U.S. dollars)
Q3 2005 Q4 2005
($ in 000s, except per share data)As As As As
Reported Adjustments(1) Restated Reported Adjustments(1) Restated
REVENUEProduct sales . . . . . . . . . . . . . . . $244,455 $ 1,162 $245,617 $274,762 $ 664 $275,426Research and development . . . . . 7,647 — 7,647 6,733 — 6,733Royalty and other . . . . . . . . . . . . 5,956 — 5,956 6,119 — 6,119
258,058 1,162 259,220 287,614 664 288,278
EXPENSESCost of goods sold . . . . . . . . . . . 51,991 (1,598) 50,393 53,567 (3,361) 50,206Research and development . . . . . 19,913 — 19,913 26,302 — 26,302Selling, general and administrative 42,402 — 42,402 53,131 — 53,131Amortization . . . . . . . . . . . . . . . 15,443 — 15,443 15,442 — 15,442Restructuring costs . . . . . . . . . . . 1,118 — 1,118 85 — 85Asset impairments, net of gain on
disposal . . . . . . . . . . . . . . . . . — — — 2,670 — 2,670
130,867 (1,598) 129,269 151,197 (3,361) 147,836
Operating income . . . . . . . . . . . . 127,191 2,760 129,951 136,417 4,025 140,442Interest income . . . . . . . . . . . . . . 2,386 — 2,386 3,499 — 3,499Interest expense . . . . . . . . . . . . . (9,450) — (9,450) (9,205) — (9,205)Foreign exchange gain (loss) . . . . (1,462) 63 (1,399) 736 195 931Equity loss . . . . . . . . . . . . . . . . . (271) — (271) (356) — (356)
Income from continuingoperations before provision forincome taxes . . . . . . . . . . . . . . 118,394 2,823 121,217 131,091 4,220 135,311
Provision for income taxes . . . . . . 9,095 — 9,095 10,575 — 10,575
Income from continuingoperations . . . . . . . . . . . . . . . . 109,299 2,823 112,122 120,516 4,220 124,736
Loss from discontinued operation (7,636) — (7,636) (797) — (797)
Net income . . . . . . . . . . . . . . . . $101,663 $ 2,823 $104,486 $119,719 $ 4,220 $123,939
Basic and diluted earnings pershare
Income from continuingoperations . . . . . . . . . . . . . . . . $ 0.69 $ 0.02 $ 0.70 $ 0.75 $ 0.03 $ 0.78
Net income . . . . . . . . . . . . . . . . $ 0.64 $ 0.02 $ 0.65 $ 0.75 $ 0.03 $ 0.77
Net cash provided by continuingoperating activities . . . . . . . . . . $122,446 $ — $122,446 $223,390 $ — $223,390
(1) See explanations above under ‘‘Restatement’’.
69
63

MANAGEMENT’S DISCUSSION AND ANALYSIS OFRESULTS OF OPERATIONS AND FINANCIAL CONDITION (Continued)
(All dollar amounts expressed in U.S. dollars)
RESULTS FOR THE FOURTH QUARTER
Revenue
The increase in revenue in the fourth quarter of 2006, compared with the fourth quarter of 2005, was duemainly to an increase in revenue from sales of Wellbutrin XL�, which reflected the positive impact of a priceincrease effected by GSK in the second quarter of 2006, as well as the added contribution from sales ofUltram� ER in fourth quarter of 2006. These factors were partially offset by lower Tiazac� and Wellbutrin� SRproduct sales in Canada in the fourth quarter of 2006, due to generic competition.
The increase in revenue in the fourth quarter of 2006, compared with the first three quarters of 2006, wasdue mainly to the positive impact of the tiered supply price for Wellbutrin XL�, which is reset to the lowest tierat the start of each calendar year. In the second and third quarters of 2006, GSK’s net sales of Wellbutrin XL�exceeded the sales-dollar threshold to increase the supply price from the first to second tier and from the secondto third and highest tier, respectively. As a result, all Wellbutrin XL� brand sales, except for any product held ininventory by GSK at the end of 2006, were recorded at the highest-tier supply price in the fourth quarter of 2006.
Results of operations
The increase in income from continuing operations and net income in the fourth quarter of 2006, comparedwith the fourth quarter of 2005, was due mainly to higher gross profit on Wellbutrin XL� and Ultram� ERproduct sales, as well as higher interest income. These factors were partially offset by charges in the fourthquarter of 2006 of $15.1 million for restructuring activities; $14.4 million for litigation settlements; and$3.5 million for contract losses.
The increase in income from continuing operations and net income in the fourth quarter of 2006, comparedwith the first three quarters of 2006, reflected the increasing gross margin on Wellbutrin XL� product sales dueto the tiered supply price. The loss from continuing operations and net loss in the third quarter of 2006 was duemainly to the impact of charges of $147.0 million for asset impairments and $46.8 million for contract losses.
Cash flows
The increase in net cash provided by continuing operating activities in the fourth quarter of 2006, comparedwith the fourth quarter of 2005, was mainly related to higher gross profit on Wellbutrin XL� and Ultram� ERproduct sales, as well as increased collections of accounts receivable in the fourth quarter of 2006, offset partiallyby the receipt of a $60 million supply prepayment from OMI for Ultram� ER in the fourth quarter of 2005.
The increase in net cash provided by continuing operating activities in the fourth quarter of 2006, comparedwith the first three quarters of 2006, reflected higher gross profit recognized on Wellbutrin XL� andUltram� ER product sales, as well as fluctuations in accounts receivable due to the amount and timing ofproduct sales.
70
64

MANAGEMENT’S DISCUSSION AND ANALYSIS OFRESULTS OF OPERATIONS AND FINANCIAL CONDITION (Continued)
(All dollar amounts expressed in U.S. dollars)
FINANCIAL CONDITION
The following table presents a summary of our financial condition at December 31, 2006 and 2005:
2006 2005
($ in 000s)As As
Restated(1) Restated(1)
Working capital (total current assets less total current liabilities) . . . . . . . . . . . . . . $ 647,337 $ 414,033Long-lived assets . . . . . . . . . . . . . . . . . . . . . . . . . . . . . . . . . . . . . . . . . . . . . . . . 1,072,699 1,274,844Long-term obligations . . . . . . . . . . . . . . . . . . . . . . . . . . . . . . . . . . . . . . . . . . . . . 411,791 436,868Shareholders’ equity . . . . . . . . . . . . . . . . . . . . . . . . . . . . . . . . . . . . . . . . . . . . . . 1,302,257 1,228,364
(1) See above under ‘‘Restatement’’.
Working capital
The $233.3 million increase in working capital from 2005 to 2006 was primarily due to:
• Cash generated from continuing operations of $522.5 million; and
• A decrease in accounts payable of $16.5 million related to the timing of payments and lower payablesrelated to capital expenditures, inventory purchases and professional fees.
Partially offset by:
• Dividends declared of $160.3 million;
• An increase in accrued contract losses of $54.8 million;
• Additions to property, plant and equipment of $44.8 million;
• An increase in accrued liabilities of $26.7 million mainly related to unpaid litigation settlements andrestructuring costs; and
• Repayments of long-term obligations of $25.5 million.
Long-lived assets
Long-lived assets comprise property, plant and equipment, goodwill, intangible and other assets, net ofaccumulated depreciation and amortization. The $202.1 million decrease in long-lived assets from 2005 to 2006was primarily due to:
• Asset impairment charge of $147.0 million related to write-down of the Vasotec�, Vaseretic� andGlumetza� intangible assets; and
• Depreciation of plant and equipment of $25.5 million and the amortization of intangible and other assetsof $69.0 million.
Partially offset by:
• Additions to property, plant and equipment of $44.8 million, which included expenditures related to theexpansion of our manufacturing facility in Steinbach, Manitoba (which is now substantially complete) andthe addition of equipment at our manufacturing facility in Dorado, Puerto Rico.
71
65

MANAGEMENT’S DISCUSSION AND ANALYSIS OFRESULTS OF OPERATIONS AND FINANCIAL CONDITION (Continued)
(All dollar amounts expressed in U.S. dollars)
Long-term obligations
The $25.1 million decrease in long-term obligations, including the current portion thereof, from 2005 to2006 was primarily due to:
• Final payment of $14.0 million related to the May 2002 acquisition of Vasotec� and Vaseretic�; and
• Payment of $11.3 million to GSK related to the October 2002 amendments to the Zovirax� distributionagreement.
Shareholders’ equity
The $73.9 million increase in shareholders’ equity from 2005 to 2006 was primarily due to:
• Net income of $211.6 million (including $14.8 million of stock-based compensation recorded in additionalpaid-in capital); and
• Proceeds of $15.6 million from the issuance of common shares, mainly on the exercise of stock options.
Partially offset by:
• Dividends declared of $160.3 million.
CASH FLOWS
Our primary source of cash is the collection of accounts receivable related to product sales. Our primaryuses of cash include salaries and benefits; inventory purchases; research and development programs; sales andmarketing activities; capital expenditures; loan repayments; and dividend payments. The following table displayscash flow information for the last three years:
Years Ended December 31
2006 2005 2004
($ in 000s)
Net cash provided by continuing operating activities . . . . . . . . . . . . . . . . $522,517 $ 501,879 $ 279,566Net cash provided by (used in) continuing investing activities . . . . . . . . . (40,447) 31,825 (42,258)Net cash used in continuing financing activities . . . . . . . . . . . . . . . . . . . . (92,256) (119,095) (334,526)Net cash used in discontinued operation . . . . . . . . . . . . . . . . . . . . . . . . (558) (3,817) (2,481)Effect of exchange rate changes on cash and cash equivalents . . . . . . . . . (5) 173 762
Net increase (decrease) in cash and cash equivalents . . . . . . . . . . . . . . . $389,251 $ 410,965 $ (98,937)
Operating activities
Net cash provided by continuing operating activities increased $20.6 million from 2005 to 2006, primarilydue to:
• An increase of $143.1 million related to income from operations before changes in operating assets andliabilities, due mainly to higher gross profit on product sales, lower sales force and marketing costs, andhigher interest income. Those factors were partially offset by higher legal expenses; and
• An increase of $22.5 million related to the change in accrued liabilities, due mainly to unpaid litigationsettlements and restructuring costs.
Partially offset by:
• A decrease of $90.3 million related to the change in deferred revenue, due mainly to the receipt of the$60 million supply prepayment from OMI in 2005, as well as the portion of that prepayment and thedeferred proceeds from the Kos transaction that were amortized in 2006;
72
66

MANAGEMENT’S DISCUSSION AND ANALYSIS OFRESULTS OF OPERATIONS AND FINANCIAL CONDITION (Continued)
(All dollar amounts expressed in U.S. dollars)
• A decrease of $35.7 million related to the change in inventories and accounts payable, due mainly to thetiming of inventory purchases and payments;
• A decrease of $9.4 million related to the change in income taxes payable; and
• A decrease of $8.1 million related to the timing of collection of accounts receivable.
Net cash provided by continuing operating activities increased $222.3 million from 2004 to 2005, primarilydue to:
• An increase of $67.1 million related to income from operations before changes in operating assets andliabilities, due mainly to higher gross profit on product sales, and lower sales force and marketing costs;
• An increase of $43.7 million related to the change in deferred revenue, due mainly to the receipt of the$60 million supply prepayment from OMI;
• An increase of $43.1 million related to the change in inventories, due mainly to lower purchases relatedto Teveten and Teveten HCT following the Kos transaction, and a work-down of our inventories ofCardizem� CD and Zovirax� products, as well as an increase in our provision for inventory obsolescencerelated to Cardizem� CD;
• An increase of $42.3 million related to the change in accounts payable, due mainly to the timing ofpayments and higher payables related to legal and consulting fees; and
• An increase of $27.3 million related to the change in accrued liabilities, due mainly to lower paymentsrelated to product returns, rebates and chargebacks.
Partially offset by:
• A decrease of $15.6 million related to the timing of collection of accounts receivable.
Investing activities
Net cash used in continuing investing activities increased $72.3 million from 2005 to 2006, primarily due to:
• A decrease of $94.1 million in proceeds from the disposal of intangible assets, mainly related toconsideration received in connection with the Kos transaction in 2005.
Partially offset by:
• A decrease of $26.0 million in payments to acquire intangible assets, primarily related to the addition ofthe Glumetza� product right in 2005.
Net cash provided by continuing investing activities increased $74.1 million from 2004 to 2005 primarilydue to:
• An increase of $95.1 million in proceeds from the disposal of intangible assets, mainly related to the Kostransaction; and
• A decrease of $9.3 million in payments to acquire businesses, related to our acquisition of PPII’sremaining interest in BNC-Pharmapass in 2004.
Partially offset by:
• An increase of $26.0 million in payments to acquire intangible assets, primarily related to the addition ofthe Glumetza� product right; and
• An increase of $9.8 million in capital expenditures on property, plant and equipment in 2005, mainlyrelated to the expansion of our Steinbach manufacturing facility.
73
67

MANAGEMENT’S DISCUSSION AND ANALYSIS OFRESULTS OF OPERATIONS AND FINANCIAL CONDITION (Continued)
(All dollar amounts expressed in U.S. dollars)
Financing activities
Net cash used in continuing financing activities declined $26.8 million from 2005 to 2006, primarily due to:
• An increase of $12.6 million in proceeds from the issuance of common shares; and
• A decrease of $14.1 million in repayments of long-term obligations, primarily related to the final paymentin 2005 for Ativan� and Isordil�.
Net cash used in continuing financing activities declined by $215.0 million from 2004 to 2005 primarilydue to:
• A decrease of $280.0 million related to repayments under our credit facility in 2004; and
• A decrease of $26.7 million in repayments of other long-term obligations, mainly related to the finalpayment in 2004 for the Canadian rights to Wellbutrin� and Zyban�.
Partially offset by:
• An increase of $79.8 million related to dividends paid in 2005.
LIQUIDITY AND CAPITAL RESOURCES
The following table displays our net financial asset position at December 31, 2006 and 2005:
At December 31
2006 2005
($ in 000s)
Financial assetsCash and cash equivalents . . . . . . . . . . . . . . . . . . . . . . . . . . . . . . . . . . . . . . . . . . . . $834,540 $445,289Marketable securities . . . . . . . . . . . . . . . . . . . . . . . . . . . . . . . . . . . . . . . . . . . . . . . . 5,677 7,364
Total financial assets . . . . . . . . . . . . . . . . . . . . . . . . . . . . . . . . . . . . . . . . . . . . . . . . 840,217 452,653
DebtNotes . . . . . . . . . . . . . . . . . . . . . . . . . . . . . . . . . . . . . . . . . . . . . . . . . . . . . . . . . . . 399,379 400,552Other long-term obligations . . . . . . . . . . . . . . . . . . . . . . . . . . . . . . . . . . . . . . . . . . . 12,412 36,316
Total debt . . . . . . . . . . . . . . . . . . . . . . . . . . . . . . . . . . . . . . . . . . . . . . . . . . . . . . . . 411,791 436,868
Net financial assets . . . . . . . . . . . . . . . . . . . . . . . . . . . . . . . . . . . . . . . . . . . . . . . . . $428,426 $ 15,785
We believe that our existing cash resources, together with cash expected to be generated by operations andexisting funds available under our credit facility, will be sufficient to support our operational, capitalexpenditure, debt repayment, interest requirements and dividend policy, as well as to meet our working capitalneeds, for at least the next 12 months, based on our current expectations. We intend to use $422.5 million of ourexisting cash resources to finance the early redemption of our Notes. That total comprises the principal amountof our Notes plus accrued interest to April 1, 2007, and an early redemption premium of $7.9 million to be paidto the noteholders. We anticipate total capital expenditures of approximately $55 million in 2007. Major projectsinclude an expansion of our corporate office in Mississauga, Ontario, and the upgrade of our Doradomanufacturing facility. In the event that we make significant future acquisitions or change our capital structure,we may be required to raise additional funds through additional borrowings or the issuance of additional debt orequity securities.
74
68

MANAGEMENT’S DISCUSSION AND ANALYSIS OFRESULTS OF OPERATIONS AND FINANCIAL CONDITION (Continued)
(All dollar amounts expressed in U.S. dollars)
Credit facility
In June 2006, we amended and renewed our $250 million credit facility with our banking syndicate. Thisamended facility has a three-year term with an annual extension option. At December 31, 2006, we had nooutstanding borrowings under this facility. This facility may be used for general corporate purposes, includingacquisitions, and includes an accordion feature, which allows it to be increased up to $400 million. AtDecember 31, 2006, we were in compliance with all financial and non-financial covenants associated withthis facility.
Credit ratings
Our current corporate credit ratings from Standard & Poor’s (‘‘S&P’’) and Moody’s Investors Service(‘‘Moody’s’’) are as follows:
S&P Moody’s
Overall corporate . . . . . . . . . . . . . . . . . . . . . . . . . . . . . . . . . . . . . . . . . . . . . . . . . . . . BB+ Ba3Credit facility . . . . . . . . . . . . . . . . . . . . . . . . . . . . . . . . . . . . . . . . . . . . . . . . . . . . . . . BBB� NRNotes . . . . . . . . . . . . . . . . . . . . . . . . . . . . . . . . . . . . . . . . . . . . . . . . . . . . . . . . . . . . BB� B1Outlook . . . . . . . . . . . . . . . . . . . . . . . . . . . . . . . . . . . . . . . . . . . . . . . . . . . . . . . . . . . Stable Stable
NR — Not rated
CONTRACTUAL OBLIGATIONS
The following table summarizes our contractual obligations at December 31, 2006:
Payments Due by Period
2008 2010Total 2007 and 2009 and 2011 Thereafter
($ in 000s)
Long-term obligations, including interest payments(1) $425,859 $425,859 $ — $ — $ —Operating lease obligations . . . . . . . . . . . . . . . . . . . . . . . . 34,609 6,219 9,764 7,188 11,438Purchase obligations(2) . . . . . . . . . . . . . . . . . . . . . . . . . . . 129,411 68,384 33,724 24,866 2,437
Total contractual obligations . . . . . . . . . . . . . . . . . . . . . . . $589,879 $500,462 $43,488 $32,054 $13,875
(1) Our Notes are included as due for payment in 2007, as a result of our election to redeem them effective April 1, 2007.
(2) Purchase obligations consist of agreements to purchase goods and services that are enforceable and legally binding and includeobligations for minimum inventory and capital expenditures, and outsourced information technology, product promotion, and clinicalresearch services.
The above table does not reflect any milestone payments in connection with research and developmentcollaborations with third parties. These payments are contingent on the achievement of specific developmental,regulatory and/or commercial milestones. In addition, under certain arrangements, we may have to make royaltypayments based on a percentage of future sales of the products in the event regulatory approval for marketing isobtained. From a business perspective, we view these payments favourably as they signify that the products aremoving successfully through the development phase toward commercialization. We do not anticipate that we willbe required to make any material milestone payments in 2007.
75
69

MANAGEMENT’S DISCUSSION AND ANALYSIS OFRESULTS OF OPERATIONS AND FINANCIAL CONDITION (Continued)
(All dollar amounts expressed in U.S. dollars)
OFF-BALANCE SHEET ARRANGEMENTS
We did not have any off-balance sheet arrangements at December 31, 2006, other than operating leases,purchase obligations and contingent milestone payments, which are disclosed above under ‘‘ContractualObligations’’.
In the normal course of business, we enter into agreements that include indemnification provisions forproduct liability and other matters. If the indemnified party were to make a successful claim pursuant to theterms of the indemnification, we would be required to reimburse the loss. These provisions are generally subjectto maximum amounts, specified claim periods, and other conditions and limits. Other than the aforementionedaccrual for Kos’s estimated lost profit claim, no material amounts were accrued at December 31, 2006 for ourobligations under these provisions.
OUTSTANDING SHARE DATA
At March 19, 2007, we had 160,466,541 issued and outstanding common shares, as well as outstandingoptions to purchase 7,322,104 common shares under our stock option plans.
QUANTITATIVE AND QUALITATIVE DISCLOSURES ABOUT MARKET RISK
We are exposed to financial market risks, including changes in foreign currency exchange rates, interestrates on investments and debt obligations, and equity market prices on long-term investments. We use derivativefinancial instruments from time to time as a risk management tool and not for trading or speculative purposes.
Inflation has not had a significant impact on our results of operations.
Foreign currency risk
We operate internationally but a majority of our revenue and expense activities and capital expenditures aredenominated in U.S. dollars. Our only other significant transactions are denominated in Canadian dollars. Wedo not have any material non-U.S. dollar-denominated obligations. We also face foreign currency exposure onthe translation of our operations in Canada, Ireland and France from their local currencies to the U.S. dollar.Currently, we do not utilize forward contracts to hedge against foreign currency risk; however, a 10% change inforeign currency exchange rates would not have a material impact on our results of operations, financial positionor cash flows.
The redemption of our Notes will likely result in a foreign exchange gain for Canadian income tax purposes.The amount of this gain will depend on the exchange rate between the U.S. and Canadian dollar at the time theNotes are paid. At March 19, 2007, the unrealized foreign exchange gain on the translation of the Notes toCanadian dollars for Canadian income tax purposes was approximately $141 million. If all of our outstandingNotes had been paid at March 19, 2007, one-half of this foreign exchange gain would be included in ourCanadian taxable income, which would result in a corresponding reduction in our available Canadian operatinglosses and tax credit carryforward balances (with an offsetting reduction to the valuation allowance providedagainst those balances). However, the payment of our Notes will not result in a foreign exchange gain beingrecognized in our consolidated financial statements, as those statements are prepared in U.S. dollars.
76
70

MANAGEMENT’S DISCUSSION AND ANALYSIS OFRESULTS OF OPERATIONS AND FINANCIAL CONDITION (Continued)
(All dollar amounts expressed in U.S. dollars)
Interest rate risk
The primary objective of our policy for the investment of cash surpluses is the protection of principal and,accordingly, we invest in investment-grade securities with varying maturities, but typically less than 90 days. As itis our intent and policy to hold these investments until maturity, we do not have a material exposure to interestrate risk.
We are exposed to interest rate risk on borrowings under our credit facility. This facility, which is currentlyundrawn, bears interest based on London Interbank Offering Rate, U.S. dollar base rate, Canadian dollar primerate or Canadian dollar bankers’ acceptance. The imputed rates of interest used to discount our long-termobligations related to the acquisitions of intangible assets are fixed and, consequently, the fair values of theseobligations are affected by changes in interest rates. The fair value of our fixed-rate Notes is also affected bychanges in interest rates. Currently, we do not utilize interest rate swap contracts to hedge against interest raterisk; however, based on our overall interest rate exposure, a 10% change in interest rates would not have amaterial impact on our results of operations, financial position or cash flows.
Investment risk
We are exposed to investment risks on our investments in other companies. The fair values of ourinvestments are subject to significant fluctuations due to stock market volatility and changes in general marketconditions. We regularly review the carrying values of our investments and record losses whenever events andcircumstances indicate that there have been other-than-temporary declines in their fair values. A 10% change inthe total fair values of our investments would have a material impact on our results of operations; however, itwould not have a material impact on our financial position or cash flows.
RELATED PARTY TRANSACTIONS
In May 2006, we named Dr. Peter Silverstone as Senior Vice-President, Medical and Scientific Affairs.Dr. Silverstone joined Biovail from Global IQ, a clinical research organization that he co-founded in 1999,where he served as Chief Medical Officer. Global IQ has in the past provided clinical research services toBiovail, and prior to Dr. Silverstone’s joining Biovail, we had selected Global IQ as the preferred vendor for anew clinical study for a particular product. In connection with this study, Global IQ has been providing servicesfor a long-term safety study and may provide other Phase III clinical work in the future in respect of thisproduct. We have been invoiced a total of $2.0 million by Global IQ for this study up to and includingDecember 31, 2006. At December 31, 2006, $220,000 of this amount remained outstanding. It is currentlyanticipated that the study in respect of this product will continue for a period of at least one year. While clinicalresearch studies are within Dr. Silverstone’s area of management and control, we have taken steps to ensure thathe is not involved in any financial decisions in connection with any services provided or to be provided by GlobalIQ. Further, we have stated that Global IQ will no longer be eligible to bid to perform services for Biovail inconnection with any new clinical programs for other products until Dr. Silverstone has disposed of his interest inGlobal IQ to an arm’s-length party.
In 2006, Eugene Melnyk, Chairman of Biovail, reimbursed Biovail $420,000 for expenses incurred inconnection with the analysis of a potential investment in a company that Mr. Melnyk decided to pursuepersonally following a determination by our Board of Directors that the investment opportunity was not, andwould not in future be, of interest to Biovail.
PROPOSED TRANSACTION
On February 21, 2007, we entered into a share transfer agreement pursuant to which we have agreed to sellall or a part of our common shares of Ethypharm. Subject to certain conditions precedent being satisfied, it isanticipated that this transaction will close in April 2007. As consideration for such transfer we will receive cashin an amount to be determined at the closing date. We have agreed, upon closing, to invest a portion of the netproceeds of the sale to acquire a minority interest in the acquiring company.
77
71

MANAGEMENT’S DISCUSSION AND ANALYSIS OFRESULTS OF OPERATIONS AND FINANCIAL CONDITION (Continued)
(All dollar amounts expressed in U.S. dollars)
CRITICAL ACCOUNTING POLICIES AND ESTIMATES
Critical accounting policies and estimates are those policies and estimates that are most important andmaterial to the preparation of our consolidated financial statements, and which require management’s mostsubjective and complex judgment due to the need to select policies from among alternatives available, and tomake estimates about matters that are inherently uncertain. We base our estimates on historical experience andother factors that we believe to be reasonable under the circumstances. Under certain agreements, we rely onestimates made by our third-party licensees. On an ongoing basis, we review our estimates to ensure that theseestimates appropriately reflect changes in our business and new information as it becomes available. If historicalexperience and other factors we use to make these estimates do not reasonably reflect future activity, our resultsof operations and financial position could be materially impacted.
Our critical accounting policies and estimates relate to the following:
• Revenue recognition;
• Useful lives and impairment of intangible assets;
• Contingencies;
• Income taxes; and
• Stock-based compensation.
Revenue recognition
We recognize product sales revenue when title has transferred to the customer, provided that we have notretained any significant risks of ownership or future obligations with respect to the product sold. Revenue fromproduct sales is recognized net of provisions for estimated cash discounts, allowances, returns, rebates andchargebacks, as well as distribution fees paid to certain of our wholesale customers. We establish theseprovisions concurrently with the recognition of product sales revenue. In connection with these provisionsrelated to sales of our Wellbutrin XL�, Ultram� ER, Cardizem� LA, Tiazac� and Generic products in the U.S.,we rely on estimates made by our licensees, GSK, OMI, Kos, Forest and Teva, respectively. Revenue from salesof those out-licensed products accounted for approximately 70% of our total gross product sales in 2006,compared with 55% in each of 2005 and 2004.
We continually monitor our product sales provisions and evaluate the estimates used as additionalinformation becomes available. We make adjustments to these provisions periodically to reflect new facts andcircumstances that may indicate that historical experience may not be indicative of current and/or future results.We are required to make subjective judgments based primarily on our evaluation of current market conditionsand trade inventory levels related to our products. This evaluation may result in an increase or decrease in theexperience rate that is applied to current and future sales, or an adjustment related to past sales, or both.
78
72

MANAGEMENT’S DISCUSSION AND ANALYSIS OFRESULTS OF OPERATIONS AND FINANCIAL CONDITION (Continued)
(All dollar amounts expressed in U.S. dollars)
Continuity of product sales provisions
The following table presents the activity and ending balances for our product sales provisions for the lastthree years.
Cash Rebates and DistributionDiscounts Allowances Returns Chargebacks Fees Total
($ in 000s)
Balance at January 1, 2004 . . . . . . . . . $ 2,014 $ 450 $ 43,289 $ 21,151 $ — $ 66,904Current year provision . . . . . . . . . . . . 5,797 3,015 24,896 30,386 1,319 65,413Prior year provision . . . . . . . . . . . . . . — — 14,062 (1,479) — 12,583Payments or credits . . . . . . . . . . . . . . (7,022) (2,576) (51,826) (39,857) — (101,281)
Balance at December 31, 2004 . . . . . . 789 889 30,421 10,201 1,319 43,619
Current year provision . . . . . . . . . . . . 6,844 2,549 23,007 24,232 6,276 62,908Prior year provision . . . . . . . . . . . . . . — — 11,715 (1,766) — 9,949Payments or credits . . . . . . . . . . . . . . (7,266) (2,605) (41,938) (24,035) (2,710) (78,554)
Balance at December 31, 2005 . . . . . . 367 833 23,205 8,632 4,885 37,922
Current year provision . . . . . . . . . . . . 5,365 1,427 23,176 16,251 7,411 53,630Prior year provision . . . . . . . . . . . . . . — — (3,838) 442 (1,292) (4,688)Payments or credits . . . . . . . . . . . . . . (5,423) (1,919) (17,422) (18,583) (8,654) (52,001)
Balance at December 31, 2006 . . . . . . $ 309 $ 341 $ 25,121 $ 6,742 $ 2,350 $ 34,863
Use of information from external sources
We use information from external sources to estimate our product sales provisions. We obtain prescriptiondata for our products from IMS Health, an independent pharmaceutical market research firm. We use this datato identify sales trends based on prescription demand and to estimate inventory requirements. We obtaininventory data directly from our three major U.S. wholesalers, Cardinal Health, Inc. (‘‘Cardinal’’), McKessonCorporation (‘‘McKesson’’) and AmerisourceBergen Corporation (‘‘ABC’’), which together accounted forapproximately two-thirds of our direct product sales in the U.S. in the past three years. The inventory datareceived from these wholesalers excludes inventory held by customers to whom they sell. Third-party data withrespect to prescription demand and inventory levels are subject to the inherent limitations of estimates that relyon information from external sources, as this information may itself rely on certain estimates, and reflect otherlimitations.
The following table indicates information about the inventories of our products owned by Cardinal,McKesson and ABC at December 31, 2006 (which excludes inventories owned by regional wholesalers,warehousing chains, and indirect customers in the U.S., and inventories owned by wholesalers and retailers inCanada). Our distribution agreements with Cardinal, McKesson and ABC limit the amount of inventory they canown to between 1⁄2 and 11⁄2 months of supply of our products. The inventory data from these wholesalers isprovided to us in the aggregate rather than by specific lot number, which is the level of detail that would berequired to determine the original sale date and remaining shelf life of the inventory. However, the inventoryreports we receive from these wholesalers include data with respect to inventories on hand with less than12 months remaining shelf life. As indicated in the following table, these wholesalers owned overall less thanone-month of supply of our products at December 31, 2006, of which only $180,000 had less than 12 months
79
73

MANAGEMENT’S DISCUSSION AND ANALYSIS OFRESULTS OF OPERATIONS AND FINANCIAL CONDITION (Continued)
(All dollar amounts expressed in U.S. dollars)
remaining shelf life. Therefore, we believe the collection of lot information would provide limited additionalbenefit in estimating our product sales provisions.
At December 31, 2006 At December 31, 2005
Inventory With Inventory WithLess Than Less Than
Original Months On 12 Months Months On 12 MonthsShelf Life Total Hand Remaining Total Hand Remaining
(In Months) Inventory (In Months) Shelf Life Inventory (In Months) Shelf Life
($ in 000s)
Zovirax� . . . . . . . . . 36-48 $4,465 0.5 $ 88 $ 7,858 1.0 $ 59Cardizem� . . . . . . . . 36-48 2,404 0.5 43 5,958 1.1 48Ativan� . . . . . . . . . . 24 1,189 0.6 9 2,059 1.0 14Vasotec� and
Vaseretic� . . . . . . 24 885 0.7 39 2,182 1.1 15Isordil� . . . . . . . . . . 36-60 255 1.3 1 508 1.7 2
Total . . . . . . . . . . . . 24-60 $9,198 0.6 $180 $18,565 1.0 $138
Cash discounts and allowances
We offer cash discounts for prompt payment and allowances for volume purchases to customers. Provisionsfor cash discounts are estimated at the time of sale and recorded as direct reduction to accounts receivable andrevenue. At December 31, 2006 and 2005, reserves for cash discounts were $0.3 million and $0.4 million,respectively. Provisions for allowances are recorded in accrued liabilities. At December 31, 2006 and 2005,accrued allowances were $0.3 million and $0.8 million, respectively. We estimate provisions for cash discountsand allowances based on contractual sales terms with customers, an analysis of unpaid invoices and historicalpayment experience. Estimated cash discounts and allowances have historically been predictable and lesssubjective, due to the limited number of assumptions involved, the consistency of historical experience and thefact that we generally settle these amounts within one month of incurring the liability.
Returns
Consistent with industry practice, we generally allow customers to return product within a specified periodbefore and after its expiration date. We utilize the following information to estimate our provision for returns:
• Historical return and exchange levels;
• External data with respect to inventory levels in the wholesale distribution channel;
• External data with respect to prescription demand for our products;
• Original shelf lives of our products; and
• Estimated returns liability to be processed by year of sale based on analysis of lot information related toactual historical returns.
In determining our estimates for returns, we are required to make certain assumptions regarding the timingof the introduction of new products and the potential of these products to capture market share. In addition, wemake certain assumptions with respect to the extent and pattern of decline associated with generic competition.To make these assessments we utilize market data for similar products as analogs for our estimations. We useour best judgment to formulate these assumptions based on past experience and information available to us atthe time. We continually reassess and make the appropriate changes to our estimates and assumptions as newinformation becomes available to us.
80
74

MANAGEMENT’S DISCUSSION AND ANALYSIS OFRESULTS OF OPERATIONS AND FINANCIAL CONDITION (Continued)
(All dollar amounts expressed in U.S. dollars)
At December 31, 2006 and 2005, accrued liabilities for returns were $25.1 million and $23.2 million,respectively. In 2006, 2005 and 2004, provisions for returns related to sales made in the current year were$23.2 million, $23.0 million and $24.9 million, respectively, or 2%, 2% and 3%, respectively, of grossproduct sales.
Our estimate for returns may be impacted by a number of factors, but the principal factor relates to thelevel of inventory in the distribution channel. When we are aware of an increase in the level of inventory of ourproducts in the distribution channel, we consider the reasons for the increase to determine if the increase may betemporary or other-than-temporary. Increases in inventory levels assessed as temporary will not result in anadjustment to our provision for returns. Other-than-temporary increases in inventory levels, however, may be anindication that future product returns could be higher than originally anticipated and, accordingly, we may needto adjust our estimate for returns. Some of the factors that may be an indication that an increase in inventorylevels will be temporary include:
• Recently implemented or announced price increases for our products; and
• New product launches or expanded indications for our existing products.
Conversely, factors that may be an indication that an increase in inventory levels will beother-than-temporary include:
• Declining sales trends based on prescription demand;
• Recent regulatory approvals to extend the shelf life of our products, which could result in a period ofhigher returns related to older product with the shorter shelf life;
• Recent changes to the National Drug Codes (‘‘NDC’’) of our products, which could result in a period ofhigher returns related to product with the old NDC, as our customers generally permit only one NDC perproduct for identification and tracking within their inventory systems;
• Introduction of new product or generic competition; and
• Increasing price competition from generic competitors.
We made adjustments to reduce our provision for returns by $3.8 million in 2006, and to increase ourprovision for returns by $11.7 million and $14.1 million in 2005 and 2004, respectively. These adjustmentsgenerally related to sales made in prior years, as the shelf lives of our products are in excess of one year, andcustomers are not permitted to return product with more than six months of shelf life remaining.
The adjustment in 2006 was primarily related to lower-than-anticipated returns of Tiazac� productfollowing its genericization in Canada in January 2006. The adjustments in 2005 and 2004 were primarily relatedto the entry into distribution agreements with our three major wholesalers. As these wholesalers reduced theirinventories of our products during the last three quarters of 2004 and first quarter of 2005, we receivedhigher-than-anticipated returns, which reflected the intent on the part of these wholesalers to restock theirinventories with product with full shelf life, and to minimize inventories of those products that have lowerprescription demand. The adjustment in 2005 also included slow-moving 90-tablet bottles of Cardizem� LA, dueto lower than anticipated end-customer demand for this particular packaging size.
Rebates and chargebacks
We are subject to rebates on sales made under governmental and managed-care pricing programs. Thelargest of these rebates is associated with sales covered by Medicaid. We participate in state government-managed Medicaid programs, as well as certain other qualifying federal and state government programs wherebydiscounts and rebates are provided to participating government entities. Medicaid rebates are typically billed upto 180 days after the product is shipped, but can be as much as 270 days after the quarter in which the product is
81
75

MANAGEMENT’S DISCUSSION AND ANALYSIS OFRESULTS OF OPERATIONS AND FINANCIAL CONDITION (Continued)
(All dollar amounts expressed in U.S. dollars)
dispensed to the Medicaid participant. As a result, our Medicaid rebate provision includes an estimate ofoutstanding claims for end-customer sales that occurred but for which the related claim has not been billed, andan estimate for future claims that will be made when inventory in the distribution channel is sold through to planparticipants. Our calculation also requires other estimates, such as estimates of sales mix, to determine whichsales are subject to rebates and the amount of such rebates. Periodically, we adjust the Medicaid rebateprovision based on actual claims paid. Due to the delay in billing, adjustments to actual claims paid mayincorporate revisions of this provision for several periods.
Chargebacks relate to our contractual agreements to sell products to group purchasing organizations andother indirect customers at contractual prices that are lower than the list prices we charge wholesalers. Whenthese group purchasing organizations or other indirect customers purchase our products through wholesalers atthese reduced prices, the wholesaler charges us for the difference between the prices they paid us and the pricesat which they sold the products to the indirect customers.
In estimating our provisions for rebates and chargebacks, we consider relevant statutes with respect togovernmental pricing programs and contractual sales terms with managed-care providers and group purchasingorganizations. We estimate the amount of our product sales subject to these programs based on historicalutilization levels. Changes in the level of utilization of our products through private or public benefit plans andgroup purchasing organizations will affect the amount of rebates and chargebacks that we owe. We continuallyupdate these factors based on new contractual or statutory requirements, and significant changes in sales trendsthat may impact the percentage of our products subject to rebates or chargebacks.
At December 31, 2006 and 2005, accrued liabilities for rebates and chargebacks were $6.7 million and$8.6 million, respectively. In 2006, 2005 and 2004, provisions for rebates and chargebacks related to sales madein the current year were $16.3 million, $24.2 million and $30.4 million, respectively, or 2%, 3% and 3%,respectively, of gross product sales. The declining rebate and chargeback experience rate as a percentage ofrevenue in 2006, relative to 2005 and 2004, was due primarily to a lower overall utilization of our Zovirax� andoff-patent branded pharmaceutical products by private and public benefit plans, and a change in product mixfollowing the disposition of Cardizem� LA, Teveten and Teveten HCT to Kos in May 2005.
Our estimate for rebates and chargebacks may be impacted by a number of factors, but the principal factorrelates to the level of inventory in the distribution channel. If the level of inventory of our products in thedistribution channel increased or decreased by one-month supply, our provision for rebates and chargebackswould increase or decrease by approximately $1.1 million.
We do not process or track actual rebate payments or credits by period in which the original sale was made,as the required lot information is not provided to us. Accordingly, we generally assume that adjustments made torebate provisions relate to sales made in the prior years due to the delay in billing. However, we assume thatadjustments made to chargebacks are generally related to sales made in the current year as we settle theseamounts within a few months of original sale. The adjustments made to the rebates provision have not beensignificant in the past three years, and generally result from other-than-expected Medicaid utilization ofour products.
Intangible assets
Intangible assets are stated at cost, less accumulated amortization generally computed using thestraight-line method based on estimated useful lives ranging from seven to 20 years. We amortize intangibleassets on a systematic basis to reflect the pattern in which the economic benefits of the asset are consumed, ifthat basis can be reliably determined. Useful life is the period over which the intangible asset is expected tocontribute directly or indirectly to our future cash flows. We determine the useful lives of intangible assets basedon a number of factors such as: legal, regulatory or contractual limitations; known technological advances;anticipated demand; and the existence or absence of competition. A significant change in these factors
82
76

MANAGEMENT’S DISCUSSION AND ANALYSIS OFRESULTS OF OPERATIONS AND FINANCIAL CONDITION (Continued)
(All dollar amounts expressed in U.S. dollars)
(for example, a successful challenge of our patent rights resulting in generic competition earlier than expected)may warrant a revision of the expected remaining useful life of an intangible asset, which could have a materialimpact on our results of operations.
Intangible assets acquired through asset acquisitions or business combinations are initially recorded at fairvalue based on an allocation of the purchase price. We often engage independent valuation specialists toperform valuations of the assets acquired. We subsequently evaluate intangible assets annually for impairment,or more frequently if events or changes in circumstances indicate that the carrying amounts of these assets maynot be recoverable. Our evaluation is based on an assessment of potential indicators of impairment, such asobsolescence, plans to discontinue use or restructure, and poor financial performance compared with originalplans. Impairment exists when the carrying amount of an asset is not recoverable and its carrying amountexceeds its estimated fair value. There are several methods that can be used to determine fair value. Forintangible assets, an income approach is generally used. This approach starts with a forecast of all of theestimated future cash flows. These cash flows are then adjusted to present value by applying an appropriatediscount rate that reflects the risk factors associated with the cash flow streams. Some of the more significantestimates and assumptions inherent in the income approach include the amount and timing of the future cashflows, and the discount rate used to reflect the risks inherent in the future cash flows. A change in any of theseestimates and assumptions could produce a different fair value, which could have a material impact on ourresults of operations. In cases of an impairment review, we will re-evaluate the remaining useful life of theintangible asset and modify it, as appropriate.
Contingencies
In the normal course of business, we are subject to loss contingencies, such as claims and assessmentsarising from litigation and other legal proceedings, contractual indemnities, product and environmentalliabilities, and tax matters. We are required to accrue for such loss contingencies if it is probable that theoutcome will be unfavourable, and if the amount of the loss can be reasonably estimated. We evaluate ourexposure to loss based on the progress of each contingency, experience in similar contingencies and consultationwith internal and external legal counsel. We re-evaluate all contingencies as additional information becomesavailable. Given the uncertainties inherent in complex litigation and other contingencies, these evaluations caninvolve significant judgment about future events. The ultimate outcome of any litigation or other contingencymay be material to our results of operations, financial position and cash flows. For a discussion of our currentlegal proceedings, see note 23 to our audited consolidated financial statements.
We are self-insured for a portion of our product liability coverage. Reserves are established for all reportedbut unpaid claims and for estimates of incurred but not reported claims. Significant judgment is applied toestimate those reserves, and we engage an independent actuary to conduct an actuarial assessment of ourliability. If actual claims are in excess of these estimates, additional reserves may be required, which could have amaterial impact on our results of operations.
Income taxes
We have operations in various countries that have differing tax laws and rates. Our income tax reporting issubject to audit by both domestic and foreign tax authorities. The effective tax rate may change from year to yearbased on the mix of income among the different jurisdictions in which we operate, changes in tax laws in thesejurisdictions, changes in tax treaties between various countries in which we operate, and changes in theestimated values of deferred tax assets and liabilities.
Our provision for income taxes is based on a number of estimates and assumptions made by management.Our consolidated income tax rate is affected by the amount of income earned in our various operatingjurisdictions and the rate of taxes payable in respect of that income. We enter into many transactions andarrangements in the ordinary course of business in which the tax treatment is not entirely certain. We must
83
77

MANAGEMENT’S DISCUSSION AND ANALYSIS OFRESULTS OF OPERATIONS AND FINANCIAL CONDITION (Continued)
(All dollar amounts expressed in U.S. dollars)
therefore make estimates and judgments based on our knowledge and understanding of domestic andinternational tax rules in determining our consolidated tax provision. For example, certain countries in which weoperate could seek to tax a greater share of income than has been provided for by us. The final outcome of anyaudits by taxation authorities may differ from the estimates and assumptions we have used in determining ourconsolidated income tax provisions and accruals. This could result in a material effect on our consolidatedincome tax provision and results of operations, financial position and cash flows for the period in which suchdeterminations are made.
We have recorded a valuation allowance on deferred tax assets primarily relating to operating losses, futuretax depreciation and tax credit carryforwards. We have assumed that these deferred tax assets are more likelythan not to remain unrealized. Significant judgment is applied to determine the appropriate amount of valuationallowance to record. Changes in the amount of the valuation allowance required could materially increase ordecrease our provision for income taxes in a period.
Stock-based compensation
Effective January 1, 2006, we adopted the fair value-based method for recognizing employee stock-basedcompensation. Prior to 2006, we did not recognize stock-based compensation expense for stock options grantedto employees at fair market value. We use the Black-Scholes option-pricing model to calculate stock optionvalues, which requires certain assumptions related to the expected life of the option, future stock price volatility,risk-free interest rate, and dividend yield. The expected life of the option is based on historical exercise andforfeiture patterns. Future stock price volatility is based on historical volatility of our common shares over theexpected life of the option. The risk-free interest rate is based on the rate at the time of grant for zero-couponCanadian government bonds with a remaining term equal to the expected life of the option. Dividend yield isbased on the option’s exercise price and expected annual dividend rate at the time of grant. Changes to any ofthese assumptions, or the use of a different option-pricing model (such as the lattice model) could produce adifferent fair value for stock-based compensation expense, which could have a material impact on our results ofoperations. As we develop detailed data about our employees’ stock option exercise patterns, we will evaluatethe use of the lattice model to determine if that model might be expected to produce a better estimate offair value.
RECENT ACCOUNTING PRONOUNCEMENTS
In September 2006, the SEC issued Staff Accounting Bulletin (‘‘SAB’’) No. 108, ‘‘Considering the Effects ofPrior Year Misstatements when Quantifying Misstatements in Current Year Financial Statements’’ (‘‘SAB 108’’).SAB 108 provides guidance on how prior year uncorrected errors should be considered in quantifyingmisstatements in the current year financial statements. SAB 108 is effective for fiscal years ending afterNovember 15, 2006. Accordingly, SAB 108 was applicable to our fiscal year ended December 31, 2006. Theadoption of SAB 108 did not have any effect on our consolidated financial statements.
In September 2006, the Financial Accounting Standards Board (‘‘FASB’’) issued Statement of FinancialAccounting Standards (‘‘SFAS’’) No. 157, ‘‘Fair Value Measurements’’ (‘‘SFAS 157’’). SFAS 157 establishes aframework for measuring fair value in GAAP, clarifies the definition of fair value within that framework, andexpands disclosures about the use of fair value measurements. SFAS 157 applies to all other accountingpronouncements that require (or permit) fair value measurements, except for the measurement of share-basedpayments. SFAS 157 does not require any new fair value measurements in GAAP. SFAS 157 is effective for fiscalyears beginning after November 15, 2007. Accordingly, we are required to adopt SFAS 157 beginning January 1,2008. We are currently evaluating the effect that the adoption of SFAS 157 will have on our consolidatedfinancial statements.
In July 2006, the FASB issued FASB Interpretation No. 48, ‘‘Accounting for Uncertainty in Income Taxes —an interpretation of FASB Statement No. 109’’ (‘‘FIN 48’’). FIN 48 clarifies the accounting for income taxes by
84
78

MANAGEMENT’S DISCUSSION AND ANALYSIS OFRESULTS OF OPERATIONS AND FINANCIAL CONDITION (Continued)
(All dollar amounts expressed in U.S. dollars)
prescribing the minimum recognition threshold a tax position is required to meet before being recognized in thefinancial statements. FIN 48 also provides guidance on derecognition, measurement, classification, interest andpenalties, accounting in interim periods, disclosure and transition. FIN 48 is effective for fiscal years beginningafter December 15, 2006. Accordingly, we are required to adopt FIN 48 beginning January 1, 2007. Thecumulative effect of applying the provisions of FIN 48 will be reported as an adjustment to the opening balanceof our deficit recorded in shareholders’ equity at January 1, 2007. We are currently evaluating the effect that theadoption of FIN 48 will have on our consolidated financial statements.
MANAGEMENT’S REVISED REPORT ON DISCLOSURE CONTROLS AND PROCEDURES ANDINTERNAL CONTROL OVER FINANCIAL REPORTING
Disclosure controls and procedures
We performed an evaluation of the effectiveness of our disclosure controls and procedures that aredesigned to ensure that the material financial and non-financial information required to be disclosed in filingswith the SEC is recorded, processed, summarized, and reported in a timely manner. Based on our evaluation,our management, including the Chief Executive Officer (‘‘CEO’’) and CFO, has concluded that our disclosurecontrols and procedures (as defined in Rules 13a-15(e) and 15d-15(e) of the Securities Exchange Act of 1934) asof December 31, 2006 are not effective in connection with the restatement of our previously issued financialstatements (as described above under ‘‘Restatement’’). In addition, there can be no assurance that our disclosurecontrols and procedures will detect or uncover all failures of persons within Biovail to disclose materialinformation otherwise required to be set forth in our reports.
Internal control over financial reporting
Our management is responsible for establishing and maintaining effective internal control over financialreporting as defined in Rules 13a-15(f) and 15d-15(f) under the Securities Exchange Act of 1934. Our internalaccounting controls systems are designed to provide reasonable assurance that assets are safeguarded, thattransactions are executed in accordance with management’s authorization and are properly recorded, and thataccounting records are adequate for preparation of financial statements in accordance with GAAP and otherfinancial information.
Under the supervision and with the participation of management, including the CEO and CFO, weconducted an evaluation of the effectiveness of our internal control over financial reporting based on theframework in Internal Control — Integrated Framework issued by the Committee of Sponsoring Organizationsof the Treadway Commission. Management’s previous assessment as outlined in the Company’s Form 20-Fdated March 21, 2007 had concluded that the Company’s internal control over financial reporting was effectiveas of December 31, 2006.
Subsequent to the filing of the Company’s Form 20-F on March 21, 2007, an error was discovered in aspreadsheet used by the Company to (a) track quantities of Zovirax products that the Company may purchase atreduced supply prices from GlaxoSmithKline plc (‘‘GSK’’), and (b) calculate amortization expense on a relatedlong term asset that is being amortized to cost of goods sold. This error caused us to amend our Annual Reporton Form 20-F/A for the year ended December 31, 2006, to adjust cost of goods sold for the years endedDecember 31, 2006 and 2005 for an overstatement of amortization expense, with a corresponding adjustment toother assets and an adjustment to deficit in shareholders equity as of December 31, 2006.
As a result of this restatement, we reevaluated the effectiveness of our internal controls over financialreporting. This reevaluation was conducted in accordance with the provisions of PCAOB Auditing StandardNo. 2, which defines a restatement as a strong indicator of a material weakness. Based on the information, facts,and guidance available during our reevaluation, we concluded that the data input errors that resulted in themisstatement of amortization expense and cost of goods sold in the consolidated statements of income, and
85
79

MANAGEMENT’S DISCUSSION AND ANALYSIS OFRESULTS OF OPERATIONS AND FINANCIAL CONDITION (Continued)
(All dollar amounts expressed in U.S. dollars)
other assets in the consolidated balance sheets was a material weakness. We also concluded that the failure ofsubsequent evaluation and analysis performed by local management to detect those errors on a timely basis alsorepresented a material weakness. As a result of these material weaknesses identified, we have revised ourprevious assessment and have now concluded that our internal control over financial reporting was not effectiveas of December 31, 2006.
To address the material weaknesses identified, management is in the process of implementing measures toremediate the control deficiency in the location where the foregoing error occurred. With respect tospreadsheets, these measures include strengthening internal controls around their development and usage, andthe review and related analysis of those spreadsheets by local management; and examining the possibility ofincorporating the automation of the spreadsheet-based data into Biovail’s Enterprise Resource Planningapplication. We anticipate that these measures will be implemented by the end of the second quarter of 2007.
Management’s assessment of the effectiveness of our internal control over financial reporting as ofDecember 31, 2006 has been audited by Ernst & Young LLP, as stated in their report to the directors andshareholders of Biovail on page F-5 of our Amended Annual Report on Form 20-F/A.
Changes in internal control over financial reporting
There were no changes in our internal controls over financial reporting identified in connection with theevaluation thereof by our management, including the CEO and CFO, that have materially affected, or arereasonably likely to materially affect, our internal controls over financial reporting.
CANADIAN GAAP SUPPLEMENTAL INFORMATION
The following supplemental information is provided to summarize the material differences that would haveresulted in the MD&A had it been based on consolidated financial statements prepared in accordance withCanadian GAAP. Material differences between U.S. GAAP and Canadian GAAP related to recognition,measurement and presentation, together with a reconciliation of certain items, are explained in note 30 to ouraudited consolidated financial statements.
86
80
86 herein.

MANAGEMENT’S DISCUSSION AND ANALYSIS OFRESULTS OF OPERATIONS AND FINANCIAL CONDITION (Continued)
(All dollar amounts expressed in U.S. dollars)
Results of operations
Years Ended December 31
2006 2005 2004
($ in 000s, except per share data)As As As
Restated(1) Restated(1) Restated(1)
Income from continuing operations — U.S. GAAP . . . . . . . . . . . . . . . . . . $215,474 $257,015 $165,014Income from continuing operations — Canadian GAAP . . . . . . . . . . . . . . . 153,131 109,821 56,767
Net income — U.S. GAAP . . . . . . . . . . . . . . . . . . . . . . . . . . . . . . . . . . . . 211,626 246,440 159,799Net income — Canadian GAAP . . . . . . . . . . . . . . . . . . . . . . . . . . . . . . . . 149,283 99,246 51,552
Basic and diluted earnings per shareIncome from continuing operations — U.S. GAAP . . . . . . . . . . . . . . . . . . $ 1.35 $ 1.61 $ 1.04Income from continuing operations — Canadian GAAP . . . . . . . . . . . . . . . $ 0.96 $ 0.69 $ 0.36
Net income — U.S. GAAP . . . . . . . . . . . . . . . . . . . . . . . . . . . . . . . . . . . . $ 1.32 $ 1.54 $ 1.00Net income — Canadian GAAP . . . . . . . . . . . . . . . . . . . . . . . . . . . . . . . . $ 0.93 $ 0.62 $ 0.32
(1) See above under ‘‘Restatement’’.
In 2006, 2005 and 2004, income from continuing operations and net income under Canadian GAAP wouldhave been $62.3 million, $147.2 million and $108.2 million lower, respectively, than income from continuingoperations and net income reported under U.S. GAAP.
The principal reconciling difference that affects our results of operations under Canadian GAAP relates tothe treatment of acquired research and development assets. Under Canadian GAAP, additional amortizationexpense of $49.3 million in 2006, and $98.1 million in each of 2005 and 2004, would have been recognizedrelated to acquired research and development assets that were capitalized at the time of acquisition. In addition,under Canadian GAAP, we recorded impairment charges of $9.5 million and $45.0 million in 2006 and 2005,respectively, to write down the carrying value of acquired research and development assets associated withproduct-development projects that were discontinued. Under U.S. GAAP, acquired research and developmentassets were written off at the time of acquisition.
In 2005 and 2004, an additional reconciling difference that affected our results of operations underCanadian GAAP related to the treatment of stock-based compensation. Under Canadian GAAP, the Companyadopted the fair-value based method for recognizing stock-based compensation effective January 1, 2004,whereas, under U.S. GAAP, the Company recognized employee stock-based compensation under the intrinsicvalue-based method prior to January 1, 2006. As a result, under Canadian GAAP, the Company would haverecognized additional stock-based compensation expense of $4.4 million and $20.4 million in 2005 and 2004,respectively.
87
81

MANAGEMENT’S DISCUSSION AND ANALYSIS OFRESULTS OF OPERATIONS AND FINANCIAL CONDITION (Continued)
(All dollar amounts expressed in U.S. dollars)
Financial condition
At December 31
2006 2005
($ in 000s)As As
Restated(1) Restated(1)
Long-lived assets — U.S. GAAP . . . . . . . . . . . . . . . . . . . . . . . . . . . . . . . . . . . . . $1,072,699 $1,274,844Long-lived assets — Canadian GAAP . . . . . . . . . . . . . . . . . . . . . . . . . . . . . . . . . . 1,185,850 1,450,362Shareholders’ equity — U.S. GAAP . . . . . . . . . . . . . . . . . . . . . . . . . . . . . . . . . . . 1,302,257 1,228,364Shareholders’ equity — Canadian GAAP . . . . . . . . . . . . . . . . . . . . . . . . . . . . . . . 1,409,498 1,387,557
(1) See above under ‘‘Restatement’’.
At December 31, 2006 and 2005, long-lived assets under Canadian GAAP would have been higher by$113.2 million and $175.5 million, respectively, than long-lived assets reported under U.S. GAAP. The principalreconciling difference that affects long-lived assets under Canadian GAAP relates to the unamortized carryingvalue of capitalized acquired research and development assets. The carrying value of those assets underCanadian GAAP amounted to $112.3 million and $175.1 million at December 31, 2006 and 2005, respectively.
At December 31, 2006 and 2005, shareholders’ equity under Canadian GAAP would have been higher by$107.2 million and $159.2 million, respectively, than shareholders’ equity reported under U.S. GAAP. Theprincipal reconciling differences that affect shareholders’ equity under Canadian GAAP relate to theunamortized carrying value of capitalized acquired research and development assets, partially offset byunrealized holding gains on available-for-sale investments that are reported at cost under Canadian GAAP.Under U.S. GAAP, unrealized gains on available-for-sale investments are recorded in the accumulated othercomprehensive income component of shareholders’ equity. At December 31, 2006 and 2005, the cost ofavailable-for-sale investments under Canadian GAAP would have been lower by $5.8 million and $16.2 million,respectively, than the fair values of these investments reported under U.S. GAAP.
Cash flows
There were no material differences between our cash flows as reported under U.S. GAAP and our cashflows that would have been reported under Canadian GAAP.
88
82

REVISED REPORT OF MANAGEMENT ON FINANCIAL STATEMENTS ANDINTERNAL CONTROL OVER FINANCIAL REPORTING
Financial Statements
The Company’s management is responsible for preparing the accompanying consolidated financialstatements in conformity with United States generally accepted accounting principles (‘‘GAAP’’). In preparingthese consolidated financial statements, management selects appropriate accounting policies and uses itsjudgment and best estimates to report events and transactions as they occur. Management has determined suchamounts on a reasonable basis in order to ensure that the consolidated financial statements are presented fairly,in all material respects. Financial information included throughout this Annual Report is prepared on a basisconsistent with that of the accompanying consolidated financial statements.
Ernst & Young LLP has been engaged by the Company’s shareholders to audit the consolidated financialstatements.
The Board of Directors is responsible for ensuring that management fulfills its responsibility for financialreporting and is ultimately responsible for reviewing and approving the consolidated financial statements. TheBoard of Directors carries out this responsibility principally through its Audit Committee. The members of theAudit Committee are outside Directors. The Audit Committee considers, for review by the Board of Directorsand approval by the shareholders, the engagement or reappointment of the external auditors. Ernst &Young LLP has full and free access to the Audit Committee.
Management acknowledges its responsibility to provide financial information that is representative of theCompany’s operations, is consistent and reliable, and is relevant for the informed evaluation of the Company’sactivities.
Internal Control Over Financial Reporting
The Company’s management is responsible for establishing and maintaining effective internal control overfinancial reporting as defined in Rules 13a-15(f) and 15d-15(f) under the Securities Exchange Act of 1934. TheCompany’s internal accounting controls systems are designed to provide reasonable assurance that assets aresafeguarded, that transactions are executed in accordance with management’s authorization and are properlyrecorded, and that accounting records are adequate for preparation of financial statements in accordance withGAAP and other financial information.
Under the supervision and with the participation of management, including the Company’s Chief ExecutiveOfficer and Chief Financial Officer, the Company conducted an evaluation of the effectiveness of its internalcontrol over financial reporting based on the framework in Internal Control — Integrated Framework issued bythe Committee of Sponsoring Organizations of the Treadway Commission. Management’s previous assessmentas outlined in the Company’s Form 20-F dated March 21, 2007 had concluded that the Company’s internalcontrol over financial reporting was effective as of December 31, 2006.
Subsequent to the filing of the Company’s Form 20-F on March 21, 2007, an error was discovered in aspreadsheet used by the Company to (a) track quantities of Zovirax products that the Company may purchase atreduced supply prices from GlaxoSmithKline plc (‘‘GSK’’), and (b) calculate amortization expense on a relatedlong term asset that is being amortized to cost of goods sold. This error caused us to amend our Annual Reporton Form 20-F/A for the year ended December 31, 2006, to adjust cost of goods sold for the years endedDecember 31, 2006 and 2005 for an overstatement of amortization expense, with a corresponding adjustment toother assets and an adjustment to deficit in shareholders equity as of December 31, 2006.
F-2
83

As a result of this restatement, we reevaluated the effectiveness of our internal controls over financialreporting. This reevaluation was conducted in accordance with the provisions of PCAOB Auditing StandardNo. 2, which defines a restatement as a strong indicator of a material weakness. Based on the information, facts,and guidance available during our reevaluation, we concluded that the data input errors that resulted in themisstatement of amortization expense and cost of goods sold in the consolidated statements of income, andother assets in the consolidated balance sheets was a material weakness. We also concluded that the failure ofsubsequent evaluation and analysis performed by local management to detect those errors on a timely basis alsorepresented a material weakness. As a result of these material weaknesses identified, we have revised ourprevious assessment and have now concluded that our internal control over financial reporting was not effectiveas of December 31, 2006.
Management’s assessment of the effectiveness of the Company’s internal control over financial reporting asof December 31, 2006 has been audited by Ernst & Young LLP, as stated in their report on page F-5 herein.
/s/ DOUGLAS J. P. SQUIRES /s/ KENNETH G. HOWLINGDouglas J. P. Squires Kenneth G. HowlingChief Executive Officer Chief Financial Officer
F-3
84
86 herein.

REPORT OF INDEPENDENT REGISTERED PUBLIC ACCOUNTING FIRM
To the Board of Directors and Shareholders ofBiovail Corporation
We have audited the accompanying consolidated balance sheets of Biovail Corporation as of December 31,2006 and 2005, and the related consolidated statements of income, shareholders’ equity and cash flows for eachof the three years in the period ended December 31, 2006. Our audits also included the financial statementSchedule II listed in the Exhibit Index as Exhibit 99.1. These financial statements and schedule are theresponsibility of the Company’s management. Our responsibility is to express an opinion on these financialstatements and schedule based on our audits.
We conducted our audits in accordance with the standards of the Public Company Accounting OversightBoard (United States). Those standards require that we plan and perform the audit to obtain reasonableassurance about whether the financial statements are free of material misstatement. An audit includesexamining, on a test basis, evidence supporting the amounts and disclosures in the financial statements. An auditalso includes assessing the accounting principles used and significant estimates made by management, as well asevaluating the overall financial statement presentation. We believe that our audits provide a reasonable basis forour opinion.
In our opinion, the financial statements referred to above present fairly, in all material respects, theconsolidated financial position of Biovail Corporation at December 31, 2006 and 2005, and the consolidatedresults of its operations and its cash flows for each of the three years in the period ended December 31, 2006, inconformity with United States generally accepted accounting principles. Also, in our opinion, the relatedfinancial statement schedule, when considered in relation to the basic financial statements taken as a whole,presents fairly in all material respects the information set forth therein.
Our previous audit report dated March 19, 2007 has been withdrawn, and the consolidated balance sheetsas at December 31, 2006 and 2005 and the related consolidated statements of income, shareholders’ equity andcash flows for each of the three years ended December 31, 2006 have been restated, as described in note 3 to theconsolidated financial statements.
As discussed in note 2 to the consolidated financial statements, in 2006, Biovail Corporation changed itsmethod of accounting for share-based payments in accordance with the guidance provided in Statement ofFinancial Accounting Standards No. 123(R), ‘‘Share-Based Payment.’’
We also have audited, in accordance with the standards of the Public Company Accounting Oversight Board(United States), the effectiveness of Biovail Corporation’s internal control over financial reporting as ofDecember 31, 2006, based on criteria established in Internal Control-Integrated framework issued by theCommittee of Sponsoring Organizations of the Treadway Commission and our report dated March 19, 2007,except for the effects of the material weaknesses described in the sixth paragraph of that report, as to which thedate is May 22, 2007, expressed an unqualified opinion on management’s assessment and an adverse opinionbecause of material weaknesses on the effectiveness of internal control over financial reporting.
Toronto, Canada, /s/ ERNST & YOUNG LLPMarch 19, 2007, except for note 3, Chartered Accountantsas to which the date is May 22, 2007 Licensed Public Accountants
F-4
85
We have audited the accompanying consolidated balance sheets of Biovail Corporation as of December 31, 2006 and 2005, and the related consolidated statements of income, shareholders’ equity and cash flows for each of the three years in the period ended December 31, 2006. These financial statements are the responsibility of the Company’s management. Our responsibility is to express an opinion on these financial statements based on our audits.
REPORT OF INDEPENDENT REGISTERED PUBLIC ACCOUNTING FIRM
To the Board of Directors and Shareholders ofBiovail Corporation
We have audited the accompanying consolidated balance sheets of Biovail Corporation as of December 31,2006 and 2005, and the related consolidated statements of income, shareholders’ equity and cash flows for eachof the three years in the period ended December 31, 2006. Our audits also included the financial statementSchedule II listed in the Exhibit Index as Exhibit 99.1. These financial statements and schedule are theresponsibility of the Company’s management. Our responsibility is to express an opinion on these financialstatements and schedule based on our audits.
We conducted our audits in accordance with the standards of the Public Company Accounting OversightBoard (United States). Those standards require that we plan and perform the audit to obtain reasonableassurance about whether the financial statements are free of material misstatement. An audit includesexamining, on a test basis, evidence supporting the amounts and disclosures in the financial statements. An auditalso includes assessing the accounting principles used and significant estimates made by management, as well asevaluating the overall financial statement presentation. We believe that our audits provide a reasonable basis forour opinion.
In our opinion, the financial statements referred to above present fairly, in all material respects, theconsolidated financial position of Biovail Corporation at December 31, 2006 and 2005, and the consolidatedresults of its operations and its cash flows for each of the three years in the period ended December 31, 2006, inconformity with United States generally accepted accounting principles. Also, in our opinion, the relatedfinancial statement schedule, when considered in relation to the basic financial statements taken as a whole,presents fairly in all material respects the information set forth therein.
Our previous audit report dated March 19, 2007 has been withdrawn, and the consolidated balance sheetsas at December 31, 2006 and 2005 and the related consolidated statements of income, shareholders’ equity andcash flows for each of the three years ended December 31, 2006 have been restated, as described in note 3 to theconsolidated financial statements.
As discussed in note 2 to the consolidated financial statements, in 2006, Biovail Corporation changed itsmethod of accounting for share-based payments in accordance with the guidance provided in Statement ofFinancial Accounting Standards No. 123(R), ‘‘Share-Based Payment.’’
We also have audited, in accordance with the standards of the Public Company Accounting Oversight Board(United States), the effectiveness of Biovail Corporation’s internal control over financial reporting as ofDecember 31, 2006, based on criteria established in Internal Control-Integrated framework issued by theCommittee of Sponsoring Organizations of the Treadway Commission and our report dated March 19, 2007,except for the effects of the material weaknesses described in the sixth paragraph of that report, as to which thedate is May 22, 2007, expressed an unqualified opinion on management’s assessment and an adverse opinionbecause of material weaknesses on the effectiveness of internal control over financial reporting.
Toronto, Canada, /s/ ERNST & YOUNG LLPMarch 19, 2007, except for note 3, Chartered Accountantsas to which the date is May 22, 2007 Licensed Public Accountants
F-4

REPORT OF INDEPENDENT REGISTERED PUBLIC ACCOUNTING FIRM
To the Board of Directors and ShareholdersBiovail Corporation
We have audited management’s assessment, included in the accompanying Management’s Report onInternal Control over Financial Reporting (as revised), that Biovail Corporation did not maintain effectiveinternal control over financial reporting as of December 31, 2006, because of the effect of material weaknessesidentified in management’s assessment, based on criteria established in Internal Control — IntegratedFramework issued by the Committee of Sponsoring Organizations of the Treadway Commission (the COSOcriteria). Biovail Corporation’s management is responsible for maintaining effective internal control overfinancial reporting and for its assessment of the effectiveness of internal control over financial reporting. Ourresponsibility is to express an opinion on management’s assessment and an opinion on the effectiveness of thecompany’s internal control over financial reporting based on our audit.
We conducted our audit in accordance with the standards of the Public Company Accounting OversightBoard (United States). Those standards require that we plan and perform the audit to obtain reasonableassurance about whether effective internal control over financial reporting was maintained in all materialrespects. Our audit included obtaining an understanding of internal control over financial reporting, evaluatingmanagement’s assessment, testing and evaluating the design and operating effectiveness of internal control, andperforming such other procedures as we considered necessary in the circumstances. We believe that our auditprovides a reasonable basis for our opinion.
A company’s internal control over financial reporting is a process designed to provide reasonable assuranceregarding the reliability of financial reporting and the preparation of financial statements for external purposesin accordance with generally accepted accounting principles. A company’s internal control over financialreporting includes those policies and procedures that (1) pertain to the maintenance of records that, inreasonable detail, accurately and fairly reflect the transactions and dispositions of the assets of the company;(2) provide reasonable assurance that transactions are recorded as necessary to permit preparation of financialstatements in accordance with generally accepted accounting principles, and that receipts and expenditures ofthe company are being made only in accordance with authorizations of management and directors of thecompany; and (3) provide reasonable assurance regarding prevention or timely detection of unauthorizedacquisition, use, or disposition of the company’s assets that could have a material effect on the financialstatements.
Because of its inherent limitations, internal control over financial reporting may not prevent or detectmisstatements. Also, projections of any evaluation of effectiveness to future periods are subject to the risk thatcontrols may become inadequate because of changes in conditions, or that the degree of compliance with thepolicies or procedures may deteriorate.
In our report dated March 19, 2007, we expressed an unqualified opinion on management’s assessment thatBiovail Corporation maintained effective internal control over financial reporting and an unqualified opinion onthe effectiveness of internal control over financial reporting. As described in the following paragraph, BiovailCorporation subsequently identified a material misstatement in its 2006 annual consolidated financialstatements, which caused such annual statements to be restated. Management subsequently revised itsassessment due to the identification of the material weaknesses described in the following paragraph.Accordingly, our opinion on the effectiveness of Biovail Corporation’s internal control over financial reportingas of December 31, 2006, expressed herein, is different from that expressed in our previous report.
A material weakness is a control deficiency, or combination of control deficiencies, that results in more thana remote likelihood that a material misstatement of the annual or interim financial statements will not beprevented or detected. The following material weaknesses have been identified and included in management’sassessment. Biovail Corporation did not have appropriate controls in place to prevent the error in thepreparation of the spreadsheet that was used to calculate amortization of an asset and detect the error throughreview and analysis of the spreadsheet by local management. See note 3 to the 2006 consolidated financialstatements for a full discussion of the effects of these changes to Biovail Corporation’s consolidated financialstatements. These material weaknesses were considered in determining the nature, timing, and extent of audit
F-5
86

tests applied in our audit of the 2006 consolidated financial statements, and this report does not affect our reportdated March 19, 2007 (except for note 3, as to which the date is May 22, 2007) on those financial statements.
In our opinion, management’s revised assessment that Biovail Corporation did not maintain effectiveinternal control over financial reporting as of December 31, 2006, is fairly stated, in all material respects, basedon the COSO criteria. Also, in our opinion, because of the effect of the material weaknesses described above onthe achievement of the objectives of the control criteria, Biovail Corporation has not maintained effectiveinternal control over financial reporting as of December 31, 2006, based on the COSO criteria.
We also have audited, in accordance with the standards of the Public Company Accounting Oversight Board(United States), the accompanying consolidated balance sheets of Biovail Corporation as of December 31, 2006and 2005, and the related consolidated statements of income, shareholders’ equity, and cash flows for each ofthe three years in the period ended December 31, 2006, and our report dated March 19, 2007, except for note 3,as to which the date is May 22, 2007, expressed an unqualified opinion thereon.
Toronto, Canada, /s/ ERNST & YOUNG LLPMarch 19, 2007, except for the effects of the Chartered Accountantsmaterial weaknesses described in the sixth Licensed Public Accountantsparagraph above, as to which the date isMay 22, 2007
F-6
87
REPORT OF INDEPENDENT REGISTERED PUBLIC ACCOUNTING FIRM
To the Board of Directors and Shareholders ofBiovail Corporation
We have audited the accompanying consolidated balance sheets of Biovail Corporation as of December 31,2006 and 2005, and the related consolidated statements of income, shareholders’ equity and cash flows for eachof the three years in the period ended December 31, 2006. Our audits also included the financial statementSchedule II listed in the Exhibit Index as Exhibit 99.1. These financial statements and schedule are theresponsibility of the Company’s management. Our responsibility is to express an opinion on these financialstatements and schedule based on our audits.
We conducted our audits in accordance with the standards of the Public Company Accounting OversightBoard (United States). Those standards require that we plan and perform the audit to obtain reasonableassurance about whether the financial statements are free of material misstatement. An audit includesexamining, on a test basis, evidence supporting the amounts and disclosures in the financial statements. An auditalso includes assessing the accounting principles used and significant estimates made by management, as well asevaluating the overall financial statement presentation. We believe that our audits provide a reasonable basis forour opinion.
In our opinion, the financial statements referred to above present fairly, in all material respects, theconsolidated financial position of Biovail Corporation at December 31, 2006 and 2005, and the consolidatedresults of its operations and its cash flows for each of the three years in the period ended December 31, 2006, inconformity with United States generally accepted accounting principles. Also, in our opinion, the relatedfinancial statement schedule, when considered in relation to the basic financial statements taken as a whole,presents fairly in all material respects the information set forth therein.
Our previous audit report dated March 19, 2007 has been withdrawn, and the consolidated balance sheetsas at December 31, 2006 and 2005 and the related consolidated statements of income, shareholders’ equity andcash flows for each of the three years ended December 31, 2006 have been restated, as described in note 3 to theconsolidated financial statements.
As discussed in note 2 to the consolidated financial statements, in 2006, Biovail Corporation changed itsmethod of accounting for share-based payments in accordance with the guidance provided in Statement ofFinancial Accounting Standards No. 123(R), ‘‘Share-Based Payment.’’
We also have audited, in accordance with the standards of the Public Company Accounting Oversight Board(United States), the effectiveness of Biovail Corporation’s internal control over financial reporting as ofDecember 31, 2006, based on criteria established in Internal Control-Integrated framework issued by theCommittee of Sponsoring Organizations of the Treadway Commission and our report dated March 19, 2007,except for the effects of the material weaknesses described in the sixth paragraph of that report, as to which thedate is May 22, 2007, expressed an unqualified opinion on management’s assessment and an adverse opinionbecause of material weaknesses on the effectiveness of internal control over financial reporting.
Toronto, Canada, /s/ ERNST & YOUNG LLPMarch 19, 2007, except for note 3, Chartered Accountantsas to which the date is May 22, 2007 Licensed Public Accountants
F-4

BIOVAIL CORPORATION
CONSOLIDATED BALANCE SHEETS
In accordance with United States generally accepted accounting principles(All dollar amounts expressed in thousands of U.S. dollars)
At December 31
2006 2005
As Restated — As Restated —See Note 3 See Note 3
ASSETSCurrentCash and cash equivalents . . . . . . . . . . . . . . . . . . . . . . . . . . . . . . . . . . . . . . . . . $ 834,540 $ 445,289Marketable securities . . . . . . . . . . . . . . . . . . . . . . . . . . . . . . . . . . . . . . . . . . . . — 505Accounts receivable . . . . . . . . . . . . . . . . . . . . . . . . . . . . . . . . . . . . . . . . . . . . . 129,247 135,506Inventories . . . . . . . . . . . . . . . . . . . . . . . . . . . . . . . . . . . . . . . . . . . . . . . . . . . . 78,781 89,473Deposits and prepaid expenses . . . . . . . . . . . . . . . . . . . . . . . . . . . . . . . . . . . . . . 15,056 14,923Assets of discontinued operation held for sale . . . . . . . . . . . . . . . . . . . . . . . . . . . — 1,893
1,057,624 687,589Marketable securities . . . . . . . . . . . . . . . . . . . . . . . . . . . . . . . . . . . . . . . . . . . . 5,677 6,859Long-term investments . . . . . . . . . . . . . . . . . . . . . . . . . . . . . . . . . . . . . . . . . . . 56,442 66,421Property, plant and equipment, net . . . . . . . . . . . . . . . . . . . . . . . . . . . . . . . . . . . 211,979 199,567Intangible assets, net . . . . . . . . . . . . . . . . . . . . . . . . . . . . . . . . . . . . . . . . . . . . . 697,645 910,276Goodwill . . . . . . . . . . . . . . . . . . . . . . . . . . . . . . . . . . . . . . . . . . . . . . . . . . . . . 100,294 100,294Other assets, net . . . . . . . . . . . . . . . . . . . . . . . . . . . . . . . . . . . . . . . . . . . . . . . . 62,781 64,707Long-term assets of discontinued operation held for sale . . . . . . . . . . . . . . . . . . . — 1,107
$2,192,442 $2,036,820
LIABILITIESCurrentAccounts payable . . . . . . . . . . . . . . . . . . . . . . . . . . . . . . . . . . . . . . . . . . . . . . . $ 44,988 $ 61,453Dividends payable . . . . . . . . . . . . . . . . . . . . . . . . . . . . . . . . . . . . . . . . . . . . . . . 80,222 —Accrued liabilities . . . . . . . . . . . . . . . . . . . . . . . . . . . . . . . . . . . . . . . . . . . . . . . 115,619 88,870Accrued contract losses . . . . . . . . . . . . . . . . . . . . . . . . . . . . . . . . . . . . . . . . . . . 54,800 —Income taxes payable . . . . . . . . . . . . . . . . . . . . . . . . . . . . . . . . . . . . . . . . . . . . 41,596 37,713Deferred revenue . . . . . . . . . . . . . . . . . . . . . . . . . . . . . . . . . . . . . . . . . . . . . . . 61,916 61,160Current portion of long-term obligations . . . . . . . . . . . . . . . . . . . . . . . . . . . . . . . 11,146 24,360
410,287 273,556Deferred revenue . . . . . . . . . . . . . . . . . . . . . . . . . . . . . . . . . . . . . . . . . . . . . . . 73,621 117,119Deferred leasehold inducements . . . . . . . . . . . . . . . . . . . . . . . . . . . . . . . . . . . . . 5,632 5,273Long-term obligations . . . . . . . . . . . . . . . . . . . . . . . . . . . . . . . . . . . . . . . . . . . . 400,645 412,508
890,185 808,456SHAREHOLDERS’ EQUITYCommon shares, no par value, unlimited shares authorized, 160,444,070 and
159,587,838 issued and outstanding at December 31, 2006 and 2005, respectively . 1,476,930 1,461,077Additional paid-in capital . . . . . . . . . . . . . . . . . . . . . . . . . . . . . . . . . . . . . . . . . 14,952 377Deficit . . . . . . . . . . . . . . . . . . . . . . . . . . . . . . . . . . . . . . . . . . . . . . . . . . . . . . . (232,733) (284,075)Accumulated other comprehensive income . . . . . . . . . . . . . . . . . . . . . . . . . . . . . 43,108 50,985
1,302,257 1,228,364$2,192,442 $2,036,820
Commitments and contingencies (notes 23 and 24)On behalf of the Board:
/s/ Eugene N. Melnyk /s/ Michael R. Van EveryEUGENE N. MELNYK MICHAEL R. VAN EVERY
Chairman of the Board DirectorThe accompanying notes are an integral part of the consolidated financial statements.
F-7
88
BIOVAIL CORPORATION
CONSOLIDATED BALANCE SHEETS
In accordance with United States generally accepted accounting principles(All dollar amounts expressed in thousands of U.S. dollars)
At December 31
2006 2005
As Restated — As Restated —See Note 3 See Note 3
ASSETSCurrentCash and cash equivalents . . . . . . . . . . . . . . . . . . . . . . . . . . . . . . . . . . . . . . . . . $ 834,540 $ 445,289Marketable securities . . . . . . . . . . . . . . . . . . . . . . . . . . . . . . . . . . . . . . . . . . . . — 505Accounts receivable . . . . . . . . . . . . . . . . . . . . . . . . . . . . . . . . . . . . . . . . . . . . . 129,247 135,506Inventories . . . . . . . . . . . . . . . . . . . . . . . . . . . . . . . . . . . . . . . . . . . . . . . . . . . . 78,781 89,473Deposits and prepaid expenses . . . . . . . . . . . . . . . . . . . . . . . . . . . . . . . . . . . . . . 15,056 14,923Assets of discontinued operation held for sale . . . . . . . . . . . . . . . . . . . . . . . . . . . — 1,893
1,057,624 687,589Marketable securities . . . . . . . . . . . . . . . . . . . . . . . . . . . . . . . . . . . . . . . . . . . . 5,677 6,859Long-term investments . . . . . . . . . . . . . . . . . . . . . . . . . . . . . . . . . . . . . . . . . . . 56,442 66,421Property, plant and equipment, net . . . . . . . . . . . . . . . . . . . . . . . . . . . . . . . . . . . 211,979 199,567Intangible assets, net . . . . . . . . . . . . . . . . . . . . . . . . . . . . . . . . . . . . . . . . . . . . . 697,645 910,276Goodwill . . . . . . . . . . . . . . . . . . . . . . . . . . . . . . . . . . . . . . . . . . . . . . . . . . . . . 100,294 100,294Other assets, net . . . . . . . . . . . . . . . . . . . . . . . . . . . . . . . . . . . . . . . . . . . . . . . . 62,781 64,707Long-term assets of discontinued operation held for sale . . . . . . . . . . . . . . . . . . . — 1,107
$2,192,442 $2,036,820
LIABILITIESCurrentAccounts payable . . . . . . . . . . . . . . . . . . . . . . . . . . . . . . . . . . . . . . . . . . . . . . . $ 44,988 $ 61,453Dividends payable . . . . . . . . . . . . . . . . . . . . . . . . . . . . . . . . . . . . . . . . . . . . . . . 80,222 —Accrued liabilities . . . . . . . . . . . . . . . . . . . . . . . . . . . . . . . . . . . . . . . . . . . . . . . 115,619 88,870Accrued contract losses . . . . . . . . . . . . . . . . . . . . . . . . . . . . . . . . . . . . . . . . . . . 54,800 —Income taxes payable . . . . . . . . . . . . . . . . . . . . . . . . . . . . . . . . . . . . . . . . . . . . 41,596 37,713Deferred revenue . . . . . . . . . . . . . . . . . . . . . . . . . . . . . . . . . . . . . . . . . . . . . . . 61,916 61,160Current portion of long-term obligations . . . . . . . . . . . . . . . . . . . . . . . . . . . . . . . 11,146 24,360
410,287 273,556Deferred revenue . . . . . . . . . . . . . . . . . . . . . . . . . . . . . . . . . . . . . . . . . . . . . . . 73,621 117,119Deferred leasehold inducements . . . . . . . . . . . . . . . . . . . . . . . . . . . . . . . . . . . . . 5,632 5,273Long-term obligations . . . . . . . . . . . . . . . . . . . . . . . . . . . . . . . . . . . . . . . . . . . . 400,645 412,508
890,185 808,456SHAREHOLDERS’ EQUITYCommon shares, no par value, unlimited shares authorized, 160,444,070 and
159,587,838 issued and outstanding at December 31, 2006 and 2005, respectively . 1,476,930 1,461,077Additional paid-in capital . . . . . . . . . . . . . . . . . . . . . . . . . . . . . . . . . . . . . . . . . 14,952 377Deficit . . . . . . . . . . . . . . . . . . . . . . . . . . . . . . . . . . . . . . . . . . . . . . . . . . . . . . . (232,733) (284,075)Accumulated other comprehensive income . . . . . . . . . . . . . . . . . . . . . . . . . . . . . 43,108 50,985
1,302,257 1,228,364$2,192,442 $2,036,820
Commitments and contingencies (notes 23 and 24)On behalf of the Board:
/s/ Eugene N. Melnyk /s/ Michael R. Van EveryEUGENE N. MELNYK MICHAEL R. VAN EVERY
Chairman of the Board DirectorThe accompanying notes are an integral part of the consolidated financial statements.
F-7

BIOVAIL CORPORATION
CONSOLIDATED STATEMENTS OF INCOME
In accordance with United States generally accepted accounting principles(All dollar amounts expressed in thousands of U.S. dollars, except per share data)
Years Ended December 31
2006 2005 2004
As Restated — As Restated — As Restated —See Note 3 See Note 3 See Note 3
REVENUEProduct sales . . . . . . . . . . . . . . . . . . . . . . . . . . . . . . . . . . . . . . $1,021,278 $887,074 $837,102Research and development . . . . . . . . . . . . . . . . . . . . . . . . . . . . 21,593 27,949 19,279Royalty and other . . . . . . . . . . . . . . . . . . . . . . . . . . . . . . . . . . 24,851 23,320 22,775
1,067,722 938,343 879,156
EXPENSESCost of goods sold . . . . . . . . . . . . . . . . . . . . . . . . . . . . . . . . . . 211,152 201,330 221,935Research and development . . . . . . . . . . . . . . . . . . . . . . . . . . . . 95,479 88,437 68,382Selling, general and administrative . . . . . . . . . . . . . . . . . . . . . . 238,441 227,394 253,531Amortization . . . . . . . . . . . . . . . . . . . . . . . . . . . . . . . . . . . . . . 56,457 62,260 64,704Asset impairments, net of gain on disposal . . . . . . . . . . . . . . . . 143,000 29,230 40,685Restructuring costs . . . . . . . . . . . . . . . . . . . . . . . . . . . . . . . . . . 15,126 19,810 —Contract losses . . . . . . . . . . . . . . . . . . . . . . . . . . . . . . . . . . . . 54,800 — —Litigation settlements . . . . . . . . . . . . . . . . . . . . . . . . . . . . . . . . 14,400 — —Acquired research and development . . . . . . . . . . . . . . . . . . . . . — — 8,640
828,855 628,461 657,877
Operating income . . . . . . . . . . . . . . . . . . . . . . . . . . . . . . . . . . 238,867 309,882 221,279Interest income . . . . . . . . . . . . . . . . . . . . . . . . . . . . . . . . . . . . 29,199 7,175 1,034Interest expense . . . . . . . . . . . . . . . . . . . . . . . . . . . . . . . . . . . . (35,203) (37,126) (40,104)Foreign exchange gain (loss) . . . . . . . . . . . . . . . . . . . . . . . . . . . (2,360) 794 (1,759)Equity loss and other . . . . . . . . . . . . . . . . . . . . . . . . . . . . . . . . (529) (1,160) (6,486)
Income from continuing operations before provision forincome taxes . . . . . . . . . . . . . . . . . . . . . . . . . . . . . . . . . . . . 229,974 279,565 173,964
Provision for income taxes . . . . . . . . . . . . . . . . . . . . . . . . . . . . 14,500 22,550 8,950
Income from continuing operations . . . . . . . . . . . . . . . . . . . . . . 215,474 257,015 165,014Loss from discontinued operation . . . . . . . . . . . . . . . . . . . . . . . (3,848) (10,575) (5,215)
Net income . . . . . . . . . . . . . . . . . . . . . . . . . . . . . . . . . . . . . . . 211,626 246,440 159,799
Basic and diluted earnings (loss) per shareIncome from continuing operations . . . . . . . . . . . . . . . . . . . . . . 1.35 1.61 1.04Loss from discontinued operation . . . . . . . . . . . . . . . . . . . . . . . (0.03) (0.07) (0.04)
Net income . . . . . . . . . . . . . . . . . . . . . . . . . . . . . . . . . . . . . . . 1.32 1.54 1.00
Weighted average number of common shares outstanding (000s)Basic . . . . . . . . . . . . . . . . . . . . . . . . . . . . . . . . . . . . . . . . . . . . 160,060 159,433 159,115Diluted . . . . . . . . . . . . . . . . . . . . . . . . . . . . . . . . . . . . . . . . . . 160,078 159,681 159,258
The accompanying notes are an integral part of the consolidated financial statement.
F-8
89

BIOVAIL CORPORATION
CONSOLIDATED STATEMENTS OF SHAREHOLDERS’ EQUITY
In accordance with United States generally accepted accounting principles(All dollar amounts expressed in thousands of U.S. dollars)
AccumulatedCommon Shares Additional OtherShares Paid-in Comprehensive(000s) Amount Capital Deficit Income Total
As Restated — As Restated — As Restated —See Note 3 See Note 3 See Note 3
Balance, January 1, 2004 . . . . . . . . . . . . . . . . . . . . . . . . $158,797 $1,448,353 $ 2,290 $(610,535) $41,487 $ 881,595Issued on the exercise of stock options . . . . . . . . . . . . . . . . 561 8,279 (700) — — 7,579Issued under Employee Stock Purchase Plan . . . . . . . . . . . . 25 433 — — — 433Stock-based compensation . . . . . . . . . . . . . . . . . . . . . . . — — (140) — — (140)
159,383 1,457,065 1,450 (610,535) 41,487 889,467
Comprehensive incomeNet income . . . . . . . . . . . . . . . . . . . . . . . . . . . . . . . . — — — 159,799 — 159,799Other comprehensive income . . . . . . . . . . . . . . . . . . . . . — — — — 4,647 4,647
Total comprehensive income . . . . . . . . . . . . . . . . . . . . . . 164,446
Balance, December 31, 2004 . . . . . . . . . . . . . . . . . . . . . . 159,383 1,457,065 1,450 (450,736) 46,134 1,053,913
Issued on the exercise of stock options . . . . . . . . . . . . . . . . 187 3,740 (1,022) — — 2,718Issued under Employee Stock Purchase Plan . . . . . . . . . . . . 18 272 — — — 272Stock-based compensation . . . . . . . . . . . . . . . . . . . . . . . — — (51) — — (51)Dividends declared . . . . . . . . . . . . . . . . . . . . . . . . . . . . — — — (79,779) — (79,779)
159,588 1,461,077 377 (530,515) 46,134 977,073
Comprehensive incomeNet income . . . . . . . . . . . . . . . . . . . . . . . . . . . . . . . . — — — 246,440 — 246,440Other comprehensive income . . . . . . . . . . . . . . . . . . . . . — — — — 4,851 4,851
Total comprehensive income . . . . . . . . . . . . . . . . . . . . . . 251,291
Balance, December 31, 2005 . . . . . . . . . . . . . . . . . . . . . . 159,588 1,461,077 377 (284,075) 50,985 1,228,364
Issued on the exercise of stock options . . . . . . . . . . . . . . . . 844 15,659 (219) — — 15,440Issued under Employee Stock Purchase Plan . . . . . . . . . . . . 12 194 — — — 194Stock-based compensation . . . . . . . . . . . . . . . . . . . . . . . — — 14,794 — — 14,794Dividends declared . . . . . . . . . . . . . . . . . . . . . . . . . . . . — — — (160,284) — (160,284)
160,444 1,476,930 14,952 (444,359) 50,985 1,098,508
Comprehensive incomeNet income . . . . . . . . . . . . . . . . . . . . . . . . . . . . . . . . — — — 211,626 — 211,626Other comprehensive loss . . . . . . . . . . . . . . . . . . . . . . . — — — — (7,877) (7,877)
Total comprehensive income . . . . . . . . . . . . . . . . . . . . . . 203,749
Balance, December 31, 2006 . . . . . . . . . . . . . . . . . . . . . . $160,444 $1,476,930 $14,952 $(232,733) $43,108 $1,302,257
The accompanying notes are an integral part of the consolidated financial statements.
F-9
90

BIOVAIL CORPORATIONCONSOLIDATED STATEMENTS OF CASH FLOWS
In accordance with United States generally accepted accounting principles(All dollar amounts expressed in thousands of U.S. dollars)
Years Ended December 31
2006 2005 2004
As Restated — As Restated — As Restated —See Note 3 See Note 3 See Note 3
CASH FLOWS FROM OPERATING ACTIVITIESNet income . . . . . . . . . . . . . . . . . . . . . . . . . . . . . . . . . . . . . . . . . . $211,626 $ 246,440 $ 159,799Adjustments to reconcile net income to cash provided by continuing
operating activitiesDepreciation and amortization . . . . . . . . . . . . . . . . . . . . . . . . . . . . . 92,150 96,641 86,137Amortization and write-down of deferred financing costs . . . . . . . . . . . 2,300 3,445 4,322Amortization and write-down of discounts on long-term obligations . . . 1,291 2,420 3,218Stock-based compensation . . . . . . . . . . . . . . . . . . . . . . . . . . . . . . . . 14,794 — —Asset impairments . . . . . . . . . . . . . . . . . . . . . . . . . . . . . . . . . . . . . 151,140 29,230 42,156Gain on disposal of intangible assets . . . . . . . . . . . . . . . . . . . . . . . . (4,000) — (1,471)Accrued contract losses . . . . . . . . . . . . . . . . . . . . . . . . . . . . . . . . . 54,800 — —Equity loss . . . . . . . . . . . . . . . . . . . . . . . . . . . . . . . . . . . . . . . . . . 529 1,160 4,179Loss from discontinued operation . . . . . . . . . . . . . . . . . . . . . . . . . . 3,848 10,575 5,215Receipt of leasehold inducements . . . . . . . . . . . . . . . . . . . . . . . . . . . 835 805 5,232Acquired research and development . . . . . . . . . . . . . . . . . . . . . . . . . — — 8,640Other . . . . . . . . . . . . . . . . . . . . . . . . . . . . . . . . . . . . . . . . . . . . . . 1,248 (3,274) 2,883Changes in operating assets and liabilities:
Accounts receivable . . . . . . . . . . . . . . . . . . . . . . . . . . . . . . . . . . 4,688 12,775 28,413Inventories . . . . . . . . . . . . . . . . . . . . . . . . . . . . . . . . . . . . . . . . 10,906 16,624 (26,466)Deposits and prepaid expenses . . . . . . . . . . . . . . . . . . . . . . . . . . . (311) 1,101 (539)Accounts payable . . . . . . . . . . . . . . . . . . . . . . . . . . . . . . . . . . . . (12,999) 17,027 (25,240)Accrued liabilities . . . . . . . . . . . . . . . . . . . . . . . . . . . . . . . . . . . . 28,094 5,605 (21,645)Income taxes payable . . . . . . . . . . . . . . . . . . . . . . . . . . . . . . . . . 3,897 13,343 428Deferred revenue . . . . . . . . . . . . . . . . . . . . . . . . . . . . . . . . . . . . (42,319) 47,962 4,305
Net cash provided by continuing operating activities . . . . . . . . . . . . . . 522,517 501,879 279,566CASH FLOWS FROM INVESTING ACTIVITIESAdditions to property, plant and equipment, net . . . . . . . . . . . . . . . . . (44,802) (37,807) (28,024)Proceeds from sales and maturities of marketable securities . . . . . . . . . 4,854 6,296 —Proceeds on disposal of intangible assets, net of withholding tax . . . . . . 4,000 98,127 3,000Purchases of marketable securities . . . . . . . . . . . . . . . . . . . . . . . . . . (3,196) (8,791) (5,038)Acquisitions of long-term investments . . . . . . . . . . . . . . . . . . . . . . . . (1,303) — (2,877)Acquisitions of intangible assets . . . . . . . . . . . . . . . . . . . . . . . . . . . . — (26,000) —Acquisition of business, net of cash acquired . . . . . . . . . . . . . . . . . . . — — (9,319)Net cash provided by (used in) continuing investing activities . . . . . . . . (40,447) 31,825 (42,258)CASH FLOWS FROM FINANCING ACTIVITIESDividends paid . . . . . . . . . . . . . . . . . . . . . . . . . . . . . . . . . . . . . . . (80,062) (79,779) —Repayments of other long-term obligations . . . . . . . . . . . . . . . . . . . . (25,455) (39,587) (66,288)Issuance of common shares . . . . . . . . . . . . . . . . . . . . . . . . . . . . . . . 15,634 2,990 8,012Financing costs paid . . . . . . . . . . . . . . . . . . . . . . . . . . . . . . . . . . . . (1,275) (1,300) (2,550)Repurchase of Senior Subordinated Notes . . . . . . . . . . . . . . . . . . . . . (1,098) — —Proceeds (payment) on termination of interest rate swaps . . . . . . . . . . — (1,419) 6,300Repayments under credit facility . . . . . . . . . . . . . . . . . . . . . . . . . . . — — (280,000)Net cash used in continuing financing activities . . . . . . . . . . . . . . . . . (92,256) (119,095) (334,526)CASH FLOWS FROM DISCONTINUED OPERATIONNet cash used in operating activities . . . . . . . . . . . . . . . . . . . . . . . . . (558) (3,770) (2,476)Net cash used in investing activities . . . . . . . . . . . . . . . . . . . . . . . . . — (47) (5)Net cash used in discontinued operation . . . . . . . . . . . . . . . . . . . . . . (558) (3,817) (2,481)Effect of exchange rate changes on cash and cash equivalents . . . . . . . (5) 173 762Net increase (decrease) in cash and cash equivalents . . . . . . . . . . . . . . 389,251 410,965 (98,937)Cash and cash equivalents, beginning of year . . . . . . . . . . . . . . . . . . . 445,289 34,324 133,261Cash and cash equivalents, end of year . . . . . . . . . . . . . . . . . . . . . . . $834,540 $ 445,289 $ 34,324
The accompanying notes are an integral part of the consolidated financial statements.
F-10
91

BIOVAIL CORPORATION
NOTES TO CONSOLIDATED FINANCIAL STATEMENTS
In accordance with United States generally accepted accounting principles(All tabular dollar amounts expressed in thousands of U.S. dollars, except per share data)
December 31, 2006
1. DESCRIPTION OF BUSINESS
Biovail Corporation (‘‘Biovail’’ or the ‘‘Company’’) was continued under the Canadian Business Corporations Act on June 29, 2005. TheCompany is engaged in the formulation, clinical testing, registration, manufacture, and commercialization of pharmaceutical products.
2. SIGNIFICANT ACCOUNTING POLICIES
Basis of presentation
The consolidated financial statements have been prepared by the Company in United States (‘‘U.S.’’) dollars and in accordance withU.S. generally accepted accounting principles (‘‘U.S. GAAP’’), applied on a consistent basis. These policies are consistent withaccounting policies generally accepted in Canada (‘‘Canadian GAAP’’) in all material respects except as described in note 30.
Principles of consolidation
The consolidated financial statements include the accounts of the Company and those of its subsidiaries. All intercompany transactionsand balances have been eliminated.
Use of estimates
In preparing the Company’s consolidated financial statements, management is required to make estimates and assumptions that affectthe reported amounts of assets and liabilities, the disclosure of contingent assets and liabilities at the date of the consolidated financialstatements and the reported amounts of revenue and expenses during the reporting periods. Under certain license agreements,management relies on estimates and assumptions made by the Company’s third-party licensees. Significant estimates made bymanagement include allowances for inventories; provisions for product returns, rebates and chargebacks; useful lives of long-livedassets; expected future cash flows used in evaluating long-lived assets and investments for impairment; provisions for loss contingencies;provisions for income taxes and realizability of deferred tax assets; and the allocation of the purchase price of acquired assets andbusinesses. On an ongoing basis, management reviews its estimates to ensure that these estimates appropriately reflect changes in theCompany’s business and new information as it becomes available. If historical experience and other factors used by management tomake these estimates do not reasonably reflect future activity, the Company’s consolidated financial statements could be materiallyimpacted.
Fair value of financial instruments
Fair value of a financial instrument is defined as the amount at which the instrument could be exchanged in a current transactionbetween willing parties. The estimated fair values of cash and cash equivalents, accounts receivable, accounts payable and accruedliabilities approximate their carrying values due to their short maturity periods. The fair values of marketable securities, long-terminvestments, long-term obligations, and derivative financial instruments are based on quoted market prices, if available, or estimateddiscounted future cash flows.
Cash and cash equivalents
Cash and cash equivalents include certificates of deposit, treasury bills, and investment-grade commercial paper with maturities of90 days or less when purchased.
Marketable securities
Marketable securities are classified as being available-for-sale. These securities are reported at fair value with all unrealized gains andlosses recognized in comprehensive income or loss. Realized gains and losses on the sale of these securities are recognized in netincome. The cost of investments sold is determined using the specific identification method. The amortization of acquisition premiumsor discounts is recorded as a deduction from or addition to interest income earned on these securities.
Concentrations of credit risk
Financial instruments that potentially subject the Company to significant concentrations of credit risk consist primarily of cashequivalents, marketable securities, and accounts receivable.
F-11
92

BIOVAIL CORPORATION
NOTES TO CONSOLIDATED FINANCIAL STATEMENTS (Continued)
In accordance with United States generally accepted accounting principles(All tabular dollar amounts expressed in thousands of U.S. dollars, except per share data)
December 31, 2006
2. SIGNIFICANT ACCOUNTING POLICIES (Continued)
The Company invests its excess cash in high quality, liquid money market instruments with varying maturities, but typically less than90 days. The Company maintains its cash and cash equivalents with major financial institutions. The Company has not experienced anysignificant losses on its cash or cash equivalents.
The Company’s marketable securities portfolio comprises investment-grade government or corporate fixed income obligations with amaximum term to maturity of three years. No single issuer comprises more than 20% of the portfolio.
A significant portion of the Company’s product sales is made to third-party licensees, as well as major drug wholesalers in the U.S. andCanada. The Company’s three largest customer balances accounted for 59% and 57% of trade receivables at December 31, 2006 and2005, respectively. The Company performs periodic credit evaluations of customers and generally does not require collateral. Anallowance for doubtful accounts is maintained for potential credit losses based on the aging of accounts receivable, historical bad debtsexperience, and changes in customer payment patterns. Accounts receivable balances are written off against the allowance when it isprobable that the receivable will not be collected. The Company has not experienced any significant losses from uncollectible accounts.
Inventories
Inventories comprise raw materials, work in process and finished goods, which are valued at the lower of cost or market, on a first-in,first-out basis. Cost for work in process and finished goods inventories includes materials, direct labour, and an allocation of overheads.Market for raw materials is replacement cost, and for work in process and finished goods is net realizable value. Allowances aremaintained for slow-moving inventories based on the remaining shelf life of, and estimated time required to sell, such inventories.Obsolete inventory is written off against the allowance. Rejected product is written off directly to cost of goods sold.
Effective January 1, 2006, the Company adopted Financial Accounting Standards Board (‘‘FASB’’) Statement of Financial AccountingStandards (‘‘SFAS’’) No. 151, ‘‘Inventory Costs — An Amendment of ARB No. 43, Chapter 4’’ (‘‘SFAS 151’’). SFAS 151 requires thatitems such as idle facility expense, excessive spoilage, double freight, and rehandling costs be excluded from the cost of inventory andexpensed as incurred. Additionally, SFAS 151 requires that the allocation of fixed overheads be based on the normal capacity of theproduction facilities. The adoption of SFAS 151 did not have a material effect on the Company’s consolidated financial statements.
Long-term investments
Marketable investments are classified as being available-for-sale. These investments are reported at fair value with all unrealized gainsand temporary unrealized losses recognized in comprehensive income or loss. Unrealized losses on these investments that areconsidered to be other-than-temporary are recognized in net income.
Non-marketable investments are accounted for using the cost method. Declines in the fair value of these investments below their costbases that are considered to be other-than-temporary are recognized in net income.
An investment over which the Company has the ability to exercise significant influence is accounted for using the equity method. TheCompany’s share of the losses of the investee is recognized in net income. The Company provides for its cumulative share of thoselosses in excess of its investment if it has committed to provide additional capital contributions to the investee.
On an ongoing basis, the Company evaluates its long-term investments to determine if a decline in fair value is other-than-temporary.Factors that the Company considers include general market conditions, the duration and extent to which the fair value of an investmentis below its cost basis, and the Company’s ability and intent to hold the investment.
Property, plant and equipment
Property, plant and equipment are reported at cost, less accumulated depreciation. Costs incurred on assets under construction arecapitalized as construction in progress. Cost includes interest incurred during the construction period. Depreciation is calculated usingthe straight-line method, commencing when the assets become available for productive use, based on the following estimateduseful lives:
Buildings . . . . . . . . . . . . . . . . . . . . . . . . . . . . . . . . . . . 25 yearsMachinery and equipment . . . . . . . . . . . . . . . . . . . . . . . . 5-10 yearsOther equipment . . . . . . . . . . . . . . . . . . . . . . . . . . . . . . 3-10 yearsLeasehold improvements . . . . . . . . . . . . . . . . . . . . . . . . . Lesser of term of lease or 10 years
F-12
93

BIOVAIL CORPORATION
NOTES TO CONSOLIDATED FINANCIAL STATEMENTS (Continued)
In accordance with United States generally accepted accounting principles(All tabular dollar amounts expressed in thousands of U.S. dollars, except per share data)
December 31, 2006
2. SIGNIFICANT ACCOUNTING POLICIES (Continued)
Intangible assets
Intangible assets are reported at cost, less accumulated amortization. Intangible assets acquired through asset acquisitions or businesscombinations are initially recognized at fair value based on an allocation of the purchase price. Intangible assets with finite lives areamortized over their estimated useful lives. Amortization is calculated using the straight-line method based on the following estimateduseful lives:
Trademarks . . . . . . . . . . . . . . . . . . . . . . . . . . . . . . . . . . 20 yearsProduct rights . . . . . . . . . . . . . . . . . . . . . . . . . . . . . . . . 7-20 yearsTechnology . . . . . . . . . . . . . . . . . . . . . . . . . . . . . . . . . . 15 years
The Company does not have any indefinite-lived intangible assets.
Impairment of long-lived assets
The Company tests long-lived assets (which include property, plant and equipment, and intangible and other assets) for impairmentwhenever events or changes in circumstances indicate that the carrying amounts of these assets may not be recoverable. Indicators ofpotential impairment include damage or obsolescence; plans to discontinue use or restructure; and poor financial performancecompared with original plans. If indicators of impairment are present, a long-lived asset is tested for recoverability by comparing thecarrying amount of the asset to the related estimated undiscounted future cash flows expected to be derived from the asset. If theexpected cash flows are less than the carrying amount of a long-lived asset, then the long-lived asset is considered to be impaired andthe carrying amount of the asset is written down to its fair value, based on the related estimated discounted future cash flows.
Goodwill
Goodwill represents the excess of the purchase price of acquired businesses over the estimated fair value of the identifiable net assetsacquired. Goodwill is not amortized but is tested for impairment, at least annually, at the reporting unit level. A reporting unit is thesame as, or one level below, an operating segment. The Company currently has one operating segment and one reporting unit. TheCompany uses its market capitalization as the measurement basis for the estimated fair value of its reporting unit. The Company testsgoodwill for impairment by comparing its market capitalization to the carrying value of its consolidated net assets. On that basis, therewas no indication of goodwill impairment at December 31, 2006 or 2005.
Deferred financing costs
Deferred financing costs are reported at cost, less accumulated amortization and are recorded in other assets. Amortization iscalculated using the straight-line method over the term of the related long-term obligations. Amortization expense related to deferredfinancing costs is included in interest expense.
Derivative financial instruments
From time to time, the Company utilizes derivative financial instruments to manage its exposure to interest rate risks. The Companydoes not utilize derivative financial instruments for trading or speculative purposes. The Company accounts for derivative financialinstruments as either assets or liabilities at fair value. For a derivative financial instrument that is designated and qualifies as a highlyeffective fair value hedge, the derivative financial instrument is marked-to-market with the gain or loss on the derivative financialinstrument and the respective offsetting loss or gain on the underlying hedged item recognized in net income. Net receipts or paymentsrelating to the derivative financial instruments are recorded as an adjustment to interest expense.
Deferred leasehold inducements
Leasehold inducements comprise free rent and leasehold improvement incentives. Leasehold inducements are deferred and amortizedto reduce rental expense on a straight-line basis over the term of the related lease.
Foreign currency translation
The financial statements of the Company’s operations having a functional currency other than U.S. dollars are translated intoU.S. dollars at the rate of exchange prevailing at the balance sheet date for asset and liability accounts and at the average rate of
F-13
94
BIOVAIL CORPORATION
NOTES TO CONSOLIDATED FINANCIAL STATEMENTS (Continued)
In accordance with United States generally accepted accounting principles(All tabular dollar amounts expressed in thousands of U.S. dollars, except per share data)
December 31, 2006
2. SIGNIFICANT ACCOUNTING POLICIES (Continued)
exchange for the reporting period for revenue and expense accounts. The cumulative foreign currency translation adjustment isrecorded as a component of accumulated other comprehensive income in shareholders’ equity.
The functional currency of the Company’s Irish subsidiary group is the U.S. dollar. Non-monetary balance sheet and related incomestatement accounts are remeasured into U.S. dollars using historical exchange rates. Remeasurement gains and losses are recognized innet income.
Foreign currency exchange gains and losses on transactions occurring in a currency other than an operation’s functional currency arerecognized in net income.
Revenue recognition
Revenue is deemed to be realizable and earned when persuasive evidence of an arrangement exists, delivery has occurred or serviceshave been rendered, the Company’s price to the customer is fixed or determinable, and collectibility is reasonably assured. EffectiveJanuary 1, 2000, the Company adopted the provisions of the U.S. Securities and Exchange Commission (‘‘SEC’’) Staff AccountingBulletin (‘‘SAB’’) No. 101, ‘‘Revenue Recognition in Financial Statements’’ (‘‘SAB 101’’), as amended by SAB No. 104 ‘‘RevenueRecognition’’. Total revenue in each of 2006, 2005 and 2004 included $3,400,000 of amortization of revenue deferred upon the adoptionof SAB 101.
Management evaluates revenue arrangements with multiple deliverables to determine whether the deliverables represent one or moreunits of accounting. A delivered item is considered a separate unit of accounting if the following separation criteria are met: thedelivered item has standalone value to the customer; the fair value of any undelivered items can be reliably determined; and the deliveryof undelivered items is probable and substantially in the Company’s control. The relevant revenue recognition accounting policy isapplied to each separate unit of accounting.
Product sales
Product sales revenue is recognized when title has transferred to the customer and the customer has assumed the risks and rewards ofownership. Amounts received from customers as prepayments for products to be shipped in the future are reported as deferred revenue.
Revenue from product sales is recognized net of provisions for estimated discounts and allowances, returns, rebates and chargebacks, aswell as distribution fees paid to certain of the Company’s wholesale customers in the U.S. In connection with those provisions related tosales of products manufactured by the Company for distribution by third-party licensees, the Company relies on estimates andassumptions made by those licensees. The Company offers discounts for prompt payment and other incentive allowances to customers.Provisions for discounts and allowances are estimated based on contractual sales terms with customers and historical paymentexperience. The Company allows customers to return product within a specified period of time before and after its expiration date.Provisions for returns are estimated based on historical return and exchange levels, and third-party data with respect to prescriptiondemand for the Company’s products and inventory levels of the Company’s products in the wholesale distribution channel. TheCompany is subject to rebates on sales made under governmental and managed care pricing programs, and chargebacks on sales madeto group purchasing organizations. Provisions for rebates and chargebacks are estimated based on historical experience, relevantstatutes with respect to governmental pricing programs, and contractual sales terms with managed care providers and group purchasingorganizations.
Research and development
Research and development revenue attributable to the performance of contract services is recognized as the services are performed,using the percentage-of-completion method. Performance is measured based on units-of-work performed relative to total units-of-workcontracted. Costs and profit margin related to these services that are in excess of amounts billed are recorded in accounts receivable,and amounts billed related to these services that are in excess of costs and profit margin are recorded in deferred revenue.
Non-refundable, up-front fees for access to the Company’s proprietary technology in connection with certain research and developmentcollaborations are deferred and recognized as revenue on a systematic basis over the term of the related collaboration. Contingentrevenue in connection with those collaborations attributable to the achievement of regulatory or developmental milestones isrecognized only on the achievement of the applicable milestone.
F-14
95

BIOVAIL CORPORATION
NOTES TO CONSOLIDATED FINANCIAL STATEMENTS (Continued)
In accordance with United States generally accepted accounting principles(All tabular dollar amounts expressed in thousands of U.S. dollars, except per share data)
December 31, 2006
2. SIGNIFICANT ACCOUNTING POLICIES (Continued)
Royalty
Royalty revenue is recognized based on the terms of the specific licensing contracts, and when the Company has no future obligationswith respect to the royalty fee. Royalty revenue is recognized net of amounts payable to sublicensees where the Company is simplyacting as an agent for the sublicensee.
Other
Co-promotion revenue is recognized based on the terms of the specific co-promotion contracts, and is generally determined based on apercentage of the net sales of the co-promoted products. Sales and marketing costs related to co-promotion revenue are recorded inselling, general and administrative expenses. The Company earned co-promotion revenue of $4,311,000 in 2006, but did not earn anyco-promotion revenue in 2005 or 2004.
Licensing revenue is deferred and recognized on a systematic basis over the licensing period.
Shipping and handling costs
Shipping and handling costs are included in cost of goods sold. The Company generally does not charge customers for shipping andhandling costs.
Research and development expenses
Costs related to internal research and development programs are expensed as incurred. Under certain research and developmentagreements with third parties, the Company may be required to make payments that are contingent on the achievement of specificdevelopmental, regulatory and/or commercial milestones. Milestone payments made to third parties are expensed as incurred prior tothe receipt of regulatory approval of the product under development. Milestone payments made to third parties after regulatoryapproval is received are capitalized and amortized over the estimated useful life of the approved product.
Costs associated with providing contract research services to third parties were $17,684,000, $19,017,000 and $12,513,000, in 2006, 2005and 2004, respectively. These costs are included in research and development expenses.
Acquired research and development expense
The costs of assets that are purchased through asset acquisitions or business combinations for a particular research and developmentproject are expensed as acquired research and development at the time of acquisition. The amount allocated to acquired research anddevelopment is determined by identifying those specific in-process research and development projects that the Company intends tocontinue, which have not reached technological feasibility at the date of acquisition and have no alternative future use.
The efforts required to develop the acquired research and development into commercially viable products may include the completionof the development stages of these projects, clinical-trial testing, regulatory approval, and commercialization. The principal risksrelating to these projects may include the outcomes of the formulation development, clinical studies, and regulatory filings. Sincepharmaceutical products cannot be marketed without regulatory approvals, the Company will not receive any benefits unless regulatoryapproval is obtained. The completion of these projects may require significant amounts of future time and effort, as well as additionaldevelopment costs, which may be incurred by the Company. Consequently, there is significant technological and regulatory approvalrisk associated with these projects at the date of acquisition.
The research being undertaken on these projects relates specifically to developing novel formulations of the associated active drugcompounds. Consequently, the Company does not foresee any alternative future benefit from the acquired research and developmentother than specifically related to these projects.
The fair value of acquired research and development is determined using an income approach on a project-by-project basis. Theestimated future net cash flows related to these projects include the costs to develop these projects into commercially viable products,and the projected revenues to be earned upon commercialization of these projects when complete. The discount rates used to presentvalue the estimated future net cash flows related to each of these projects are determined based on the relative risk of achieving each ofthese project’s net cash flows. The discount rates reflect the project’s stage of completion and other risk factors, which include thenature and complexity of the product, the projected costs to complete, market competition, and the estimated useful life of the product.
F-15
96

BIOVAIL CORPORATION
NOTES TO CONSOLIDATED FINANCIAL STATEMENTS (Continued)
In accordance with United States generally accepted accounting principles(All tabular dollar amounts expressed in thousands of U.S. dollars, except per share data)
December 31, 2006
2. SIGNIFICANT ACCOUNTING POLICIES (Continued)
Litigation expenses
The Company is subject to litigation and other legal proceedings in the ordinary course of business. Legal fees and other expensesrelated to those proceedings are expensed as incurred and included in selling, general and administrative expenses.
Advertising costs
Advertising costs comprise product samples, print media, and promotional materials. Advertising costs related to new product launchesare expensed on the first showing of the advertisement. The Company did not have any deferred advertising costs at December 31, 2006or 2005.
Advertising costs expensed in 2006, 2005 and 2004 were $19,828,000, $17,507,000 and $29,040,000, respectively. These costs are includedin selling, general and administrative expenses.
Stock-based compensation
Prior to January 1, 2006, the Company recognized employee stock-based compensation under the intrinsic value-based method ofAccounting Principles Board (‘‘APB’’) Opinion No. 25, ‘‘Accounting for Stock Issued to Employees’’ (‘‘APB 25’’). Accordingly, nocompensation expense for stock options granted to employees at fair market value was included in the determination of net incomeprior to January 1, 2006. Effective January 1, 2006, the Company adopted SFAS No. 123 (revised 2004), ‘‘Share-Based Payment’’(‘‘SFAS 123R’’), which revises SFAS No. 123, ‘‘Accounting for Stock-Based Compensation’’ (‘‘SFAS 123’’), and supersedes APB 25.SFAS 123R requires all share-based payments to employees, including grants of employee stock options, to be recognized in thefinancial statements based on their fair values. The Company elected to use the modified-prospective transition method of adoption.This method requires that compensation expense be recorded for all share-based payments granted, modified or settled after the date ofadoption and for all unvested stock options at the date of adoption. Prior periods have not been restated to recognize stock-basedcompensation expense in amounts previously reported in the pro forma note disclosures under SFAS 123.
Income taxes
Income taxes are accounted for under the liability method. Deferred tax assets and liabilities are recognized for the differences betweenthe financial statement and income tax bases of assets and liabilities, and for operating losses and tax credit carryforwards. A valuationallowance is provided for the portion of deferred tax assets that is more likely than not to remain unrealized. Deferred tax assets andliabilities are measured using enacted tax rates and laws.
Earnings per share
Basic earnings per share are calculated by dividing net income by the weighted average number of common shares outstanding duringthe reporting period. Diluted earnings per share are calculated by dividing net income by the weighted average number of commonshares outstanding during the reporting period after giving effect to dilutive potential common shares. The dilutive effect of stockoptions is determined using the treasury stock method.
Comprehensive income
Comprehensive income comprises net income and other comprehensive income or loss. Other comprehensive income or loss comprisesforeign currency translation adjustments and unrealized holding gains or losses on available-for-sale investments. Accumulated othercomprehensive income is recorded as a component of shareholders’ equity.
Contingencies
In the normal course of business, the Company is subject to loss contingencies, such as claims and assessments arising from litigationand other legal proceedings, contractual indemnities, product and environmental liabilities, and tax matters. In addition, the Companyis self-insured for a portion of its product liability coverage. Accruals for loss contingencies are recorded when the Company determinesthat it is both probable that a liability has been incurred and the amount of loss can be reasonably estimated. If the estimate of theamount of the loss is a range and some amount within the range appears to be a better estimate than any other amount within the range,that amount is accrued as a liability. If no amount within the range is a better estimate than any other amount, the minimum amount ofthe range is accrued as a liability.
F-16
97

BIOVAIL CORPORATION
NOTES TO CONSOLIDATED FINANCIAL STATEMENTS (Continued)
In accordance with United States generally accepted accounting principles(All tabular dollar amounts expressed in thousands of U.S. dollars, except per share data)
December 31, 2006
2. SIGNIFICANT ACCOUNTING POLICIES (Continued)
Recent accounting pronouncements
In September 2006, the SEC issued SAB No. 108, ‘‘Considering the Effects of Prior Year Misstatements when QuantifyingMisstatements in Current Year Financial Statements’’ (‘‘SAB 108’’). SAB 108 provides guidance on how prior year uncorrected errorsshould be considered in quantifying misstatements in the current year financial statements. SAB 108 is effective for fiscal years endingafter November 15, 2006. Accordingly, SAB 108 was applicable to the Company’s fiscal year ended December 31, 2006. The adoption ofSAB 108 did not have any effect on the Company’s consolidated financial statements.
In September 2006, the FASB issued SFAS No. 157, ‘‘Fair Value Measurements’’ (‘‘SFAS 157’’). SFAS 157 establishes a framework formeasuring fair value in U.S. GAAP, clarifies the definition of fair value within that framework, and expands disclosures about the use offair value measurements. SFAS 157 applies to all other accounting pronouncements that require (or permit) fair value measurements,except for the measurement of share-based payments. SFAS 157 does not require any new fair value measurements in U.S. GAAP.SFAS 157 is effective for fiscal years beginning after November 15, 2007. Accordingly, the Company is required to adopt SFAS 157beginning January 1, 2008. The Company is currently evaluating the effect that the adoption of SFAS 157 will have on its consolidatedfinancial statements.
In July 2006, the FASB issued FASB Interpretation No. 48, ‘‘Accounting for Uncertainty in Income Taxes — an interpretation of FASBStatement No. 109’’ (‘‘FIN 48’’). FIN 48 clarifies the accounting for income taxes by prescribing the minimum recognition threshold atax position is required to meet before being recognized in the financial statements. FIN 48 also provides guidance on derecognition,measurement, classification, interest and penalties, accounting in interim periods, disclosure and transition. FIN 48 is effective for fiscalyears beginning after December 15, 2006. Accordingly, the Company is required to adopt FIN 48 beginning January 1, 2007. Thecumulative effect of applying the provisions of FIN 48 will be reported as an adjustment to the opening balance of the Company’s deficitrecorded in shareholders’ equity at January 1, 2007. The Company is currently evaluating the effect that the adoption of FIN 48 willhave on its consolidated financial statements.
3. RESTATEMENT
During the 2007 first quarter financial statement close process, the Company detected a data error in a supporting schedule used to(a) track quantities of Zovirax� products that the Company may purchase at reduced supply prices from GlaxoSmithKline plc (‘‘GSK’’),and (b) calculate amortization expense on a related long-term asset that is being amortized to cost of goods sold. As a result of thiserror, cost of goods sold for the years ended December 31, 2006 and 2005 has been adjusted for an overstatement of amortizationexpense in the amount of $12,129,000 and $5,201,000, respectively. At December 31, 2006, the cumulative effect of this adjustment forfiscal years 2006 and 2005 resulted in an increase of $17,330,000 to other assets, with a corresponding adjustment to deficit inshareholders’ equity.
As a result of the preceding restatement, the Company is required to correct other known errors in prior periods that were previouslydeemed to be immaterial. The Company identified two such instances — one related to Cardizem� LA revenue recognition and theother related to foreign currency translation.
The Company has revised its previous accounting for a cumulative pricing adjustment related to Cardizem� LA sold to KosPharmaceuticals, Inc. (‘‘Kos’’). That adjustment resulted from price increases implemented by Kos during the period from May 2, 2005to September 30, 2006. As previously disclosed, the Company originally recorded the entire amount of that adjustment in product salesrevenue for the three months ended September 30, 2006. The Company has now reallocated a share of that adjustment to each of theaffected interim periods, which resulted in a decrease of $2,807,000 to product sales revenue for the year ended December 31, 2006, anda corresponding increase to product sales revenue for the year ended December 31, 2005. This reallocation had no cumulative balancesheet effect at December 31, 2006.
The Company has also corrected the classification of certain foreign currency translation gains and losses from accumulated othercomprehensive income to net income. Those gains and losses were primarily related to long-term intercompany balances between theCompany and its Irish subsidiary group. This correction resulted in an increase of $1,644,000 and $1,195,000 to the foreign exchangeloss for the years ended December 31, 2006 and 2004, respectively, and a decrease of $2,211,000 to the foreign exchange loss for theyear ended December 31, 2005. At December 31, 2006, the cumulative effect of this correction for fiscal years 2006, 2005, 2004 and 2003resulted in an increase of $3,485,000 to accumulated other comprehensive income, with a corresponding adjustment to deficit, both inshareholders’ equity.
There was no income tax impact resulting from the foregoing adjustments.
F-17
98

BIOVAIL CORPORATION
NOTES TO CONSOLIDATED FINANCIAL STATEMENTS (Continued)
In accordance with United States generally accepted accounting principles(All tabular dollar amounts expressed in thousands of U.S. dollars, except per share data)
December 31, 2006
3. RESTATEMENT (Continued)
The following table summarizes the effects of the preceding adjustments on the previously reported consolidated balance sheets atDecember 31, 2006 and 2005.
At December 31, 2006 At December 31, 2005
As As As AsReported Adjustments Restated Reported Adjustments Restated
ASSETSCurrentCash and cash equivalents . . . . . . . . . . . . . . . . . . . . $ 834,540 $ — $ 834,540 $ 445,289 $ — $ 445,289Marketable securities . . . . . . . . . . . . . . . . . . . . . . . — — — 505 — 505Accounts receivable . . . . . . . . . . . . . . . . . . . . . . . . 129,247 — 129,247 132,699 2,807 135,506Inventories . . . . . . . . . . . . . . . . . . . . . . . . . . . . . . 78,781 — 78,781 89,473 — 89,473Deposits and prepaid expenses . . . . . . . . . . . . . . . . . 15,056 — 15,056 14,923 — 14,923Assets of discontinued operations held for sale . . . . . . . — — — 1,893 — 1,893
1,057,624 — 1,057,624 684,782 2,807 687,589
Marketable securities . . . . . . . . . . . . . . . . . . . . . . . 5,677 — 5,677 6,859 — 6,859Long-term investments . . . . . . . . . . . . . . . . . . . . . . 56,442 — 56,442 66,421 — 66,421Property, plant and equipment, net . . . . . . . . . . . . . . 211,979 — 211,979 199,567 — 199,567Intangible assets, net . . . . . . . . . . . . . . . . . . . . . . . 697,645 — 697,645 910,276 — 910,276Goodwill . . . . . . . . . . . . . . . . . . . . . . . . . . . . . . . 100,294 — 100,294 100,294 — 100,294Other assets, net . . . . . . . . . . . . . . . . . . . . . . . . . . 45,451 17,330 62,781 59,506 5,201 64,707Long-term assets of discontinued operation held for sale . — — — 1,107 — 1,107
$2,175,112 $17,330 $2,192,442 $2,028,812 $ 8,008 $2,036,820
LIABILITIESCurrentAccounts payable . . . . . . . . . . . . . . . . . . . . . . . . . . $ 44,988 $ — $ 44,988 $ 61,453 $ — $ 61,453Dividends payable . . . . . . . . . . . . . . . . . . . . . . . . . 80,222 — 80,222 — — —Accrued liabilities . . . . . . . . . . . . . . . . . . . . . . . . . 115,619 — 115,619 88,870 — 88,870Accrued contract losses . . . . . . . . . . . . . . . . . . . . . . 54,800 — 54,800 — — —Income taxes payable . . . . . . . . . . . . . . . . . . . . . . . 41,596 — 41,596 37,713 — 37,713Deferred revenue . . . . . . . . . . . . . . . . . . . . . . . . . . 61,916 — 61,916 61,160 — 61,160Current portion of long-term obligations . . . . . . . . . . . 11,146 — 11,146 24,360 — 24,360
410,287 — 410,287 273,556 — 273,556
Deferred revenue . . . . . . . . . . . . . . . . . . . . . . . . . . 73,621 — 73,621 117,119 — 117,119Deferred leasehold inducements . . . . . . . . . . . . . . . . 5,632 — 5,632 5,273 — 5,273Long-term obligations . . . . . . . . . . . . . . . . . . . . . . . 400,645 — 400,645 412,508 — 412,508
890,185 — 890,185 808,456 — 808,456
SHAREHOLDERS’ EQUITYCommon shares . . . . . . . . . . . . . . . . . . . . . . . . . . 1,476,930 — 1,476,930 1,461,077 — 1,461,077Additional paid-in capital . . . . . . . . . . . . . . . . . . . . . 14,952 — 14,952 377 — 377Deficit . . . . . . . . . . . . . . . . . . . . . . . . . . . . . . . . (246,578) 13,845 (232,733) (290,242) 6,167 (284,075)Accumulated other comprehensive income . . . . . . . . . . 39,623 3,485 43,108 49,144 1,841 50,985
1,284,927 17,330 1,302,257 1,220,356 8,008 1,228,364
$2,175,112 $17,330 $2,192,442 $2,028,812 $ 8,008 $2,036,820
F-18
99

BIOVAIL CORPORATION
NOTES TO CONSOLIDATED FINANCIAL STATEMENTS (Continued)
In accordance with United States generally accepted accounting principles(All tabular dollar amounts expressed in thousands of U.S. dollars, except per share data)
December 31, 2006
3. RESTATEMENT (Continued)
The following table summarizes the effects of the preceding adjustments on the previously reported consolidated statements of incomefor the years ended December 31, 2006, 2005 and 2004.
Year Ended December 31, 2006 Year Ended December 31, 2005 Year Ended December 31, 2004
As As As As As AsReported Adjustments Restated Reported Adjustments Restated Reported Adjustments Restated
REVENUEProduct sales . . . . . . . . $1,024,085 $ (2,807) $1,021,278 $884,267 $ 2,807 $887,074 $837,102 $ — $837,102Research and
development . . . . . . . 21,593 — 21,593 27,949 — 27,949 19,279 — 19,279Royalty and other . . . . . 24,851 — 24,851 23,320 — 23,320 22,775 — 22,775
1,070,529 (2,807) 1,067,722 935,536 2,807 938,343 879,156 — 879,156
EXPENSESCost of goods sold . . . . . 223,281 (12,129) 211,152 206,531 (5,201) 201,330 221,935 — 221,935Research and
development . . . . . . . 95,479 — 95,479 88,437 — 88,437 68,382 — 68,382Selling, general and
administrative . . . . . . 238,441 — 238,441 227,394 — 227,394 253,531 — 253,531Amortization . . . . . . . . 56,457 — 56,457 62,260 — 62,260 64,704 — 64,704Asset impairments, net of
gain on disposal . . . . . 143,000 — 143,000 29,230 — 29,230 40,685 — 40,685Restructuring costs . . . . 15,126 — 15,126 19,810 — 19,810 — — —Contract losses . . . . . . . 54,800 — 54,800 — — — — — —Litigation settlements . . . 14,400 — 14,400 — — — — — —Aquired research and
development . . . . . . . — — — — — — 8,640 — 8,640
840,984 (12,129) 828,855 633,662 (5,201) 628,461 657,877 — 657,877
Operating income . . . . . 229,545 9,322 238,867 301,874 8,008 309,882 221,279 — 221,279Interest income . . . . . . . 29,199 — 29,199 7,175 — 7,175 1,034 — 1,034Interest expense . . . . . . (35,203) — (35,203) (37,126) — (37,126) (40,104) — (40,104)Foreign exchange gain
(loss) . . . . . . . . . . . . (716) (1,644) (2,360) (1,417) 2,211 794 (564) (1,195) (1,759)Equity loss and other . . . (529) — (529) (1,160) — (1,160) (6,486) — (6,486)
Income from continuingoperations beforeprovision for incometaxes . . . . . . . . . . . . 222,296 7,678 229,974 269,346 10,219 279,565 175,159 (1,195) 173,964
Provision for incometaxes . . . . . . . . . . . . 14,500 — 14,500 22,550 — 22,550 8,950 — 8,950
Income from continuingoperations . . . . . . . . 207,796 7,678 215,474 246,796 10,219 257,015 166,209 (1,195) 165,014
Loss from discontinuedoperation . . . . . . . . . (3,848) — (3,848) (10,575) — (10,575) (5,215) — (5,215)
Net income . . . . . . . . . $ 203,948 $ 7,678 $ 211,626 $236,221 $10,219 $246,440 $160,994 $(1,195) $159,799
F-19
100

BIOVAIL CORPORATION
NOTES TO CONSOLIDATED FINANCIAL STATEMENTS (Continued)
In accordance with United States generally accepted accounting principles(All tabular dollar amounts expressed in thousands of U.S. dollars, except per share data)
December 31, 2006
3. RESTATEMENT (Continued)
Year Ended December 31, 2006 Year Ended December 31, 2005 Year Ended December 31, 2004
As As As As As AsReported Adjustments Restated Reported Adjustments Restated Reported Adjustments Restated
Basic and dilutedearnings per share
Income from continuingoperations . . . . . . . . $ 1.30 $ 0.05 $ 1.35 $ 1.55 $ 0.06 $ 1.61 $ 1.04 $ (0.01) $ 1.04
Net income . . . . . . . . . $ 1.27 $ 0.05 $ 1.32 $ 1.48 $ 0.06 $ 1.54 $ 1.01 $ (0.01) $ 1.00
The following table summarizes the effects of the preceding adjustments on the previously reported consolidated statements of cashflows for the years ended December 31, 2006, 2005 and 2004.
Year Ended December 31, 2006 Year Ended December 31, 2005 Year Ended December 31, 2004
As As As As As AsReported Adjustments Restated Reported Adjustments Restated Reported Adjustments Restated
CASH FLOWS FROMOPERATINGACTIVITIES
Net income . . . . . . . . . . . $203,948 $ 7,678 $211,626 $236,221 $10,219 $246,440 $160,994 $(1,195) $159,799
Adjustments to reconcile netincome to net cashprovided by continuingoperating activities . . . . .
Depreciation andamortization . . . . . . . . . 104,279 (12,129) 92,150 101,842 (5,201) 96,641 86,137 — 86,137
Amortization andwrite-down of deferredfinancing costs . . . . . . . 2,300 — 2,300 3,445 — 3,445 4,322 — 4,322
Amortization andwrite-down of discountson long-term obligations . 1,291 — 1,291 2,420 — 2,420 3,218 — 3,218
Stock-based compensation . . 14,794 — 14,794 — — — — — —Asset impairments . . . . . . 151,140 — 151,140 29,230 — 29,230 42,156 — 42,156Gain on disposal of
intangible assets . . . . . . (4,000) — (4,000) — — — (1,471) — (1,471)Accrued contract losses . . . 54,800 — 54,800 — — — — — —Equity loss . . . . . . . . . . . 529 — 529 1,160 — 1,160 4,179 — 4,179Loss from discontinued
operation . . . . . . . . . . . 3,848 — 3,848 10,575 — 10,575 5,215 — 5,215Receipt of leasehold
inducements . . . . . . . . . 835 — 835 805 — 805 5,232 — 5,232Acquired research and
development . . . . . . . . . — — — — — — 8,640 — 8,640Other . . . . . . . . . . . . . . (396) 1,644 1,248 (1,063) (2,211) (3,274) 1,688 1,195 2,883
F-20
101
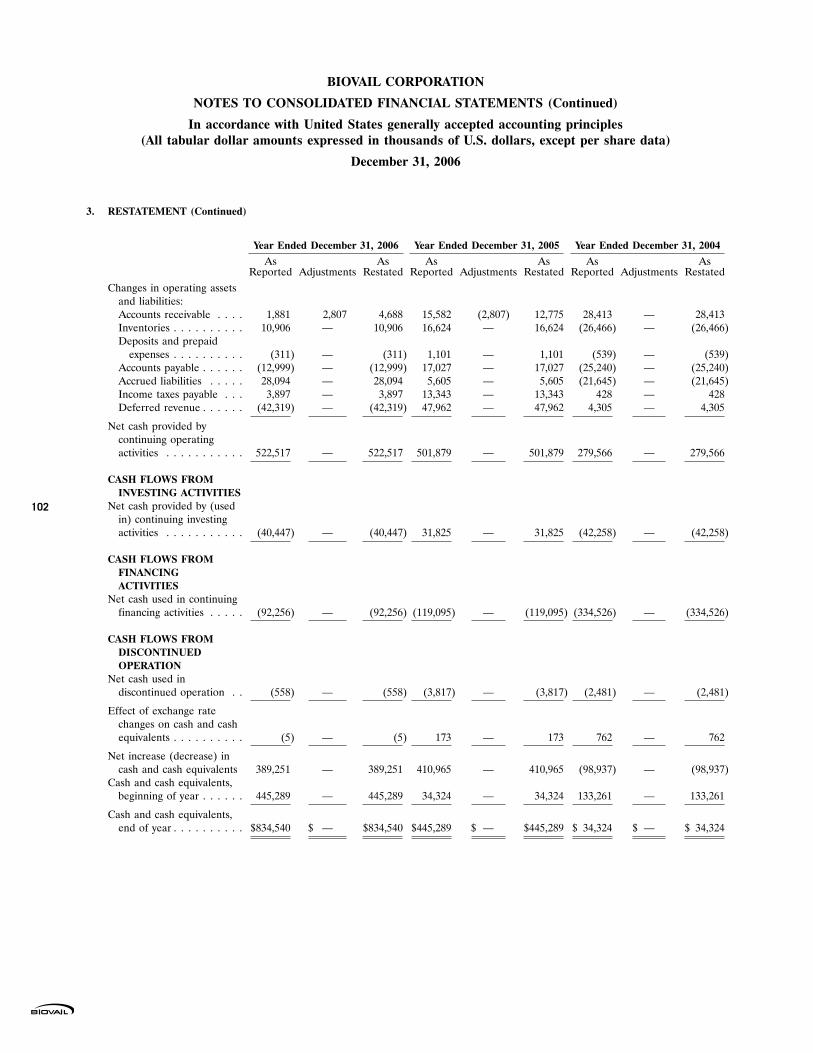
BIOVAIL CORPORATION
NOTES TO CONSOLIDATED FINANCIAL STATEMENTS (Continued)
In accordance with United States generally accepted accounting principles(All tabular dollar amounts expressed in thousands of U.S. dollars, except per share data)
December 31, 2006
3. RESTATEMENT (Continued)
Year Ended December 31, 2006 Year Ended December 31, 2005 Year Ended December 31, 2004
As As As As As AsReported Adjustments Restated Reported Adjustments Restated Reported Adjustments Restated
Changes in operating assetsand liabilities:Accounts receivable . . . . 1,881 2,807 4,688 15,582 (2,807) 12,775 28,413 — 28,413Inventories . . . . . . . . . . 10,906 — 10,906 16,624 — 16,624 (26,466) — (26,466)Deposits and prepaid
expenses . . . . . . . . . . (311) — (311) 1,101 — 1,101 (539) — (539)Accounts payable . . . . . . (12,999) — (12,999) 17,027 — 17,027 (25,240) — (25,240)Accrued liabilities . . . . . 28,094 — 28,094 5,605 — 5,605 (21,645) — (21,645)Income taxes payable . . . 3,897 — 3,897 13,343 — 13,343 428 — 428Deferred revenue . . . . . . (42,319) — (42,319) 47,962 — 47,962 4,305 — 4,305
Net cash provided bycontinuing operatingactivities . . . . . . . . . . . 522,517 — 522,517 501,879 — 501,879 279,566 — 279,566
CASH FLOWS FROMINVESTING ACTIVITIES
Net cash provided by (usedin) continuing investingactivities . . . . . . . . . . . (40,447) — (40,447) 31,825 — 31,825 (42,258) — (42,258)
CASH FLOWS FROMFINANCINGACTIVITIES
Net cash used in continuingfinancing activities . . . . . (92,256) — (92,256) (119,095) — (119,095) (334,526) — (334,526)
CASH FLOWS FROMDISCONTINUEDOPERATION
Net cash used indiscontinued operation . . (558) — (558) (3,817) — (3,817) (2,481) — (2,481)
Effect of exchange ratechanges on cash and cashequivalents . . . . . . . . . . (5) — (5) 173 — 173 762 — 762
Net increase (decrease) incash and cash equivalents 389,251 — 389,251 410,965 — 410,965 (98,937) — (98,937)
Cash and cash equivalents,beginning of year . . . . . . 445,289 — 445,289 34,324 — 34,324 133,261 — 133,261
Cash and cash equivalents,end of year . . . . . . . . . . $834,540 $ — $834,540 $445,289 $ — $445,289 $ 34,324 $ — $ 34,324
F-21
102

BIOVAIL CORPORATION
NOTES TO CONSOLIDATED FINANCIAL STATEMENTS
In accordance with United States generally accepted accounting principles(All tabular dollar amounts expressed in thousands of U.S. dollars, except per share data)
December 31, 2006
4. RESTRUCTURING
2006
On December 6, 2006, the Company eliminated its U.S.-based specialty sales force, and implemented other measures to reduce theoperating and infrastructure costs of its U.S. operations. As a result, the Company incurred a restructuring charge of $15,126,000, whichconsisted of employee termination benefits, asset impairments, contract termination costs, and professional fees.
The Company reduced its specialty sales force and related support functions by 115 positions, and administrative and other functions by73 positions. Employee termination costs include severance and related benefits, as well as outplacement services, for affectedemployees. Certain employees were offered retention bonuses to stay up to an additional six months in support of the transition process.The asset impairment charge partially related to the abandonment of leasehold improvements due to the vacating of a portion of theCompany’s Bridgewater, New Jersey facility. In addition, the Company decided to abandon large-scale manufacturing at its Chantilly,Virginia facility. As a result, the Company recorded an asset impairment charge related to the disposal or destruction of machinery andequipment that was not deemed useful for smaller scale research and development purposes. Contract termination costs include vehiclelease payments that the Company will continue to incur without economic benefit.
2005
On May 2, 2005, the Company sold the distribution rights to its cardiovascular product Cardizem� LA in the U.S. and Puerto Rico, toKos (which was acquired by Abbott Laboratories in December 2006). Kos also obtained the rights to distribute a combination productunder development comprising Cardizem� LA and Vasotec� (Vasocard�). In addition, the Company transferred to Kos all of theproduct rights and certain inventories related to its anti-hypertension drugs Teveten and Teveten HCT. In consideration for thesetransactions, Kos paid the Company $105,477,000 in cash, less withholding tax of $7,350,000.
The Company is the exclusive manufacturer and supplier of Cardizem� LA to Kos at contractually determined prices over an initialseven-year supply term. The up-front cash consideration was recorded in deferred revenue, and is being recognized in product sales on astraight-line basis over the seven-year Cardizem� LA supply term. The withholding tax was recorded in other assets, and is beingrecognized in income tax expense on the same seven-year, straight-line basis.
The Teveten and Teveten HCT product rights and inventories were transferred to Kos in exchange for the Cardizem� LA manufacturingand supply rights. The Company recorded a $25,507,000 impairment charge to write down the carrying value of the Teveten andTeveten HCT product rights to their estimated fair value of $53,700,000 (determined based on an independent valuation) at the date oftransfer. The Company recognized an intangible asset associated with the Cardizem� LA manufacturing and supply rights in theamount of $56,719,000, which comprised the estimated fair value of the Teveten and Teveten HCT product rights and cost of Tevetenand Teveten HCT inventories that were transferred to Kos. The Cardizem� LA intangible asset will be amortized to cost of goods sold,on the same seven-year, straight-line basis as deferred revenue described above. Inventories of Cardizem� LA, Teveten andTeveten HCT totaling $4,862,000 that were not transferred to Kos were written off to cost of goods sold.
Concurrent with the Kos transactions, the Company restructured its U.S. commercial operations. As a result, the Company reduced itsprimary-care and specialty sales forces at that time by 493 positions (including 186 sales representatives who were offered employmentby Kos), and administrative functions by 30 positions. The Company retained 85 specialty sales representatives. The Company incurreda restructuring charge of $19,810,000, which consisted of employee termination benefits, contract termination costs, and professionalfees. The Company did not pay termination benefits to those employees who were offered employment by Kos. Contract terminationcosts included facility and vehicle lease payments that the Company continued to incur without economic benefit.
F-22
103

BIOVAIL CORPORATION
NOTES TO CONSOLIDATED FINANCIAL STATEMENTS (Continued)
In accordance with United States generally accepted accounting principles(All tabular dollar amounts expressed in thousands of U.S. dollars, except per share data)
December 31, 2006
4. RESTRUCTURING (Continued)
Summary
A summary of the major components of restructuring costs recorded in 2006 and 2005 is as follows:
Employee Contract ProfessionalTermination Asset Termination Fees and
Benefits Impairments Costs Other Total
Balance, January 1, 2005 . . . . . . . . . . . . . . . . . . . . . $ — $ — $ — $ — $ —Costs incurred . . . . . . . . . . . . . . . . . . . . . . . . . . . 13,098 — 5,309 1,403 19,810Paid or settled . . . . . . . . . . . . . . . . . . . . . . . . . . . (13,098) — (3,738) (1,403) (18,239)
Balance, December 31, 2005 . . . . . . . . . . . . . . . . . . — — 1,571 — 1,571
Costs incurred . . . . . . . . . . . . . . . . . . . . . . . . . . . 8,722 4,140 2,008 256 15,126Paid or utilized . . . . . . . . . . . . . . . . . . . . . . . . . . . (355) (4,140) (268) — (4,763)
Balance, December 31, 2006 . . . . . . . . . . . . . . . . . . $ 8,367 $ — $ 3,311 $ 256 $ 11,934
The Company expects that the liability balance for employee termination benefits will be substantially paid prior to June 30, 2007. Theliability balance for contract termination costs includes $745,000 related to the Bridgewater facility lease that will be settled over theremaining nine-year term of this lease. The Company expects that the remaining liabilities for contract termination costs andprofessional fees will be paid or settled prior to March 31, 2007.
5. MARKETABLE SECURITIES
The amortized cost and estimated fair value of marketable securities held at December 31 were as follows:
GrossAmortized Unrealized Fair
2006 Cost Losses Value
Maturing between one and two years . . . . . . . . . . . . . . . . . . . . . . . . . . . . . . . . . . . . . $5,730 $(53) $5,677
GrossAmortized Unrealized Fair
2005 Cost Losses Value
Maturing within one year . . . . . . . . . . . . . . . . . . . . . . . . . . . . . . . . . . . . . . . . . . . . $ 511 $ (6) $ 505Maturing between one and three years . . . . . . . . . . . . . . . . . . . . . . . . . . . . . . . . . . . . 6,920 (61) 6,859
$7,431 $(67) $7,364
The gross unrealized losses on the Company’s marketable securities were caused by increases in market interest rates. As the Companyhas the ability and intent to hold these securities until a recovery of fair value, which may be maturity, the Company does not considerthese securities to be other-than-temporarily impaired at December 31, 2006.
F-23
104

BIOVAIL CORPORATION
NOTES TO CONSOLIDATED FINANCIAL STATEMENTS (Continued)
In accordance with United States generally accepted accounting principles(All tabular dollar amounts expressed in thousands of U.S. dollars, except per share data)
December 31, 2006
6. ACCOUNTS RECEIVABLE
2006 2005
As Restated —See Note 3
Trade . . . . . . . . . . . . . . . . . . . . . . . . . . . . . . . . . . . . . . . . . . . . . . . . . . . . . . . . . . . . . $123,031 $127,652Less allowances for doubtful accounts and cash discounts . . . . . . . . . . . . . . . . . . . . . . . . . . . . 3,503 4,300
119,528 123,352Royalties . . . . . . . . . . . . . . . . . . . . . . . . . . . . . . . . . . . . . . . . . . . . . . . . . . . . . . . . . . . 4,121 5,032Other . . . . . . . . . . . . . . . . . . . . . . . . . . . . . . . . . . . . . . . . . . . . . . . . . . . . . . . . . . . . . 5,598 7,122
$129,247 $135,506
7. INVENTORIES
2006 2005
Raw materials . . . . . . . . . . . . . . . . . . . . . . . . . . . . . . . . . . . . . . . . . . . . . . . . . . . . . . . . . . . . . $34,766 $54,525Work in process . . . . . . . . . . . . . . . . . . . . . . . . . . . . . . . . . . . . . . . . . . . . . . . . . . . . . . . . . . . . 15,230 11,416Finished goods . . . . . . . . . . . . . . . . . . . . . . . . . . . . . . . . . . . . . . . . . . . . . . . . . . . . . . . . . . . . . 28,785 23,532
$78,781 $89,473
8. LONG-TERM INVESTMENTS
2006 2005
Ethypharm S.A. . . . . . . . . . . . . . . . . . . . . . . . . . . . . . . . . . . . . . . . . . . . . . . . . . . . . . . . . . . . . $30,000 $30,000Depomed, Inc. . . . . . . . . . . . . . . . . . . . . . . . . . . . . . . . . . . . . . . . . . . . . . . . . . . . . . . . . . . . . . 15,999 26,102Other . . . . . . . . . . . . . . . . . . . . . . . . . . . . . . . . . . . . . . . . . . . . . . . . . . . . . . . . . . . . . . . . . . . 10,443 10,319
$56,442 $66,421
Ethypharm S.A. (‘‘Ethypharm’’)
Ethypharm is a privately held pharmaceutical company located in France that specializes in developing drug delivery systems. InApril 2002, the Company invested $67,802,000, including costs of acquisition, to acquire 9,794,118 common shares (15% of the issuedand outstanding common shares) of Ethypharm. This investment is being accounted for using the cost method.
In December 2004, the Company evaluated its investment in Ethypharm and determined that the carrying value of this investmentmight not be fully realized in the foreseeable future. As a result, the Company recorded a $37,802,000 impairment charge to write downthe carrying value of this investment to reflect an other-than-temporary decline in its estimated fair value.
In February 2007, the Company entered into a share transfer agreement pursuant to which it has agreed to sell all or a part of itscommon shares of Ethypharm (as described in note 28).
Product development and licensing agreement
In April 2002, the Company entered into a product development and licensing agreement with Ethypharm. The products underdevelopment included Ethypharm’s formulations of tramadol (Ultram� ODT) and tramadol/acetaminophen, as well as four otherproducts. Ethypharm was to complete the development of each product to enable the Company to file an application for regulatoryapproval. The Company agreed to pay Ethypharm up to $46,000,000 in milestone payments upon regulatory approval of Ultram� ODTand the other products, as well as royalties on any future sales of tramadol/acetaminophen and the other products. In May 2005, theCompany made a $1,000,000 milestone payment to Ethypharm associated with the receipt of regulatory approval for Ultram� ODT, andrecorded a corresponding product right.
F-24
105

BIOVAIL CORPORATION
NOTES TO CONSOLIDATED FINANCIAL STATEMENTS (Continued)
In accordance with United States generally accepted accounting principles(All tabular dollar amounts expressed in thousands of U.S. dollars, except per share data)
December 31, 2006
8. LONG-TERM INVESTMENTS (Continued)
In November 2006, the Company and Ethypharm amended the product development and licensing agreement to terminateEthypharm’s obligation to develop the other products, as well as the Company’s obligation to make milestone or royalty paymentsrelated to those products. Ethypharm will instead develop four new products, but the Company will assume responsibility for the clinicalprograms associated with those products. The Company is obligated to pay Ethypharm royalties on any future sales of the new products.
Depomed, Inc. (‘‘Depomed’’)
Depomed is a publicly traded specialty pharmaceutical company with proprietary oral drug delivery technologies. At December 31,2006, the Company owned 4,242,032 (2005 — 4,092,032) common shares of Depomed, which represented approximately 10% of itsissued and outstanding common shares. At December 31, 2006, the Company also held warrants to purchase 419,154 (2005 — 569,154)common shares, which are exercisable until April 2008 at an exercise price of $2.16 per share. This investment is classified as beingavailable-for-sale.
At December 31, 2006 and 2005, the cost bases and estimated fair values of this investment were as follows:
2006 2005
Cost . . . . . . . . . . . . . . . . . . . . . . . . . . . . . . . . . . . . . . . . . . . . . . . . . . . . . . . . . . . . . . . . . . . . $10,134 $ 9,810Gross unrealized holding gain . . . . . . . . . . . . . . . . . . . . . . . . . . . . . . . . . . . . . . . . . . . . . . . . . . . 5,865 16,292
Fair value . . . . . . . . . . . . . . . . . . . . . . . . . . . . . . . . . . . . . . . . . . . . . . . . . . . . . . . . . . . . . . . . $15,999 $26,102
The Company recorded unrealized holding losses of $10,427,000 and $6,916,000 in 2006 and 2004, respectively, and an unrealizedholding gain of $2,456,000 in 2005, in other comprehensive income or loss to reflect changes in the fair value of this investment.
9. PROPERTY, PLANT AND EQUIPMENT
2006 2005
Accumulated AccumulatedCost Depreciation Cost Depreciation
Land . . . . . . . . . . . . . . . . . . . . . . . . . . . . . . . . . . . . . . . . . . . $ 12,053 $ — $ 11,942 $ —Buildings . . . . . . . . . . . . . . . . . . . . . . . . . . . . . . . . . . . . . . . . 118,371 21,898 83,520 17,373Machinery and equipment . . . . . . . . . . . . . . . . . . . . . . . . . . . . . . 102,770 54,712 98,183 48,418Other equipment and leasehold improvements . . . . . . . . . . . . . . . . . 75,763 45,236 73,084 37,629Construction in progress . . . . . . . . . . . . . . . . . . . . . . . . . . . . . . . 24,868 — 36,258 —
333,825 $121,846 302,987 $103,420
Less accumulated depreciation . . . . . . . . . . . . . . . . . . . . . . . . . . . 121,846 103,420
$211,979 $199,567
Interest capitalized amounted to $866,000, $164,000 and $222,000 in 2006, 2005 and 2004, respectively.
Depreciation expense amounted to $25,468,000, $27,977,000 and $22,259,000 in 2006, 2005 and 2004, respectively.
F-25
106

BIOVAIL CORPORATION
NOTES TO CONSOLIDATED FINANCIAL STATEMENTS (Continued)
In accordance with United States generally accepted accounting principles(All tabular dollar amounts expressed in thousands of U.S. dollars, except per share data)
December 31, 2006
10. INTANGIBLE ASSETS
2006 2005
Accumulated AccumulatedCost Amortization Cost Amortization
TrademarksCardizem� . . . . . . . . . . . . . . . . . . . . . . . . . . . . . . . . . . . . . . . . $406,058 $123,247 $ 406,058 $103,044Ativan� and Isordil� . . . . . . . . . . . . . . . . . . . . . . . . . . . . . . . . . . 107,542 19,403 107,542 14,026Vasotec� and Vaseretic� . . . . . . . . . . . . . . . . . . . . . . . . . . . . . . . 35,908 573 165,855 30,729Wellbutrin� and Zyban� . . . . . . . . . . . . . . . . . . . . . . . . . . . . . . . 24,243 4,948 24,243 3,736
573,751 148,171 703,698 151,535Product rightsZovirax� . . . . . . . . . . . . . . . . . . . . . . . . . . . . . . . . . . . . . . . . . 173,518 46,940 173,518 38,488Cardizem� LA . . . . . . . . . . . . . . . . . . . . . . . . . . . . . . . . . . . . . 56,719 13,505 56,719 5,402Wellbutrin� and Zyban� . . . . . . . . . . . . . . . . . . . . . . . . . . . . . . . 45,000 12,000 45,000 9,000Tiazac� . . . . . . . . . . . . . . . . . . . . . . . . . . . . . . . . . . . . . . . . . . 22,750 12,495 22,750 10,934Vasotec� and Vaseretic� . . . . . . . . . . . . . . . . . . . . . . . . . . . . . . . 17,984 422 79,500 18,541Ativan� and Isordil� . . . . . . . . . . . . . . . . . . . . . . . . . . . . . . . . . . 16,041 3,816 16,041 2,747Glumetza� . . . . . . . . . . . . . . . . . . . . . . . . . . . . . . . . . . . . . . . . 6,667 192 25,000 1,458Other . . . . . . . . . . . . . . . . . . . . . . . . . . . . . . . . . . . . . . . . . . . 20,623 8,964 24,623 10,695
359,302 98,334 443,151 97,265TechnologyAtivan� and Isordil� . . . . . . . . . . . . . . . . . . . . . . . . . . . . . . . . . . 2,156 493 2,156 349Other . . . . . . . . . . . . . . . . . . . . . . . . . . . . . . . . . . . . . . . . . . . 14,800 5,366 14,800 4,380
16,956 5,859 16,956 4,729
950,009 $252,364 1,163,805 $253,529
Less accumulated amortization . . . . . . . . . . . . . . . . . . . . . . . . . . . 252,364 253,529
$697,645 $ 910,276
Asset impairments
At September 30, 2006, the Company recorded an asset impairment charge of $147,000,000 to write down the following intangible assetsto their estimated fair value:
Less LessAccumulated Carrying Impairment Estimated
Cost Amortization Value Charge Fair Value
TrademarksVasotec� and Vaseretic� . . . . . . . . . . . . . . . . . . . . . . . . $165,855 $36,947 $128,908 $ 93,000 $35,908
Product rightsVasotec� and Vaseretic� . . . . . . . . . . . . . . . . . . . . . . . . 79,500 22,516 56,984 39,000 17,984Glumetza� . . . . . . . . . . . . . . . . . . . . . . . . . . . . . . . . . 25,000 3,333 21,667 15,000 6,667
104,500 25,849 78,651 54,000 24,651
$270,355 $62,796 $207,559 $147,000 $60,559
Vasotec� and Vaseretic�
The Company recorded a $132,000,000 impairment charge relating to its Vasotec� and Vaseretic� trademarks and product rights. TheCompany acquired Vasotec� and Vaseretic� from Merck & Co., Inc. (‘‘Merck’’) in May 2002 for $245,355,000. Subsequent to the date of
F-26
107

BIOVAIL CORPORATION
NOTES TO CONSOLIDATED FINANCIAL STATEMENTS (Continued)
In accordance with United States generally accepted accounting principles(All tabular dollar amounts expressed in thousands of U.S. dollars, except per share data)
December 31, 2006
10. INTANGIBLE ASSETS (Continued)
acquisition, the Company had been developing Vasocard� as a Vasotec� line extension product. In May 2005, the Company sold thedistribution rights to Vasocard� to Kos (as described in note 4).
In September 2006, Kos informed the Company of its intention to discontinue its involvement with Vasocard�. The Companyperformed its own assessment and determined that Vasocard� had limited commercial potential without Kos’s continued involvement.The Company, therefore, suspended any further development activities related to Vasocard�. The Company evaluated therecoverability of the Vasotec� and Vaseretic� trademarks and product rights excluding the estimated undiscounted future cash flowsfrom the Vasocard� line extension and determined that the $185,892,000 carrying value of those assets at September 30, 2006 was nolonger fully recoverable. Accordingly, the Company wrote down the carrying value of the Vasotec� and Vaseretic� trademarks andproduct rights to reflect their estimated fair value of $53,892,000 based on the discounted future cash flows from the existing Vasotec�
and Vaseretic� product lines.
Glumetza�
The Company recorded a $15,000,000 impairment charge relating to its Glumetza� product right. In July 2005, the Company made a$25,000,000 payment to Depomed associated with the receipt of regulatory approval for Glumetza�. This product right is beingamortized using the straight-line method over its estimated useful life of 10 years.
Since its launch in the Canadian market in November 2005, the sales performance of Glumetza� (in terms of prescription volumes) hasbeen less than originally anticipated due to the competitive pricing and existing formulary listing of immediate-release genericformulations of metformin (the active drug compound in Glumetza�). In addition, the prices set by the Company for Glumetza� arenow subject to regulation by the Patented Medicine Prices Review Board (‘‘PMPRB’’) in Canada, since Depomed was granted a newCanadian patent pertaining to Glumetza� in October 2006. As a result, the Company revised its sales forecast for Glumetza� to reflectboth the underlying prescription trend since the launch of this product and possible future pricing concessions that may be required bythe PMPRB. On the basis of this forecast, the Company evaluated the recoverability of the Glumetza� product right and determinedthat the $21,667,000 carrying value of that product right at September 30, 2006 was no longer fully recoverable based on estimatedundiscounted future cash flows. Accordingly, the Company wrote down the carrying value of the Glumetza� product right to reflect itsestimated fair value of $6,667,000 based on discounted future cash flows.
Amortization expense
Amortization expense for the years ending December 31 was recorded as follows:
2006 2005 2004
Royalty and other revenue . . . . . . . . . . . . . . . . . . . . . . . . . . . . . . . . . . . . . . . . . . . . . . . $ 1,072 $ 1,072 $ 1,072Cost of goods sold . . . . . . . . . . . . . . . . . . . . . . . . . . . . . . . . . . . . . . . . . . . . . . . . . . . . 8,103 5,402 —Amortization expense . . . . . . . . . . . . . . . . . . . . . . . . . . . . . . . . . . . . . . . . . . . . . . . . . . 56,457 62,260 64,704Loss from discontinued operation . . . . . . . . . . . . . . . . . . . . . . . . . . . . . . . . . . . . . . . . . . — 204 272
$65,632 $68,938 $66,048
Estimated amortization expense for each of the five succeeding years ending December 31 is as follows:
2007 2008 2009 2010 2011
Amortization expense . . . . . . . . . . . . . . . . . . . . . . . . . . . . . . . . . . . . $57,129 $57,129 $57,129 $57,063 $55,313
Product rights have an estimated weighted average useful life of approximately 13 years. Total intangible assets have an estimatedweighted average useful life of approximately 17 years.
F-27
108

BIOVAIL CORPORATION
NOTES TO CONSOLIDATED FINANCIAL STATEMENTS (Continued)
In accordance with United States generally accepted accounting principles(All tabular dollar amounts expressed in thousands of U.S. dollars, except per share data)
December 31, 2006
11. OTHER ASSETS
2006 2005
As Restated — As Restated —See Note 3 See Note 3
Zovirax� . . . . . . . . . . . . . . . . . . . . . . . . . . . . . . . . . . . . . . . . . . . . . . . . . . . . . . . $40,656 $40,656Deferred compensation trust fund . . . . . . . . . . . . . . . . . . . . . . . . . . . . . . . . . . . . . . . 7,958 7,398Deferred financing costs, less accumulated amortization: 2006 — $14,485; 2005 — $12,185 . . . . 6,095 7,120Withholding tax, less accumulated amortization: 2006 — $1,750; 2005 — $700 . . . . . . . . . . . . 5,600 6,650Loan receivable . . . . . . . . . . . . . . . . . . . . . . . . . . . . . . . . . . . . . . . . . . . . . . . . . . . 719 665Other . . . . . . . . . . . . . . . . . . . . . . . . . . . . . . . . . . . . . . . . . . . . . . . . . . . . . . . . . 1,753 2,218
$62,781 $64,707
Zovirax�
Effective October 1, 2002, the Company amended several terms of the original Zovirax� distribution agreement with GSK, includingthe reduction in the supply price for this product. In consideration for these amendments the Company agreed to pay GSK $11,250,000per year in four annual instalments on March 31 of each year beginning in 2004. The present value of these payments was determined tobe $40,656,000, which was recorded as an asset. Commencing in 2007, this asset will be amortized to cost of goods sold on aproportionate basis relative to the total amount of Zovirax� that can be purchased at the reduced supply price.
Withholding tax
In connection with the Kos transaction, tax of $7,350,000 was withheld from the cash consideration received (as described in note 4).Commencing in 2005, this asset is being amortized to income tax expense on a straight-line basis over seven years.
Loan receivable
In March 2001, the Company made a $600,000 relocation assistance loan to a former executive officer. This loan accrues interest at arate equal to the Company’s rate of borrowing and is due on March 31, 2008.
12. ACCRUED LIABILITIES
2006 2005
Product returns . . . . . . . . . . . . . . . . . . . . . . . . . . . . . . . . . . . . . . . . . . . . . . . . . . . . . . . . . . . . $ 25,121 $23,205Employee costs . . . . . . . . . . . . . . . . . . . . . . . . . . . . . . . . . . . . . . . . . . . . . . . . . . . . . . . . . . . . 19,046 19,773Litigation settlements (as described in note 18) . . . . . . . . . . . . . . . . . . . . . . . . . . . . . . . . . . . . . . . . 14,400 —Restructuring (as described in note 4) . . . . . . . . . . . . . . . . . . . . . . . . . . . . . . . . . . . . . . . . . . . . . . 11,934 1,571Professional fees . . . . . . . . . . . . . . . . . . . . . . . . . . . . . . . . . . . . . . . . . . . . . . . . . . . . . . . . . . . 11,243 8,940Interest . . . . . . . . . . . . . . . . . . . . . . . . . . . . . . . . . . . . . . . . . . . . . . . . . . . . . . . . . . . . . . . . . 8,304 8,849Product rebates, chargebacks and allowances . . . . . . . . . . . . . . . . . . . . . . . . . . . . . . . . . . . . . . . . . 7,083 9,465Recall costs . . . . . . . . . . . . . . . . . . . . . . . . . . . . . . . . . . . . . . . . . . . . . . . . . . . . . . . . . . . . . . 3,000 —Distribution fees . . . . . . . . . . . . . . . . . . . . . . . . . . . . . . . . . . . . . . . . . . . . . . . . . . . . . . . . . . . 2,350 4,885Other . . . . . . . . . . . . . . . . . . . . . . . . . . . . . . . . . . . . . . . . . . . . . . . . . . . . . . . . . . . . . . . . . . 13,138 12,182
$115,619 $88,870
F-28
109

BIOVAIL CORPORATION
NOTES TO CONSOLIDATED FINANCIAL STATEMENTS (Continued)
In accordance with United States generally accepted accounting principles(All tabular dollar amounts expressed in thousands of U.S. dollars, except per share data)
December 31, 2006
13. ACCRUED CONTRACT LOSSES
2006 2005
Wellbutrin XL� . . . . . . . . . . . . . . . . . . . . . . . . . . . . . . . . . . . . . . . . . . . . . . . . . . . . . . . . . . . . $46,400 $ —Cardizem� LA . . . . . . . . . . . . . . . . . . . . . . . . . . . . . . . . . . . . . . . . . . . . . . . . . . . . . . . . . . . . . 8,400 —
$54,800 $ —
Wellbutrin XL�
In December 2006, Teva Pharmaceuticals Industries Ltd. (‘‘Teva’’) launched a generic version of 300mg Wellbutrin XL� product in theU.S. (as described in note 23). With the introduction of generic competition, the Company anticipates losing a substantial portion of thepre-genericization revenue from sales of 300mg Wellbutrin XL� brand product in the U.S. within a short period of time. Since its launchby GSK in September 2003 through to December 2006, Wellbutrin XL� has accounted for approximately 40% of the Company’s totalconsolidated product sales.
GSK may launch an authorized generic version of Wellbutrin XL�. Under the terms of the Wellbutrin XL� agreement with GSK, theCompany will be the exclusive manufacturer and supplier to GSK of such an authorized generic. The Company’s fixed contractualsupply price to GSK for Wellbutrin XL� generic product is substantially lower than the tiered supply price that the Company currentlyreceives on sales of Wellbutrin XL� brand product.
As a result of the introduction of generic competition, the Company is required to make a payment to GSK under the terms of theWellbutrin XL� agreement. The maximum amount of this payment was reduced by the total dollar amount of Wellbutrin XL� samplesupplies that were purchased by GSK. At December 31, 2006, the Company accrued a contract loss of $46,400,000 for the estimatedamount of this payment based on GSK’s historical and forecasted sample supply purchases.
Cardizem� LA
In April 2006, the Company began experiencing issues in connection with the manufacture and supply of Cardizem� LA to Kos. InSeptember 2006, the Company received notification from Kos that a supply failure had occurred as a result of the Company’s inabilityto supply at least 50% of the quantity of Cardizem� LA ordered by Kos. Under the terms of the Cardizem� LA agreement, theCompany agreed to indemnify Kos (subject to certain conditions and limits) in the event that such a supply failure resulted in lost profitsto Kos. In order to make a claim under this term of the Cardizem� LA agreement, Kos will be required to demonstrate the amount oflost profits it has experienced as a result of the supply failure.
At December 31, 2006, the Company accrued a contract loss of $8,400,000 based on its estimate of the lost profits claim that Kos may beentitled to. This amount was determined based on the Company’s estimate of end-customer sales of Cardizem� LA that Kos may haverealized in the absence of the supply failure. This liability may be revised in subsequent periods based on the receipt of Kos’s ownestimate of the amount of its lost profits, as well as on the timing and outcome of the Company’s remediation efforts to address itsmanufacturing issues with Cardizem� LA. The Company’s maximum potential exposure under this indemnity is approximately$14,000,000.
14. DEFERRED REVENUE
2006 2005
Cardizem� LA up-front consideration, less accumulated amortization: 2006 — $25,114; 2005 — $10,045 . . . $ 80,363 $ 95,432Ultram� ER prepayment, less accumulated amortization: 2006 — $20,275; 2005 — $ — . . . . . . . . . . . . . 39,725 60,000Licensing fees and other . . . . . . . . . . . . . . . . . . . . . . . . . . . . . . . . . . . . . . . . . . . . . . . . . . . . . 9,881 11,048Customer prepayments . . . . . . . . . . . . . . . . . . . . . . . . . . . . . . . . . . . . . . . . . . . . . . . . . . . . . . 968 5,099Research and development fees . . . . . . . . . . . . . . . . . . . . . . . . . . . . . . . . . . . . . . . . . . . . . . . . . 4,600 6,700
135,537 178,279Less current portion . . . . . . . . . . . . . . . . . . . . . . . . . . . . . . . . . . . . . . . . . . . . . . . . . . . . . . . . 61,916 61,160
$ 73,621 $117,119
F-29
110

BIOVAIL CORPORATION
NOTES TO CONSOLIDATED FINANCIAL STATEMENTS (Continued)
In accordance with United States generally accepted accounting principles(All tabular dollar amounts expressed in thousands of U.S. dollars, except per share data)
December 31, 2006
14. DEFERRED REVENUE (Continued)
Cardizem� LA
In May 2005, the Company received up-front cash consideration of $105,477,000 in connection with the Kos transaction (as described innote 4). Commencing in 2005, this consideration is being amortized to product sales on a straight-line basis over seven years.
Ultram� ER
In November 2005, the Company received $60,000,000 from Ortho-McNeil, Inc. (‘‘OMI’’) related to the manufacture and supply ofUltram� ER. Commencing in 2006, this prepayment is being amortized to zero through credits against 33% of the total amount ofUltram� ER sold to OMI.
15. LONG-TERM OBLIGATIONS
2006 2005
77⁄8% Senior Subordinated Notes due April 1, 2010 . . . . . . . . . . . . . . . . . . . . . . . . . . . . . . . . . . . . $398,902 $400,000Unamortized discount . . . . . . . . . . . . . . . . . . . . . . . . . . . . . . . . . . . . . . . . . . . . . . . . . . . . . . . (1,183) (1,551)Fair value adjustment . . . . . . . . . . . . . . . . . . . . . . . . . . . . . . . . . . . . . . . . . . . . . . . . . . . . . . . 1,660 2,103
399,379 400,552Zovirax� obligation . . . . . . . . . . . . . . . . . . . . . . . . . . . . . . . . . . . . . . . . . . . . . . . . . . . . . . . . . 11,146 21,884Vasotec� and Vaseretic� obligation . . . . . . . . . . . . . . . . . . . . . . . . . . . . . . . . . . . . . . . . . . . . . . . — 13,622Deferred compensation . . . . . . . . . . . . . . . . . . . . . . . . . . . . . . . . . . . . . . . . . . . . . . . . . . . . . . 1,266 810
411,791 436,868Less current portion . . . . . . . . . . . . . . . . . . . . . . . . . . . . . . . . . . . . . . . . . . . . . . . . . . . . . . . . 11,146 24,360
$400,645 $412,508
77⁄8% Senior Subordinated Notes (‘‘Notes’’)
Pursuant to a supplement to its base shelf prospectus dated March 25, 2002, the Company issued, under an indenture dated March 28,2002, $400,000,000 aggregate principal amount of unsecured Notes. Interest on the Notes is payable semi-annually in arrears on April 1and October 1 of each year. The Notes were issued at a price of 99.27% of their aggregate principal amount for an effective yield, if heldto maturity, of 8%. Proceeds from the issue amounted to $384,280,000, net of discount and financing costs.
In May 2006, the Company commenced a tender offer to purchase up to $56,600,000 principal amount of its Notes at par plus accruedinterest. This offer was made to fulfill the Company’s obligation following a transfer of assets under the indenture pursuant to which theNotes were issued. This offer was funded with the net proceeds resulting from the transfer of the Company’s product rights and certaininventories related to Teveten and Teveten HCT to Kos. On June 29, 2006, the Company made total cash payments of $1,098,000 for theprincipal amount of Notes tendered prior to the expiration of the tender offer on June 26, 2006. The Company recorded related write-downs to the unamortized deferred financing costs, discount and fair value adjustment associated with the repurchased Notes. Theamounts of those write-downs were not significant.
The fair values of the outstanding Notes, based on quoted market prices, were $407,379,000 and $414,400,000 at December 31, 2006 and2005, respectively.
On February 27, 2007, the Company issued a notice of redemption of all the outstanding Notes effective April 1, 2007 at a price of101.969% of the principal amount, plus accrued interest (as described in note 28). The Notes have been classified as a long-termobligation on the consolidated balance sheet based on the conditions that existed at December 31, 2006.
Zovirax� obligation
This non-interest bearing obligation relates to the amendments to the Zovirax� distribution agreement (as described in note 11), andwas discounted based on an imputed interest rate of 3.74%. The final payment of $11,250,000 is due on March 31, 2007.
F-30
111

BIOVAIL CORPORATION
NOTES TO CONSOLIDATED FINANCIAL STATEMENTS (Continued)
In accordance with United States generally accepted accounting principles(All tabular dollar amounts expressed in thousands of U.S. dollars, except per share data)
December 31, 2006
15. LONG-TERM OBLIGATIONS (Continued)
Vasotec� and Vaseretic� obligation
This non-interest bearing obligation related to the acquisition of Vasotec� and Vaseretic� from Merck, and was discounted based on animputed interest rate of 5.75%. The final payment was made on October 1, 2006.
Credit facility
At December 31, 2006 and 2005, the Company had no outstanding borrowings under its $250,000,000 credit facility.
Effective June 13, 2006, the Company amended and renewed this facility. The amended agreement extends the period of this facility toa three-year term with an annual extension option, compared with a renewable 364-day revolving period with a one-year term periodunder the previous agreement. The amended agreement contains an accordion feature, which allows this facility to be increased up to$400,000,000, and includes an increase in the minimum shareholders’ equity covenant. The amended agreement also eases certain othercovenants and contains more favourable interest terms.
Borrowings under this facility are secured by a charge over substantially all of the assets and undertakings, including intellectualproperty, of the Company. The credit agreement includes certain financial and non-financial covenants. The financial covenants requirethe Company to meet or exceed certain minimum thresholds for shareholders’ equity and interest coverage, and not to exceed amaximum threshold in respect of the ratio of debt to earnings before interest, taxes, depreciation and amortization. Non-financialcovenants include, but are not limited to, restrictions on investments and dispositions, as well as capital and debt-restructuring activities,exceeding established thresholds. On a change in control, the lenders have the right to require the Company to settle the entire facility,plus accrued and unpaid interest at the date of settlement.
Borrowings may be by way of U.S. dollar London Interbank Offering Rate (‘‘LIBOR’’) or U.S. base rate advances; or Canadian dollarprime rate or bankers’ acceptance (‘‘BA’’) advances; or letters of credit. Interest is charged at the Bank’s quoted rate plus a borrowingmargin of 1.375% to 2% in the case of LIBOR and BA advances, and 0.375% to 1% in the case of base rate and prime rate advances,depending on the Company’s financial covenant ratios at the time of such borrowing.
Maturities
Aggregate maturities of long-term obligations for the years ending December 31 are as follows:
Notes Other Total
2007 . . . . . . . . . . . . . . . . . . . . . . . . . . . . . . . . . . . . . . . . . . . . . . . . . . . . . . . . . . . $ — $11,250 $ 11,2502010 . . . . . . . . . . . . . . . . . . . . . . . . . . . . . . . . . . . . . . . . . . . . . . . . . . . . . . . . . . . 398,902 — 398,902
Total gross maturities . . . . . . . . . . . . . . . . . . . . . . . . . . . . . . . . . . . . . . . . . . . . . . . . 398,902 11,250 410,152
Unamortized discounts . . . . . . . . . . . . . . . . . . . . . . . . . . . . . . . . . . . . . . . . . . . . . . . (1,183) (104) (1,287)Fair value adjustment . . . . . . . . . . . . . . . . . . . . . . . . . . . . . . . . . . . . . . . . . . . . . . . . 1,660 — 1,660Deferred compensation . . . . . . . . . . . . . . . . . . . . . . . . . . . . . . . . . . . . . . . . . . . . . . . — 1,266 1,266
$399,379 $12,412 $411,791
The deferred compensation obligation is repayable to the participants in the deferred compensation plan upon their retirement orearlier withdrawal from the plan. Accordingly, this obligation does not have a defined maturity.
Interest
Interest expense on long-term obligations amounted to $33,450,000, $33,998,000 and $36,963,000 in 2006, 2005 and 2004, respectively.Interest paid on long-term obligations amounted to $31,490,000, $31,378,000 and $32,594,000 in 2006, 2005 and 2004, respectively.
F-31
112

BIOVAIL CORPORATION
NOTES TO CONSOLIDATED FINANCIAL STATEMENTS (Continued)
In accordance with United States generally accepted accounting principles(All tabular dollar amounts expressed in thousands of U.S. dollars, except per share data)
December 31, 2006
16. SHAREHOLDERS’ EQUITY
2006 Stock Option Plan
At the Company’s Annual and Special Meeting of Shareholders on June 27, 2006, shareholders voted to approve the Company’s 2006Stock Option Plan, which conforms to all current regulations of the New York and Toronto stock exchanges. Under the 2006 StockOption Plan, which replaces the Company’s 2004 Stock Option Plan, the Company may issue up to 6,000,000 common shares on theexercise of stock options granted to eligible employees, officers and consultants. The Company’s non-executive directors are no longereligible to receive stock options, but instead a significant portion of each director’s annual retainer is paid in deferred share units(as described below). The Company has ceased to grant stock options under the 2004 Stock Option Plan, and the remaining1,132,137 common shares available for issuance under the 2004 Stock Option Plan were removed from the reserve.
Under the 2006 Stock Option Plan, all stock options granted will expire on the fifth anniversary of the grant date; however, if a stockoption expires during a blackout period (being a period during which the option holder is prohibited from trading in securities of theCompany), the term of the stock option will be automatically extended to 10 business days following the end of the blackout period. Theexercise price of any stock options granted will be not less than the weighted average trading price of the Company’s common shares forthe five trading days immediately preceding the grant date. The Company will use reserved and unissued common shares to satisfy itsobligations under the 2006 Stock Option Plan.
Stock options generally vest and become exercisable as follows:
• Recruiting — 25% per year on each of the first through fourth anniversaries of the grant date; and
• Incentive — 25% on the date of grant, and 25% per year on each of the first through third anniversaries of the grant date.
Current year’s stock-based compensation expense under SFAS 123R
The Company recognizes stock-based compensation expense over the requisite service period of the individual grants, which generallyequals the vesting period. SFAS 123R requires forfeitures to be estimated at the time of grant and revised, if necessary, in subsequentperiods if actual forfeitures differ from those estimates. Stock-based compensation is expensed on a straight-line basis over the requisiteservice period.
For 2006, the Company recorded total stock-based compensation expense related to stock options as follows:
2006
Cost of goods sold . . . . . . . . . . . . . . . . . . . . . . . . . . . . . . . . . . . . . . . . . . . . . . . . . . . . . . . . . . . . . . . . . $ 1,072Research and development expenses . . . . . . . . . . . . . . . . . . . . . . . . . . . . . . . . . . . . . . . . . . . . . . . . . . . . . . 1,834Selling, general and administrative expenses . . . . . . . . . . . . . . . . . . . . . . . . . . . . . . . . . . . . . . . . . . . . . . . . . 11,888
$14,794
As a result of adopting SFAS 123R on January 1, 2006, the Company’s net income for 2006 was $14,647,000 lower than if it hadcontinued to account for stock-based compensation under APB 25. Both basic and diluted earnings per share for 2006 were $0.09 lowerthan if the Company had continued to account for stock-based compensation under APB 25.
F-32
113

BIOVAIL CORPORATION
NOTES TO CONSOLIDATED FINANCIAL STATEMENTS (Continued)
In accordance with United States generally accepted accounting principles(All tabular dollar amounts expressed in thousands of U.S. dollars, except per share data)
December 31, 2006
16. SHAREHOLDERS’ EQUITY (Continued)
Prior years’ pro forma information under SFAS 123
For 2005 and 2004, the following table presents the Company’s pro forma net income and earnings per share as if the fair value-basedmethod of SFAS 123 had been applied for all stock options granted:
2005 2004
As Restated — As Restated —See Note 3 See Note 3
Net income as reported . . . . . . . . . . . . . . . . . . . . . . . . . . . . . . . . . . . . . . . . . . . . . . $246,440 $159,799Pro forma stock-based compensation expense determined under
fair value-based method . . . . . . . . . . . . . . . . . . . . . . . . . . . . . . . . . . . . . . . . . . . . (4,447) (20,403)
Pro forma net income . . . . . . . . . . . . . . . . . . . . . . . . . . . . . . . . . . . . . . . . . . . . . . . $241,993 $139,396
Basic and diluted earnings per shareAs reported . . . . . . . . . . . . . . . . . . . . . . . . . . . . . . . . . . . . . . . . . . . . . . . . . . . . . $ 1.54 $ 1.00Pro forma . . . . . . . . . . . . . . . . . . . . . . . . . . . . . . . . . . . . . . . . . . . . . . . . . . . . . . $ 1.52 $ 0.88
Under SFAS 123, the Company recognized forfeitures as they occurred. As a result, pro forma stock-based compensation expense in2005 reflected the forfeiture of 1,785,119 (2004 — 299,700) stock options by certain former officers and employees upon their departurefrom the Company.
Valuation assumptions
The fair values of all stock options granted in 2006, 2005 and 2004 were estimated as of the date of grant using the Black-Scholesoption-pricing model with the following weighted-average assumptions:
2006 2005 2004
Expected option life (years) . . . . . . . . . . . . . . . . . . . . . . . . . . . . . . . . . . . . . . . . . . . . . . . . 4.0 4.0 4.0Expected volatility . . . . . . . . . . . . . . . . . . . . . . . . . . . . . . . . . . . . . . . . . . . . . . . . . . . . . . 52.9% 53.3% 55.8%Risk-free interest rate . . . . . . . . . . . . . . . . . . . . . . . . . . . . . . . . . . . . . . . . . . . . . . . . . . . . 4.2% 3.7% 3.7%Expected dividend yield . . . . . . . . . . . . . . . . . . . . . . . . . . . . . . . . . . . . . . . . . . . . . . . . . . . 2.2% — % — %
Expected option life is determined based on historical exercise and forfeiture patterns. Expected volatility is determined based onhistorical volatility of the Company’s common shares over the expected life of the option. The risk-free interest rate is determined basedon the rate at the time of grant for zero-coupon Canadian government bonds with a remaining term equal to the expected life of theoption. Dividend yield is based on the stock option’s exercise price and expected annual dividend rate at the time of grant.
The Black-Scholes option-pricing model used by the Company to calculate option values was developed to estimate the fair value offreely tradeable, fully transferable options without vesting restrictions, which significantly differ from the Company’s stock optionawards. This model also requires highly subjective assumptions, including future stock price volatility and expected time until exercise,which greatly affect the calculated values.
F-33
114
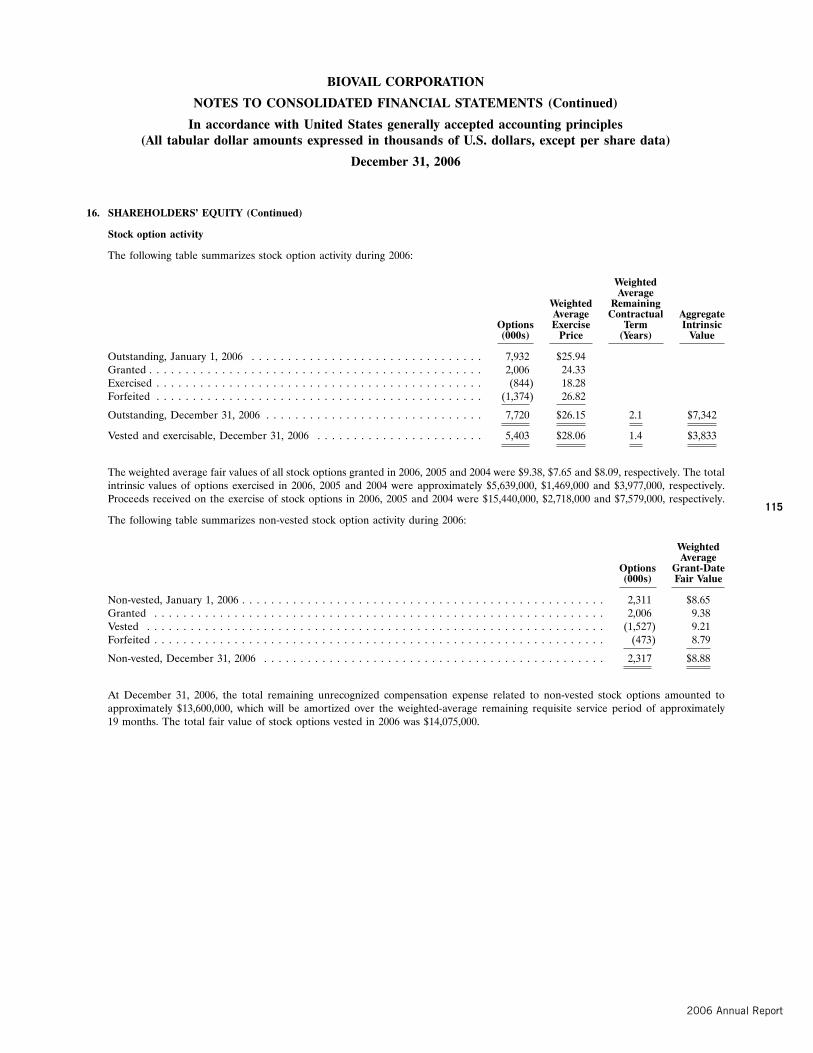
BIOVAIL CORPORATION
NOTES TO CONSOLIDATED FINANCIAL STATEMENTS (Continued)
In accordance with United States generally accepted accounting principles(All tabular dollar amounts expressed in thousands of U.S. dollars, except per share data)
December 31, 2006
16. SHAREHOLDERS’ EQUITY (Continued)
Stock option activity
The following table summarizes stock option activity during 2006:
WeightedAverage
Weighted RemainingAverage Contractual Aggregate
Options Exercise Term Intrinsic(000s) Price (Years) Value
Outstanding, January 1, 2006 . . . . . . . . . . . . . . . . . . . . . . . . . . . . . . . . 7,932 $25.94Granted . . . . . . . . . . . . . . . . . . . . . . . . . . . . . . . . . . . . . . . . . . . . . . 2,006 24.33Exercised . . . . . . . . . . . . . . . . . . . . . . . . . . . . . . . . . . . . . . . . . . . . . (844) 18.28Forfeited . . . . . . . . . . . . . . . . . . . . . . . . . . . . . . . . . . . . . . . . . . . . . (1,374) 26.82
Outstanding, December 31, 2006 . . . . . . . . . . . . . . . . . . . . . . . . . . . . . . 7,720 $26.15 2.1 $7,342
Vested and exercisable, December 31, 2006 . . . . . . . . . . . . . . . . . . . . . . . 5,403 $28.06 1.4 $3,833
The weighted average fair values of all stock options granted in 2006, 2005 and 2004 were $9.38, $7.65 and $8.09, respectively. The totalintrinsic values of options exercised in 2006, 2005 and 2004 were approximately $5,639,000, $1,469,000 and $3,977,000, respectively.Proceeds received on the exercise of stock options in 2006, 2005 and 2004 were $15,440,000, $2,718,000 and $7,579,000, respectively.
The following table summarizes non-vested stock option activity during 2006:
WeightedAverage
Options Grant-Date(000s) Fair Value
Non-vested, January 1, 2006 . . . . . . . . . . . . . . . . . . . . . . . . . . . . . . . . . . . . . . . . . . . . . . . . . . 2,311 $8.65Granted . . . . . . . . . . . . . . . . . . . . . . . . . . . . . . . . . . . . . . . . . . . . . . . . . . . . . . . . . . . . . . 2,006 9.38Vested . . . . . . . . . . . . . . . . . . . . . . . . . . . . . . . . . . . . . . . . . . . . . . . . . . . . . . . . . . . . . . . (1,527) 9.21Forfeited . . . . . . . . . . . . . . . . . . . . . . . . . . . . . . . . . . . . . . . . . . . . . . . . . . . . . . . . . . . . . . (473) 8.79
Non-vested, December 31, 2006 . . . . . . . . . . . . . . . . . . . . . . . . . . . . . . . . . . . . . . . . . . . . . . . 2,317 $8.88
At December 31, 2006, the total remaining unrecognized compensation expense related to non-vested stock options amounted toapproximately $13,600,000, which will be amortized over the weighted-average remaining requisite service period of approximately19 months. The total fair value of stock options vested in 2006 was $14,075,000.
F-34
115
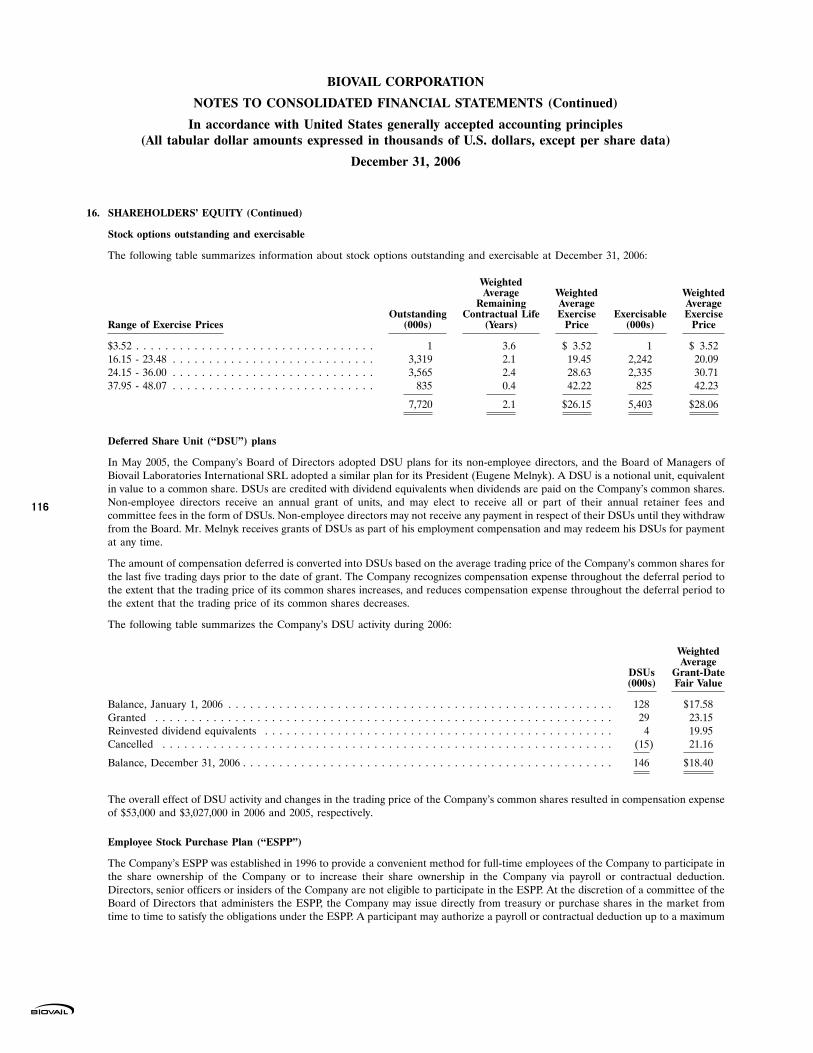
BIOVAIL CORPORATION
NOTES TO CONSOLIDATED FINANCIAL STATEMENTS (Continued)
In accordance with United States generally accepted accounting principles(All tabular dollar amounts expressed in thousands of U.S. dollars, except per share data)
December 31, 2006
16. SHAREHOLDERS’ EQUITY (Continued)
Stock options outstanding and exercisable
The following table summarizes information about stock options outstanding and exercisable at December 31, 2006:
WeightedAverage Weighted Weighted
Remaining Average AverageOutstanding Contractual Life Exercise Exercisable Exercise
Range of Exercise Prices (000s) (Years) Price (000s) Price
$3.52 . . . . . . . . . . . . . . . . . . . . . . . . . . . . . . . . . 1 3.6 $ 3.52 1 $ 3.5216.15 - 23.48 . . . . . . . . . . . . . . . . . . . . . . . . . . . . 3,319 2.1 19.45 2,242 20.0924.15 - 36.00 . . . . . . . . . . . . . . . . . . . . . . . . . . . . 3,565 2.4 28.63 2,335 30.7137.95 - 48.07 . . . . . . . . . . . . . . . . . . . . . . . . . . . . 835 0.4 42.22 825 42.23
7,720 2.1 $26.15 5,403 $28.06
Deferred Share Unit (‘‘DSU’’) plans
In May 2005, the Company’s Board of Directors adopted DSU plans for its non-employee directors, and the Board of Managers ofBiovail Laboratories International SRL adopted a similar plan for its President (Eugene Melnyk). A DSU is a notional unit, equivalentin value to a common share. DSUs are credited with dividend equivalents when dividends are paid on the Company’s common shares.Non-employee directors receive an annual grant of units, and may elect to receive all or part of their annual retainer fees andcommittee fees in the form of DSUs. Non-employee directors may not receive any payment in respect of their DSUs until they withdrawfrom the Board. Mr. Melnyk receives grants of DSUs as part of his employment compensation and may redeem his DSUs for paymentat any time.
The amount of compensation deferred is converted into DSUs based on the average trading price of the Company’s common shares forthe last five trading days prior to the date of grant. The Company recognizes compensation expense throughout the deferral period tothe extent that the trading price of its common shares increases, and reduces compensation expense throughout the deferral period tothe extent that the trading price of its common shares decreases.
The following table summarizes the Company’s DSU activity during 2006:
WeightedAverage
DSUs Grant-Date(000s) Fair Value
Balance, January 1, 2006 . . . . . . . . . . . . . . . . . . . . . . . . . . . . . . . . . . . . . . . . . . . . . . . . . . . . . 128 $17.58Granted . . . . . . . . . . . . . . . . . . . . . . . . . . . . . . . . . . . . . . . . . . . . . . . . . . . . . . . . . . . . . . . 29 23.15Reinvested dividend equivalents . . . . . . . . . . . . . . . . . . . . . . . . . . . . . . . . . . . . . . . . . . . . . . . . 4 19.95Cancelled . . . . . . . . . . . . . . . . . . . . . . . . . . . . . . . . . . . . . . . . . . . . . . . . . . . . . . . . . . . . . . (15) 21.16
Balance, December 31, 2006 . . . . . . . . . . . . . . . . . . . . . . . . . . . . . . . . . . . . . . . . . . . . . . . . . . . 146 $18.40
The overall effect of DSU activity and changes in the trading price of the Company’s common shares resulted in compensation expenseof $53,000 and $3,027,000 in 2006 and 2005, respectively.
Employee Stock Purchase Plan (‘‘ESPP’’)
The Company’s ESPP was established in 1996 to provide a convenient method for full-time employees of the Company to participate inthe share ownership of the Company or to increase their share ownership in the Company via payroll or contractual deduction.Directors, senior officers or insiders of the Company are not eligible to participate in the ESPP. At the discretion of a committee of theBoard of Directors that administers the ESPP, the Company may issue directly from treasury or purchase shares in the market fromtime to time to satisfy the obligations under the ESPP. A participant may authorize a payroll or contractual deduction up to a maximum
F-35
116

BIOVAIL CORPORATION
NOTES TO CONSOLIDATED FINANCIAL STATEMENTS (Continued)
In accordance with United States generally accepted accounting principles(All tabular dollar amounts expressed in thousands of U.S. dollars, except per share data)
December 31, 2006
16. SHAREHOLDERS’ EQUITY (Continued)
of 10% of the base salary or remuneration to be received during any purchase period. The purchase price is 90% of the closing tradingprice of the Company’s common shares on the date on which the offering period ends.
Dividends declared
In 2006 and 2005, the Company declared total cash dividends to shareholders of $160,284,000 ($1.00 per share) and $79,779,000 ($0.50per share), respectively. No dividends were declared in 2004.
Accumulated other comprehensive income
The components of accumulated other comprehensive income were as follows:
Net UnrealizedHolding
Foreign Gain/(Loss) onCurrency Available-
Translation For-SaleAdjustment Investments Total
As Restated — As Restated —See Note 3 See Note 3
Balance, January 1, 2004 . . . . . . . . . . . . . . . . . . . . . . . . . . . . . . . . . $20,697 $ 20,790 $41,487Other comprehensive income (loss) . . . . . . . . . . . . . . . . . . . . . . . . . . 11,665 (7,018) 4,647
Balance, December 31, 2004 . . . . . . . . . . . . . . . . . . . . . . . . . . . . . . . 32,362 13,772 46,134Other comprehensive income . . . . . . . . . . . . . . . . . . . . . . . . . . . . . . 2,386 2,465 4,851
Balance, December 31, 2005 . . . . . . . . . . . . . . . . . . . . . . . . . . . . . . . 34,748 16,237 50,985Other comprehensive income (loss) . . . . . . . . . . . . . . . . . . . . . . . . . . 2,516 (10,393) (7,877)
Balance, December 31, 2006 . . . . . . . . . . . . . . . . . . . . . . . . . . . . . . . $37,264 $ 5,844 $43,108
17. ASSET IMPAIRMENTS, NET OF GAIN ON DISPOSAL
2006
In September 2006, the Company recorded a $147,000,000 impairment charge to write down the intangible assets associated with itsVasotec� and Vaseretic�, and Glumetza� product lines (as described in note 10).
In July 2006, the Company terminated an April 2003 agreement with Athpharma Limited (‘‘Athpharma’’), whereby the Company hadacquired four cardiovascular products under development. Athpharma reacquired those products from the Company for cashconsideration of $4,000,000, which resulted in a corresponding gain on disposal of intangible assets, as the Company had expensed theoriginal cost of the acquired products at date of acquisition. The Company may be entitled to additional consideration of up to$2,000,000 subject to certain developmental milestones, as well as payments based on any future net sales of these products. TheCompany will only recognize any potential future consideration as additional proceeds on disposal when realized. The Company alsoobtained an option to license certain intellectual property from Athpharma.
2005
In December 2005, the Company recorded a $2,670,000 impairment charge to write down its investment in Series D Preferred Units ofReliant Pharmaceuticals, LLC (‘‘Reliant’’). The Company’s assessment at that time of the financial performance of Reliant comparedwith its business plans, as well as its financial condition and earnings prospects, indicated that the $8,929,000 carrying value of thisinvestment might not be fully realized in the foreseeable future.
In June 2005, the Company wrote off its $727,000 investment in convertible debentures of Procyon Biopharma Inc., following a decisionto terminate its license agreement for Fibrostat.
In May 2005, the Company recorded a $25,507,000 impairment charge on the transfer of the Teveten and Teveten HCT product rights toKos (as described in note 4), as well as related costs to transfer of $326,000.
F-36
117

BIOVAIL CORPORATION
NOTES TO CONSOLIDATED FINANCIAL STATEMENTS (Continued)
In accordance with United States generally accepted accounting principles(All tabular dollar amounts expressed in thousands of U.S. dollars, except per share data)
December 31, 2006
17. ASSET IMPAIRMENTS, NET OF GAIN ON DISPOSAL (Continued)
2004
In December 2004, the Company recorded a $37,802,000 impairment charge to write down its investment in Ethypharm (as described innote 8).
In November 2004, following a decision not to reformulate the Rondec product line, the Company recorded a $4,354,000 impairmentcharge to write off the remaining carrying value of the related product rights.
In July 2004, the Company received proceeds of $3,000,000 on the sale of the Cedax product rights, which resulted in a gain on disposalof $1,471,000.
18. LITIGATION SETTLEMENTS
2006
Wellbutrin XL� . . . . . . . . . . . . . . . . . . . . . . . . . . . . . . . . . . . . . . . . . . . . . . . . . . . . . . . . . . . . . . . . . . . $11,667Adalat CC . . . . . . . . . . . . . . . . . . . . . . . . . . . . . . . . . . . . . . . . . . . . . . . . . . . . . . . . . . . . . . . . . . . . . . . 2,733
$14,400
Wellbutrin XL�
In February 2007, GSK reached a settlement with Andrx Corporation (‘‘Andrx’’) (which was acquired by Watson Pharmaceuticals, Inc.(‘‘Watson’’) in November 2006) related to a patent infringement suit by Andrx in respect to its U.S. patent purportedly covering 150mgWellbutrin XL� product. GSK agreed to make a one-time payment of $35,000,000 to Andrx, while Andrx granted GSK a royalty-bearinglicense to its patent. Under the terms of the Wellbutrin XL� agreement with GSK, the Company agreed to reimburse GSK for one-thirdof the payment to Andrx, which was accrued at December 31, 2006, and to pay one-third of the ongoing royalty on sales of 150mgWellbutrin XL� product.
Adalat CC
At December 31, 2006, the Company accrued its one-third share of the total consideration to be paid to settle certain claims related tothe Company’s licensing of Adalat CC generic products from Elan Corporation plc (‘‘Elan’’) (as described in note 23).
19. ACQUIRED RESEARCH AND DEVELOPMENT
In July 2003, the Company and Pharma Pass II, LLC (‘‘PPII’’) formed BNC-PHARMAPASS, LLC (‘‘BNC-Pharmapass’’) to advancethe development of certain products. In 2004, the Company acquired PPII’s remaining interest in BNC-Pharmapass. At the date ofacquisition, the increase in the Company’s share of the fair values of the products under development by BNC-Pharmapass resulted in acharge of $8,640,000 to acquired research and development expense.
F-37
118

BIOVAIL CORPORATION
NOTES TO CONSOLIDATED FINANCIAL STATEMENTS (Continued)
In accordance with United States generally accepted accounting principles(All tabular dollar amounts expressed in thousands of U.S. dollars, except per share data)
December 31, 2006
20. INCOME TAXES
The components of the provision for income taxes were as follows:
2006 2005 2004
CurrentDomestic . . . . . . . . . . . . . . . . . . . . . . . . . . . . . . . . . . . . . . . . . . . . . . . . . . . . . . . . . . $ 30 $ 450 $ 485Foreign . . . . . . . . . . . . . . . . . . . . . . . . . . . . . . . . . . . . . . . . . . . . . . . . . . . . . . . . . . . 14,470 22,100 8,465
14,500 22,550 8,950
DeferredDomestic . . . . . . . . . . . . . . . . . . . . . . . . . . . . . . . . . . . . . . . . . . . . . . . . . . . . . . . . . . — — —Foreign . . . . . . . . . . . . . . . . . . . . . . . . . . . . . . . . . . . . . . . . . . . . . . . . . . . . . . . . . . . — — —
— — —
$14,500 $22,550 $8,950
The reported provision for income taxes differs from the expected amount calculated by applying the Company’s Canadian statutoryrate to income before provision for income taxes. The reasons for this difference and the related tax effects are as follows:
2006 2005 2004
As Restated — As Restated — As Restated —See Note 3 See Note 3 See Note 3
Income from continuing operations before provision for income taxes . . . . . $ 229,974 $ 279,565 $ 173,964Loss from discontinued operation . . . . . . . . . . . . . . . . . . . . . . . . . . . (3,848) (10,575) (5,215)
Income before provision for income taxes . . . . . . . . . . . . . . . . . . . . . . 226,126 268,990 168,749Expected Canadian statutory rate . . . . . . . . . . . . . . . . . . . . . . . . . . . . 36.3% 36.5% 36.5%
Expected provision for income taxes . . . . . . . . . . . . . . . . . . . . . . . . . . 82,084 98,181 61,593Non-deductible amounts:
Amortization . . . . . . . . . . . . . . . . . . . . . . . . . . . . . . . . . . . . . . . 22,656 22,725 23,472Equity loss . . . . . . . . . . . . . . . . . . . . . . . . . . . . . . . . . . . . . . . . . 324 423 1,525Intangible asset impairments . . . . . . . . . . . . . . . . . . . . . . . . . . . . . 53,390 — —Acquired research and development . . . . . . . . . . . . . . . . . . . . . . . . — — 3,154
Foreign tax rate differences . . . . . . . . . . . . . . . . . . . . . . . . . . . . . . . (172,127) (156,463) (163,648)Unrecognized income tax benefit of losses . . . . . . . . . . . . . . . . . . . . . . 18,106 42,921 78,991Withholding taxes on foreign income . . . . . . . . . . . . . . . . . . . . . . . . . 4,943 3,900 —Other . . . . . . . . . . . . . . . . . . . . . . . . . . . . . . . . . . . . . . . . . . . . . 5,124 10,863 3,863
$ 14,500 $ 22,550 $ 8,950
Income taxes paid amounted to $10,960,000, $9,242,000 and $8,195,000 in 2006, 2005 and 2004, respectively. Stock option exercises didnot impact taxes paid in 2006, 2005 and 2004.
The Company has provided for foreign withholding taxes on the portion of undistributed earnings of foreign subsidiaries expected tobe remitted.
F-38
119

BIOVAIL CORPORATION
NOTES TO CONSOLIDATED FINANCIAL STATEMENTS (Continued)
In accordance with United States generally accepted accounting principles(All tabular dollar amounts expressed in thousands of U.S. dollars, except per share data)
December 31, 2006
20. INCOME TAXES (Continued)
Deferred income taxes have been provided for on the following temporary differences:
2006 2005
Deferred tax assetsTax loss carryforwards . . . . . . . . . . . . . . . . . . . . . . . . . . . . . . . . . . . . . . . . . . . . . . . . . . . . . . $ 184,796 $ 187,485Scientific Research and Experimental Development pool . . . . . . . . . . . . . . . . . . . . . . . . . . . . . . . . 50,074 49,451Investment tax credits . . . . . . . . . . . . . . . . . . . . . . . . . . . . . . . . . . . . . . . . . . . . . . . . . . . . . . 36,413 34,236Provisions . . . . . . . . . . . . . . . . . . . . . . . . . . . . . . . . . . . . . . . . . . . . . . . . . . . . . . . . . . . . . 26,103 34,022Plant, equipment and technology . . . . . . . . . . . . . . . . . . . . . . . . . . . . . . . . . . . . . . . . . . . . . . . 16,007 17,503Deferred revenue . . . . . . . . . . . . . . . . . . . . . . . . . . . . . . . . . . . . . . . . . . . . . . . . . . . . . . . . . 9,081 11,856Intangible assets . . . . . . . . . . . . . . . . . . . . . . . . . . . . . . . . . . . . . . . . . . . . . . . . . . . . . . . . . 867 —Deferred financing and share issue costs . . . . . . . . . . . . . . . . . . . . . . . . . . . . . . . . . . . . . . . . . . — 240Other . . . . . . . . . . . . . . . . . . . . . . . . . . . . . . . . . . . . . . . . . . . . . . . . . . . . . . . . . . . . . . . . 3,141 2,480
Total deferred tax assets . . . . . . . . . . . . . . . . . . . . . . . . . . . . . . . . . . . . . . . . . . . . . . . . . . . . 326,482 337,273Less valuation allowance . . . . . . . . . . . . . . . . . . . . . . . . . . . . . . . . . . . . . . . . . . . . . . . . . . . . (325,105) (333,942)
Net deferred tax assets . . . . . . . . . . . . . . . . . . . . . . . . . . . . . . . . . . . . . . . . . . . . . . . . . . . . . 1,377 3,331
Deferred tax liabilitiesPrepaid expenses . . . . . . . . . . . . . . . . . . . . . . . . . . . . . . . . . . . . . . . . . . . . . . . . . . . . . . . . . 456 1,738Deferred financing and share issue costs . . . . . . . . . . . . . . . . . . . . . . . . . . . . . . . . . . . . . . . . . . 531 —Intangible assets . . . . . . . . . . . . . . . . . . . . . . . . . . . . . . . . . . . . . . . . . . . . . . . . . . . . . . . . . — 964Other . . . . . . . . . . . . . . . . . . . . . . . . . . . . . . . . . . . . . . . . . . . . . . . . . . . . . . . . . . . . . . . . 390 629
Total deferred tax liabilities . . . . . . . . . . . . . . . . . . . . . . . . . . . . . . . . . . . . . . . . . . . . . . . . . . 1,377 3,331
Net deferred income taxes . . . . . . . . . . . . . . . . . . . . . . . . . . . . . . . . . . . . . . . . . . . . . . . . . . . $ — $ —
The realization of deferred tax assets is dependent on the Company generating sufficient domestic and foreign taxable income in theyears that the temporary differences become deductible. A valuation allowance has been provided for the portion of the deferred taxassets that the Company determined is more likely than not to remain unrealized based on estimated future taxable income and taxplanning strategies. In 2006, the valuation allowance decreased by $8,837,000 due mainly to enacted tax rate reductions and partialutilization of tax loss carryforwards. In 2005, the valuation allowance increased by $49,862,000, due mainly to higher accumulated taxlosses and tax credit carryforwards.
At December 31, 2006, the Company had accumulated tax losses of approximately $54,900,000 (2005 — $17,000,000) available forfederal purposes and approximately $70,400,000 (2005 — $52,700,000) available for provincial purposes in Canada, which expire from2009 to 2027. The Company also had approximately $37,700,000 (2005 — $32,900,000) of unclaimed Canadian investment tax credits,which expire from 2007 to 2027. These losses and investment tax credits can be used to offset future years’ taxable income and federaltax, respectively.
In addition, at December 31, 2006, the Company has pooled Scientific Research and Experimental Development (‘‘SR&ED’’)expenditures amounting to approximately $188,100,000 (2005 — $169,800,000) available to offset against future years’ taxable incomefrom its Canadian operations, which may be carried forward indefinitely.
On February 27, 2007, the Company issued a notice of redemption of all the outstanding Notes effective April 1, 2007 (as described innote 28). The payment of the U.S. dollar denominated Notes will likely result in a foreign exchange gain for Canadian income taxpurposes. The amount of this gain will depend on the exchange rate between the U.S. and Canadian dollars at the time the Notes arepaid. At December 31, 2006, the unrealized foreign exchange gain on the translation of the Notes to Canadian dollars for Canadianincome tax purposes was approximately $146,000,000. If the Notes had been paid at December 31, 2006, one-half of this foreignexchange gain would have been included in the Company’s Canadian taxable income, which would have resulted in a correspondingreduction in the Company’s available Canadian operating losses, SR&ED pool and/or investment tax credit carryforward balancesdisclosed above. The payment of the Notes will not result in a foreign exchange gain or loss being recognized in the Company’sconsolidated financial statements, as these statements are prepared in U.S. dollars.
F-39
120

BIOVAIL CORPORATION
NOTES TO CONSOLIDATED FINANCIAL STATEMENTS (Continued)
In accordance with United States generally accepted accounting principles(All tabular dollar amounts expressed in thousands of U.S. dollars, except per share data)
December 31, 2006
20. INCOME TAXES (Continued)
At December 31, 2006, the Company has accumulated tax losses of approximately $419,367,000 (2005 — $460,200,000) for federal andstate purposes in the U.S., which expire from 2008 to 2025. These losses can be used to offset future years’ taxable income. There maybe limitations on the annual utilization of these losses as a result of certain changes in ownership that have occurred, or that may occurin the future.
21. DISCONTINUED OPERATION
In September 2005, the Company’s Board of Directors committed to a plan to sell the Company’s Nutravail division. Nutravaildeveloped and manufactured nutraceutical and food-ingredient products. This business was not considered strategic to the Company’score pharmaceutical operations. The Company received an offer of $3,000,000 from Futuristic Brands USA, Inc. (‘‘Futuristic’’) topurchase the inventory and long-lived assets, including intellectual property, of Nutravail. On the consolidated balance sheet atDecember 31, 2005, the net assets of Nutravail were reported as held for sale at their estimated fair value of $3,000,000 based on thepurchase offer received. In 2005, the Company recorded a $5,570,000 impairment charge to write down the carrying values ofNutravail’s long-lived assets.
On May 2, 2006, the Company completed the sale of its Nutravail division to Futuristic. Under the terms of the final sale agreement, theCompany is entitled to future payments based on the net revenues generated from those assets by Futuristic for a period of 10 years. Asa result, at May 2, 2006, the net realized value of Nutravail’s inventory and long-lived assets was zero, as no consideration was receivedfrom Futuristic at the date of sale, and the Company did not attribute any value to the future payments. The Company recorded aninventory write-off of $1,304,000 to cost of goods sold, and an additional impairment charge to $1,084,000 to write off the remainingcarrying values of Nutravail’s long-lived assets. The Company does not have a reasonable basis to estimate the amount of the futurepayments it may receive because the Company does not have any significant continuing involvement in the operations of Nutravail. TheCompany will recognize any future payments as income once each payment is determinable and collection is reasonably assured, whichgenerally will be upon receipt of the cash payment.
Because of the distinct nature of its business, Nutravail had identifiable operations and cash flows that were clearly distinguishable fromthe rest of the Company. Subsequent to May 2, 2006, Nutravail’s operations and direct cash flows have been eliminated from theongoing operations of the Company as a result of the sale transaction. The extent to which the Company is involved in the operations ofNutravail is limited to the Company’s ability to receive indirect cash flows from the future payments. The Company has no continuingobligations in connection with the receipt of those payments, and those payments are not expected to be significant to the continuingoperations of either the Company or Nutravail. Accordingly, Nutravail has been reported as a discontinued operation in the Company’sconsolidated statements of income and cash flows.
For the period ended May 2, 2006, and years ended December 31, 2005 and 2004, the following revenue and expenses of Nutravail havebeen reclassified from continuing operations to loss from discontinued operation:
2006 2005 2004
REVENUEProduct sales . . . . . . . . . . . . . . . . . . . . . . . . . . . . . . . . . . . . . . . . . . . . . . . . . . . . . . . $ 774 $ 2,397 $ 4,344Research and development . . . . . . . . . . . . . . . . . . . . . . . . . . . . . . . . . . . . . . . . . . . . . . 69 1,042 1,173Royalty and other . . . . . . . . . . . . . . . . . . . . . . . . . . . . . . . . . . . . . . . . . . . . . . . . . . . . 446 2,093 1,870
1,289 5,532 7,387
EXPENSESCost of goods sold (including write-off of inventory: 2006 — $1,304; 2005 and 2004 — $ — ) . . . . . 2,160 4,202 6,343Research and development . . . . . . . . . . . . . . . . . . . . . . . . . . . . . . . . . . . . . . . . . . . . . . 1,263 1,931 2,111Selling, general and administration . . . . . . . . . . . . . . . . . . . . . . . . . . . . . . . . . . . . . . . . . 630 4,200 3,876Amortization . . . . . . . . . . . . . . . . . . . . . . . . . . . . . . . . . . . . . . . . . . . . . . . . . . . . . . . — 204 272
4,053 10,537 12,602
Loss from discontinued operation before asset impairments . . . . . . . . . . . . . . . . . . . . . . . . . (2,764) (5,005) (5,215)Asset impairments . . . . . . . . . . . . . . . . . . . . . . . . . . . . . . . . . . . . . . . . . . . . . . . . . . . (1,084) (5,570) —
Loss from discontinued operation . . . . . . . . . . . . . . . . . . . . . . . . . . . . . . . . . . . . . . . . . . $(3,848) $(10,575) $(5,215)
F-40
121

BIOVAIL CORPORATION
NOTES TO CONSOLIDATED FINANCIAL STATEMENTS (Continued)
In accordance with United States generally accepted accounting principles(All tabular dollar amounts expressed in thousands of U.S. dollars, except per share data)
December 31, 2006
22. EARNINGS PER SHARE
Earnings per share were calculated as follows:
2006 2005 2004
As Restated — As Restated — As Restated —See Note 3 See Note 3 See Note 3
Net income . . . . . . . . . . . . . . . . . . . . . . . . . . . . . . . . . . . . . . . . . . $211,626 $246,440 $159,799
Basic weighted average number of common shares outstanding (000s) . . . . . 160,060 159,433 159,115Dilutive effect of stock options (000s) . . . . . . . . . . . . . . . . . . . . . . . . . 18 248 143
Diluted weighted average number of common shares outstanding (000s) . . . 160,078 159,681 159,258
Basic and diluted earnings per share . . . . . . . . . . . . . . . . . . . . . . . . . . $ 1.32 $ 1.54 $ 1.00
23. LEGAL PROCEEDINGS
From time to time, the Company becomes involved in various legal and administrative proceedings, which include product liability,intellectual property, antitrust, governmental and regulatory investigations and related private litigation. There are also ordinary courseemployment related issues and other types of claims in which the Company routinely becomes involved but which individually andcollectively are not material.
Unless otherwise indicated, the Company cannot reasonably predict the outcome of these legal proceedings, nor can it estimate theamount of loss, or range of loss, if any, that may result from these proceedings. An adverse outcome in certain of these proceedingscould have a material adverse effect on the Company’s results of operations, financial condition or cash flows.
From time to time, the Company also initiates actions or files counterclaims. The Company could be subject to counterclaims or othersuits in response to other actions it may initiate. The Company cannot reasonably predict the outcome of these proceedings, some ofwhich can involve significant legal fees. The Company believes that the prosecution of these actions and counterclaims is important topreserve and protect the Company, its reputation and its assets.
Biovail Action Against S.A.C. and Others
On February 22, 2006, Biovail filed a lawsuit in Superior Court, Essex County, New Jersey, seeking $4,600,000,000 in damages from22 defendants. The complaint alleges that the defendants participated in a stock market manipulation scheme that negatively affectedthe market price of Biovail shares. The complaint alleges violations of various state laws, including the New Jersey Racketeer Influencedand Corrupt Organizations Act (RICO), pursuant to which treble damages may be available.
Defendants include: S.A.C. Capital Management, LLC, S.A.C. Capital Advisors, LLC, S.A.C. Capital Associates, LLC, S.A.C. HealthcoFunds, LLC, Sigma Capital Management, LLC, Steven A. Cohen, Arthur Cohen, Joseph Healey, Timothy McCarthy, David Maris,Gradient Analytics, Inc., Camelback Research Alliance, Inc., James Carr Bettis, Donn Vickrey, Pinnacle Investment Advisors, LLC,Helios Equity Fund, LLC, Hallmark Funds, Gerson Lehrman Group, Gerson Lehrman Group Brokerage Services, LLC, ThomasLehrman, Patrick Duff, and James Lyle. The defendant Hallmark Funds has been voluntarily dismissed from the action bythe Company.
The lawsuit is in its early stages. While it had been removed from New Jersey State Court to Federal Court by the defendants, it has nowbeen remanded back to the New Jersey State Court. No discovery has been conducted. All but one defendant has moved to dismiss thecomplaint. These motions have yet to be heard by the Court. The time for the defendant Maris to move to dismiss or answer thecomplaint has been extended, and he is expected to move to dismiss the complaint at that time.
Intellectual Property
On February 3, 2006, the Company and Laboratoires Des Produits Ethiques Ethypharm instituted an action against Sandoz Canada Inc.(‘‘Sandoz’’) and Andrx Corporation and Andrx Pharmaceuticals Inc. (collectively, the ‘‘Andrx Group’’) stating that certain patentsapplicable to Tiazac� have been infringed contrary to the Patent Act (Canada). In addition, the Company is seeking injunctive reliefrestraining the defendants from offering for sale and/or manufacturing in Canada any product covered by the Company’s patents and/orprocuring the infringement of the Company’s patents.
F-41
122
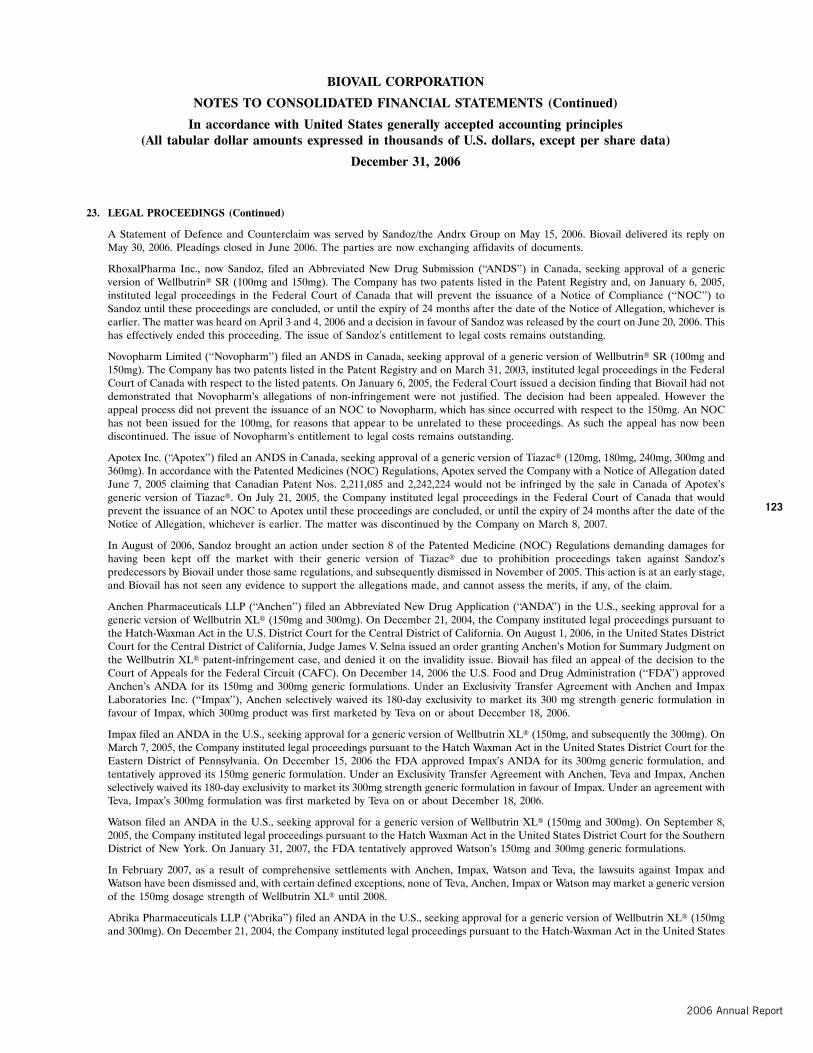
BIOVAIL CORPORATION
NOTES TO CONSOLIDATED FINANCIAL STATEMENTS (Continued)
In accordance with United States generally accepted accounting principles(All tabular dollar amounts expressed in thousands of U.S. dollars, except per share data)
December 31, 2006
23. LEGAL PROCEEDINGS (Continued)
A Statement of Defence and Counterclaim was served by Sandoz/the Andrx Group on May 15, 2006. Biovail delivered its reply onMay 30, 2006. Pleadings closed in June 2006. The parties are now exchanging affidavits of documents.
RhoxalPharma Inc., now Sandoz, filed an Abbreviated New Drug Submission (‘‘ANDS’’) in Canada, seeking approval of a genericversion of Wellbutrin� SR (100mg and 150mg). The Company has two patents listed in the Patent Registry and, on January 6, 2005,instituted legal proceedings in the Federal Court of Canada that will prevent the issuance of a Notice of Compliance (‘‘NOC’’) toSandoz until these proceedings are concluded, or until the expiry of 24 months after the date of the Notice of Allegation, whichever isearlier. The matter was heard on April 3 and 4, 2006 and a decision in favour of Sandoz was released by the court on June 20, 2006. Thishas effectively ended this proceeding. The issue of Sandoz’s entitlement to legal costs remains outstanding.
Novopharm Limited (‘‘Novopharm’’) filed an ANDS in Canada, seeking approval of a generic version of Wellbutrin� SR (100mg and150mg). The Company has two patents listed in the Patent Registry and on March 31, 2003, instituted legal proceedings in the FederalCourt of Canada with respect to the listed patents. On January 6, 2005, the Federal Court issued a decision finding that Biovail had notdemonstrated that Novopharm’s allegations of non-infringement were not justified. The decision had been appealed. However theappeal process did not prevent the issuance of an NOC to Novopharm, which has since occurred with respect to the 150mg. An NOChas not been issued for the 100mg, for reasons that appear to be unrelated to these proceedings. As such the appeal has now beendiscontinued. The issue of Novopharm’s entitlement to legal costs remains outstanding.
Apotex Inc. (‘‘Apotex’’) filed an ANDS in Canada, seeking approval of a generic version of Tiazac� (120mg, 180mg, 240mg, 300mg and360mg). In accordance with the Patented Medicines (NOC) Regulations, Apotex served the Company with a Notice of Allegation datedJune 7, 2005 claiming that Canadian Patent Nos. 2,211,085 and 2,242,224 would not be infringed by the sale in Canada of Apotex’sgeneric version of Tiazac�. On July 21, 2005, the Company instituted legal proceedings in the Federal Court of Canada that wouldprevent the issuance of an NOC to Apotex until these proceedings are concluded, or until the expiry of 24 months after the date of theNotice of Allegation, whichever is earlier. The matter was discontinued by the Company on March 8, 2007.
In August of 2006, Sandoz brought an action under section 8 of the Patented Medicine (NOC) Regulations demanding damages forhaving been kept off the market with their generic version of Tiazac� due to prohibition proceedings taken against Sandoz’spredecessors by Biovail under those same regulations, and subsequently dismissed in November of 2005. This action is at an early stage,and Biovail has not seen any evidence to support the allegations made, and cannot assess the merits, if any, of the claim.
Anchen Pharmaceuticals LLP (‘‘Anchen’’) filed an Abbreviated New Drug Application (‘‘ANDA’’) in the U.S., seeking approval for ageneric version of Wellbutrin XL� (150mg and 300mg). On December 21, 2004, the Company instituted legal proceedings pursuant tothe Hatch-Waxman Act in the U.S. District Court for the Central District of California. On August 1, 2006, in the United States DistrictCourt for the Central District of California, Judge James V. Selna issued an order granting Anchen’s Motion for Summary Judgment onthe Wellbutrin XL� patent-infringement case, and denied it on the invalidity issue. Biovail has filed an appeal of the decision to theCourt of Appeals for the Federal Circuit (CAFC). On December 14, 2006 the U.S. Food and Drug Administration (‘‘FDA’’) approvedAnchen’s ANDA for its 150mg and 300mg generic formulations. Under an Exclusivity Transfer Agreement with Anchen and ImpaxLaboratories Inc. (‘‘Impax’’), Anchen selectively waived its 180-day exclusivity to market its 300 mg strength generic formulation infavour of Impax, which 300mg product was first marketed by Teva on or about December 18, 2006.
Impax filed an ANDA in the U.S., seeking approval for a generic version of Wellbutrin XL� (150mg, and subsequently the 300mg). OnMarch 7, 2005, the Company instituted legal proceedings pursuant to the Hatch Waxman Act in the United States District Court for theEastern District of Pennsylvania. On December 15, 2006 the FDA approved Impax’s ANDA for its 300mg generic formulation, andtentatively approved its 150mg generic formulation. Under an Exclusivity Transfer Agreement with Anchen, Teva and Impax, Anchenselectively waived its 180-day exclusivity to market its 300mg strength generic formulation in favour of Impax. Under an agreement withTeva, Impax’s 300mg formulation was first marketed by Teva on or about December 18, 2006.
Watson filed an ANDA in the U.S., seeking approval for a generic version of Wellbutrin XL� (150mg and 300mg). On September 8,2005, the Company instituted legal proceedings pursuant to the Hatch Waxman Act in the United States District Court for the SouthernDistrict of New York. On January 31, 2007, the FDA tentatively approved Watson’s 150mg and 300mg generic formulations.
In February 2007, as a result of comprehensive settlements with Anchen, Impax, Watson and Teva, the lawsuits against Impax andWatson have been dismissed and, with certain defined exceptions, none of Teva, Anchen, Impax or Watson may market a generic versionof the 150mg dosage strength of Wellbutrin XL� until 2008.
Abrika Pharmaceuticals LLP (‘‘Abrika’’) filed an ANDA in the U.S., seeking approval for a generic version of Wellbutrin XL� (150mgand 300mg). On December 21, 2004, the Company instituted legal proceedings pursuant to the Hatch-Waxman Act in the United States
F-42
123

BIOVAIL CORPORATION
NOTES TO CONSOLIDATED FINANCIAL STATEMENTS (Continued)
In accordance with United States generally accepted accounting principles(All tabular dollar amounts expressed in thousands of U.S. dollars, except per share data)
December 31, 2006
23. LEGAL PROCEEDINGS (Continued)
District Court for the Southern District of Florida. If Abrika obtains FDA approval, it must wait for Anchen’s 180-day exclusivity periodto end before it can market its generic version of Wellbutrin XL�. Abrika brought a motion for summary judgment that was heard onNovember 2, 2005. Following the oral arguments on this motion in December 2005 and supplemental oral arguments on the motion inApril 2006, the Court stayed the motion in order to allow discovery to proceed and for further supplemental briefing. Final briefing isscheduled for July 2, 2007, however this date may change. If the court denies Abrika’s motion, the case will continue in its ordinarycourse.
On August 24, 2006, Biovail filed suit against the FDA in the United States District Court for the District of Columbia, relating toBiovail’s pending Citizen Petition filed with the FDA on December 20, 2005, concerning bioequivalence for extended-release genericversions of bupropion products.
On December 14, 2006, the FDA denied Biovail’s Citizen Petition and granted Anchen an ANDA to market a generic version ofWellbutrin XL�. On December 18, 2006, moved to amend and supplement its original complaint. That same day, Biovail filed a secondmotion requesting a temporary restraining order and a preliminary injunction. The district court has yet to rule on Biovail’s amendedcomplaint or second motion for a temporary restraining order and a preliminary injunction.
On December 18, 2006, Biovail filed suit against the FDA in the United States District Court for the District of Maryland, seeking tostay the effectiveness of the FDA’s approval of Impax’s manufacture of a 300-mg dosage of a generic version of Wellbutrin XL�
pursuant to an ANDA. Biovail argued that this approval violated Biovail’s right to a 30-month stay of ANDA approval under the Hatch-Waxman Amendments to the Food, Drug and Cosmetic Act.
The FDA, and intervenors Impax and Teva, filed answers to Biovail’s complaint on February 20, 2007. On February 21, 2007, the courtentered a scheduling order, setting a discovery deadline of July 6, 2007, at which time the parties are required to submit a joint statusreport to the court. The Company’s settlement of its lawsuit with Impax referenced above effectively renders this lawsuit moot.
On July 7, 2005, the Company notified Kos that the Andrx Group had filed with the FDA an ANDA that would, if approved, allow theAndrx Group to market a generic version of the Cardizem� LA product. The Andrx Group’s notice letter to the Company alleged thatits proposed product would not infringe United States Patent Nos. 5,288,505 (’505) and 5,529,791 (’791), which are listed in the FDAOrange Book as covering Cardizem� LA, and that the ’505 patent was invalid. Under the terms of the Kos Agreements, if a genericdrug company files an ANDA, the Company has the first right to initiate a lawsuit, and Kos, in its discretion, may initiate suit if theCompany elects not to file suit.
On August 10, 2005, a lawsuit against the Andrx Group in the Company’s name was commenced in the United States District Court forthe District of Delaware (Civil Action No. 05-586). The complaint averred that Andrx Group’s filing of its ANDA constitutedinfringement of the ’791 patent. The Andrx Group’s Answer denied infringement of the ’791 patent and asserted affirmative defenses ofinvalidity. In addition, the Andrx Group counterclaimed for declaratory judgment of non-infringement and invalidity. The Andrx Groupsought no monetary relief, other than recovery of attorney fees and costs.
Upon receiving a second Paragraph IV certification from the Andrx Group directed to additional Cardizem� LA tablet strengths of 120,180, 240, 300, and 360mg added by an amendment to the Andrx Group’s ANDA, on October 14, 2005, a second complaint was filed inthe Company’s name in the United States District Court for the District of Delaware (Civil Action No. 05-730). The complaint averredthat the Andrx Group’s Amended ANDA constituted infringement of the ’791 patent. The Andrx Group’s Answer denied infringementof the ’791 patent and asserted affirmative defenses of invalidity. In addition, the Andrx Group counterclaimed for declaratoryjudgment of non-infringement and invalidity. The Andrx Group sought no monetary relief, other than recovery of attorney feesand costs.
On September 26, 2005, the Company received a third Paragraph IV certification from the Andrx Group regarding its Cardizem� LAtablets, 120, 180, 240, 300, 360, and 420mg. The certification sets forth allegations of non-infringement and invalidity of the 6,923,984(’984) patent that is also listed in the Orange Book and owned by the Company. No suit was brought against the Andrx Group forinfringement of the ’984 patent.
On September 19, 2006, a fourth patent, U.S. Patent 7,108,866, issued to the Company containing claims relating to Cardizem� LA. TheCompany subsequently listed the ’866 patent in the Orange Book and received a fourth paragraph IV certification from the AndrxGroup for all Cardizem� LA tablet strengths via an additional amendment to the Andrx Group’s ANDA. On October 4, 2006, a thirdcomplaint in the Company’s name was filed (Civil Action No. 06-620) in the United States District Court for the District of Delaware.The complaint averred that the Andrx Group’s amended ANDA constituted infringement of the ’866 patent.
F-43
124

BIOVAIL CORPORATION
NOTES TO CONSOLIDATED FINANCIAL STATEMENTS (Continued)
In accordance with United States generally accepted accounting principles(All tabular dollar amounts expressed in thousands of U.S. dollars, except per share data)
December 31, 2006
23. LEGAL PROCEEDINGS (Continued)
Civil actions 05-586, 05-730 and 06-620 have been consolidated by the Court for all purposes. Under a revised case schedule, fact andexpert discovery is scheduled to close on March 23, 2007, a Markman hearing is now scheduled for May 24, 2007 and trial is scheduledfor October 9, 2007. These dates, however, may change.
If the patents relating to Cardizem� LA are invalid, unenforceable or not infringed, the Andrx Group, subject to FDA approval, couldcommence producing and selling a generic version of the Cardizem� LA product.
Product liability
Biovail Pharmaceuticals Inc. (‘‘BPI’’) along with a number of other defendants has been named in two complaints — one in theSuperior Court of the State of California for the County of Los Angeles (January 4, 2002) and the other in the United States DistrictCourt or the Western District of Washington at Seattle (October 23, 2003) — alleging personal injuries arising from plaintiffs’ use ofDura-Vent, a product containing phenylpropanolamine and formerly marketed by BPI. The California case has been dismissed withoutprejudice. The Company has never been served with a complaint in the second case nor has there been any other form of activity in thisaction as it relates to the Company. For these reasons, the Company filed a motion seeking to be dismissed from the action, which theCourt granted on August 28, 2006.
Antitrust
Several class action or representative action complaints in multiple jurisdictions have been filed against the Company in which theplaintiffs have alleged that the Company has improperly impeded the approval of a generic form of Tiazac�. Those actions filed infederal courts have been transferred to, and in some cases consolidated or coordinated in, the United States District Court for theDistrict of Columbia. The Company believes that the complaints are without merit and that the Company’s actions were in accordancewith its rights as contained in the Hatch-Waxman Amendments and the law. Moreover, the Company’s position is that it is notresponsible for the Andrx Group’s inability to receive timely final marketing approval from the FDA for its generic Tiazac� consideringthat the Andrx Group product did not receive FDA approval for a lengthy period following the removal of all legal or regulatoryimpediments by the Company. The Court granted the Company’s Motion for Summary Judgment seeking to dismiss several of thoseactions, which the Federal plaintiffs have appealed. The Court has also granted the Company’s motion for Summary Judgment in afurther case filed in the United States District Court for the District of Columbia after Biovail’s Motion for Summary Judgment in theother federal actions had been fully briefed, and which has been appealed to the United States Court of Appeals for the District ofColumbia Circuit. This appeal, as well as the other appeals filed by Plaintiffs to the original lawsuits dismissed by the District Court,have been consolidated by the Court of Appeals. The Court has also set a briefing schedule for the consolidated appeals with briefing tobegin this year at the end of March and conclude by the end of May. The Company has brought the Court’s decision on Biovail’sMotion for Summary Judgment to the attention of the Superior Court of the State of California for Los Angeles County, the SuperiorCourt of California for the County of San Diego and the Superior Court of the State of California for the County of Alameda, whereseveral State Court actions are pending. The Superior Court for the County of San Diego directed that certain discovery concerning theAndrx Group’s regulatory problems that was already produced to the Federal plaintiffs be made available to the plaintiffs in that case.The Company complied with the Court’s direction and then moved to dismiss the amended complaint in the case. The Court grantedthe Company’s motion and dismissed the complaint with leave for the plaintiffs to file an amended complaint, which they have. TheCompany then moved to dismiss the amended complaint. The Court also granted that motion and dismissed the complaint withprejudice. The plaintiffs have moved the Court to reconsider its decision, which the Court denied. The Company has been notified thatthe Plaintiffs intend to appeal that decision. The actions in the other California courts are stayed pending the final disposition of thecases pending in the District of Columbia.
Several class action and individual action complaints in multiple jurisdictions have been commenced jointly against the Company, Elanand Teva relating to an agreement between the Company and Elan for the licensing of Adalat CC products from Elan. These actionswere transferred to the United States District Court for the District of Columbia. The agreement in question has since been dissolved asa result of a consent decree with the U.S. Federal Trade Commission. The Company believes these suits are without merit because,among other reasons, it is the Company’s position that any delay in the marketing or out-licensing of the Company’s Adalat CC productwas due to manufacturing difficulties the Company encountered and not because of any improper activity on its part. The Companyfiled a motion for the summary dismissal of these actions. The Court has denied the Company’s motion to dismiss the damage claimsbrought on behalf of a purported class of so-called ‘‘direct purchasers’’, generally consisting of distributors and large chain drug stores,but dismissed the claims of a class of consumers and ‘‘indirect purchasers’’. The remainder of the federal action is proceeding on themerits through the normal legal process. The consumer and ‘‘indirect purchasers’’ claims were refiled in the Superior Court of the State
F-44
125

BIOVAIL CORPORATION
NOTES TO CONSOLIDATED FINANCIAL STATEMENTS (Continued)
In accordance with United States generally accepted accounting principles(All tabular dollar amounts expressed in thousands of U.S. dollars, except per share data)
December 31, 2006
23. LEGAL PROCEEDINGS (Continued)
of California. All court dates in the California action were taken off calendar as the parties have reached agreement for a settlementsubject to completion of the necessary documentation and approval of the court. In general, the settlement calls for the certification of asettlement class consisting of all indirect purchases of 30mg or 60mg Adalat CC from October 1, 1999 to the present. The total paymentto be made by all the defendants is $8,200,000, which the defendants have agreed to pay in three equal shares. The Company’s one-thirdshare is $2,733,000. On March 21, 2006, the Company was advised that an additional claim in respect of this fact situation was filed byMaxi Drug Inc. d/b/a Brooks Pharmacy in the United States District Court, District of Columbia. The Company has accepted service ofthis complaint, and the case will proceed on the merits according to the schedule set by the Court in the related federal cases pending inthe District of Columbia.
Securities class actions
In late 2003 and early 2004, a number of securities class action complaints were filed in the United States District Court for theSouthern District of New York naming Biovail and certain officers and directors as defendants. On or about June 18, 2004, the plaintiffsfiled a Consolidated Amended Complaint (the ‘‘Complaint’’), alleging among other matters, that the defendants violated Sections 10(b)and 20(a) of the Securities Exchange Act of 1934 and Rule 10b-5 promulgated thereunder. The Company responded to the Complaintby filing a motion to dismiss, which the Court denied. Thereafter, the Company filed its Answer denying the allegations inthe Complaint.
On August 25, 2006, the plaintiffs filed a Consolidated Second Amended Class Action Complaint (‘‘Second Amended Complaint’’)under seal. The Second Amended Complaint alleges, among other matters, that the defendants violated Sections 10(b) and 20(a) of theSecurities Exchange Act of 1934 and Rule 10b-5 promulgated thereunder. More specifically, the Second Amended Complaint allegesthat the defendants made materially false and misleading statements that inflated the price of the Company’s stock between February 7,2003 and March 2, 2004. The plaintiffs seek to represent a class consisting of all persons, other than the defendants and their affiliates,who purchased the Company’s stock during that period. On October 16, 2006, the Company filed its Answer denying the allegations inthe Second Amended Complaint.
On February 28, 2006, the plaintiffs filed a motion for class certification. The Company has opposed that motion. That motion isexpected to be heard on March 23, 2007. Discovery in this case is ongoing, and the action is now proceeding on its merits throughnormal legal process. The Company continues to defend itself vigorously, but cannot predict the eventual outcome of the case.
On September 21, 2005, the Canadian Commercial Workers Industry Pension Plan commenced a securities class action in Canadaagainst Biovail and several of its officers. The action is purportedly prosecuted on behalf of all individuals other than the defendantswho purchased Biovail’s common stock between February 7, 2003 and March 2, 2004. The claim seeks damages in excess of$100,000,000 for misrepresentation and breaches of s. 134 of the Securities Act, R.S.O. 1990, c. S.5, and ss. 36 and 52 of the CompetitionAct, R.S. 1985, c. C-34, as well as class wide punitive and exemplary damages. The claim essentially relies on the same facts andallegations as those cited in the Complaint. The claim was served on the Company and named officers on September 29, 2005. Theplaintiffs have not taken any steps to certify the action as a class proceeding or otherwise to move it forward. The defendants intend toresist class certification and file a defence only following a decision on class certification.
Defamation and Tort
On April 29, 2003, Jerry I. Treppel, a former analyst at Banc of America Securities, commenced an action in the United States DistrictCourt for the Southern District of New York naming as defendants the Company and certain officers thereof, and against MichaelSitrick and Sitrick & Company, Inc. (in their capacities as consultants of the Company), in which he has alleged that he was defamed bythe defendants and that the Company’s actions resulted in damages to him by way of lost employment and employment opportunities.
The Company filed a motion to dismiss this action, which, after rehearing, the Court granted in substantial part. In response, theplaintiff filed a Second Amended Complaint on March 24, 2005, which essentially repeated the allegations and asserted that that alldefendants acted in concert and participated in the defamatory and other alleged misconduct.
On May 27, 2005, Eugene Melnyk, the Company’s Chairman, filed an answer to the Second Amended Complaint and a counterclaimagainst Mr. Treppel. This counterclaim alleges defamation, defamation per se, and civil conspiracy. Mr. Melnyk’s claims relate to,among other things, written and oral communications commencing in 2002 and continuing to the date of the counterclaim. Mr. Melnykalleged that Mr. Treppel’s statements caused damage to his professional and business reputation.
F-45
126

BIOVAIL CORPORATION
NOTES TO CONSOLIDATED FINANCIAL STATEMENTS (Continued)
In accordance with United States generally accepted accounting principles(All tabular dollar amounts expressed in thousands of U.S. dollars, except per share data)
December 31, 2006
23. LEGAL PROCEEDINGS (Continued)
Biovail and the named defendants, including Mr. Melnyk, filed a second motion to dismiss, directed at some of the claims. Mr. Treppelresponded with a motion to dismiss the counterclaim brought by Mr. Melnyk.
On August 30, 2005, the Court issued its order on those motions. The Court granted in part and denied in part the motion by the Biovaildefendants, and dismissed the case with prejudice against three of the five defendants. In the Order, the Judge further noted that theremaining claims against Biovail and the only remaining individual defendant, Mr. Melnyk, were limited to the defamation, tortiousinterference and civil conspiracy claims arising out of three statements he found to be susceptible of a defamatory meaning.
The Court also denied in part and granted in part Mr. Treppel’s motion to dismiss Mr. Melnyk’s counterclaims against him. Thiscounterclaim is therefore proceeding on certain of the claims of defamation and defamation per se made by Mr. Melnyk.
The case is currently in discovery.
General civil actions
Complaints have been filed by the City of New York, the State of Alabama, the State of Mississippi and a number of counties within theState of New York, claiming that the Company, and numerous other pharmaceutical companies, made fraudulent misstatementsconcerning the ‘‘average wholesale price’’ of their prescription drugs, resulting in alleged overpayments by the plaintiffs forpharmaceutical products sold by the companies.
Counsel for the City of New York and for all the counties in New York (other than Erie, Oswego and Schenectady) that had suedBiovail have voluntarily dismissed the Company and certain others of the named defendants on a without prejudice basis. Similarly, theState of Mississippi has voluntarily dismissed its claim against the Company and a number of defendants on a without prejudice basis.
In the case brought by the State of Alabama, the Company has answered the State’s Amended Complaint and discovery is ongoing. Thecases brought by the New York State counties of Oswego, Schenectady and Erie, each of which was originally brought in New York Statecourt, were removed by defendants to federal court on October 11, 2006. The Company answered the complaint in each case after theremoval to federal court. Remand motions are pending and no discovery is currently being taken in these removed cases.
Based on the information currently available, and given the small number of Biovail products at issue and the limited time frame inrespect of such sales, the Company anticipates that even if these actions were successful, any recovery against Biovail would likely notbe significant.
Governmental and regulatory inquiries
In July 2003, the Company received a subpoena from the U.S. Attorney’s Office for the District of Massachusetts (‘‘AODM’’) requestinginformation related to the promotional and marketing activities surrounding the commercial launch of Cardizem� LA. In particular, thesubpoena sought information relating to the Cardizem� LA Clinical Experience Program, titled P.L.A.C.E. (Proving L.A. ThroughClinical Experience). The Company has met with the AODM and have described the precautionary steps it took to ensure that theprogram met the applicable rules and regulations. These steps included relying on advice from various external advisors as well asrelying on a representation from the company Biovail engaged to design the program. The Company believes it has acted properly inconnection with the P.L.A.C.E. program and is cooperating fully with the AODM to resolve this matter; however, the Company cannotpredict the outcome or the timing of when this matter may be resolved.
On November 20, 2003, the Company received notification from the SEC indicating that the SEC would be conducting an informalinquiry relating to the Company’s financial reporting for the fiscal year 2003. On March 3, 2005, the Company received a subpoena fromthe SEC. The subpoena reflects the fact that the Commission has entered a formal order of investigation. The subpoena seeksinformation about the Company’s financial reporting for the fiscal year 2003. Also, the scope of the investigation became broader than itwas initially, and the period under review was extended to encompass the period January 1, 2001 to May 2004. The SEC alsosubpoenaed individual Company employees, who testified before the SEC. On March 17, 2006, the Company received a subpoena fromthe SEC related to, among other things, the trading and ownership of Biovail shares, which is consistent with the matters the OntarioSecurities Commission (‘‘OSC’’) is investigating as described below. The Company has received additional subpoenas from the SECrequesting additional documents, including documents relating to the Company’s production of documents to date. The Companycontinues to cooperate fully with the SEC by providing responsive documents and making Company representatives available.
F-46
127

BIOVAIL CORPORATION
NOTES TO CONSOLIDATED FINANCIAL STATEMENTS (Continued)
In accordance with United States generally accepted accounting principles(All tabular dollar amounts expressed in thousands of U.S. dollars, except per share data)
December 31, 2006
23. LEGAL PROCEEDINGS (Continued)
On Sept 28, 2006, Dec 5, 2006, and Jan 10, 2007, the Company signed tolling agreements with the SEC. The current tolling period endsJuly 31, 2007. The Company continues to cooperate fully with the SEC by providing responsive documents and making Companyrepresentatives available. The Company cannot predict either the outcome or the timing of when this matter may be resolved.
Recently, the Company was contacted by the United States Attorney’s Office for the Eastern District of New York, who informed theCompany that they were conducting an investigation into the same matters that the SEC is investigating. The Company is cooperatingfully with the investigation.
Over the last number of years, the Company has received a number of communications from the OSC relating to its disclosure, and/orseeking information pertaining to certain financial periods. The OSC had advised the Company that it is investigating, among otherthings, two issues relating to Biovail’s accounting and disclosure in 2003. The first is whether the Company improperly recognizedrevenue for accounting purposes in relation to its interim financial statements for each of the four quarters in 2003. The second iswhether the Company provided misleading disclosure in its press release dated October 3, 2003 concerning the reasons for Biovail’sforecast of a revenue shortfall in respect of the three-month period ending September 30, 2003. The OSC had also advised that it isinvestigating four issues relating to trading in the Company’s common shares. These issues include whether insiders of the Companycomplied with insider reporting requirements, and whether persons in a special relationship with the Company may have traded in theCompany’s shares with knowledge of undisclosed material information. The OSC also advised that it is investigating whether certaintransactions may have resulted in, or contributed to, a misleading appearance of trading activity in the Company’s securities during 2003and 2004, and whether certain registrants (who are past, or present, directors of Biovail) may have been in a conflict of interest inrelation to trading of the Company’s shares. Subsequently, the OSC advised the Company that it is also investigating whether theCompany has improperly recognized revenue for accounting purposes in relation to the financial statements filed by the Company foreach of the four quarters in 2001 and 2002 and related disclosure issues. The Company understands that these investigations remainongoing, and cannot predict the outcome or the timing of when this matter may be resolved.
Pursuant to a notice of hearing dated July 28, 2006, the staff of the OSC gave notice that an administrative hearing pursuant tosections 127 and 127.1 of the Ontario Securities Act would be held. The respondents in the hearing include Chairman Eugene Melnykand a former director of the Company, among others. The Company is not a party to this proceeding. The hearing is currentlyscheduled to be held during 2007.
24. COMMITMENTS AND CONTINGENCIES
Operating lease commitments
The Company leases certain facilities, vehicles and equipment under operating leases. Rental expense was $8,772,000, $10,415,000 and$10,300,000 in 2006, 2005 and 2004, respectively.
Minimum future rental payments under non-cancelable operating leases for the years ending December 31 are as follows:
2007 . . . . . . . . . . . . . . . . . . . . . . . . . . . . . . . . . . . . . . . . . . . . . . . . . . . . . . . . . . . . . . . . . . . . . . . . . . $ 6,2192008 . . . . . . . . . . . . . . . . . . . . . . . . . . . . . . . . . . . . . . . . . . . . . . . . . . . . . . . . . . . . . . . . . . . . . . . . . . 5,3422009 . . . . . . . . . . . . . . . . . . . . . . . . . . . . . . . . . . . . . . . . . . . . . . . . . . . . . . . . . . . . . . . . . . . . . . . . . . 4,4222010 . . . . . . . . . . . . . . . . . . . . . . . . . . . . . . . . . . . . . . . . . . . . . . . . . . . . . . . . . . . . . . . . . . . . . . . . . . 3,6142011 . . . . . . . . . . . . . . . . . . . . . . . . . . . . . . . . . . . . . . . . . . . . . . . . . . . . . . . . . . . . . . . . . . . . . . . . . . 3,574Thereafter . . . . . . . . . . . . . . . . . . . . . . . . . . . . . . . . . . . . . . . . . . . . . . . . . . . . . . . . . . . . . . . . . . . . . . . 11,438
Total minimum future rental payments . . . . . . . . . . . . . . . . . . . . . . . . . . . . . . . . . . . . . . . . . . . . . . . . . . . . . $34,609
Minimum future rental payments have not been reduced by the following sublease rentals due under non-cancelable subleases: 2007 —$698,000; 2008 — $547,000; and 2009 — $38,000.
Other commitments
Commitments related to capital expenditures totaled $3,100,000 at December 31, 2006.
F-47
128

BIOVAIL CORPORATION
NOTES TO CONSOLIDATED FINANCIAL STATEMENTS (Continued)
In accordance with United States generally accepted accounting principles(All tabular dollar amounts expressed in thousands of U.S. dollars, except per share data)
December 31, 2006
24. COMMITMENTS AND CONTINGENCIES (Continued)
Net sales of certain products of the Company are subject to royalties payable to third parties. Royalty expense recorded in cost of goodssold amounted to $6,883,000, $8,838,000 and $9,226,000 in 2006, 2005 and 2004, respectively.
Under certain licensing agreements, the Company may be required to make payments upon the achievement of specific developmental,regulatory, or commercial milestones. Because it is uncertain if and when these milestones will be achieved, the Company did not accruefor any of these payments at December 31, 2006.
Product liability insurance
The Company is self-insured for up to the first $12,500,000 of costs incurred relating to product liability claims arising during an annualpolicy period. The Company provides for unsettled reported losses and losses incurred but not reported based on an independentreview of all claims made against the Company. Accruals for estimated losses related to self-insurance were not material atDecember 31, 2006.
Indemnification provisions
In the normal course of business, the Company enters into agreements that include indemnification provisions for product liability andother matters. These provisions are generally subject to maximum amounts, specified claim periods, and other conditions and limits.These provisions include, but are not limited to, indemnifications provided to Kos for lost profits in the event of a Cardizem� LA supplyfailure, or the entry of generic competition to Cardizem� LA prior to December 31, 2008. With the exception of Kos’s estimated lostprofits claim (as described in note 13), no material amounts were accrued at December 31, 2006 for the Company’s obligations underany of these provisions.
25. RELATED PARTY TRANSACTIONS
In May 2006, the Company named Dr. Peter Silverstone as Senior Vice-President, Medical and Scientific Affairs. Dr. Silverstone joinedBiovail from Global IQ, a clinical research organization that he co-founded in 1999, where he served as Chief Medical Officer. GlobalIQ has in the past provided clinical research services to Biovail, and prior to Dr. Silverstone’s joining Biovail, the Company had selectedGlobal IQ as the preferred vendor for a new clinical study for a particular product. In connection with this study, Global IQ has beenproviding services for a long-term safety study and may provide other Phase III clinical work in the future in respect of this product.Global IQ has invoiced the Company a total of $1,980,000 for this study up to and including December 31, 2006. At December 31, 2006,$220,000 of this amount remained outstanding. It is currently anticipated that the study in respect of this product will continue for aperiod of at least one year. While clinical research studies are within Dr. Silverstone’s area of management and control, the Companyhas taken steps to ensure that he is not involved in any financial decisions in connection with any services provided or to be provided byGlobal IQ. Further, the Company has stated that Global IQ will no longer be eligible to bid to perform services for Biovail inconnection with any new clinical programs for other products until Dr. Silverstone has disposed of his interest in Global IQ to anarm’s-length party.
In 2006, Mr. Melnyk, Chairman of Biovail, reimbursed the Company $420,000 for expenses incurred in connection with the analysis of apotential investment in a company that Mr. Melnyk decided to pursue personally following a determination by the Company’s Board ofDirectors that the investment opportunity was not, and would not in future be, of interest to Biovail.
26. PROMOTIONAL SERVICES AGREEMENT
On December 15, 2006, the Company entered into an exclusive promotional services agreement with Sciele Pharma, Inc. (‘‘Sciele’’),whereby Sciele will provide detailing and sampling support for Zovirax� Ointment and Zovirax� Cream in the U.S. Sciele is solelyresponsible for the cost of maintaining a field sales force, and has committed to spending a minimum amount each year on promotionalactivities. Commencing in 2007, the Company will pay Sciele an annual fee as compensation for its promotion of Zovirax�. Sciele is alsoentitled to additional payments if certain tiered revenue targets are met each calendar year. This agreement continues untilDecember 2011.
27. SEGMENT INFORMATION
The Company operates in one operating segment — pharmaceutical products. Management assesses performance and makes resourcedecisions based on the consolidated results of operations of this operating segment. Substantially all of the operations of the Company
F-48
129

BIOVAIL CORPORATION
NOTES TO CONSOLIDATED FINANCIAL STATEMENTS (Continued)
In accordance with United States generally accepted accounting principles(All tabular dollar amounts expressed in thousands of U.S. dollars, except per share data)
December 31, 2006
27. SEGMENT INFORMATION (Continued)
are directly engaged in or support this operating segment. Other operations are not material and share many of the same economic andoperating characteristics as pharmaceutical products and, accordingly, they are included with pharmaceutical products for purposes ofsegment reporting.
Geographic information
The following table displays revenue and long-lived assets by geographic area:
Revenue(1) Long-Lived Assets(2)
2006 2005 2004 2006 2005 2004
As Restated — As Restated — As Restated — As Restated —See Note 3 See Note 3 See Note 3 See Note 3
Canada . . . . . . . . . . . . . . . . $ 89,920 $112,847 $110,511 $ 126,194 $ 116,337 $ 108,988U.S. and Puerto Rico . . . . . . . 966,212 815,342 760,175 183,763 182,876 184,793Barbados . . . . . . . . . . . . . . . — — — 736,769 947,947 1,007,448Other countries . . . . . . . . . . . 11,590 10,154 8,470 25,973 27,684 27,134
$1,067,722 $938,343 $879,156 $1,072,699 $1,274,844 $1,328,363
(1) Revenue is attributed to countries based on the location of the customer.
(2) Consists of property, plant and equipment, goodwill, intangible and other assets, net of accumulated depreciation andamortization. Property, plant and equipment are attributed to countries based on their physical location, goodwill is attributedto countries based on the location of the related acquired businesses, and intangible and other assets are attributed tocountries based on ownership rights.
Major customers
The following table identifies external customers that accounted for 10% or more of the Company’s total revenue:
Percentage ofTotal Revenue
2006 2005 2004
Customer A . . . . . . . . . . . . . . . . . . . . . . . . . . . . . . . . . . . . . . . . . . . . . . . . . . . . . . . . . . . . . 42% 38% 36%Customer B . . . . . . . . . . . . . . . . . . . . . . . . . . . . . . . . . . . . . . . . . . . . . . . . . . . . . . . . . . . . . 12% 15% 17%Customer C . . . . . . . . . . . . . . . . . . . . . . . . . . . . . . . . . . . . . . . . . . . . . . . . . . . . . . . . . . . . . 12% 14% 13%
28. SUBSEQUENT EVENTS
Ethypharm
On February 21, 2007, the Company entered into a share transfer agreement pursuant to which it has agreed to sell all or a part of itscommon shares of Ethypharm. Subject to certain conditions precedent being satisfied, it is anticipated that this transaction will close inApril 2007. As consideration for such transfer the Company will receive cash in an amount to be determined at the closing date. TheCompany has agreed, upon closing, to invest a portion of the net proceeds of the sale to purchase a minority interest in the acquiringcompany.
Notes redemption
On February 27, 2007, the Company issued a notice of redemption of all the outstanding Notes effective April 1, 2007 at a price of101.969% of the principal amount, plus accrued interest. At the redemption date, the Company expects to record a charge of $7,854,000in respect of the early redemption premium to be paid to the holders of the Notes. In addition, the Company expects to record awrite-off of $5,025,000 related to the total unamortized deferred financing costs, discount and fair value adjustment associated withthe Notes.
The Company expects that the redemption of the Notes will result in a foreign exchange gain for Canadian income tax purposes(as described in note 20). Taking that expectation into consideration, the Company believes it is more likely than not that it will generatesufficient taxable income in Canada in 2007 to utilize a portion of its deferred tax assets, which is expected to result in a correspondingreduction in the valuation allowance on those assets.
F-49
130

BIOVAIL CORPORATION
NOTES TO CONSOLIDATED FINANCIAL STATEMENTS (Continued)
In accordance with United States generally accepted accounting principles(All tabular dollar amounts expressed in thousands of U.S. dollars, except per share data)
December 31, 2006
28. SUBSEQUENT EVENTS
Wellbutrin XL� settlement
On March 5, 2007, the Company announced a comprehensive settlement with Anchen, Impax, Watson and Teva related toWellbutrin XL� (as described in notes 18 and 23).
Dividends declared
On March 14, 2007, the Company’s Board of Directors declared a cash dividend of $0.375 per share, payable on April 3, 2007 toshareholders of record at March 26, 2007.
29. COMPARATIVE FIGURES
Certain of the prior years’ figures have been reclassified to conform to the presentation adopted in 2006.
30. CANADIAN GAAP SUPPLEMENTAL INFORMATION
Prior to 2006, the Company prepared interim and annual consolidated financial statements and management’s discussion and analysis(‘‘MD&A’’) in accordance with Canadian GAAP for Canadian regulatory purposes. These reports were filed with the OSC and othersecurities regulatory authorities in Canada. Canadian securities regulations allow issuers that are required to file reports with the SEC,upon meeting certain conditions, to satisfy their Canadian continuous disclosure requirements by filing financial statements prepared inaccordance with U.S. GAAP. Accordingly, beginning in 2006, the Company has commenced preparing its interim and annualconsolidated financial statements and MD&A in accordance with U.S. GAAP only. For interim and annual periods in 2006 and 2007,the Company will include in the notes to its consolidated financial statements, among other things, an explanation of materialdifferences between U.S. GAAP and Canadian GAAP related to recognition, measurement and presentation. Subsequent to 2007, nofurther explanation of such differences will be required under current Canadian securities regulations.
Reconciliation of U.S. GAAP and Canadian GAAP
The following table presents a reconciliation of the Company’s consolidated net income as reported under U.S. GAAP and theCompany’s consolidated net income that would have been reported under Canadian GAAP:
2006 2005 2004
As Restated — As Restated — As Restated —See Note 3 See Note 3 See Note 3
Net income under U.S. GAAP . . . . . . . . . . . . . . . . . . . . . . . . . . . . . $211,626 $246,440 $159,799
Canadian GAAP adjustmentsAcquired research and development amortization expense(1) . . . . . . . . . . . (49,316) (98,112) (98,112)Impairment of acquired research and development(2) . . . . . . . . . . . . . . . (9,504) (45,046) —Gain on disposal of acquired research and development(3) . . . . . . . . . . . . (4,000) — —Purchase of acquired research and development(4) . . . . . . . . . . . . . . . . . — — 8,640Stock-based compensation expense(5) . . . . . . . . . . . . . . . . . . . . . . . . . . — (4,447) (20,403)Other . . . . . . . . . . . . . . . . . . . . . . . . . . . . . . . . . . . . . . . . . . . . . 477 411 1,628
Net income under Canadian GAAP . . . . . . . . . . . . . . . . . . . . . . . . . . $149,283 $ 99,246 $ 51,552
Basic and diluted earnings per share under Canadian GAAPIncome from continuing operations . . . . . . . . . . . . . . . . . . . . . . . . . . $ 0.96 $ 0.69 $ 0.36Net income . . . . . . . . . . . . . . . . . . . . . . . . . . . . . . . . . . . . . . . . . . $ 0.93 $ 0.62 $ 0.32
F-50
131

BIOVAIL CORPORATION
NOTES TO CONSOLIDATED FINANCIAL STATEMENTS (Continued)
In accordance with United States generally accepted accounting principles(All tabular dollar amounts expressed in thousands of U.S. dollars, except per share data)
December 31, 2006
30. CANADIAN GAAP SUPPLEMENTAL INFORMATION (Continued)
The following table presents a reconciliation of the Company’s consolidated balance sheets as reported under U.S. GAAP and theCompany’s consolidated balance sheets that would have been reported under Canadian GAAP:
2006 2005
As Restated — As Restated —See Note 3 See Note 3
Total assets under U.S. GAAP . . . . . . . . . . . . . . . . . . . . . . . . . . . . . . . . . . . . . . . . . $2,192,442 $2,036,820
Canadian GAAP adjustmentsMarketable securities/Long-term investments
Net unrealized holding gain on available-for-sale investments(6) . . . . . . . . . . . . . . . . . . . (5,844) (16,237)Intangible assets, net
Acquired research and development(1),(2),(3),(4) . . . . . . . . . . . . . . . . . . . . . . . . . . . . . . . 112,299 175,121Goodwill
Value of consideration paid on acquisition of Fuisz Technologies Ltd. (‘‘Fuisz’’)(7) . . . . . . . . 7,763 7,763Settlement of Fuisz pre-acquisition contract(8) . . . . . . . . . . . . . . . . . . . . . . . . . . . . . . (7,460) (7,460)Other . . . . . . . . . . . . . . . . . . . . . . . . . . . . . . . . . . . . . . . . . . . . . . . . . . . . . . . 2,312 2,312
Other assets, net . . . . . . . . . . . . . . . . . . . . . . . . . . . . . . . . . . . . . . . . . . . . . . . . . . (1,763) (2,218)
Total assets under Canadian GAAP . . . . . . . . . . . . . . . . . . . . . . . . . . . . . . . . . . . . . . $2,299,749 $2,196,101
2006 2005
Total liabilities under U.S. GAAP . . . . . . . . . . . . . . . . . . . . . . . . . . . . . . . . . . . . . . . . . . . . . . . . $890,185 $808,456
Canadian GAAP adjustmentsLong-term obligations . . . . . . . . . . . . . . . . . . . . . . . . . . . . . . . . . . . . . . . . . . . . . . . . . . . . . . . 66 88
Total liabilities under Canadian GAAP . . . . . . . . . . . . . . . . . . . . . . . . . . . . . . . . . . . . . . . . . . . . $890,251 $808,544
F-51
132

BIOVAIL CORPORATION
NOTES TO CONSOLIDATED FINANCIAL STATEMENTS (Continued)
In accordance with United States generally accepted accounting principles(All tabular dollar amounts expressed in thousands of U.S. dollars, except per share data)
December 31, 2006
30. CANADIAN GAAP SUPPLEMENTAL INFORMATION (Continued)
2006 2005
As AsRestated — Restated —See Note 3 See Note 3
Total shareholders’ equity under U.S. GAAP . . . . . . . . . . . . . . . . . . . . . . . . . . . . . . . . . $1,302,257 $1,228,364
Canadian GAAP adjustmentsCommon shares
Stock-based compensation(5) . . . . . . . . . . . . . . . . . . . . . . . . . . . . . . . . . . . . . . . . . . 43,547 36,779Accretion of convertible debt(9) . . . . . . . . . . . . . . . . . . . . . . . . . . . . . . . . . . . . . . . . 26,116 26,116Value of consideration paid on acquisition of Fuisz(7) . . . . . . . . . . . . . . . . . . . . . . . . . . 7,763 7,763Other . . . . . . . . . . . . . . . . . . . . . . . . . . . . . . . . . . . . . . . . . . . . . . . . . . . . . . . . (1,700) (1,700)
Additional paid-in capitalStock-based compensation(5) . . . . . . . . . . . . . . . . . . . . . . . . . . . . . . . . . . . . . . . . . . 58,732 65,500
DeficitAcquired research and development(1),(2),(3),(4) . . . . . . . . . . . . . . . . . . . . . . . . . . . . . . . 112,299 175,121Stock-based compensation(5) . . . . . . . . . . . . . . . . . . . . . . . . . . . . . . . . . . . . . . . . . . (102,279) (102,279)Accretion of convertible debt(9) . . . . . . . . . . . . . . . . . . . . . . . . . . . . . . . . . . . . . . . . (26,116) (26,116)Settlement of Fuisz pre-acquisition contract(8) . . . . . . . . . . . . . . . . . . . . . . . . . . . . . . . (7,460) (7,460)Other . . . . . . . . . . . . . . . . . . . . . . . . . . . . . . . . . . . . . . . . . . . . . . . . . . . . . . . . 2,183 1,706
Cumulative translation adjustmentNet unrealized holding gain on available-for-sale investments(6) . . . . . . . . . . . . . . . . . . . . (5,844) (16,237)
Total shareholders’ equity under Canadian GAAP . . . . . . . . . . . . . . . . . . . . . . . . . . . . . $1,409,498 $1,387,557
Total liabilities and shareholders’ equity under Canadian GAAP . . . . . . . . . . . . . . . . . . . . $2,299,749 $2,196,101
(1) Under Canadian GAAP, acquired research and development assets are capitalized and amortized over their estimated useful lives.
(2) Under Canadian GAAP, the Company recorded impairment charges of $9,504,000 and $45,046,000 in 2006 and 2005, respectively,to write down the carrying value of acquired research and development assets associated with product-development projects thatwere discontinued.
(3) Under U.S. GAAP, the Company recorded a $4,000,000 gain in 2006 on the disposal to Athpharma of certain products underdevelopment (as described in note 17). Under Canadian GAAP, the cash consideration received from Athpharma was recordedagainst the carrying value of the related acquired research and development asset, which resulted in no gain or loss on disposal.
(4) Under U.S. GAAP, acquired research and development assets for which technological feasibility has not been established andhaving no alternative future use must be written-off at the time of acquisition. In 2004, the Company acquired PPII’s remaininginterest in BNC-Pharmapass, which resulted in a charge of $8,640,000 to acquired research and development expense (as describedin note 19).
(5) Under U.S. GAAP, prior to January 1, 2006, the Company recognized employee stock-based compensation under the intrinsicvalue-based method. Accordingly, no compensation expense for stock options granted to employees at fair market value wasincluded in the determination of net income in 2005 or 2004. Effective January 1, 2006, the Company adopted the fair-value basedmethod for recognizing all share-based payments to employees, including grants of employee stock options. Stock optionforfeitures are estimated at the date of grant.
Under Canadian GAAP, effective January 1, 2004, the Company adopted the fair-value based method for recognizing stock-basedcompensation cost on a retroactive basis to January 1, 1996, without restatement of prior periods. At January 1, 2004, thecumulative effect of the change in accounting policy on prior periods resulted in a charge to deficit of $88,334,000 relating to thefair value of stock options vested since January 1, 1996, an increase to common shares of $40,945,000 related to the fair value ofstock options exercised since January 1, 1996, and an increase of $47,389,000 to additional paid-in capital related to the fair value ofoptions vested but unexercised since January 1, 1996. Stock option forfeitures are recognized as they occur.
F-52
133
BIOVAIL CORPORATION
NOTES TO CONSOLIDATED FINANCIAL STATEMENTS (Continued)
In accordance with United States generally accepted accounting principles(All tabular dollar amounts expressed in thousands of U.S. dollars, except per share data)
December 31, 2006
30. CANADIAN GAAP SUPPLEMENTAL INFORMATION (Continued)
(6) Under U.S. GAAP, long-term investments with readily determinable market values are accounted for as being available-for-sale.These investments are reported at fair value with all unrealized gains and temporary unrealized losses recognized in comprehensiveincome or loss. Unrealized losses on these investments that are considered to be other-than-temporary are recognized innet income.
Under Canadian GAAP, long-term investments are accounted for using the cost method. Declines in the fair value of theseinvestments below their cost bases that are considered to be other-than-temporary are recognized in net income.
(7) Under U.S. GAAP, the acquisition of Fuisz was valued based on the stock market price of the Company’s common shares beforeand after the July 25, 1999 date of the acquisition agreement. Under Canadian GAAP, the acquisition of Fuisz was valued based onthe average price of the Company’s common shares at the date of acquisition on November 12, 1999. The effect was that, underCanadian GAAP, the value of the common shares issued was higher by $7,763,000, which increased the goodwill acquired by anequal amount.
(8) Under U.S. GAAP, the cash settlement of a Fuisz pre-acquisition contract and the issuance of additional common shares in 2000related to the acquisition of Fuisz were allocated to goodwill acquired. Under Canadian GAAP, adjustments to the purchase pricesubsequent to the acquisition date were charged to net income.
(9) Under U.S. GAAP, no portion of the proceeds from the issuance of the Company’s Convertible Subordinated Preferred EquivalentDebentures (‘‘Debentures’’) in 2000 was attributed to the conversion feature.
Under Canadian GAAP, a portion of the proceeds from the issuance of the Debentures was attributed to the holder conversionoption. The portion of the debt conversion premium recorded on the redemption of the Debentures in 2001 that was related to theholder conversion option was charged to retained earnings.
There were no material differences between the Company’s consolidated cash flows as reported under U.S. GAAP and the Company’sconsolidated cash flows that would have been reported under Canadian GAAP.
Recent accounting pronouncements under Canadian GAAP
Recent accounting pronouncements under Canadian GAAP include the following:
In July 2006, The Canadian Institute of Chartered Accountants (‘‘CICA’’) issued Handbook Section 1506, ‘‘Accounting Changes’’, whichreplaces the former Section 1506. Section 1506 establishes criteria for changing accounting policies, together with the accountingtreatment and disclosure of changes in accounting policies, changes in accounting estimates and correction of errors. Section 1506requires retrospective application of changes in accounting policy, unless doing so is impracticable. Changes in accounting estimates aregenerally recognized prospectively, and material prior period errors are corrected retrospectively. This standard applies to interim andannual financial statements relating to fiscal years beginning on or after January 1, 2007.
In January 2005, the CICA issued Handbook Section 1530, ‘‘Comprehensive Income’’; Section 3855, ‘‘Financial Instruments —Recognition and Measurement’’; and Section 3865, ‘‘Hedges’’. Section 1530 sets the standards for reporting and display ofcomprehensive income. Comprehensive income includes, among other components, gains and losses arising on the translation ofself-sustaining foreign operations. Under Section 3855, financial assets and liabilities would, with certain exceptions, be initiallymeasured at fair value. After initial recognition, gains and losses on financial assets and liabilities measured at fair value would berecognized in net income with the exception of gains or losses arising from financial assets classified as available-for-sale, for whichunrealized gains and losses would be recognized in comprehensive income. Section 3865 builds on existing Accounting GuidelineNo. 13, by specifying how hedge accounting is applied for different types of hedging relationships. Unrealized gains and losses oncertain financial instruments that qualify for hedge accounting would be included in comprehensive income. These standards areeffective for annual and interim periods beginning on or after October 1, 2006. On the adoption of these standards effective January 1,2006, the Company will designate certain investments as available-for-sale and remeasure those investments at fair value, which willresult in a corresponding adjustment to the opening balance of a new separate section of shareholders’ equity called accumulated othercomprehensive income. The Company is currently evaluating the effect that the adoption of these standards will have on itsconsolidated financial statements.
Comparative consolidated financial statements
The tables on the following pages present comparative figures as previously reported under Canadian GAAP.
F-53
134

BIOVAIL CORPORATION
NOTES TO CONSOLIDATED FINANCIAL STATEMENTS
In accordance with United States generally accepted accounting principles(All tabular dollar amounts expressed in thousands of U.S. dollars, except per share data)
December 31, 2006
Consolidated Balance Sheets
At December 31
2006 2005 2005
(U.S. GAAP) (U.S. GAAP) (CDN GAAP)As Restated — As Restated — As Restated —
See Note 3 See Note 3 See Note 3ASSETSCurrentCash and cash equivalents . . . . . . . . . . . . . . . . . . . . . . . . . . . . . . . . $ 834,540 $ 445,289 $ 445,289Marketable securities . . . . . . . . . . . . . . . . . . . . . . . . . . . . . . . . . . . — 505 511Accounts receivable . . . . . . . . . . . . . . . . . . . . . . . . . . . . . . . . . . . . 129,247 135,506 135,506Inventories . . . . . . . . . . . . . . . . . . . . . . . . . . . . . . . . . . . . . . . . . . 78,781 89,473 89,473Deposits and prepaid expenses . . . . . . . . . . . . . . . . . . . . . . . . . . . . . 15,056 14,923 14,923Assets of discontinued operation held for sale . . . . . . . . . . . . . . . . . . . . — 1,893 1,893
$1,057,624 $ 687,589 $ 687,595
Marketable securities . . . . . . . . . . . . . . . . . . . . . . . . . . . . . . . . . . . 5,677 6,859 6,920Long-term investments . . . . . . . . . . . . . . . . . . . . . . . . . . . . . . . . . . 56,442 66,421 50,117Property, plant and equipment, net . . . . . . . . . . . . . . . . . . . . . . . . . . . 211,979 199,567 199,567Intangible assets, net . . . . . . . . . . . . . . . . . . . . . . . . . . . . . . . . . . . . 697,645 910,276 1,085,397Goodwill . . . . . . . . . . . . . . . . . . . . . . . . . . . . . . . . . . . . . . . . . . . 100,294 100,294 102,909Other assets, net . . . . . . . . . . . . . . . . . . . . . . . . . . . . . . . . . . . . . . 62,781 64,707 62,489Long-term assets of discontinued operation held for sale . . . . . . . . . . . . . — 1,107 1,107
$2,192,442 $2,036,820 $2,196,101
LIABILITIESCurrentAccounts payable . . . . . . . . . . . . . . . . . . . . . . . . . . . . . . . . . . . . . . 44,988 61,453 61,453Dividends payable . . . . . . . . . . . . . . . . . . . . . . . . . . . . . . . . . . . . . 80,222 — —Accrued liabilities . . . . . . . . . . . . . . . . . . . . . . . . . . . . . . . . . . . . . . 115,619 88,870 88,870Accrued contract losses . . . . . . . . . . . . . . . . . . . . . . . . . . . . . . . . . . 54,800 — —Income taxes payable . . . . . . . . . . . . . . . . . . . . . . . . . . . . . . . . . . . 41,596 37,713 37,713Deferred revenue . . . . . . . . . . . . . . . . . . . . . . . . . . . . . . . . . . . . . . 61,916 61,160 61,160Current portion of long-term obligations . . . . . . . . . . . . . . . . . . . . . . . 11,146 24,360 24,360
$ 410,287 $ 273,556 $ 273,556
Deferred revenue . . . . . . . . . . . . . . . . . . . . . . . . . . . . . . . . . . . . . . 73,621 117,119 117,119Deferred leasehold inducements . . . . . . . . . . . . . . . . . . . . . . . . . . . . 5,632 5,273 5,273Long-term obligations . . . . . . . . . . . . . . . . . . . . . . . . . . . . . . . . . . . 400,645 412,508 412,596
$ 890,185 $ 808,456 $ 808,544
SHAREHOLDERS’ EQUITYCommon shares . . . . . . . . . . . . . . . . . . . . . . . . . . . . . . . . . . . . . . . 1,476,930 1,461,077 1,530,035Additional paid-in capital . . . . . . . . . . . . . . . . . . . . . . . . . . . . . . . . . 14,952 377 65,877Deficit . . . . . . . . . . . . . . . . . . . . . . . . . . . . . . . . . . . . . . . . . . . . . (232,733) (284,075) (243,103)Accumulated other comprehensive income/Cumulative translation
adjustment . . . . . . . . . . . . . . . . . . . . . . . . . . . . . . . . . . . . . . . . . 43,108 50,985 34,748
$1,302,257 $1,228,364 $1,387,557
$2,192,442 $2,036,820 $2,196,101
F-54
135

BIOVAIL CORPORATION
NOTES TO CONSOLIDATED FINANCIAL STATEMENTS (Continued)
In accordance with United States generally accepted accounting principles(All tabular dollar amounts expressed in thousands of U.S. dollars, except per share data)
December 31, 2006
Consolidated Statements of Income
Years Ended December 31
2006 2005 2005
(U.S. GAAP) (U.S. GAAP) (CDN GAAP)As Restated — As Restated — As Restated —
See Note 3 See Note 3 See Note 3REVENUEProduct sales . . . . . . . . . . . . . . . . . . . . . . . . . . . . . . . . . . . . . . . . . . . $1,021,278 $887,074 $887,074Research and development . . . . . . . . . . . . . . . . . . . . . . . . . . . . . . . . . . 21,593 27,949 27,949Royalty and other . . . . . . . . . . . . . . . . . . . . . . . . . . . . . . . . . . . . . . . . 24,851 23,320 23,320
1,067,722 938,343 938,343
EXPENSESCost of goods sold . . . . . . . . . . . . . . . . . . . . . . . . . . . . . . . . . . . . . . . 211,152 201,330 201,615Research and development . . . . . . . . . . . . . . . . . . . . . . . . . . . . . . . . . . 95,479 88,437 88,884Selling, general and administrative . . . . . . . . . . . . . . . . . . . . . . . . . . . . . 238,441 227,394 231,109Amortization . . . . . . . . . . . . . . . . . . . . . . . . . . . . . . . . . . . . . . . . . . . 56,457 62,260 160,372Asset impairments, net of gain on disposal . . . . . . . . . . . . . . . . . . . . . . . . 143,000 29,230 74,276Restructuring costs . . . . . . . . . . . . . . . . . . . . . . . . . . . . . . . . . . . . . . . 15,126 19,810 19,810Contract losses . . . . . . . . . . . . . . . . . . . . . . . . . . . . . . . . . . . . . . . . . . 54,800 — —Litigation settlements . . . . . . . . . . . . . . . . . . . . . . . . . . . . . . . . . . . . . . 14,400 — —
$ 828,855 $628,461 $776,066
Operating income . . . . . . . . . . . . . . . . . . . . . . . . . . . . . . . . . . . . . . . . 238,867 309,882 162,277Interest income . . . . . . . . . . . . . . . . . . . . . . . . . . . . . . . . . . . . . . . . . 29,199 7,175 7,175Interest expense . . . . . . . . . . . . . . . . . . . . . . . . . . . . . . . . . . . . . . . . . (35,203) (37,126) (36,715)Foreign exchange gain (loss) . . . . . . . . . . . . . . . . . . . . . . . . . . . . . . . . . (2,360) 794 794Equity loss . . . . . . . . . . . . . . . . . . . . . . . . . . . . . . . . . . . . . . . . . . . . (529) (1,160) (1,160)
Income from continuing operations before provision for income taxes . . . . . . . 229,974 279,565 132,371Provision for income taxes . . . . . . . . . . . . . . . . . . . . . . . . . . . . . . . . . . 14,500 22,550 22,550
Income from continuing operations . . . . . . . . . . . . . . . . . . . . . . . . . . . . . 215,474 257,015 109,821Loss from discontinued operation . . . . . . . . . . . . . . . . . . . . . . . . . . . . . . (3,848) (10,575) (10,575)
Net income . . . . . . . . . . . . . . . . . . . . . . . . . . . . . . . . . . . . . . . . . . . . $ 211,626 $246,440 $ 99,246
Basic and diluted earnings (loss) per shareIncome from continuing operations . . . . . . . . . . . . . . . . . . . . . . . . . . . . . 1.35 1.61 0.69Loss from discontinued operation . . . . . . . . . . . . . . . . . . . . . . . . . . . . . . (0.03) (0.07) (0.07)
Net income . . . . . . . . . . . . . . . . . . . . . . . . . . . . . . . . . . . . . . . . . . . . $ 1.32 $ 1.54 $ 0.62
Weighted average number of common shares outstanding (000s)Basic . . . . . . . . . . . . . . . . . . . . . . . . . . . . . . . . . . . . . . . . . . . . . . . . 160,060 159,433 159,433Diluted . . . . . . . . . . . . . . . . . . . . . . . . . . . . . . . . . . . . . . . . . . . . . . 160,078 159,681 159,433
F-55
136

BIOVAIL CORPORATION
NOTES TO CONSOLIDATED FINANCIAL STATEMENTS (Continued)
In accordance with United States generally accepted accounting principles(All tabular dollar amounts expressed in thousands of U.S. dollars, except per share data)
December 31, 2006
Consolidated Statements of Cash Flows
Years Ended December 31
2006 2005 2005
(U.S. GAAP) (U.S. GAAP) (CDN GAAP)As Restated — As Restated — As Restated —
See Note 3 See Note 3 See Note 3CASH FLOWS FROM OPERATING ACTIVITIESNet income . . . . . . . . . . . . . . . . . . . . . . . . . . . . . . . . . . . . . . . . $ 211,626 $ 246,440 $ 99,246Adjustments to reconcile net income to cash provided by continuing
operating activitiesDepreciation and amortization . . . . . . . . . . . . . . . . . . . . . . . . . . . . 92,150 96,641 194,753Amortization and write-down of deferred financing costs . . . . . . . . . . . . 2,300 3,445 3,445Amortization and write-down of discounts on long-term obligations . . . . . 1,291 2,420 2,009Stock-based compensation . . . . . . . . . . . . . . . . . . . . . . . . . . . . . . . 14,794 — 4,825Asset impairments . . . . . . . . . . . . . . . . . . . . . . . . . . . . . . . . . . . . 151,140 29,230 74,276Gain on disposal of intangible assets . . . . . . . . . . . . . . . . . . . . . . . . . (4,000) — —Accrued contract losses . . . . . . . . . . . . . . . . . . . . . . . . . . . . . . . . . 54,800 — —Equity loss . . . . . . . . . . . . . . . . . . . . . . . . . . . . . . . . . . . . . . . . . 529 1,160 1,160Loss from discontinued operation . . . . . . . . . . . . . . . . . . . . . . . . . . 3,848 10,575 10,575Receipt of leasehold inducements . . . . . . . . . . . . . . . . . . . . . . . . . . 835 805 805Other . . . . . . . . . . . . . . . . . . . . . . . . . . . . . . . . . . . . . . . . . . . . 1,248 (3,274) (3,652)Changes in operating assets and liabilities:
Accounts receivable . . . . . . . . . . . . . . . . . . . . . . . . . . . . . . . . . . 4,688 12,775 12,775Inventories . . . . . . . . . . . . . . . . . . . . . . . . . . . . . . . . . . . . . . . 10,906 16,624 16,624Deposits and prepaid expenses . . . . . . . . . . . . . . . . . . . . . . . . . . . (311) 1,101 1,101Accounts payable . . . . . . . . . . . . . . . . . . . . . . . . . . . . . . . . . . . (12,999) 17,027 17,027Accrued liabilities . . . . . . . . . . . . . . . . . . . . . . . . . . . . . . . . . . . 28,094 5,605 5,605Income taxes payable . . . . . . . . . . . . . . . . . . . . . . . . . . . . . . . . . 3,897 13,343 13,343Deferred revenue . . . . . . . . . . . . . . . . . . . . . . . . . . . . . . . . . . . (42,319) 47,962 47,962
Net cash provided by continuing operating activities . . . . . . . . . . . . . . . $ 522,517 $ 501,879 $ 501,879
CASH FLOWS FROM INVESTING ACTIVITIESAdditions to property, plant and equipment, net . . . . . . . . . . . . . . . . . (44,802) (37,807) (37,807)Proceeds from sales and maturities of marketable securities . . . . . . . . . . 4,854 6,296 6,296Proceeds on disposal of intangible assets, net of withholding tax . . . . . . . 4,000 98,127 98,127Purchases of marketable securities . . . . . . . . . . . . . . . . . . . . . . . . . . (3,196) (8,791) (8,791)Acquisitions of long-term investments . . . . . . . . . . . . . . . . . . . . . . . . (1,303) — —Acquisitions of intangible assets . . . . . . . . . . . . . . . . . . . . . . . . . . . . — (26,000) (26,000)
Net cash provided by (used in) continuing investing activities . . . . . . . . . $ (40,447) $ 31,825 $ 31,825
CASH FLOWS FROM FINANCING ACTIVITIESDividends paid . . . . . . . . . . . . . . . . . . . . . . . . . . . . . . . . . . . . . . (80,062) (79,779) (79,779)Repayments of other long-term obligations . . . . . . . . . . . . . . . . . . . . . (25,455) (39,587) (39,587)Issuance of common shares . . . . . . . . . . . . . . . . . . . . . . . . . . . . . . 15,634 2,990 2,990Financing costs paid . . . . . . . . . . . . . . . . . . . . . . . . . . . . . . . . . . . (1,275) (1,300) (1,300)Repurchase of Senior Subordinated Notes . . . . . . . . . . . . . . . . . . . . . (1,098) — —Payment on termination of interest rate swaps . . . . . . . . . . . . . . . . . . — (1,419) (1,419)
Net cash used in continuing financing activities . . . . . . . . . . . . . . . . . . $ (92,256) $ (119,095) $ (119,095)
CASH FLOWS FROM DISCONTINUED OPERATIONNet cash used in operating activities . . . . . . . . . . . . . . . . . . . . . . . . . (558) (3,770) (3,770)Net cash used in investing activities . . . . . . . . . . . . . . . . . . . . . . . . . — (47) (47)
Net cash used in discontinued operation . . . . . . . . . . . . . . . . . . . . . . (558) (3,817) (3,817)
Effect of exchange rate changes on cash and cash equivalents . . . . . . . . . (5) 173 173
Net increase in cash and cash equivalents . . . . . . . . . . . . . . . . . . . . . 389,251 410,965 410,965Cash and cash equivalents, beginning of year . . . . . . . . . . . . . . . . . . . 445,289 34,324 34,324
Cash and cash equivalents, end of year . . . . . . . . . . . . . . . . . . . . . . . $ 834,540 $ 445,289 $ 445,289
F-56
137

138 (This page intentionally left blank).


WILFRED BRISTOW
Director
MICHAEL VAN EVERYDirector
140
EXECUTIVE OFFICERS
DOUGLAS J.P. SQUIRES
Chief Executive Officer
Biovail Corporation
DOUGLAS J.P. SQUIRES
Chief Executive Officer
KENNETH G. HOWLING
Senior Vice-President
Chief Financial Officer
DR. PETER SILVERSTONE
Senior Vice-President
Medical and Scientific Affairs
GILBERT GODIN
Senior Vice-President
Technical Operations
and Drug Delivery
WENDY KELLEY
Senior Vice-President
General Counsel and
Corporate Secretary
CHRISTINE MAYER
Senior Vice-President
Business Development Services
Biovail Pharmaceuticals, Inc.
GREG GUBITZ
Senior Vice-President
MICHEL CHOUINARD
Chief Operating Officer
Biovail Laboratories International SRL
BOARD OF DIRECTORS
JAMIE SOKALSKY
Executive Vice-President
and Chief Financial Officer
Barrick Gold Corporation
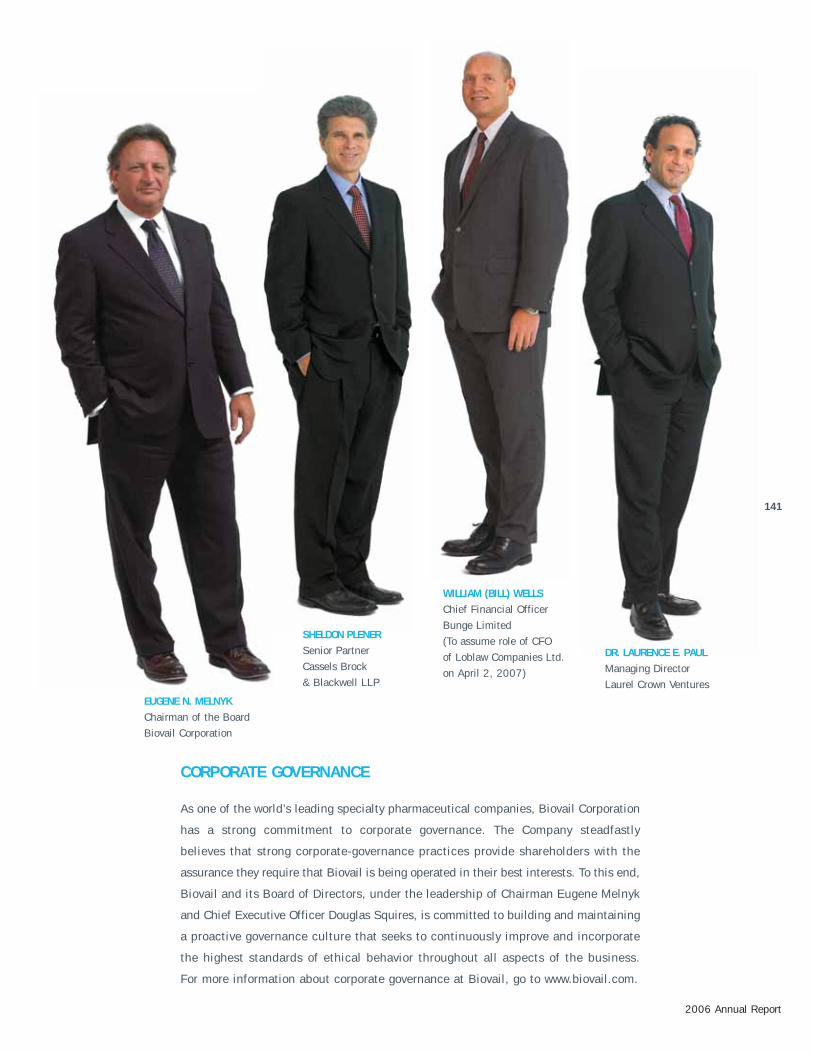
141
2006 Annual Report
As one of the world’s leading specialty pharmaceutical companies, Biovail Corporation
has a strong commitment to corporate governance. The Company steadfastly
believes that strong corporate-governance practices provide shareholders with the
assurance they require that Biovail is being operated in their best interests. To this end,
Biovail and its Board of Directors, under the leadership of Chairman Eugene Melnyk
and Chief Executive Officer Douglas Squires, is committed to building and maintaining
a proactive governance culture that seeks to continuously improve and incorporate
the highest standards of ethical behavior throughout all aspects of the business.
For more information about corporate governance at Biovail, go to www.biovail.com.
CORPORATE GOVERNANCE
EUGENE N. MELNYK
Chairman of the Board
Biovail Corporation
DR. LAURENCE E. PAUL
Managing Director
Laurel Crown Ventures
WILLIAM (BILL) WELLS
Chief Financial Officer
Bunge Limited
(To assume role of CFO
of Loblaw Companies Ltd.
on April 2, 2007)
SHELDON PLENER
Senior Partner
Cassels Brock
& Blackwell LLP

142
SELECTED QUARTERLY DATA
[All dollar amounts expressed in thousands of U.S. dollars, except per share and share price data]
[Includes certain non-GAAP measures - see footnotes below] Q11 Q21 Q31 Q41 Total As Restated As Restated As Restated As Restated As Restated2006Product sales $ 211,811 $ 243,455 $ 270,015 $ 295,997 $ 1,021,278 Revenue 222,629 255,143 282,302 307,648 1,067,722 Expenses 140,894 162,965 336,951 188,045 828,855 Operating income (loss) 81,735 92,178 (54,649) 119,603 238,867 Income (loss) from continuing operations 72,556 85,005 (60,063) 117,976 215,474 Net income (loss) 68,436 85,277 (60,063) 117,976 211,626 Specifi c items affecting net income Asset impairments, net of gain on disposal - - 143,000 - 143,000 Contract losses - 4,500 46,800 3,500 54,800 Restructuring costs - - - 15,126 15,126 Litigation settlements - - - 14,400 14,400 Asset impairments of discontinued operation 1,084 - - - 1,084 Equity loss (income) 318 (50) 205 56 529 Specifi c items affecting net income 1,402 4,450 190,005 33,082 228,939 Net income excluding specifi c items2 69,838 89,727 129,942 151,058 440,565 Adjustments to get to EBITDA excluding specifi c items: Net interest expense (income) 3,828 2,369 1,374 (1,567) 6,004 Provision for income taxes 4,150 5,350 3,700 1,300 14,500 Depreciation and amortization 22,978 23,316 24,119 21,737 92,150 EBITDA excluding specifi c items2 $ 100,794 $ 120,762 $ 159,135 $ 172,528 $ 553,219 Diluted per share data Income (loss) from continuing operations $ 0.45 $ 0.53 $ (0.37) $ 0.74 $ 1.35 Net income (loss) $ 0.43 $ 0.53 $ (0.37) $ 0.74 $ 1.32 Net income excluding specifi c items2 $ 0.44 $ 0.56 $ 0.81 $ 0.94 $ 2.75 EBITDA excluding specifi c items2 $ 0.63 $ 0.75 $ 0.99 $ 1.08 $ 3.46 Depreciation and amortization $ 0.14 $ 0.15 $ 0.15 $ 0.14 $ 0.58 Weighted average number of common shares outstanding (000s) 159,737 160,071 160,232 160,265 160,078 Cash dividends declared per share $ 0.125 $ 0.125 $ 0.125 $ 0.625 $ 1.00 Common share price3 High $ 28.28 $ 28.13 $ 23.75 $ 22.45 $ 28.28 Low $ 22.23 $ 21.65 $ 14.51 $ 14.90 $ 14.51 2005 Product sales $ 160,531 $ 205,500 $ 245,617 $ 275,426 $ 887,074 Revenue 173,686 217,159 259,220 288,278 938,343 Expenses 151,715 199,641 129,269 147,836 628,461 Operating income 21,971 17,518 129,951 140,442 309,882 Income from continuing operations 12,837 7,320 112,122 124,736 257,015 Net income 11,910 6,105 104,486 123,939 246,440 Specifi c items affecting net income Asset impairments - 26,560 - 2,670 29,230 Restructuring costs - 18,607 1,118 85 19,810 Asset impairments of discontinued operation - - 6,113 (543) 5,570 Write-off of inventory - 4,862 - - 4,862 Equity loss 270 263 271 356 1,160 Specifi c items affecting net income 270 50,292 7,502 2,568 60,632 Net income excluding specifi c items2 12,180 56,397 111,988 126,507 307,072 Adjustments to get to EBITDA excluding specifi c items: Net interest expense 8,519 8,662 7,064 5,706 29,951 Provision for income taxes 585 2,295 9,095 10,575 22,550 Depreciation and amortization 22,914 27,423 23,781 23,497 97,615 EBITDA excluding specifi c items2 $ 44,198 $ 94,777 $ 151,928 $ 166,285 $ 457,188 Diluted per share data Income from continuing operations $ 0.08 $ 0.05 $ 0.70 $ 0.78 $ 1.61 Net income $ 0.07 $ 0.04 $ 0.65 $ 0.77 $ 1.54 Net income excluding specifi c items2 $ 0.08 $ 0.35 $ 0.70 $ 0.79 $ 1.92 EBITDA excluding specifi c items2 $ 0.28 $ 0.59 $ 0.95 $ 1.04 $ 2.86 Depreciation and amortization $ 0.14 $ 0.17 $ 0.15 $ 0.15 $ 0.61 Weighted average number of common shares outstanding (000s) 159,447 159,441 159,583 160,250 159,681 Cash dividends declared per share $ - $ - $ - $0.50 $0.50 Common share price3 High $ 18.02 $ 16.38 $ 23.78 $ 27.28 $ 27.28 Low $ 14.90 $ 13.74 $ 15.23 $ 21.24 $ 13.74 1 Data for each of the quarters in 2006 and 2005 has been adjusted to refl ect the restatement of the Company’s previously issued fi nancial statements, as more fully described in note 3 to the Company’s restated audited consolidated fi nancial statements for the year ended December 31, 2006. 2 Net income excluding specifi c items; earnings before interest, taxes, depreciation and amortization (“EBITDA”); and EBITDA excluding specifi c items are non-GAAP measures and have no standardized defi nitions under GAAP. These measures are presented to enhance the comparison of quarterly and annual data and may not be comparable to similar measures presented by other issuers3 High and low per share sales prices on the New York Stock Exchange.

20061,2
20051,2
20041,2
20031,2
20022 2001
2 2000
3 1999
3 1998
4 1997
4 As Restated As Restated As Restated As Restated
OPERATING RESULTS Revenue Product sales $ 1,021,278 $ 887,074 $ 837,102 $ 624,139 $ 643,953 $ 518,707 $ 217,004 $ 98,029 $ 69,154 $ 50,333 Research and development 21,593 27,949 19,279 12,813 27,965 14,127 66,834 48,232 30,891 18,809 Royalty and other 24,851 23,320 22,775 174,798 111,770 45,114 25,332 26,203 11,612 12,487 1,067,722 938,343 879,156 811,750 783,688 577,948 309,170 172,464 111,657 81,629 Expenses Cost of goods sold 211,152 201,330 221,935 132,197 161,093 123,338 67,980 35,027 28,542 16,420 Research and development 95,479 88,437 68,382 84,625 50,361 49,468 51,709 32,954 17,490 14,386 Selling, general and administrative 238,441 227,394 253,531 239,796 164,779 106,788 51,621 36,223 19,735 15,353 Amortization 56,457 62,260 64,704 140,623 71,227 44,241 7,232 2,789 470 204 Asset impairments, net of gain on disposal 143,000 29,230 40,685 45,081 31,944 80,482 - - - - Restructuring costs 15,126 19,810 - - - - - - - - Contract losses 54,800 - - - - - - - - - Litigation settlements 14,400 - - (34,055) - - - - - - Acquired research and development - - 8,640 124,720 167,745 - 208,424 105,689 - - Extinguishment of royalty obligation - - - 61,348 - - - - - - 828,855 628,461 657,877 794,335 647,149 404,317 386,966 212,682 66,237 46,363 Operating income (loss) 238,867 309,882 221,279 17,415 136,539 173,631 (77,796) (40,218) 45,420 35,266 Income (loss) from continuing operations 215,474 257,015 165,014 (29,643) 90,750 88,851 (147,976) (109,978) 41,577 32,822 Net income (loss) 211,626 246,440 159,799 (30,122) 87,795 87,448 (147,976) (109,978) 41,577 32,822 Specifi c items net income: Asset impairments, net of gain on disposal 143,000 29,230 40,685 45,081 31,944 80,482 - - - - Contract losses 54,800 - - - - - - - - - Restructuring costs 15,126 19,810 - - - - - - - - Litigation settlements 14,400 - - - - - - - - - Asset impairments of discontinued operation 1,084 5,570 - - - - - - - - Equity loss 529 1,160 4,179 1,010 - - - 56,451 - - Write-off of inventory - 4,862 - - - - - - - - Acquired research and development - - 8,640 124,720 167,745 - 208,424 105,689 - - Extinguishment of royalty obligation - - - 61,348 - - - - - - Foreign exchange loss on long-term obligation - - - 13,061 - - - - - - Relocation costs - - - 7,539 - - - - - - Reduction in tax contingency provision - - - (12,000) - - - - - - Debt conversion and extinguishment provision - - - - - 34,923 20,039 - - - Cumulative effect adjustment of change in accounting policy - - - - - - 43,500 - - - Specifi c items affecting net income 228,939 60,632 53,504 240,759 199,689 115,405 271,963 162,140 - - Net income excluding specifi c items5 440,565 307,072 213,303 210,637 287,484 202,853 123,987 52,162 41,577 32,822 Adjustments to get to EBITDA excluding specifi c items: Net interest expense (income) 6,004 29,951 39,070 33,256 28,397 33,500 (2,955) 9,152 1,702 351 Provision for income taxes 14,500 22,550 8,950 8,000 21,500 15,285 9,360 4,215 2,024 1,941 Depreciation and amortization 92,150 97,615 88,307 157,317 82,368 55,287 20,988 8,187 4,829 3,157 EBITDA excluding specifi c items5 $ 553,219 $457,188 $349,630 $409,210 $419,749 $306,925 $151,380 $73,716 $50,132 $38,271 Diluted per share data Income (loss) from continuing operations $ 1.35 $ 1.61 $ 1.04 $ (0.19) $ 0.57 $ 0.59 $ (1.16) $ (1.07) $ 0.38 $ 0.31 Net income (loss) $ 1.32 $ 1.54 $ 1.00 $ (0.19) $ 0.55 $ 0.58 $ (1.16) $ (1.07) $ 0.38 $ 0.31 Net income excluding specifi c items5 $ 2.75 $ 1.92 $ 1.34 $ 1.32 $ 1.79 $ 1.35 $ 0.86 $ 0.48 $ 0.38 $ 0.31 EBITDA excluding specifi c items5 $ 3.46 $ 2.86 $ 2.20 $ 2.56 $ 2.62 $ 2.04 $ 1.05 $ 0.68 $ 0.46 $ 0.36 Depreciation and amortization $ 0.58 $ 0.61 $ 0.55 $ 0.98 $ 0.51 $ 0.37 $ 0.15 $ 0.08 $ 0.04 $ 0.03 Weighted average number of common shares outstanding (000s) 160,078 159,681 159,258 159,919 160,463 150,690 143,512 108,174 108,944 106,476 CASH DIVIDENDS DECLARED PER SHARE $ 1.00 $ 0.50 $ - $ - $ - $ - $ - $ - $ - $ - FINANCIAL POSITION Cash and cash equivalents $ 834,540 $ 445,289 $ 34,324 $ 133,261 $ 56,080 $ 434,891 $ 125,144 $ 178,086 $ 78,279 $ 8,275 Working capital 647,337 414,033 124,414 149,884 (23,527) 427,856 (25,295) 266,068 114,898 47,663 Total assets 2,192,442 2,036,820 1,711,060 1,922,774 1,833,804 1,331,483 1,107,267 467,179 198,616 93,739 Long-term obligations 411,791 436,868 478,936 822,927 747,350 46,161 738,729 137,504 126,835 4,847 Shareholders’ equity 1,302,257 1,228,364 1,053,913 881,595 845,686 1,126,074 237,458 267,336 49,888 75,458 Shareholders’ equity excluding specifi c items5 2,631,671 2,328,839 2,093,756 1,867,934 1,591,266 1,671,965 667,944 425,859 46,271 71,841 COMMON SHARE PERFORMANCE Market capitalization $ 3,395,000 $ 3,787,000 $ 2,635,000 $ 3,413,000 $ 4,176,000 $ 8,859,000 $ 5,106,000 $ 2,915,000 $ 940,000 $ 1,041,000 Closing share price on New York Stock Exchange $ 21.16 $ 23.73 $ 16.53 $ 21.49 $ 26.41 $ 56.25 $ 38.84 $ 23.44 $ 9.45 $ 9.77 Closing number of common shares issued and outstanding (000s) 160,444 159,588 159,383 158,797 158,120 157,496 131,461 124,392 99,444 106,644 CASH FLOWS Net cash provided by continuing operating activities $ 522,517 $ 501,879 $ 279,566 $ 282,769 $ 337,253 $ 285,983 $ 102,494 $ 51,985 $ 52,394 $ 3,566 Net issuance (repurchase) of common shares 15,634 2,990 8,012 12,079 (483,485) 469,163 109,604 223,128 (68,212) 4,464 Proceeds from disposal of intangible assets, net of withholding tax 4,000 98,127 3,000 10,000 - - - - - - Dividends paid (80,062) (79,779) - - - - - - - - Additions to property, plant and equipment, net (44,802) (37,807) (28,024) (37,016) (61,138) (40,119) (15,845) (7,759) (3,920) (2,664) Net issuance (repurchase/repayment) of long-term obligations (26,553) (40,887) (348,838) 50,456 450,195 (404,666) 309,153 (75,212) 117,705 (1,829) Net cash used in discontinued operation (558) (3,817) (2,481) (697) (3,393) (6,179) - - - - Acquisitions of intangible assets - (26,000) - (242,298) (375,385) (12,445) (27,752) (13,340) (19,000) - Acquisitions of businesses, net of cash acquired - - (9,319) (25,741) (240,581) - (622,145) (43,720) - - Net increase (decrease) in cash and cash equivalents 389,251 410,965 (98,937) 77,181 (378,811) 309,747 (52,942) 99,807 70,004 3,749 RATIOS Net income excluding specifi c items as a percentage of revenue5 41.3% 32.7% 24.3% 25.9% 36.7% 35.1% 40.1% 30.2% 37.2% 40.2% EBITDA excluding specifi c items as a percentage of revenue5 51.8% 48.7% 39.8% 50.4% 53.6% 53.1% 49.0% 42.7% 44.9% 46.9% Return on shareholders’ equity excluding specifi c items5 17.8% 13.9% 10.8% 12.2% 17.6% 17.3% 22.7% 22.1% 70.4% 62.4% Ratio of EBITDA excluding specifi c items to interest expense5 15.7x 12.3x 8.7x 10.1x 13.1x 8.5x 7.3x 5.1x 21.3x 192.3x Product sales growth 15.1% 6.0% 34.1% (3.1%) 24.1% 139.0% 121.4% 41.8% 37.4% (7.3%) Revenue growth 13.8% 6.7% 8.3% 3.6% 35.6% 86.9% 79.3% 54.5% 36.8% 22.9% HEADCOUNT - Number of employees, end of year 1,603 1,744 2,291 1,958 1,857 1,425 1,200 701 489 377 1 Data for 2003 to 2006 has been adjusted to refl ect the restatement of the Company’s previously issued fi nancial statements, as more fully described in note 3 to the Company’s restated audited consolidated fi nancial statements for the year ended December 31, 2006. 2 Data for 2001 to 2006 refl ects the Company’s Nutravail division as a discontinued operation. The Company acquired Nutravail in November 1999, as part of the Fuisz Technologies Ltd. (“Fuisz”) acquisition. 3 Data for 2000 and 1999 does not refl ect the Company’s Nutravail division as a discontinued operation because this information is not available due to changes in the fi nancial systems of Fuisz that were implemented subsequent to the date of the Company’s acquisition. 4 Data has been derived from consolidated fi nancial statements prepared in accordance with Canadian GAAP. 5 Certain fi nancial information (such as net income excluding specifi c items; earnings before interest, taxes, depreciation and amortization (“EBITDA”); EBITDA excluding specifi c items; and shareholders’ equity excluding specifi c items) are non-GAAP measures and have no standardized defi nitions under GAAP. These measures are presented to enhance the comparison of annual data and may not be comparable to similar measures presented by other issuers
TEN YEAR FINANCIAL SUMMARY
[All dollar amounts expressed in thousands of U.S. dollars, except per share and share price data]
[Includes certain non-GAAP measures - see footnotes below]

2006 ANNUAL REPORTMAY 2007
20
06
AN
NU
AL R
EP
OR
T
MORE INFORMATION:INVESTOR RELATIONS
BIOVAIL CORPORATION7150 Mississauga Road
Mississauga, Ontario, Canada L5N 8M5
WWW.BIOVAIL.COM
SHAREHOLDER INFORMATION
HEAD OFFICE
Biovail Corporation
7150 Mississauga Road
Mississauga, Ontario, Canada L5N 8M5
SUBSIDIARIES
Biovail Laboratories International SRL
Chelston Park, Building 2, Ground Floor
Collymore Rock, St. Michael
Barbados, West Indies
Biovail Pharmaceuticals Canada
7150 Mississauga Road
Mississauga, Ontario
Canada L5N 8M5
Biovail Pharmaceuticals, Inc.
700 Route 202/206 North
Bridgewater, New Jersey
U.S.A. 08807
Biovail Technologies (Ireland) Limited
3200 Lake Drive
Citywest Business Campus
Dublin 24, Ireland
Biovail Technologies Ltd.
3701 Concorde Parkway
Chantilly, Virginia
U.S.A. 20151
AUDITORS
Ernst & Young LLP
Chartered Accountants
Toronto, Ontario
LEGAL COUNSEL
Davies Ward Phillips & Vineberg LLP
Toronto, Ontario
Proskauer Rose LLP
New York, New York
REGISTRARS AND TRANSFER AGENTS
CIBC Mellon Trust Company
Toronto, Ontario
1.800.387.0825
Mellon Investor Services LLC
New York, New York
THE ANNUAL MEETING OF SHAREHOLDERS
The annual meeting of shareholders will be held at 10:00 a.m. EDT
on Wednesday May 16, 2007, at the Dominion Club.
1 King Street West
Toronto, Ontario, Canada M5H 1A1
STOCK EXCHANGE LISTINGS
Toronto Stock Exchange
New York Stock Exchange
TRADING SYMBOL
Common Shares: BVF
SHARES OUTSTANDING AT DECEMBER 31, 2006
160.1 million
HOW TO REACH US FOR MORE INFORMATION
For additional copies of this report, the annual report on Form 20-F as
filed with the United States Securities and Exchange Commission, quarterly
reports or for further information, please contact Investor Relations.
Biovail Corporation
7150 Mississauga Road
Mississauga, Ontario
Canada L5N 8M5
Phone
905.286.3000
Fax
905.286.3050
Web site
www.biovail.com
The following words are trademarks of the Company and are subject of either registration, or application for registration, in one or more of Canada, the U.S. or certain other jurisdictions: Attenade®, A Tablet Design (Apex Down)®, A Tablet Design (Apex Up)®, Aplezin, Ativan®, Asolza, Biovail®, Biovail Corporation International®, Biovail & Swoosh Design®, BPI®, BVF®, Cardizem®, Ceform, Crystaal Corporation & Design®, Crystaal Pharmaceuticals, Ditech, Flash Dose®, Flashdose, Glumetza, Instatab, Isordil®, Jovola, Jublia, Mivura, Onelza, Onexten, Oramelt, Palvata, Smartcoat, Solbri, Tesivee, Tiazac®, Tovalt, Upzimia, Upziva, Vaseretic®, Vasocard, Vasotec®, Vemreta, Volzelo, Z-Flakes and Zileran.
Wellbutrin®, Wellbutrin® SR, Wellbutrin XL® (a once daily formulation of bupropion developed by Biovail), Zovirax®, and Zyban® are trademarks of The GlaxoSmithKline Group of Companies and are used by the Company under license. Ultram®, Ultram® ER, and Ultram® ODT are trademarks of Ortho-McNeil, Inc. and are used by the Company under license.
In addition, the Company has filed trademark applications for many of its other trademarks in the United States and Canada and has implemented on an ongoing basis a trademark protection program for new trademarks.