share price $5.75 market capitalization $1,649.3 million ... sharma (212) 208-3333 ... 3,038 2,941...
TRANSCRIPT
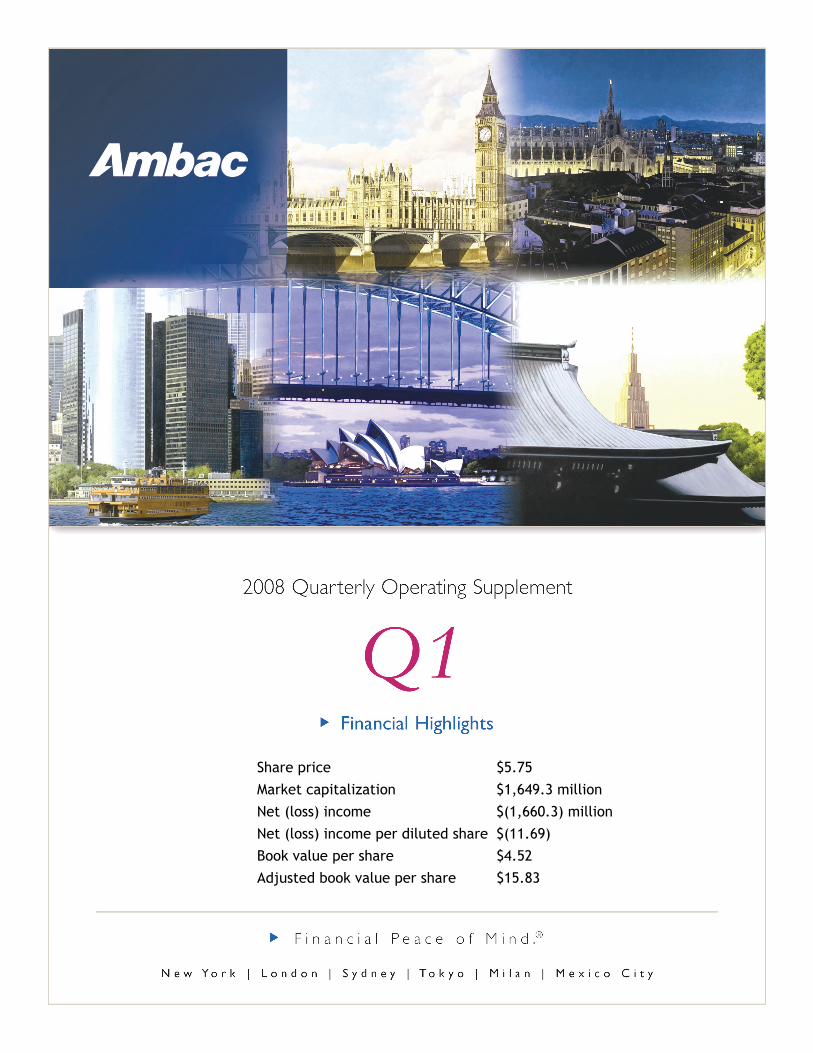
Share price $5.75
Market capitalization $1,649.3 million
Net (loss) income $(1,660.3) million
Net (loss) income per diluted share $(11.69)
Book value per share $4.52
Adjusted book value per share $15.83

Company Profile Ambac Financial Group, Inc., headquartered in New York City, is a holding company whose affiliates provide financial guarantees and financial services to clients in both the public and private sectors around the world. The principal operating subsidiary, Ambac Assurance Corporation, a leading guarantor of public finance and structured finance obligations, has earned triple-A ratings from Moody’s Investors Services, Inc. and Standard & Poor’s Ratings Services, and a double-A rating from Fitch, Inc. All of these ratings have a “Negative Outlook.” Ambac Financial Group, Inc., through its subsidiaries, also provide investment agreements, interest rate swaps, total return swaps and funding conduits, principally to clients of the financial guarantee business, which include municipalities and their authorities, health care organizations and asset-backed issuers. Ambac Financial Group, Inc. common stock is listed on the New York Stock Exchange (ticker symbol ABK). Company Information
Corporate headquarters are located at:
Ambac Financial Group, Inc. One State Street Plaza New York, New York 10004 (212) 668-0340 (212) 509-9190 (fax) www.ambac.com
Investor Relations Contact: Vandana Sharma (212) 208-3333 (212) 208-3108 (fax) [email protected]
To obtain a copy of Ambac Financial Group, Inc.’s latest annual or quarterly report filed with the Securities and Exchange Commission or the most recent Annual Report to Stockholders, please call, write or e-mail the Investor Relations Department at the above number or address or download it from our website at www.ambac.com.
Ambac Financial Group, Inc. Quarterly Operating Supplement
First Quarter 2008
Table of Contents Annual Financial and Statistical Data……………………………………………………………… . 1 Key Financial Highlights…………………………………………………………………………..... 2 Earnings Analysis………………………………………………………………………………….... 3 First Quarter 2008 Earnings Release………………………………………………………………... 4-12 Consolidated Statements of Operations……………………………………………………………... 13 Consolidated Balance Sheets……………………………………………………………………….. 14 Financial Guarantees………………………………………………………………………………... 15 Normal Net Insurance Premiums Earned and Fees on Credit Derivatives………………………….. 16 Effect of Refundings, Calls and Other Accelerations……………………………………………… . 16 Public Finance New Issuance……………………………………………………………………….. 17 Net Exposure Amortization…………………………………………………………………………. 18 Net Unearned Premium Amortization and Estimated Future Installment Premiums ........................ 18 Fixed Income Investment Portfolio.................................................................................................... 19 Rating Distribution of Investment Portfolio….. ................................................................................ 19 Ratio of Net Claims Paid ................................................................................................................... 20 Summary of Net Insurance Loss Reserves and Credit Derivatives ................................................... 20 Summary of Below Investment Grade Exposures ............................................................................. 20 Expense Analysis ............................................................................................................................... 21 Deferred Expense Ratio Analysis ...................................................................................................... 21 Historical Financial Guarantee Exposures Outstanding .................................................................... 22 Bond Type Distribution of Financial Guarantee Exposures .............................................................. 23 Geographic Distribution of Financial Guarantee Exposures ............................................................. 24 Rating Distribution of Net Financial Guarantee Exposures............................................................... 24 Largest Domestic Public Finance Exposures..................................................................................... 25 Largest Domestic Healthcare Exposures ........................................................................................... 25 Largest Structured Finance Exposures............................................................................................... 26 Largest International Finance Exposures........................................................................................... 26 Statutory Accounting, Financial and Capital Information ................................................................. 27 Note 1: Throughout this Supplement adjusted book value (ABV) per share is reported and analyzed. ABV, is not promulgated in
conformity with U.S. generally accepted accounting principles (GAAP) and should not be considered a substitute for actual book value. It is used by management, equity analysts and investors as a measurement of the Company’s estimated intrinsic value with no benefit given for ongoing business activity. Management derives adjusted book value by beginning with stockholders’ equity (book value) and adding or subtracting the after-tax value of: the net unearned premium reserve; deferred acquisition costs; the present value of estimated net future installment premiums (discounted at 5.0% and 5.2% at March 31, 2008 and December 31, 2007, respectively); and the unrealized gain or loss on investment agreement liabilities. The definition of ABV used by the Company may differ from definitions of ABV used by other financial guarantors and should be considered in such context. The adjustments described above will not be realized until future periods and may differ materially from the amounts used in determining ABV.
Note 2: Credit enhancement production (CEP) and net credit enhancement production (NCEP), which are not promulgated
under GAAP, should not be considered a substitute for gross or net premiums written. CEP is used by management, equity analysts and investors as an indication of new business production. CEP, which Ambac reports as analytical data, is defined as gross (direct and assumed) up-front premiums written plus the present value of estimated installment premiums written on insurance policies, structured credit derivatives and other credit enhancement products issued in the period (discounted at 5.2% and 5.4% for the quarters ended March 31, 2008 and 2007, respectively). NCEP is defined as CEP less cessions to all reinsurers. The definition of CEP and NCEP used by Ambac may differ from definitions of CEP and NCEP used by other financial guarantors.
Note 3: Internal Ambac credit ratings contained in this Supplement are provided solely to indicate the underlying credit quality
of guaranteed obligations based on the view of Ambac Assurance. In cases where Ambac has insured multiple tranches of an issue with varying internal ratings, or more than one obligation of an issuer with varying internal ratings, a weighted average rating is used. Ambac credit ratings are subject to revision at anytime and do not constitute investment advice. Ambac Assurance, or one of its affiliates, has insured the obligations listed and may also provide other products or services to the issuers of these obligations for which Ambac may have received premiums or fees.
Note 4: Information contained in this report is unaudited.
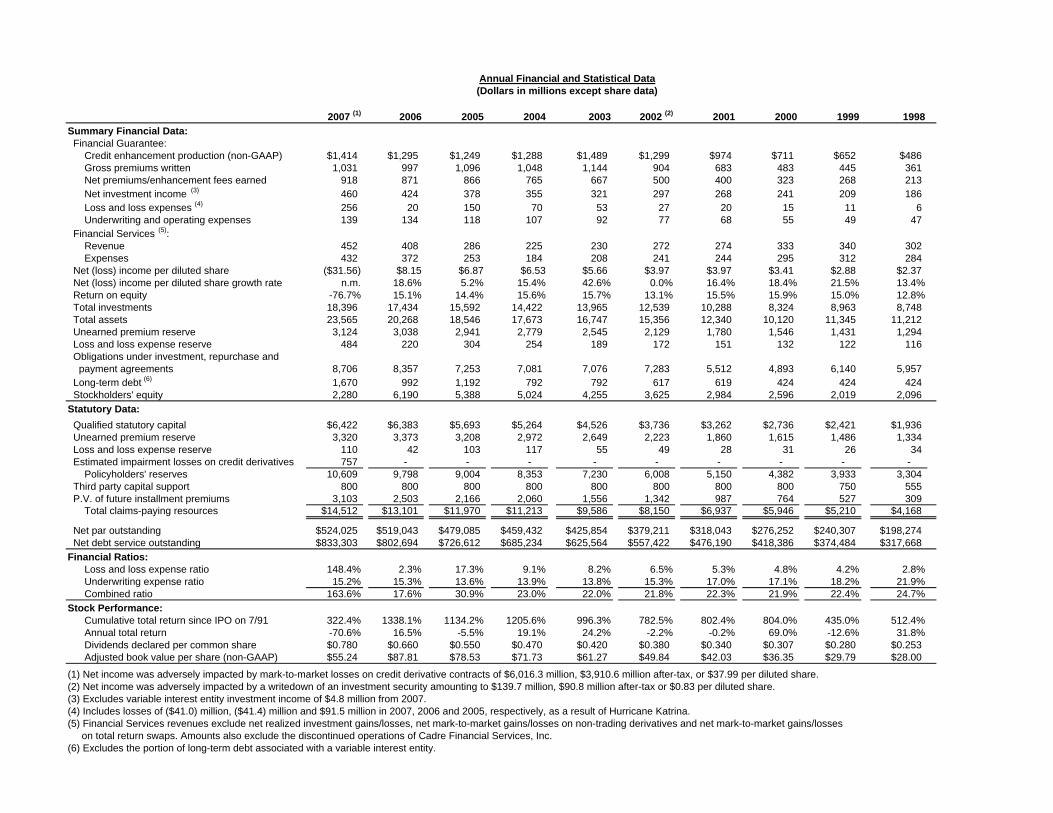
Annual Financial and Statistical Data(Dollars in millions except share data)
2007 (1) 2006 2005 2004 2003 2002 (2) 2001 2000 1999 1998Summary Financial Data: Financial Guarantee: Credit enhancement production (non-GAAP) $1,414 $1,295 $1,249 $1,288 $1,489 $1,299 $974 $711 $652 $486 Gross premiums written 1,031 997 1,096 1,048 1,144 904 683 483 445 361 Net premiums/enhancement fees earned 918 871 866 765 667 500 400 323 268 213 Net investment income (3) 460 424 378 355 321 297 268 241 209 186 Loss and loss expenses (4) 256 20 150 70 53 27 20 15 11 6 Underwriting and operating expenses 139 134 118 107 92 77 68 55 49 47 Financial Services (5): Revenue 452 408 286 225 230 272 274 333 340 302 Expenses 432 372 253 184 208 241 244 295 312 284 Net (loss) income per diluted share ($31.56) $8.15 $6.87 $6.53 $5.66 $3.97 $3.97 $3.41 $2.88 $2.37 Net (loss) income per diluted share growth rate n.m. 18.6% 5.2% 15.4% 42.6% 0.0% 16.4% 18.4% 21.5% 13.4% Return on equity -76.7% 15.1% 14.4% 15.6% 15.7% 13.1% 15.5% 15.9% 15.0% 12.8% Total investments 18,396 17,434 15,592 14,422 13,965 12,539 10,288 8,324 8,963 8,748 Total assets 23,565 20,268 18,546 17,673 16,747 15,356 12,340 10,120 11,345 11,212 Unearned premium reserve 3,124 3,038 2,941 2,779 2,545 2,129 1,780 1,546 1,431 1,294 Loss and loss expense reserve 484 220 304 254 189 172 151 132 122 116 Obligations under investment, repurchase and payment agreements 8,706 8,357 7,253 7,081 7,076 7,283 5,512 4,893 6,140 5,957 Long-term debt (6) 1,670 992 1,192 792 792 617 619 424 424 424 Stockholders' equity 2,280 6,190 5,388 5,024 4,255 3,625 2,984 2,596 2,019 2,096 Statutory Data: Qualified statutory capital $6,422 $6,383 $5,693 $5,264 $4,526 $3,736 $3,262 $2,736 $2,421 $1,936 Unearned premium reserve 3,320 3,373 3,208 2,972 2,649 2,223 1,860 1,615 1,486 1,334 Loss and loss expense reserve 110 42 103 117 55 49 28 31 26 34 Estimated impairment losses on credit derivatives 757 - - - - - - - - - Policyholders' reserves 10,609 9,798 9,004 8,353 7,230 6,008 5,150 4,382 3,933 3,304 Third party capital support 800 800 800 800 800 800 800 800 750 555 P.V. of future installment premiums 3,103 2,503 2,166 2,060 1,556 1,342 987 764 527 309 Total claims-paying resources $14,512 $13,101 $11,970 $11,213 $9,586 $8,150 $6,937 $5,946 $5,210 $4,168
Net par outstanding $524,025 $519,043 $479,085 $459,432 $425,854 $379,211 $318,043 $276,252 $240,307 $198,274 Net debt service outstanding $833,303 $802,694 $726,612 $685,234 $625,564 $557,422 $476,190 $418,386 $374,484 $317,668Financial Ratios: Loss and loss expense ratio 148.4% 2.3% 17.3% 9.1% 8.2% 6.5% 5.3% 4.8% 4.2% 2.8% Underwriting expense ratio 15.2% 15.3% 13.6% 13.9% 13.8% 15.3% 17.0% 17.1% 18.2% 21.9% Combined ratio 163.6% 17.6% 30.9% 23.0% 22.0% 21.8% 22.3% 21.9% 22.4% 24.7%Stock Performance: Cumulative total return since IPO on 7/91 322.4% 1338.1% 1134.2% 1205.6% 996.3% 782.5% 802.4% 804.0% 435.0% 512.4% Annual total return -70.6% 16.5% -5.5% 19.1% 24.2% -2.2% -0.2% 69.0% -12.6% 31.8% Dividends declared per common share $0.780 $0.660 $0.550 $0.470 $0.420 $0.380 $0.340 $0.307 $0.280 $0.253 Adjusted book value per share (non-GAAP) $55.24 $87.81 $78.53 $71.73 $61.27 $49.84 $42.03 $36.35 $29.79 $28.00
(1) Net income was adversely impacted by mark-to-market losses on credit derivative contracts of $6,016.3 million, $3,910.6 million after-tax, or $37.99 per diluted share.(2) Net income was adversely impacted by a writedown of an investment security amounting to $139.7 million, $90.8 million after-tax or $0.83 per diluted share.(3) Excludes variable interest entity investment income of $4.8 million from 2007.(4) Includes losses of ($41.0) million, ($41.4) million and $91.5 million in 2007, 2006 and 2005, respectively, as a result of Hurricane Katrina.(5) Financial Services revenues exclude net realized investment gains/losses, net mark-to-market gains/losses on non-trading derivatives and net mark-to-market gains/losses on total return swaps. Amounts also exclude the discontinued operations of Cadre Financial Services, Inc.(6) Excludes the portion of long-term debt associated with a variable interest entity.

Key Financial HighlightsFirst First
Quarter Quarter2008 2007
KEY FINANCIAL LINES
Net (loss) income ($ millions). . . . . . . . . . . . . . . . . . . . . . . . . . . . . . . . . . . . . . . ($1,660.3) $213.3Stockholders' equity ($ millions) . . . . . . . . . . . . . . . . . . . . . . . . . . . . . . . . . . . . $1,296.5 $5,989.2Return on equity . . . . . . . . . . . . . . . . . . . . . . . . . . . . . . . . . . . . . . . . . . . . . . . . . -371.4% 14.0%Total capitalization (1) ($ millions) . . . . . . . . . . . . . . . . . . . . . . . . . . . . . . . . . . . $2,915.2 $7,378.4Debt/total capital (1) . . . . . . . . . . . . . . . . . . . . . . . . . . . . . . . . . . . . . . . . . . . . . . . 55.5% 18.8%Capital ratio(2). . . . . . . . . . . . . . . . . . . . . . . . . . . . . . . . . . . . . . . . . . . . . . . . . . . . 120:1 125:1Claims-Paying ratio (2). . . . . . . . . . . . . . . . . . . . . . . . . . . . . . . . . . . . . . . . . . . . . 51:1 62:1Loss ratio (3) . . . . . . . . . . . . . . . . . . . . . . . . . . . . . . . . . . . . . . . . . . . . . . . . . . . . . 972.9% 4.9%Expense ratio (4) . . . . . . . . . . . . . . . . . . . . . . . . . . . . . . . . . . . . . . . . . . . . . . . . . . 24.0% 15.7%Combined ratio(3) (4) . . . . . . . . . . . . . . . . . . . . . . . . . . . . . . . . . . . . . . . . . . . . . . . 996.9% 20.6%Effective tax rates:
Financial Guarantee: Net investment income . . . . . . . . . . . . . . . . . . . . . . . . . . . . . . . . . . . . . . . 13.9% 13.0% Realized securities gains . . . . . . . . . . . . . . . . . . . . . . . . . . . . . . . . . . . . . 35.0% 35.0% Underwriting and other income . . . . . . . . . . . . . . . . . . . . . . . . . . . . . . . . 35.3% 35.6% Total Financial Guarantee. . . . . . . . . . . . . . . . . . . . . . . . . . . . . . . . . . 36.4% 27.0%
Financial Services . . . . . . . . . . . . . . . . . . . . . . . . . . . . . . . . . . . . . . . . . . . . 35.2% 32.7%Other. . . . . . . . . . . . . . . . . . . . . . . . . . . . . . . . . . . . . . . . . . . . . . . . . . . . . . . . 334% 41.5% Consolidated total effective tax rate. . . . . . . . . . . . . . . . . . . . . . . . . . . . . 40.5% 26.2%
STOCKHOLDER DATAMarket value per share . . . . . . . . . . . . . . . . . . . . . . . . . . . . . . . . . . . . . . . . . . . . $5.75 $86.39Net income per share. . . . . . . . . . . . . . . . . . . . . . . . . . . . . . . . . . . . . . . . . . . . . . ($11.69) $2.04Net income per diluted share. . . . . . . . . . . . . . . . . . . . . . . . . . . . . . . . . . . . . . . . ($11.69) $2.02
OTHER EARNINGS MEASURES (Per diluted share)Net (loss) income . . . . . . . . . . . . . . . . . . . . . . . . . . . . . . . . . . . . . . . . . . . . . . . . ($11.69) $2.02Net security losses and (gains) (5) . . . . . . . . . . . . . . . . . . . . . . . . . . . . . . . . . . . . $4.76 ($0.02)Other items . . . . . . . . . . . . . . . . . . . . . . . . . . . . . . . . . . . . . . . . . . . . . . . . . . . . . $0.00 $0.00Operating earnings (non-GAAP). . . . . . . . . . . . . . . . . . . . . . . . . . . . . . . . . . . . . ($6.93) $2.00Refundings, calls and other accelerations, net. . . . . . . . . . . . . . . . . . . . . . . . . . . ($0.15) ($0.24)Core earnings (non-GAAP) . . . . . . . . . . . . . . . . . . . . . . . . . . . . . . . . . . . . . . . . ($7.08) $1.76
ADJUSTED BOOK VALUE ANALYSIS (Per share)Book value. . . . . . . . . . . . . . . . . . . . . . . . . . . . . . . . . . . . . . . . . . . . . . . . . . . . . . $4.52 $58.85After-tax value of: Net unearned premium reserve less deferred acquisition costs. . . . . . . . . . . . 5.31 15.73 Present value of future installment premiums. . . . . . . . . . . . . . . . . . . . . . . . . 6.47 15.60 Unrealized loss on investment agreement liabilities. . . . . . . . . . . . . . . . . . . . (0.47) (0.72) Adjusted book value . . . . . . . . . . . . . . . . . . . . . . . . . . . . . . . . . . . . . . . . . . . . . . $15.83 $89.46
(1) Excludes the portion of long-term debt associated with variable interest entities of $272.5 million at March 31, 2008. (2) Capital and financial resources ratios (Statutory) and loss, expense and combined ratios (GAAP) relate solely to Financial Guarantee operations.(3) Loss ratio is computed as insurance loss and loss expense plus credit derivative estimated credit impairment losses divided by net premiums earned and fees earned on credit derivatives.(4) Expense ratio is computed as financial guarantee underwriting and operating expenses divided by net premiums earned and fees earned on credit derivatives.(5) Includes net gains and losses from sales of investment securities, net mark-to-market gains and losses on credit derivatives, total return swaps and non-trading derivatives in both the Financial Services and the Medium-Term Notes Conduit businesses.
2
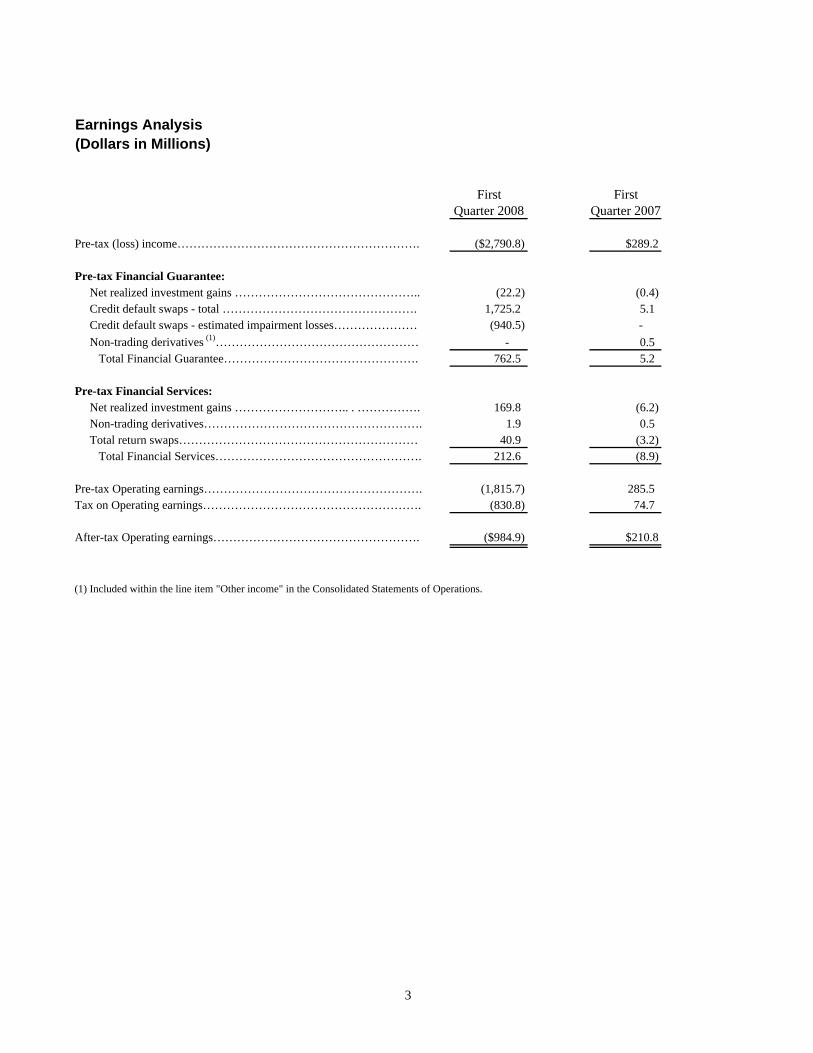
Earnings Analysis(Dollars in Millions)
First FirstQuarter 2008 Quarter 2007
Pre-tax (loss) income……………………………………………………. ($2,790.8) $289.2
Pre-tax Financial Guarantee: Net realized investment gains ……………………………………….. (22.2) (0.4) Credit default swaps - total …………………………………………. 1,725.2 5.1 Credit default swaps - estimated impairment losses………………… (940.5) - Non-trading derivatives (1)…………………………………………… - 0.5 Total Financial Guarantee…………………………………………. 762.5 5.2
Pre-tax Financial Services: Net realized investment gains ……………………….. . ……………. 169.8 (6.2) Non-trading derivatives………………………………………………. 1.9 0.5 Total return swaps…………………………………………………… 40.9 (3.2) Total Financial Services……………………………………………. 212.6 (8.9)
Pre-tax Operating earnings………………………………………………. (1,815.7) 285.5Tax on Operating earnings………………………………………………. (830.8) 74.7
After-tax Operating earnings……………………………………………. ($984.9) $210.8
(1) Included within the line item "Other income" in the Consolidated Statements of Operations.
3
4
For Immediate Release
AMBAC FINANCIAL GROUP, INC. ANNOUNCES FIRST QUARTER NET LOSS OF $1,660.3 MILLION First Quarter Net Loss Per Share of $11.69 Reflects
Mortgage-related Losses
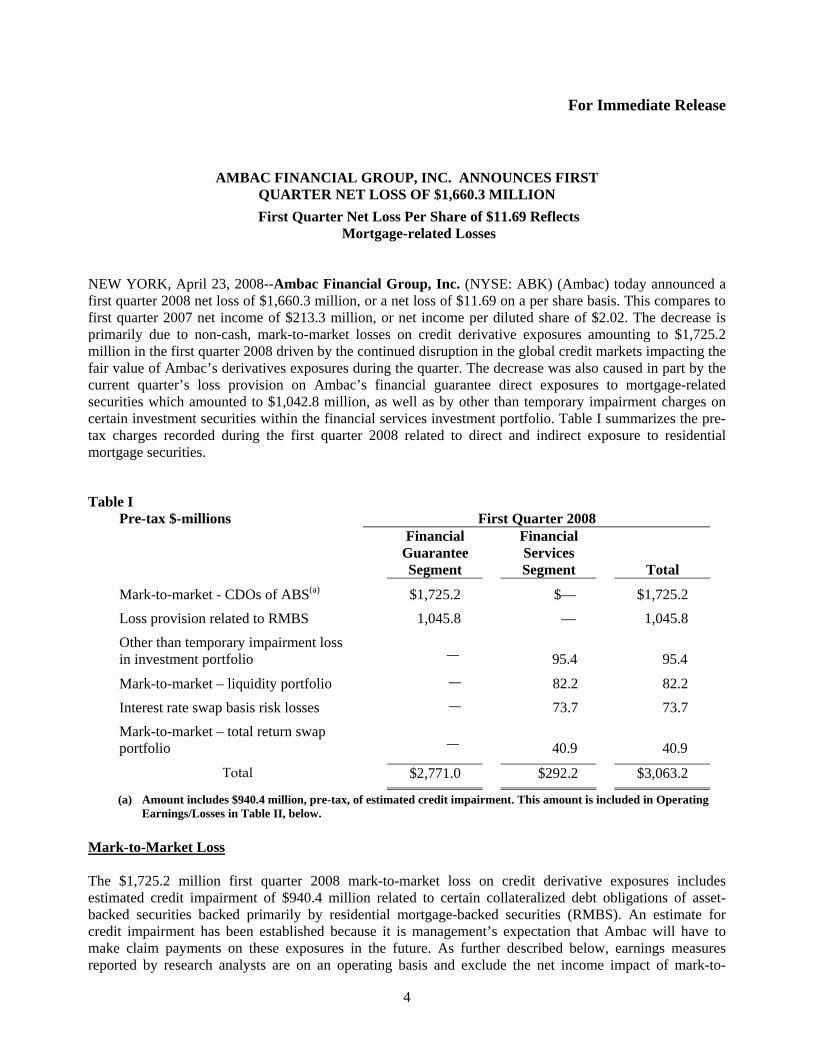
NEW YORK, April 23, 2008--Ambac Financial Group, Inc. (NYSE: ABK) (Ambac) today announced a first quarter 2008 net loss of $1,660.3 million, or a net loss of $11.69 on a per share basis. This compares to first quarter 2007 net income of $213.3 million, or net income per diluted share of $2.02. The decrease is primarily due to non-cash, mark-to-market losses on credit derivative exposures amounting to $1,725.2 million in the first quarter 2008 driven by the continued disruption in the global credit markets impacting the fair value of Ambac’s derivatives exposures during the quarter. The decrease was also caused in part by the current quarter’s loss provision on Ambac’s financial guarantee direct exposures to mortgage-related securities which amounted to $1,042.8 million, as well as by other than temporary impairment charges on certain investment securities within the financial services investment portfolio. Table I summarizes the pre-tax charges recorded during the first quarter 2008 related to direct and indirect exposure to residential mortgage securities.
Table I Pre-tax $-millions First Quarter 2008 Financial
Guarantee Segment
Financial Services Segment
Total
Mark-to-market - CDOs of ABS(a) $1,725.2 $— $1,725.2 Loss provision related to RMBS 1,045.8 — 1,045.8 Other than temporary impairment loss in investment portfolio
—
95.4
95.4
Mark-to-market – liquidity portfolio — 82.2 82.2
Interest rate swap basis risk losses — 73.7 73.7 Mark-to-market – total return swap portfolio
—
40.9
40.9
Total $2,771.0 $292.2 $3,063.2
(a) Amount includes $940.4 million, pre-tax, of estimated credit impairment. This amount is included in Operating Earnings/Losses in Table II, below.
Mark-to-Market Loss The $1,725.2 million first quarter 2008 mark-to-market loss on credit derivative exposures includes estimated credit impairment of $940.4 million related to certain collateralized debt obligations of asset-backed securities backed primarily by residential mortgage-backed securities (RMBS). An estimate for credit impairment has been established because it is management’s expectation that Ambac will have to make claim payments on these exposures in the future. As further described below, earnings measures reported by research analysts are on an operating basis and exclude the net income impact of mark-to-

5
market gains and losses on credit derivative contracts internally rated investment grade, as well as certain other items. Operating earnings2 in the first quarter 2008 includes the impact of the estimated $940.4 million credit impairment. Net Income/(Loss) Per Share
Net loss per share and net income per diluted share are computed in conformity with U.S. generally accepted accounting principles (GAAP). However, many research analysts and investors do not limit their analysis of our earnings to a strictly GAAP basis. In order to assist investors in their understanding of quarterly results, Ambac provides additional information.
Earnings measures reported by research analysts exclude the net income/(loss) impact of net gains and losses from sales of investment securities and mark-to-market gains and losses on credit, total return and non-trading derivative contracts internally rated investment grade (collectively “net security gains and losses”) and certain other items. Certain research analysts and investors further exclude the net income impact of accelerated premiums earned on guaranteed obligations that have been refunded and other accelerated earnings (“accelerated earnings”). During the first quarter 2008, net security losses had the effect of decreasing net income by $675.5 million, or $4.76 on a per share basis. Table II provides first quarter comparisons of earnings for 2008 and 2007.
Table II Earnings Per Diluted Share
First Quarter 2008 2007 % Change
Net (loss) per share / income per diluted share
($11.69)
$2.02
n.m.
Effect of net security losses /(gains) $8.39 ($0.02) Less impairment losses ($3.63) — Operating earnings (a) (b) ($6.93) $2.00 n.m. Effect of accelerated earnings ($0.15) ($0.24) Core (loss) / earnings (b) ($7.08) $1.76 n.m. (a) Consensus earnings that are reported by earnings estimate services, such as First Call, are on this basis. (b) Operating and core earnings are non-GAAP measures. See footnote 2, below. n.m. Not meaningful.
Commenting on the financial results, Mr. Callen, noted, “The housing market crisis continues to disrupt the global credit markets and our credit derivatives and direct mortgage portfolios were severely impacted once again. While we realize that these are disappointing credit results, we continue to believe that the capital raise and strategic business actions taken during the quarter will enable us to get beyond this credit market. The capital that we raised during the quarter in the midst of a very difficult market plus capital generated from the reduction in net par exposure helped bring our claims-paying resources to approximately $16.0 billion as of March 31, 2008. We currently exceed S&P’s AAA target level of capital by a comfortable margin and we expect to meet our goal of exceeding Moody’s Aaa target level of capital in the second quarter. Importantly, we generated positive operating cash flow during the quarter.” Mr. Callen continued, “Our team of professionals is working hard on restoring market faith in the Ambac brand and we have recently started to see some business come our way in the municipal markets. We feel strongly that our highly qualified professionals worldwide, our significant size and scale, and our expertise in select market sectors will result in new business opportunities."

6
Revenues Highlights • Credit enhancement production(1) in the first quarter of 2008 was $40.5 million, down from production
of $310.1 million reported in the first quarter of 2007.
Table III provides the quarterly comparisons of credit enhancement production by market segment for 2008 and 2007. Table III
Credit Enhancement Production (1) ($-millions) First Quarter
2008 2007 % Change
Public Finance $5.5 $114.6 -95% Structured Finance 29.4 135.4 -78% International 5.6 60.1 -91%
Total $40.5 $310.1 -87% As previously reported, Ambac has written very little business since late 2007 as fixed income investors awaited the results of rating agency reviews and resultant actions. In the U.S. municipal market issuance was down 22% quarter on quarter. Market penetration declined from approximately 52% a year ago to approximately 27% in the current quarter. Subsequent to Ambac’s successful $1.5 billion capital raise in early March, Ambac’s ratings remain on “negative outlook” and issuers seeking insurance have thus far opted to insure with competitors with stable triple-A ratings. During the first quarter 2008, Ambac announced that it had suspended underwriting all structured finance business for six months in order to accumulate capital. Global infrastructure, private finance initiative transactions and privatization transactions which finance essential infrastructure are not considered structured finance and are therefore not subject to the six month suspension of underwriting. Also, in the student loan sector, transactions issued by state and local government agencies and nonprofit issuers are not subject to the six month suspension of underwriting. The structured finance business written during the quarter relates to transactions that closed and transactions to which Ambac had committed prior to the announcement of suspension of underwriting.
• Net premiums written in the first quarter of 2008 of $135.7 million were 38% lower than net premiums
written of $220.4 million in the first quarter of 2007. The decrease is primarily a result of lower gross premiums written, as discussed above, and a higher percentage of ceded premiums written resulting from the reinsurance arrangement with Assured Guaranty Re Ltd. (“AG Re”) transacted in the fourth quarter 2007. Ceded premiums as a percentage of gross premiums written were 14.8% and 11.8% for the first quarter of 2008 and 2007, respectively.
• Net premiums earned for the first quarter of 2008 were $186.9 million, down 13% from $216.0 million
earned in the first quarter of 2007. Normal earned premiums in the first quarter 2008 of $172.9 million were 2% lower than $176.3 million reported in the first quarter 2007, primarily due to the AG Re cede which took place in early December 2007. The AG Re cede reduced normal earned premiums by $6.9 million in the current quarter.
7
Net premiums earned include accelerated premiums, which result from refundings, calls and other accelerations recognized during the quarter. Accelerated premiums were $14.0 million in the first quarter of 2008, down 65% from $39.7 million in accelerated premiums in the first quarter of 2007. During the first quarter 2008 and 2007, approximately 66% and 85%, respectively, of the accelerated premiums related to U.S. public finance transactions. Ambac's U.S. public finance refundings, measured by par, were down 42% as compared to the overall market decline of approximately 46%.
• Realized gains and other settlements from credit derivative contracts, during the periods presented represents the normal accretion into income of premiums received for transactions executed in credit derivative format. Such accretion for the first quarter of 2008 amounted to $17.0 million, which represented a 9% increase from the $15.6 million in the first quarter of 2007. The increase was driven by the increased credit derivative business written during the first half of 2007. In previous periods these amounts were referred to as “Other Credit Enhancement Fees” in the Consolidated Statements of Operations. This reclassification is the result of an industry-wide effort, in consultation with the Securities and Exchange Commission, to present the results from credit derivative transactions consistently.
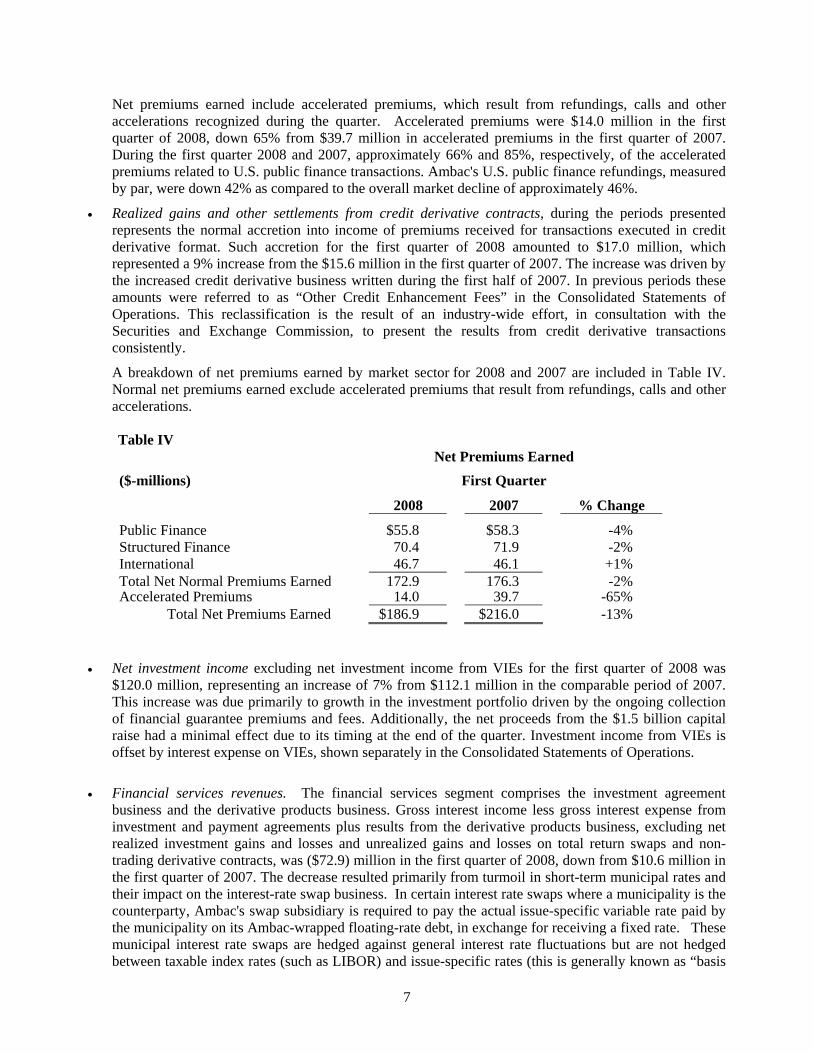
A breakdown of net premiums earned by market sector for 2008 and 2007 are included in Table IV. Normal net premiums earned exclude accelerated premiums that result from refundings, calls and other accelerations. Table IV
Net Premiums Earned ($-millions) First Quarter
2008 2007 % Change
Public Finance $55.8 $58.3 -4% Structured Finance 70.4 71.9 -2% International 46.7 46.1 +1% Total Net Normal Premiums Earned 172.9 176.3 -2% Accelerated Premiums 14.0 39.7 -65% Total Net Premiums Earned $186.9 $216.0 -13%
• Net investment income excluding net investment income from VIEs for the first quarter of 2008 was
$120.0 million, representing an increase of 7% from $112.1 million in the comparable period of 2007. This increase was due primarily to growth in the investment portfolio driven by the ongoing collection of financial guarantee premiums and fees. Additionally, the net proceeds from the $1.5 billion capital raise had a minimal effect due to its timing at the end of the quarter. Investment income from VIEs is offset by interest expense on VIEs, shown separately in the Consolidated Statements of Operations.
• Financial services revenues. The financial services segment comprises the investment agreement business and the derivative products business. Gross interest income less gross interest expense from investment and payment agreements plus results from the derivative products business, excluding net realized investment gains and losses and unrealized gains and losses on total return swaps and non-trading derivative contracts, was ($72.9) million in the first quarter of 2008, down from $10.6 million in the first quarter of 2007. The decrease resulted primarily from turmoil in short-term municipal rates and their impact on the interest-rate swap business. In certain interest rate swaps where a municipality is the counterparty, Ambac's swap subsidiary is required to pay the actual issue-specific variable rate paid by the municipality on its Ambac-wrapped floating-rate debt, in exchange for receiving a fixed rate. These municipal interest rate swaps are hedged against general interest rate fluctuations but are not hedged between taxable index rates (such as LIBOR) and issue-specific rates (this is generally known as “basis
8
risk”). A decline in demand for variable-rate municipal debt has driven issue-specific rate resets to very high levels thereby increasing Ambac's payment obligations under the interest rate swaps resulting in a ($16.8) million realized loss and a ($56.9) million mark-to-market loss for the quarter on this portfolio.
During the first quarter 2008, Ambac announced that it would discontinue writing new Financial Services business as part of its capital preservation strategy. The interest rate swap and investment agreement businesses will be run off. In the process of doing so, we expect to execute hedging transactions to mitigate risks in the respective books of business. Such hedging transactions may include execution of new investment agreement transactions whereby the proceeds of such new transactions would be invested in assets selected to improve duration matching of the investment agreement business assets and liabilities or to improve the cash flow profile of the portfolio.
Expenses
Highlights
• Financial guarantee expenses of $1,095.3 million for the first quarter of 2008 increased significantly from $47.8 million of expenses for the first quarter of 2007. Financial guarantee loss and loss expenses were $1,042.8 million in the first quarter of 2008, up from $11.4 million in the first quarter of 2007. See “Loss Reserve Activity,” below, for additional information on losses. Gross underwriting expenses of $38.7 million in the first quarter 2008 are down 21% from $49.2 million in the comparable prior quarter primarily as a result of lower compensation expense, primarily driven by prior year bonus accrual reversal and reduced equity-based compensation costs, and lower premium taxes driven by lower premiums written during the period. These decreases were partially offset by higher consulting and legal expenses related to the credit derivatives portfolio. As a result of the recent decline in underwriting, during the first quarter 2008 Ambac significantly reduced the level of expenses it defers to future periods. As a result, net underwriting expenses are not comparable, period to period.
Loss Reserve Activity
• Case basis loss reserves (loss reserves for exposures that have defaulted) increased $240.8 million during the first quarter of 2008 from $109.8 million at December 31, 2007 to $350.6 million at March 31, 2008. The increased case reserves relate primarily to second-lien RMBS transactions that are underperforming original expectations. Poor transaction performance accelerated during the quarter, particularly during February and March. Total net claims paid during the quarter amounted to $34.1 million.
• Active credit reserves (“ACR”) are established for probable and estimable losses due to credit deterioration on certain adversely classified insured transactions. The ACR increased by $767.9 million during the quarter, from $363.4 million at December 31, 2007 to $1,131.3 million at March 31, 2008. The increase was driven primarily by unfavorable credit activity within the second lien segment of the RMBS portfolio and to a lesser extent by Alt-A RMBS transactions.
• Case reserves and ACR for all direct residential mortgage-backed securities exposures amounted to $303.5 million and $1,011.3 million, respectively, at March 31, 2008, which on a combined basis represents 89% of Ambac’s net loss and loss expense reserves.
Other Items
• Total net securities gains/(losses) for the first quarter of 2008 were ($1,915.5) million, consisting of net realized losses or other than temporary impairments on investment securities of ($147.6) million, net mark-to-market losses on credit and total return derivatives of ($1,766.1) million and net mark-to-market losses on non-trading derivative contracts of ($1.8) million. Included in the net realized losses on
9
investment securities are ($95.4) million of other than temporary impairment losses on five highly-rated mortgage-related securities in the investment agreement portfolio with current par outstanding of approximately $233 million. Additionally, the net realized losses include ($82.2) million of mark-to-market losses on a “liquidity portfolio” within the investment agreement portfolio. That portfolio consists of highly-rated asset-backed securities which are reported as “available for sale” with mark-to-market losses reported through the Consolidated Statements of Operations in accordance with GAAP. The liquidity portfolio, consisting of securities with par outstanding of approximately $1,267 million, was established to fund potential pay downs and/or collateral needs of the investment agreement business.
During the quarter a net mark-to-market loss amounting to ($1,725.2) million was recorded related to contracts executed in credit default format, primarily in our collateralized debt obligation exposures. The negative mark-to-market continues to be driven by dramatically lower prices in certain structured finance asset classes particularly with respect to CDOs of ABS with subprime RMBS exposure. Pricing declines were observed throughout the quarter but were exceptionally large in March as recent poor transactional performance became public. Prices continue to be driven down by poor collateral performance, rating agency downgrades and uncertainty regarding the ultimate outcome of subprime and other residential mortgage-backed securities losses.
In the first quarter of 2007, net securities gains/(losses) were $3.7 million, consisting of net realized gains on investment securities of $6.6 million, net mark-to-market losses on credit and total return derivatives of ($1.9) million and net mark-to-market losses on non-trading derivative contracts of ($1.0) million.
Balance Sheet
Highlights
• Total assets as of March 31, 2008 were $24.93 billion, up 6% from total assets of $23.57 billion at December 31, 2007. The increase was primarily driven by cash generated from the capital raise in March and from an increase in the deferred tax asset, partially offset by the increase in net unrealized losses in the investment portfolio. The increased net unrealized losses are primarily due to credit spread widening in highly rated asset-backed securities within the investment agreement investment portfolio.
• As of March 31, 2008, stockholders’ equity was $1.30 billion, a 43% decrease from year-end 2007 stockholders’ equity of $2.28 billion. The decrease was primarily the result of the net loss reported for the period and the increase in net unrealized losses within the investment agreement investment portfolio as described above, partially offset by the capital raise in March 2008.
Annual Meeting of Stockholders The Board of Directors set the 2008 Annual Meeting of Stockholders for Tuesday, June 3, 2008, at 11:30 a.m. in New York City. The record date for determining stockholders entitled to notice of, and to vote at, the annual meeting was the close of business, April 7, 2008.
10
Forward-Looking Statements
This release contains statements that may constitute "forward-looking statements" within the meaning of the safe harbor provisions of the Private Securities Litigation Reform Act of 1995. Any or all of management’s forward-looking statements here or in other publications may turn out to be wrong and are based on Ambac’s management current belief or opinions. Ambac’s actual results may vary materially, and there are no guarantees about the performance of Ambac’s securities. Among events, risks, uncertainties or factors that could cause actual results to differ materially are: (1) changes in the economic, credit, foreign currency or interest rate environment in the United States and abroad; (2) the level of activity within the national and worldwide credit markets; (3) competitive conditions and pricing levels; (4) legislative and regulatory developments; (5) changes in tax laws; (6) changes in our business plan, including changes resulting from our decision to discontinue writing new business in the financial services area, to significantly reduce new underwriting of structured finance business and to discontinue all new underwritings of structured finance business for six months; (7) the policies and actions of the United States and other governments; (8) changes in capital requirements whether resulting from downgrades in our insured portfolio or changes in rating agencies’ rating criteria or other reasons; (9) changes in Ambac’s and/or Ambac Assurance’s credit or financial strength ratings; (10) changes in accounting principles or practices relating to the financial guarantee industry or that may impact Ambac’s reported financial results; (11) inadequacy of reserves established for losses and loss expenses; (12) default by one or more of Ambac Assurance’s portfolio investments, insured issuers, counterparties or reinsurers; (13) credit risk throughout our business, including large single exposures to reinsurers; (14) market spreads and pricing on insured collateralized debt obligations (“CDOs”) and other derivative products insured or issued by Ambac; (15) credit risk related to residential mortgage securities and CDOs; (16) the risk that holders of debt securities or counterparties on credit default swaps or other similar agreements seek to declare events of default or seek judicial relief or bring claims alleging violation or breach of covenants by Ambac or one of its subsidiaries; (17) the risk that our underwriting and risk management policies and practices do not anticipate certain risks and/or the magnitude of potential for loss as a result of unforeseen risks; (18) the risk of volatility in income and earnings, including volatility due to the application of fair value accounting, or FAS 133, to the portion of our credit enhancement business which is executed in credit derivative form; (19) operational risks, including with respect to internal processes, risk models, systems and employees; (20) the risk of decline in market position; (21) the risk that market risks impact assets in our investment portfolio; (22) the risk of credit and liquidity risk due to unscheduled and unanticipated withdrawals on investment agreements; (23) changes in prepayment speeds on insured asset-backed securities; (24) factors that may influence the amount of installment premiums paid to Ambac; (25) the risk that we may be required to raise additional capital, which could have a dilutive effect on our outstanding equity capital and/or future earnings; (26) our ability or inability to raise additional capital, including the risks that regulatory or other approvals for any plan to raise capital are not obtained, or that various conditions to such a plan, either imposed by third parties or imposed by Ambac or its Board of Directors, are not satisfied and thus potentially necessary capital raising transactions do not occur, or the risk that for other reasons the Company cannot accomplish any potentially necessary capital raising transactions, including the transactions contemplated hereby; (27) the risk that Ambac’s holding company structure and certain regulatory and other constraints, including adverse business performance, affect Ambac’s ability to pay dividends and make other payments; (28) the risk of litigation and regulatory inquiries or investigations, and the risk of adverse outcomes in connection therewith, which could have a material adverse effect on our business, operations, financial position, profitability or cash flows; (29) other factors discussed under “Risk Factors” in this prospectus supplement, described in the Risk Factors section in Part I, 1A of our Annual Report on Form 10-K for the fiscal year ended December 31, 2007 and also disclosed from time to time by Ambac in its subsequent reports on Form 10-Q and Form 8-K, which are or will be available on the Ambac website at www.ambac.com and at the SEC’s website, www.sec.gov; and (30) other risks and uncertainties that have not been identified at this time. Readers are cautioned that forward-looking statements speak only as of the date they are made and that Ambac does not undertake to update forward-looking statements to reflect circumstances or events that arise

11
after the date the statements are made. You are therefore advised to consult any further disclosures we make on related subjects in Ambac’s reports to the SEC. Ambac may also, from time to time, disclose financial information on a non-GAAP basis where management believes this information is valuable to investors in gauging the quality of Ambac’s financial performance and identifying trends.
*******************
Ambac Financial Group, Inc., headquartered in New York City, is a holding company whose affiliates provide financial guarantees and financial services to clients in both the public and private sectors around the world. Ambac's principal operating subsidiary, Ambac Assurance Corporation, a guarantor of public finance and structured finance obligations, has earned triple-A ratings from Moody's Investors Service, Inc. and Standard & Poor's Ratings Services; and a double-A rating from Fitch, Inc. Moody's, Standard & Poor's and Fitch all maintain a “negative outlook”. Ambac Financial Group, Inc. common stock is listed on the New York Stock Exchange (ticker symbol ABK).
********************
Footnotes (1) Credit enhancement production, a non-GAAP measure, is used by management, equity analysts and
investors as an indication of new business production in the period. Credit enhancement production, which Ambac reports as analytical data, is defined as gross (direct and assumed) up-front premiums plus the present value of estimated installment premiums on insurance policies and structured credit derivatives issued in the period. The discount rate used to measure the present value of estimated installment premiums was 5.2% and 5.4% during the first quarter of 2008 and 2007, respectively. The definition of credit enhancement production used by Ambac may differ from definitions of credit enhancement production (or similar terms) used by other public holding companies of financial guarantors. The following table reconciles credit enhancement production to gross premiums written calculated in accordance with GAAP:
$-millions First Quarter
2008
2007
Credit enhancement production $ 40 $ 310
Present value of estimated installment premiums written on insurance policies and structured credit derivatives issued in the period
(33)
(198) Gross up-front premiums written
7
112
Gross installment premiums written on insurance policies
152
138 Gross premiums written
$ 159
$ 250

12
(2) Operating earnings and core earnings are not substitutes for net income computed in accordance
with GAAP, but are useful measures of performance used by management, equity analysts and investors because they allow more consistent period-to-period comparison of our earnings without the effects of net securities gains/losses and accelerated earnings. Net securities gains/losses excluded from operating earnings consists of investment portfolio realized gains and losses, mark-to-market gains and losses on credit, total return and non-trading derivative contracts for investment grade rated exposures, and certain other items. Core earnings further exclude the impact of refundings, calls and other accelerations. The definitions of operating earnings and core earnings used by Ambac may differ from definitions of operating earnings and core earnings used by other public holding companies of financial guarantors.
Contact Information: Investor/Media Contact: Vandana Sharma (212) 208-3333 [email protected] Fixed Income Contact: Peter Poillon (212) 208-3222 [email protected]

Consolidated Statements of Operations
First Quarter($ in Thousands, Except Share Data) 2008 2007Revenues: Financial Guarantee:
Gross premiums written……………………………………………………………. $159,207 $249,912Ceded premiums written……………………………………………………………. (23,534) (29,484) Net premiums written……………………………………………………………… $135,673 $220,428
Normal net premiums earned………………………………………………………. $172,870 $176,280Accelerated net premiums earned…………………………………………………. 13,996 39,726 Total net premiums earned…………………………………………………………. 186,866 216,006 Net investment income……………………………………………………………… 120,014 112,064 Net investment income from VIEs…………………………………………………. 3,631 - Net realized gains……………………………………………………………………. 22,212 440
Realized gains and other settlements on credit derivative contracts………….. 16,973 15,553 Unrealized losses on credit derivative contracts…………..…………………….. (1,725,172) (5,124) Net change in fair value of credit derivative contracts…………………………. (1,708,199) 10,429 Other income………………………………………………………………………… 8,457 2,856
Financial Services:Investment income………………………………………………………………….. 84,926 105,970 Derivative products…………………………………………………………………. (68,820) 3,606 Net realized investment gains……………………………………………………… (169,792) 6,161 Net mark-to-market (losses) gains on total return swap contracts…………….. (40,928) 3,215 Net mark-to-market losses on non-trading derivatives contracts……………… (1,833) (499)
Corporate:Net investment income……………………………………………………………… 827 1,581 Total revenues…………………………………………………………………….. (1,562,639) 461,829
Expenses: Financial Guarantee:
Losses and loss expenses…………………………………………………………. 1,042,761 11,422 Underwriting and operating expenses……………………………………………. 48,982 36,376 Interest expense on variable interest entity notes………………………………. 3,557 -
Financial Services:Interest from investment and payment agreements…………………………….. 89,003 98,958 Other expenses……………………………………………………………………… 3,389 3,288
Corporate: Interest……………………………………………………………………………….. 24,377 19,289 Other expenses………………………………………………………………………. 16,076 3,256
Total expenses…………………………………………………………………….. 1,228,145 172,589 (Loss) income before income taxes………………………………………………………. (2,790,784) 289,240 Provision for income taxes………………………………………………………………… (1,130,441) 75,897
Net (loss) income…………………………………………………………………… ($1,660,343) $213,343
Net (loss) income per share………………………………………………………… ($11.69) $2.04Net (loss) income per diluted share……………………………………………….. ($11.69) $2.02
Weighted average number of shares outstanding……………………………………… 142,032,462 104,643,529 Weighted average number of diluted shares outstanding…………………………….. 142,032,462 105,600,555
13
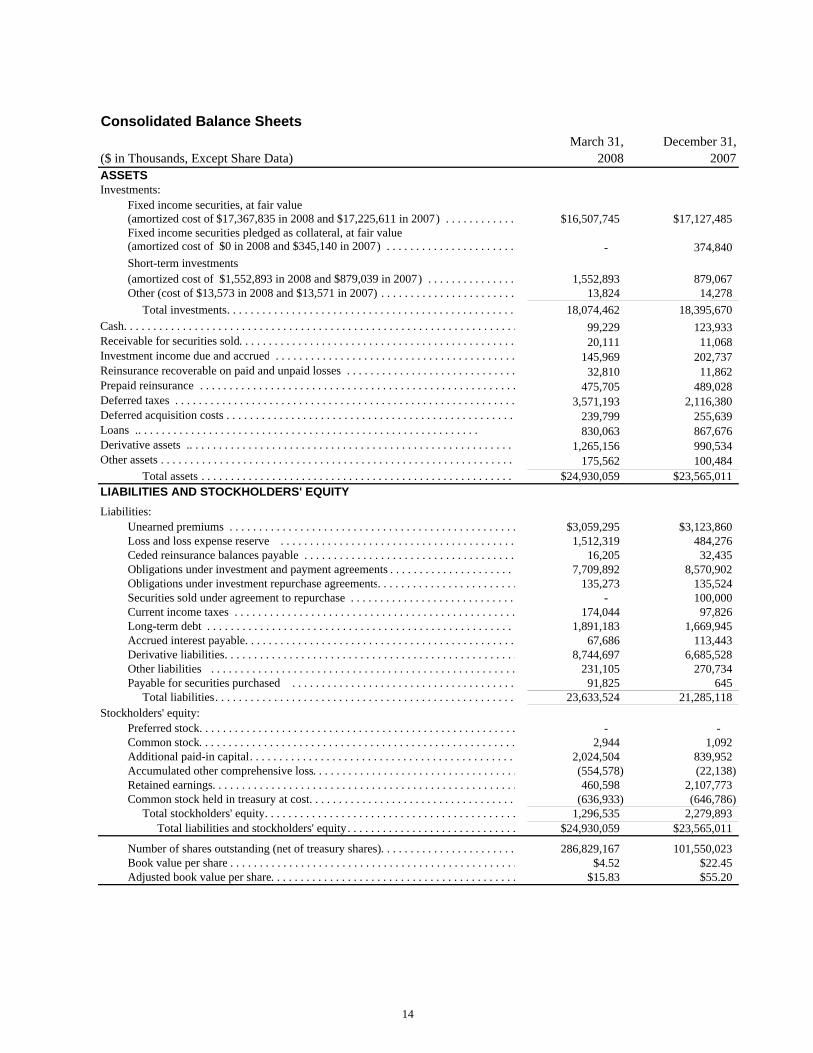
Consolidated Balance Sheets March 31, December 31,
($ in Thousands, Except Share Data) 2008 2007ASSETSInvestments:
Fixed income securities, at fair value(amortized cost of $17,367,835 in 2008 and $17,225,611 in 2007) . . . . . . . . . . . . $16,507,745 $17,127,485Fixed income securities pledged as collateral, at fair value(amortized cost of $0 in 2008 and $345,140 in 2007) . . . . . . . . . . . . . . . . . . . . . . - 374,840 Short-term investments(amortized cost of $1,552,893 in 2008 and $879,039 in 2007) . . . . . . . . . . . . . . . 1,552,893 879,067 Other (cost of $13,573 in 2008 and $13,571 in 2007) . . . . . . . . . . . . . . . . . . . . . . . 13,824 14,278 Total investments. . . . . . . . . . . . . . . . . . . . . . . . . . . . . . . . . . . . . . . . . . . . . . . . . 18,074,462 18,395,670
Cash. . . . . . . . . . . . . . . . . . . . . . . . . . . . . . . . . . . . . . . . . . . . . . . . . . . . . . . . . . . . . . . . . . . 99,229 123,933 Receivable for securities sold. . . . . . . . . . . . . . . . . . . . . . . . . . . . . . . . . . . . . . . . . . . . . . . 20,111 11,068 Investment income due and accrued . . . . . . . . . . . . . . . . . . . . . . . . . . . . . . . . . . . . . . . . . 145,969 202,737 Reinsurance recoverable on paid and unpaid losses . . . . . . . . . . . . . . . . . . . . . . . . . . . . . 32,810 11,862 Prepaid reinsurance . . . . . . . . . . . . . . . . . . . . . . . . . . . . . . . . . . . . . . . . . . . . . . . . . . . . . . 475,705 489,028 Deferred taxes . . . . . . . . . . . . . . . . . . . . . . . . . . . . . . . . . . . . . . . . . . . . . . . . . . . . . . . . . . 3,571,193 2,116,380 Deferred acquisition costs . . . . . . . . . . . . . . . . . . . . . . . . . . . . . . . . . . . . . . . . . . . . . . . . . 239,799 255,639 Loans .. . . . . . . . . . . . . . . . . . . . . . . . . . . . . . . . . . . . . . . . . . . . . . . . . . . . . . . . . . 830,063 867,676 Derivative assets .. . . . . . . . . . . . . . . . . . . . . . . . . . . . . . . . . . . . . . . . . . . . . . . . . . . . . . . 1,265,156 990,534 Other assets . . . . . . . . . . . . . . . . . . . . . . . . . . . . . . . . . . . . . . . . . . . . . . . . . . . . . . . . . . . . 175,562 100,484
Total assets . . . . . . . . . . . . . . . . . . . . . . . . . . . . . . . . . . . . . . . . . . . . . . . . . . . . . $24,930,059 $23,565,011LIABILITIES AND STOCKHOLDERS' EQUITYLiabilities:
Unearned premiums . . . . . . . . . . . . . . . . . . . . . . . . . . . . . . . . . . . . . . . . . . . . . . . . . $3,059,295 $3,123,860Loss and loss expense reserve . . . . . . . . . . . . . . . . . . . . . . . . . . . . . . . . . . . . . . . . 1,512,319 484,276 Ceded reinsurance balances payable . . . . . . . . . . . . . . . . . . . . . . . . . . . . . . . . . . . . 16,205 32,435 Obligations under investment and payment agreements . . . . . . . . . . . . . . . . . . . . . 7,709,892 8,570,902 Obligations under investment repurchase agreements. . . . . . . . . . . . . . . . . . . . . . . . 135,273 135,524 Securities sold under agreement to repurchase . . . . . . . . . . . . . . . . . . . . . . . . . . . . - 100,000 Current income taxes . . . . . . . . . . . . . . . . . . . . . . . . . . . . . . . . . . . . . . . . . . . . . . . . 174,044 97,826 Long-term debt . . . . . . . . . . . . . . . . . . . . . . . . . . . . . . . . . . . . . . . . . . . . . . . . . . . . 1,891,183 1,669,945 Accrued interest payable. . . . . . . . . . . . . . . . . . . . . . . . . . . . . . . . . . . . . . . . . . . . . . 67,686 113,443 Derivative liabilities. . . . . . . . . . . . . . . . . . . . . . . . . . . . . . . . . . . . . . . . . . . . . . . . . . 8,744,697 6,685,528 Other liabilities . . . . . . . . . . . . . . . . . . . . . . . . . . . . . . . . . . . . . . . . . . . . . . . . . . . . 231,105 270,734 Payable for securities purchased . . . . . . . . . . . . . . . . . . . . . . . . . . . . . . . . . . . . . . 91,825 645 Total liabilities. . . . . . . . . . . . . . . . . . . . . . . . . . . . . . . . . . . . . . . . . . . . . . . . . . . 23,633,524 21,285,118
Stockholders' equity:
Preferred stock. . . . . . . . . . . . . . . . . . . . . . . . . . . . . . . . . . . . . . . . . . . . . . . . . . . . . . - - Common stock. . . . . . . . . . . . . . . . . . . . . . . . . . . . . . . . . . . . . . . . . . . . . . . . . . . . . . 2,944 1,092 Additional paid-in capital. . . . . . . . . . . . . . . . . . . . . . . . . . . . . . . . . . . . . . . . . . . . . 2,024,504 839,952 Accumulated other comprehensive loss. . . . . . . . . . . . . . . . . . . . . . . . . . . . . . . . . . . (554,578) (22,138) Retained earnings. . . . . . . . . . . . . . . . . . . . . . . . . . . . . . . . . . . . . . . . . . . . . . . . . . . . 460,598 2,107,773 Common stock held in treasury at cost. . . . . . . . . . . . . . . . . . . . . . . . . . . . . . . . . . . (636,933) (646,786) Total stockholders' equity. . . . . . . . . . . . . . . . . . . . . . . . . . . . . . . . . . . . . . . . . . . 1,296,535 2,279,893 Total liabilities and stockholders' equity. . . . . . . . . . . . . . . . . . . . . . . . . . . . . $24,930,059 $23,565,011
Number of shares outstanding (net of treasury shares). . . . . . . . . . . . . . . . . . . . . . . 286,829,167 101,550,023 Book value per share . . . . . . . . . . . . . . . . . . . . . . . . . . . . . . . . . . . . . . . . . . . . . . . . . $4.52 $22.45Adjusted book value per share. . . . . . . . . . . . . . . . . . . . . . . . . . . . . . . . . . . . . . . . . . $15.83 $55.20
14

Financial Guarantees(1)(2)(3)
($ Thousands) 2008 2007Public Finance: Gross Par Guaranteed . . . . . . . . . . . . . . . . . . . . . . . . . . . . . . . . . . . . . . . . . . . . . . . . . . . . . . . . . . . . . . $517,061 $13,906,376
Up-front Premium . . . . . . . . . . . . . . . . . . . . . . . . . . . . . . . . . . . . . . . . . . . . . . . . . . . . . . . . . . . . . . . . . . $4,849 $106,089 Installment Premium . . . . . . . . . . . . . . . . . . . . . . . . . . . . . . . . . . . . . . . . . . . . . . . . . . . . . . . . . . . . . . . 8,358 8,301 Gross Premium . . . . . . . . . . . . . . . . . . . . . . . . . . . . . . . . . . . . . . . . . . . . . . . . . . . . . . . . . . . . . . . . . $13,207 $114,390
Credit Enhancement Production . . . . . . . . . . . . . . . . . . . . . . . . . . . . . . . . . . . . . . . . . . . . . . . . . . . . $5,524 $114,614
Net Credit Enhancement Production . . . . . . . . . . . . . . . . . . . . . . . . . . . . . . . . . . . . . . . . . . . . . . . . $5,038 $100,409
Structured Finance: Gross Par Guaranteed . . . . . . . . . . . . . . . . . . . . . . . . . . . . . . . . . . . . . . . . . . . . . . . . . . . . . . . . . . . . . . $3,828,012 $15,065,618
Up-front Premium . . . . . . . . . . . . . . . . . . . . . . . . . . . . . . . . . . . . . . . . . . . . . . . . . . . . . . . . . . . . . . . . . . $1,690 $4,309 Installment Premium . . . . . . . . . . . . . . . . . . . . . . . . . . . . . . . . . . . . . . . . . . . . . . . . . . . . . . . . . . . . . . . 80,537 78,927 Gross Premium . . . . . . . . . . . . . . . . . . . . . . . . . . . . . . . . . . . . . . . . . . . . . . . . . . . . . . . . . . . . . . . . . $82,227 $83,236
Credit Enhancement Production . . . . . . . . . . . . . . . . . . . . . . . . . . . . . . . . . . . . . . . . . . . . . . . . . . . . $29,356 $135,350
Net Credit Enhancement Production . . . . . . . . . . . . . . . . . . . . . . . . . . . . . . . . . . . . . . . . . . . . . . . . $26,816 $118,695
International Finance: Gross Par Guaranteed . . . . . . . . . . . . . . . . . . . . . . . . . . . . . . . . . . . . . . . . . . . . . . . . . . . . . . . . . . . . . . $541,535 $2,535,594
Up-front Premium . . . . . . . . . . . . . . . . . . . . . . . . . . . . . . . . . . . . . . . . . . . . . . . . . . . . . . . . . . . . . . . . . . $377 $1,824 Installment Premium . . . . . . . . . . . . . . . . . . . . . . . . . . . . . . . . . . . . . . . . . . . . . . . . . . . . . . . . . . . . . . . 63,396 50,462 Gross Premium . . . . . . . . . . . . . . . . . . . . . . . . . . . . . . . . . . . . . . . . . . . . . . . . . . . . . . . . . . . . . . . . . $63,773 $52,286
Credit Enhancement Production . . . . . . . . . . . . . . . . . . . . . . . . . . . . . . . . . . . . . . . . . . . . . . . . . . . . $5,603 $60,115
Net Credit Enhancement Production . . . . . . . . . . . . . . . . . . . . . . . . . . . . . . . . . . . . . . . . . . . . . . . . $5,413 $42,690
Grand Total: Gross Par Guaranteed . . . . . . . . . . . . . . . . . . . . . . . . . . . . . . . . . . . . . . . . . . . . . . . . . . . . . . . . . . . . . . $4,886,608 $31,507,588
Up-front Premium . . . . . . . . . . . . . . . . . . . . . . . . . . . . . . . . . . . . . . . . . . . . . . . . . . . . . . . . . . . . . . . . . . $6,916 $112,222 Installment Premium . . . . . . . . . . . . . . . . . . . . . . . . . . . . . . . . . . . . . . . . . . . . . . . . . . . . . . . . . . . . . . . 152,291 137,690 Gross Premium . . . . . . . . . . . . . . . . . . . . . . . . . . . . . . . . . . . . . . . . . . . . . . . . . . . . . . . . . . . . . . . . . $159,207 $249,912
Credit Enhancement Production . . . . . . . . . . . . . . . . . . . . . . . . . . . . . . . . . . . . . . . . . . . . . . . . . . . . $40,483 $310,079
Net Credit Enhancement Production . . . . . . . . . . . . . . . . . . . . . . . . . . . . . . . . . . . . . . . . . . . . . . . . $37,267 $261,794
(1) Credit enhancement production (CEP) and net credit enhancement production (NCEP) includes reinsurance assumed of $2.4 million and $12.8 million for the three months ended March 2008 and 2007, respectively. NCEP is defined as CEP less reinsurance cessions.(2) International Finance includes components of domestic exposure. (3) CEP and NCEP were discounted at rates of 5.2% and 5.4% in the first quarter of 2008 and 2007, respectively.
First Quarter
15

Normal Net Insurance Premiums Earned and Fees on Credit DerivativesFirst Second Third Fourth Year-to
2008 ($ Thousands) Quarter Quarter Quarter Quarter DatePublic Finance:Up-front premiums earned . . . . . . . . . . . . . . . . . . . . . . . . . . . . . . . . . . . . . . . . . . . . . . . . . . $48,778 $48,778Installment premiums earned . . . . . . . . . . . . . . . . . . . . . . . . . . . . . . . . . . . . . . . . . . . . . . . 7,033 7,033 Total Public Finance premiums earned . . . . . . . . . . . . . . . . . . . . . . . . . . . . . . . . . . . 55,811 - - - 55,811
Structured Finance:Up-front premiums earned . . . . . . . . . . . . . . . . . . . . . . . . . . . . . . . . . . . . . . . . . . . . . . . . . . 3,956 3,956 Installment premiums earned . . . . . . . . . . . . . . . . . . . . . . . . . . . . . . . . . . . . . . . . . . . . . . . 66,418 66,418 Total Structured Finance premiums earned . . . . . . . . . . . . . . . . . . . . . . . . . . . . . . . 70,374 - - - 70,374
International Finance:Up-front premiums earned . . . . . . . . . . . . . . . . . . . . . . . . . . . . . . . . . . . . . . . . . . . . . . . . . . 5,082 5,082 Installment premiums earned . . . . . . . . . . . . . . . . . . . . . . . . . . . . . . . . . . . . . . . . . . . . . . . 41,603 41,603 Total International Finance premiums earned . . . . . . . . . . . . . . . . . . . . . . . . . . . . . 46,685 - - - 46,685
Total normal premiums earned . . . . . . . . . . . . . . . . . . . . . . . . . . . . . . . . . . . . . . . . $172,870 $0 $0 $0 $172,870
Fees on credit derivative contracts (1) . . . . . . . . . . . . . . . . . . . . . . . . . . . . . . . . . . . . . . . . $16,973 $0 $0 $0 $16,973
First Second Third Fourth Full2007 ($ Thousands) Quarter Quarter Quarter Quarter YearPublic Finance:Up-front premiums earned . . . . . . . . . . . . . . . . . . . . . . . . . . . . . . . . . . . . . . . . . . . . . . . . . . $51,170 $52,005 $51,748 $50,880 $205,803Installment premiums earned . . . . . . . . . . . . . . . . . . . . . . . . . . . . . . . . . . . . . . . . . . . . . . . 7,182 7,070 7,281 7,514 29,047 Total Public Finance premiums earned . . . . . . . . . . . . . . . . . . . . . . . . . . . . . . . . . . . 58,352 59,075 59,029 58,394 234,850
Structured Finance:Up-front premiums earned . . . . . . . . . . . . . . . . . . . . . . . . . . . . . . . . . . . . . . . . . . . . . . . . . . 4,624 4,492 4,319 4,205 17,640 Installment premiums earned . . . . . . . . . . . . . . . . . . . . . . . . . . . . . . . . . . . . . . . . . . . . . . . 67,245 69,487 68,631 68,720 274,083 Total Structured Finance premiums earned . . . . . . . . . . . . . . . . . . . . . . . . . . . . . . . 71,869 73,979 72,950 72,925 291,723
International Finance:Up-front premiums earned . . . . . . . . . . . . . . . . . . . . . . . . . . . . . . . . . . . . . . . . . . . . . . . . . . 5,801 5,776 5,366 5,536 22,479 Installment premiums earned . . . . . . . . . . . . . . . . . . . . . . . . . . . . . . . . . . . . . . . . . . . . . . . 40,258 39,153 41,044 42,971 163,426 Total International Finance premiums earned . . . . . . . . . . . . . . . . . . . . . . . . . . . . . 46,059 44,929 46,410 48,507 185,905
Total normal premiums earned . . . . . . . . . . . . . . . . . . . . . . . . . . . . . . . . . . . . . . . . $176,280 $177,983 $178,389 $179,826 $712,478
Fees on credit derivative contracts (1) . . . . . . . . . . . . . . . . . . . . . . . . . . . . . . . . . . . . . . . . $15,553 $17,332 $20,035 $23,514 $76,434
Effect of Refundings, Calls and Other AccelerationsFirst Second Third Fourth Year-to
2008 ($ Thousands, Except Share Data) Quarter Quarter Quarter Quarter Date
Earned premium recognized from refundings, calls and other accelerations. . . . $13,996 $13,996Net income effect . . . . . . . . . . . . . . . . . . . . . . . . . . . . . . . . . . . . . . . . . . . . . . . . . . . . . . . . . . $20,372 $20,372Net income per diluted share effect . . . . . . . . . . . . . . . . . . . . . . . . . . . . . . . . . . . . . . . . . . $0.15 $0.15
First Second Third Fourth Full2007 ($ Thousands, Except Share Data) Quarter Quarter Quarter Quarter Year
Earned premium recognized from refundings, calls and other accelerations. . . . $39,726 $43,036 $16,406 $29,815 $128,983Net income effect . . . . . . . . . . . . . . . . . . . . . . . . . . . . . . . . . . . . . . . . . . . . . . . . . . . . . . . . . . $24,658 $25,588 $9,559 $18,395 $78,200Net income per diluted share effect . . . . . . . . . . . . . . . . . . . . . . . . . . . . . . . . . . . . . . . . . . $0.24 $0.25 $0.10 $0.18 $0.76
(1) Fees on credit derivative contracts are included in "Realized gains & other settlements on credit derivative contracts" on the consolidated statement of operations.
16

Public Finance New Issuance (1)(2)
MarketInsured Share
($ Millions of Par Value) Issued Insured Percent Insured Percent2008 By Quarter
First. . . . . . . . . . . . . . . . . . . . . . . . . . . . . . . . . $83,367 $22,258 26.7% $261 1.2%2007 By Quarter
Fourth . . . . . . . . . . . . . . . . . . . . . . . . . . . . . . . $105,725 $43,667 41.3% $7,744 17.7%Third . . . . . . . . . . . . . . . . . . . . . . . . . . . . . . . . 92,957 46,531 50.1% 13,019 28.0%Second . . . . . . . . . . . . . . . . . . . . . . . . . . . . . . . 123,917 55,703 45.0% 11,422 20.5%First. . . . . . . . . . . . . . . . . . . . . . . . . . . . . . . . . 106,411 55,117 51.8% 13,340 24.2%
Full Year
Year-to-date 2008. . . . . . . . . . . . . . . . . . . . . . $83,367 $22,258 26.7% $261 1.2%2007. . . . . . . . . . . . . . . . . . . . . . . . . . . . . . . . . 429,010 201,018 46.9% 45,525 22.6%2006. . . . . . . . . . . . . . . . . . . . . . . . . . . . . . . . . 388,716 184,805 47.5% 43,111 23.3%2005. . . . . . . . . . . . . . . . . . . . . . . . . . . . . . . . . 408,266 233,046 57.1% 57,527 24.7%2004. . . . . . . . . . . . . . . . . . . . . . . . . . . . . . . . . 359,717 194,887 54.2% 44,760 23.0%2003. . . . . . . . . . . . . . . . . . . . . . . . . . . . . . . . . 383,559 190,641 49.7% 39,200 20.6%2002. . . . . . . . . . . . . . . . . . . . . . . . . . . . . . . . . 358,569 178,928 49.9% 35,894 20.1%2001. . . . . . . . . . . . . . . . . . . . . . . . . . . . . . . . . 288,083 134,359 46.6% 32,573 24.2%2000. . . . . . . . . . . . . . . . . . . . . . . . . . . . . . . . . 200,880 79,305 39.5% 17,185 21.7%1999. . . . . . . . . . . . . . . . . . . . . . . . . . . . . . . . . 227,741 105,575 46.4% 26,555 25.2%1998. . . . . . . . . . . . . . . . . . . . . . . . . . . . . . . . . 286,817 145,515 50.7% 29,552 20.3%1997. . . . . . . . . . . . . . . . . . . . . . . . . . . . . . . . . 220,685 107,468 48.7% 25,405 23.6%1996. . . . . . . . . . . . . . . . . . . . . . . . . . . . . . . . . 185,210 85,708 46.3% 24,694 28.8%1995. . . . . . . . . . . . . . . . . . . . . . . . . . . . . . . . . 160,369 68,553 42.7% 16,983 24.8%1994. . . . . . . . . . . . . . . . . . . . . . . . . . . . . . . . . 165,034 61,512 37.3% 17,437 28.3%1993. . . . . . . . . . . . . . . . . . . . . . . . . . . . . . . . . 292,249 107,955 36.9% 31,487 29.2%1992. . . . . . . . . . . . . . . . . . . . . . . . . . . . . . . . . 234,667 80,762 34.4% 24,596 30.5%
(1) Figures are Ambac estimates subject to revisions as new information becomes available. It is compiled from The Bond Buyer and Thompson Financial.(2) Data for industry and Ambac is provided on a sale date basis and will not agree with Ambac data in subsequent sections which is provided on a closing date basis.
Total New Issue Market Insured by Ambac
17

Net Exposure Amortization(1)
As of March 31, 2008Estimated Net Ending NetDebt Service Debt Service
($ Millions) Amortization Outstanding
2008 (2nd, 3rd, and 4th Qtrs). . . . . . . . . . . . . . . . . . . . . . . . . . . . . . . . . . . . . . . . . . . . . . . . . . . . . . . . . . . . . . . . $36,386 $778,6632009. . . . . . . . . . . . . . . . . . . . . . . . . . . . . . . . . . . . . . . . . . . . . . . . . . . . . . . . . . . . . . . . . . . . . . . . . . . . . . . . . . . . . . . . . . . . 44,530 734,133 2010. . . . . . . . . . . . . . . . . . . . . . . . . . . . . . . . . . . . . . . . . . . . . . . . . . . . . . . . . . . . . . . . . . . . . . . . . . . . . . . . . . . . . . . . . . . . 48,813 685,320 2011. . . . . . . . . . . . . . . . . . . . . . . . . . . . . . . . . . . . . . . . . . . . . . . . . . . . . . . . . . . . . . . . . . . . . . . . . . . . . . . . . . . . . . . . . . . . 44,345 640,975 2012. . . . . . . . . . . . . . . . . . . . . . . . . . . . . . . . . . . . . . . . . . . . . . . . . . . . . . . . . . . . . . . . . . . . . . . . . . . . . . . . . . . . . . . . . . . . 37,328 603,647 2013. . . . . . . . . . . . . . . . . . . . . . . . . . . . . . . . . . . . . . . . . . . . . . . . . . . . . . . . . . . . . . . . . . . . . . . . . . . . . . . . . . . . . . . . . . . . 37,515 566,132
2008 (2nd, 3rd, and 4th Qtrs). . . . . . . . . . . . . . . . . . . . . . . . . . . . . . . . . . . . . . . . . . . . . . . . . . . . . . . . . . . . . . . . 36,386 778,663 2009-2013. . . . . . . . . . . . . . . . . . . . . . . . . . . . . . . . . . . . . . . . . . . . . . . . . . . . . . . . . . . . . . . . . . . . . . . . . . . . . . . . . . . . . 212,531 566,132 2018-2014. . . . . . . . . . . . . . . . . . . . . . . . . . . . . . . . . . . . . . . . . . . . . . . . . . . . . . . . . . . . . . . . . . . . . . . . . . . . . . . . . . . . . 166,012 400,120 2019-2023. . . . . . . . . . . . . . . . . . . . . . . . . . . . . . . . . . . . . . . . . . . . . . . . . . . . . . . . . . . . . . . . . . . . . . . . . . . . . . . . . . . . . 127,874 272,246 2024-2028. . . . . . . . . . . . . . . . . . . . . . . . . . . . . . . . . . . . . . . . . . . . . . . . . . . . . . . . . . . . . . . . . . . . . . . . . . . . . . . . . . . . . 92,856 179,390 After 2028. . . . . . . . . . . . . . . . . . . . . . . . . . . . . . . . . . . . . . . . . . . . . . . . . . . . . . . . . . . . . . . . . . . . . . . . . . . . . . . . . . . . . 179,390 -
$815,049
Net Unearned Premium Amortization and Estimated Future Installment PremiumsAs of March 31, 2008
Estimated Total Fees on Net Future Premium Credit Derivative
($ Millions) Upfront Installments Installments(3) Earnings Contracts
2008 (2nd, 3rd, and 4th Qtrs). . . . . . . . . . . . . $166.2 $44.7 $282.5 $493.4 $49.02009. . . . . . . . . . . . . . . . . . . . . . . . . . . . . . . . . . . . . . . . 206.8 7.6 383.5 597.9 62.1 2010. . . . . . . . . . . . . . . . . . . . . . . . . . . . . . . . . . . . . . . . 192.4 3.2 346.1 541.7 57.6 2011. . . . . . . . . . . . . . . . . . . . . . . . . . . . . . . . . . . . . . . . 179.1 2.6 274.5 456.2 47.8 2012. . . . . . . . . . . . . . . . . . . . . . . . . . . . . . . . . . . . . . . . 166.6 1.7 223.2 391.5 37.6 2013. . . . . . . . . . . . . . . . . . . . . . . . . . . . . . . . . . . . . . . . . . . . . 153.8 1.3 194.4 349.5 28.8
2008 (2nd, 3rd, and 4th Qtrs). . . . . . . . . . . . . . . 166.2 44.7 282.5 493.4 49.0 2009-2013. . . . . . . . . . . . . . . . . . . . . . . . . . . . . . . . . 898.7 16.4 1,421.7 2,336.8 233.9 2014-2018. . . . . . . . . . . . . . . . . . . . . . . . . . . . . . . . . 615.0 4.7 620.1 1,239.8 44.5 2019-2023. . . . . . . . . . . . . . . . . . . . . . . . . . . . . . . . . 399.9 2.7 405.2 807.8 18.9 2024-2028. . . . . . . . . . . . . . . . . . . . . . . . . . . . . . . . . 240.9 2.2 272.5 515.6 15.2 After 2028. . . . . . . . . . . . . . . . . . . . . . . . . . . . . . . . . 190.7 1.5 269.5 461.7 25.9 Total. . . . . . . . . . . . . . . . . . . . . . . . . . . . . . . . . . . . $2,511.4 $72.2 $3,271.5 $5,855.1 $387.4
(1) Depicts amortization of existing guaranteed portfolio (principal and interest), assuming no advance refundings, as of March 31, 2008. Expected maturities will differ from contractual maturities because borrowers may have the right to call or prepay guaranteed obligations.(2) Unearned premium amounts are net of prepaid reinsurance, which is reported separately as an asset on the Consolidated Balance Sheet. (3) Actual future installments are net of reinsurance and may differ from estimated because borrowers may have the right to call or terminate a transaction or the guaranteed obligation may be subject to prepayment.
Net Unearned Premium Amortization (2)
Total. . . . . . . . . . . . . . . . . . . . . . . . . . . . . . . . . . . . . . . . . . . . . . . . . . . . . . . . . . . . . . . . . . . . . . . . . . . . . . . . . . . . . . . .
18

Fixed Income Investment PortfolioAs of March 31, 2008
WeightedAverage YTD
INCOME ANALYSIS BY TYPE OF SECURITY Fair Amortized Yield to After-Tax InvestmentInvestment category ($ thousands) Value Cost Maturity (1) Yield Income
Financial Guarantee investments: Long-term investments
U.S. government obligations . . . . . . . . . . . . . . . . . . . . . . $320,610 $317,678 2.69% 1.75% $1,602U.S. agency obligations . . . . . . . . . . . . . . . . . . . . . . . . . . . . . . 274,690 265,740 4.18% 2.72% 2,161Municipal obligations (2) (3) . . . . . . . . . . . . . . . . . . . . . . . . . . . . 8,794,402 8,652,941 4.54% 4.46% 91,668 Foreign obligations . . . . . . . . . . . . . . . . . . . . . . . . . . . . . . . . . . . . . 324,893 303,976 4.76% 3.09% 3,873 Corporate obligations . . . . . . . . . . . . . . . . . . . . . . . . . . . . . . . . . 419,814 395,282 6.00% 3.90% 5,384 Mortgage and asset-backed securities . . . . . . . . . . . . 838,007 830,495 4.77% 3.10% 10,477 Total long-term investments . . . . . . . . . . . . . . . . . . . . . . 10,972,416 10,766,112 4.55% 4.17% 115,165
Short-term investments (4) . . . . . . . . . . . . . . . . . . . . . . . . . . . . . . . . . 1,023,541 1,023,541 2.74% 2.08% 5,712
Other (5) . . . . . . . . . . . . . . . . . . . . . . . . . . . . . . . . . . . . . . . . . . . . . . . . . . . . 12,787 12,903 3,903 Total Financial Guarantee investments . . . . . . . . . . . . . . 12,008,744 11,802,556 4.39% 3.98% 124,780
Investment expenses. . . . . . . . . . . . . . . . . . . . . . . . . . . . . . . . . . . . . . . . . . . . . . . . . . . . . . . . . . . . . . . . . . . . . . . . . . . . . . . . . . . . . . . . . . . . . . . . . . . . . . . . . . . . . . . . . . (1,135) Financial Guarantee net investment income . . . . . . . . . . . . . . . . . . . . . . . . . . . . . . . . . . . . . . . . . . . . . . . . . . . . . . . . . . . . . . . . . . . . . . . . . . . . . . . . . $123,645
Financial Services investments (6)
Long-term investmentsU.S. government obligations . . . . . . . . . . . . . . . . . . . . . . . . . 15,364 14,091 U.S. agency obligations . . . . . . . . . . . . . . . . . . . . . . . . . . . . . . . 428,791 362,852 Municipal obligations . . . . . . . . . . . . . . . . . . . . . . . . . . . . . . . . . . 104,746 97,740 Corporate obligations . . . . . . . . . . . . . . . . . . . . . . . . . . . . . . 263,053 278,975 Mortgage and asset-backed securities . . . . . . . . . . . . . . . . . 4,723,375 5,848,065 Total long-term investments . . . . . . . . . . . . . . . . . . . . . . 5,535,329 6,601,723
Short-term investments . . . . . . . . . . . . . . . . . . . . . . . . . . . . . . . . . . . 376,404 376,404 Total Financial Services investments . . . . . . . . . . . . . . . . 5,911,733 6,978,127
Corporate investments: Short-term investments . . . . . . . . . . . . . . . . . . . . . . . . . . . . . . . . . . . 152,948 152,948 Other . . . . . . . . . . . . . . . . . . . . . . . . . . . . . . . . . . . . . . . . . . . . . . . . . . . . . . . 1,037 670
Total Corporate investments. . . . . . . . . . . . . . . . . . . . . . . . . . . . . 153,985 153,618
Total Investments . . . . . . . . . . . . . . . . . . . . . . . . . . . . . . . . . . . $18,074,462 $18,934,301
RATING DISTRIBUTION OF INVESTMENT PORTFOLIO(7)
Percent of Investment Portfolio
Rating Fin. Guar. Fin. Services Combined
AAA(2) (8) . . . . . . . . . . . . . . . . . . . . . . . . . . . . . . . . . . . . . . . . . . . . . . . . . . . . . . . . . . . . . . . . . . . . . . . . . . . . . . . . . . . . . . . . . . . . . . . . . . 74% 89% 80%
AA . . . . . . . . . . . . . . . . . . . . . . . . . . . . . . . . . . . . . . . . . . . . . . . . . . . . . . . . . . . . . . . . . . . . . . . . . . . . . . . . . . . . . . . . . . . . . . . . . . . . . . . . . . 20% 5% 14%A . . . . . . . . . . . . . . . . . . . . . . . . . . . . . . . . . . . . . . . . . . . . . . . . . . . . . . . . . . . . . . . . . . . . . . . . . . . . . . . . . . . . . . . . . . . . . . . . . . . . . . . . . . . 5% 5% 5%BBB . . . . . . . . . . . . . . . . . . . . . . . . . . . . . . . . . . . . . . . . . . . . . . . . . . . . . . . . . . . . . . . . . . . . . . . . . . . . . . . . . . . . . . . . . . . . . . . . . . . . . . . 1% <1% 1%Below investment grade . . . . . . . . . . . . . . . . . . . . . . . . . . . . . . . . . . . . . . . . . . . . . . . . . . . . . . . . . . . . . . . . . . . . . . . . . . . . . . . . . <1% 1% <1%Not rated . . . . . . . . . . . . . . . . . . . . . . . . . . . . . . . . . . . . . . . . . . . . . . . . . . . . . . . . . . . . . . . . . . . . . . . . . . . . . . . . . . . . . . . . . . . . . . . . . . . <1% 0% <1%
100% 100% 100%
Duration of Financial Guarantee investment portfolio . . . . . . . . . . . . . . . . . . . . . . . . . . . . . . . . . . . . . . . . . . . . . . . . . . . . . . . . . . . . . . . . . . . . . . . . . . . . . . . . . . . 5.6
(1) “Yield to maturity” refers to the rate of interest to be earned over the expected remaining life of the investments in the portfolio, and is calculated based on purchase price, estimated future cash flows and call schedules. Actual maturities may differ from stated maturities because borrowers may have the right to call or prepay obligations.(2) Includes municipal bonds which have been advance refunded and defeased with U.S. Treasury and Agency obligations, but not necessarily re-rated by S&P and/or Moody's. Ambac considers the credit quality of these bonds, which have a total fair value of $1,334,051 and comprise approximately 11% of the Financial Guarantee portfolio, to be AAA.(3) Includes taxable and tax-exempt municipal obligations with a fair value of $362,406 and $8,431,996, respectively.(4) Includes taxable and tax-exempt short-term investments with a fair value of $629,718 and $393,823, respectively.(5) Includes income earned on loans, FIN 46 entities, and securities purchased under agreements to resell, which are classified separately on the balance sheet.(6) Financial Services investments relate primarily to the investment agreement business. The goal is to match invested assets to related investment agreement liabilities to earn a net interest spread.(7) Ratings are based on the lower of Standard & Poor's or Moody's ratings.(8) Includes U.S. Government and Agency securities which comprise approximately 11% and 15% of the Financial Guarantee and Financial Services portfolios, respectively.
19

Ratio of Net Claims Paid (1)
($ Thousands) YTD 2008 2007 2006 2005 2004
Net claims paid (2) . . . . . . . . . . . . . . . . . . . . . . . . . . . . . . . . . . . . . . $34,053 ($2,128) $105,568 $86,739 $18,923
Net insurance premiums and credit derivative fees . . . . . . . . . . . . . $203,839 $917,895 $871,383 $866,415 $764,510
Ratio of net claims paid. . . . . . . . . . . . . . . . . . . . . . . . . . . . . . . . . . 16.7% -0.2% 12.1% 10.0% 2.5%
Summary of Net Insurance Loss Reserves and Credit Derivatives($ Thousands) 3/31/08 12/31/07 12/31/06 12/31/05
Case basis credit reserves . . . . . . . . . . . . . . . . . . . . . . . . . . . . . . . . . . . . . . . . . . . . . . . . . . $350,586 $109,816 $42,458 $103,064
Active credit reserves . . . . . . . . . . . . . . . . . . . . . . . . . . . . . . . . . . . . . . . . . . . . . . . . . . . . . . 1,131,310 363,372 172,644 197,607 Total insurance reserves . . . . . . . . . . . . . . . . . . . . . . . . . . . . . . . . . . . . . . . . . . . . . . . . . . . . 1,481,896 473,188 215,102 300,671
Estimated credit impairment losses on credit derivatives (3) . . . . . . . . . . . . . . . . . . . . . . . . 2,046,156 1,105,741 - - Total impairment losses . . . . . . . . . . . . . . . . . . . . . . . . . . . . . . . . . . . . . . . . . . . . . . . . . . . . 3,528,052 1,578,929 215,102 300,671 Mark-to-market reserve (asset) on credit derivatives (3) . . . . . . . . . . . . . . . . . . . . . . . . . . . 5,674,478 4,889,721 (8,929) 165 Mark-to-market reserve (asset) on total return swaps . . . . . . . . . . . . . . . . . . . . . . . . . . . . . 62,681 21,901 (11,195) (14,718)
Grand total net insurance loss reserves and credit derivatives . . . . . . . . . . . . . . . . . . $9,265,211 $6,490,551 $194,978 $286,118
Summary of Below Investment Grade Exposures (4)
($ Millions) Net Par Outstanding Total Impairment Losses
Public Finance:Transportation Revenue . . . . . . . . . . . . . . . . . . . . . . . . . . . . . . . . . . . . . . . . . . . . . . . . . . . . . . . . . . . . . . . . . . . . . . . . . . . . . . . . . . . . . . . . . . . . . . $1,007Health Care . . . . . . . . . . . . . . . . . . . . . . . . . . . . . . . . . . . . . . . . . . . . . . . . . . . . . . . . . . . . . . . . . . . . . . . . . . . . . . . . . . . . . . . . . . . . . . . . . . . . . .. . 374 Other . . . . . . . . . . . . . . . . . . . . . . . . . . . . . . . . . . . . . . . . . . . . . . . . . . . . . . . . . . . . . . . . . . . . . . . . . . . . . . . . . . . . . . . . . . . . . . . . . . . . . .. . . . . . . 455
Total Public Finance . . . . . . . . . . . . . . . . . . . . . . . . . . . . . . . . . . . . . . . . . . . . . . . . . . . . . . . . . . . . . . . . . . . . . . . . . . . . . . . . . . . . . . . . . . . . . . . . . . . . 1,836 163
Structured Finance:CDO of ABS >25% MBS (5) . . . . . . . . . . . . . . . . . . . . . . . . . . . . . . . . . . . . . . . . . . . . . . . . . . . . . . . . . . . . . . . . . . . . . . . . . . . . . . . . . . . . . . . . . . . $6,971 $2,046Mortgage-Backed & Home Equity - Second Lien . . . . . . . . . . . . . . . . . . . . . . . . . . . . . . . . . . . . . . . . . . . . . . . . . . . . . . . . . . . . . . . . . . . . . . . . . . 4,323 1,068 Mortgage-Backed & Home Equity - Alt-A . . . . . . . . . . . . . . . . . . . . . . . . . . . . . . . . . . . . . . . . . . . . . . . . . . . . . . . . . . . . . . . . . . . . . . . . . . . . . . . 1,762 200 Enhanced Equipment Trust Certificates . . . . . . . . . . . . . . . . . . . . . . . . . . . . . . . . . . . . . . . . . . . . . . . . . . . . . . . . . . . . . . . . . . . . . . . . . . . . . . . . . . 601 - Investor-Owned Utilities . . . . . . . . . . . . . . . . . . . . . . . . . . . . . . . . . . . . . . . . . . . . . . . . . . . . . . . . . . . . . . . . . . . . . . . . . . . . . . . . . . . . . . . . . . . . . 583 - Mortgage-Backed & Home Equity - Sub prime. . . . . . . . . . . . . . . . . . . . . . . . . . . . . . . . . . . . . . . . . . . . . . . . . . . . . . . . . . . . . . . . . . . . . . . . . . . . 425 16 Mortgage-Backed & Home Equity - Other. . . . . . . . . . . . . . . . . . . . . . . . . . . . . . . . . . . . . . . . . . . . . . . . . . . . . . . . . . . . . . . . . . . . . . . . . . . . . . . 153 33 Other CDOs . . . . . . . . . . . . . . . . . . . . . . . . . . . . . . . . . . . . . . . . . . . . . . . . . . . . . . . . . . . . . . . . . . . . . . . . . . . . . . . . . . . . . . . . . . . . . . . . . . . . . .. . 59 -
Total Structured Finance . . . . . . . . . . . . . . . . . . . . . . . . . . . . . . . . . . . . . . . . . . . . . . . . . . . . . . . . . . . . . . . . . . . . . . . . . . . . . . . . . . . . . . . . . . . . . . . . . 14,877 3,363
International Finance: $35 $2
Total . . . . . . . . . . . . . . . . . . . . . . . . . . . . . . . . . . . . . . . . . . . . . . . . . . . . . . . . . . . . . . . . . . . . . . . . . . . . . . . . . . . . . . . . . . . . . . . . . . . . . .. . . . . . . . . . . $16,748 $3,528
(1) Ratio of net claims paid is net claims paid divided by net premiums earned and other credit enhancement fees.(2) Net claims paid includes payments on credit derivatives of $0, $0, $0, $0 and $0 million for year-to-date 2008, 2007, 2006, 2005 and 2004,
respectively, and are net of salvage received of $1.6 million, $27.9 million, $16.7 million, $9.4 million, and $33.6 million for year-to-date 2008, 2007,2006, 2005, and 2004 respectively.
(3) Total net mark-to-market losses are $7,720,634 as of March 31, 2008 and $5,995,462 as of December 31, 2007 and are reportedon the consolidated balance sheet under derivative liabilities.
20
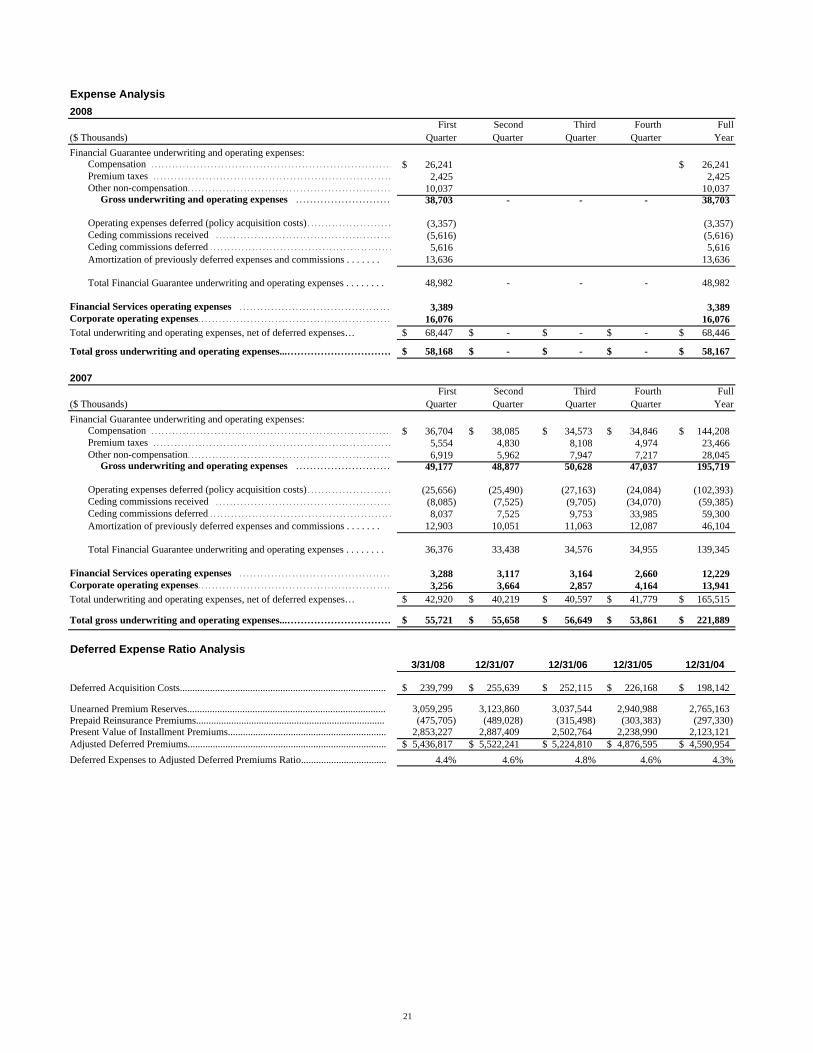
Expense Analysis2008
First Second Third Fourth Full($ Thousands) Quarter Quarter Quarter Quarter YearFinancial Guarantee underwriting and operating expenses:
Compensation . . . . . . . . . . . . . . . . . . . . . . . . . . . . . . . . . . . . . . . . . . . . . . . . . . . . . . . . . . . . . . . . . . . . . 26,241$ 26,241$ Premium taxes . . . . . . . . . . . . . . . . . . . . . . . . . . . . . . . . . . . . . . . . . . . . . . . . . . . . . . . . . . . . . . . . . . . . 2,425 2,425 Other non-compensation. . . . . . . . . . . . . . . . . . . . . . . . . . . . . . . . . . . . . . . . . . . . . . . . . . . . . . . . . . 10,037 10,037 Gross underwriting and operating expenses . . . . . . . . . . . . . . . . . . . . . . . . . . . 38,703 - - - 38,703
Operating expenses deferred (policy acquisition costs) . . . . . . . . . . . . . . . . . . . . . . . . (3,357) (3,357) Ceding commissions received . . . . . . . . . . . . . . . . . . . . . . . . . . . . . . . . . . . . . . . . . . . . . . . . . . (5,616) (5,616) Ceding commissions deferred . . . . . . . . . . . . . . . . . . . . . . . . . . . . . . . . . . . . . . . . . . . . . . . . . . . . 5,616 5,616 Amortization of previously deferred expenses and commissions . . . . . . . 13,636 13,636
Total Financial Guarantee underwriting and operating expenses . . . . . . . . 48,982 - - - 48,982
Financial Services operating expenses . . . . . . . . . . . . . . . . . . . . . . . . . . . . . . . . . . . . . . . . . . . 3,389 3,389 Corporate operating expenses. . . . . . . . . . . . . . . . . . . . . . . . . . . . . . . . . . . . . . . . . . . . . . . . . . . . . . . 16,076 16,076 Total underwriting and operating expenses, net of deferred expenses… 68,447$ -$ -$ -$ 68,446$
Total gross underwriting and operating expenses...…………………………… 58,168$ -$ -$ -$ 58,167$
2007First Second Third Fourth Full
($ Thousands) Quarter Quarter Quarter Quarter YearFinancial Guarantee underwriting and operating expenses:
Compensation . . . . . . . . . . . . . . . . . . . . . . . . . . . . . . . . . . . . . . . . . . . . . . . . . . . . . . . . . . . . . . . . . . . . . 36,704$ 38,085$ 34,573$ 34,846$ 144,208$ Premium taxes . . . . . . . . . . . . . . . . . . . . . . . . . . . . . . . . . . . . . . . . . . . . . . . . . . . . . . . . . . . . . . . . . . . . 5,554 4,830 8,108 4,974 23,466 Other non-compensation. . . . . . . . . . . . . . . . . . . . . . . . . . . . . . . . . . . . . . . . . . . . . . . . . . . . . . . . . . 6,919 5,962 7,947 7,217 28,045 Gross underwriting and operating expenses . . . . . . . . . . . . . . . . . . . . . . . . . . . 49,177 48,877 50,628 47,037 195,719
Operating expenses deferred (policy acquisition costs) . . . . . . . . . . . . . . . . . . . . . . . . (25,656) (25,490) (27,163) (24,084) (102,393) Ceding commissions received . . . . . . . . . . . . . . . . . . . . . . . . . . . . . . . . . . . . . . . . . . . . . . . . . . (8,085) (7,525) (9,705) (34,070) (59,385) Ceding commissions deferred . . . . . . . . . . . . . . . . . . . . . . . . . . . . . . . . . . . . . . . . . . . . . . . . . . . . 8,037 7,525 9,753 33,985 59,300 Amortization of previously deferred expenses and commissions . . . . . . . 12,903 10,051 11,063 12,087 46,104
Total Financial Guarantee underwriting and operating expenses . . . . . . . . 36,376 33,438 34,576 34,955 139,345
Financial Services operating expenses . . . . . . . . . . . . . . . . . . . . . . . . . . . . . . . . . . . . . . . . . . . 3,288 3,117 3,164 2,660 12,229 Corporate operating expenses. . . . . . . . . . . . . . . . . . . . . . . . . . . . . . . . . . . . . . . . . . . . . . . . . . . . . . . 3,256 3,664 2,857 4,164 13,941 Total underwriting and operating expenses, net of deferred expenses… 42,920$ 40,219$ 40,597$ 41,779$ 165,515$
Total gross underwriting and operating expenses...…………………………… 55,721$ 55,658$ 56,649$ 53,861$ 221,889$
Deferred Expense Ratio Analysis3/31/08 12/31/07 12/31/06 12/31/05 12/31/04
239,799$ 255,639$ 252,115$ 226,168$ 198,142$
3,059,295 3,123,860 3,037,544 2,940,988 2,765,163 (475,705) (489,028) (315,498) (303,383) (297,330)
2,853,227 2,887,409 2,502,764 2,238,990 2,123,121 5,436,817$ 5,522,241$ 5,224,810$ 4,876,595$ 4,590,954$
4.4% 4.6% 4.8% 4.6% 4.3%
Deferred Acquisition Costs..................................................................................
Unearned Premium Reserves...............................................................................Prepaid Reinsurance Premiums...........................................................................Present Value of Installment Premiums...............................................................Adjusted Deferred Premiums...............................................................................Deferred Expenses to Adjusted Deferred Premiums Ratio..................................
21
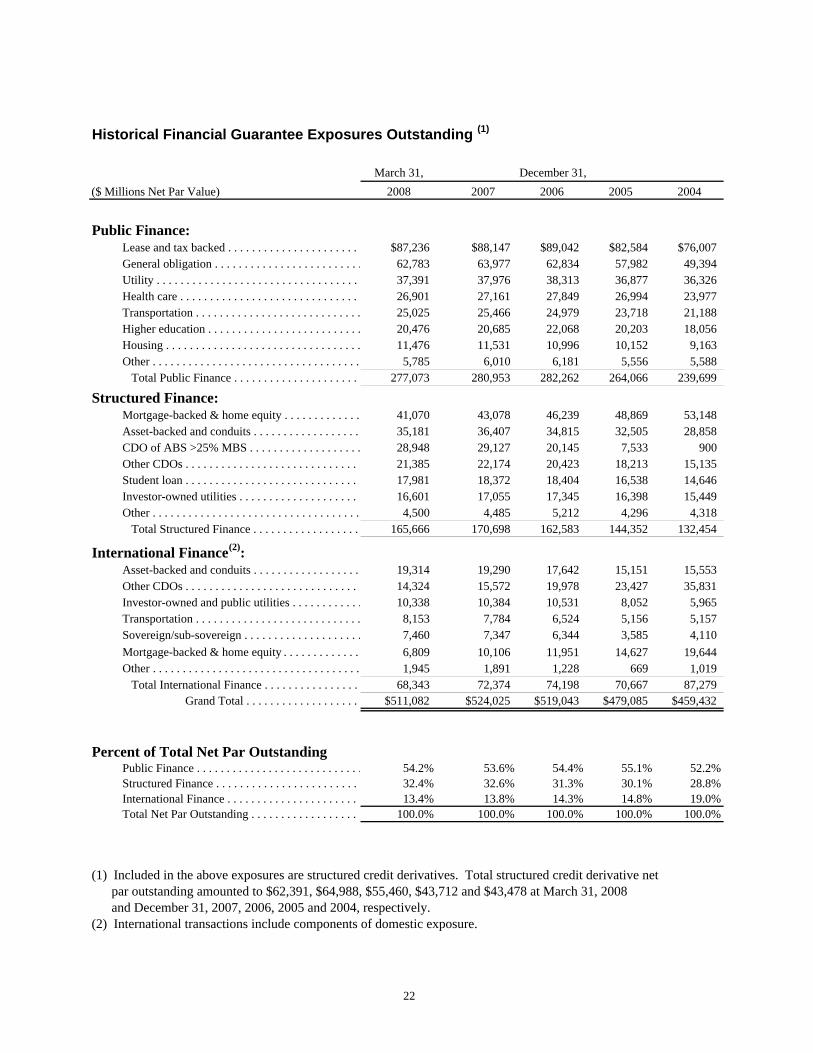
Historical Financial Guarantee Exposures Outstanding (1)
March 31,($ Millions Net Par Value) 2008 2007 2006 2005 2004
Public Finance: Lease and tax backed . . . . . . . . . . . . . . . . . . . . . . $87,236 $88,147 $89,042 $82,584 $76,007 General obligation . . . . . . . . . . . . . . . . . . . . . . . . . 62,783 63,977 62,834 57,982 49,394 Utility . . . . . . . . . . . . . . . . . . . . . . . . . . . . . . . . . . 37,391 37,976 38,313 36,877 36,326 Health care . . . . . . . . . . . . . . . . . . . . . . . . . . . . . . 26,901 27,161 27,849 26,994 23,977 Transportation . . . . . . . . . . . . . . . . . . . . . . . . . . . . 25,025 25,466 24,979 23,718 21,188 Higher education . . . . . . . . . . . . . . . . . . . . . . . . . . 20,476 20,685 22,068 20,203 18,056 Housing . . . . . . . . . . . . . . . . . . . . . . . . . . . . . . . . . 11,476 11,531 10,996 10,152 9,163 Other . . . . . . . . . . . . . . . . . . . . . . . . . . . . . . . . . . . 5,785 6,010 6,181 5,556 5,588 Total Public Finance . . . . . . . . . . . . . . . . . . . . . 277,073 280,953 282,262 264,066 239,699
Structured Finance: Mortgage-backed & home equity . . . . . . . . . . . . . 41,070 43,078 46,239 48,869 53,148 Asset-backed and conduits . . . . . . . . . . . . . . . . . . 35,181 36,407 34,815 32,505 28,858 CDO of ABS >25% MBS . . . . . . . . . . . . . . . . . . . 28,948 29,127 20,145 7,533 900 Other CDOs . . . . . . . . . . . . . . . . . . . . . . . . . . . . . 21,385 22,174 20,423 18,213 15,135 Student loan . . . . . . . . . . . . . . . . . . . . . . . . . . . . . 17,981 18,372 18,404 16,538 14,646 Investor-owned utilities . . . . . . . . . . . . . . . . . . . . 16,601 17,055 17,345 16,398 15,449 Other . . . . . . . . . . . . . . . . . . . . . . . . . . . . . . . . . . . 4,500 4,485 5,212 4,296 4,318 Total Structured Finance . . . . . . . . . . . . . . . . . . 165,666 170,698 162,583 144,352 132,454
International Finance(2): Asset-backed and conduits . . . . . . . . . . . . . . . . . . 19,314 19,290 17,642 15,151 15,553 Other CDOs . . . . . . . . . . . . . . . . . . . . . . . . . . . . . 14,324 15,572 19,978 23,427 35,831 Investor-owned and public utilities . . . . . . . . . . . . 10,338 10,384 10,531 8,052 5,965 Transportation . . . . . . . . . . . . . . . . . . . . . . . . . . . . 8,153 7,784 6,524 5,156 5,157 Sovereign/sub-sovereign . . . . . . . . . . . . . . . . . . . . 7,460 7,347 6,344 3,585 4,110 Mortgage-backed & home equity . . . . . . . . . . . . . 6,809 10,106 11,951 14,627 19,644 Other . . . . . . . . . . . . . . . . . . . . . . . . . . . . . . . . . . . 1,945 1,891 1,228 669 1,019 Total International Finance . . . . . . . . . . . . . . . . 68,343 72,374 74,198 70,667 87,279 Grand Total . . . . . . . . . . . . . . . . . . . $511,082 $524,025 $519,043 $479,085 $459,432
Percent of Total Net Par Outstanding Public Finance . . . . . . . . . . . . . . . . . . . . . . . . . . . . 54.2% 53.6% 54.4% 55.1% 52.2% Structured Finance . . . . . . . . . . . . . . . . . . . . . . . . 32.4% 32.6% 31.3% 30.1% 28.8% International Finance . . . . . . . . . . . . . . . . . . . . . . 13.4% 13.8% 14.3% 14.8% 19.0% Total Net Par Outstanding . . . . . . . . . . . . . . . . . . 100.0% 100.0% 100.0% 100.0% 100.0%
(1) Included in the above exposures are structured credit derivatives. Total structured credit derivative net par outstanding amounted to $62,391, $64,988, $55,460, $43,712 and $43,478 at March 31, 2008 and December 31, 2007, 2006, 2005 and 2004, respectively.(2) International transactions include components of domestic exposure.
December 31,
22

Bond Type Distribution of Financial Guarantee Exposures
Guaranteed Year-to-Date($ Millions Par Value) Gross % Net %
Public Finance: Lease and tax backed . . . . . . . . . . . . . . . . . . . $60 1.2% $60 1.4% General obligation . . . . . . . . . . . . . . . . . . . . . 138 2.8% 138 3.2% Utility . . . . . . . . . . . . . . . . . . . . . . . . . . . . . . . 136 2.8% 136 3.2% Health care . . . . . . . . . . . . . . . . . . . . . . . . . . . 123 2.5% 123 2.9% Transportation . . . . . . . . . . . . . . . . . . . . . . . . - 0.0% - 0.0% Higher education . . . . . . . . . . . . . . . . . . . . . . 11 0.2% 11 0.3% Housing . . . . . . . . . . . . . . . . . . . . . . . . . . . . . 42 0.9% 42 1.0% Other . . . . . . . . . . . . . . . . . . . . . . . . . . . . . . . 7 0.1% 7 0.2% Total Public Finance . . . . . . . . . . . . . . . . . . 517 10.6% 517 12.0%
Structured Finance: Mortgage-backed & home equity . . . . . . . . . 30 0.6% 30 0.7% Asset-backed and conduits . . . . . . . . . . . . . . . 3,272 67.0% 2,803 65.2% CDO of ABS > 25% MBS . . . . . . . . . . . . . . . 50 1.0% 50 1.2% Other CDOs . . . . . . . . . . . . . . . . . . . . . . . . . . 195 4.0% 195 4.5% Student loan . . . . . . . . . . . . . . . . . . . . . . . . . . - 0.0% - 0.0% Investor-owned utilities . . . . . . . . . . . . . . . . . 29 0.6% 23 0.5% Other . . . . . . . . . . . . . . . . . . . . . . . . . . . . . . . 252 5.2% 252 5.9% Total Structured Finance . . . . . . . . . . . . . . . 3,828 78.3% 3,353 78.0%
International Finance(1): Asset-backed and conduits . . . . . . . . . . . . . . . 123 2.5% 82 1.9% Other CDOs . . . . . . . . . . . . . . . . . . . . . . . . . . 249 5.1% 195 4.5% Investor-owned and public utilities . . . . . . . . - 0.0% - 0.0% Transportation . . . . . . . . . . . . . . . . . . . . . . . . 170 3.5% 128 3.0% Sovereign/sub-sovereign . . . . . . . . . . . . . . . . - 0.0% 22 0.5% Mortgage-backed & home equity . . . . . . . . . - 0.0% - 0.0% Other . . . . . . . . . . . . . . . . . . . . . . . . . . . . . . . - 0.0% - 0.0% Total International Finance . . . . . . . . . . . . . 542 11.1% 427 9.9% Grand Total . . . . . . . . . . . . . . . . $4,887 100.0% $4,297 100.0%
(1) International transactions include components of domestic exposure.
23

Geographic Distribution of Financial Guarantee ExposuresNet Par Outstanding as of
Guaranteed Year-to-Date March 31, 2008($ Millions Par Value) Gross % Net % Net %
Domestic:California . . . . . . . . . . . . . . . . . . . . . $231 4.7% $175 4.1% $52,954 10.4%New York . . . . . . . . . . . . . . . . . . . . . 245 5.0% 245 5.7% 31,446 6.2%Florida . . . . . . . . . . . . . . . . . . . . . . . - 0.0% - 0.0% 22,308 4.4%Texas . . . . . . . . . . . . . . . . . . . . . . . . 31 0.6% 61 1.4% 19,632 3.8%New Jersey . . . . . . . . . . . . . . . . . . . . - 0.0% - 0.0% 14,133 2.8%Pennsylvania . . . . . . . . . . . . . . . . . . . 36 0.7% 36 0.8% 13,121 2.6%Illinois . . . . . . . . . . . . . . . . . . . . . . . . 9 0.2% 9 0.2% 12,140 2.4%Massachusetts . . . . . . . . . . . . . . . . . . - 0.0% - 0.0% 10,263 2.0%Ohio . . . . . . . . . . . . . . . . . . . . . . . . . - 0.0% - 0.0% 8,138 1.6%Colorado . . . . . . . . . . . . . . . . . . . . . . 7 0.1% 7 0.2% 7,447 1.5%Mortgage and asset-backed . . . . . . . 3,302 67.6% 2,833 65.9% 76,251 14.9%Other states . . . . . . . . . . . . . . . . . . . . 484 9.9% 504 11.7% 174,906 34.2%
Total Domestic . . . . . . . . . 4,345 88.9% 3,870 90.1% 442,739 86.6%
International:United Kingdom . . . . . . . . . . . . . . . . 9 0.2% 54 1.3% 26,692 5.2%Australia . . . . . . . . . . . . . . . . . . . . . . 16 0.3% 9 0.2% 6,349 1.2%Italy . . . . . . . . . . . . . . . . . . . . . . . . . . - 0.0% - 0.0% 3,226 0.6%Japan . . . . . . . . . . . . . . . . . . . . . . . . . 4 0.1% 2 0.0% 2,784 0.5%Germany . . . . . . . . . . . . . . . . . . . . . . - 0.0% - 0.0% 2,532 0.5%Internationally diversified . . . . . . . . 339 6.9% 252 5.9% 16,293 3.2%Other international . . . . . . . . . . . . . . 174 3.6% 110 2.6% 10,467 2.0%
Total International . . . . . . . 542 11.1% 427 9.9% 68,343 13.4%
Grand Total . . . . . . . $4,887 100.0% $4,297 100.0% $511,082 100.0%
Rating Distribution of Net Financial Guarantee Exposures(1)
As of March 31, 2008 Percentage of Guaranteed PortfolioPublic
Rating Finance Total
AAA . . . . . . . . . . . . . . . . . . . . . . . . . . . . . . . . . . . . . . . . . . . . . . . . . . . . . . . . . . . . . . . . . . . . . . . . . . . . . . . . . . . . . . <1 12AA . . . . . . . . . . . . . . . . . . . . . . . . . . . . . . . . . . . . . . . . . . . . . . . . . . . . . . . . . . . . . . . . . . . . . . . . . . . . . . . . . . . . . . . . 28 20A . . . . . . . . . . . . . . . . . . . . . . . . . . . . . . . . . . . . . . . . . . . . . . . . . . . . . . . . . . . . . . . . . . . . . . . . . . . . . . . . . . . . . . . . . . 59 43BBB . . . . . . . . . . . . . . . . . . . . . . . . . . . . . . . . . . . . . . . . . . . . . . . . . . . . . . . . . . . . . . . . . . . . . . . . . . . . . . . . . . . . . . 12 22BIG . . . . . . . . . . . . . . . . . . . . . . . . . . . . . . . . . . . . . . . . . . . . . . . . . . . . . . . . . . . . . . . . . . . . . . . . . . . . . . . . . . . . . . . <1 3
100 100
(1) Based upon Ambac ratings. See Note 3 on the Table of Contents page.
Structured andInternational Finance
27122332
6100
24
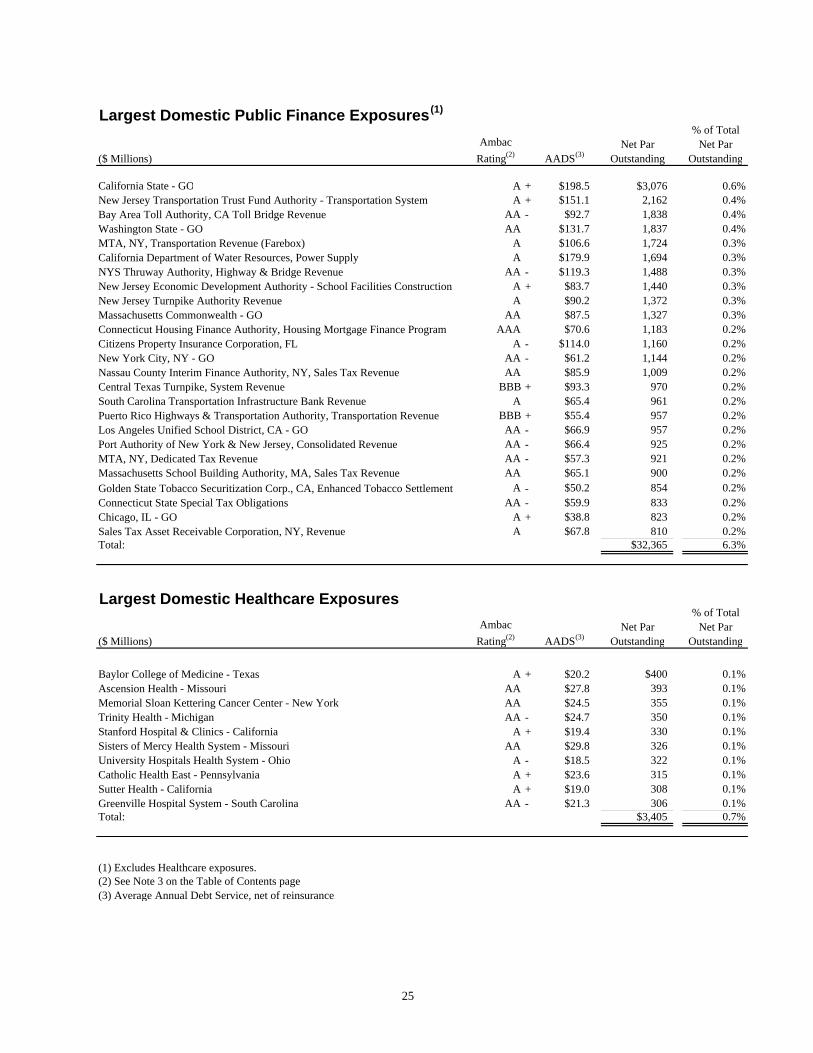
Largest Domestic Public Finance Exposures(1)
($ Millions)Ambac
Rating(2) AADS(3)Net Par
Outstanding
% of Total Net Par
Outstanding
California State - GO A + $198.5 $3,076 0.6%New Jersey Transportation Trust Fund Authority - Transportation System A + $151.1 2,162 0.4%Bay Area Toll Authority, CA Toll Bridge Revenue AA - $92.7 1,838 0.4%Washington State - GO AA $131.7 1,837 0.4%MTA, NY, Transportation Revenue (Farebox) A $106.6 1,724 0.3%California Department of Water Resources, Power Supply A $179.9 1,694 0.3%NYS Thruway Authority, Highway & Bridge Revenue AA - $119.3 1,488 0.3%New Jersey Economic Development Authority - School Facilities Construction A + $83.7 1,440 0.3%New Jersey Turnpike Authority Revenue A $90.2 1,372 0.3%Massachusetts Commonwealth - GO AA $87.5 1,327 0.3%Connecticut Housing Finance Authority, Housing Mortgage Finance Program AAA $70.6 1,183 0.2%Citizens Property Insurance Corporation, FL A - $114.0 1,160 0.2%New York City, NY - GO AA - $61.2 1,144 0.2%Nassau County Interim Finance Authority, NY, Sales Tax Revenue AA $85.9 1,009 0.2%Central Texas Turnpike, System Revenue BBB + $93.3 970 0.2%South Carolina Transportation Infrastructure Bank Revenue A $65.4 961 0.2%Puerto Rico Highways & Transportation Authority, Transportation Revenue BBB + $55.4 957 0.2%Los Angeles Unified School District, CA - GO AA - $66.9 957 0.2%Port Authority of New York & New Jersey, Consolidated Revenue AA - $66.4 925 0.2%MTA, NY, Dedicated Tax Revenue AA - $57.3 921 0.2%Massachusetts School Building Authority, MA, Sales Tax Revenue AA $65.1 900 0.2%Golden State Tobacco Securitization Corp., CA, Enhanced Tobacco Settlement A - $50.2 854 0.2%Connecticut State Special Tax Obligations AA - $59.9 833 0.2%Chicago, IL - GO A + $38.8 823 0.2%Sales Tax Asset Receivable Corporation, NY, Revenue A $67.8 810 0.2%Total: $32,365 6.3%
Largest Domestic Healthcare Exposures
($ Millions)Ambac
Rating(2) AADS(3)Net Par
Outstanding
% of Total Net Par
Outstanding
Baylor College of Medicine - Texas A + $20.2 $400 0.1%Ascension Health - Missouri AA $27.8 393 0.1%Memorial Sloan Kettering Cancer Center - New York AA $24.5 355 0.1%Trinity Health - Michigan AA - $24.7 350 0.1%Stanford Hospital & Clinics - California A + $19.4 330 0.1%Sisters of Mercy Health System - Missouri AA $29.8 326 0.1%University Hospitals Health System - Ohio A - $18.5 322 0.1%Catholic Health East - Pennsylvania A + $23.6 315 0.1%Sutter Health - California A + $19.0 308 0.1%Greenville Hospital System - South Carolina AA - $21.3 306 0.1%Total: $3,405 0.7%
(1) Excludes Healthcare exposures.(2) See Note 3 on the Table of Contents page.(3) Average Annual Debt Service, net of reinsurance.
25
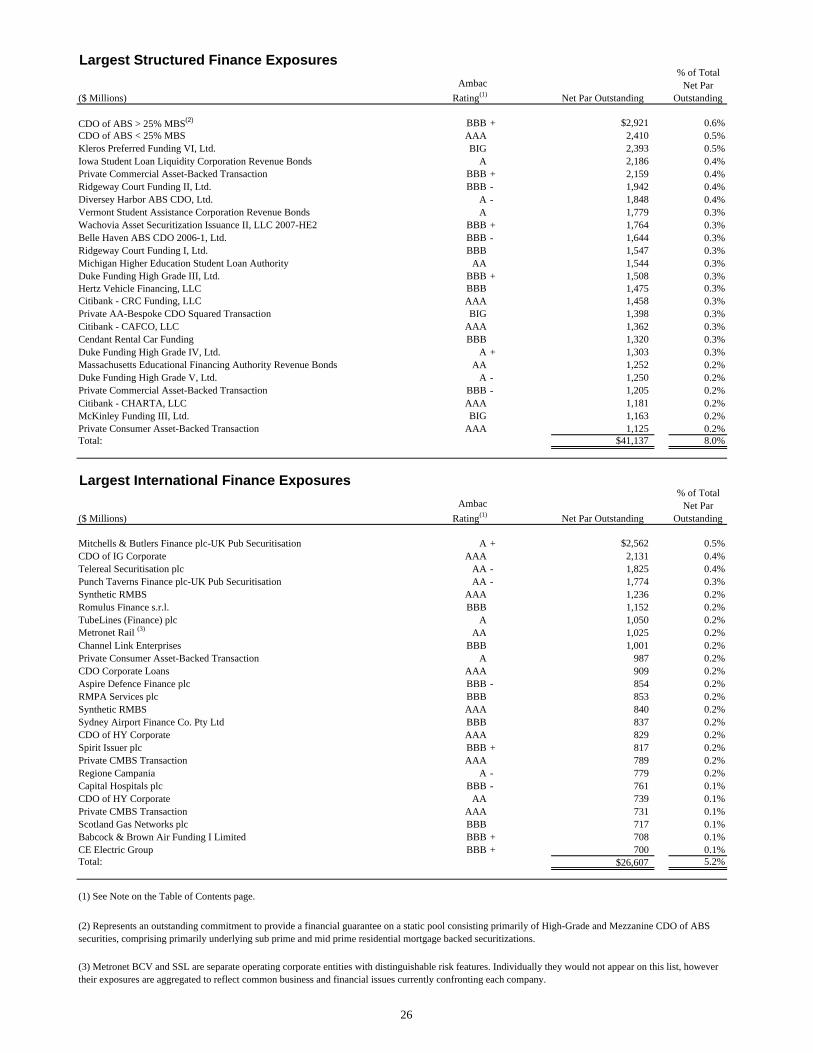
Largest Structured Finance Exposures
($ Millions)Ambac
Rating(1) Net Par Outstanding
% of Total Net Par
Outstanding
CDO of ABS > 25% MBS(2) BBB + $2,921 0.6%CDO of ABS < 25% MBS AAA 2,410 0.5%Kleros Preferred Funding VI, Ltd. BIG 2,393 0.5%Iowa Student Loan Liquidity Corporation Revenue Bonds A 2,186 0.4%Private Commercial Asset-Backed Transaction BBB + 2,159 0.4%Ridgeway Court Funding II, Ltd. BBB - 1,942 0.4%Diversey Harbor ABS CDO, Ltd. A - 1,848 0.4%Vermont Student Assistance Corporation Revenue Bonds A 1,779 0.3%Wachovia Asset Securitization Issuance II, LLC 2007-HE2 BBB + 1,764 0.3%Belle Haven ABS CDO 2006-1, Ltd. BBB - 1,644 0.3%Ridgeway Court Funding I, Ltd. BBB 1,547 0.3%Michigan Higher Education Student Loan Authority AA 1,544 0.3%Duke Funding High Grade III, Ltd. BBB + 1,508 0.3%Hertz Vehicle Financing, LLC BBB 1,475 0.3%Citibank - CRC Funding, LLC AAA 1,458 0.3%Private AA-Bespoke CDO Squared Transaction BIG 1,398 0.3%Citibank - CAFCO, LLC AAA 1,362 0.3%Cendant Rental Car Funding BBB 1,320 0.3%Duke Funding High Grade IV, Ltd. A + 1,303 0.3%Massachusetts Educational Financing Authority Revenue Bonds AA 1,252 0.2%Duke Funding High Grade V, Ltd. A - 1,250 0.2%Private Commercial Asset-Backed Transaction BBB - 1,205 0.2%Citibank - CHARTA, LLC AAA 1,181 0.2%McKinley Funding III, Ltd. BIG 1,163 0.2%Private Consumer Asset-Backed Transaction AAA 1,125 0.2%Total: $41,137 8.0%
Largest International Finance Exposures
($ Millions)Ambac
Rating(1) Net Par Outstanding
% of Total Net Par
Outstanding
Mitchells & Butlers Finance plc-UK Pub Securitisation A + $2,562 0.5%CDO of IG Corporate AAA 2,131 0.4%Telereal Securitisation plc AA - 1,825 0.4%Punch Taverns Finance plc-UK Pub Securitisation AA - 1,774 0.3%Synthetic RMBS AAA 1,236 0.2%Romulus Finance s.r.l. BBB 1,152 0.2%TubeLines (Finance) plc A 1,050 0.2%
AA 1,025 0.2%Channel Link Enterprises BBB 1,001 0.2%Private Consumer Asset-Backed Transaction A 987 0.2%CDO Corporate Loans AAA 909 0.2%Aspire Defence Finance plc BBB - 854 0.2%RMPA Services plc BBB 853 0.2%Synthetic RMBS AAA 840 0.2%Sydney Airport Finance Co. Pty Ltd BBB 837 0.2%CDO of HY Corporate AAA 829 0.2%Spirit Issuer plc BBB + 817 0.2%Private CMBS Transaction AAA 789 0.2%Regione Campania A - 779 0.2%Capital Hospitals plc BBB - 761 0.1%CDO of HY Corporate AA 739 0.1%Private CMBS Transaction AAA 731 0.1%Scotland Gas Networks plc BBB 717 0.1%Babcock & Brown Air Funding I Limited BBB + 708 0.1%CE Electric Group BBB + 700 0.1%Total: $26,607 5.2%
(1) See Note on the Table of Contents page.
(3) Metronet BCV and SSL are separate operating corporate entities with distinguishable risk features. Individually they would not appear on this list, however their exposures are aggregated to reflect common business and financial issues currently confronting each company.
Metronet Rail (3)
(2) Represents an outstanding commitment to provide a financial guarantee on a static pool consisting primarily of High-Grade and Mezzanine CDO of ABS securities, comprising primarily underlying sub prime and mid prime residential mortgage backed securitizations.
26
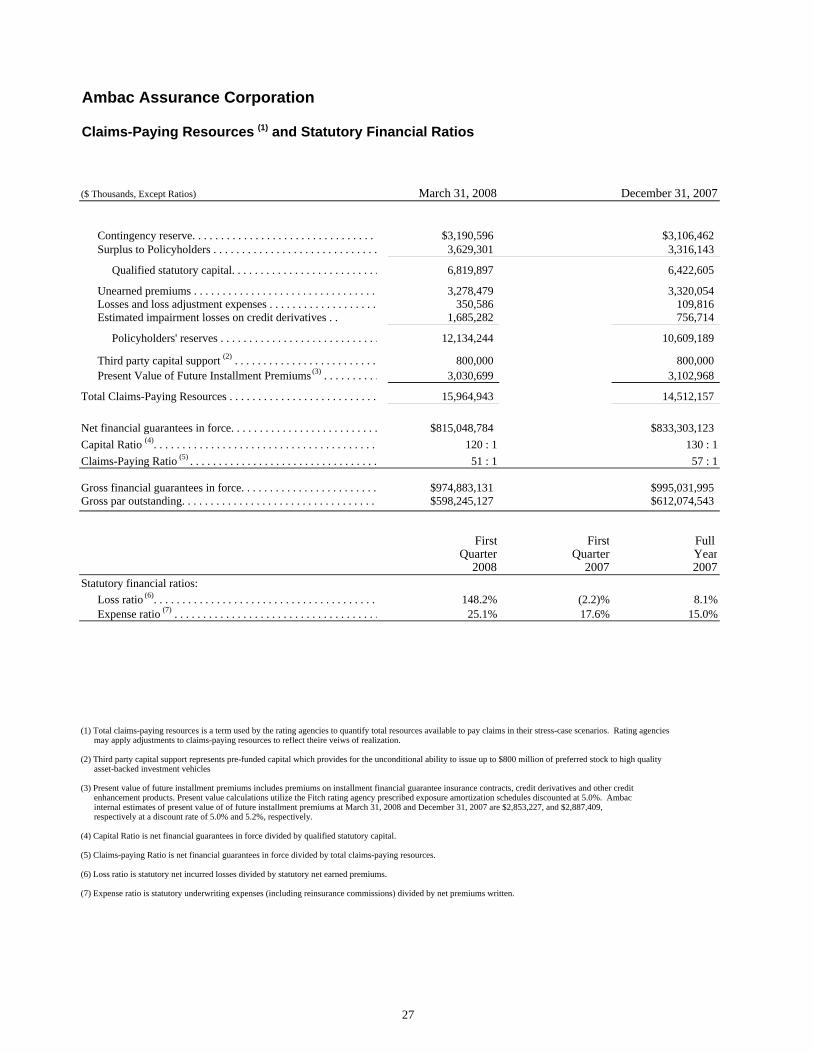
Ambac Assurance Corporation
Claims-Paying Resources (1) and Statutory Financial Ratios
($ Thousands, Except Ratios) March 31, 2008 December 31, 2007
$3,190,596 $3,106,462 3,629,301 3,316,143
6,819,897 6,422,605
3,278,479 3,320,054 350,586 109,816
1,685,282 756,714
12,134,244 10,609,189
800,000 800,000 3,030,699 3,102,968
15,964,943 14,512,157
$815,048,784 $833,303,123 120 : 1 130 : 1
Claims-Paying Ratio (5) . . . . . . . . . . . . . . . . . . . . . . . . . . . . . . . . . 51 : 1 57 : 1
$974,883,131 $995,031,995 $598,245,127 $612,074,543
First First Full Quarter Quarter Year
2008 2007 2007Statutory financial ratios:
148.2% (2.2)% 8.1% 25.1% 17.6% 15.0%
(1) Total claims-paying resources is a term used by the rating agencies to quantify total resources available to pay claims in their stress-case scenarios. Rating agencies may apply adjustments to claims-paying resources to reflect theire veiws of realization.
(2) Third party capital support represents pre-funded capital which provides for the unconditional ability to issue up to $800 million of preferred stock to high quality asset-backed investment vehicles.
(3) Present value of future installment premiums includes premiums on installment financial guarantee insurance contracts, credit derivatives and other credit enhancement products. Present value calculations utilize the Fitch rating agency prescribed exposure amortization schedules discounted at 5.0%. Ambac internal estimates of present value of of future installment premiums at March 31, 2008 and December 31, 2007 are $2,853,227, and $2,887,409, respectively at a discount rate of 5.0% and 5.2%, respectively.
(4) Capital Ratio is net financial guarantees in force divided by qualified statutory capital.
(5) Claims-paying Ratio is net financial guarantees in force divided by total claims-paying resources.
(6) Loss ratio is statutory net incurred losses divided by statutory net earned premiums.
(7) Expense ratio is statutory underwriting expenses (including reinsurance commissions) divided by net premiums written.
Third party capital support (2) . . . . . . . . . . . . . . . . . . . . . . . . .
Loss ratio (6). . . . . . . . . . . . . . . . . . . . . . . . . . . . . . . . . . . . . . . Expense ratio (7) . . . . . . . . . . . . . . . . . . . . . . . . . . . . . . . . . . . .
Gross par outstanding. . . . . . . . . . . . . . . . . . . . . . . . . . . . . . . . . .
Present Value of Future Installment Premiums (3) . . . . . . . . . .
Total Claims-Paying Resources . . . . . . . . . . . . . . . . . . . . . . . . . .
Net financial guarantees in force. . . . . . . . . . . . . . . . . . . . . . . . . .Capital Ratio (4). . . . . . . . . . . . . . . . . . . . . . . . . . . . . . . . . . . . . . .
Gross financial guarantees in force. . . . . . . . . . . . . . . . . . . . . . . .
Contingency reserve. . . . . . . . . . . . . . . . . . . . . . . . . . . . . . . . .
Qualified statutory capital. . . . . . . . . . . . . . . . . . . . . . . . . .
Unearned premiums . . . . . . . . . . . . . . . . . . . . . . . . . . . . . . . .
Policyholders' reserves . . . . . . . . . . . . . . . . . . . . . . . . . . . .
Surplus to Policyholders . . . . . . . . . . . . . . . . . . . . . . . . . . . . .
Losses and loss adjustment expenses . . . . . . . . . . . . . . . . . . . Estimated impairment losses on credit derivatives . .
27

Ambac Financial Group, Inc.One State Street PlazaNew York, New York 10004212-668-0340212-509-9190 (fax)
www.ambac.com