shaping the future - calbee...by frito-lay. performance highlights † expanded due to new garrett...
TRANSCRIPT

Annual Report 2016Fiscal year ended March 31, 2016
TSE code: 2229
Shaping the Future
Our Future isalso supportedby successfulmarketing...
like me!
Marunouchi Trust Tower Main, 22nd Floor
1-8-3 Marunouchi, Chiyoda-ku, Tokyo 100-0005, JAPAN
https://www.calbee.com/ir/
This annual report was printed entirely on FSC®-certifi ed paper using a waterless printing process.Printed in Japan
Calbee, Inc. A
nnual Report 2016
製版センター
6482941
表紙
エイ・アイ・
エイ・デザイン
研究
FSC
カルビー AR 2016
英文
280
435/背5
佐々木単102
H1-4
初校16.09.03
H4 H1
カルビー16表紙_初戻し0906.indd c4-c1カルビー16表紙_初戻し0906.indd c4-c1 2016/09/08 19:002016/09/08 19:00

Corporate Message
Calbee Group Vision
Harvest the Power of Nature.
“We must earn respect,admiration and love fi rstly of our customers,
suppliers and distributors,secondly of our employees and their families,
thirdly of the communities,and fi nally of our stockholders.”
Forward-Looking StatementsThis annual report contains forward-looking statements concerning the future plans, performance and strategies of Calbee, Inc. and its subsidiaries and affi liated companies. These forward-looking statements are not historical facts. They are judgments and assumptions based on information available to the Company at the time of publication, and projections or future policies cannot be assured or guaranteed. Actual results may differ materially from those projected due to changes in economic or market conditions. As such, investors should not place undue reliance on forward-looking statements.
Contents
01020406121618
22242833
3438
85868788
Calbee’s Growth TargetsCalbee Performance HighlightsAt a GlanceCEO MessageC0O MessageThe Secret of Calbee’s StrengthInitiatives in Japan
Calbee’s Most Important Growth PillarOverseas InitiativesCorporate Governance SystemDriving Sustainable Growth throughHealth and Productivity ManagementCorporate Social Responsibility Financial Section
Corporate History Corporate Data Investor InformationBoard of Directors, Audit & Supervisory Board Members
Calbee, Inc. Annual Report 2016 1
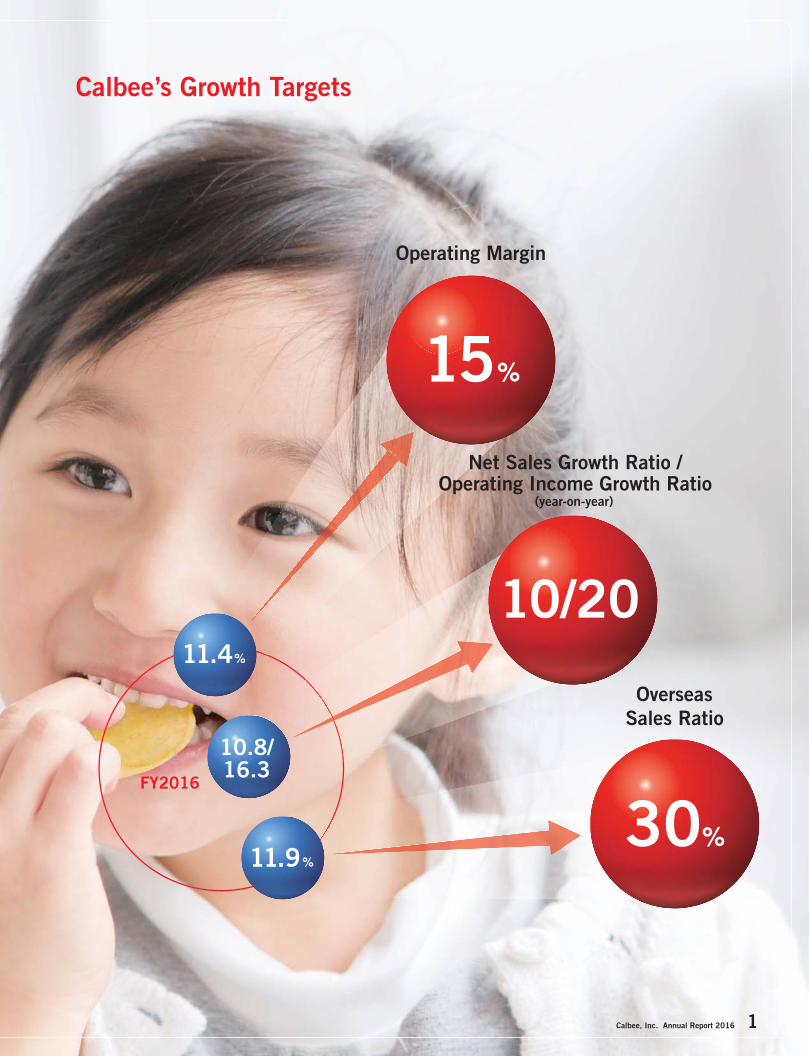
15%
10.8/16.3
11.9%
10/20
30%
11.4%
FY2016
Operating Margin
(year-on-year)
Net Sales Growth Ratio /Operating Income Growth Ratio
Overseas Sales Ratio
Calbee’s Growth Targets
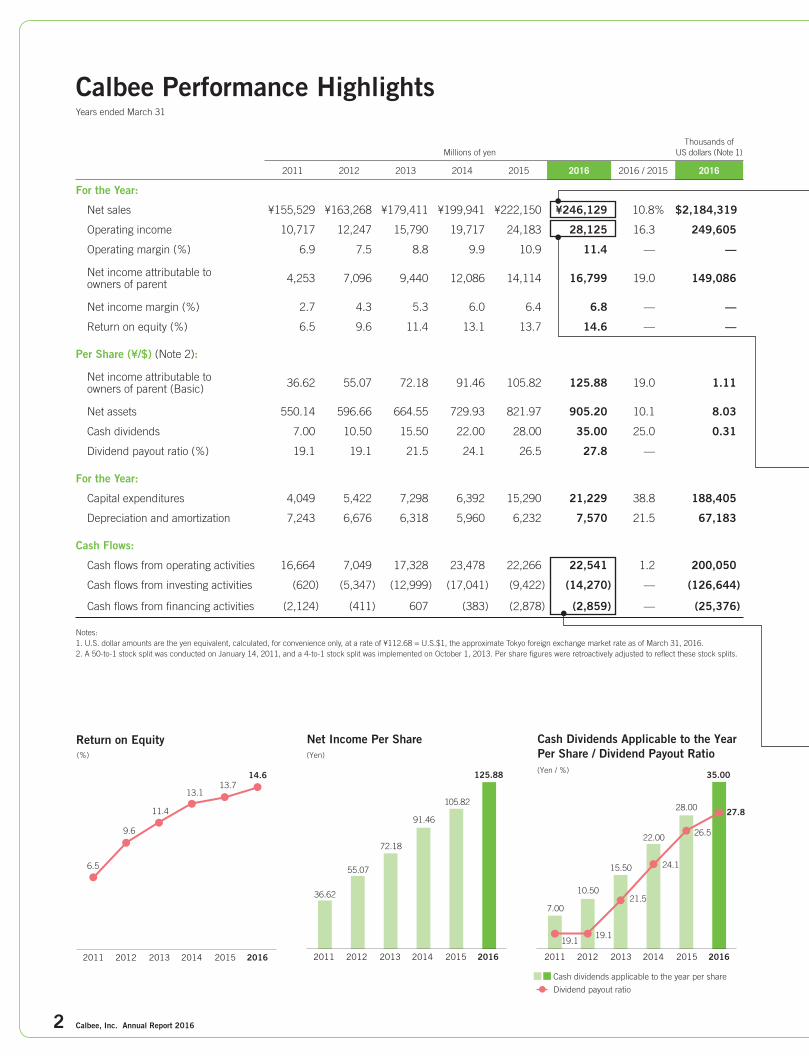
Millions of yenThousands of
US dollars (Note 1)
2011 2012 2013 2014 2015 2016 2016 / 2015 2016
For the Year:
Net sales ¥155,529 ¥163,268 ¥179,411 ¥199,941 ¥222,150 ¥246,129 10.8% $2,184,319
Operating income 10,717 12,247 15,790 19,717 24,183 28,125 16.3 249,605
Operating margin (%) 6.9 7.5 8.8 9.9 10.9 11.4 — —
Net income attributable to owners of parent 4,253 7,096 9,440 12,086 14,114 16,799 19.0 149,086
Net income margin (%) 2.7 4.3 5.3 6.0 6.4 6.8 — —
Return on equity (%) 6.5 9.6 11.4 13.1 13.7 14.6 — —
Per Share (¥/$) (Note 2):
Net income attributable to owners of parent (Basic) 36.62 55.07 72.18 91.46 105.82 125.88 19.0 1.11
Net assets 550.14 596.66 664.55 729.93 821.97 905.20 10.1 8.03
Cash dividends 7.00 10.50 15.50 22.00 28.00 35.00 25.0 0.31
Dividend payout ratio (%) 19.1 19.1 21.5 24.1 26.5 27.8 —
For the Year:
Capital expenditures 4,049 5,422 7,298 6,392 15,290 21,229 38.8 188,405
Depreciation and amortization 7,243 6,676 6,318 5,960 6,232 7,570 21.5 67,183
Cash Flows:
Cash fl ows from operating activities 16,664 7,049 17,328 23,478 22,266 22,541 1.2 200,050
Cash fl ows from investing activities (620) (5,347) (12,999) (17,041) (9,422) (14,270) — (126,644)
Cash fl ows from fi nancing activities (2,124) (411) 607 (383) (2,878) (2,859) — (25,376)
Notes:1. U.S. dollar amounts are the yen equivalent, calculated, for convenience only, at a rate of ¥112.68 = U.S.$1, the approximate Tokyo foreign exchange market rate as of March 31, 2016.2. A 50-to-1 stock split was conducted on January 14, 2011, and a 4-to-1 stock split was implemented on October 1, 2013. Per share fi gures were retroactively adjusted to refl ect these stock splits.
Calbee Performance HighlightsYears ended March 31
Net Income Per Share
2011 2012 2013 2014 2015 2016
36.62
55.07
72.18
91.46
105.82
7.00
19.119.1
21.5
24.1
26.5
27.8
10.50
15.50
22.00
28.00
35.00
2011 2012 2013 2014 2015 2016
Cash dividends applicable to the year per share
Dividend payout ratio
(Yen / %)
Cash Dividends Applicable to the YearPer Share / Dividend Payout Ratio
125.88
Return on Equity(%) (Yen)
2011 2012 2013 2014 2015 2016
6.5
9.6
11.4
13.113.7
14.6
2 Calbee, Inc. Annual Report 2016

Cash Flows(Millions of yen)
2011 2012 2013 2014 2015 2016
Cash flows from operating activitiesCash flows from investing activitiesCash flows from financing activities
16,664
7,049
17,328
23,47822,266
607
(620) (411) (383)(2,878)(2,124)
(5,347)
(12,999)
(17,041)
(9,422)
22,541
(2,859)
(14,270)
(Millions of yen / %)
Operating Income / Operating Margin
2011 2012 2013 2014 2015 2016
6.9
7.5
8.8
9.9
10.9
10,71712,247
15,790
19,717
24,18311.4
28,125
(Millions of yen)
Net Sales
2011 2012 2013 2014 2015 2016
155,529163,268
179,411
199,941
222,150
246,129
• Increased sales and market share of cereal product Frugra
• Domestic market share expan-sion of potato chips
• Strong Sales of Harvest Snaps in North America, Honey Butter Chips in South Korea
• Increased operating income due to net sales growth
• Higher raw material cost mainly caused by the weak yen
• Improved costs driven by utili-zation ratio improvements, etc.
• Increased income before income taxes
• Cash outfl ows for acquisition of production facilities for Frugra, new factory construction in North America
• Cash fl ows from operating activities suffi cient to cover investment outfl ow
222,150
FY2016
FY2015
Potato-based Snacks 7,694
Cereals 7,793
Bakery 1,412
Other products 197
Overseas 6,880
Domestic 17,098
246,129
Higher sales 10,530
Higher raw material costs 1,292
Higher selling expenses 2,386
Higher distribution costs 1,783
Other1,480
Improved costs 234
24,183
FY2016
FY2015
28,125
Lower labor costs 120
Income taxes paid 8,936
Increase in notes andaccounts receivable—trade
2,193
Other operating activities 21
7,570Depreciation and amortization
Income before income taxes 26,123
FY2015
FY2016
42,572
Cash and cash equivalents at end of year
47,323
Purchase offixed assets 21,229
Otherinvesting activities 6,959
Cashdividends paid
4,553
Exchangerate change
660
Operating activities 22,541
Investing activities 14,270
Other financing activities 1,694
Financing activities 2,859
Net Sales for Fiscal 2016
¥246,129 million Up ¥23,978 million 10.8% year on year
Operating Income for Fiscal 2016
¥28,125 million Up ¥3,942 million 16.3% year on year
Cash and Cash Equivalents at End of Fiscal 2016
¥47,323 million Up ¥4,751 million
Calbee, Inc. Annual Report 2016 3

¥246,129million
Sales Breakdown FY2016
Snack Foods:83.2%(Domestic sales: 71.3%; Overseas sales: 11.9%)
Other Food Products:15.5%
Other Businesses:1.3%
Potato-based Snacks: 51.7%
Potato Chips(launched in 1975)
31.9%
Snack Foods: 83.2%
Product InformationCalbee boasts a variety of products in its potato chips lineup that distinguish it from the competition and that have allowed it to secure top brand recognition in the Japanese market. Our basic potato chips, a series of simple but tasty thin-style potato chips fried in cooking oil, comprises Usushio (lightly salted), Consomme Punch (consommé), and Norishio (laver salt) variations. Among other product series are Kata-Age Potato, a line of thickly sliced potato chips that are fried slowly in a kettle using a tradi-tional low-temperature method, and Pizza Potato Chips, which are made using our unique “melt fl ake” technology for an authentic cheese taste. Moreover, we produce potato chips in a wide range of fl avors to match different seasons, local tastes and other factors.
Product InformationJagarico is our second megabrand. Within three years of its launch, the brand’s annual sales had reached ¥10 billion and by its 11th year, ¥20 billion. By its 19th year, fi scal 2014, Jagarico had grown into a brand with net sales of ¥30 billion. Jagarico was Japan’s fi rst snack-in-a-cup, and it has proven popular with a wide range of customers thanks to its unique crunchy texture and easy-to-eat style that leaves hands clean.
Product InformationMade from unpeeled potatoes processed into sticks, the Jagabee lineup features authentic potato fl avor and a unique texture that sets it apart from Jagarico.
Domestics Sales: 71.3%
Performance Highlights
• Basic Potato Chips series (Usushio, Consomme Punch, and Norishio) enjoyed strong sales
• Kata-Age Potato saw a signifi cant increase in sales• Received growing orders for private-brand products from clients
Performance Highlights
• Increased sales of Tarako Butter fl avor and launch of 20-year anniver-sary campaign products
Performance Highlights
• Showed sales increase through strengthening lineup of time-limited and region-limited products
Jagarico(launched in 1995)
Jagabee(launched in 2006)
14.2%
3.9%
At a Glance
The Calbee Group’s main business is the production and sale of snacks and other foods, including potato-based, fl our-based, corn-based and other snacks as well as cereals. In fi scal 2016 (the year ended March 31, 2016), net sales from the production and sale of snacks and other foods totaled ¥242,879 million, an increase of 11.0% year on year. In other businesses, including the distribution business, net sales were almost level with the previous year at ¥3,249 million. A breakdown showing the principal components of consolidated net sales is presented below.
(Millions of yen)Net Sales
Potato Chips
73,051
32.9%
31.9%
78,627
FY2015 FY2016Sales contribution
(Millions of yen)Net Sales
34,223
15.4%
14.2%
35,069
FY2015 FY2016Jagarico Sales contribution
(Millions of yen)Net Sales
8,763
3.9%3.9%
9,488
FY2015 FY2016Jagabee Sales contribution
4 Calbee, Inc. Annual Report 2016

Overseas Sales: 11.9%
Flour-based Snacks: 8.9%
Product InformationKappa Ebisen (prawn crackers) made from whole natural prawns is a long-selling snack product that embarked on its second half century of pleasing palates in fi scal 2015.
Performance Highlights
• Strong sales of sweet potato snack Osatsu Snack and Cheese Bit(Millions of yen)Net Sales
Flour-based snacks
21,972
9.9%
8.9%
22,007
FY2015 FY2016Sales contribution
Corn-based Snacks: 7.5%
Product InformationHaving enjoyed steady sales for many years, Mike Popcorn Butter Shoyu (butter and soy sauce) fl avor was launched in 1983. Our corn-based snack business produces and markets Doritos and Cheetos, two global megabrands developed by Frito-Lay.
Performance Highlights
• Expanded due to new Garrett Popcorn Shops ® store openings and other factors
(Millions of yen)Net Sales
Corn-based snacks
17,801
8.0%7.5%
18,550
FY2015 FY2016Sales contribution
Other New Snacks: 3.2%
Product InformationVegips are whole vegetable chips seasoned only with salt, launched in 2010. In 2016, Calbee entered the fabricated potato chip market employing its technolo-gies, know-how and brand capability to launch Potato Chips Crisps, which boast distinguishing crispness and tasty fl avors and are sold in easy-to-carry packages.
Performance Highlights
• Decreased sales of Vegips and other factors(Millions of yen)Net Sales
Other new snacks
8,401
3.8%3.2%
7,815
FY2015 FY2016Sales contribution
Other Food Products: 15.5%Cereals: 9.8%
Product InformationFrugra (fruit granola) is the single best-selling cereal product in Japan and its sales are continuing to rise. Frugra has proven popular among a broad range of customers, particularly women, who appreciate the ready source of fi ber, iron and vitamins it offers.
Performance Highlights
• Frugra saw sales expand even further and its runaway success continu-ing to drive the growth of the entire cereal market
(Millions of yen)Net Sales
Cereals
16,346
7.4%
9.8%
24,140
FY2015 FY2016Sales composition
Overseas Snack Business: 11.9%
Product InformationIn addition to undertaking product development in Japan, we market snack foods tailored to local tastes in North America, South Korea and other Asian as well as European countries.
Performance Highlights
• Harvest Snaps (Snapea Crisps) and Honey Butter Chips enjoyed strong sales in North America and South Korea, respectively
(Millions of yen)Net Sales
Overseas snacks
22,441
10.1%
11.9%
29,321
FY2015 FY2016Sales contribution
Calbee, Inc. Annual Report 2016 5

CEO Message
Akira MatsumotoChairman of the Board & CEO,Representative Director
6 Calbee, Inc. Annual Report 2016
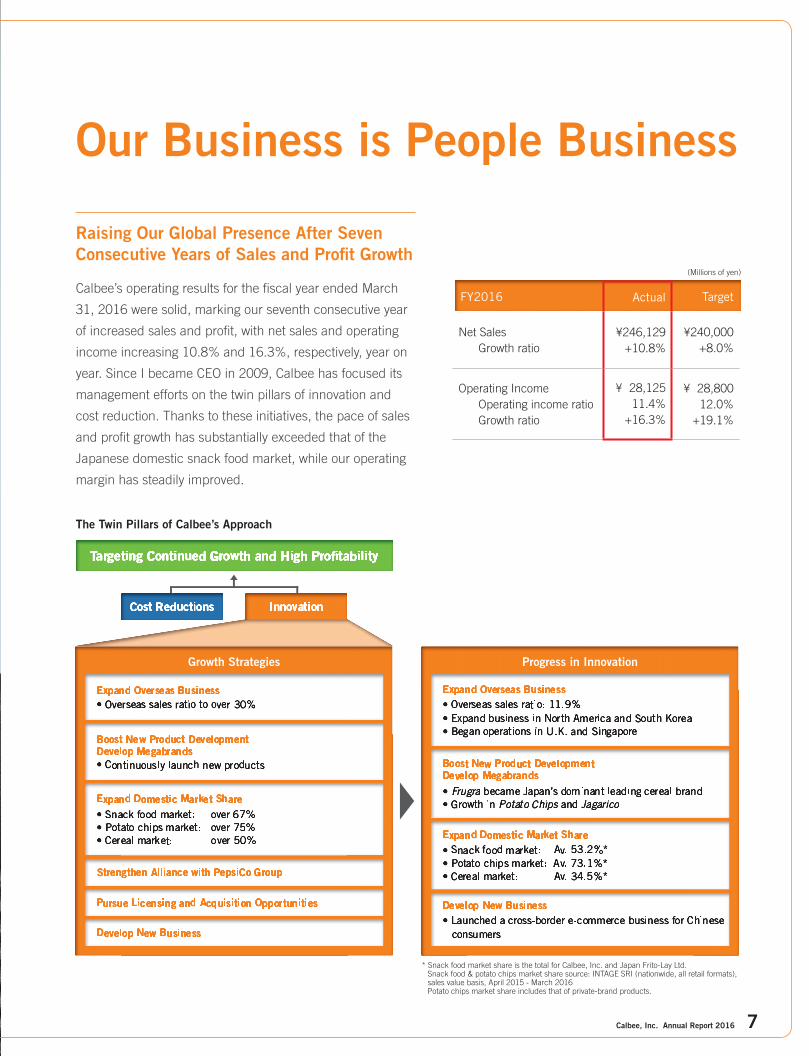
Raising Our Global Presence After Seven Consecutive Years of Sales and Profi t Growth
Calbee’s operating results for the fi scal year ended March
31, 2016 were solid, marking our seventh consecutive year
of increased sales and profi t, with net sales and operating
income increasing 10.8% and 16.3%, respectively, year on
year. Since I became CEO in 2009, Calbee has focused its
management efforts on the twin pillars of innovation and
cost reduction. Thanks to these initiatives, the pace of sales
and profi t growth has substantially exceeded that of the
Japanese domestic snack food market, while our operating
margin has steadily improved.
Our Business is People Business
* Snack food market share is the total for Calbee, Inc. and Japan Frito-Lay Ltd. Snack food & potato chips market share source: INTAGE SRI (nationwide, all retail formats), sales value basis, April 2015 - March 2016 Potato chips market share includes that of private-brand products.
(Millions of yen)
Growth Strategies Progress in Innovation
The Twin Pillars of Calbee’s Approach
FY2016 Actual Target
Net Sales Growth ratio
¥246,129+10.8%
¥240,000+8.0%
Operating Income Operating income ratio Growth ratio
¥ 28,12511.4%
+16.3%
¥ 28,80012.0%
+19.1%
Calbee, Inc. Annual Report 2016 7

Although sales exceeded forecast, operating income was somewhat lower than expected. Our operat-
ing margin improved from 10.9% to 11.4%, a little lower than the one percentage point increase initially
forecast and indicative of an easing in our previously rapid pace of growth.
We are determined not to let our pace of growth decline further, and are maintaining our medium- to
long-term operating margin target of 15%. We will also implement “10/20” once again, a structure aim-
ing for a 10% increase in sales and 20% increase in profi t every year, as soon as possible. To maintain
growth, we are implementing initiatives to improve our manufacturing cost ratio, and will also endeavor
to better control selling, general and administrative (SG&A) expenses. By standing our ground, we will
continue to challenge ourselves to become a genuinely leading company in the global market.
Pursuing Sustainable Expansion on Organic Growth in Domestic Market
Japan’s snack food market has not grown in more than 15 years and, given the country’s declining
birthrate, future market shrinkage seems inevitable. Against this backdrop, Calbee has been striving
to expand its share of the existing domestic snack food market. During fi scal 2016, we released a
constant stream of new competitive products aimed at creating and meeting customer needs, with
Potato Chips being particularly successful and contributing to a larger market share and to overall
business performance. Although Potato Chips commands a very strong 73% market share, there is
still room for further growth.
FY2010 FY2016 Target
Net Sales 100% 100% 100%
Cost of Sales 60.1% 56.5% 50%
Gross Profi t 39.9% 43.5% 50%
SG&A Expenses33.4% 32.1%
30%
R&D Expenses 5%
Operating Income 6.5% 11.4% 15%
Progress toward Calbee’s Earnings Model
8 Calbee, Inc. Annual Report 2016

In August 2016 we launched a new line of
fabricated potato chip products after a year’s
postponement, under the strong leadership of
president and COO Shuji Ito. This is a market
valued at around ¥27 billion annually, and we
have an ambitious aim of capturing a 50% mar-
ket share within several years while stimulating
further demand.
We also see domestic market growth oppor-
tunities in areas other than snack foods. For
example, Frugra, a cereal targeting the break-
fast food business, contributed signifi cantly to
sales growth in fi scal 2016. The market for
cereals, including Frugra, is expected to main-
tain its current growth rate for several years. We
also aim to develop a new business in food
products to establish a third pillar of operations
alongside snack foods and cereals.
Given the stability of our mainstay business in
Japan, we are confi dent that we can meet our
target of achieving an annual growth rate of 5% in the snack business and that our cereals business, in
particular, will see strong growth going forward. However, the results of our recent initiatives to realize
innovation through new product development have been less than successful we hoped. So although it
has become increasingly diffi cult to create mega hits in the confectionery market, we are actively pursu-
ing operational reforms and genuine innovation in our prod-
ucts to achieve our target of a 67% share of the domestic
snack foods market.
Realigning Our Strategy for Overseas Expansion
There are a number of overseas market regions with robust
demand for snack foods. In North America, we smoothly
established a new factory in Senatobia, Mississippi in June
2015. However, due to operational issues at our existing fac-
tory in Fairfi eld, California, which had been playing a key role
in supporting our sales expansion, revenues from our North
American operations fell short of forecasts. We are currently
working to overhaul the facilities in question and resolve
some organizational issues.
Despite these diffi culties, North America remains a large
Cereal Market and Calbee’s Share(Billions of yen)
2011 2012 2013 2014 2015 Target
SourceShare: INTAGE SRI based on sales (nationwide, all retail formats)Market: Japan Snack Cereal Foods Association
Corn flakes Granola Brown-rice OtherCalbee’s share (FY) (right scale)
(%)
34.5
20.1
27.5
30.932.7
50.0
0
50
100
0
30
60
Overseas Sales Ratio(%)
FY2010 FY2016 Target
3.6
11.9
30.0
Calbee, Inc. Annual Report 2016 9

and very appealing market for snack foods. Harvest Snaps, one of our core product lines marketed in
the “better-for-you” food category in the region, has earned pleasing recognition among the growing
number of health-conscious customers. Our aim is to create new hit products through development
involving both Japanese and local R&D bases.
In China, despite having decided to dissolve our joint venture, we intend to reformulate our basic
regional strategy by the second half of fi scal 2017 and then restart local operations within one year. Also
in China, we have launched a cross-border e-commerce business on a trial basis. There is tremendous
potential in China with its large population, and still we recognize that local operation in China is the key
of our Chinese business growth.
Taken as a whole, we see the restructuring of our North American business as the highest priority
issue for fi scal 2017 in overseas business. At the same time, we will strive to expand our existing over-
seas businesses and improve their profi tability by streamlining operations in every market, such as in
South Korea where we have already opened a new factory and increased production capacity this year.
We entered the UK and the Philippine markets in 2015 and Indonesia in 2016, and are working swiftly
to get operations in these countries on track and profi table within the next few years. In these ways, we
are solidifying our business foundation to become an even stronger global player and achieve our goal
of raising the overseas sales ratio to 30% over the medium- to long-term.
Our People Drive Our Growth
It is absolutely clear to me that Calbee’s future success depends on the quality of its people. In provid-
ing snacks to consumers, our employees are the key players behind the production and marketing of
these offerings. To put it simply, “Our Business is People Business.” This is why we consider it essential
to have an environment in which every worker
can realize their full potential and achieve suc-
cess, regardless of gender, nationality or race, in
order to ensure further corporate growth and
achieve genuine innovation.
With this in mind, Calbee will continue to do
its utmost to promote workforce diversity. As of
April 2016, our overall ratio of female managers
had risen considerably to 22.1%. However, we
understand that diversity should not be narrowly
defi ned as the promotion of women. Looking
ahead, we will build on our current diversity ini-
tiatives and create an even better workplace as
a company where everyone can exert his/her
full potential to achieve results and get reward-
ed fairly for based on their performance.
FY2010
16.7
Cash Dividends per Share / Dividend Payout Ratio(Yen / %)
Cash dividends per share Dividend payout ratioA 50-to-1 stock split was conducted on January 14, 2011, and a 4-to-1 stock split was implemented on October 1, 2013. Per share figures were retroactively adjusted to reflect these stock splits.
FY2011 FY2012
19.119.1
FY2013
21.5
FY2014
24.1
FY2015
26.5
FY2016
27.8
FY2017(plan)
30.0
6.00 7.00
10.50
15.50
22.00
28.00
35.00
40.00
10 Calbee, Inc. Annual Report 2016

Achieving Calbee’s Vision
We recognize that returning profi ts to shareholders is one of our key responsibilities. For fi scal 2016, we
increased our year-end dividend by ¥7 per share to ¥35 per share, achieving a consolidated payout
ratio of 27.8%. We intend to continue to raise the annual dividend and dividend payout ratio.
The Calbee Group’s vision is ‘We must earn respect, admiration and love fi rstly of our customers,
suppliers and distributors, secondly of our employees and their families, thirdly of the communities, and
fi nally of our stockholders.’ To realize our vision, we have a number of challenges to overcome. However,
“No trouble makes no business,” to achieve this vision, we must tackle a number of challenges. We are
committed to satisfying the expectations of all our stakeholders, ensuring sustainable corporate growth
and enhancing corporate value over the long-term.
In closing, I want to recognize the valued support and feedback of our stakeholders. We look forward
to your ongoing support.
Akira MatsumotoChairman of the Board & CEO,Representative Director
Calbee, Inc. Annual Report 2016 11

Despite Record-High Fiscal 2016 Results for Sales and Profi t, WE ARE NOT SATISFIED
In fi scal 2016, our business activities continued to be centered on the twin pillars of strategy: innovation and cost
reductions.
Sales of domestic snack foods, our main business, grew steadily while market growth leveled off. In the cereal
business, Frugra continued to grow strongly and lead market expansion. Overseas business also expanded as reve-
nues from the markets we already entered increased while entering into new markets successfully. Meanwhile, we
have undertaken a variety of initiatives aimed at domestic factory capacity utilization improvement and cost reduction.
Consequently, net sales for fi scal 2016 rose 10.8% year on year to ¥246,129 million (US$2,184 million), while
operating income climbed 16.3% to ¥28,125 million (US$249 million) for an operating margin of 11.4%.
Consolidated net income attributable to owners of parent increased 19.0% to ¥16,799 million (US$149 million).
With the domestic business serving as a main contributor, Calbee thus posted record-high sales and profi t.
COO Message
Shuji ItoPresident & COO,Representative Director
Focusing on innovation and cost reductions, we will become a globally competitive food company
12 Calbee, Inc. Annual Report 2016
Despite record-high sales and
profi t, we are not satisfi ed with
this performance. Annual growth
in net sales exceeded the tar-
geted 8.0%, but the growth in
operating income fell short of
the targeted 19.1% and the
operating margin was below the
target of 12.0%. These fell short
of the fi nancial targets I com-
mitted to for stakeholders.
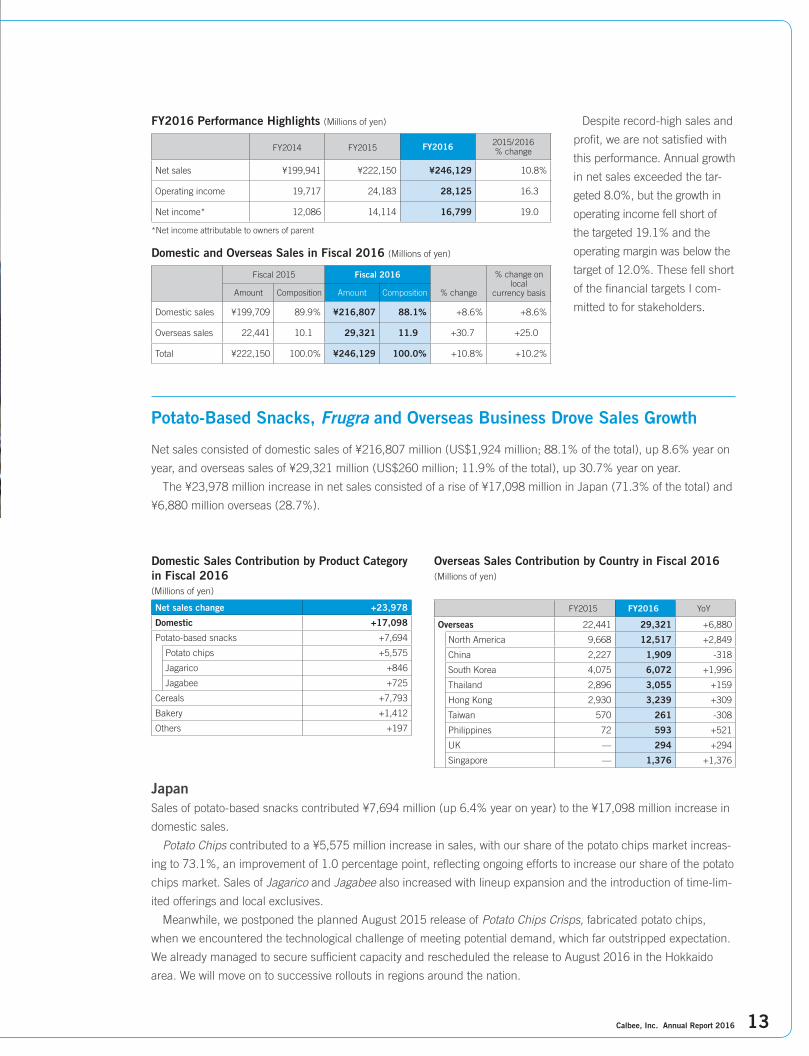
Potato-Based Snacks, Frugra and Overseas Business Drove Sales Growth
Net sales consisted of domestic sales of ¥216,807 million (US$1,924 million; 88.1% of the total), up 8.6% year on
year, and overseas sales of ¥29,321 million (US$260 million; 11.9% of the total), up 30.7% year on year.
The ¥23,978 million increase in net sales consisted of a rise of ¥17,098 million in Japan (71.3% of the total) and
¥6,880 million overseas (28.7%).
Domestic and Overseas Sales in Fiscal 2016 (Millions of yen)
Fiscal 2015 Fiscal 2016
% change
% change on local
currency basisAmount Composition Amount Composition
Domestic sales ¥199,709 89.9% ¥216,807 88.1% +8.6% +8.6%
Overseas sales 22,441 10.1 29,321 11.9 +30.7 +25.0
Total ¥222,150 100.0% ¥246,129 100.0% +10.8% +10.2%
Domestic Sales Contribution by Product Category in Fiscal 2016 (Millions of yen)
Net sales change +23,978
Domestic +17,098
Potato-based snacks +7,694
Potato chips +5,575
Jagarico +846
Jagabee +725
Cereals +7,793
Bakery +1,412
Others +197
Overseas Sales Contribution by Country in Fiscal 2016 (Millions of yen)
FY2015 FY2016 YoY
Overseas 22,441 29,321 +6,880
North America 9,668 12,517 +2,849
China 2,227 1,909 -318
South Korea 4,075 6,072 +1,996
Thailand 2,896 3,055 +159
Hong Kong 2,930 3,239 +309
Taiwan 570 261 -308
Philippines 72 593 +521
UK — 294 +294
Singapore — 1,376 +1,376
FY2016 Performance Highlights (Millions of yen)
FY2014 FY2015 FY2016 2015/2016 % change
Net sales ¥199,941 ¥222,150 ¥246,129 10.8%
Operating income 19,717 24,183 28,125 16.3
Net income* 12,086 14,114 16,799 19.0
*Net income attributable to owners of parent
JapanSales of potato-based snacks contributed ¥7,694 million (up 6.4% year on year) to the ¥17,098 million increase in
domestic sales.
Potato Chips contributed to a ¥5,575 million increase in sales, with our share of the potato chips market increas-
ing to 73.1%, an improvement of 1.0 percentage point, refl ecting ongoing efforts to increase our share of the potato
chips market. Sales of Jagarico and Jagabee also increased with lineup expansion and the introduction of time-lim-
ited offerings and local exclusives.
Meanwhile, we postponed the planned August 2015 release of Potato Chips Crisps, fabricated potato chips,
when we encountered the technological challenge of meeting potential demand, which far outstripped expectation.
We already managed to secure suffi cient capacity and rescheduled the release to August 2016 in the Hokkaido
area. We will move on to successive rollouts in regions around the nation.
Calbee, Inc. Annual Report 2016 13
Sales of our cereals rose ¥7,793 million, or 47.7%, compared with the previous fi scal year. Sales of our mainstay
Frugra grew continuously to ¥22,337 million, up 54.6% year on year. We consecutively expanded Frugra produc-
tion capacity in May 2015 and in April 2016. With “hassle free,” “high-fi ber content,” and “low-sodium content” as
key advertising messages, Frugra is gaining popularity as a practical and health-conscious breakfast. As a leading
brand, Frugra is increasing market share while driving market expansion. In fi scal 2016, our share of the domestic
cereal market rose 1.8 percentage points to 34.5%.
OverseasOverseas sales totaled ¥29,321 million and accounted for 11.9% of net sales.
We continued to expand overseas business. In North America, we launched a new factory in Senatobia, Mississippi
which contributed to the sales growth of our mainstay Harvest Snaps. In South Korea, the boom of Honey Butter
Chips continued. In addition, a sales distributor in Singapore joined Calbee group, and U.K. operations commenced.
On the other hand, we revisited business strategies in some countries. In China, we dissolved the joint venture
agreement related to Calbee (Hangzhou) Foods Co., Ltd. due to its persistently stagnant performance. In Taiwan,
we decided to liquidate a local joint venture in March 2016. We are re-establishing the strategies to re-enter
these markets.
Contributors to Profi t Growth
The overall ¥3,942 million rise in operating income was mainly attributable to the following factors. The expansion
in net sales contributed to a ¥10,530 million increase in operating income. This was partially offset by such nega-
tive factors as a rise in raw material costs totaling ¥1,292 million due to the depreciation of the yen along with
increases in selling expenses of ¥2,386 million and distribution costs of ¥1,783 million. As a result, operating
income rose 16.3% year on year.
Although our fi scal 2016 profi t was a record high, our operating income target was not met due to the following
challenges.
The fi rst challenge was balancing between supply and demand in our domestic supply chain operations during
the fi rst quarter. The fact that our average factory utilization ratio is now more than 90% made it diffi cult to meticu-
lously adjust production volume of each stock keeping unit (SKU). This resulted in an increase in inventory, sales
discounts, losses on inventory disposal and storage costs while, at the same time, being hampered by inventory
back order, marketing opportunity losses and irregular transportation expenses. We already addressed these prob-
lems in the second quarter by strengthening control over the number of SKUs and inventory while aligning our
supply with demand.
Another challenge we faced during the year was the sluggish performance of Japan Frito-Lay Ltd., which supplies
corn-based snacks. Despite the strong showings of premium popcorns in the previous fi scal year, Japan Frito-Lay
saw overall sales fall quite short of forecasts. We strive to streamline Japan Frito-Lay’s operations and reduce costs
in order to improve profi tability.
Another, even greater challenge is our pursuit of profi table global expansion. Business in North America, a key
contributor to profi table global expansion, has lost its previous growth momentum due to the decrease in capacity
utilization that resulted from facility-related problems at the existing factory in Fairfi eld, California.
14 Calbee, Inc. Annual Report 2016

Fiscal 2017 Initiatives: Achieving Improved Operating Income Ratio
In fi scal 2017, we expect net sales of
¥262,000 million, up 6.4% year on year.
This estimate includes a rise in domestic
sales of ¥9,884 million, or 4.6%, as well
as annual growth of 20.4%, or ¥5,986
million, in overseas sales. We also set the
target of boosting operating income
10.2% to ¥31,000 million.
In Japan, we will strive to secure even
higher sales of Frugra. Also, we will be
promoting Kata-Age Potato and Jagarico
as key products in potato-based snacks
for further expansion, with a planned
increase in production capacity by the end of fi scal 2017. For further expansion of our potato-based snack busi-
ness, we are aware of the urgent need to secure potato supply from domestic farmers. We will continue to constantly
seek out stable sources of quality potatoes for safe, reliable and delicious snack products available to our customers.
Overseas, we will make the business launch successful in markets, such as Spain and Indonesia, where we have
recently entered. We will also strive to expand business further in North America, South Korea and other markets
where we already have footholds. Specifi cally, in North America where business growth has been slowing down
since the second half of fi scal 2016, we are determined to strengthen local management, enhance the supply chain
system and re-establish the trust of product supply among sales channels. Moreover, we will release new Harvest
Snaps offerings with the aim of getting the North American business back on a growth path.
To secure greater profi t, we will pursue both sales growth and cost improvement through enhancing production
effi ciency. In Japan, we continuously promote cost containment initiatives to minimize production loss and improve
manufacturing effi ciency. In addition, we will enhance control over selling, general and administrative expenses
(SG&A). We will strive to improve effi ciency with selling expenses in Japan while accelerating overseas investment,
and thus we will keep our current SG&A ratio unchanged from previous year. Lastly, we plan to raise the operating
margin to 11.8%, up 0.4 of a percentage point year on year.
We ask for your continued support of our business operations.
Shuji ItoPresident & COO, Representative Director
Breakdown of Increase in Operating Income in Fiscal 2016(Millions of yen)
Increase
Highersales
Improvedcosts
Higherselling
expensesHigher
distributioncosts
Lowerlaborcosts Others
Increasedraw material
costs24,183
FY2015 FY2016
10,530
1,2922,386
1,783
234
Increase in depreciation expenses Decline in utilization ratio in North AmericaUtilization ratio improvements, etc.
1,127575
1,936
Domestic Overseas
1,780605
1,480
28,125120
Decrease
Calbee, Inc. Annual Report 2016 15

Source: Intage SRI based on sales (nationwide, all retail formats) April 2015 - March 2016Comparison period: April 2014 - March 2016Snack market share: Total of Calbee and Japan Frito-Lay
We have built a solid product safety track record that now constitutes a distinguishing brand
strength of Calbee. However, because snack foods tend to be discretionary purchases, we
must keep being particular about deliciousness and quality. In 2015, we decided to recall
some products that were somewhat inferior in texture despite meeting our product quality
standards. The recall demonstrated our endless pursuit of product quality, even for such a
subtle factor as texture. The decision was considered critical to protect the Calbee brand.
Compared with overseas markets, there are more snack fl avor variations available in
Japan. Some critics regard so many variations as disadvantageous to profi tability. But we
believe our customers would not enjoy seeing shelves fi lled only with regular items.
Accordingly, we pursue the optimal balance between securing profi tability as a manufac-
turer and providing customers with the sheer fun of choosing their snacks from a broad lineup.
Compound Annual Growth Rates (CAGR) FY2011- FY2016 in Domestic Market
Calbee’s Share of the Domestic Snack Food and Cereal Market
Snacks Cereals
The Secret of Calbee’s StrengthOur Domestic Operations
Makoto EharaExecutive Vice President
** Source: Japan Snack Cereal Food Association 2010-2015* Source: All Nippon Kashi Association 2010-2015
53.2% 34.5%
No.1 No.1
Calbee’s domestic business enjoys continuously robust sales growth that exceeds market growth. In addition to expanding sales,
the Company improved domestic profi tability by increasing capacity utilization and production effi ciency and stepping up cost
reduction efforts. In sum, the domestic business is a core operation bolstering Calbee’s organic growth. To discover the secrets of
the Company’s strength, we hear from Calbee’s Executive Vice President, Makoto Ehara, as well as three key product managers.
6% 1%
Snackmarket
* **
35% 16%
Cerealmarket
16 Calbee, Inc. Annual Report 2016

Thoroughly Pursuing Technological Advancement and Quality Control in Every Process
VarietySelection
Cultivation Storage Manufacturing Marketing
Every 10 years or so, Calbee releases a novel product featuring ingredients that set it
apart. This is backed by our product development, which centers on utilizing the bene-
fi ts of natural ingredients. Calbee’s long-sellers are the result of persistent development
with an eye to customer benefi t, even those that were not an immediate hit. We continue
to develop products in line with our aspiration to deliver delicious food to customers while
maintaining an optimal balance between agility and tenaciousness.
Yumiko AboshiManager, FRUGRA Division, Marketing Group
Calbee boasts a variety of key brands that bolster its strength. Snack culture in Japan is
uniquely refi ned, with snacks often presented as exquisite foods to be enjoyed not only for
their taste but also for texture, appearance and package design. Although snacks are gen-
erally thought of as teatime
treats, in fact consumers
eat snacks at all sorts of
hours in widely varying
circumstances.
Accordingly, our brands
are meticulously seg-
mented to best satisfy customer needs. Going forward,
our domestic snack business can continue to grow by
astutely probing and addressing customer needs.
Yuko KawaseManager, Snack Division, Marketing Group
Flour-based snacksPotato ChipsCerealsJagaricoJagabeeCorn-based snacksProcessed breadOther
1949 1959 1969 1979 1989 1999 2009
Sales by Product Group
Our distinguishing strength is our robust lineup of long sellers. We maintain a constant
stream of new products and continually work to further harness the blessings of nature.
The variety of fl avors we offer is also impressive. Three to four fl avor variations are avail-
able for every regular item on store shelves. Our time-limited products feature seasonally
evocative fl avors such as plums in spring. It is characteristically Japanese to acknowledge
the seasonal cycle through specifi c fl avors. We continually introduce new fl avors to
increase brand recognition.Naoko TsuchiyaManager, Potato Chips Division, Marketing Group
Calbee, Inc. Annual Report 2016 17

Initiatives in Japan
Upholding the twin pillars of innovation and cost reduction, Calbee aims to secure an unequalled domestic market share. Having
positioned sales expansion in the snack food and cereal categories as a growth driver, we will continuously strive to reap greater
profi ts from the domestic market, setting the operating margin target at 15%.
Market Conditions
(Billions of yen) (Trillions of yen)
Confectionery Market in Japan
2008 2009 2010 2011 2012 2013 2014 2015
Confectionery retail sales (right scale)Snack foods (left scale) Chocolate (left scale) Rice Foods (left scale)
Source: All Nippon Kashi association
300
450
600
1.5
2.5
3.5
In calendar 2015, the domestic confectionery market saw 2.3%
year-on-year overall growth in value to ¥3.3 trillion. The snack
food market, our main fi eld of operations, grew 1.7% to ¥429
billion. Although considerable market growth is not expected
going forward, we are striving to increase our presence by dis-
covering unmet needs and introducing new products.
Meanwhile, the cereal market continued to see robust
growth in value, rising 25.8% year on year to ¥53.7 billion,
with Frugra serving as the chief growth driver. On the back of
rising consumer preferences for health-conscious products,
we anticipate signifi cant growth in this category.
Growth of the domestic snack food market is stagnant
The domestic cereal market boasts signifi cant potential for future growth
67%
TARGETShare of the Japanese snack food market
18 Calbee, Inc. Annual Report 2016

Calbee’s Presence
Further solidify Calbee’s advantageous position in the potato chips market
Frugra has been increasing its share in the growing cereal market in Japan.
(%)
Calbee's Market Position
FY2012 FY2013 FY2014 FY2015 FY2016
Notes:1. Source: INTAGE SRI (nationwide, all retail formats), Base: sales value, April 2011 – March 20162. Snack food market share is the total for Calbee, Inc. and Japan Frito-Lay Ltd.3. In 2015, the scope of the snack food market was redefined. Accordingly, figures for preceding years have been recalculated. 4. “Year” notation is fiscal years (April to March) for Calbee, Inc.
Calbee's potato chips market share
Calbee's snack food market share
Calbee's cereal market share
64.2
48.2
20.1
68.1
51.9
27.5
70.7
53.3
30.9
72.1
53.8
32.7
73.1
53.2
34.5
20
40
60
80
In fi scal 2016, Calbee captured a 53.2% share of the domes-
tic snack food market, securing its position as the market
leader. In particular, we captured a dominating 73.1% share
of the potato chips market, our key area of business.
Moreover, we command 57.0% and 20.6% shares of the
fl our-based and corn-based snack markets, respectively, as
well as a 34.5% share of the domestic cereal market. In
sum, Calbee boasts the top shares in the aforementioned
multiple market categories.
50%
TARGETShare of the Japanese cereal market
Calbee, Inc. Annual Report 2016 19

Initiatives in Japan
We will further expand the domestic business by increasing
production capacity for hit products, introducing new products
and optimizing production lines.
In August 2016, we began
marketing fabricated potato
chips under the brand name
Potato Chips Crisps. Looking
ahead, we will constantly
introduce new products to
stimulate market demand.
In the face of an ongoing, nationwide supply shortage of
Jagarico, we decided to commission its manufacture to the
Japan Agricultural Cooperatives (JA) from September 2016,
with the aim of boosting production volume. On the other
hand, we will streamline our current two-factory potato chips
production system in Hokkaido Prefecture, which consists of
our own factory and a JA-run factory, as it has excess produc-
tion capacity. We will consolidate all potato chips production
into our own factory, thereby optimizing our supply structure.
In fi scal 2016, we posted a record-high operating margin of
11.4%. Previously, our focus was on increasing sales and prof-
it by improving domestic factory utilization and production effi -
ciency. This policy helped us lower the ratio of fi xed costs. At
the same time, we actively invested in promotional campaigns
while leveraging the improved capacity utilization ratio to
reduce sales prices. Thanks to these efforts, our already large
share of the domestic market grew even larger. However, since
we have little room for improvement in domestic factory utiliza-
tion, we will strive to expand our production capacity and
Constantly introducing new products and fl avors
Undertaking an ongoing and exhaustive reduction in the manufacturing cost ratio
Optimizing sales promotion expenses
Strengthening the marketing of hit products by improving production capacity and implementing effective promotional activities
Jagarico Production Reform
Jagarico Sales(Billions of yen)
FY2013 FY2014 FY2015 FY201620
30
40
CAGR 7.1%
Snacks
Securing Greater Profi ts in Japan
Securing a Greater Domestic Market Share
JA Shihoro OEM Factory
JA Shihoro OEM Factory
Chitose Factory Chitose Factory
Obihiro Factory Obihiro Factory
JO
From September 2016Previously
20 Calbee, Inc. Annual Report 2016

In 2016, Frugra marks the 25th anniversary of its release.
Over the past six years, the CAGR for our cereal products,
including Frugra, averaged 35% thanks to burgeoning sales
growth at more than twice the pace of the domestic cereal
market.
One of our hit products, Frugra is seeing sustained growth
due to its ability to satisfy consumer needs for health-con-
scious breakfast staples. Going forward, we will work to
increase market recognition of Frugra as a health conscious
breakfast, thereby boosting its sales.
Due to a high capacity utilization ratio, Frugra production
was at fi rst limited to a few regular products. With the launch
of a new factory in April 2016, however, we signifi cantly
expanded our production capacity, facilitating the manufac-
ture of ¥35 billion in Frugra products per year. In addition to
increasing the production volume of regular offerings, we will
enhance Frugra product lineup to capture an even broader
customer base.
Expanding recognition that Frugra is “hassle free,” “high fi ber” and “ low-sodium”
Enhanced product lineup
enhance the effi ciency of existing production lines while
stepping up cost reduction efforts. In these ways, we will
decrease our manufacturing cost ratio.
Although we have been abstaining from cutting selling,
general and administrative (SG&A) expenses, we will
endeavor to enhance the effi ciency of selling expenses,
which constitute a major SG&A expense component. In
these ways, we will raise our operating margin to 15% in
the next several years.
(Billions of yen)
Calbee’s Frugra Sales and Production Capacity
FY2013 FY2014 FY2015 FY2016 FY2017(Plan)
0
20
40
ProductionCapacity
0 10
15
55
60
(%)
(%)
Manufacturing Cost Ratio and Selling Expense Ratio
FY2010 FY2011 FY2012 FY2013 FY2014 FY2015 FY2016
Manufacturing cost ratio (left scale) Selling expense ratio (right scale)
Cereals
Calbee, Inc. Annual Report 2016 21

Calbee’s Most Important Growth PillarOur Overseas Operations
Overseas operations are Calbee’s primary growth driver. We are expanding our operations with unique products of world-leading
quality in the key regions of North America, China, Southeast Asia, and Western Europe. In this special feature, we hear from
Keiei Sho, an Executive Offi cer and the General Manager of the Overseas Business Division, about Calbee’s current strategies
for and the outlook of global expansion.
70,000
10,000
20,000
30,000
40,000
50,000
60,000
140.0
(GDP per capita,US$)
020.0 40.0 60.0 80.0 100.0 120.0
Japan
Germany
Mexico
Russia
Hong Kong
1994 Singapore
2015
Australia
(Snack* consumption per capita,US$)*Snack: Savory snacks
Source: IMF, Canadian, All Nippon Kashi Association
2002
China
2015
1970
United Kingdom
United States
Thailand
1980
South Korea
2003
Philippines
2015
Indonesia
2016Brazil
India
Spain
2016
Strategic Markets
Phase I North America, China, South Korea, Thailand, Taiwan, Hong Kong
Phase II Western Europe (U.K., Spain), Indonesia, Russia, Australia, Malaysia, Vietnam, etc.
Phase III India, Brazil
Note: Red text indicates countries / regions where Calbee has secured footholds.
Global Expansion Strategy – What Makes Us OutstandingNothing more perfectly describes Calbee’s current global
expansion strategy than the phrase “swift attack.” Our global
business has expanded rapidly since 2009. In 1970 we
entered the North American market, following this with entry
into Thailand and Hong Kong, but our pace of growth was
slower until 2008. In 2009, a new management team decided
to position global expansion as a priority issue, initiating a
three-phase global expansion plan.
22 Calbee, Inc. Annual Report 2016

Keiei ShoExecutive Offi cer, General Manager, Overseas Business Division
We determine our priority targets based on market size,
growth potential, and receptiveness to Calbee products. In
line with our strong emphasis on “swiftness,” we choose to
form partnerships as our primary modus operandi for expan-
sion in Asia, while in Europe and the United States, where a
sales channel infrastructure is already established, we follow
a direct expansion model like that used for our entry into the
U.K. market.
Overseas Expansion Best PracticesOur North American and South Korean businesses showcase
best practices for our overseas business operations.
In North America, Harvest Snaps, now a best-selling
series, was fi rst marketed around 15 years ago. Favorably
accepted, the product was placed in the “Better-for-You” cat-
egory, which lies between regular snacks and health foods.
To spur popularity, we placed the product amid fresh pro-
duce displays while adopting a new package design featuring
large images of the primary vegetable content. A recent
surge in health-consciousness is serving as a tailwind.
In South Korea, for a long time the snack food market was
a rather conventional array of products undifferentiated with
regard to fl avor. We found this an opportunity and decided to
strive to stimulate potential demand by providing consumers
the sheer fun of choosing a snack from a wide variety of
options, which is a key competency of Calbee, which offers
nearly 200 fl avor variations every year. Thus, Honey Butter
Chips was introduced. In spite of our spending the least pos-
sible amount on advertising, it became a mega hit social
phenomenon, in large part due to favorable mentions on
social media by a number of Korean celebrities. The aston-
ishing potential of social networks as an advertising medium
was one of the best lessons we took away from our South
Korean experience.
In North America, we launched a new factory in 2015, the
existing factory having decreased its capacity utilization after
prolonged over-utilization and a decline in overall supply
chain management. We have dispatched a senior management
team to North America to address related issues. Aiming for
¥20 billion in sales, we are committed to strengthening orga-
nizational governance and supply chain management.
Our domestic business operations maintain high quality
backed up by phenomenally excellent and seasoned
engineers. With the support of these engineers, we are rolling
out Japanese quality standards overseas. However, since
such engineering resources are limited, we need to balance
geographical expansion and quality maintenance. Looking
ahead, we will shift our focus to strengthening the technolog-
ical capabilities of existing overseas facilities.
Toward an Overseas Sales Ratio of 30%In North America, we will begin developing new products in
the “Better-for-You” snack food category in the next three
years. As for China, we are currently formulating revitalization
plans covering the selection of products, production costs,
target regions, and local partners. Given the stable business
results of the e-commerce business started in 2015, we
believe that the Calbee brand has the potential to become
popular in China. Elsewhere in Asia, we entered the
Indonesian market in 2016, taking on the major challenge of
reaching the broadest possible local consumer base. In
Europe, our U.K. operations have made a smooth start. We
have also launched operations in Spain and are endeavoring
to expand local business.
My foremost mission is to fi nd a way to raise our overseas
sales ratio to 30% in fi ve years. As we move forward, the
efforts I have described here can be equated with establishing
a solid base camp preparatory to attacking the summit. Over
the next two years, we will draw on our experience to build the
next camp and map out the best route to the heights.
Calbee, Inc. Annual Report 2016 23

Overseas Initiatives
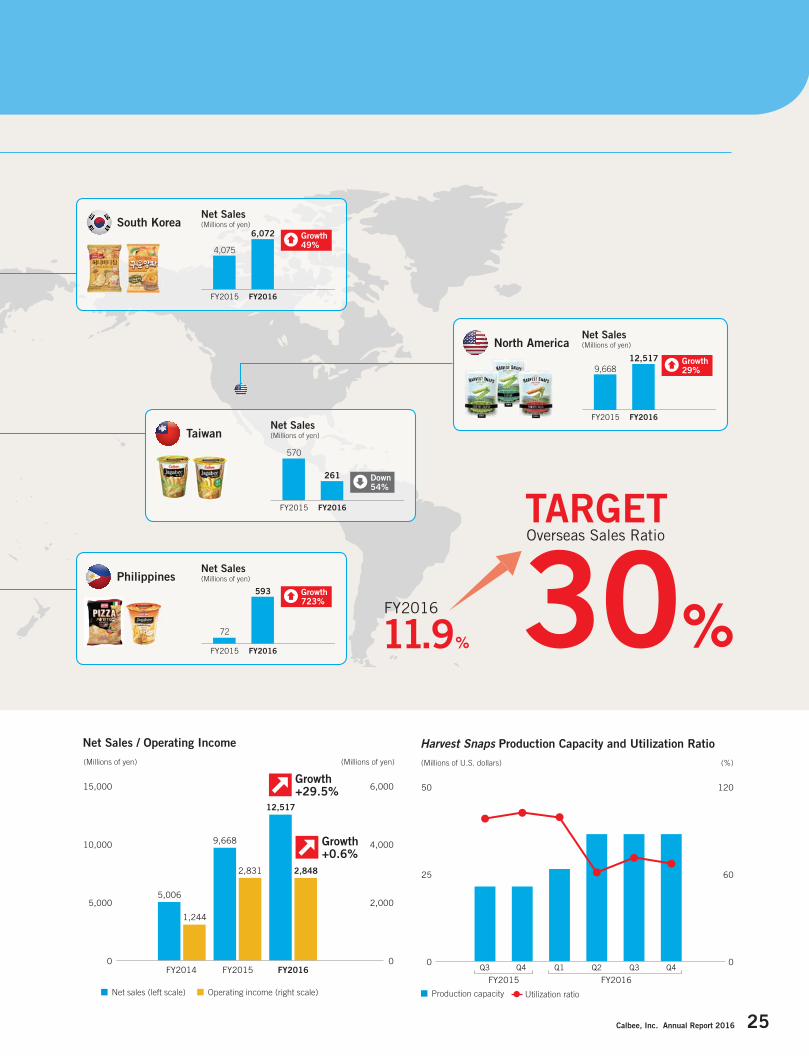
FY2016 Performance Highlights
Calbee’s overseas business encompasses
10 countries and regions. Our fi scal 2016
overseas sales ratio was 11.9%; we will
strive to raise the fi gure to 30% in the
medium and long term.
In calendar 2015, the value of the North American snack food
market, the world’s largest market, amounted to US$30 billion.
Calbee’s net sales in North America in fi scal 2016 totaled
¥12,517 million, a year-on-year increase of 29.5%. Over the
past eight years, the U.S. snack food market has seen a CAGR
of 3.3%. On the back of ongoing market growth, Harvest
Snaps, sold under the Calbee brand, are the current growth
driver for our North American business. Launched in 1999,
this long-selling product line has become especially popular
with health-conscious consumers. In June 2015, we estab-
lished a new factory in Senatobia, Mississippi, thereby boost-
ing our Harvest Snaps production capacity
1.6 times. However, our two-factory opera-
tion was not very effective, resulting in a fall
in the capacity utilization ratio that has led to
the slowdown of growth in operating income.
Efforts are steadily under way to reform the
management structure and supply chain. In
fi scal 2017, we will introduce new products
in the Harvest Snaps series while imple-
menting active promotional campaigns, thereby getting the
North American business back on the growth path.
North America
Singapore
Thailand
China
United Kingdom
Hong Kong
(Millions of yen)Net Sales
294Entry in FY2016
FY2015 FY2016
(Millions of yen)Net Sales
2,930 3,239
FY2015 FY2016
Growth11%
(Millions of yen)Net Sales
1,376
FY2015 FY2016
Entry in FY2016
(Millions of yen)Net Sales
2,896 3,055
FY2015 FY2016
Growth6%
(Millions of yen)Net Sales
2,2271,909
FY2015 FY2016
Down14%
24 Calbee, Inc. Annual Report 2016
30%11.9%
TARGETOverseas Sales Ratio
FY2016
5,006
9,668
12,517
Growth+29.5%
(Millions of yen) (Millions of yen)
Net Sales / Operating Income
FY2014 FY2015 FY2016
1,244
2,831 2,848
0
5,000
10,000
15,000
0
2,000
4,000
6,000
Growth+0.6%
Net sales (left scale) Operating income (right scale)
(Millions of U.S. dollars) (%)
Harvest Snaps Production Capacity and Utilization Ratio
Q4 Q3
FY2015 FY2016
Production capacity Utilization ratio
0
25
50
0
60
120
Q3 Q1 Q2 Q4
Philippines
Taiwan
South Korea
North America
(Millions of yen)Net Sales
4,075
6,072
FY2015 FY2016
Growth49%
(Millions of yen)Net Sales
9,66812,517
FY2015 FY2016
Growth29%
(Millions of yen)Net Sales
570
261
FY2015 FY2016
Down54%
(Millions of yen)Net Sales
72
593
FY2015 FY2016
Growth723%
Calbee, Inc. Annual Report 2016 25
Overseas Initiatives
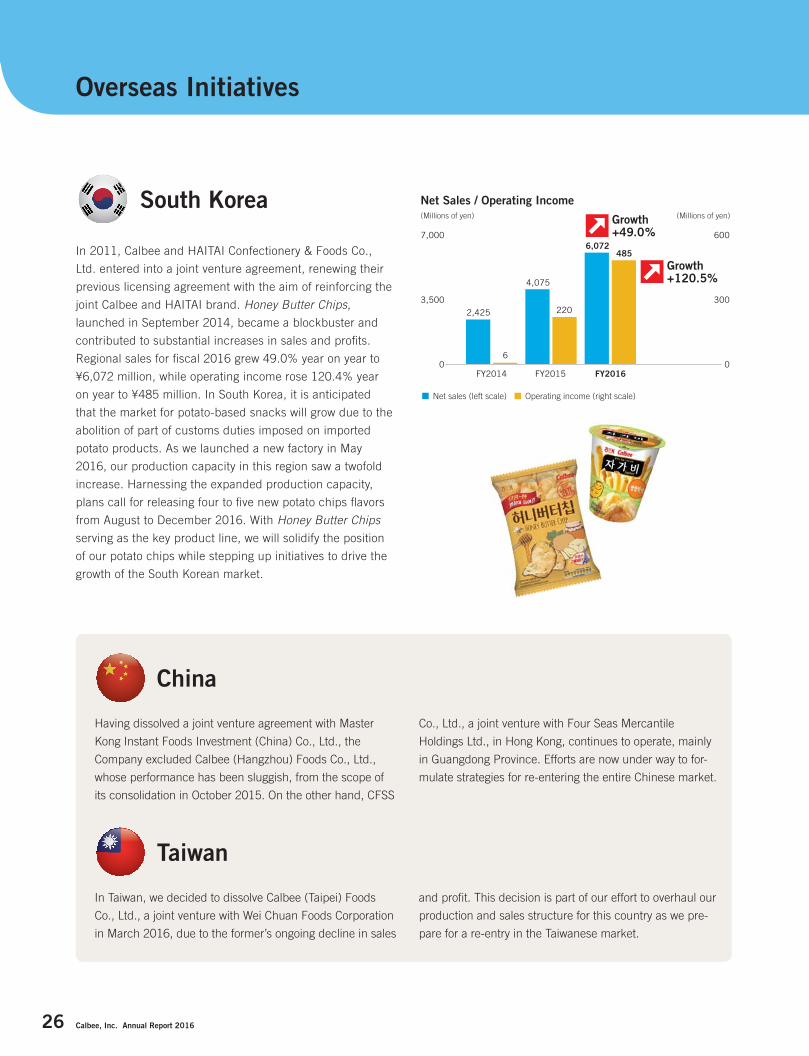
In 2011, Calbee and HAITAI Confectionery & Foods Co.,
Ltd. entered into a joint venture agreement, renewing their
previous licensing agreement with the aim of reinforcing the
joint Calbee and HAITAI brand. Honey Butter Chips,
launched in September 2014, became a blockbuster and
contributed to substantial increases in sales and profi ts.
Regional sales for fi scal 2016 grew 49.0% year on year to
¥6,072 million, while operating income rose 120.4% year
on year to ¥485 million. In South Korea, it is anticipated
that the market for potato-based snacks will grow due to the
abolition of part of customs duties imposed on imported
potato products. As we launched a new factory in May
2016, our production capacity in this region saw a twofold
increase. Harnessing the expanded production capacity,
plans call for releasing four to fi ve new potato chips fl avors
from August to December 2016. With Honey Butter Chips
serving as the key product line, we will solidify the position
of our potato chips while stepping up initiatives to drive the
growth of the South Korean market.
In Taiwan, we decided to dissolve Calbee (Taipei) Foods
Co., Ltd., a joint venture with Wei Chuan Foods Corporation
in March 2016, due to the former’s ongoing decline in sales
Taiwan
South Korea
Having dissolved a joint venture agreement with Master
Kong Instant Foods Investment (China) Co., Ltd., the
Company excluded Calbee (Hangzhou) Foods Co., Ltd.,
whose performance has been sluggish, from the scope of
its consolidation in October 2015. On the other hand, CFSS
Co., Ltd., a joint venture with Four Seas Mercantile
Holdings Ltd., in Hong Kong, continues to operate, mainly
in Guangdong Province. Efforts are now under way to for-
mulate strategies for re-entering the entire Chinese market.
China
(Millions of yen) (Millions of yen)
Net Sales / Operating Income
0
3,500
7,000
0
300
600
FY2014 FY2015 FY2016
6
2,425 220
4,075
4856,072
Growth+120.5%
Growth+49.0%
Net sales (left scale) Operating income (right scale)
and profi t. This decision is part of our effort to overhaul our
production and sales structure for this country as we pre-
pare for a re-entry in the Taiwanese market.
26 Calbee, Inc. Annual Report 2016

In June 2015, Calbee (UK) Ltd., a
wholly owned subsidiary of the
Company, initiated operations at its
factory in the United Kingdom, the
largest snack food market in
Europe. The subsidiary started out
with the marketing of YUSHOi (sold
under the name Harvest Snaps in
North America). We are striving to
secure key outlets through major retailers, with plans calling
for implementing active promotional campaigns to boost sales
in fi scal 2017 and beyond. To realize profi tability at the earliest
possible date, efforts are now under way to improve produc-
tion effi ciency while pursuing cost reductions.
PT. Calbee-Wings Food, a joint venture between Calbee,
PT. Mitrajaya Ekaprana—a subsidiary of the Wings Group
that boasts brand strength and sales capability in
Indonesia—and ITOCHU Corporation, brought its factory
online in August 2016. In Indonesia, where traditional trade
through small shops and marketplaces constitutes a key
retail outlet, this joint venture will manufacture products that
will be marketed by the Wing Group through its local sales net-
work. In fi scal 2017, this joint venture will release fi ve prod-
ucts under two brand names.
United Kingdom
Indonesia
Spain
Entries into New Markets
Following our entry into the United Kingdom, we entered into
the Spanish market, with a local subsidiary commencing its
operations in April 2016. We initiated sales of Snapea Crisps
(Harvest Snaps), a bean-based snack manufactured in the
U.K.
Calbee, Inc. Annual Report 2016 27

• Introduced the executive offi cer system• Appointed outside directors• Separated execution and supervision functions
• Highly independent outside directors comprise the majority
• Reduced in-house directors from nine to two• Increased outside directors from two to fi ve• Appointed fi rst non-Japanese director
• Established Ethics and Risk Management Advisory Board including external experts
• Established the Advisory Board for nominations and remuneration including outside directors
• The term for director appointments was changed from 2 years to 1 year
• Appointed 3 female Executive Offi cers ( As of June 2016, two female directors and six
female executive offi cers were appointed.)
• Incorporated Calbee’s corporate governance sys-tem, policy and procedures into “Calbee’s Corporate Governance Code” for disclosure
Calbee’s Changing Corporate Governance System
2001 Separation
2009 Supervision / Diversity
2011 Ethics and Risk Management
2012 Transparency
2013 Accountability / Diversity
2015 Disclosure
� Basic ApproachCalbee has a vision of itself as a corporate group that is respected,
admired and loved by its customers, suppliers and distributors, its
employees and their families, communities, and its shareholders. This
vision refl ects a belief that the interests of our shareholders are best
served by focusing on our valued customers and business partners.
� Strong Corporate DisciplineSince launching the new management framework in 2009, we have
enforced a corporate governance structure predicated on superior trans-
parency, independence and diversity. Specifi cally, this move was intend-
ed to further strengthen the functions of the Board of Directors, so that it
may more effectively promote innovation and new value creation.
We decreased the number of directors from 11 to seven while appointing
Corporate Governance System
Calbee’s Corporate Governance at a GlanceBoard of Directors
Number of directors* Up to 13
Chairman of the Board of Directors CEO
Number of directors (of which, outside directors) 7 (5)
Term of offi ce for directors* 1 year
Audit & Supervisory Board members
Number of Audit & Supervisory Board members* Up to 4
Number of Audit & Supervisory Board members(of which, outside Audit & Supervisory Board members) 3 (2)
Term of offi ce for Audit & Supervisory Board members* 4 years
Rights plan and other measures to protect against acquisition None
*Stipulated by the Articles of Incorporation
We also believe that reinforcing and enhancing corporate governance is
a key to building and maintaining favorable relationships with all stake-
holders, while increasing corporate value. In line with this vision, we have
enhanced management transparency and strengthened internal control
and compliance system.
fi ve highly independent outside directors, who thus make up the majori-
ty. Moreover, the Board members have been chosen from diverse back-
grounds and a variety of industries, including two female directors and
one non-Japanese director, attesting to our intention to ensure a solid
management structure informed by a broader range of perspectives and
independent standpoints in its decision making.
Percentage of Outside Directors on the Board
28% 26%
84%
58%61% 60%
Japan (TOPIX 100)
Japan(Nikkei 225)
UnitedStates
France UnitedKingdom
Germany
71%
Source: 2015 Japan Board Index, Spencer Stuart* Figures for countries other than Japan represent average percentages of independent outside directors.
28 Calbee, Inc. Annual Report 2016

Percentage of Outside Directors Percentage of Non-Japanese Directors
Ratio of Female Directors and Audit & Supervisory Board Members
Number of Directors
(%)(%)(%)(Number)
2008 2016 2008 2016 2008 20160
4
8
12
In-house directorsOutside directors
9
2
11
2
5
7
0
20
40
60
80
18
71
00
5
10
15 14
2008 20160
10
20
30
7
30
A Message from an Outside Director
To Further Strengthen Calbee’s Corporate GovernanceI believe that the evaluation of corporate governance must be based
on the corporation’s business results and corporate value, not the
structure of its governance system. The primary objective of corpo-
rate governance is to monitor the corporation and thereby ensure
Takashi KawamuraOutside Director
that the value created through its business activities is returned to
all stakeholders. Applying this scale of evaluation, I conclude that
because Calbee has been enjoying stable growth in its operating
results while increasing annual cash dividends, the Company’s gov-
ernance system is worthy of praise.
Looking ahead, the Company’s Board of Directors will focus on
such issues as overarching management strategies, including
those for global expansion, to secure greater corporate value. At
the same time, we will exhaustively review our succession plans,
human resource development, health management and environ-
mental management. Drawing on my experience as a corporate
manager at a global company, I will help Calbee’s management,
breaking down unnecessary internal restraints and taking a look at
things from an outside perspective. By doing so, I will facilitate
active discussion at Board of Directors meetings.
Calbee’s Corporate Governance CodeIn conjunction with the enactment of Japan’s Corporate Governance Code, which
applies to all domestic listed companies, Calbee has established its own
Corporate Governance Code to systematically lay out its concepts of corporate
governance in a governance system that best refl ects its vision The abstract
principles of Calbee’s Corporate Governance Code are shown below. For details,
please visit the following website.
https://www.calbee.com/ir/governance.php
Principle 1 Securing the Rights and Equal Treatment of Shareholders
The Company will take appropriate measures to secure shareholder rights and
equality among said shareholders, thereby building and maintaining favorable
relationships with its shareholders.
Principle 2 Appropriate Cooperation with Stakeholders Other Than
Shareholders
In line with the Calbee Group’s vision, the Company endeavors to maintain an
appropriate cooperative relationship with all stakeholders. To establish a corpo-
rate culture consistent with this vision, top management pays annual visits to
every business offi ces and engages in dialogue with employees through town hall
meetings aimed at instilling a commitment to realizing said vision.
Principle 3 Ensuring Appropriate Information Disclosure and Transparency
The Company seeks to remain a trustworthy company and to ensure that its
stakeholders are provided with straightforward, unbiased data on which to base
their understanding and evaluation of its activities and performance. Accordingly,
the Company maintains information disclosure in compliance with laws and regu-
lations as well as its IR policies. Furthermore, the Company discloses, as proac-
tively and on as continual a basis as possible, information that is not subject to
laws and regulations whenever it is deemed that said information may have a
bearing on the investment decisions of shareholders and investors.
Principle 4 Responsibilities of the Board
To fulfi ll the Company’s stewardship responsibilities and ensure its accountability
to shareholders, the Board of Directors strives to drive sustainable business
growth and seeks to enhance corporate value while maintaining a disciplined
management structure through the monitoring and supervision of directors’ busi-
ness execution. In addition to the Board of Directors, the Company has estab-
lished the Audit & Supervisory Board, every member of which is responsible for
auditing directors’ business execution. A solid and effective auditing structure is
supported by the Audit & Supervisory Board, which operates in a highly indepen-
dent manner in collaboration with the external accounting auditors.
Principle 5 Dialogue with Shareholders
The Company values maintaining dialogue with its shareholders and investors
who seek to fulfi ll their stewardship responsibilities from the medium- and long-
term perspectives. Accordingly, the Company actively engages in dialogue with
them within reasonable limits.
Calbee, Inc. Annual Report 2016 29

Appoint / Dismiss
Evaluate
ReportInternal Control Committee
Ethics andRisk Management
Committee
Ethics and Risk Management
Advisory Board(including outside
experts)
� Corporate Governance System Calbee has a corporate governance system supported by the Board of Directors,
with a membership that consists mainly of outside directors with a high degree of
independence, as well as the Audit & Supervisory Board, with a membership
that engages in the monitoring and supervision of management. Moreover, hav-
ing introduced an executive offi cer system, the Company has ensured the sepa-
ration of business execution and supervisory functions, with the aim of
enhancing management transparency, clarifying the responsibilities of manage-
ment, accelerating decision making and strengthening management oversight.
Board of DirectorsThe Board of Directors is comprised of two in-house directors and fi ve highly
independent outside directors for a total of seven directors. One of the
Company’s seven directors is non-Japanese, and two of the directors are
women, thus ensuring diversity.
As a general rule, the Board meets once every month. In addition to dis-
cussing resolutions on matters stipulated by law, the Board formulates and
makes decisions on key management policies and strategies while supervis-
ing business execution. In doing so, it leverages members’ diverse stand-
points and objective perspectives to ensure business growth and greater
corporate value over the long term. In particular, outside directors have been
chosen from a variety of fi elds, including foodstuffs, industrial manufacturing,
consumer goods, academia and journalism, in order to maintain a balanced
composition and help ensure a solid management structure.
Advisory BoardDiscussions and proposals concerning nominations and remuneration of
directors and senior executive offi cers are the responsibility of the Advisory
Board. The board, with outside directors constituting the majority of mem-
bers, meets four times a year in principle.
Executive Offi cersBusiness execution is carried out by 23 executive offi cers, who have been
given authority to manage specifi c organizations within the Group. This devolu-
tion of authority is part of efforts to create a management system that speeds
up decision-making and clarifi es business execution responsibility. Among the
executive offi cers, senior executive offi cers are entrusted with especially impor-
tant and wide-ranging duties and do not hold employee status. To promote
rapid and appropriate decision-making by the directors, important business
matters are discussed in the Management Council, with senior executive offi -
cers and presidents from key Group subsidiaries serving as council members.
Audit & Supervisory System
The Audit & Supervisory Board consists of three Audit & Supervisory Board
members, including two outside Audit & Supervisory Board members (one of
whom is a woman). Each of the Audit & Supervisory Board members brings a
high level of expertise and knowledge to their role of monitoring, auditing
and assessing the management of Calbee. Not only does the Audit &
Supervisory Board perform audits from the perspective of legal compli-
ance, it also conducts audits in terms of appropriateness of management.
As part of this auditing role, the Audit & Supervisory Board members
actively participate in meetings of the Board of Directors and other man-
agement meetings, auditing and monitoring the activities of directors
and executive offi cers to ensure no problems arise in business execu-
tion. The Audit & Supervisory Board members also conduct systematic
audits at Group companies in coordination with the Audit & Supervisory
Board members at each company and Calbee’s Internal Audit Section.
FY2016 Outside Directors’ Board of Directors Attendance RecordOutside Directors Attendance ratio
Yuzaburo Mogi 92%
Takashi Kawamura 100%
Takahisa Takahara 90%
Atsuko Fukushima 90%
Note: Ms. Anindita Mukherjee, who retired from the position of director on October 1, 2015, attended three of the four Board of Directors meetings held during her term of offi ce.
30 Calbee, Inc. Annual Report 2016

In addition, the Audit & Supervisory Board members review annual account-
ing audit plans submitted by the external accounting auditors and receive
reports on such audits from them in and are present at audits they conduct.
In these ways, the Audit & Supervisory Board members maintain close mutu-
al collaboration, engaging in periodic discussions and information exchanges
with the external accounting auditors.
For internal audits, we have an Internal Audit Section, which has a dedi-
cated staff of six and is responsible for conducting internal audits of the
whole Group in accordance with annual audit plans. The Internal Audit
Section regularly exchanges opinions with Audit & Supervisory Board mem-
bers about the results of internal audits.
� Executive RemunerationThe Company’s executive remuneration system is highly transparent and incorpo-
rates objective perspectives. Specifi cally, it is decided upon after being discussed
by the Advisory Board. Approximately half of the remuneration is accounted for
by a performance-based variable portion, which is designed to refl ect sharehold-
ers’ interest in its amount from medium- and long-term perspectives.
To enhance management transparency, the Company pays remuneration for
directors after discussion by the Advisory Board, obtaining a resolution from the
Board of Directors and the approval of the General Meeting of Shareholders. The
Company pays remuneration for senior executive offi cers after discussion by the
Advisory Board and obtaining a resolution from the Board of Directors.
Remuneration for Calbee directors and executive offi cers comprises fi xed
basic remuneration commensurate with executive duties, bonuses paid in
accordance with the Company’s business results for each fi scal year, execu-
tive retirement benefi ts linked to performance during the period of appoint-
ment and stock options and a performance-linked stock compensation plan
called the Board Incentive Plan (BIP) Trust.
In addition, outside directors and part-time Audit & Supervisory Board
members receive fi xed basic remuneration due to the importance of their
supervisory function from an independent perspective.
Appoint / Dismiss Appoint / Dismiss
Report /Cooperate
Cooperate
Report /Cooperate
Accounting audit
Audit
Report
Report
Internal audit
Outside Audit & Supervisory Board
Members
Attendance ratio
Board of Directors Audit & Supervisory Board
Tadashi Ishida 100% 100%
Tomomi Yatsu* 100% 100%
Akira Kondoh* 100% 100%
* Ms. Yatsu and Mr. Kondoh retired on June 22, 2016.
FY2016 Outside Audit & Supervisory Board Members’ Attendance Record
Remuneration System for Calbee Directors, Audit & Advisory Board Members and Other Senior Management Personnel
Fixed proportion: Approx. 50%
Basic remuneration*1 Fixed-amount cash remuneration paid for the recipient’s executive duties1
Variable portion: Approx. 50%
Bonus Cash remuneration in an amount linked to the Company’s business results during the fi scal year*2
Retirement benefi ts*2
Cash remuneration paid at the time of the recipient’s retire-ment from the position in an amount linked to the Company’s business results during the period of appointment
Stock options*3 Stock options provided in accordance with the Company’s business results*4
Performance-based stock compensation*4
Cash remuneration paid at the time of recipient’s retirement from the position in an amount determined in accordance with annual performance targets achieved during the period of appointment*3
Notes: *1. The amount of basic remuneration for directors is within total annual remuneration approved by
the General Meeting of Shareholders.*2. The upper limit for total remuneration amount is set at 1.5% of consolidated ordinary income.*3. The Company has not provided stock options since 2010.*4. During the period spanning from fi scal 2015 to 2017, the Company pays bonuses only when annu-
al performance targets for the fi scal year are met, with upper limit for total remuneration amount set at 1% of consolidated net income.
Calbee, Inc. Annual Report 2016 31

Total Remuneration by Executive Classifi cation, Type of Remuneration and Number of Eligible Recipients
Executive classifi cationTotal remuneration
(millions of yen)
Total remuneration by type (millions of yen)Number of
eligible executivesBasicremuneration
Stockoptions
BonusesPerformance-basedstock compensation
Retirementbenefi ts
Directors (excluding outside directors) 209 110 - 66 - 33 2
Audit & Supervisory Board members(excluding outside Audit & Supervisory Board members)
34 30 - - - 4 1
Outside directors and Audit & Supervisory Board members
128 123 - - - 4 12
Total Remuneration Paid to Individual Directors
NameTotal remuneration
(millions of yen)Title
Total remuneration by type (millions of yen)
Basicremuneration
Stockoptions
BonusesPerformance-basedstock compensation
Retirementbenefi ts
Akira Matsumoto 104Chairman of the Board & CEO, Representative Director
55 - 33 - 16
Shuji Ito 104 President and COO, Representative Director 55 - 33 - 16
Note: Only individuals with total remuneration exceeding ¥100 million have been shown.
Company is developing a structure capable of swiftly countering such risk whenever it materializes. Calbee also formulates plans for minimizing damage and swiftly recovering business operations in the event of crisis situations that could have a major impact on management. These include action plans to deal with misconduct, product contamination, and the event of a major earth-quake striking Tokyo.
� Initiatives for IR ActivitiesDialogues with ShareholdersCalbee values maintaining dialogues with its shareholders and investors who seek to fulfi ll their stewardship responsibilities from the medium and long-term perspectives. Accordingly, we actively engage in dialogues with them within reasonable limits. In addition, opinions and concerns voiced by shareholders and investors are periodically reported to the Board of Directors through the Investor Relations Group so that they are appropri-ately addressed.
Disclosure PolicyCalbee seeks to remain a trustworthy company and to ensure that its stakeholders, including shareholders and investors, can form a clear understanding and evaluation of the Company’s activities and perfor-mance. We therefore strive to provide continuous, fair, timely disclosure of information that has a bearing on the investment decisions of share-holders and investors. It is also our policy to disclose, as proactively and constantly as possible, information that is not subject to laws and regula-tions whenever it is deemed that said information may have a bearing on such decisions. In addition, we utilize our Investor Relations (IR) website to publicize such fi nancial information as earnings reports as well as earnings presentation materials and other IR materials.
Communication with Securities Analysts and Institutional InvestorsCalbee holds earnings presentations every quarter. At the presentations, senior management explains the Company’s future management plans and performance. In addition, we hold around 300 meetings with securi-ties analysts and institutional investors in and outside of Japan each year. Calbee is also proactive in communicating with overseas institution-al investors. In the year ended March 2016, we held meetings in Europe, North America, and Asia.
� ComplianceCalbee considers compliance with the law and with social norms to be the supporting pillar of its business activities. We formulated Groupwide rules on compliance risk management and have since then strengthened our structure to ensure strict compliance under the initiative of the Ethics and Risk Management Committee. The Ethics and Risk Management Committee, headed by the President & COO, promotes compliance and risk management activities throughout the entire Calbee Group. To complement activities conducted by this committee, Calbee has established the Ethics and Risk Management Advisory Board chaired by an outside expert and run by a total of six members, three of whom are external specialists. The board provides advice and proposals to the Ethics and Risk Management Committee from an objective standpoint.
� Risk ManagementTo address risk management, the Ethics and Risk Management Committee was set up to comprehensively and accurately identify and assess all risks that could have a major impact on the Group’s operations in order to minimize any losses. The committee analyzes risks facing the Group and examines measures to mitigate any impact, maintains rele-vant regulations, and submits proposals to the Board of Directors when necessary. In particular, risk associated with product safety and raw material procurement is addressed by implementing preventive mea-sures under the initiative of the Quality Assurance Headquarters and the
Ethics and Risk Management Advisory BoardChairperson Outside expert (lawyer)
MembersPresident & COO, General Manager of HumanResources & General Affairs Group, General Managerof Administration Division, and 3 external experts
Secretariat Ethics and Risk Management Division
Meeting frequency Once every month, in principle
Ethics and Risk Management CommitteeChairperson President & COO
MembersGeneral managers of Headquarters Divisions and Regional Business Divisions and presidents of subsidiaries
Secretariat Ethics and Risk Management Division
Meeting frequency Once every quarter, in principle
32 Calbee, Inc. Annual Report 2016

Driving Sustainable Growth through Health and Productivity Management
Ishii: In your view, what is the most important factor supporting sus-
tainable corporate growth?
Kawamura: Hitachi, Ltd., where I formerly served as chairman, has
integrated its personnel evaluation and management system on a
global basis. Domestic employees are aware that most foreign man-
agers complete their tasks by fi ve o’clock and promptly go home.
This situation is providing Japanese peers with a good insight into
working styles and is raising their awareness of the need for change,
including reduced overtime.
Sustainable corporate growth is dependent on employees who
have high awareness of productivity and can act upon that aware-
ness. Calbee has succeeded in changing its corporate culture to
raise the proportion of female managers to more than 20%. It will
have to do the same to enhance workforce productivity. To that end,
top management should communicate its vision to each employee,
gain their understanding of such vision, and encourage them to
change their approach if necessary. If top management demon-
strates its own commitment to doing so as well, employee awareness
will be signifi cantly enhanced.
Ishii: As for health management, businesses are now being called
upon to proactively take action to help employees maintain their
health.
Kawamura: First and foremost, a healthy workforce is the founda-
tion for all business operations and key to achieving corporate
growth. The company must actively offer assistance by, for example,
sponsoring health checkups that use the latest technologies and
providing detailed examination data, so that employees can act on
any symptom before it develops into something serious and thus
avoid contacting a disease. On the other hand, employees them-
selves must take responsibility for managing their lifestyles and take
steps to improve their health if necessary.
Ishii: Mental health care of employees is becoming an important
issue, too.
Kawamura: This issue is quite complicated. I think external special-
ists should be called in to address such issues, in addition to the
Company taking steps. I expect Calbee to diligently carry out preven-
tive measures to counter mental health issues.
Ishii: Mr. Kawamura, you’ve taken on a number of grave responsibil-
ities to lead businesses. Do you have any personal tips on managing
stress?
Kawamura: I often plan my vacations well in advance. This helps me
to concentrate on the business at hand. Moreover, since I’ve become
a corporate manager, I’ve been wearing a pedometer and walking a
lot, and set a goal of 50 thousand steps a week. Physical exercise is
very important in that enables me to sleep well. As a manager, I’ve
set detailed KPI in phased manner to allow my staff to feel a sense of
achievement when meeting each Key Performance Indicator (KPI).
Ishii: Calbee has a corporate philosophy of contributing to healthy
lifestyles. A healthy workforce leads to growth in corporate value.
With this in mind, we will support and encourage employees to pur-
sue healthier, more affl uent and fulfi lling lives to ensure a construc-
tive and vibrant working environment. Mr. Kawamura, thank you for
sharing your views.
To secure sustainable corporate growth, health and productivity
management is as essential as diversity promotion. In fact, a
mentally and physically sound workforce is key to forming a
vibrant business organization that is conducive to innovation and
capable of boosting corporate productivity and profi tability.
Calbee established the Healthcare Committee in April 2016
and is poised to implement full-scale health and productivity
management initiatives.
In this section, we hear from Mr. Takashi Kawamura, an out-
side director of Calbee, Inc., about the relationship between
health management of our employees and sustainable corporate
growth as well as related challenges Calbee is now tackling.Nobue IshiiChief Healthcare Offi cer (CHO),Chairperson, Healthcare Committee
Takashi KawamuraOutside Director
Calbee, Inc. Annual Report 2016 33
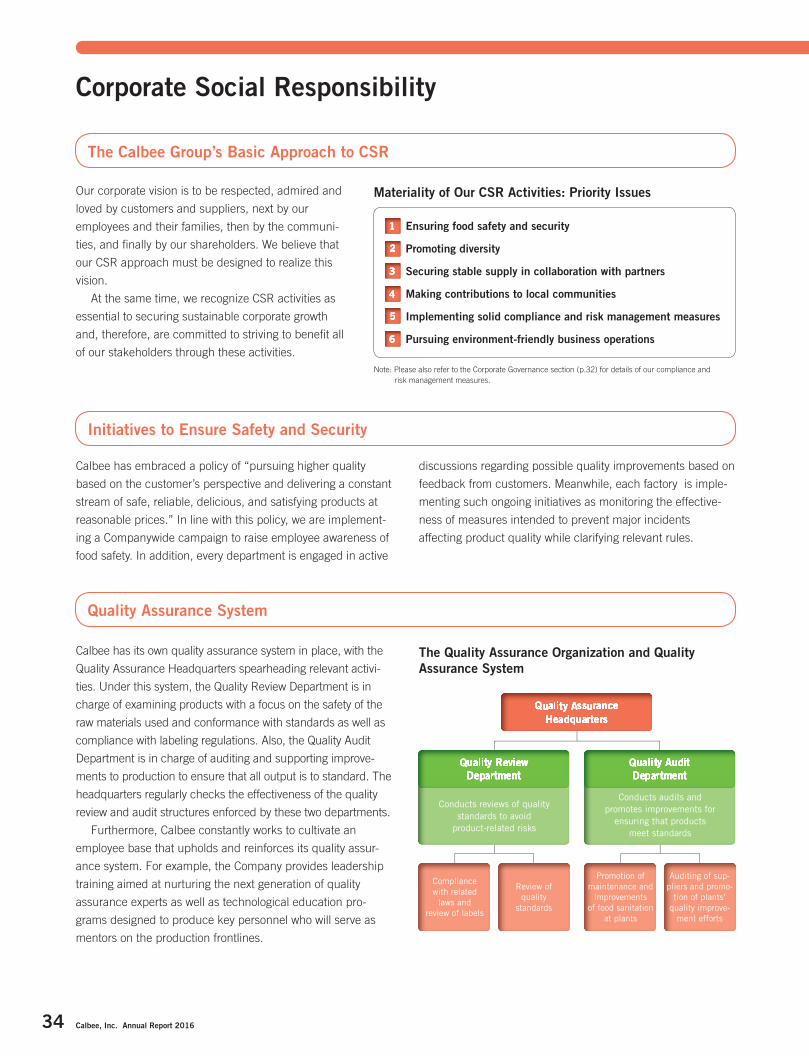
Corporate Social Responsibility
Our corporate vision is to be respected, admired and
loved by customers and suppliers, next by our
employees and their families, then by the communi-
ties, and fi nally by our shareholders. We believe that
our CSR approach must be designed to realize this
vision.
At the same time, we recognize CSR activities as
essential to securing sustainable corporate growth
and, therefore, are committed to striving to benefi t all
of our stakeholders through these activities.
Calbee has embraced a policy of “pursuing higher quality
based on the customer’s perspective and delivering a constant
stream of safe, reliable, delicious, and satisfying products at
reasonable prices.” In line with this policy, we are implement-
ing a Companywide campaign to raise employee awareness of
food safety. In addition, every department is engaged in active
Calbee has its own quality assurance system in place, with the
Quality Assurance Headquarters spearheading relevant activi-
ties. Under this system, the Quality Review Department is in
charge of examining products with a focus on the safety of the
raw materials used and conformance with standards as well as
compliance with labeling regulations. Also, the Quality Audit
Department is in charge of auditing and supporting improve-
ments to production to ensure that all output is to standard. The
headquarters regularly checks the effectiveness of the quality
review and audit structures enforced by these two departments.
Furthermore, Calbee constantly works to cultivate an
employee base that upholds and reinforces its quality assur-
ance system. For example, the Company provides leadership
training aimed at nurturing the next generation of quality
assurance experts as well as technological education pro-
grams designed to produce key personnel who will serve as
mentors on the production frontlines.
The Calbee Group’s Basic Approach to CSR
Initiatives to Ensure Safety and Security
Quality Assurance System
discussions regarding possible quality improvements based on
feedback from customers. Meanwhile, each factory is imple-
menting such ongoing initiatives as monitoring the effective-
ness of measures intended to prevent major incidents
affecting product quality while clarifying relevant rules.
Materiality of Our CSR Activities: Priority Issues
The Quality Assurance Organization and Quality Assurance System
Ensuring food safety and security
Promoting diversity
Securing stable supply in collaboration with partners
Making contributions to local communities
Implementing solid compliance and risk management measures
Pursuing environment-friendly business operations
Note: Please also refer to the Corporate Governance section (p.32) for details of our compliance and risk management measures.
Conducts reviews of quality standards to avoid
product-related risks
Compliance with related
laws and review of labels
Promotion of maintenance and
improvements of food sanitation
at plants
Review of quality
standards
Auditing of sup-pliers and promo-
tion of plants’ quality improve-
ment efforts
Conducts audits and promotes improvements for
ensuring that products meet standards
34 Calbee, Inc. Annual Report 2016

Calbee has identifi ed “Support for parenting,” “Support for
local communities” and “Protecting the environment” as its
key themes for community contribution. Putting these themes
into practice, all employees are encouraged to proactively
think about local contribution and take action under the initia-
tive of the Social Contribution Committees in each business
division.
Support for Areas Affected by the Great East Japan EarthquakeCalbee continues to support communities and people who
were affected by the Great East Japan Earthquake in March
2011.
The MICHINOKU Future Fund, set up to support earth-
quake orphans, was jointly established by Calbee, KAGOME
CO., LTD. and ROHTO Pharmaceutical Co., Ltd. in 2011. In
2013, Ebara Foods Industry, Inc. was also welcomed into the
fold as a co-sponsor. The fund provides scholarships, solicits
donations and engages in other support activities, with the
goal of continuously aiding earthquake orphans over a 25-year
Contribution to Local Communities
period following the disaster. As of March 2016, the number of
scholarship recipients totaled 527.
Food CommunicationWith the aim of promoting healthier
living, Calbee engages in “food com-
munication” activities that include
offering educational programs
designed to impart useful information
on enjoyable eating, using familiar
snacks as examples.
Specifi cally, since 2003 Calbee has been providing “Calbee
Snack School” lessons throughout Japan. The lessons are
designed to help children—society’s future leaders—under-
stand what makes a good diet to empower them to enjoy
healthier and more active lives. In these lessons, we are also
encouraging them to develop the habits of self control. In fi s-
cal 2016, the program visited around 800 schools and met
with more than 62,000 children and their parents.
Procurement Policy
We will make day-to-day procurement decisions and select new suppliers in accordance with reasonable standards regarding quality, cost, stability of supply and environmental impact.
We will abstain from becoming overly dependent on specifi c suppliers while ensuring that no supplier becomes overly dependent on us. To that end, we will strive to maintain an appropriate procurement volume per supplier while securing multiple sources of supply.
We will adhere to reasonable standards regarding the selection of suppliers based as specifi ed in our supplier guidelines. To maintain fairness, our pro-curement function operates independently from other business functions to ensure the objectivity of the selection and evaluation process.
We will, in principle, obtain estimates from multiple suppliers and thereby ensure a competitive and fair selection process.
We will, upon request, provide suppliers whose proposals are rejected through the selection process following the submission of bids or competitive quotes with the reasons for such rejection in as much detail as possible.
We will engage in continued transactions only after we have signed a basic transaction agreement with a supplier and will observe terms and conditions stipulated by said agreement. Moreover we will, in principle, conclude and observe a written agreement even when we engage in a one-off deal.
We will never engage in business transactions aimed at directly marketing our products to suppliers.
We will be international in our recruitment of potential suppliers, maintaining an open and proactive attitude when offering them opportunities to enter our supply chain.
Basic Policy on Product Recall
Customer FirstEnsure that not even one customer is exposed to a defective product
Information DisclosureDisclose information at hand with no exception
Leadership of Top ManagementTackle all problems head-on and take the initiative
Swift RecallFirst and foremost, quickly execute the recall of any defective product
Recurrence PreventionPrevent the recurrence of any similar problem
A Calbee Snack School
Calbee, Inc. Annual Report 2016 35
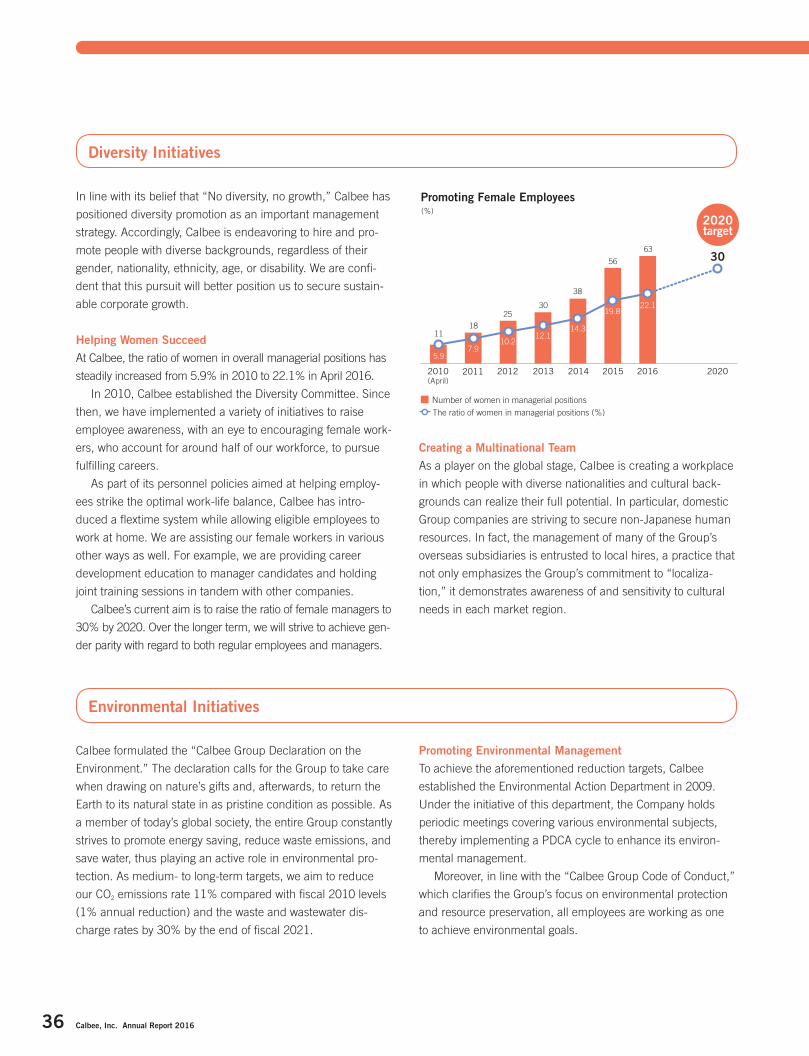
Environmental Initiatives
Calbee formulated the “Calbee Group Declaration on the
Environment.” The declaration calls for the Group to take care
when drawing on nature’s gifts and, afterwards, to return the
Earth to its natural state in as pristine condition as possible. As
a member of today’s global society, the entire Group constantly
strives to promote energy saving, reduce waste emissions, and
save water, thus playing an active role in environmental pro-
tection. As medium- to long-term targets, we aim to reduce
our CO2 emissions rate 11% compared with fi scal 2010 levels
(1% annual reduction) and the waste and wastewater dis-
charge rates by 30% by the end of fi scal 2021.
In line with its belief that “No diversity, no growth,” Calbee has
positioned diversity promotion as an important management
strategy. Accordingly, Calbee is endeavoring to hire and pro-
mote people with diverse backgrounds, regardless of their
gender, nationality, ethnicity, age, or disability. We are confi -
dent that this pursuit will better position us to secure sustain-
able corporate growth.
Helping Women SucceedAt Calbee, the ratio of women in overall managerial positions has
steadily increased from 5.9% in 2010 to 22.1% in April 2016.
In 2010, Calbee established the Diversity Committee. Since
then, we have implemented a variety of initiatives to raise
employee awareness, with an eye to encouraging female work-
ers, who account for around half of our workforce, to pursue
fulfi lling careers.
As part of its personnel policies aimed at helping employ-
ees strike the optimal work-life balance, Calbee has intro-
duced a fl extime system while allowing eligible employees to
work at home. We are assisting our female workers in various
other ways as well. For example, we are providing career
development education to manager candidates and holding
joint training sessions in tandem with other companies.
Calbee’s current aim is to raise the ratio of female managers to
30% by 2020. Over the longer term, we will strive to achieve gen-
der parity with regard to both regular employees and managers.
Diversity Initiatives
Creating a Multinational TeamAs a player on the global stage, Calbee is creating a workplace
in which people with diverse nationalities and cultural back-
grounds can realize their full potential. In particular, domestic
Group companies are striving to secure non-Japanese human
resources. In fact, the management of many of the Group’s
overseas subsidiaries is entrusted to local hires, a practice that
not only emphasizes the Group’s commitment to “localiza-
tion,” it demonstrates awareness of and sensitivity to cultural
needs in each market region.
Promoting Environmental ManagementTo achieve the aforementioned reduction targets, Calbee
established the Environmental Action Department in 2009.
Under the initiative of this department, the Company holds
periodic meetings covering various environmental subjects,
thereby implementing a PDCA cycle to enhance its environ-
mental management.
Moreover, in line with the “Calbee Group Code of Conduct,”
which clarifi es the Group’s focus on environmental protection
and resource preservation, all employees are working as one
to achieve environmental goals.
Promoting Female Employees
2010 2011 2012 2013 2014 2015 2016 2020
Number of women in managerial positionsThe ratio of women in managerial positions (%)
1118
2530
38
56
63
5.97.9
10.212.1
14.3
19.822.1
(%)
(April)
30
2020 target
36 Calbee, Inc. Annual Report 2016

Calbee Group Declaration on the Environment
Our Basic Views on Environmental Protection“Harvest the Power of Nature.”Under this corporate message, the Calbee Group has been delivering the blessings of nature to customers via its food products. Because we harvest vital natural resources, we are committed to preserving the wonderful blessings of nature and returning the earth back to as near to its natural state as possible. We aspire to harmoni-ously coexist with all the world’s fl ora and fauna and thus pass this legacy on to future generations. In this way we are working toward the realization of our common vision of being a corporate group that is respected, admired, and loved by all stakeholders.
Declaration of Environmental Management1. We will observe environment-related laws and ordinances.
2. We will strive to offer safe products that give consideration to peo-ple’s health and the global environment.
3. We will strive to reduce CO2 emissions that contribute to global warming.
4. We will strive to minimize waste in the use of raw materials, which are nature’s gift to us, and reduce waste and the amount of water used.
5. All of our employees will engage in environmental conservation efforts.
Waste Discharge Rate and Recycling Rate
FY2012 FY2013 FY2014 FY2015 FY2016
Waste discharge rate per ¥100 million of net sales (tons of waste / ¥100 million of net sales)
Recycling rate (%)
95.0 95.0 97.7 99.6
15.9 15.7 14.2 13.7
99.9
13.8
Source: Calbee Group companies in Japan
Wastewater Discharge Rate and COD(Chemical Oxygen Demand)
FY2012 FY2013 FY2014 FY2015 FY2016
COD (tons)Wastewater discharge rate (m3 / ¥100 million of net sales)
74.2
86.6
54.6
67.968.5
1.33 1.22 1.22 1.16 1.09
Source: Calbee Group companies in JapanNote: Figures for FY2013-FY2015 were retroactively changed due to some factories’ data modification.
CO2 Emissions per Sales Unit and CO2 Emissions
FY2012 FY2013 FY2014 FY2015 FY2016
CO2 emissions (thousands of tons)CO2 emissions per sales unit (tons of CO2 / ¥100 million of net sales)
100.1 102.0 102.5 97.8 94.4
217.3232.3
205.0183.2
163.4
Source: Calbee Group companies in Japan
Environmental Initiative Results CO2 ReductionWith the aim of reducing CO2 emissions, Calbee assesses
emissions from its entire value chain, from raw material pro-
curement through production, distribution, sales, and facility
utilization and maintenance to disposal and recycling. In fi scal
2016, overall CO2 emissions increased year on year, refl ecting
an increase in production volume. On the other hand, the CO2
emissions per sales unit decreased.
Effective Utilization of Resources and WaterTo help create a recycling-oriented society, Calbee is striving to
reduce waste emissions while promoting recycling. At every
stage of the production processes, we are stepping up efforts
to separate waste for recycling and reduce the volume of
waste generated while looking to effectively utilize potato skin
and other waste products, including plant residue. In these
ways, we are working to achieve “zero-emission” status and
realize a more recycle-oriented production structure, with the
recycling rate being 99.9% in fi scal 2016.
In addition, we are engaged in exhaustive effl uent manage-
ment, with an eye to utilizing recycled wastewater. Calbee will
also endeavor to minimize water consumption and promote
the effective utilization of water resources.
Calbee, Inc. Annual Report 2016 37

Contents39 CFO Message
40 Six-Year Summary
41 Management’s Discussion and Analysis
44 Business Risks
46 Consolidated Balance Sheets
48 Consolidated Statements of Income
48 Consolidated Statements of Comprehensive Income
49 Consolidated Statements of Changes in Net Assets
51 Consolidated Statements of Cash Flows
52 Notes to Consolidated Financial Statements
84 Independent Auditor’s Report
Financial Section
38 Calbee, Inc. Annual Report 2016

Calbee’s Profi t Structure Enters a New Growth StageSince the shift to a new management framework in 2009,
Calbee has achieved steady expansion in sales and profi ts
along with constant improvement in profi tability toward the tar-
geted operating margin of 15%. However, we are now seeing
profi t growth slow down slightly. In fi scal 2016, overseas prof-
its were held down by start-up costs in new markets. Our
North American business, which funded our overseas expan-
sion into other regions, was sluggish, affecting the overall per-
formance of our overseas business.
In Japan, we achieved steady profi t growth with strong
domestic sales despite higher raw material prices due to the
weaker yen. We faced some challenges in the supply-demand
balance as we almost reached the maximum level of capacity
utilization. Accordingly, we decided to increase production
capacity for potato-based snacks and cereals. As for selling,
general and administrative (SG&A) expenses, we will continue
focusing on streamlining spending to gain greater control of
our operations.
The Source of Future Growth: Overseas Business’ Profi t ModelWe will execute reforms in our North American business,
establish a strategy for re-entrance into the Chinese market,
and get our newly launched U.K. and Spanish business up to
speed. In 2016, we started operations in Indonesia and will
remain open to seek out new growth opportunities overseas.
CFO Message
Koichi Kikuchi
Challenges We Are Confronting As We Enter a New Growth Stage
Executive Managing Offi cer Chief Financial Offi cer
Striking a Balance between Growth Investment and Shareholder ReturnsTaking a look at our cash fl ow distribution policy, we would
maintain the current level of investment for growth opportuni-
ties, including overseas. As for shareholder returns, we have
steadily increased cash dividends by improving operational
profi tability and the consolidated payout ratio. We expect that
our targeted payout ratio of 30% will be realized by the end of
fi scal 2017.
In fi scal 2016, Calbee achieved an operating margin of
11.4% while boasting ROE of 14.6%. These indicators attest
to the probability of Calbee becoming one of the industry’s
leading global players. As a CFO, I am committed to showcas-
ing Calbee’s constant corporate growth by communicating its
annual performance to shareholders. I sincerely ask for your
continued support of our operations.
Prior to ascending to his present position, held since April 2016, Mr. Kikuchi served as Executive Offi cer and CFO from February 2012; having previously served at Mitsui Trust Bank, Limited, PricewaterhouseCoopers Co., Ltd. and IBM Japan, Ltd.
• Expand production capacity through capital expenditure as we have almost reached the upper limit of domestic facto-ry utilization
• Streamlining SG&A expenses, especially selling expenses
• Restructuring the North American business, formulat-ing strategies for re-entering China and stabilizing opera-tions in countries we have recently entered
• Establishing a highly profi t-able business model in over-seas markets
Calbee, Inc. Annual Report 2016 39

40 Calbee, Inc. Annual Report 2016
Six-Year SummaryYears ended March 31, 2016, 2015, 2014, 2013, 2012 and 2011
Millions of yen
Thousands of U.S. dollars
(Note 1)
2016 2015 2014 2013 2012 2011 2016
For the Year:
Net sales ¥246,129 ¥222,150 ¥199,941 ¥179,411 ¥163,268 ¥155,529 $2,184,319
Operating income 28,125 24,183 19,717 15,790 12,247 10,717 249,605
Operating margin (%) 11.4 10.9 9.9 8.8 7.5 6.9 —
Net income attributable to owners of parent 16,799 14,114 12,086 9,440 7,096 4,253 149,086
Net income margin (%) 6.8 6.4 6.0 5.3 4.3 2.7 —
Return on equity (%) 14.6 13.7 13.1 11.4 9.6 6.5 —
Research and development costs 2,195 2,052 2,161 2,288 1,811 2,213 19,482
Capital expenditures 21,229 15,290 6,392 7,298 5,422 4,049 188,405
Depreciation and amortization 7,570 6,232 5,960 6,318 6,676 7,243 67,183
Per Share (¥/$) (Note 2):
Net income attributable to owners of parent 125.88 105.82 91.46 72.18 55.07 36.62 1.11
Net assets 905.20 821.97 729.93 664.55 596.66 550.14 8.03
Cash dividends 35.00 28.00 22.00 15.50 10.50 7.00 0.31
Dividend payout ratio (%) 27.8 26.5 24.1 21.5 19.1 19.1 —
At Year-End:
Total assets 174,878 161,968 140,966 124,793 108,474 99,393 1,551,992
Net assets 131,469 118,800 104,466 92,685 80,417 72,924 1,166,752
Working capital (Note 3) 57,456 55,313 50,160 36,302 25,210 16,131 509,905
Interest-bearing debt 366 402 — 7 6 299 3,250
Equity ratio (%) (Note 4) 69.1 67.7 69.1 70.2 71.6 70.7 —
Debt to equity ratio (times) (Note 4) 0.0 0.0 0.0 0.0 0.0 0.0 —
Number of consolidated subsidiaries 24 22 22 21 18 18 —
Number of employees (consolidated) 3,728 3,477 3,341 3,352 3,053 2,911 —
Cash Flows:
Net cash provided by operating activities 22,541 22,266 23,478 17,328 7,049 16,664 200,050
Net cash used in investing activities (14,270) (9,422) (17,041) (12,999) (5,347) (620) (126,644)
Net cash providing by (used in) fi nancing activities (2,859) (2,878) (383) 607 (411) (2,124) (25,376)
Cash and cash equivalents at end of year 47,323 42,572 31,592 25,331 19,448 18,238 419,982
Notes: 1. U.S. dollar amounts are presented, for convenience only, at a conversion rate of ¥112.68 = US$1, the approximate Tokyo foreign exchange market rate as of March 31, 2016. 2. A 50-for-1 share split was conducted on January 14, 2011, and a 4-for-1 share split was implemented on October 1, 2013. Per share fi gures were retroactively adjusted to refl ect these
stock splits. 3. Working capital comprises current assets less current liabilities. 4. Shareholder’s equity as presented above consists of total net assets exclusive of subscription rights and non-controlling interests.

Calbee, Inc. Annual Report 2016 41
Management’s Discussion and Analysis
Net Sales(Millions of yen)
Snack Foods Other Food ProductsOther Businesses
2011 2012 2013 2014 2015 2016
135,157
18,349
141,248
19,523
155,659
21,334
173,145
23,773
190,069
28,830
2,0222,495
2,417
3,021
3,250
155,529163,268
179,411
199,941
222,150
204,842
38,036
3,249246,129
Gross Profit / Gross Margin(Millions of yen / %)
Gross Profit Gross Margin
2011 2012 2013 2014 2015 2016
41.8
42.3
43.8 43.6 43.965,04769,081
78,522
87,209
97,561
43.5
107,033
SG&A Expenses /SG&A Expenses to Net Sales(Millions of yen / %)
SG&A Expenses SG&A Expenses to Net Sales
2011 2012 2013 2014 2015 2016
34.9
34.8 35.0 33.8 33.0
54,32956,833
62,73167,492
73,378
32.1
78,908
Operating Results
Net SalesIn the fi scal year ended March 31, 2016 (fi scal 2016), consol-
idated net sales increased ¥23,978 million, up 10.8% year on
year to ¥246,129 million due to strong performance in the
production and sale of snacks and other foods, the Company’s
only reporting segment.
Production and Sale of Snacks and Other Foods
Sales in the production and sale of snacks and other foods
segment increased 11.0 % to ¥242,879 million, driven by
potato-based snack foods and cereals, as well as overseas
business.
Snack Foods
Snack food sales grew 7.8% to ¥204,842 million due to
growth in sales of potato-based snacks and overseas business.
1. Potato-Based Snacks
Sales of potato-based snacks increased 6.4% to ¥127,147 million.
Potato Chips showed strong sales of regular items (Usushio,
Consome Punch, and Norishio), Shiawase Butter, and others.
Kata-Age Potato also saw a signifi cant year-on-year increase in
sales, and the expansion of contract production of private
brands for client fi rms also contributed to performance.
Jagarico sales rose due to increased sales of Tarako Butter
fl avor and the launch of 20-year anniversary campaign
products.
Jagabee also recorded a sales increase thanks to a strength-
ened lineup of time-limited and region-limited products.
2. Flour-Based Snacks
Sales of fl our-based snacks increased 0.2% to ¥22,007
million. Sales of regular items Sapporo Potato Tsubutsubu
Vegetable declined year on year, but there were strong sales of
the sweet potato snack Osatsu Snack and of Cheese Bit.
3. Corn-Based Snacks
Sales of corn-based snacks increased 4.2% to ¥18,550
million backed by a new store opening of Garett Popcorn
Shops, and other factors.
4. Domestic Other Snacks
Sales of domestic other snacks decreased 7.0% to ¥7,815
million due to decreased sales of Vegips and other factors.
5. Overseas Business
Sales of overseas business increased 30.7% to ¥29,321
million on strong sales of Harvest Snaps in North America and
Honey Butter Chips in South Korea, as well as sales boost
from entry into new markets.
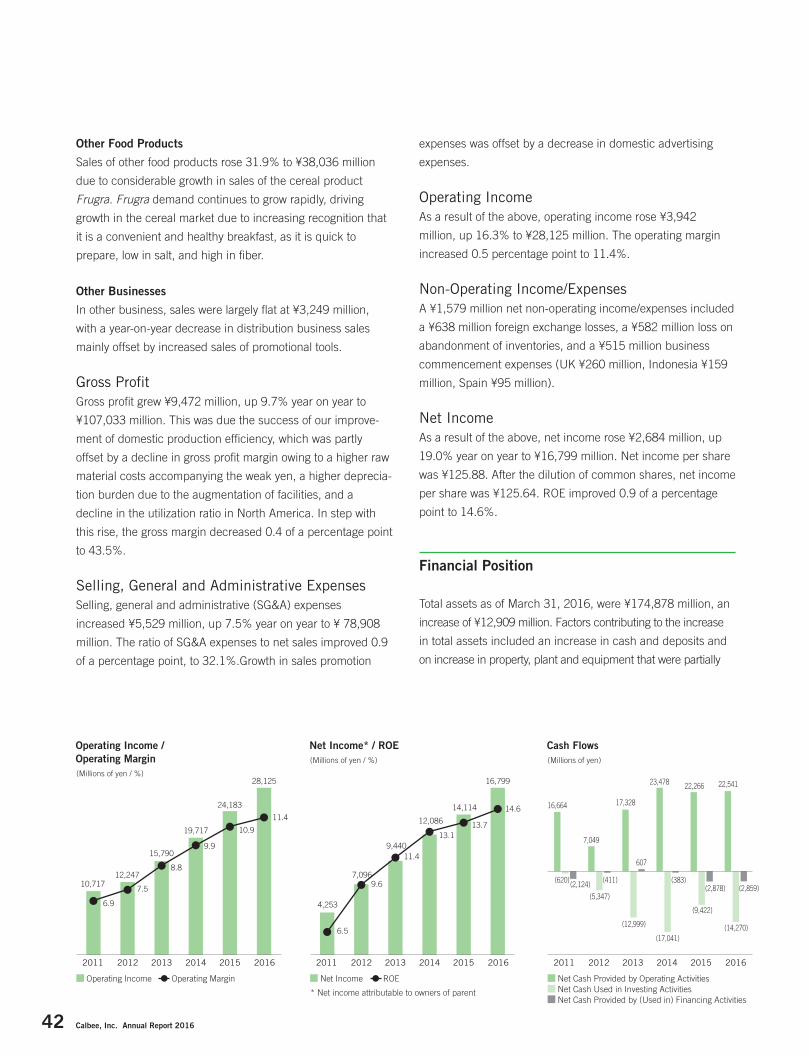
42 Calbee, Inc. Annual Report 2016
Other Food Products
Sales of other food products rose 31.9% to ¥38,036 million
due to considerable growth in sales of the cereal product
Frugra. Frugra demand continues to grow rapidly, driving
growth in the cereal market due to increasing recognition that
it is a convenient and healthy breakfast, as it is quick to
prepare, low in salt, and high in fi ber.
Other Businesses
In other business, sales were largely fl at at ¥3,249 million,
with a year-on-year decrease in distribution business sales
mainly offset by increased sales of promotional tools.
Gross Profi tGross profi t grew ¥9,472 million, up 9.7% year on year to
¥107,033 million. This was due the success of our improve-
ment of domestic production effi ciency, which was partly
offset by a decline in gross profi t margin owing to a higher raw
material costs accompanying the weak yen, a higher deprecia-
tion burden due to the augmentation of facilities, and a
decline in the utilization ratio in North America. In step with
this rise, the gross margin decreased 0.4 of a percentage point
to 43.5%.
Selling, General and Administrative ExpensesSelling, general and administrative (SG&A) expenses
increased ¥5,529 million, up 7.5% year on year to ¥ 78,908
million. The ratio of SG&A expenses to net sales improved 0.9
of a percentage point, to 32.1%.Growth in sales promotion
expenses was offset by a decrease in domestic advertising
expenses.
Operating IncomeAs a result of the above, operating income rose ¥3,942
million, up 16.3% to ¥28,125 million. The operating margin
increased 0.5 percentage point to 11.4%.
Non-Operating Income/ExpensesA ¥1,579 million net non-operating income/expenses included
a ¥638 million foreign exchange losses, a ¥582 million loss on
abandonment of inventories, and a ¥515 million business
commencement expenses (UK ¥260 million, Indonesia ¥159
million, Spain ¥95 million).
Net IncomeAs a result of the above, net income rose ¥2,684 million, up
19.0% year on year to ¥16,799 million. Net income per share
was ¥125.88. After the dilution of common shares, net income
per share was ¥125.64. ROE improved 0.9 of a percentage
point to 14.6%.
Financial Position
Total assets as of March 31, 2016, were ¥174,878 million, an
increase of ¥12,909 million. Factors contributing to the increase
in total assets included an increase in cash and deposits and
on increase in property, plant and equipment that were partially
Operating Income /Operating Margin(Millions of yen / %)
Operating Income Operating Margin
2011 2012 2013 2014 2015 2016
6.9
7.5
8.8
9.9
10.9
10,71712,247
15,790
19,717
24,183
11.4
28,125
Net Income* / ROE
Net Income
* Net income attributable to owners of parent
ROE
2011 2012 2013 2014 2015 2016
6.5
9.6
11.4
13.113.7
4,253
7,096
9,440
12,086
14,114 14.6
16,799
(Millions of yen / %)
Cash Flows
Net Cash Provided by Operating ActivitiesNet Cash Used in Investing ActivitiesNet Cash Provided by (Used in) Financing Activities
2011 2012 2013 2014 2015 2016
16,664
(620)(2,124)
7,049
(5,347)
(411)
17,328
(12,999)
607
23,478
(17,041)
(383)
22,266
(Millions of yen)
(9,422)
(2,878)
22,541
(14,270)
(2,859)

Calbee, Inc. Annual Report 2016 43
offset by a decrease in securities resulting from the redemp-
tion of commercial paper. The increase in property, plant and
equipment was driven by the expansion of production lines for
strong-selling Frugra and the acquisition of production facili-
ties overseas, including factories in North America.
Total current liabilities decreased ¥758 million to ¥33,469
million refl ecting decreases in other current liabilities.
Total non-current liabilities increased ¥999 million to ¥9,939
million due to a rise in net defi ned benefi t liabilities.
Net assets increased ¥12,669 million to ¥131,469 million.
Factors contributing to this outcome included rises in retained
earnings.
The equity ratio increased 1.4 percentage points from the end
of the previous fi scal year to 69.1%, and net assets per share
was ¥905.20.
Cash FlowCash and cash equivalents as of March 31, 2016 were ¥47,323
million, ¥4,751 million higher than at the end of the previous
fi scal year. The main contributing factors are detailed below.
Cash fl ows from operating activities
Operating activities during the period under review resulted in
a net cash infl ow of ¥22,541 million, compared to an infl ow of
¥22,266 million for the previous fi scal year. Factors contributing to
this outcome included infl ows of income before income taxes and
depreciation, partially offset by an increase in notes and accounts
receivable—trade and outfl ows of income tax payments.
Cash fl ows from investing activities
Investing activities during the period under review resulted in
a net cash outfl ow of ¥14,270 million, due to outfl ows for the
acquisition of production facilities for Frugra and in North
America, compared to an outfl ow of ¥9,422 million for the
previous fi scal year.
Cash fl ows from fi nancing activities
Financing activities during the period under review resulted in
a net cash outfl ow of ¥2,859 million, due to outfl ows for cash
dividends paid, compared to an outfl ow of ¥2,878 million for
the previous fi scal year.
Capital ExpendituresIn fi scal 2016, capital expenditures totaled ¥21,229 million,
up ¥5,938 million, compared with the previous fi scal year. Of
this total, ¥14,070 million went to domestic operations and
¥7,158 million went to overseas operations. The main compo-
nents of domestic capital expenditure were ¥3,918 million
used to expand Frugra production facilities and ¥1,786 million
used to acquire production facilities for fabricated potato
chips. Meanwhile, overseas capital expenditures included
¥3,601 million used to establish a North American factory and
acquire other production facilities. For fi scal 2017, ending
March 31, 2017, the Group plans capital expenditures totaling
¥12,600 million.
Total Assets / Net Assets /Equity Ratio(Millions of yen / %)
Total Assets Net Assets Equity Ratio
2011 2012 2013 2014 2015 2016
99,39372,924
108,474
80,417
124,793
92,685
140,966
104,466
70.771.6
70.2 69.1
67.7
161,968
118,800
69.1
174,878
131,469
Debt to Equity Ratio
2011 2012 2013 2014 2015 2016
0.0 0.0 0.0 0.0 0.0 0.0
(Times)
Capital Expenditures /Depreciation and Amortization(Millions of yen)
Capital ExpendituresDepreciation and Amortization
2011 2012 2013 2014 2015 2016
7,243
4,0495,422
6,676 7,2986,318
6,3925,960
15,290
6,232
21,229
7,570

44 Calbee, Inc. Annual Report 2016
Business Risks
The major risks to which Calbee is exposed in its operations are described below. In the interests of full disclosure, infor-mation has also been provided on risks that are not antici-pated to necessarily have a major impact on the business but have been deemed important to facilitate a better understand-ing of Calbee’s business activities. Recognizing the possibility that such risks may materialize, Calbee’s policy is to avoid these risks where possible and to mitigate any impact in the event that they materialize. The risks and forward-looking statements described below are based on judgments made by Calbee as of the date of publi-cation of this report.
1. Product Development
Calbee conducts research and development activities to provide customers with unique, value-added products that maximize the nutritional content and fl avor of natural ingredi-ents. Meanwhile, there is considerable change underway in Calbee’s operating environment owing to diversifying customer tastes, growing health awareness, and Japan’s low birthrate and ageing society. The ability to rapidly respond to these changes and develop high value-added products is becoming an increasingly important factor in Calbee’s business expan-sion. As such, Calbee conducts research and development activities in accordance with annual plans in the areas of new product development, existing product improvement, cost reduction, and analysis of ingredients and nutrients. However, there is no guarantee that investment in these development activities will result in the successful launch of new products, and any divergence between research and development themes and market needs could have an impact on Calbee’s operating results and fi nancial position.
2. Ingredient Procurement
In principle, imports of raw potatoes, the main ingredient of potato snacks such as Potato Chips, Jagarico and Jagabee, are not permitted into Japan under the Plant Protection Act. In order to secure suffi cient supplies of domestically produced high-quality potatoes at a stable price, Calbee has sought to build a procurement system based on ongoing grower con-tracts concluded since launching its fi rst potato snacks. Although these grower contracts enable stable supplies, harvest conditions could prevent Calbee from securing suffi -cient supplies of raw potatoes, resulting in sales opportunity losses and increased costs due to emergency procurement that could have an impact on Calbee’s operating results and fi nancial position.
Moreover, changes in demand trends and fl uctuations in the price of crude oil and in foreign exchange markets could affect procurement costs for a wide range of raw materials such as edible oils, other ingredients and product packaging, which could also have an impact on Calbee’s operating results and fi nancial position.
3. Product Safety
Consumer demands for greater food safety have increased in recent years. In assuming responsibility for responding to these demands, Calbee strictly monitors the quality of ingredi-ents and manufacturing processes and takes all possible pre-cautions to ensure product quality and prevent contamination. However, unforeseen problems related to ingredients and manufacturing processes could have an impact on Calbee’s operating results and fi nancial position. Furthermore, in April 2002, the Swedish government released the results of research showing that grilling or frying foods with high carbohydrate content can generate acryl-amide, a carcinogen. Japan’s Ministry of Health, Labour and Welfare has said it does not foresee any health impact from this substance for people who consume average amounts of this type of food, and at this point, there has been no impact on Calbee’s operating results. Nevertheless, this issue could develop in the future to the point where it has an impact on the entire snack foods industry.
4. Competitive Risk
Calbee has a large and stable share of the domestic snack food and cereal markets. However, intensifying competition from rival domestic companies, a signifi cant infl ux of foreign-owned companies into the market, or sector realignment due to M&A deals could have an impact on Calbee’s operating results and fi nancial position. In addition, choosing to lower prices in response to price reductions implemented by competitors could result in lower profi t margins and other outcomes, which in turn could have an impact on Calbee’s operating results and fi nancial position.
5. Global Expansion
Calbee is using subsidiaries overseas to expand its operations outside the Japanese market. Calbee believes it is necessary to strengthen and expand overseas business to deliver growth over the longer term. Going forward, Calbee intends to expand its operations more rapidly and boost its competitiveness.

Calbee, Inc. Annual Report 2016 45
However, if efforts to develop its presence in global markets do not proceed as anticipated it may be necessary for Calbee to review its growth strategy. In addition, as Calbee expands its operations, changes in the political and economic conditions of a variety of countries and regions, as well as fl uctuations in foreign exchange markets, could have an impact on Calbee’s operating results and fi nancial position.
6. Relationship with Major Shareholder
As of March 31, 2015, Frito-Lay Global Investments B.V. (FLGI), a wholly owned subsidiary of PepsiCo, Inc., (PepsiCo) owned 20.00% of Calbee, Inc. shares (after full dilution) making Calbee (the Company) an equity-method affi liate of PepsiCo. FLGI, which directly owns the shares of the Company, is a wholly owned PepsiCo subsidiary, so PepsiCo effectively makes all decisions regarding the exercise of common share voting rights. PepsiCo is one of the world’s largest food and beverage makers and is listed on the New York Stock Exchange. Also, PepsiCo operates globally in the same snack foods fi eld as the Company via group companies, primarily its subsidiary Frito-Lay North America, Inc. On June 24, 2009, the Company and PepsiCo concluded a strategic alliance agreement, based on the understanding that combining management capabilities to generate synergies was necessary to deliver sustained growth for both companies. In order to reinforce the partnership with PepsiCo, the Company allocated new shares to PepsiCo’s wholly owned subsidiary FLGI via a private placement, and at the same time, acquired all the shares of PepsiCo’s subsidiary Japan Frito-Lay Ltd. Under the strategic partnership, PepsiCo has agreed not to operate a snack food business in the Japanese market and therefore does not compete with the Company in Japan. Also, because no restrictions have been placed on overseas busi-ness development, the Company believes there are no limits on its management decisions or business development under the agreement. The Company intends to maintain this strategic partnership and work toward boosting corporate value. However, in the future it may no longer be possible to generate synergies from the partnership in the event that PepsiCo makes changes to its management policy and business strategy. In addition, the PepsiCo Group could become a competitor in the Japanese market in the event that the partnership is dissolved for any reason. Any of these developments could have an impact on Calbee’s operating results and fi nancial position.
a. Personnel Relationship As of March 31, 2016, no signifi cant personnel relationship exists between Calbee and PepsiCo Group.
b. Business RelationshipThe Company’s subsidiary Japan Frito-Lay Ltd. receives imports of snack foods from Frito-Lay, Inc., a PepsiCo Group company. In addition, the Company’s subsidiary Calbee North America, LLC sells snack foods to PepsiCo Group’s Frito-Lay North America, Inc.
c. Capital Relationship Under the strategic partnership with PepsiCo, the Company and PepsiCo have agreed that from the perspective of main-taining the strategic partnership, PepsiCo shall not own more than 20% of the Company’s shares. In future, PepsiCo’s own-ership ratio in the Company may be subject to change, owing to changes in the management policies or business strategies of PepsiCo or the Company, or as a result of other factors such as changes in the Company’s business environment.
7. Legal Regulations
In the course of its business activities, Calbee is subject to a range of legal regulations, including the Food Sanitation Act, Act against Unjustifi able Premiums and Misleading Representations, Measurement Act, Unfair Competition Prevention Act, Plant Protection Act, and Consumer Product Safety Act. Calbee may incur additional costs to respond to revisions to these regulations or their abolishment and the implementation of new regulations, and this could have an impact on Calbee’s operating results and fi nancial position. Calbee has also received a variety of permits and licenses necessary to conduct its business activities. However, Calbee’s business activities may be restricted if these permits and licenses are withdrawn due to legal infringements or other reasons, which could have an impact on Calbee’s operating results and fi nancial position.
8. Natural Disaster Risk
Calbee conducts necessary periodic inspections of its manu-facturing lines to avoid the risk of shutdowns to these lines. It has also built a stable product supply framework by dispersing its manufacturing sites. However, there is no guarantee that manufacturing facilities will not be damaged as a result of a natural disaster or other event. Any such damage to facilities could lead to a drop in sales and an increase in costs, which could have an impact on Calbee’s operating results and fi nancial position.
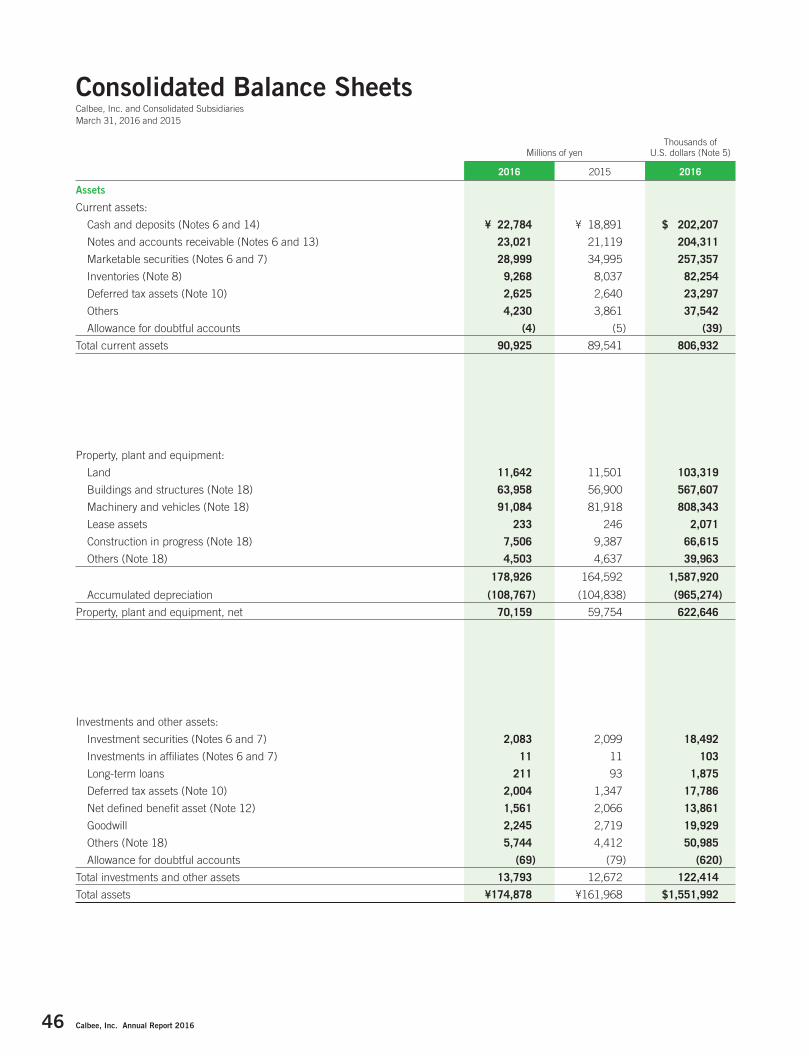
46 Calbee, Inc. Annual Report 2016
Consolidated Balance SheetsCalbee, Inc. and Consolidated SubsidiariesMarch 31, 2016 and 2015
Millions of yenThousands of
U.S. dollars (Note 5)
2016 2015 2016
Assets
Current assets:
Cash and deposits (Notes 6 and 14) ¥ 22,784 ¥ 18,891 $ 202,207
Notes and accounts receivable (Notes 6 and 13) 23,021 21,119 204,311
Marketable securities (Notes 6 and 7) 28,999 34,995 257,357
Inventories (Note 8) 9,268 8,037 82,254
Deferred tax assets (Note 10) 2,625 2,640 23,297
Others 4,230 3,861 37,542
Allowance for doubtful accounts (4) (5) (39)
Total current assets 90,925 89,541 806,932
Property, plant and equipment:
Land 11,642 11,501 103,319
Buildings and structures (Note 18) 63,958 56,900 567,607
Machinery and vehicles (Note 18) 91,084 81,918 808,343
Lease assets 233 246 2,071
Construction in progress (Note 18) 7,506 9,387 66,615
Others (Note 18) 4,503 4,637 39,963
178,926 164,592 1,587,920
Accumulated depreciation (108,767) (104,838) (965,274)
Property, plant and equipment, net 70,159 59,754 622,646
Investments and other assets:
Investment securities (Notes 6 and 7) 2,083 2,099 18,492
Investments in affi liates (Notes 6 and 7) 11 11 103
Long-term loans 211 93 1,875
Deferred tax assets (Note 10) 2,004 1,347 17,786
Net defi ned benefi t asset (Note 12) 1,561 2,066 13,861
Goodwill 2,245 2,719 19,929
Others (Note 18) 5,744 4,412 50,985
Allowance for doubtful accounts (69) (79) (620)
Total investments and other assets 13,793 12,672 122,414
Total assets ¥174,878 ¥161,968 $1,551,992

Calbee, Inc. Annual Report 2016 47
Millions of yenThousands of
U.S. dollars (Note 5)
2016 2015 2016
Liabilities
Current liabilities:
Notes and accounts payable (Note 6) ¥ 10,350 ¥ 9,387 $ 91,856
Short-term borrowings (Note 9) — 402 —
Current portion of long-term debt (Note 9) 52 — 464
Lease obligations (Note 9) 64 52 570
Other payables 6,121 5,165 54,326
Income taxes payable 4,604 5,174 40,865
Deferred tax liabilities (Note 10) 1 — 17
Provision for bonuses 4,195 3,775 37,237
Provision for directors’ bonuses 128 198 1,136
Provision for stock payments (Note 4) 65 83 579
Others 7,884 9,988 69,971
Total current liabilities 33,469 34,227 297,027
Non-current liabilities:
Long-term debt (Note 9) 313 — 2,785
Lease obligations (Note 9) 93 76 830
Deferred tax liabilities (Note 10) 553 373 4,915
Provision for directors’ retirement benefi ts 527 573 4,677
Provision for directors’ stock payments (Note 4) 121 132 1,075
Net defi ned benefi t liability (Note 12) 7,489 7,076 66,468
Asset retirement obligations 645 637 5,729
Others 194 70 1,730
Total non-current liabilities 9,939 8,940 88,212
Net assets (Note 11):
Shareholders’ equity:
Common stock:
Authorized 2016 — 176,000,000 shares Authorized 2015 — 176,000,000 shares Issued 2016 — 133,769,800 shares Issued 2015 — 133,629,800 shares 12,008 11,975 106,569
Additional paid-in capital 11,572 11,543 102,702
Retained earnings 98,013 84,956 869,839
Treasury stock — 193,452 shares in 2016 228,132 shares in 2015 (609) (699) (5,405)
Total shareholders’ equity 120,985 107,774 1,073,706
Accumulated other comprehensive income:
Unrealized holding gain on securities 608 617 5,401
Foreign currency translation adjustments 904 2,377 8,025
Remeasurements of defi ned benefi t plans (Note 12) (1,585) (1,116) (14,069)
Total accumulated other comprehensive income (loss) (72) 1,877 (641)
Subscription rights 15 25 133
Non-controlling interests 10,541 9,122 93,555
Total net assets 131,469 118,800 1,166,752
Total liabilities and net assets ¥174,878 ¥161,968 $1,551,992
See accompanying notes to the consolidated fi nancial statements.

48 Calbee, Inc. Annual Report 2016
Consolidated Statements of IncomeCalbee, Inc. and Consolidated SubsidiariesYears ended March 31, 2016 and 2015
Consolidated Statements of Comprehensive IncomeCalbee, Inc. and Consolidated SubsidiariesYears ended March 31, 2016 and 2015
Millions of yenThousands of
U.S. dollars (Note 5)
2016 2015 2016
Net sales ¥246,129 ¥222,150 $2,184,319 Cost of sales (Notes 8 and 16) 139,095 124,588 1,234,430 Gross profi t 107,033 97,561 949,889 Selling, general and administrative expenses (Notes 15 and 16) 78,908 73,378 700,284 Operating income 28,125 24,183 249,605 Other income (expenses):
Interest and dividend income 202 301 1,796 Interest expense (9) (5) (81) Real estate income 76 76 682 Cost of real estate (32) (33) (291) Foreign exchange gains (losses) (638) 1,318 (5,670) Loss on abandonment of inventories (582) — (5,170) Business commencement expenses (515) (368) (4,573) Gain on sales of non-current assets 6 7 60 Gain on sales of shares of subsidiaries and affi liates 370 — 3,287 Subsidy income 149 — 1,325 Loss on sales of property, plant and equipment (Note 17) (3) (229) (35) Loss on disposal of property, plant and equipment (Note 17) (227) (300) (2,015) Impairment loss (Note 18) (594) (836) (5,274) Other (204) 105 (1,810) Net income before income taxes 26,123 24,217 231,833Income taxes (Note 10):
Current (8,359) (9,190) (74,185) Deferred 267 (121) 2,377
(8,091) (9,311) (71,807) Net income 18,031 14,906 160,026 Net income attributable to:
Non-controlling interests 1,232 (791) 10,939 Owners of parent ¥ 16,799 ¥ 14,114 $ 149,086
See accompanying notes to the consolidated fi nancial statements.
Millions of yenThousands of
U.S. dollars (Note 5)
2016 2015 2016
Net income ¥18,031 ¥14,906 $160,026Other comprehensive income (Note 19):
Unrealized holding gain (loss) on securities (8) 406 (74) Foreign currency translation adjustments (2,253) 2,521 (19,998) Remeasurements of defi ned benefi t plans (468) 149 (4,157)Total other comprehensive income (loss) (2,730) 3,076 (24,230)Comprehensive income ¥15,301 ¥17,983 $135,799
Comprehensive income attributable to:
Owners of parent ¥14,848 ¥16,074 $131,779 Non-controlling interests ¥ 452 ¥ 1,908 $ 4,019
See accompanying notes to the consolidated fi nancial statements.
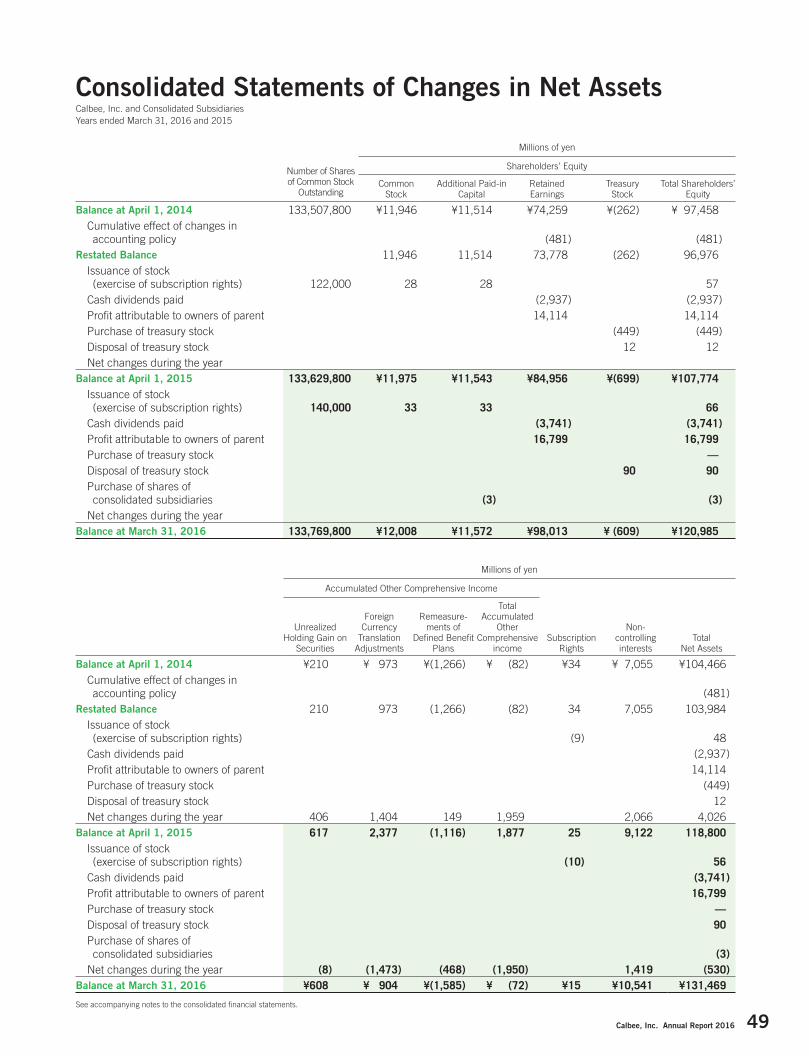
Calbee, Inc. Annual Report 2016 49
Consolidated Statements of Changes in Net AssetsCalbee, Inc. and Consolidated SubsidiariesYears ended March 31, 2016 and 2015
Number of Shares of Common Stock
Outstanding
Millions of yen
Shareholders’ Equity
Common Stock
Additional Paid-in Capital
Retained Earnings
Treasury Stock
Total Shareholders’ Equity
Balance at April 1, 2014 133,507,800 ¥11,946 ¥11,514 ¥74,259 ¥(262) ¥ 97,458 Cumulative effect of changes in
accounting policy (481) (481)Restated Balance 11,946 11,514 73,778 (262) 96,976 Issuance of stock
(exercise of subscription rights) 122,000 28 28 57 Cash dividends paid (2,937) (2,937) Profi t attributable to owners of parent 14,114 14,114 Purchase of treasury stock (449) (449) Disposal of treasury stock 12 12 Net changes during the yearBalance at April 1, 2015 133,629,800 ¥11,975 ¥11,543 ¥84,956 ¥(699) ¥107,774 Issuance of stock
(exercise of subscription rights) 140,000 33 33 66 Cash dividends paid (3,741) (3,741) Profi t attributable to owners of parent 16,799 16,799 Purchase of treasury stock — Disposal of treasury stock 90 90 Purchase of shares of
consolidated subsidiaries (3) (3) Net changes during the yearBalance at March 31, 2016 133,769,800 ¥12,008 ¥11,572 ¥98,013 ¥ (609) ¥120,985
Millions of yen
Accumulated Other Comprehensive Income
Unrealized Holding Gain on
Securities
Foreign Currency
Translation Adjustments
Remeasure-ments of
Defi ned Benefi t Plans
Total Accumulated
Other Comprehensive
incomeSubscription
Rights
Non-controlling interests
Total Net Assets
Balance at April 1, 2014 ¥210 ¥ 973 ¥(1,266) ¥ (82) ¥34 ¥ 7,055 ¥104,466 Cumulative effect of changes in
accounting policy (481)Restated Balance 210 973 (1,266) (82) 34 7,055 103,984 Issuance of stock
(exercise of subscription rights) (9) 48 Cash dividends paid (2,937) Profi t attributable to owners of parent 14,114 Purchase of treasury stock (449) Disposal of treasury stock 12 Net changes during the year 406 1,404 149 1,959 2,066 4,026Balance at April 1, 2015 617 2,377 (1,116) 1,877 25 9,122 118,800 Issuance of stock
(exercise of subscription rights) (10) 56 Cash dividends paid (3,741) Profi t attributable to owners of parent 16,799 Purchase of treasury stock — Disposal of treasury stock 90 Purchase of shares of
consolidated subsidiaries (3) Net changes during the year (8) (1,473) (468) (1,950) 1,419 (530)Balance at March 31, 2016 ¥608 ¥ 904 ¥(1,585) ¥ (72) ¥15 ¥10,541 ¥131,469
See accompanying notes to the consolidated fi nancial statements.
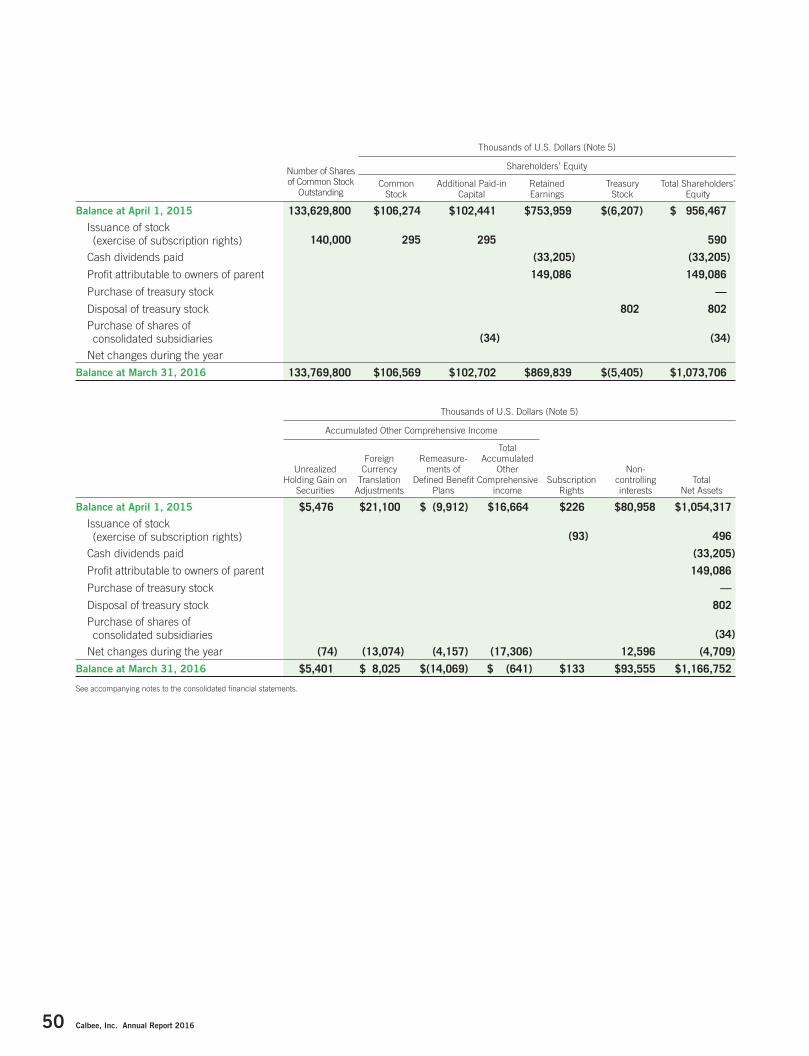
50 Calbee, Inc. Annual Report 2016
Number of Shares of Common Stock
Outstanding
Thousands of U.S. Dollars (Note 5)
Shareholders’ Equity
Common Stock
Additional Paid-in Capital
Retained Earnings
Treasury Stock
Total Shareholders’ Equity
Balance at April 1, 2015 133,629,800 $106,274 $102,441 $753,959 $(6,207) $ 956,467 Issuance of stock
(exercise of subscription rights) 140,000 295 295 590
Cash dividends paid (33,205) (33,205)
Profi t attributable to owners of parent 149,086 149,086
Purchase of treasury stock —
Disposal of treasury stock 802 802 Purchase of shares of
consolidated subsidiaries (34) (34)
Net changes during the year
Balance at March 31, 2016 133,769,800 $106,569 $102,702 $869,839 $(5,405) $1,073,706
Thousands of U.S. Dollars (Note 5)
Accumulated Other Comprehensive Income
Unrealized Holding Gain on
Securities
Foreign Currency
Translation Adjustments
Remeasure-ments of
Defi ned Benefi t Plans
Total Accumulated
Other Comprehensive
incomeSubscription
Rights
Non-controlling interests
Total Net Assets
Balance at April 1, 2015 $5,476 $21,100 $ (9,912) $16,664 $226 $80,958 $1,054,317 Issuance of stock
(exercise of subscription rights) (93) 496
Cash dividends paid (33,205)
Profi t attributable to owners of parent 149,086
Purchase of treasury stock —
Disposal of treasury stock 802 Purchase of shares of
consolidated subsidiaries (34)
Net changes during the year (74) (13,074) (4,157) (17,306) 12,596 (4,709)
Balance at March 31, 2016 $5,401 $ 8,025 $(14,069) $ (641) $133 $93,555 $1,166,752
See accompanying notes to the consolidated fi nancial statements.
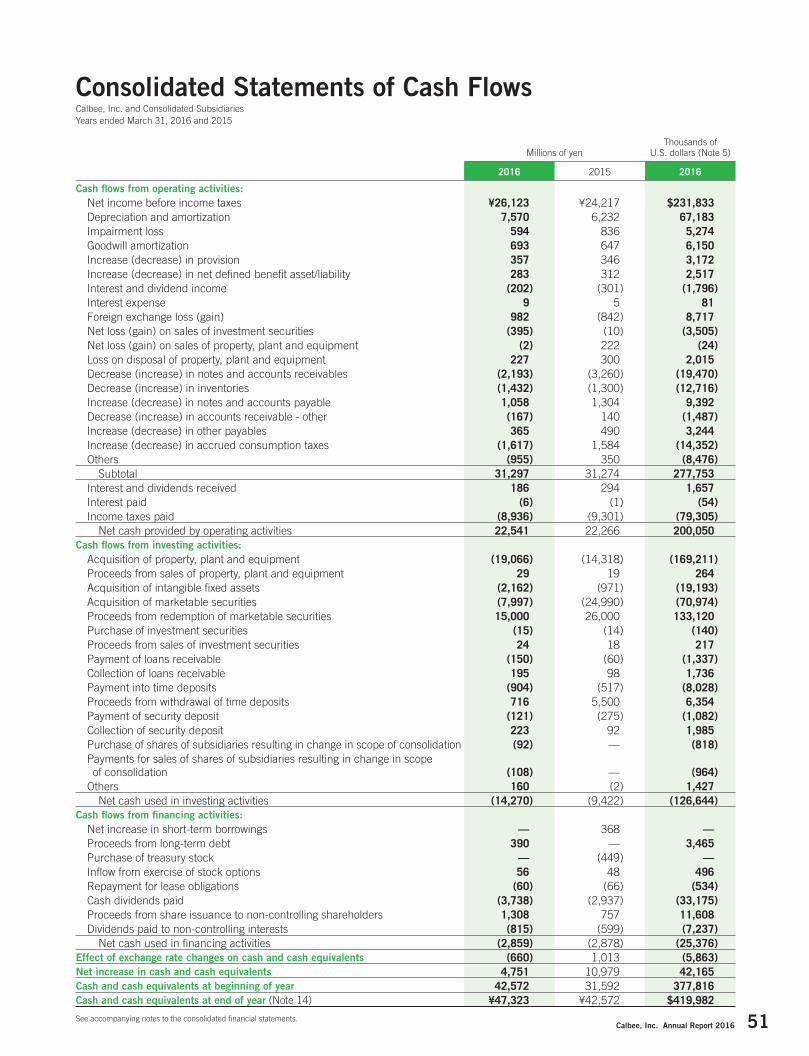
Calbee, Inc. Annual Report 2016 51
Consolidated Statements of Cash FlowsCalbee, Inc. and Consolidated SubsidiariesYears ended March 31, 2016 and 2015
Millions of yenThousands of
U.S. dollars (Note 5)
2016 2015 2016
Cash fl ows from operating activities: Net income before income taxes ¥26,123 ¥24,217 $231,833 Depreciation and amortization 7,570 6,232 67,183 Impairment loss 594 836 5,274 Goodwill amortization 693 647 6,150 Increase (decrease) in provision 357 346 3,172 Increase (decrease) in net defi ned benefi t asset/liability 283 312 2,517 Interest and dividend income (202) (301) (1,796) Interest expense 9 5 81 Foreign exchange loss (gain) 982 (842) 8,717 Net loss (gain) on sales of investment securities (395) (10) (3,505) Net loss (gain) on sales of property, plant and equipment (2) 222 (24) Loss on disposal of property, plant and equipment 227 300 2,015 Decrease (increase) in notes and accounts receivables (2,193) (3,260) (19,470) Decrease (increase) in inventories (1,432) (1,300) (12,716) Increase (decrease) in notes and accounts payable 1,058 1,304 9,392 Decrease (increase) in accounts receivable - other (167) 140 (1,487) Increase (decrease) in other payables 365 490 3,244 Increase (decrease) in accrued consumption taxes (1,617) 1,584 (14,352) Others (955) 350 (8,476) Subtotal 31,297 31,274 277,753 Interest and dividends received 186 294 1,657 Interest paid (6) (1) (54) Income taxes paid (8,936) (9,301) (79,305) Net cash provided by operating activities 22,541 22,266 200,050 Cash fl ows from investing activities: Acquisition of property, plant and equipment (19,066) (14,318) (169,211) Proceeds from sales of property, plant and equipment 29 19 264 Acquisition of intangible fi xed assets (2,162) (971) (19,193) Acquisition of marketable securities (7,997) (24,990) (70,974) Proceeds from redemption of marketable securities 15,000 26,000 133,120 Purchase of investment securities (15) (14) (140) Proceeds from sales of investment securities 24 18 217 Payment of loans receivable (150) (60) (1,337) Collection of loans receivable 195 98 1,736 Payment into time deposits (904) (517) (8,028) Proceeds from withdrawal of time deposits 716 5,500 6,354 Payment of security deposit (121) (275) (1,082) Collection of security deposit 223 92 1,985 Purchase of shares of subsidiaries resulting in change in scope of consolidation (92) — (818) Payments for sales of shares of subsidiaries resulting in change in scope
of consolidation (108) — (964) Others 160 (2) 1,427 Net cash used in investing activities (14,270) (9,422) (126,644)Cash fl ows from fi nancing activities: Net increase in short-term borrowings — 368 — Proceeds from long-term debt 390 — 3,465 Purchase of treasury stock — (449) — Infl ow from exercise of stock options 56 48 496 Repayment for lease obligations (60) (66) (534) Cash dividends paid (3,738) (2,937) (33,175) Proceeds from share issuance to non-controlling shareholders 1,308 757 11,608 Dividends paid to non-controlling interests (815) (599) (7,237) Net cash used in fi nancing activities (2,859) (2,878) (25,376)Effect of exchange rate changes on cash and cash equivalents (660) 1,013 (5,863)Net increase in cash and cash equivalents 4,751 10,979 42,165 Cash and cash equivalents at beginning of year 42,572 31,592 377,816 Cash and cash equivalents at end of year (Note 14) ¥47,323 ¥42,572 $419,982
See accompanying notes to the consolidated fi nancial statements.

52 Calbee, Inc. Annual Report 2016
Notes to Consolidated Financial StatementsCalbee, Inc. and Consolidated SubsidiariesYears ended March 31, 2016 and 2015
1. Basis of Presentation
The accompanying consolidated fi nancial statements of Calbee, Inc. (the “Company”) and its consolidated subsid-
iaries have been prepared from the consolidated fi nancial statements fi led with the Kanto Local Finance Bureau as
required by the Financial Instruments and Exchange Law of Japan and in conformity with generally accepted
accounting principles and practices in Japan, which are different in certain respects as to the application and dis-
closure requirements of International Financial Reporting Standards. Accordingly, International Financial Reporting
Standards are not applied in preparing the accompanying consolidated fi nancial statements. The consolidated
fi nancial statements are not intended to present the fi nancial position, results of operations or cash fl ows in accor-
dance with accounting principles and practices generally accepted in countries and jurisdictions other than Japan.
In preparing the accompanying consolidated fi nancial statements, certain reclassifi cations have been made to
present the information in a form familiar to readers outside Japan. The accounts and the fi nancial statements of
the Company and its subsidiaries are maintained in Japanese yen.
As permitted, amounts of less than one million yen are rounded down. As a result, the totals shown in the
accompanying consolidated fi nancial statements (both in yen and U.S. dollars) do not necessarily agree with the
sum of the individual amounts.
2. Summary of Signifi cant Accounting Policies
(a) Basis of consolidation and accounting for investments in affi liates
The accompanying consolidated fi nancial statements include the accounts of the Company and signifi cant subsid-
iaries in which the Company holds, directly or indirectly, more than 50% of the voting rights or where it exercises
control. The consolidated fi nancial statements consist of the Company and its 24 (22 in 2015) signifi cant subsidiar-
ies as listed below.
Consolidated subsidiaries
• Calbee Potato, Inc.
• Snack Food Service Co., Ltd.
• Garden Bakery, Inc.
• Tower Bakery, Inc.
• Star Bakery, Inc.
• Calnac Co., Ltd.
• Calbee Eatalk Co., Ltd.
• Japan Frito-Lay Ltd.
• ICS Investment Co., LTD. (Note 4)
• Calbee America, Inc. (Note 4)
• Calbee North America, LLC (Note 4)
• Qingdao Calbee Foods Co., Ltd. (Note 4)
• Yantai Calbee Co., Ltd. (Note 4)
• CFSS Co. Ltd. (Note 4)
• Calbee Four Seas Co., Ltd.
• Calbee E-commerce Limited (Notes 1 and 4)
• Calbee (Taipei) Foods Co., Ltd. (Note 4)
• Haitai-Calbee Co., Ltd. (Note 4)
• Calbee Tanawat Co., Ltd. (Note 4)
• Calbee Moh Seng Pte. Ltd. (Notes 2 and 4)
• PT. Calbee-Wings Food (Note 4)
• Calbee-URC, Inc. (Note 4)
• Calbee (UK) Ltd (Note 4)
• Calbee Iberia, S. L. (Notes 1 and 4)
Notes: 1. The Company established Calbee Iberia, S. L. in April 2015, and Calbee
E-commerce Limited in October 2015. These companies were included in
the scope of consolidation from the year ended March 31, 2016.
2. In April 2015, the Company acquired a 51% stake in Moh Seng Market-
ing Pte. Ltd., which has thus been included in the scope of consolidation
during the year ended March 31, 2016. In addition, its name was
changed to Calbee Moh Seng Pte. Ltd.
3. The Company divested its entire stake in subsidiary Calbee (Hangzhou)
Foods Co., Ltd., and it was therefore removed from the scope of consoli-
dation from the year ended March 31, 2016.
4. The fi scal year-end of these subsidiaries is December 31.

Calbee, Inc. Annual Report 2016 53
Investments in affi liates which are not accounted for by the equity method are carried at cost.
For the years ended March 31, 2016 and 2015, all subsidiaries are consolidated and there is no affi liate that is
accounted for by the equity method.
For the years ended March 31, 2016 and 2015, three affi liates, Potato Foods Co., Ltd., Hiroshima Agricultural
Produce Distributors Cooperative, and Socio Kobo Co., Ltd., were not accounted for using the equity method as
they were not signifi cant in terms of net income and retained earnings of the consolidated fi nancial statements.
All signifi cant intercompany balances and transactions have been eliminated in consolidation. Accounts of sub-
sidiaries whose year-ends differ by three months from March 31 have been included using pro forma fi nancial
information prepared as of March 31.
(b) Foreign currency translation
All monetary assets and liabilities denominated in foreign currencies are translated into yen at the exchange rate in
effect at the balance sheet date and gains or losses arising from such translation is credited or charged to income.
Assets and liabilities of overseas subsidiaries are translated into yen at the exchange rate in effect at the balance
sheet date, whereas shareholders’ equity of such subsidiaries is translated at the historical rate that prevailed on
the date of their acquisition. Income and expenses of overseas subsidiaries are translated into yen using the
average exchange rate during the fi scal year. Translation adjustments are included in foreign currency translation
adjustments and non-controlling interests in net assets section of the accompanying consolidated balance sheets.
(c) Cash and cash equivalents
For the purpose of the consolidated statements of cash fl ows, cash and cash equivalents consist of cash on hand,
deposits with banks available for withdrawal on demand and short-term highly liquid investments with an original
maturity of three months or less which are readily convertible into cash and subject to insignifi cant risk of changes
in value.
(d) Allowance for doubtful accounts
Allowance for doubtful accounts is provided based on the Company’s actual historical experience of credit loss for
active accounts and on an individual basis after an analysis of collectability for certain doubtful accounts.
(e) Marketable and investment securities
Marketable and investment securities are classifi ed and valued as follows:
(1) Held-to-maturity debt securities
Amortized cost method (straight-line method)
(2) Available-for-sale securities
Securities for which fair values are readily available:
Marked-to-market using market prices at the fi scal year-end, with any changes in unrealized holding gains
or losses, net of applicable income taxes, included directly in net assets. Cost of securities sold is deter-
mined using the moving average method.
Securities for which fair values are not readily available:
Stated at cost based on the moving-average method.

54 Calbee, Inc. Annual Report 2016
(f) Inventories
Inventories are stated at cost using the average method for fi nished goods and work-in-process. The moving-aver-
age method is applied for commercial goods, raw materials and supplies. The book value of inventories is written
down to refl ect any declines in profi tability.
(g) Property, plant and equipment (except for leases)
Property, plant and equipment is stated at cost less accumulated depreciation. Depreciation is calculated primarily
by the declining balance method over the estimated useful lives of the respective assets, except for buildings
(excluding leasehold improvements) acquired subsequent to March 31, 1998, for which depreciation is calculated
by the straight-line method. The useful lives of buildings, machinery and equipment are as follows:
Useful lives (years)
Buildings 15 to 31 years
Machinery and equipment 10 years
After property, plant and equipment acquired prior to April 1, 2007 are depreciated to the depreciable limit (5%
of the acquisition price), the remaining balance is further depreciated to memorandum value using the straight-line
method over fi ve years beginning in the following year.
(h) Goodwill
Goodwill is amortized using the straight-line method over 5, 10 or 20 years.
(i) Intangible assets (except for leases)
Intangible assets are amortized using the straight-line method. Software for internal use is amortized using the
straight-line method over the estimated useful life of fi ve years.
(j) Leases
Finance lease assets that do not transfer ownership of the property to the lessee are depreciated using the straight-
line method over the lease term with no residual value, except for those leased prior to April 1, 2008, which are
accounted for in a similar manner to operating lease transactions.
(k) Provision for bonuses
Provision for bonuses is provided for the bonus payments to employees and directors in the estimated bonus
amount attributable to the current fi scal year.
(l) Provision for stock payments
To prepare for future awards of Calbee shares to Group employees, provision for stock payments is provided for
stock award debt based on predetermined regulations for awarding stock.
(m) Provision for directors’ retirement benefi ts
To provide for the payment of directors’ retirement benefi t, the amount payable under internal regulations at the
consolidated balance sheet date is recorded.
Calbee, Inc. Annual Report 2016 55
(n) Provision for directors’ stock payments
To prepare for future awards of Calbee shares to Calbee’s directors, etc, provision for stock payments is provided for
stock award debt based on predetermined regulations for awarding stock.
(o) Accounting method for retirement benefi ts
(1) Period allocation methodology for the estimated retirement benefi t amount
The retirement benefi t obligation is calculated by allocating the estimated retirement benefi t amount until the
end of the current fi scal year on a benefi t formula basis.
(2) Amortization of net unrecognized actuarial gains (losses) and unrecognized past service cost
Net unrecognized actuarial gains (losses) are amortized beginning in the following fi scal year by the straight-line
method over a specifi ed number of years (12 years) within the average remaining service period of employees
at the time the difference arose.
Unrecognized past service cost is amortized by the straight-line method over a specifi ed number of years (fi ve
years) within the average remaining service period of employees at the time the cost incurred.
(3) Application of the simplifi ed method for small businesses
For part-time employees of the Company, amount payable at the fi scal year-end in accordance with internal reg-
ulations is provided for.
For certain consolidated subsidiaries, a simplifi ed method is applied for the calculation of retirement benefi t
obligations and retirement benefi t expenses in which the necessary retirement benefi t provisions for voluntary
resignations at the end of the fi scal year are recorded as retirement benefi t obligations.
(p) Consumption taxes
Transactions subject to consumption tax and local consumption tax are stated at the amount, net of consumption taxes.
(q) Business commencement expenses
Business commencement expenses are expensed as incurred.
(r) Accounting standards issued but not yet adopted
Implementation Guidance on Recoverability of Deferred Tax Assets Accounting Standards Board of Japan (ASBJ
Guidance No. 26, March 28, 2016)
(1) Overview
Following the framework in Auditing Committee Report No. 66 “Audit Treatment regarding the Judgment of
Recoverability of Deferred Tax Assets”, which prescribes estimation of deferred tax assets according to the clas-
sifi cation of the entity by one of fi ve types, the following treatments were changed as necessary:
1. Treatment for an entity that does not meet any of the criteria in types 1 to 5;
2. Criteria for types 2 and 3;
3. Treatment for deductible temporary differences that an entity classifi ed as type 2 is unable to schedule;
4. Treatment for the period which an entity classifi ed as type 3 is able to reasonably estimate with respect to
future taxable income before consideration of taxable or deductible temporary differences that exist at the
end of the current annual period; and
5. Treatment when an entity classifi ed as type 4 also meets the criteria for types 2 or 3.

56 Calbee, Inc. Annual Report 2016
(2) Effective date
The guidance is effective from the beginning of the year ending March 31, 2017.
(3) Effects of application of the guidance
The impact of the Company’s consolidated fi nancial statements from the adoption of implementation guidance
on recoverability of deferred tax assets is under evaluation at the time of the preparation of consolidated fi nan-
cial statements.
3. Accounting Change
Accounting Standard for Business Combinations
The Accounting Standard for Business Combinations (ASBJ Statement No. 21) revised September 13, 2013, the
Accounting Standard for Consolidated Financial Statements (ASBJ Statement No. 22) revised September 13, 2013,
and the Accounting Standard for Business Divestitures (ASBJ Statement No. 7) revised September 13, 2013, have
been applied from the year ended March 31, 2016. Differences arising from changes in ownership interests in sub-
sidiaries in cases where the parent company continues to have control are now recorded in additional paid-in
capital, and acquisition expenses for business combinations are now treated as expenses in the consolidated fi nan-
cial statements for the year in which they arise. For business combinations that occur from April 1, 2015, any
changes to the allocation of the acquisition price arising from settlement of the provisional accounting treatment
shall be refl ected in the consolidated fi nancial statements for the year in which the business combination occurs.
Additionally, a change in presentation has been made to net income, and the previous accounting standard cate-
gory of minority interests has changed to non-controlling interests. To refl ect these changes in presentation, the
consolidated fi nancial statements for the previous year have been restated.
The Company has adopted these accounting standards from the beginning of the year ended March 31, 2016, in
accordance with transitional treatment based on Article 58-2 (4) of the Accounting Standard for Business Combina-
tions, Article 44-5 (4) of the Accounting Standard for Consolidated Financial Statements, and Article 57-4 (4) of the
Accounting Standard for Business Divestitures.
In the consolidated statement of cash fl ows for the year ended March 31, 2016, cash fl ows arising from acquisi-
tion-related expenses for the acquisition of shares of subsidiaries that result in changes in the scope of consolida-
tion, or the acquisition or sale of shares of subsidiaries that do not result in changes in the scope of consolidation,
are recorded under cash fl ows from operating activities.
The impact on operating income, ordinary income and income before income taxes and additional paid-in capital
as of and for the year ended March 31, 2016 is minimal.
The effect on per share information is described in Note 25, “Per Share Information.”
4. Additional Information
Employee Stock Ownership Plan (ESOP) Trust
The Company awards the Company’s own stock to the employees of the Group through a trust.
(1) Transaction summary
On March 7, 2014, the Employee Stock Ownership Plan (ESOP) Trust was introduced as an employee incentive
plan with the aim of improving long-term corporate value. By raising awareness of our fi nancial results and share

Calbee, Inc. Annual Report 2016 57
price among employees, the Company aims to further promote corporate activities that improve fi nancial results.
The Company has established the Trust by contributing funds for acquisition of Calbee stocks for those employees
who satisfy certain requirements. Based on predetermined regulations for awarding stocks, the Trust will acquire
the estimated number of Calbee stocks to be awarded to employees from the stock market during the predeter-
mined stock acquisition period. Funds required for the Trust to purchase the aforementioned stocks will be pro-
vided by the Company. The employees will bear no liabilities.
Introducing the Trust will enable employees to profi t from a rise in stock prices, and will promote awareness of
the stock price among employees as they fulfi ll their duties and is thereby expected to improve employee motiva-
tion. Further, the voting rights of the company stocks held in the Trust will be executed within a structure that will
refl ect the will of the employees who are potential benefi ciaries and is an effective way to improve corporate value
by promoting employees’ participation in management planning.
(2) The Company’s own stock in the Trust
The Company’s own stock in the Trust is recorded in treasury shares under net assets based on the book value in
the trust (excluding ancillary expenses). The book value and the number of these treasury shares as of March 31,
2016 and 2015 were ¥168 million ($1,496 thousand) and 67,120 shares, and ¥247 million and 98,500 shares,
respectively.
Performance-linked Stock Compensation Plan
The Company awards stock to board members (excluding outside and part-time directors) and executives contrac-
tually bound to Calbee including Senior Executive Offi cers and Executive Offi cers (hereinafter “Board Members”)
through the Trust.
(1) Transaction summary
On August 6, 2014, the Company introduced a performance-linked stock compensation plan (hereinafter the
“Plan”) with the goal of increasing awareness of the importance of contributing to further enhancing Calbee’s cor-
porate value and performance over the medium-to-long-term. The plan will be highly transparent and objective and
closely linked with the Company’s performance for board members.
The Plan is the performance-linked stock compensation plan under which the Company’s shares are acquired
through the Board Incentive Plan Trust (hereafter “BIP Trust”) with the funds of remuneration contributed by the
Company and the Company’s shares are awarded to the Company’s Board Members in accordance with perfor-
mance targets achieved. Upon their retirement, Board Members will receive Calbee stock in principle.
In order to ensure the neutrality of Calbee’s management, voting rights for Calbee stock in the Trust shall not be
exercised while in the Trust.
(2) The Company’s own stock in the Trust
The Company’s own stock in the Trust is recorded in treasury shares under net assets based on the book value in
the Trust (excluding ancillary expenses). The book value and the number of these treasury shares in the Trust as of
March 31, 2016 and 2015 were ¥438 million ($3,889 thousand) and 125,500 shares, and ¥449 million and
128,800 shares, respectively.

58 Calbee, Inc. Annual Report 2016
5. U.S. Dollar Amounts
For the convenience of the reader, the accompanying consolidated fi nancial statements are also presented in U.S.
dollars by converting Japanese yen amounts at the rate of ¥112.68 = $1, the approximate rate in effect on March
31, 2016. The inclusion of such amounts is not intended to imply that yen amounts have been or could be readily
converted, realized or settled in U.S. dollars at that or any other rate.
6. Financial Instruments
(1) Policy for fi nancial instruments
The Company’s fund management policy is to use highly secure fi nancial instruments, such as term deposits, with
purchases of fi nancial instruments carried out in accordance with internal regulations including the fund manage-
ment policy. As for funding, domestic consolidated subsidiaries are prohibited from borrowing from third parties
and are only allowed to borrow from the Company. The Company borrows necessary funds from third parties if nec-
essary. The Company uses derivatives in order to hedge foreign exchange risk and does not enter into derivative
transactions for speculative or trading purposes.
(2) Nature of fi nancial instruments and the related risks and risk management
Trade receivables consist of notes and accounts receivable and are exposed to customers’ credit risk. In order to
reduce such risk, the Company monitors the credit standing, due dates and outstanding balance by individual
customer in accordance with the Group credit management policy.
Marketable securities consist of commercial paper and jointly-managed money trust and are highly safe fi nancial
instruments held for short-term investment. The Company considers their credit risk to be insignifi cant.
Investment securities consist of shares of companies with business relationships and debt securities for surplus
fund management, and are exposed to market volatility risk. In order to reduce such risk, the Company reviews the
market values and the fi nancial position of the issuers on a regular basis.
Trade payables consist of notes and accounts payable and borrowings and are exposed to liquidity risk. The
Company manages such risk by preparing fund management plans on a monthly basis. Also, the Company
enhanced its centralized funding and cash management functions by implementing a cash management system.
Long-term debt (including current portion of long-term debt) are taken out for the purpose of capital investments.
To avoid risks from fl uctuations in interest rates for payments on long-term debt, the Company’s borrowings are
limited to those with fi xed interest rates.
To hedge exchange rate volatility risk related to monetary receivables and payables denominated in foreign
currencies, the Company uses forward foreign exchange contracts. These derivative transactions are executed and
managed in accordance with the internal regulations governing the transaction authorizations. The Company con-
siders that credit risk arising from non-performance of counterparties is minimal because the counterparties to the
derivative transactions are limited to domestic banks with high credit standing.
(3) Supplementary explanation of the estimated fair value of fi nancial instruments
The fair value of fi nancial instruments includes the market value, or the reasonably determined value, in case there
is no relevant market value. Such value may change depending on the different presumptions adopted, since vari-
able factors are taken into account in determining the fair value.
The contract amount of derivative transactions shown in Note 21 Derivative Financial Instruments does not rep-
resent market risk.

Calbee, Inc. Annual Report 2016 59
(4) Fair values of fi nancial instruments
Carrying amount, estimated fair value and the difference between them for fi nancial instruments as of March 31,
2016 and 2015 are shown in the following table. The fi nancial instruments for which fair values are not readily
available are not included (see Note 2 below).
Millions of yen
(As of March 31, 2016) Carrying amount Estimated fair value Difference
Assets
(1) Cash and deposits ¥ 22,784 ¥ 22,784 —
(2) Notes and accounts receivable 23,021 23,021 —
(3) Marketable and investment securities
Held-to-maturity 28,999 29,004 ¥ 5
Available-for-sale 2,074 2,074 —
Total assets ¥ 76,880 ¥ 76,885 ¥ 5
Liabilities
(4) Notes and accounts payable ¥(10,350) ¥(10,350) —
(5) Long-term debt (including current portion of long-term debt) (366) (366) —
Total liabilities ¥(10,716) ¥(10,716) —
Derivative transactions
Hedge accounting not applied ¥ 169 ¥ 169 —
Total derivative transactions ¥ 169 ¥ 169 —
Thousands of U.S. dollars
(As of March 31, 2016) Carrying amount Estimated fair value Difference
Assets
(1) Cash and deposits $202,207 $202,207 —
(2) Notes and accounts receivable 204,311 204,311 —
(3) Marketable and investment securities
Held-to-maturity 257,357 257,403 $45
Available-for-sale 18,414 18,414 —
Total assets $682,290 $682,335 $45
Liabilities
(4) Notes and accounts payable $ (91,856) $ (91,856) —
(5) Long-term debt (including current portion of long-term debt) (3,250) (3,250) —
Total liabilities $ (95,106) $ (95,106) —
Derivative transactions
Hedge accounting not applied $ 1,505 $ 1,505 —
Total derivative transactions $ 1,505 $ 1,505 —
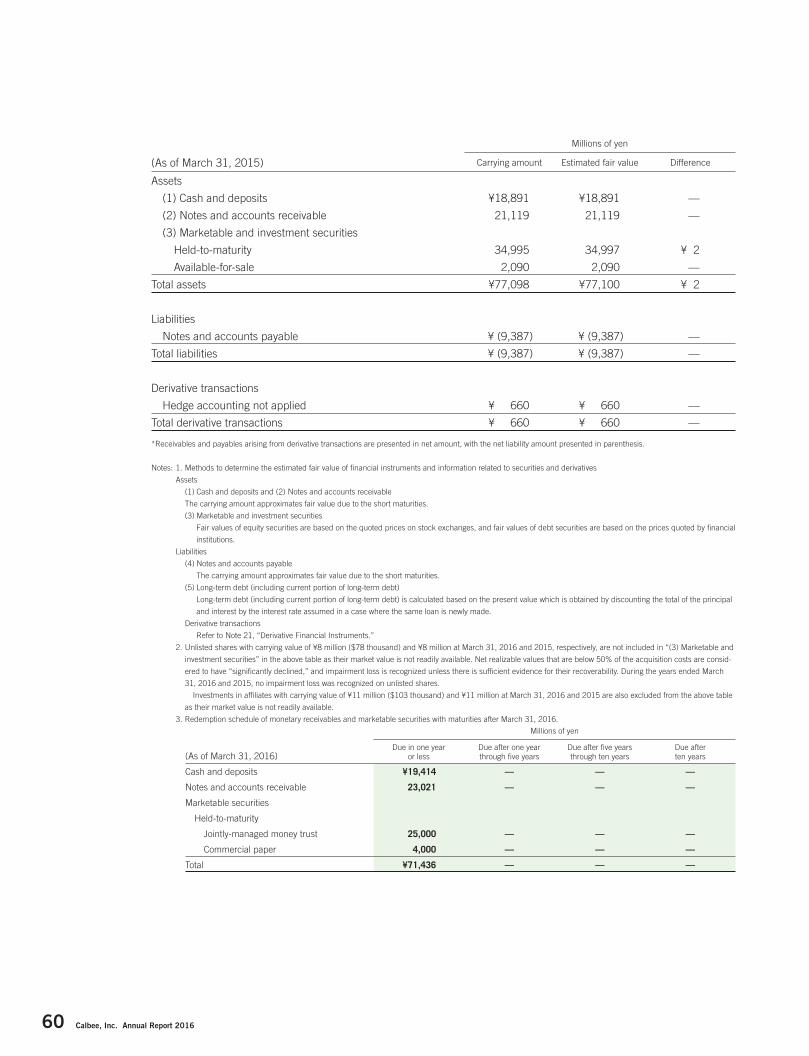
60 Calbee, Inc. Annual Report 2016
Millions of yen
(As of March 31, 2015) Carrying amount Estimated fair value Difference
Assets
(1) Cash and deposits ¥18,891 ¥18,891 —
(2) Notes and accounts receivable 21,119 21,119 —
(3) Marketable and investment securities
Held-to-maturity 34,995 34,997 ¥ 2
Available-for-sale 2,090 2,090 —
Total assets ¥77,098 ¥77,100 ¥ 2
Liabilities
Notes and accounts payable ¥ (9,387) ¥ (9,387) —
Total liabilities ¥ (9,387) ¥ (9,387) —
Derivative transactions
Hedge accounting not applied ¥ 660 ¥ 660 —
Total derivative transactions ¥ 660 ¥ 660 —
*Receivables and payables arising from derivative transactions are presented in net amount, with the net liability amount presented in parenthesis.
Notes: 1. Methods to determine the estimated fair value of fi nancial instruments and information related to securities and derivatives
Assets
(1) Cash and deposits and (2) Notes and accounts receivable
The carrying amount approximates fair value due to the short maturities.
(3) Marketable and investment securities
Fair values of equity securities are based on the quoted prices on stock exchanges, and fair values of debt securities are based on the prices quoted by fi nancial
institutions.
Liabilities
(4) Notes and accounts payable
The carrying amount approximates fair value due to the short maturities.
(5) Long-term debt (including current portion of long-term debt)
Long-term debt (including current portion of long-term debt) is calculated based on the present value which is obtained by discounting the total of the principal
and interest by the interest rate assumed in a case where the same loan is newly made.
Derivative transactions
Refer to Note 21, “Derivative Financial Instruments.”
2. Unlisted shares with carrying value of ¥8 million ($78 thousand) and ¥8 million at March 31, 2016 and 2015, respectively, are not included in “(3) Marketable and
investment securities” in the above table as their market value is not readily available. Net realizable values that are below 50% of the acquisition costs are consid-
ered to have “signifi cantly declined,” and impairment loss is recognized unless there is suffi cient evidence for their recoverability. During the years ended March
31, 2016 and 2015, no impairment loss was recognized on unlisted shares.
Investments in affi liates with carrying value of ¥11 million ($103 thousand) and ¥11 million at March 31, 2016 and 2015 are also excluded from the above table
as their market value is not readily available.
3. Redemption schedule of monetary receivables and marketable securities with maturities after March 31, 2016.
Millions of yen
(As of March 31, 2016)Due in one year
or lessDue after one year through fi ve years
Due after fi ve years through ten years
Due after ten years
Cash and deposits ¥19,414 — — —
Notes and accounts receivable 23,021 — — —
Marketable securities
Held-to-maturity
Jointly-managed money trust 25,000 — — —
Commercial paper 4,000 — — —
Total ¥71,436 — — —

Calbee, Inc. Annual Report 2016 61
Thousands of U.S. dollars
(As of March 31, 2016)Due in one year
or lessDue after one year through fi ve years
Due after fi ve years through ten years
Due after ten years
Cash and deposits $172,295 — — —
Notes and accounts receivable 204,311 — — —
Marketable securities
Held-to-maturity
Jointly-managed money trust 221,867 — — —
Commercial paper 35,498 — — —
Total $633,973 — — —
7. Marketable and Investment Securities
(1) The summary of acquisition cost and carrying value of held to maturity and available-for-sale securities as of
March 31, 2016 and 2015 is as follows:
Held-to-maturity
Millions of yen Thousands of U.S. dollars
2016 2016
Carrying amount
Estimated fair value
Unrealized gains (losses)
Carrying amount
Estimated fair value
Unrealized gains (losses)
(Securities with estimated fair value exceeding carrying amount) ¥14,000 ¥14,005 ¥ 5 $124,245 $124,294 $48
Jointly-managed money trust
(Securities with estimated fair value not exceeding carrying amount)
Jointly-managed money trust ¥11,000 ¥11,000 — $ 97,621 $ 97,621 —
Commercial paper 3,999 3,998 ¥(0) 35,490 35,487 $(3)
Total ¥28,999 ¥29,004 ¥5 $257,357 $257,403 $45
Available-for-sale
Millions of yen Thousands of U.S. dollars
2016 2016
Carrying amount
Acquisitioncost
Unrealized gains (losses)
Carrying amount
Acquisitioncost
Unrealized gains (losses)
(Securities with carrying value exceeding acquisition cost)
Equity securities ¥2,052 ¥1,208 ¥843 $18,215 $10,729 $7,486
(Securities with carrying value not exceeding acquisition cost)
Equity securities 22 27 (5) 198 244 (45)
Total ¥2,074 ¥1,236 ¥838 $18,414 $10,973 $7,440
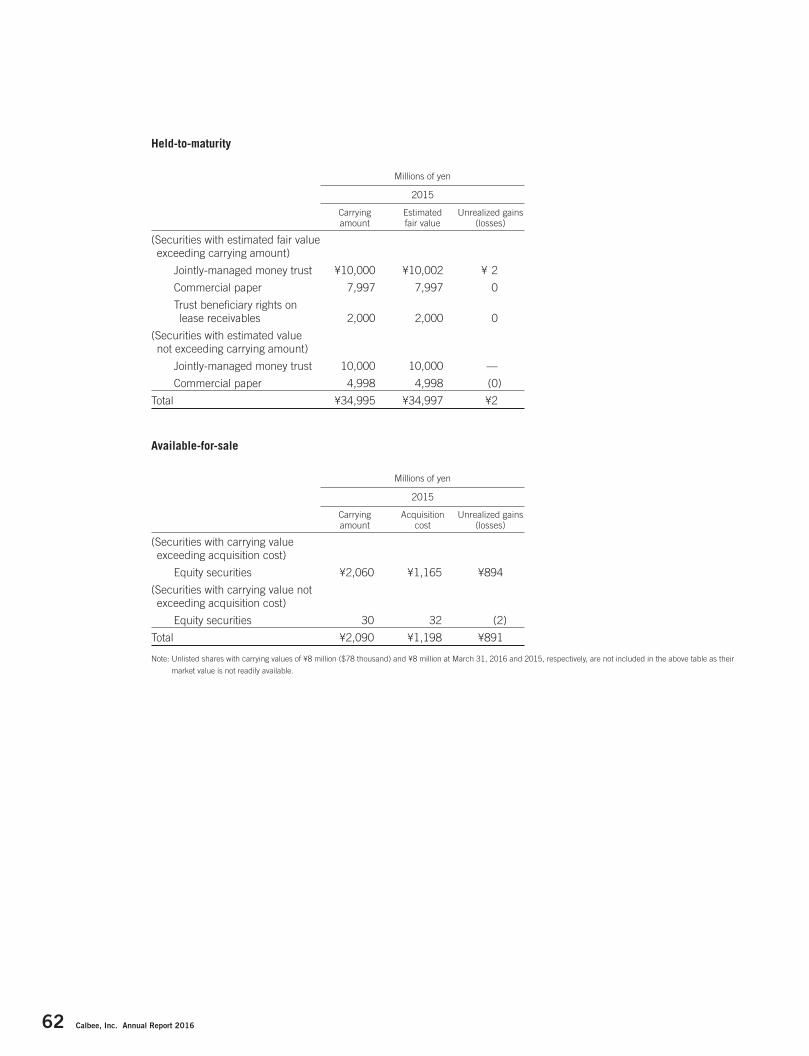
62 Calbee, Inc. Annual Report 2016
Held-to-maturity
Millions of yen
2015
Carrying amount
Estimated fair value
Unrealized gains (losses)
(Securities with estimated fair value exceeding carrying amount)
Jointly-managed money trust ¥10,000 ¥10,002 ¥ 2
Commercial paper 7,997 7,997 0
Trust benefi ciary rights on lease receivables 2,000 2,000 0
(Securities with estimated value not exceeding carrying amount)
Jointly-managed money trust 10,000 10,000 —
Commercial paper 4,998 4,998 (0)
Total ¥34,995 ¥34,997 ¥2
Available-for-sale
Millions of yen
2015
Carrying amount
Acquisitioncost
Unrealized gains (losses)
(Securities with carrying value exceeding acquisition cost)
Equity securities ¥2,060 ¥1,165 ¥894
(Securities with carrying value not exceeding acquisition cost)
Equity securities 30 32 (2)
Total ¥2,090 ¥1,198 ¥891
Note: Unlisted shares with carrying values of ¥8 million ($78 thousand) and ¥8 million at March 31, 2016 and 2015, respectively, are not included in the above table as their
market value is not readily available.

Calbee, Inc. Annual Report 2016 63
(2) Sales of available-for-sale securities
Information on the available-for-sale securities sold during the year ended March 31, 2016 and 2015 is as follows:
Millions of yen Thousands of U.S. dollars
2016 2016
ProceedsRealized
gainsRealized losses Proceeds
Realized gains
Realized losses
Equity securities ¥24 ¥24 — $217 $217 —
Millions of yen
2015
ProceedsRealized
gainsRealized losses
Equity securities ¥18 ¥10 —
(3) Impairment loss on available-for-sale securities
The Company recognizes impairment loss for the full amount of securities when the fair value declines below 50%
of the acquisition cost, and for amounts deemed necessary after consideration of recoverability when the fair value
declines by 30 to 50% of the acquisition cost. During the years ended March 31, 2016 and 2015, impairment loss
recognized on equity securities classifi ed as available-for-sale securities amounted to nil.
8. Inventories
Inventories at March 31, 2016 and 2015 consisted of the following:
Millions of yenThousands of U.S. dollars
2016 2015 2016
Finished goods and commercial goods ¥3,473 ¥2,601 $30,824
Work in process 1,340 1,429 11,896
Raw materials and supplies 4,454 4,005 39,533
¥9,268 ¥8,037 $82,254
Valuation losses due to declines in profi tability included in cost of sales for the years ended March 31, 2016 and
2015 were ¥98 million ($873 thousand) and ¥242 million, respectively.

64 Calbee, Inc. Annual Report 2016
9. Short-Term Borrowings and Long-Term Debt
(1) The outstanding balance of short-term borrowings, long-term debt, lease obligations and other interest-bearing
liabilities as of March 31, 2016 and 2015 are as follows:
Millions of yenThousands of U.S. dollars Average interest rate
2016 2015 2016 2016 2015
Short-term borrowings — ¥402 — — 2.0%
Current portion of long-term debt ¥ 52 — $ 464 2.4% —
Current portion of lease obligations 64 52 570 — —
Long-term debt, excluding current portion 313 — 2,785 2.4 —
Lease obligations, excluding current portion 93 76 830 — —
Other interest-bearing liabilities 31 31 279 1.6 1.5
Total ¥555 ¥563 $4,930
Note: “Average interest rate” represents the weighted average interest rate on the respective ending balance. The average interest rate for lease obligations is not disclosed as
lease obligations include the interest component of the lease payments and it is not practicable to calculate average interest rate.
The aggregate annual maturities of long-term debt and lease obligations are summarized below:
Millions of yenThousands of U.S. dollars Millions of yen
Thousands of U.S. dollars
Years ending March 31, Long-term debt Lease obligations
2017 ¥ 52 $464 ¥64 $570
2018 52 464 38 341
2019 52 464 19 171
2020 52 464 13 123
2021 52 464 12 111
2022 and thereafter 104 928 9 83
10. Income Taxes
The Company and its domestic consolidated subsidiaries are subject to several types of taxes: corporate tax, local
inhabitant taxes and enterprise taxes, which in the aggregate resulted in a statutory tax rate of approximately 32.8%
and 35.4% for the fi scal years ended March 31, 2016 and 2015, respectively. Overseas subsidiaries are subject to
income and other taxes of the respective countries in which they operate.

Calbee, Inc. Annual Report 2016 65
A reconciliation of the statutory tax rate to the effective tax rates for the years ended March 31, 2016 and 2015 is
as follows:
2016 2015
Statutory tax rate 32.8% 35.4%
Adjustments:
Entertainment and other permanently non-deductible expenses 0.3 0.8
Dividend and other permanently non-taxable income (0.0) (0.0)
Special tax credit for income tax (1.7) (1.6)
Per capita inhabitant tax 0.3 0.4
Adjustment to deferred tax assets and liabilities from changes in the statutory tax rate 0.7 1.2
Changes in valuation allowances (1.9) 2.8
Tax rate differences in consolidated subsidiaries (1.0) (1.0)
Effect of consolidation adjustments 1.3 0.8
Others 0.1 (0.4)
Effective tax rates 31.0% 38.4%
Signifi cant components of deferred tax assets and liabilities as of March 31, 2016 and 2015 are as follows:
Millions of yenThousands of U.S. dollars
2016 2015 2016
Deferred tax assets:
Allowance for doubtful accounts ¥ 25 ¥ 27 $ 224
Provision for bonuses 1,265 1,190 11,231
Accrued expenses 1,012 1,002 8,986
Enterprise tax payable 307 381 2,726
Provision for employees’ stock payments 20 27 177
Provision for directors’ stock payments 36 42 327
Net defi ned benefi t liability 1,795 1,584 15,938
Provision for directors’ retirement benefi ts 194 190 1,728
Share-based payment expense 4 8 40
Depreciation 109 112 968
Impairment loss 250 119 2,219
Asset retirement obligations 206 210 1,835
Loss carried forward 244 512 2,173
Others 678 315 6,023
Subtotal 6,152 5,726 54,603
Less valuation allowances (496) (956) (4,408)
Total deferred tax assets 5,655 4,769 50,194
Deferred tax liabilities:
Unrealized holding gain on securities (251) (274) (2,234)
Deferred gains on property, plant and equipment (519) (521) (4,611)
Asset retirement obligations (30) (37) (270)
Others (780) (321) (6,927)
Total deferred tax liabilities (1,582) (1,154) (14,043)
Net deferred tax assets ¥4,073 ¥3,615 $36,151

66 Calbee, Inc. Annual Report 2016
Net deferred tax assets are included in the consolidated balance sheets as of March 31, 2016 and 2015 as follows:
Millions of yenThousands of U.S. dollars
2016 2015 2016
Current assets—deferred tax assets: ¥2,625 ¥2,640 $23,297
Investments and other assets—deferred tax assets: 2,004 1,347 17,786
Current liabilities—deferred tax liabilities (1) — (17)
Non-current liabilities—deferred tax liabilities (553) (373) (4,915)
Net deferred tax assets ¥4,073 ¥3,615 $36,151
With the Japanese Diet’s enactment of The Act for Partial Revision of the Income Tax Act, etc., and The Act for
Partial Revision of the Local Tax Act on March 29, 2016, the statutory tax rate used for the calculation of deferred
tax assets and deferred tax liabilities (limited to settlements made on or after April 1, 2016) will change from 32.8%
to 30.7% between April 1, 2016 and March 31, 2018, and to 30.5% after April 1, 2018 for temporary differences
expected to be realized or settled.
As a result, deferred tax assets (after offsetting deferred tax liabilities) decreased by ¥211 million ($1,876 thou-
sand), income taxes-deferred increased ¥194 million ($1,728 thousand), unrealized holding loss on securities
increased by ¥11 million ($105 thousand) and remeasurements of defi ned benefi t plans decreased by ¥28 million
($253 thousand) as of and for the year ended March 31, 2016.
11. Net Assets
(1) Movements of number of common stock issued and outstanding during the years ended March 31, 2016 and 2015
are as follows:
Number of shares
2016 2015
Balance at beginning of year 133,629,800 133,507,800
Increase 140,000 122,000
Decrease — —
Balance at end of year 133,769,800 133,629,800
Notes: The breakdown of the increase during the year ended March 31, 2016 is as follows:
Increase due to an exercise of subscription rights 140,000 shares
The breakdown of the increase during the year ended March 31, 2015 is as follows:
Increase due to an exercise of subscription rights 122,000 shares

Calbee, Inc. Annual Report 2016 67
(2) Movements of number of treasury stock during the years ended March 31, 2016 and 2015 are as follows:
Number of shares
2016 2015
Balance at beginning of year 228,132 104,232
Increase — 128,800
Decrease (34,680) (4,900)
Balance at end of year 193,452 228,132
Notes: The breakdown of the increase and decrease during the year ended March 31, 2016 is as follows:
Decrease due to issuance of treasury shares by the trust 34,680 shares
The breakdown of the increase during the year ended March 31, 2015 is as follows:
Increase due to an acquisition of treasury shares by the trust 128,800 shares
Decrease due to issuance of treasury shares by the trust 4,900 shares
(3) As of March 31, 2016 and 2015, the outstanding balance of subscription rights provided for as stock options was
¥15 million ($133 thousand) and ¥25 million, respectively.
(4) Cash dividends
The following appropriation of retained earnings at March 31, 2016 and 2015 was approved at the annual meetings
of the Company’s shareholders held on June 22, 2016 and June 25, 2015, respectively.
Millions of yenThousands of U.S. dollars
2016 2015 2016
Cash dividends ¥4,681 ¥3,741 $41,550
Cash dividends attributable to the year ended March 31, 2015 of ¥3,741 million ($33,205 thousand) were paid
during the year ended March 31, 2016 in accordance with the resolution at the annual meeting of the Company’s
shareholders held on June 25, 2015.
Amount of total dividends paid to shares held by the Company in trust in 2016 and 2015 is ¥6 million ($59 thou-
sand) and ¥6 million, respectively.
12. Retirement Benefi ts for Employees
The Company and its 2 domestic consolidated subsidiaries have corporate pension plans and lump-sum payment
plans that are multi-employer plans as defi ned benefi t pension plans. Other domestic consolidated subsidiaries and
certain foreign consolidated subsidiaries have only lump-sum payment plans. The Company adopts defi ned contri-
bution pension plans and prepaid retirement allowance plans.
Charges for net defi ned benefi t liability and retirement benefi t expenses for a portion of the Company’s retirement
benefi t plans, the defi ned benefi t pension plans for consolidated subsidiaries and the retirement lump-sum
payment plans are calculated using the simplifi ed accounting method.
Notes relating to retirement benefi ts based on defi ned benefi t plans include the portion related to multi-employer plans.
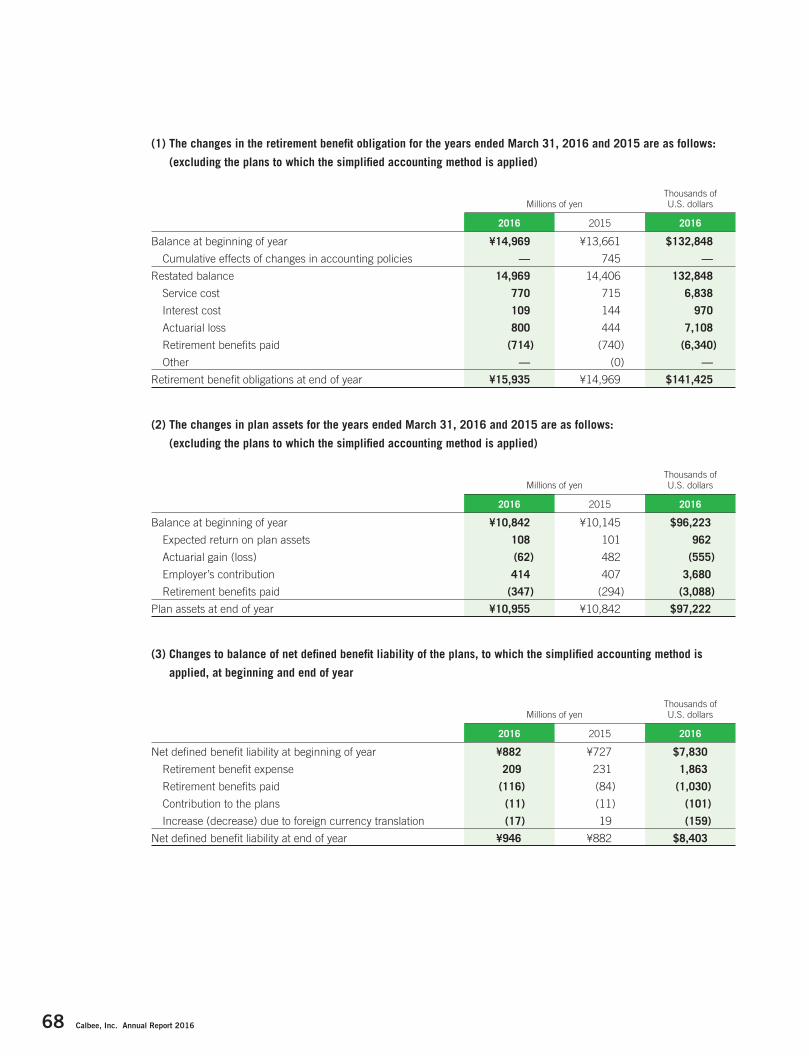
68 Calbee, Inc. Annual Report 2016
(1) The changes in the retirement benefi t obligation for the years ended March 31, 2016 and 2015 are as follows:
(excluding the plans to which the simplifi ed accounting method is applied)
Millions of yenThousands of U.S. dollars
2016 2015 2016
Balance at beginning of year ¥14,969 ¥13,661 $132,848
Cumulative effects of changes in accounting policies — 745 —
Restated balance 14,969 14,406 132,848
Service cost 770 715 6,838
Interest cost 109 144 970
Actuarial loss 800 444 7,108
Retirement benefi ts paid (714) (740) (6,340)
Other — (0) —
Retirement benefi t obligations at end of year ¥15,935 ¥14,969 $141,425
(2) The changes in plan assets for the years ended March 31, 2016 and 2015 are as follows:
(excluding the plans to which the simplifi ed accounting method is applied)
Millions of yenThousands of U.S. dollars
2016 2015 2016
Balance at beginning of year ¥10,842 ¥10,145 $96,223
Expected return on plan assets 108 101 962
Actuarial gain (loss) (62) 482 (555)
Employer’s contribution 414 407 3,680
Retirement benefi ts paid (347) (294) (3,088)
Plan assets at end of year ¥10,955 ¥10,842 $97,222
(3) Changes to balance of net defi ned benefi t liability of the plans, to which the simplifi ed accounting method is
applied, at beginning and end of year
Millions of yenThousands of U.S. dollars
2016 2015 2016
Net defi ned benefi t liability at beginning of year ¥882 ¥727 $7,830
Retirement benefi t expense 209 231 1,863
Retirement benefi ts paid (116) (84) (1,030)
Contribution to the plans (11) (11) (101)
Increase (decrease) due to foreign currency translation (17) 19 (159)
Net defi ned benefi t liability at end of year ¥946 ¥882 $8,403
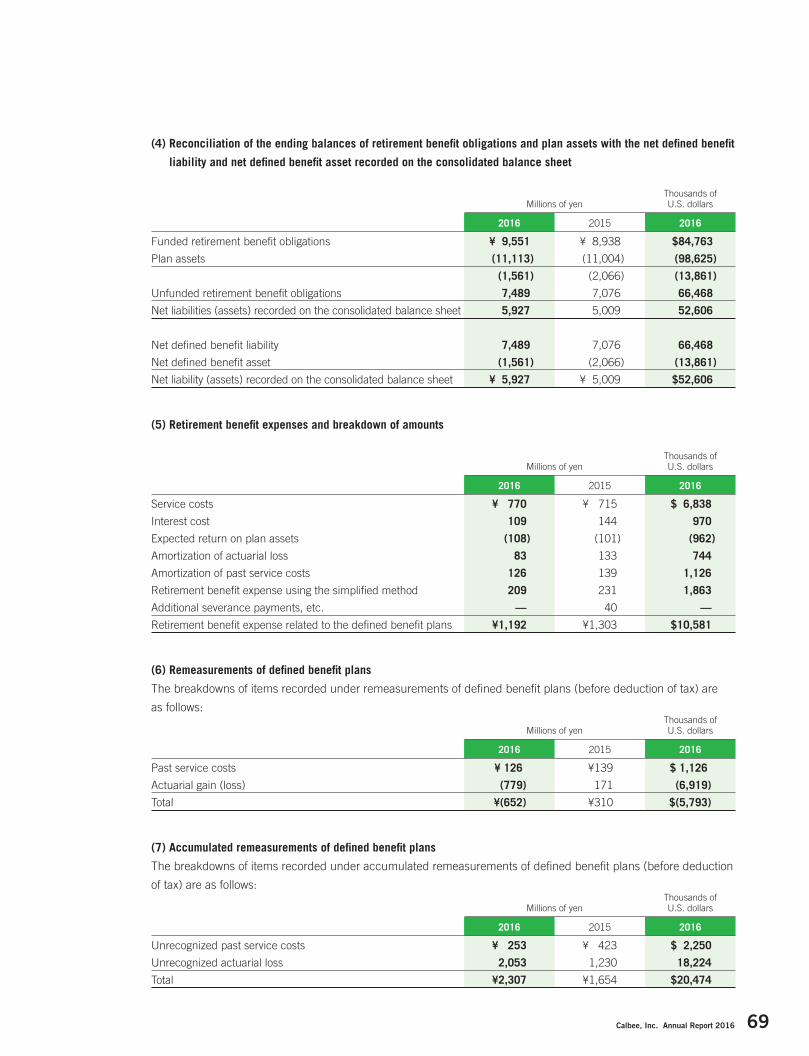
Calbee, Inc. Annual Report 2016 69
(4) Reconciliation of the ending balances of retirement benefi t obligations and plan assets with the net defi ned benefi t
liability and net defi ned benefi t asset recorded on the consolidated balance sheet
Millions of yenThousands of U.S. dollars
2016 2015 2016
Funded retirement benefi t obligations ¥ 9,551 ¥ 8,938 $84,763
Plan assets (11,113) (11,004) (98,625)
(1,561) (2,066) (13,861)
Unfunded retirement benefi t obligations 7,489 7,076 66,468
Net liabilities (assets) recorded on the consolidated balance sheet 5,927 5,009 52,606
Net defi ned benefi t liability 7,489 7,076 66,468
Net defi ned benefi t asset (1,561) (2,066) (13,861)
Net liability (assets) recorded on the consolidated balance sheet ¥ 5,927 ¥ 5,009 $52,606
(5) Retirement benefi t expenses and breakdown of amounts
Millions of yenThousands of U.S. dollars
2016 2015 2016
Service costs ¥ 770 ¥ 715 $ 6,838
Interest cost 109 144 970
Expected return on plan assets (108) (101) (962)
Amortization of actuarial loss 83 133 744
Amortization of past service costs 126 139 1,126
Retirement benefi t expense using the simplifi ed method 209 231 1,863
Additional severance payments, etc. — 40 —
Retirement benefi t expense related to the defi ned benefi t plans ¥1,192 ¥1,303 $10,581
(6) Remeasurements of defi ned benefi t plans
The breakdowns of items recorded under remeasurements of defi ned benefi t plans (before deduction of tax) are
as follows:
Millions of yenThousands of U.S. dollars
2016 2015 2016
Past service costs ¥ 126 ¥139 $ 1,126
Actuarial gain (loss) (779) 171 (6,919)
Total ¥(652) ¥310 $(5,793)
(7) Accumulated remeasurements of defi ned benefi t plans
The breakdowns of items recorded under accumulated remeasurements of defi ned benefi t plans (before deduction
of tax) are as follows:
Millions of yenThousands of U.S. dollars
2016 2015 2016
Unrecognized past service costs ¥ 253 ¥ 423 $ 2,250
Unrecognized actuarial loss 2,053 1,230 18,224
Total ¥2,307 ¥1,654 $20,474

70 Calbee, Inc. Annual Report 2016
(8) Items related to plan assets
(a) Breakdown of main items
Allocation of main plan asset items comprising the total is as follows:
2016 2015
Domestic bonds 32.9% 24.1%
Domestic equity 8.3 18.0
Foreign bonds — 10.4
Foreign equity 10.2 17.7
Alternative investments* 31.8 13.1
General life insurance accounts 14.0 13.8
Other 2.8 2.9
Total 100.0% 100.0%
* Alternative investments are mainly managed by the investment advisory company with the deposits of investment fund.
(b) Method for determining the long-term expected rate of return
In determining the long-term expected rate of return, conservative estimates are made of the assumed interest rate
for the corporate pension, the current and expected allocation of plan assets, and the current and future long-term
expected rate of return from the various assets that compose the plan assets.
(9) Items related to actuarial calculations
Main components used in actuarial calculations are as follows:
2016 2015
Discount rate 0.4% 0.7%
Long-term expected rate of return 1.0 1.0
Estimated salary increase rate 4.9 5.1
The amounts of required contributions to the defi ned contribution plans of the Company and consolidated subsidiaries
for the years ended March 31, 2016 and 2015 were ¥200 million ($1,780 thousand) and ¥116 million, respectively.
13. Contingent Liabilities
Contingent liabilities for the years ended March 31, 2016 and 2015 are as follows:
Millions of yenThousands of U.S. dollars
2016 2015 2016
Trade notes discounted ¥— ¥434 $—
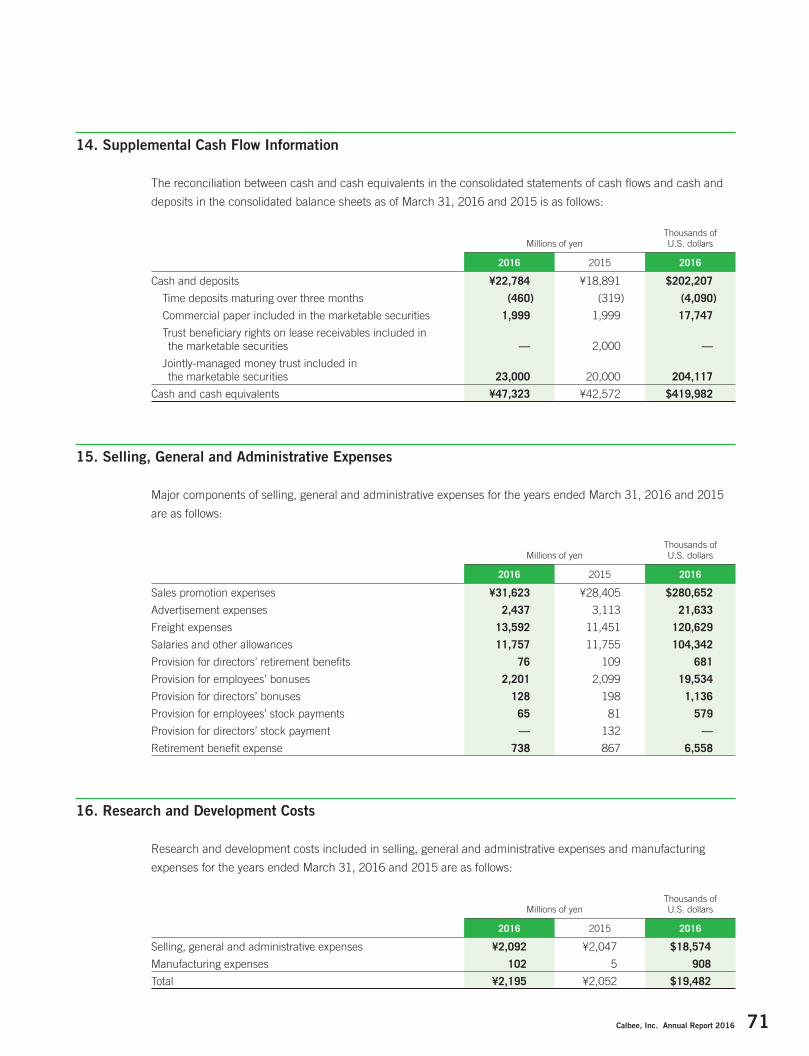
Calbee, Inc. Annual Report 2016 71
14. Supplemental Cash Flow Information
The reconciliation between cash and cash equivalents in the consolidated statements of cash fl ows and cash and
deposits in the consolidated balance sheets as of March 31, 2016 and 2015 is as follows:
Millions of yenThousands of U.S. dollars
2016 2015 2016
Cash and deposits ¥22,784 ¥18,891 $202,207
Time deposits maturing over three months (460) (319) (4,090)
Commercial paper included in the marketable securities 1,999 1,999 17,747
Trust benefi ciary rights on lease receivables included in the marketable securities — 2,000 —
Jointly-managed money trust included in the marketable securities 23,000 20,000 204,117
Cash and cash equivalents ¥47,323 ¥42,572 $419,982
15. Selling, General and Administrative Expenses
Major components of selling, general and administrative expenses for the years ended March 31, 2016 and 2015
are as follows:
Millions of yenThousands of U.S. dollars
2016 2015 2016
Sales promotion expenses ¥31,623 ¥28,405 $280,652
Advertisement expenses 2,437 3,113 21,633
Freight expenses 13,592 11,451 120,629
Salaries and other allowances 11,757 11,755 104,342
Provision for directors’ retirement benefi ts 76 109 681
Provision for employees’ bonuses 2,201 2,099 19,534
Provision for directors’ bonuses 128 198 1,136
Provision for employees’ stock payments 65 81 579
Provision for directors’ stock payment — 132 —
Retirement benefi t expense 738 867 6,558
16. Research and Development Costs
Research and development costs included in selling, general and administrative expenses and manufacturing
expenses for the years ended March 31, 2016 and 2015 are as follows:
Millions of yenThousands of U.S. dollars
2016 2015 2016
Selling, general and administrative expenses ¥2,092 ¥2,047 $18,574
Manufacturing expenses 102 5 908
Total ¥2,195 ¥2,052 $19,482

72 Calbee, Inc. Annual Report 2016
17. Sale and Disposal of Property, Plant and Equipment
Gain on sales of property, plants and equipment for the years ended March 31, 2016 and 2015 is as follows:
Millions of yenThousands of U.S. dollars
2016 2015 2016
Machinery and vehicles ¥6 ¥ 7 $58
Other 0 — 1
Total ¥6 ¥ 7 $60
Loss on sales of property, plant and equipment for the years ended March 31, 2016 and 2015 is as follows:
Millions of yenThousands of U.S. dollars
2016 2015 2016
Buildings and structures ¥— ¥178 $ —
Machinery and vehicles 3 5 31
Land — 46 —
Other 0 0 3
Total ¥ 3 ¥229 $35
Loss on disposal of property, plant and equipment for the years ended March 31, 2016 and 2015 is as follows:
Millions of yenThousands of U.S. dollars
2016 2015 2016
Buildings and structures ¥ 41 ¥ 62 $ 370
Machinery and vehicles 171 117 1,521
Construction in progress 5 115 49
Other 8 4 73
Total ¥227 ¥300 $2,015
18. Impairment Loss
For the year ended March 31, 2016, the Company recognized impairment loss of ¥594 million ($5,274 thousand)
on the idle assets for which there is no intended to use in the future and whose market values signifi cantly
declined. With regard to shops, the Company has reduced the book value to the recoverable amount, since the
Company decided to close those shops.
For the year ended March 31, 2015, the Company recognized impairment loss of ¥836 million on property, plant
and equipment. With regard to the plant, the Company has reduced the book value to the recoverable amount,
since the plant has recorded operating loss continuously and the estimated aggregated value of future cash fl ows is
lower than the carrying amounts of each asset. With regard to manufacturing equipment, the Company has
reduced the book value to the recoverable amount, since the Company decided to discontinue the production and
there is no plan to utilize these assets in future. With regard to shops, the Company has reduced the book value to
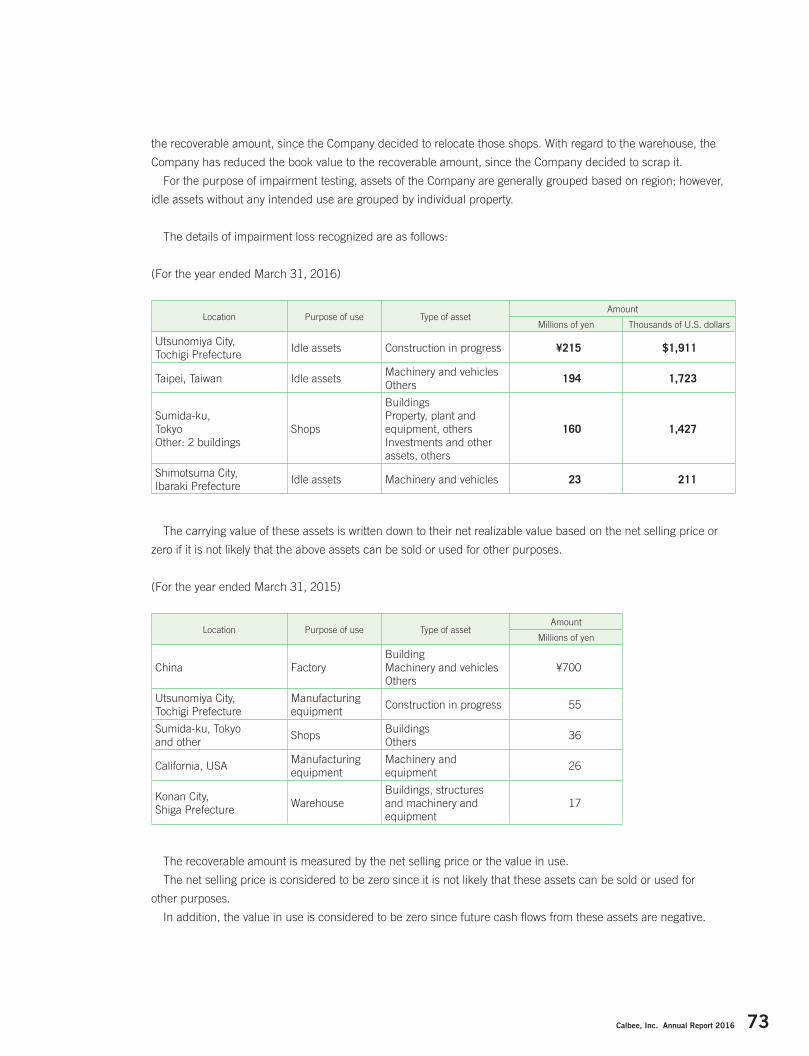
Calbee, Inc. Annual Report 2016 73
the recoverable amount, since the Company decided to relocate those shops. With regard to the warehouse, the
Company has reduced the book value to the recoverable amount, since the Company decided to scrap it.
For the purpose of impairment testing, assets of the Company are generally grouped based on region; however,
idle assets without any intended use are grouped by individual property.
The details of impairment loss recognized are as follows:
(For the year ended March 31, 2016)
Location Purpose of use Type of assetAmount
Millions of yen Thousands of U.S. dollars
Utsunomiya City, Tochigi Prefecture
Idle assets Construction in progress ¥215 $1,911
Taipei, Taiwan Idle assetsMachinery and vehicles Others
194 1,723
Sumida-ku, TokyoOther: 2 buildings
Shops
Buildings Property, plant and equipment, others Investments and other assets, others
160 1,427
Shimotsuma City,Ibaraki Prefecture
Idle assets Machinery and vehicles 23 211
The carrying value of these assets is written down to their net realizable value based on the net selling price or
zero if it is not likely that the above assets can be sold or used for other purposes.
(For the year ended March 31, 2015)
Location Purpose of use Type of assetAmount
Millions of yen
China FactoryBuilding Machinery and vehiclesOthers
¥700
Utsunomiya City, Tochigi Prefecture
Manufacturing equipment
Construction in progress 55
Sumida-ku, Tokyo and other
ShopsBuildingsOthers
36
California, USAManufacturing equipment
Machinery and equipment
26
Konan City, Shiga Prefecture
WarehouseBuildings, structuresand machinery and equipment
17
The recoverable amount is measured by the net selling price or the value in use.
The net selling price is considered to be zero since it is not likely that these assets can be sold or used for
other purposes.
In addition, the value in use is considered to be zero since future cash fl ows from these assets are negative.

74 Calbee, Inc. Annual Report 2016
19. Other Comprehensive Income
Reclassifi cation adjustments and tax effects related to other comprehensive income for the years ended March 31,
2016 and 2015 are as follows:
Millions of yenThousands of U.S. dollars
2016 2015 2016
Other comprehensive income
Unrealized holding gain (loss) on securities
Amount during the year ¥ 363 ¥ 579 $ 3,230
Reclassifi cation adjustments (395) (10) (3,505)
Amount before tax effects (31) 568 (275)
Tax effects 22 (161) 200
Total ¥ (8) ¥ 406 $ (74)
Foreign currency translation adjustments
Amount during the year ¥(2,565) ¥2,521 $(22,764)
Reclassifi cation adjustments 311 — 2,765
Amount before tax effects (2,253) 2,521 (19,998)
Tax effects — — —
Total ¥(2,253) ¥2,521 $(19,998)
Remeasurements of defi ned benefi t plans
Amount during the year ¥ (863) ¥ 37 $ (7,663)
Reclassifi cation adjustments 210 273 1,870
Amount before tax effects (652) 310 (5,793)
Tax effects 184 (161) 1,635
Total ¥ (468) ¥ 149 $ (4,157)
Total ¥(2,730) ¥3,076 $(24,231)
20. Leases
Future minimum lease payments subsequent to March 31, 2016 and 2015 for operating leases are summarized
as follows:
Millions of yenThousands of U.S. dollars
2016 2015 2016
Due in 1 year or less ¥14 ¥10 $125
Due over 1 year 39 19 354
Total ¥54 ¥29 $479

Calbee, Inc. Annual Report 2016 75
Leased assets under fi nance lease transactions contracted prior to April 1, 2008 that do not involve the transfer
of ownership are accounted for in a similar manner as operating leases. Had these leases been accounted for
under the accounting treatment for fi nance leases, the acquisition cost, accumulated depreciation and net book
value would have been as follows:
Millions of yen Thousands of U.S. dollars
2016 2016
Leased assetsAcquisition
costAccumulated depreciation
Net bookvalue
Acquisitioncost
Accumulated depreciation
Net bookvalue
Other ¥7 ¥7 ¥0 $67 $65 $1
Total ¥7 ¥7 ¥0 $67 $65 $1
Millions of yen
2015
Leased assetsAcquisition
costAccumulated depreciation
Net bookvalue
Other ¥24 ¥23 ¥ 1
Total ¥24 ¥23 ¥ 1
Future minimum lease obligations under fi nance lease transactions subsequent to March 31, 2016 and 2015 are
as follows:
Millions of yenThousands of U.S. dollars
2016 2015 2016
Due in 1 year or less ¥ 0 ¥ 1 $ 1
Due over 1 year — 0 —
Total ¥ 0 ¥ 1 $ 1
Lease payments for the years ended March 31, 2016 and 2015 are ¥1 million ($10 thousand) and ¥13 million,
respectively.

76 Calbee, Inc. Annual Report 2016
21. Derivative Financial Instruments
Information on derivative transactions of the Company that do not meet the criteria for hedge accounting as of
March 31, 2016 and 2015 is as follows:
Millions of yen
2016
Contract amount
Maturity over one year Fair value
Revaluation gain/loss
Non-exchange transactions
Forward foreign exchange contracts
Sell
USD ¥3,127 — ¥207 ¥207
Buy
USD 4,838 ¥2,515 (37) (37)
Total ¥7,966 ¥2,515 ¥169 ¥169
Thousands of U.S. dollars
2016
Contract amount
Maturity over one year Fair value
Revaluation gain/loss
Non-exchange transactions
Forward foreign exchange contracts
Sell
USD $27,758 — $1,842 $1,842
Buy
USD 42,943 $22,324 (336) (336)
Total $70,702 $22,324 $1,505 $1,505
Millions of yen
2015
Contract amount
Maturity over one year Fair value
Revaluation gain/loss
Non-exchange transactions
Forward foreign exchange contracts
Sell
USD ¥ 3,304 — ¥ (39) ¥ (39)
Buy
USD 6,124 ¥2,323 697 697
GBP 312 — 3 3
SGD 344 — (0) (0)
Total ¥10,085 ¥2,323 ¥660 ¥660
* Fair value is determined based on the price provided by the fi nancial institutions that are counterparties to the transactions.

Calbee, Inc. Annual Report 2016 77
22. Business Combinations
No applicable items
23. Stock Options
As of March 31, 2016, the Company has the following stock option programs.
Date of resolution June 24, 2009
Type and number of eligible persons
[The Company]Directors: 2
Statutory auditor: 1Employees: 14
[the Company’s subsidiaries]Directors: 2
Class and number of shares to be granted Common stock: 1,600,000 shares (Note 1)
Grant date June 30, 2009
Vesting requirement —
Vesting period —
Exercise period From July 1, 2009 to June 30, 2019 (Note 2)
Notes: 1. Number of shares in the above table refl ects the 50-for-1 share split executed on January 14, 2011 and the 4-for-1 share split executed on October 1, 2013.
2. The exercise period was revised at the extraordinary shareholders’ meeting held on January 14, 2011.
(1) Number and price information
(As of March 31, 2016)
Date of resolutionShares
June 24, 2009
Unvested stock options
Outstanding as of March 31, 2015 —
Granted —
Expired —
Vested —
Outstanding as of March 31, 2016 —
Vested stock options
Outstanding as of March 31, 2015 340,000
Vested —
Exercised 140,000
Expired —
Outstanding as of March 31, 2016 200,000
Note: Number of shares in the above table refl ects the 50-for-1 share split executed on January 14, 2011 and the 4-for-1 share split executed on October 1, 2013.
Yen U.S. dollars
Date of resolution June 24, 2009
Exercise price ¥ 400 $ 3.54
Average stock price at exercise 4,546 40.34
Fair value at grant date 75 0.66
Note: Exercise price in the above table refl ects the 50-for-1 share split executed on January 14, 2011 and the 4-for-1 share split executed on October 1, 2013.

78 Calbee, Inc. Annual Report 2016
(2) Estimate of fair value of stock option
The fair value of the stock options granted on June 30, 2009 is estimated using the intrinsic value per unit based
on the price calculated under the net asset value method and benchmark companies’ analysis, as the Company
was not a public company at the time of the grant.
(3) Estimate of number of vested stock options
Number of options to expire in the future cannot be reasonably estimated. Accordingly, only the actual number of
expired options is refl ected.
(4) Intrinsic value of stock option
Yen U.S. dollars
Total intrinsic value at March 31, 2016 ¥814,000,000 $7,223,997
Total intrinsic value on the exercise date of the stock options exercised in the year ended March 31, 2016 ¥576,140,000 $5,113,063
24. Related Party Transactions
The following summarizes related party transactions for the years ended March 31, 2016 and 2015.
(1) For the year ended March 31, 2016
Offi cers and individual major shareholders
Nature of related party Name Description of business or occupation
Ownership ratio of voting rights
Description of transaction
Transaction volume (Note 1)
Offi cer and his/her close family member
Akira Matsumoto
Chairman of the board & CEO Representative Director of the Company
Direct 0.03%Exercise of subscription rights (Note 2)
¥24 million($212 thousand)
Notes 1: The above amounts do not include consumption taxes.
2: The exercise of stock options granted by resolution at the ordinary shareholders’ meeting held on June 24, 2009, pursuant to Article 236, 238 and 239 of the Com-
panies Act. The transaction volume is calculated by multiplying the number of shares issued as a result of exercise of the option by the amount paid upon exercise.
(2) For the year ended March 31, 2015
Offi cers and individual major shareholders
Nature of related party Name Description of business or occupation
Ownership ratio of voting rights
Description of transaction
Transaction volume (Note 1)
Offi cer and his/her close family member
Shuji ItoPresident & COO, Representative Director of the Company
Direct0.05%
Exercise of subscription rights (Note 2)
¥20 million
Notes 1: The above amounts do not include consumption taxes.
2: The exercise of stock options granted by resolution at the ordinary shareholders’ meeting held on June 24, 2009, pursuant to Article 236, 238 and 239 of the Com-
panies Act. The transaction volume is calculated by multiplying the number of shares issued as a result of exercise of the option by the amount paid upon exercise.

Calbee, Inc. Annual Report 2016 79
25. Per Share Information
Per share information as of March 31, 2016 and 2015 and for the years then ended is as follows:
Yen U.S. dollars
2016 2015 2016
Net assets per share ¥905.20 ¥821.97 $8.03
Net income per share
Basic ¥125.88 ¥105.82 $1.11
Diluted ¥125.64 ¥105.54 $1.11
Basis for calculation of net assets per share is as follows:
Millions of yenThousands of U.S. dollars
2016 2015 2016
Total net assets ¥131,469 ¥118,800 $1,166,752
Net assets attributable to common stock ¥120,912 ¥109,652 $1,073,064
Major components of the difference
Subscription rights ¥ 15 ¥ 25 $ 133
Non-controlling interests ¥ 10,541 ¥ 9,122 $ 93,555
Number of shares
2016 2015
Number of common stock issued and outstanding 133,769,800 133,629,800
Treasury stock of common stock 193,452 228,132
Number of common shares used in calculation of net assets per share 133,576,348 133,401,668
Basis for calculation of net income per share is as follows:
Millions of yenThousands of U.S. dollars
2016 2015 2016
Basis for calculation of net income per share
Net income attributable to owners of parent ¥16,799 ¥14,114 $149,086
Net income attributable to owners of parent attributable to common stock ¥16,799 ¥14,114 $149,086
Net income attributable to owners of parent to common stock — — —
Number of shares
2016 2015
Average number of shares outstanding during the year 133,452,595 133,392,045

80 Calbee, Inc. Annual Report 2016
Millions of yenThousands of U.S. dollars
2016 2015 2016
Major dilutive factors included in calculating diluted net income per share
Adjustments to net income attributable to owners of parent ¥— ¥— $—
Number of shares
2016 2015
Subscription rights 251,478 348,982
Increase in number of common stock 251,478 348,982
Notes: 1. The Company’s own stock in the trust recorded as treasury stock under shareholders’ equity includes treasury shares excluded from the average number of
shares during the period used for calculating net income per share and treasury shares excluded from the number of shares outstanding at the end of the fi scal
year used for calculating net assets per share.
204,036 treasury shares (183,756 shares in 2015) were excluded from the average number of shares during the year used for calculating net income per share
for the year ended March 31, 2016 and 192,620 treasury shares (227,300 shares in 2015) were excluded from the number of shares outstanding used for calcu-
lating net assets per share at March 31, 2016.
2: As stated in “Changes in accounting principles,” the Accounting Standard for Business Combinations have been applied.
As a result, net assets per share, net income per share and net income per share (diluted) as of and for the year ended March 31, 2016 decreased by ¥0.05
($0.00), ¥0.02 ($0.00) and ¥0.02 ($0.00), respectively.
26. Segment Information
For the years ended March 31, 2016 and 2015, information on operating segments is not disclosed as the
Company has only one reporting segment, “Production and sale of snacks and other foods.”
[Related information]
(1) Sales by product and service
Millions of yen
2016
Snacks Other foods Other Total
Sales to third parties ¥204,842 ¥38,036 ¥3,249 ¥246,129
Thousands of U.S. dollars
2016
Snacks Other foods Other Total
Sales to third parties $1,817,914 $337,563 $28,841 $2,184,319
Millions of yen
2015
Snacks Other foods Other Total
Sales to third parties ¥190,069 ¥28,830 ¥3,250 ¥222,150

Calbee, Inc. Annual Report 2016 81
(2) Information by region
Information about sales by region is as follows:
Millions of yen
2016
Japan America China Others Total
Sales ¥216,807 ¥12,517 ¥1,909 ¥14,894 ¥246,129
Thousands of U.S. dollars
2016
Japan America China Others Total
Sales $1,924,098 $111,091 $16,943 $132,186 $2,184,319
Millions of yen
2015
Japan America China Others Total
Sales ¥199,709 ¥9,668 ¥2,227 ¥10,544 ¥222,150
Information about property, plant and equipment by region is as follows:
Millions of yen
2016
Japan America China Others Total
Property, plant and equipment ¥51,292 ¥9,408 ¥585 ¥8,873 ¥70,159
Thousands of U.S. dollars
2016
Japan America China Others Total
Property, plant and equipment $455,209 83,496 $5,195 $78,745 $622,646
Millions of yen
2015
Japan America China Others Total
Property, plant and equipment ¥44,915 ¥7,274 ¥753 ¥6,811 ¥59,754

82 Calbee, Inc. Annual Report 2016
(3) Sales by major customers
Millions of yenThousands of U.S. dollars
Reported segment 2016 2015 2016
CONFEX CO., LTD. Production and sale of snacks and other foods ¥28,105 ¥25,856 $249,424
YAMABOSHIYA Co., Ltd. Production and sale of snacks and other foods 26,352 27,065 233,873
Mitsubishi Shokuhin Co., Ltd Production and sale of snacks and other foods 26,324 24,231 233,622
(4) Impairment loss on fi xed assets by reporting segment
Millions of yen
2016
Reporting segment
Production and sale of snacks and
other foods Total OtherCorporate / elimination Total
Impairment loss ¥594 ¥594 — — ¥594
Thousands of U.S. dollars
2016
Reporting segment
Production and sale of snacks and
other foods Total OtherCorporate / elimination Total
Impairment loss $5,274 $5,274 — — $5,274
Millions of yen
2015
Reporting segment
Production and sale of snacks and
other foods Total OtherCorporate / elimination Total
Impairment loss ¥836 ¥836 — — ¥836
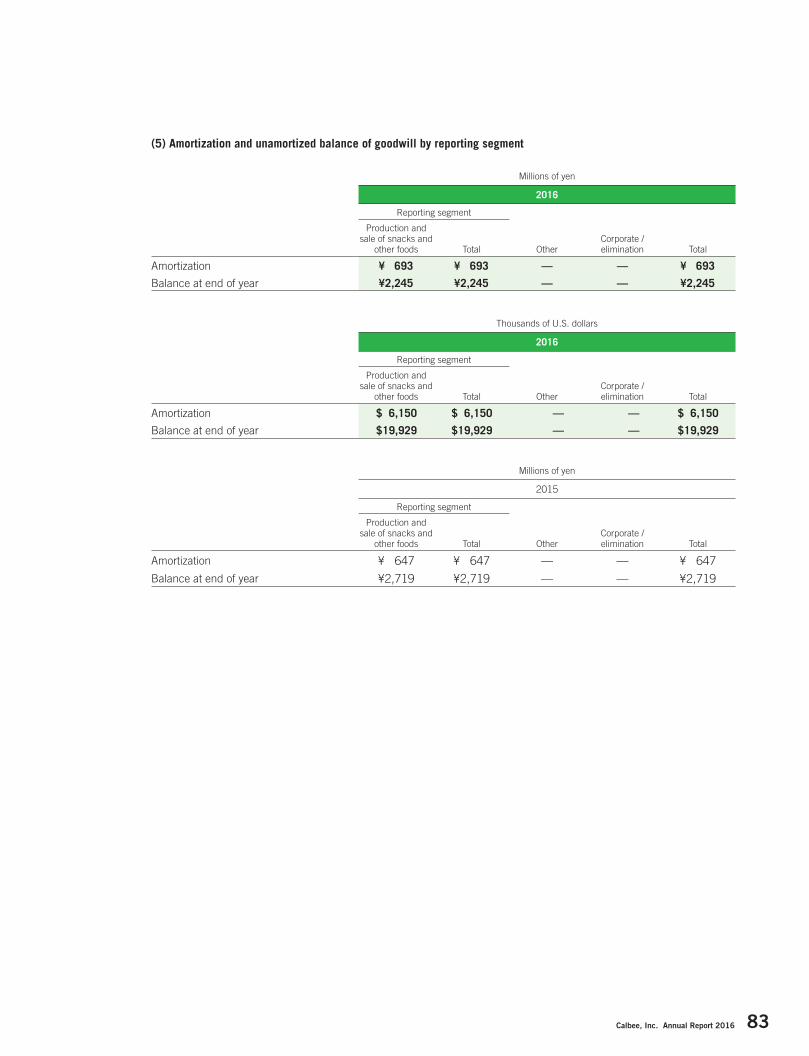
Calbee, Inc. Annual Report 2016 83
(5) Amortization and unamortized balance of goodwill by reporting segment
Millions of yen
2016
Reporting segment
Production and sale of snacks and
other foods Total OtherCorporate / elimination Total
Amortization ¥ 693 ¥ 693 — — ¥ 693
Balance at end of year ¥2,245 ¥2,245 — — ¥2,245
Thousands of U.S. dollars
2016
Reporting segment
Production and sale of snacks and
other foods Total OtherCorporate / elimination Total
Amortization $ 6,150 $ 6,150 — — $ 6,150
Balance at end of year $19,929 $19,929 — — $19,929
Millions of yen
2015
Reporting segment
Production and sale of snacks and
other foods Total OtherCorporate / elimination Total
Amortization ¥ 647 ¥ 647 — — ¥ 647
Balance at end of year ¥2,719 ¥2,719 — — ¥2,719

84 Calbee, Inc. Annual Report 2016
Independent Auditor’s Report
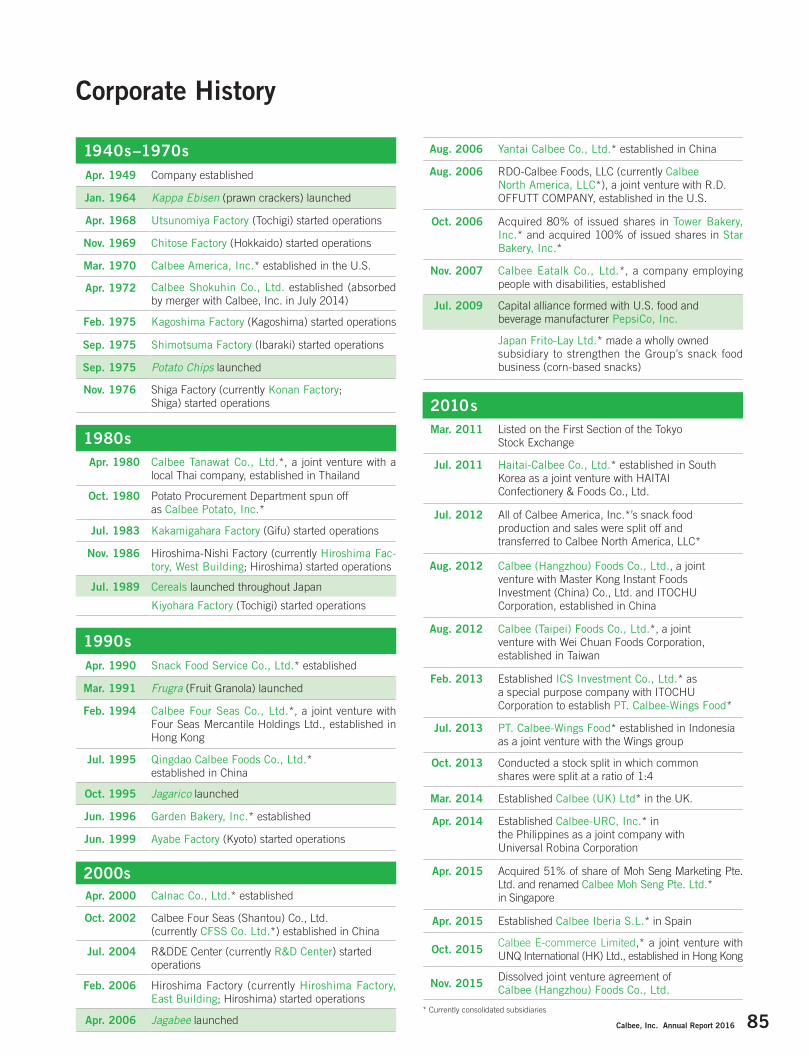
Calbee, Inc. Annual Report 2016 85
Corporate History
1940s–1970sApr. 1949 Company established
Jan. 1964 Kappa Ebisen (prawn crackers) launched
Apr. 1968 Utsunomiya Factory (Tochigi) started operations
Nov. 1969 Chitose Factory (Hokkaido) started operations
Mar. 1970 Calbee America, Inc.* established in the U.S.
Apr. 1972 Calbee Shokuhin Co., Ltd. established (absorbed by merger with Calbee, Inc. in July 2014)
Feb. 1975 Kagoshima Factory (Kagoshima) started operations
Sep. 1975 Shimotsuma Factory (Ibaraki) started operations
Sep. 1975 Potato Chips launched
Nov. 1976 Shiga Factory (currently Konan Factory; Shiga) started operations
1980sApr. 1980 Calbee Tanawat Co., Ltd.*, a joint venture with a
local Thai company, established in Thailand
Oct. 1980 Potato Procurement Department spun off as Calbee Potato, Inc.*
Jul. 1983 Kakamigahara Factory (Gifu) started operations
Nov. 1986 Hiroshima-Nishi Factory (currently Hiroshima Fac-tory, West Building; Hiroshima) started operations
Jul. 1989 Cereals launched throughout Japan
Kiyohara Factory (Tochigi) started operations
1990sApr. 1990 Snack Food Service Co., Ltd.* established
Mar. 1991 Frugra (Fruit Granola) launched
Feb. 1994 Calbee Four Seas Co., Ltd.*, a joint venture with Four Seas Mercantile Holdings Ltd., established in Hong Kong
Jul. 1995 Qingdao Calbee Foods Co., Ltd.* established in China
Oct. 1995 Jagarico launched
Jun. 1996 Garden Bakery, Inc.* established
Jun. 1999 Ayabe Factory (Kyoto) started operations
2000sApr. 2000 Calnac Co., Ltd.* established
Oct. 2002 Calbee Four Seas (Shantou) Co., Ltd. (currently CFSS Co. Ltd.*) established in China
Jul. 2004 R&DDE Center (currently R&D Center) started operations
Feb. 2006 Hiroshima Factory (currently Hiroshima Factory, East Building; Hiroshima) started operations
Apr. 2006 Jagabee launched
Aug. 2006 Yantai Calbee Co., Ltd.* established in China
Aug. 2006 RDO-Calbee Foods, LLC (currently Calbee North America, LLC*), a joint venture with R.D. OFFUTT COMPANY, established in the U.S.
Oct. 2006 Acquired 80% of issued shares in Tower Bakery, Inc.* and acquired 100% of issued shares in Star Bakery, Inc.*
Nov. 2007 Calbee Eatalk Co., Ltd.*, a company employing people with disabilities, established
Jul. 2009 Capital alliance formed with U.S. food and beverage manufacturer PepsiCo, Inc.
Japan Frito-Lay Ltd.* made a wholly owned subsidiary to strengthen the Group’s snack food business (corn-based snacks)
2010sMar. 2011 Listed on the First Section of the Tokyo
Stock Exchange
Jul. 2011 Haitai-Calbee Co., Ltd.* established in South Korea as a joint venture with HAITAI Confectionery & Foods Co., Ltd.
Jul. 2012 All of Calbee America, Inc.*’s snack food production and sales were split off and transferred to Calbee North America, LLC*
Aug. 2012 Calbee (Hangzhou) Foods Co., Ltd., a joint venture with Master Kong Instant Foods Investment (China) Co., Ltd. and ITOCHU Corporation, established in China
Aug. 2012 Calbee (Taipei) Foods Co., Ltd.*, a joint venture with Wei Chuan Foods Corporation, established in Taiwan
Feb. 2013 Established ICS Investment Co., Ltd.* as a special purpose company with ITOCHU Corporation to establish PT. Calbee-Wings Food*
Jul. 2013 PT. Calbee-Wings Food* established in Indonesia as a joint venture with the Wings group
Oct. 2013 Conducted a stock split in which common shares were split at a ratio of 1:4
Mar. 2014 Established Calbee (UK) Ltd* in the UK.
Apr. 2014 Established Calbee-URC, Inc.* in the Philippines as a joint company with Universal Robina Corporation
Apr. 2015 Acquired 51% of share of Moh Seng Marketing Pte. Ltd. and renamed Calbee Moh Seng Pte. Ltd.* in Singapore
Apr. 2015 Established Calbee Iberia S.L.* in Spain
Oct. 2015 Calbee E-commerce Limited,* a joint venture with UNQ International (HK) Ltd., established in Hong Kong
Nov. 2015 Dissolved joint venture agreement of Calbee (Hangzhou) Foods Co., Ltd.
* Currently consolidated subsidiaries

86 Calbee, Inc. Annual Report 2016
Corporate Data(As of March 31, 2016)
Location of Factories
Overseas Japan
Company Name Calbee, Inc.
Date of Establishment April 30, 1949
Head Offi ce Marunouchi Trust Tower Main, 22nd Floor1-8-3 Marunouchi, Chiyoda-ku, Tokyo 100-0005, JAPAN
Paid-in Capital 12,008 million yen
Representatives Akira Matsumoto, Chairman of the Board & CEOShuji Ito, President & COO
Number of Employees 3,728 (consolidated basis), 1,685 (parent basis)
Fiscal Year-end March 31
Business Production and sale of snacks and other foods
Independent Auditor Ernst & Young ShinNihon LLC
Group Companies JapanCalbee Potato, Inc.Snack Food Service Co., Ltd.Garden Bakery, Inc.Tower Bakery, Inc.Star Bakery, Inc.Calnac Co., Ltd.Calbee Eatalk Co., Ltd.Japan Frito-Lay Ltd.ICS Investment Co., Ltd.
OverseasCalbee America, Inc.Calbee North America, LLCQingdao Calbee Foods Co., Ltd.Yantai Calbee Co., Ltd.CFSS Co. Ltd.Calbee E-commerce LimitedCalbee Four Seas Co., Ltd.Calbee (Taipei) Foods Co., Ltd.(Decided as of March 2016 to liquidate)
Haitai-Calbee Co., Ltd.Calbee Tanawat Co., Ltd.PT. Calbee-Wings FoodCalbee-URC, Inc.Calbee Moh Seng Pte. Ltd.Calbee (UK) LtdCalbee Iberia S.L.
Calbee North America, LLCBoardman Factory(Oregon, USA)
Calbee (Taipei) Foods Co., Ltd.(Taipei, Taiwan)
Haitai-Calbee Co., Ltd.(Wonju, South Korea)
Calbee Four Seas Co., Ltd.(Hong Kong)
Calbee-URC, Inc.(Pasig, Philippines)
Calbee (UK) Ltd(Wales, UK)
Calbee North America, LLCFairfield Factory(California, USA)
Calbee North America, LLCSenatobia Factory(Mississippi, USA)
Qingdao Calbee Foods Co., Ltd.(Shandong Province, China)
CFSS Co. Ltd.(Guangdong Province, China)
Calbee Tanawat Co., Ltd.(Bangkok, Thailand)
PT. Calbee-Wings Food(West Java, Indonesia)
Obihiro Factory(Hokkaido, Calbee Potato, Inc.)
Chitose Factory (Hokkaido)
Tower Bakery, Inc.Factory (Saitama)
KakamigaharaFactory (Gifu)
Hiroshima Factory,East Building(Hiroshima)
Konan Factory (Shiga)
Ayabe Factory (Kyoto)
Hiroshima Factory, West Building(Hiroshima)
Kagoshima Factory (Kagoshima)
Shin-UtsunomiyaFactory (Tochigi)
R&D Center(Tochigi)
Kiyohara Factory(Tochigi)
Japan Frito-Lay Ltd.Factory (Ibaraki)
ShimotsumaFactory (Ibaraki)
Garden Bakery, Inc.Factory (Tokyo)

Calbee, Inc. Annual Report 2016 87
Investor Information(As of March 31, 2016)
Apr.2014
May June July Aug. Sept. Oct. Nov. Dec. Jan.2015
Feb. Mar. Apr. May June July Aug. Sept. Oct. Nov. Dec. Jan.2016
Feb. Mar.
(Yen) (Points)6,000 2,000
5,000 1,750
4,000 1,500
3,000 1,250
2,000 1,000
Stock price (left scale) TOPIX (right scale) *Stock prices show the range between the high and low price for each month.
Stock Price Range
ContactIR and Strategic Planning Group E-mail: [email protected]
ShareholdersNumber of
Shares(thousands)
Ownershipratio3 (%)
FRITO-LAY GLOBAL INVESTMENTS B.V. 1 26,800 20.03General Incorporated Association Miki-no-Kai 2 22,970 17.17Japan Trustee Services Bank, Ltd. (Trust Account) 3,925 2.93The Master Trust Bank of Japan, Ltd. (Trust Account) 3,603 2.69THE BANK OF NEW YORK, NON-TREATY JASDEC ACCOUNT 3,069 2.29Calbee Employees Shareholding Association 2,633 1.97THE TORIGOE CO., LTD. 1,936 1.45STATE STREET BANK AND TRUST COMPANY 1,787 1.34BNYM TREATY DTT 15 1,409 1.05BBH FOR MATTHEWS JAPAN FUND 1,323 0.99
1. FRITO-LAY GLOBAL INVESTMENTS B.V. is a wholly-owned subsidiary of PepsiCo, Inc.2. General Incorporated Association Miki-no-Kai is a shareholding association of the founding family of
the Company.3. Ownership ratios are calculated excluding 832 shares held by the Company as treasury stock including
67,120 shares held by the Employee Stock Ownership Plan Trust Account and 125,500 shares held by the Board Incentive Plan Trust Account.
2015 2016
Number of Shares Issued 133,629,800 133,769,800Share Breakdown by Shares Issued Financial institutions 13.8% 13.2% Securities companies 1.0% 1.0% Domestic companies 27.2% 25.3% Foreign companies 44.7% 47.2% Individuals, etc. 13.3% 13.3% Treasury stock 0.0% 0.0%
2015 2016
Number of Shareholders 13,878 19.088Share Breakdown by Shareholders Financial institutions 0.4% 0.4% Securities companies 0.3% 0.2% Domestic companies 1.0% 0.8% Foreign companies 3.2% 2.4% Individuals, etc. 95.1% 96.2% Treasury stock 0.0% 0.0%
Principal Shareholders Shares and Shareholders
Share Breakdown by Shareholder TypeCommon Stock Authorized: Issued:
176,000,000 shares133,769,800 shares
Number of Shareholders 19,088
Annual General Meeting June
Date of Listing March 11, 2011
Stock Listing First Section of the Tokyo Stock Exchange
TSE Code 2229
Share Register Mitsubishi UFJ Trust and Banking Corporation
Financial institutions13.2%
Securities companies1.0%
Domestic companies25.3%
Treasury stock0.0%
Individuals, etc.13.3%
Foreign companies47.2%
Number ofshares issued:
133,769,800shares
Stock Trading Volume
Apr.2014
May June July Aug. Sept. Oct. Nov. Dec. Jan.2015
Feb. Mar. Apr. May June July Aug. Sept. Oct. Nov. Dec. Jan.2016
Feb. Mar.
(Thousand shares)
0
30,000
20,000
10,000
*Calbee’s common stock was split at a ratio of 4 shares for 1 share effective October 1, 2013. Stock prices and trading volumes prior to the date of the stock split have also been retroactively adjusted.
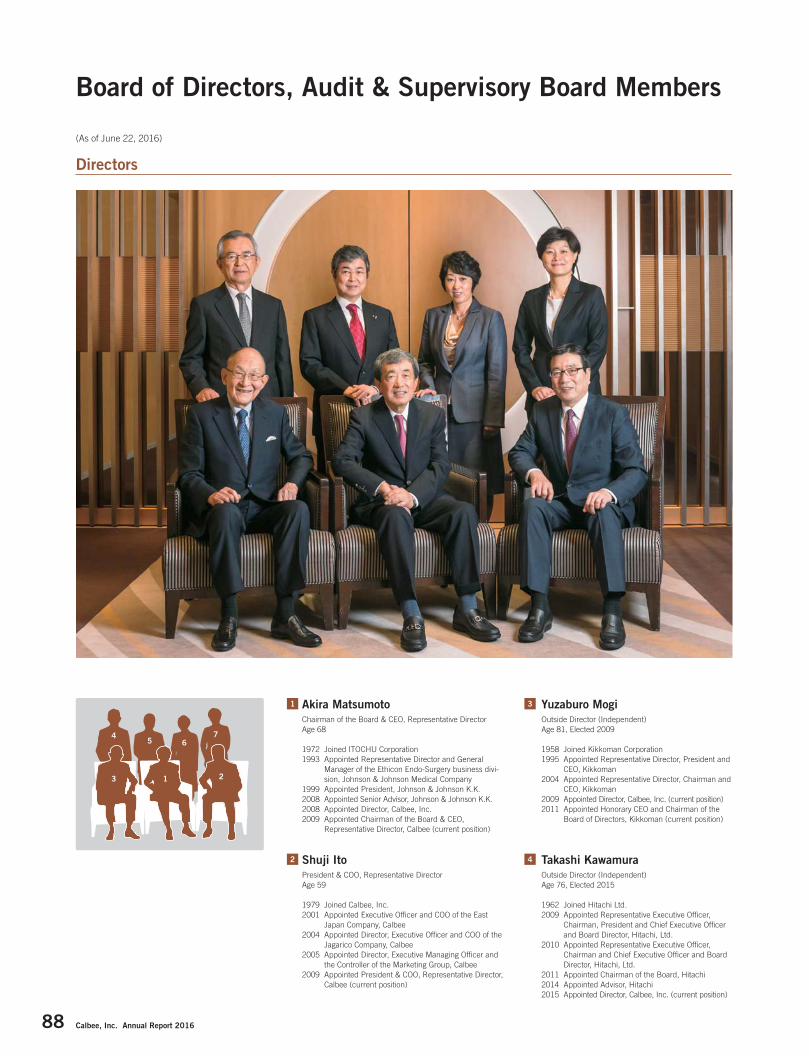
1
2 4
3Akira MatsumotoChairman of the Board & CEO, Representative DirectorAge 68
1972 Joined ITOCHU Corporation1993 Appointed Representative Director and General
Manager of the Ethicon Endo-Surgery business divi-sion, Johnson & Johnson Medical Company
1999 Appointed President, Johnson & Johnson K.K.2008 Appointed Senior Advisor, Johnson & Johnson K.K.2008 Appointed Director, Calbee, Inc.2009 Appointed Chairman of the Board & CEO,
Representative Director, Calbee (current position)
Yuzaburo MogiOutside Director (Independent)Age 81, Elected 2009
1958 Joined Kikkoman Corporation1995 Appointed Representative Director, President and
CEO, Kikkoman2004 Appointed Representative Director, Chairman and
CEO, Kikkoman2009 Appointed Director, Calbee, Inc. (current position)2011 Appointed Honorary CEO and Chairman of the
Board of Directors, Kikkoman (current position)
Takashi KawamuraOutside Director (Independent)Age 76, Elected 2015
1962 Joined Hitachi Ltd.2009 Appointed Representative Executive Offi cer,
Chairman, President and Chief Executive Offi cer and Board Director, Hitachi, Ltd.
2010 Appointed Representative Executive Offi cer, Chairman and Chief Executive Offi cer and Board Director, Hitachi, Ltd.
2011 Appointed Chairman of the Board, Hitachi2014 Appointed Advisor, Hitachi2015 Appointed Director, Calbee, Inc. (current position)
Shuji ItoPresident & COO, Representative DirectorAge 59
1979 Joined Calbee, Inc.2001 Appointed Executive Offi cer and COO of the East
Japan Company, Calbee2004 Appointed Director, Executive Offi cer and COO of the
Jagarico Company, Calbee2005 Appointed Director, Executive Managing Offi cer and
the Controller of the Marketing Group, Calbee2009 Appointed President & COO, Representative Director,
Calbee (current position)
Directors
(As of June 22, 2016)
Board of Directors, Audit & Supervisory Board Members
45 6
7
213
88 Calbee, Inc. Annual Report 2016

5
7
6 Atsuko FukushimaOutside Director (Independent)Age 54, Elected 2015
1985 Joined Chubu-Nippon Broadcasting Co., Ltd.1988 Named newscaster, Japan Broadcasting Corporation
(NHK)1993 Named newscaster, Tokyo Broadcasting System, Inc.
(TBS, now Tokyo Broadcasting System Television, Inc.)1994 Appointed Management Advisor for Matsushita
Electric Industrial Co., Ltd. (now Panasonic Corporation)
2015 Appointed Director, Calbee, Inc. (current position)
Katty LamOutside DirectorAge 49, Elected 2016
1994 Joined PepsiCo China2008 Appointed Area Vice President of PepsiCo Beverages,
South China2011 Appointed President of PepsiCo Greater China Foods
Operation2013 Appointed Chairman, PepsiCo Greater China Region
(current position)2016 Appointed Director, Calbee, Inc. (current position)
Takahisa TakaharaOutside Director (Independent)Age 54, Elected 2015
1986 Joined Sanwa Bank, Ltd. (now The Bank of Tokyo-Mitsubishi UFJ, Ltd.)
1991 Joined Unicharm Corporation1995 Appointed Director, Unicharm2001 Appointed President & CEO, Unicharm
(current position)2015 Appointed Director, Calbee, Inc. (current position)
Tadashi IshidaOutside (Independent) Audit & Supervisory Board MemberAge 72, Elected 2011
Nagako OeOutside (Independent) Audit & Supervisory Board MemberAge 43, Elected 2016
Isao HirakawaAge 60, Elected 2012
Audit & Supervisory Board Members
1974 Joined Arthur Young, Tokyo Offi ce1980 Joined Asahi & Co. (now KPMG AZSA LLC)1980 Registered as Certifi ed Public Accountant (Japan)2003 Appointed CFO & Executive Vice President,
McDonald’s Co. (Japan), Ltd.2011 Appointed Statutory Audit & Supervisory Board
Member, Calbee, Inc. (current position)
1998 Licensed and registered as an attorney at law1998 Joined Toranomon Sougoh Law Offi ce2004 Joined Kramer Levin Naftalis & Frankel LLP, New York
(Foreign Trainee)2005 Joined Asahi Koma Law Offi ces (Associate)2007 Joined TMI Associates (Associate)2008 Appointed Partner, TMI Associate (current position)2016 Appointed Statutory Audit & Supervisory Board
Member, Calbee, Inc. (current position)
(Note) Calbee has appointed one alternate Audit and Supervisory Board Member to ensure that it consistently maintains the number of corporate auditors prescribed under the law.
1980 Joined Kanebo, Ltd.2006 Appointed Administrative Management Director,
Kanebo2008 Appointed Executive Offi cer and Chief Financial
Offi cer, Calbee, Inc.2010 Appointed Executive Offi cer and General Manager
of Finance & Accounting Group, Calbee2012 Appointed Statutory Audit & Supervisory Board
Member, Calbee (current position)
Calbee, Inc. Annual Report 2016 89
Annual Report 2016Fiscal year ended March 31, 2016
TSE code: 2229
Shaping the Future
Our Future isalso supportedby successfulmarketing...
like me!
Marunouchi Trust Tower Main, 22nd Floor
1-8-3 Marunouchi, Chiyoda-ku, Tokyo 100-0005, JAPAN
https://www.calbee.com/ir/
This annual report was printed entirely on FSC®-certifi ed paper using a waterless printing process.Printed in Japan
Calbee, Inc. A
nnual Report 2016
製版センター
6482941
表紙
エイ・アイ・
エイ・デザイン
研究
FSC
カルビー AR 2016
英文
280
435/背5
佐々木単102
H1-4
初校16.09.03
H4 H1
カルビー16表紙_初戻し0906.indd c4-c1カルビー16表紙_初戻し0906.indd c4-c1 2016/09/08 19:112016/09/08 19:11