shallow groundwater pollution index around the location of
TRANSCRIPT

199
INTRODUCTION
Sidoarjo District, East Java Province, is de-veloping as a large industrial area. According to the data from the Civil Registry Service for 2018, the total population was 2,238,069 people. Such number of people produces a lot of waste. Sido-arjo Regency only has one final waste disposal site (landfill), namely the Griyo Mulyo Landfill (Jabon Landfill) in Jabon District. The amount of
waste that entered Jabon Landfill in April 2020 was 11,433,700 tons.
The amount of waste has continued to increase, which has had an impact on the environment, es-pecially the production of leachate. Leachate is a liquid substance produced in the process of de-composing waste and it has a very strong odor. Leachate occurs due to the entry of water into the garbage pile, which can cause groundwater pollu-tion, especially in the shallow groundwater (dug
Shallow Groundwater Pollution Index Around the Location of Griyo Mulyo Landfill (Jabon Landfill) in Jabon District, Sidoarjo Regency, East Java, Indonesia
Bieby Voijant Tangahu1, Anak Agung Gde Kartika2, Kriyo Sambodho3, Sheilla Megagupita Putri Marendra1, Isni Arliyani1
1 Department of Environmental Engineering, Faculty of Civil, Planning and Geo Engineering, Institut Teknologi Sepuluh Nopember (ITS), Jl. Raya ITS, Keputih, Sukolilo, Surabaya 60111, Indonesia
2 Department of Civil Engineering, Faculty of Civil, Planning and Geo Engineering, Institut Teknologi Sepuluh Nopember, Surabaya 60111, Indonesia
3 Department of Ocean Engineering, Faculty of Ocean Technology Institut Teknologi Sepuluh Nopember (ITS), Surabaya 60111, Indonesia
* Corresponding author’s e-mail: [email protected]
AbstrActThe leachate coming from the landfill is a serious problem. This is because the leachate water can contaminate the wells of the residents around the landfill. This research was conducted at Jabon Landfill located in Jabon District of Sidoarjo Regency, East Java Province, Indonesia. Jabon Landfill has been operating since 2003 with a controlled landfill system that has triggered environmental risks due to the leachate output. The purpose of this study was to determine the classification of the shallow groundwater quality status based on the pollution index (PI) around Jabon Landfill at a distance of around 250 meters, 500 meters and 1,000 meters from the landfill. The pollution index was determined by analyzing the pollutant concentration consisting of these following parameters: pH, BOD, COD and Fe. The results of the analysis show that the pH parameter had a higher value than the pH at Jabon Landfill of 7.2–7.5. The pH at Jabon Landfill was 6.35. The Fe parameter shows that the value of 1.694 in the groundwater well closest to Jabon Landfill and the wells further away indicates that the Fe concentration was lower for the latter, namely 0.081 at a distance of up to 200 meters. On the basis of the Pollution Index, the highest value was 5.45 at Well 7 is located 196 m from Jabon Landfill. Meanwhile, the well furthest from Jabon Landfill at a distance of 1,000 m showed a lightly polluted status with a Pollution Index of 1.91. The further the location of the well away from Jabon Landfill, the Pollution Index value tended to decrease. This means that the pollution status generally improves. Overall, the pollution status of the 18 wells shows that 2 wells are moderately polluted, 15 wells are lightly polluted and 1 well is in good condition.
Keywords: pollution index, leachate, Jabon Landfill, water quality status
Journal of Ecological EngineeringReceived: 2020.12.16Accepted: 2021.01.14Published: 2021.02.01
Journal of Ecological Engineering 2021, 22(3), 199–210https://doi.org/10.12911/22998993/132658ISSN 2299–8993, License CC-BY 4.0

200
Journal of Ecological Engineering 2021, 22(3), 199–210
wells) of the residents around the landfill. Sub-sequent contamination of groundwater through leachate discharged is a major environmental problem experienced around landfills (Afolayan and Ogundele, 2012). Replenishing an aquifer with water from the ground is groundwater re-charging (Bhattacharya, 2010). Leachate, which is increasing in volume, seeps into the ground, which in turn results in the contamination of the subsurface water, subsequently contaminating the shallow wells used by the residents as a source of drinking water.
One type of rural water supply facility that is widely used by the government as a source of clean water is dug wells. This facility uses shal-low groundwater, so its existence is considered to be efficient and effective when it comes to meeting the needs of daily life. Groundwater is used more widely, because it is easier to obtain and relatively safe from pollution compared to surface water. Therefore, understanding the local groundwater sources is very important in sustain-able development (Selvam et al., 2016). Shallow groundwater is the primary need for the people who do not have tap water, and it usually takes the form of dug wells or shallow boreholes in people’s houses. The use of groundwater through the means of either boreholes or dug wells is also carried out by the residents around Jabon Land-fill. Generally, shallow groundwater is found at a depth of around 15 meters. If the well water is polluted by the leachate from Jabon Landfill, there will be a decrease in the quality of the well water and it cannot be used again properly. The water may have an impact on the health of the community and surrounding environment in the area (Vinet and Zhedanov, 2011).
Jabon Landfill has 3 (three) monitoring wells. Some of the parameters still exceed the quality standards set by the Regulation of Ministry of Health no. 492/2010. Jabon Landfill often over-loads and the condition of high rainfall due to the climate results in increased leachate production contributing to leachate penetration. This land-fill service covers all waste in Sidoarjo Regency, which causes the waste to rot quicker and produce the pollutants that can contaminate the groundwa-ter. The leachate load that is collected is not maxi-mal and this surplus causes seepage. In addition, clean water in Jabon is no longer easy to obtain because the groundwater has been polluted by the liquid waste from the landfill. On the basis of this fact, it is necessary to conduct research in order
to determine the distribution of pollutants due to leachate. This study aimed to determine the con-centration of the pollution parameters according to the leachate characteristics at various horizon-tal distances from the landfill site. This pollutant concentration was used to determine the water quality using the Pollutant Index method for the shallow wells around Jabon Landfill.
LITERATURE REVIEW
Leachate
Leachate is a liquid that arises from the en-try of external water into a landfill that rinses any dissolved materials, including the organic matter resulting from the biological decomposition pro-cesses. Leachate can cause pollution if it is not treated first before being discharged into the en-vironment. Leachate is generally toxic because it contains high amounts of many microorganisms, in addition to heavy metals which are dangerous if exposed directly to the environment (Juliardi and Wiyanti, 2018). The garbage buried in the landfill (final disposal site) location contains or-ganic substances. If it rains, it will produce leach-ate with a high mineral and organic content. If the leachate is allowed to flow into the soil surface, it can have a negative effect on the surrounding environment, including humans. In addition, the level of leachate degradation ability in nature is very low. This is indicated by the low value of the BOD/COD ratio. The characteristics of leach-ate vary greatly depending on the processes that occur in the landfill, which can be physical, chemical and biological. The type of waste, site design, geochemistry, climatological conditions, and hydrogeology affect the leachate migration to groundwater (Lee and Kitanidis, 1993). The leachate produced from materials that often con-tain toxic substances can be the greatest threat to groundwater pollution, especially if industrial waste is dumped on the land (Longe and Balogun, 2010). There is no significant difference between the dry season and wet season measurements, ex-cept for some of the pollutants at several land-fill sites. Generally, groundwater contamination appears after five years and peaks several years afterward. Shallow groundwater contamination in the community appears within 1,000 meters of the landfill. It is mostly categorized as a serious groundwater contamination, which occurs within

201
Journal of Ecological Engineering 2021, 22(3), 199–210
200 meters of the landfill. This suggests that the contamination of the groundwater near the land-fill must be considered, especially in developing countries (Han et al., 2016).
The composition of leachate depends on the composition of the waste. This is according to (1) the type and age of the buried waste, (2) the water balance in the landfill and (3) the microbes that play a role in the decomposition. The pro-cess of decomposing waste requires the presence of decomposing microbes, including fungi, yeast, and actinomycetes. These microbes can dissolve in water. This means that if there is a water flow present, then the microbes will be carried away by the water. Leachate generally contains high levels of organic and inorganic compounds (so-dium, potassium, calcium, magnesium, chlorine, sulfates, phosphates, phenols, nitrogen and heavy metal compounds). The action of bacteria helps rainwater in the decomposition process to pro-duce leachate. Inorganic macro-components such as chloride, ammonia, Cd, Ni, Cu, Pb, and Fe and xenobiotic organic compounds such as halogenat-ed organic compounds are usually contained in leachate. Chemicals such as pesticides, solvents and heavy metals may also be present (Kostova, 2006). The quality standards for the leachate wa-ter produced from the final processing site (land-fill) can be found in Appendix I of the Regulation of the Minister of Environment of the Republic of Indonesia No. 59 of 2016 concerning the Quality Standard of Leachate for Business and/or Activi-ties of Waste Final Processing Sites.
The movement of leachate in soil
Leachate can seep into the ground and mix with the groundwater or flow on the ground and infiltrate into the river water. The ability of leachate to contaminate either the surface water or groundwater is influenced by the geological
conditions (soil type and rock type) as well as the hydrological conditions (depth and movement of groundwater, amount of rainfall, and surface flow control) where the landfill is located.
Gravitational potential is the main force that causes the flow of leachate, which generally moves from a high to a low angle. As the distance from the pollution source increases, the con-taminant concentration in groundwater decreas-es (Adeolu et al., 2011; Ling and Zhang, 2017; Mor et al., 2006). Much of the research related to soil-water environmental assessments near landfills and waste management facilities has re-sulted in the impact of landfills on the ground-water quality (Adamcová et al., 2016; Calvo et al., 2005; Gworek et al., 2016; Koda, 2012; Koda et al., 2017, 2015; Ling and Zhang, 2017; Pande et al., 2015).
The mechanism of the entry of leachate into the groundwater layer, especially shallow ground-water, involves through several stages. Leachate can contaminate groundwater. The mechanism for the entry of leachate into the groundwater lay-er, especially shallow groundwater (wells), goes through the following process:1. Leachate is usually found in the areas used to
dispose of waste without management, namely in a layer approximately 2 meters below the soil surface.
2. In particular, if the leachate enters the ground through infiltration, then immediately the soil surface is filled with water.
3. Due to such factors as rainwater, the leachate is accelerated into the soil layer, namely the aera-tion zone. This is at a depth of 10 meters below the soil surface.
4. Due to the large amount of leachate formed, the leachate water enters either the shallow groundwater layer or the saturated groundwa-ter layer.
5. In the saturated soil layer, the collected water is mixed with the leachate water which is used as a drinking water source through shallow wells (Hadi and Irfan, 2016).
Groundwater
Shallow groundwater is the water that is above the first impermeable layer. Shallow groundwater is very vulnerable to contamina-tion. Shallow ground water occurs because of the process of water infiltration through the sur-face of the soil. Any mud will be retained, as will
table 1. Quality standard of leachates
ParametersMaximum concentration
Value Unit
pH 6 – 9 -
BOD 150 mg/L
COD 300 mg/L
TSS 100 mg/L
N Total 60 mg/L
Mercury 0.005 mg/L
Cadmium 0.1 mg/L

202
Journal of Ecological Engineering 2021, 22(3), 199–210
some bacteria, so the ground water will be clear but contain more chemicals (dissolved salts) be-cause it passes through the soil layer which has certain chemical elements. This soil layer func-tions as a filter. However, the risk of impurity is still present, especially at the water level close to ground level. After meeting a dense layer of wa-ter, the water will collect as shallow groundwater. This groundwater is used as a clean water source through shallow wells.
Shallow groundwater comes in at a depth of ± 15 meters. As a source of clean water, shallow groundwater is often considered from a rather good quality perspective. In terms of quantity, it is not good and it depends on the season.
RESEARCH METHOD
The Pollution Index method is based on two quality indices. The first is the Average Index (IR). This index shows the average level of pol-lution using all of the parameters in one obser-vation. The second is the Maximum Index (IM). This index focuses on one type of parameter that predominantly causes a decrease in water quality in one observation.
On the basis of the Decree of the Minister of Environment Number 115 of 2003, the water quality can be determined using the Pollution In-dex. This is a different concept from the Water Quality Index. The Pollution Index (IP) is deter-mined for a particular designation and then devel-oped for several uses for all parts of a water body or part of a river.
Lij indicates the concentration of the water quality parameters listed in the Water Quality Standard (j) and Ci indicates the concentration of the water quality parameters (i) obtained from the analysis of the water samples at a sampling loca-tion from the river channel. PIj is the Pollution Index for the designation (j) which is a function of Ci/Lij.
PIj = (C1/L1j, C2/L2j,…,Ci/Lij) (1)
Each Ci/Lij value indicates the relative pollu-tion caused by the water quality parameters. This ratio has no units involved. The Ci/Lij = 1.0 is a critical value because this value is expected to be met by the Water Allocation Quality Standard. If Ci/Lij is > 1.0 for a parameter, then the concen-tration of this parameter must be reduced or set aside if a body of water is used for a particular
designation (j). If this parameter is meaningful for the chosen designation, then it is absolutely necessary to treat the water. In the IP model, vari-ous water quality parameters are used; it requires an average value of the entire Ci/Lij value as a measure of the pollution. This value will not be meaningful if one of the Ci/Lij values is greater than 1. This index must include the maximum Ci/Lij value. PIj = {(Ci/Lij)R,(Ci/Lij)M} (2)
value (Ci/Lij)R : average value Ci/Lij(Ci/Lij)M : maximum value Ci/Lij
The water will be increasingly polluted at a designation (j) if the value of (Ci/Lij) Rm and/or (Ci/Lij) M is greater than 1.0. If the maximum value of Ci/Lij and/or the average value of Ci/Lij is greater, then the level of pollution of the water body will also increase.
PIj = m √(𝐶𝐶𝐶𝐶𝐿𝐿𝐶𝐶𝐿𝐿)𝑀𝑀2+ (𝐶𝐶𝐶𝐶𝐿𝐿𝐶𝐶𝐿𝐿)𝑅𝑅
2 (3)
Where m = balancing factor
The critical state is used to calculate the value of mPIj = 1.0 if maximum value Ci/Lij = 1.0 and aver-age value Ci/Lij = 1.0 so that:
1.0 = m√(1)2 + (1)2 (4)
m = 1/√2 , then the equation becomes:
Pij = √(𝐶𝐶𝐶𝐶𝐿𝐿𝐶𝐶𝐿𝐿)𝑀𝑀
2+( 𝐶𝐶𝐶𝐶𝐿𝐿𝐶𝐶𝐿𝐿)𝑅𝑅
2
2 (5)
This method can directly relate the level of contamination to whether or not the river can be used for certain purposes and the value of certain parameters. The Water Quality Standard (BMA) used in this study was the Class II Water Desig-nation Criteria (PP 82/2001). The use of Class II BMA is due to the absence of a technical study
table 2. Relationship between the pollution index value and water quality
Pollution index value Water quality status
0 – 1.0 Good condition
1.1 – 5.0 Light polluted
5.0 – 10.0 Moderate polluted
>10.0 High polluted

203
Journal of Ecological Engineering 2021, 22(3), 199–210
on the designation of the water for Lake Ranu-pani. Under a condition where a technical study of the designation of the water sources has not been carried out, BMA uses the criteria for desig-nating class II water even though the water source is used for various raw water needs (Government Regulation 82/2001 article 5, article 9, article 11, article 12, paragraph 1).
RESULTS AND DISCUSSION
Sidoarjo Regency is included in the medium city category. On the basis of the Jakstrada, the area of waste services in Sidoarjo Regency is 714.24 km2 with the percentage of solid waste service coverage being 48%. The amount of waste dumped in the landfill is 575 tons/day and the amount of unmanaged waste is 227 tons/day. The amount of daily waste generated by the capital city in Sidoarjo Regency is 168.00 tons/day while the daily waste generation for the non-capital cit-ies is 1112.00 tons/day. According to Marendra (2019), the leachate discharge generated by Jabon landfill is 3.72 liters/second. On the basis of the calculations by Jakstrada Sidoarjo Regency, Ja-bon Landfill land has been depleted in 2019 (the land used in 2019 was ± 10.1 Ha) because it has exceeded its capacity of only 8.5 Ha.
The measurement of the waste generation en-tering Jabon Landfill is based on the primary data from the observations conducted at Jabon Land-fill. This is done because Jabon Landfill does not have a weighbridge yet. The waste quantity anal-ysis was therefore calculated from the volume of waste according to the number of waste transport fleets and their capacity every day. The results of the data collection show that the total waste
generation is 1206.65 m3/day or 329198.9 kg/day (Lumban Gaol and Warmadewanthi, 2017).
The composition of the waste at Jabon Land-fill was observed. The types of waste entering the landfill from the observations were compostable waste (food scraps/crusts and garden waste) con-sisting of food scraps totaling 77% and garden waste totaling 26.77%. The following type of waste had the largest percentage at 15.6% plastic (HDPE, LDPE, PET, PS Styrofoam, PP bag, and other plastics), 10.4% diapers (including diapers and pads), 4.8% fabric, 2.66% paper, 1.86% car-tons, 0.54% rubber (used sandals, rubber bands and used tires), 0.27% hazardous waste (spent batteries, leftover medicines, used lamps, objects contaminated with hazardous etc), 0.25% glass (glass bottles and other glass shards), 0.16% iron (iron plates and tin) and 1.92% other (waste not included in any of the above group specifications).
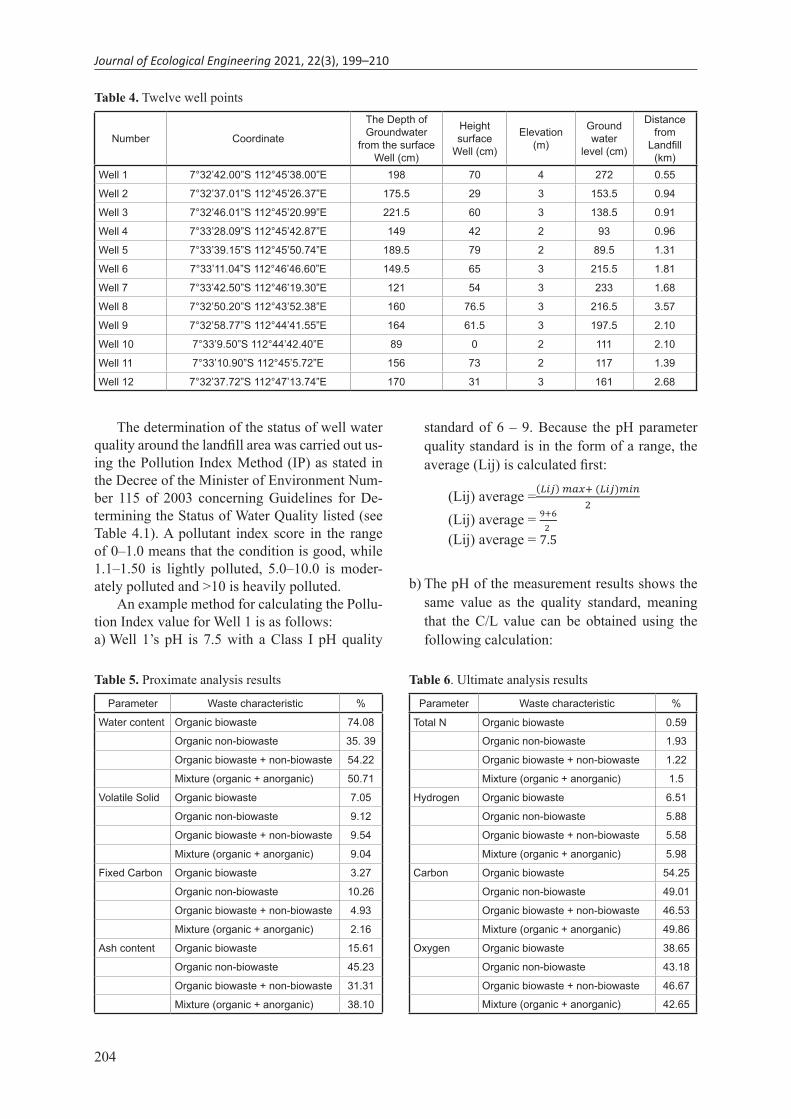
The dispersion of contaminants was observed by determined the direction of groundwater flow. Several groundwater points (wells) were selected to measure the elevation of the water level. Mea-surements are taken from the depth of the water face of the well lip, the height of the well lip from the ground. The groundwater level elevation is then calculated. Dispersion is assumed to be in line with groundwater flow and groundwater flow from the higher water level elevation to the lower elevation. Twelve well points that have been sur-veyed are then plotted for use in dispersion mod-eling are shown in Table 4.
The physical characteristics of the waste were also analyzed using proximate analysis, which included the analysis of the moisture con-tent, volatile solids, fixed carbons and ash con-tent. Proximate analysis was carried out in the laboratory to determine the water content in the waste. The Volatile Solids (VSs) were analyzed to determine the organic matter content in the waste and the ash analysis was used to deter-mine the content of the ash produced from burn-ing waste. The analysis of the waste character-istics can be divided into several types, namely biowaste organic waste (food waste and garden waste), non-biowaste organic waste (plastic, paper, cardboard, cloth, rubber and other organ-ics), bio + non-biowaste and mixed waste (com-bined organic and inorganic). The results of the proximate analysis are presented in Table 5. The chemical characteristics of the waste were also analyzed using ultimate analysis. The results of the analysis are shown in Table 6.
table 3. Waste generation in Jabon Landfill
Day Waste generation (m3/day) Mass (kg/day)
1 1,218.0 332,295.4
2 1,214.4 331,313.2
3 1,198.8 327,057.2
4 1,193.6 325,638.5
5 1,228.0 335,023.6
6 1,225.6 334,368.8
7 1,201.2 327,712.0
8 1,173.6 320,182.1
Average 1,206.6 329,198.9
204
Journal of Ecological Engineering 2021, 22(3), 199–210
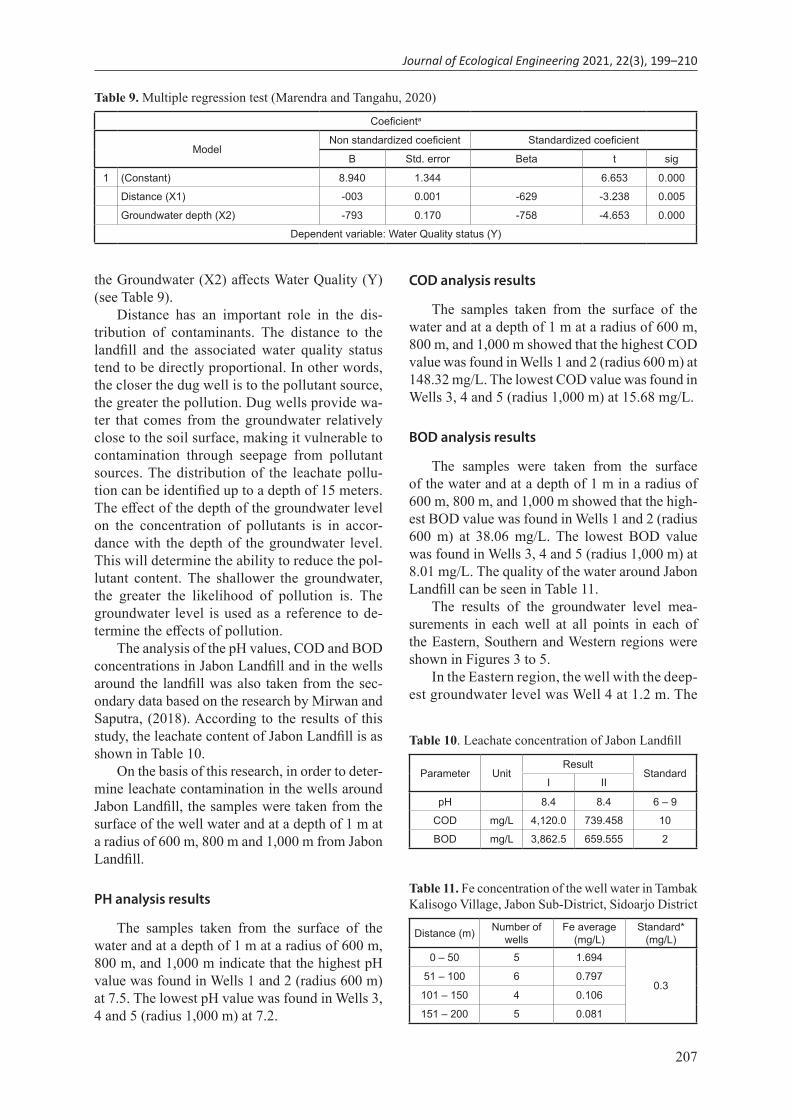
The determination of the status of well water quality around the landfill area was carried out us-ing the Pollution Index Method (IP) as stated in the Decree of the Minister of Environment Num-ber 115 of 2003 concerning Guidelines for De-termining the Status of Water Quality listed (see Table 4.1). A pollutant index score in the range of 0–1.0 means that the condition is good, while 1.1–1.50 is lightly polluted, 5.0–10.0 is moder-ately polluted and >10 is heavily polluted.
An example method for calculating the Pollu-tion Index value for Well 1 is as follows:a) Well 1’s pH is 7.5 with a Class I pH quality
standard of 6 – 9. Because the pH parameter quality standard is in the form of a range, the average (Lij) is calculated first:
(Lij) average =(𝐿𝐿𝐿𝐿𝐿𝐿) 𝑚𝑚𝑚𝑚𝑚𝑚+ (𝐿𝐿𝐿𝐿𝐿𝐿)𝑚𝑚𝐿𝐿𝑚𝑚2
(Lij) average = 9+62
(Lij) average = 7.5
JABON Landfill
b) The pH of the measurement results shows the same value as the quality standard, meaning that the C/L value can be obtained using the following calculation:
table 4. Twelve well points
Number Coordinate
The Depth of Groundwater
from the surface Well (cm)
Height surface
Well (cm)
Elevation (m)
Ground water
level (cm)
Distance from
Landfill (km)
Well 1 7°32’42.00”S 112°45’38.00”E 198 70 4 272 0.55
Well 2 7°32’37.01”S 112°45’26.37”E 175.5 29 3 153.5 0.94
Well 3 7°32’46.01”S 112°45’20.99”E 221.5 60 3 138.5 0.91
Well 4 7°33’28.09”S 112°45’42.87”E 149 42 2 93 0.96
Well 5 7°33’39.15”S 112°45’50.74”E 189.5 79 2 89.5 1.31
Well 6 7°33’11.04”S 112°46’46.60”E 149.5 65 3 215.5 1.81
Well 7 7°33’42.50”S 112°46’19.30”E 121 54 3 233 1.68
Well 8 7°32’50.20”S 112°43’52.38”E 160 76.5 3 216.5 3.57
Well 9 7°32’58.77”S 112°44’41.55”E 164 61.5 3 197.5 2.10
Well 10 7°33’9.50”S 112°44’42.40”E 89 0 2 111 2.10
Well 11 7°33’10.90”S 112°45’5.72”E 156 73 2 117 1.39
Well 12 7°32’37.72”S 112°47’13.74”E 170 31 3 161 2.68
table 5. Proximate analysis results
Parameter Waste characteristic %
Water content Organic biowaste 74.08
Organic non-biowaste 35. 39
Organic biowaste + non-biowaste 54.22
Mixture (organic + anorganic) 50.71
Volatile Solid Organic biowaste 7.05
Organic non-biowaste 9.12
Organic biowaste + non-biowaste 9.54
Mixture (organic + anorganic) 9.04
Fixed Carbon Organic biowaste 3.27
Organic non-biowaste 10.26
Organic biowaste + non-biowaste 4.93
Mixture (organic + anorganic) 2.16
Ash content Organic biowaste 15.61
Organic non-biowaste 45.23
Organic biowaste + non-biowaste 31.31
Mixture (organic + anorganic) 38.10
table 6. Ultimate analysis results
Parameter Waste characteristic %
Total N Organic biowaste 0.59
Organic non-biowaste 1.93
Organic biowaste + non-biowaste 1.22
Mixture (organic + anorganic) 1.5
Hydrogen Organic biowaste 6.51
Organic non-biowaste 5.88
Organic biowaste + non-biowaste 5.58
Mixture (organic + anorganic) 5.98
Carbon Organic biowaste 54.25
Organic non-biowaste 49.01
Organic biowaste + non-biowaste 46.53
Mixture (organic + anorganic) 49.86
Oxygen Organic biowaste 38.65
Organic non-biowaste 43.18
Organic biowaste + non-biowaste 46.67
Mixture (organic + anorganic) 42.65
205
Journal of Ecological Engineering 2021, 22(3), 199–210
(Ci/Lij) = 𝐶𝐶𝐶𝐶𝑚𝑚−(𝐿𝐿𝐶𝐶𝐿𝐿)𝑎𝑎𝑎𝑎𝑎𝑎𝑎𝑎𝑎𝑎𝑎𝑎𝑎𝑎(𝐿𝐿𝐶𝐶𝐿𝐿)𝑚𝑚𝐶𝐶𝑚𝑚−(𝐿𝐿𝐶𝐶𝐿𝐿)𝑎𝑎𝑎𝑎𝑎𝑎𝑎𝑎𝑎𝑎𝑎𝑎𝑎𝑎
(Ci/Lij) = 7.5−7.59−7.5 (Ci/Lij) = 0
On the basis of the analysis, it is known that the value (Ci/Lij) <1.0 does not require a new calculation (Ci/Lij). It can therefore be used without calculating the value (Ci/Lij) using the new formula. The calculations (Ci/Lij) were performed for the other parameters, namely COD, BOD and Fe. The results of the analy-sis regarding the calculated values (Ci/Lij) are shown in Table 7.
On the basis of the results of the calculation (Ci/Lij) for each new parameter, calculating the new value (Ci/Lij) is as follows:
(Ci/Lij) average = (Lij) average = 0,00+7.42+6.85+0.274 (Lij) average = 3.638
On the basis of the results of the new (Ci/Lij) calculation, we then determined the maximum (Ci/Lij) value of the highest (Ci/Lij) value for
the new (Ci/Lij) of all parameters. The maximum value (Ci/Lij) is 7.42.
We then calculated the Pollution Index value according to the following calculations:
𝐼𝐼𝐼𝐼𝑗𝑗 = √( 𝐶𝐶𝑖𝑖
𝐿𝐿𝑖𝑖𝑗𝑗)
2
𝑀𝑀+ ( 𝐶𝐶𝑖𝑖
𝐿𝐿𝑖𝑖𝑗𝑗)
2
𝑅𝑅2
𝐼𝐼𝐼𝐼𝑗𝑗 = √3.6382 + 7.422
2
𝐼𝐼𝐼𝐼𝑗𝑗 = 5.31
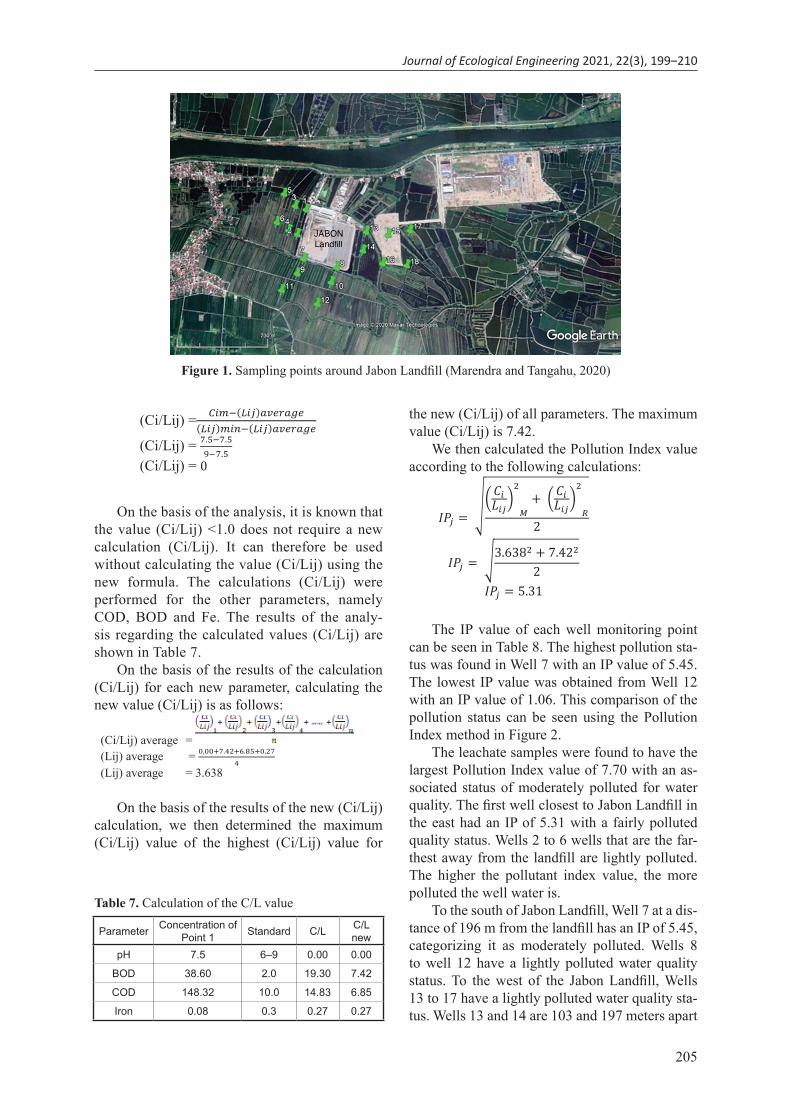
The IP value of each well monitoring point can be seen in Table 8. The highest pollution sta-tus was found in Well 7 with an IP value of 5.45. The lowest IP value was obtained from Well 12 with an IP value of 1.06. This comparison of the pollution status can be seen using the Pollution Index method in Figure 2.
The leachate samples were found to have the largest Pollution Index value of 7.70 with an as-sociated status of moderately polluted for water quality. The first well closest to Jabon Landfill in the east had an IP of 5.31 with a fairly polluted quality status. Wells 2 to 6 wells that are the far-thest away from the landfill are lightly polluted. The higher the pollutant index value, the more polluted the well water is.
To the south of Jabon Landfill, Well 7 at a dis-tance of 196 m from the landfill has an IP of 5.45, categorizing it as moderately polluted. Wells 8 to well 12 have a lightly polluted water quality status. To the west of the Jabon Landfill, Wells 13 to 17 have a lightly polluted water quality sta-tus. Wells 13 and 14 are 103 and 197 meters apart
table 7. Calculation of the C/L value
Parameter Concentration of Point 1 Standard C/L C/L
newpH 7.5 6–9 0.00 0.00
BOD 38.60 2.0 19.30 7.42
COD 148.32 10.0 14.83 6.85
Iron 0.08 0.3 0.27 0.27
Figure 1. Sampling points around Jabon Landfill (Marendra and Tangahu, 2020)

206
Journal of Ecological Engineering 2021, 22(3), 199–210
from the landfill, respectively. Although they are west of the landfill, there is still leachate seeping into shallow groundwater at that distance. How-ever, Well 16 has a higher Pollutant Index value because the well has an agricultural pen. The cage is less than 11 meters from the well, meaning that pollution can occur.
The variables used in this analysis were the in-dependent variables of Distance (X1) and Ground-water Depth (X2) and the dependent variable of
Water Quality Status (Y). A statistical test was per-formed using multiple regression methods.
From the SPSS output, it was found that the significance value of the Distance variable (X1) was 0.005 and the significance value of the Groundwater Depth variable (X2) was 0.000. Since the significance values of 0.005 and 0.000 are lower than 0.05, according to the basis for the decision-making in the t test, it can be con-cluded that Distance (X1) and the Initial Depth of
table 8. Groundwater quality status around the landfill (Marendra and Tangahu, 2020)
No. Sampling point Distance (m) Direction Pollution index Water quality status
1 Well 1 219 East 5.31 Moderate polluted
2 Well 2 241 East 4.79 Light polluted
3 Well 3 379 East 4.41 Light polluted
4 Well 4 485 East 3.23 Light polluted
5 Well 5 971 East 2.98 Light polluted
6 Well 6 1000 East 1.91 Light polluted
7 Well 7 196 South 5.45 Moderate polluted
8 Well 8 211 South 3.50 Light polluted
9 Well 9 353 South 2.91 Light polluted
10 Well 0 444 South 2.17 Light polluted
11 Well 11 710 South 1.32 Light polluted
12 Well 12 990 South 1.06 Light polluted
13 Well 13 103 West 2.76 Light polluted
14 Well 14 197 West 2.56 Light polluted
15 Well 15 391 West 1.42 Light polluted
16 Well 16 464 West 1.91 Light polluted
17 Well 17 707 West 1.39 Light polluted
18 Well 18 911 West 0.93 Good condition
19 Leachate 0 – 7.70 Moderate polluted
Figure 2. Pollution status based on the pollution index value
207
Journal of Ecological Engineering 2021, 22(3), 199–210
the Groundwater (X2) affects Water Quality (Y) (see Table 9).
Distance has an important role in the dis-tribution of contaminants. The distance to the landfill and the associated water quality status tend to be directly proportional. In other words, the closer the dug well is to the pollutant source, the greater the pollution. Dug wells provide wa-ter that comes from the groundwater relatively close to the soil surface, making it vulnerable to contamination through seepage from pollutant sources. The distribution of the leachate pollu-tion can be identified up to a depth of 15 meters. The effect of the depth of the groundwater level on the concentration of pollutants is in accor-dance with the depth of the groundwater level. This will determine the ability to reduce the pol-lutant content. The shallower the groundwater, the greater the likelihood of pollution is. The groundwater level is used as a reference to de-termine the effects of pollution.
The analysis of the pH values, COD and BOD concentrations in Jabon Landfill and in the wells around the landfill was also taken from the sec-ondary data based on the research by Mirwan and Saputra, (2018). According to the results of this study, the leachate content of Jabon Landfill is as shown in Table 10.
On the basis of this research, in order to deter-mine leachate contamination in the wells around Jabon Landfill, the samples were taken from the surface of the well water and at a depth of 1 m at a radius of 600 m, 800 m and 1,000 m from Jabon Landfill.
PH analysis results
The samples taken from the surface of the water and at a depth of 1 m at a radius of 600 m, 800 m, and 1,000 m indicate that the highest pH value was found in Wells 1 and 2 (radius 600 m) at 7.5. The lowest pH value was found in Wells 3, 4 and 5 (radius 1,000 m) at 7.2.
COD analysis results
The samples taken from the surface of the water and at a depth of 1 m at a radius of 600 m, 800 m, and 1,000 m showed that the highest COD value was found in Wells 1 and 2 (radius 600 m) at 148.32 mg/L. The lowest COD value was found in Wells 3, 4 and 5 (radius 1,000 m) at 15.68 mg/L.
BOD analysis results
The samples were taken from the surface of the water and at a depth of 1 m in a radius of 600 m, 800 m, and 1,000 m showed that the high-est BOD value was found in Wells 1 and 2 (radius 600 m) at 38.06 mg/L. The lowest BOD value was found in Wells 3, 4 and 5 (radius 1,000 m) at 8.01 mg/L. The quality of the water around Jabon Landfill can be seen in Table 11.
The results of the groundwater level mea-surements in each well at all points in each of the Eastern, Southern and Western regions were shown in Figures 3 to 5.
In the Eastern region, the well with the deep-est groundwater level was Well 4 at 1.2 m. The
table 10. Leachate concentration of Jabon Landfill
Parameter UnitResult
StandardI II
pH 8.4 8.4 6 – 9
COD mg/L 4,120.0 739.458 10
BOD mg/L 3,862.5 659.555 2
table 9. Multiple regression test (Marendra and Tangahu, 2020)
Coeficienta
ModelNon standardized coeficient Standardized coeficient
B Std. error Beta t sig
1 (Constant) 8.940 1.344 6.653 0.000
Distance (X1) -003 0.001 -629 -3.238 0.005
Groundwater depth (X2) -793 0.170 -758 -4.653 0.000
Dependent variable: Water Quality status (Y)
table 11. Fe concentration of the well water in Tambak Kalisogo Village, Jabon Sub-District, Sidoarjo District
Distance (m) Number of wells
Fe average(mg/L)
Standard* (mg/L)
0 – 50 5 1.694
0.351 – 100 6 0.797
101 – 150 4 0.106
151 – 200 5 0.081

208
Journal of Ecological Engineering 2021, 22(3), 199–210
Figure 5. Groundwater elevation in the Western Region
shallowest was Well 6 at an altitude of 0.9 m at a distance of 900 m from Jabon Landfill. In the southern region, the deepest groundwa-ter level was obtained at Well 12 at a distance of 911 m at a depth of 3.8 m. The shallowest groundwater level was at Well 7 at a distance of 103 m from Jabon Landfill obtained at a depth of 1.7 m. A depth of 1.4 m, which is the deepest groundwater level, was obtained at Well 17 at a distance of 710 m in the West Area. A depth of 0.9 m, which is the shallowest groundwater level, was obtained at Well 18 at a distance of 990 m in the same area.
table 13. Well water characteristics – frequency distributions based on the taste criteria in Tambak Kalisogo Village, Jabon Sub-District, Sidoarjo District
Distance (m)Taste criteria
Number of well Percentage (%)No taste Percent (%) Taste Percent (%)
0 – 50 3 60 2 40 5 100
51 – 100 2 33.3 4 66.7 6 100
101 – 150 2 50 2 50 4 100
151 – 200 5 100 - - 5 100
Total 12 60 8 40 20 100
table 12. Well water characteristics – frequency distributions based on turbidity criteria in Tambak Kalisogo Village, Jabon Sub-District, Sidoarjo District
Distance (m)Turbidity criteria
Number of well Percentage (%)Clear (n) Percent (%) Turbid (n) Percent
(%)0 – 50 - - 5 100 5 100
51 – 100 6 100 - - 6 100
101 – 150 4 100 - - 4 100
151 – 200 5 100 - - 5 100
Total 15 75 5 25 20 100
Figure 4. Groundwater elevation in the Southern Region
Figure 3. Groundwater elevation in the Eastern Region

209
Journal of Ecological Engineering 2021, 22(3), 199–210
CONCLUSIONS
On the basis of the obtained results and dis-cussion, it can be concluded that:1. The parameters related to the leachate char-
acteristics in the groundwater around Jabon Landfill such as pH have a higher value com-pared to the pH in Jabon Landfill at 7.2 to 7.5. The pH value in Jabon Landfill is 6.35. In ad-dition, the Fe parameter has a lower value, namely 1.694 in the groundwater well closest to Jabon Landfill. The further away from Jabon Landfill the well is, the lower the Fe concentra-tion, namely down to 0.081 at a distance of up to 200 meters.
2. The wells closer to Jabon Landfill showed as having a value closer to the leachate charac-teristics of Jabon Landfill. Details at 0 – 250 m indicates Lightly Polluted to Moderately Pol-luted, 251 – 500 m indicates Lightly Polluted and 501 – 1,000 m indicates Good to Lightly Polluted.
3. On the basis of the Pollution Index, the highest value was 5.45 at Well 7 located 196 m from Jabon Landfill. Meanwhile, the well furthest from Jabon Landfill at a distance of 1,000 m had a lightly polluted status with a Pollution Index of 1.91. The further the location of the well from Jabon Landfill, the lower the Pollu-tion Index is, showing that the pollution status tends to improve. Overall, the pollution status of the 18 wells examined shows that 2 wells are moderately polluted, 15 wells are lightly polluted and 1 well is in good condition.
Acknowledgement
The authors would like to show gratitude to The Ministry of Research and Technology, Pro-gram of Research Technology National Research and Innovation Agency (RISTEKBRIN) for the full financial support. The authors also thank to The Directorate of Research and Community Service (DRPM), Institut Teknologi Sepuluh Nopember for the letter of agreement for the im-plementation of basic research.
REFERENCES
1. Adamcová, D., Vaverková, M.D., Bartoň, S., Havlíček, Z., Břoušková, E., 2016. Soil Contami-nation In Landfills: A Case Study Of A Landfill In
Czech Republic. Solid Earth, 7(1), 239–247. https://doi.org/10.5194/se-7–239–2016
2. Adeolu, A.O., Ada, O. V, Gbenga, A.A., Adebayo, O.A., 2011. Assessment of groundwater contami-nation by leachate near a municipal solid waste landfill. African J. Environ. Sci. Technol., 5(11), 933–940. https://doi.org/10.5897/AJEST11.272
3. Afolayan, O.S., Ogundele, F.O., 2012. Compara-tive analysis of the effect of closed and operational land-fills on groundwater quality in Solous, Lagos Nigeria. J. Appl. Technol. Environ. Sanit., 1(4), 52–58.
4. Bhattacharya, A.K., 2010. Artificial ground water recharge with a special reference to India. Int. J. Res. Rev. Appl. Sci., 4(7), 214–221.
5. Calvo, F., Moreno, B., Zamorano, M., Szanto, M., 2005. Environmental diagnosis methodol-ogy for municipal waste landfills. Waste Manage-ment, 25(8), 768–779. https://doi.org/10.1016/j.wasman.2005.02.019
6. Gworek, B., Dmuchowski, W., Koda, E., Marecka, M., Baczewska, A.H., Bragoszewska, P., Sieczka, A., Osiński, P., 2016. Impact of the municipal solid waste Lubna landfill on environmental pollution by heavy metals. Water (Switzerland), 8(10), 56–83. https://doi.org/10.3390/w8100470
7. Han, Z., Ma, H., Shi, G., He, L., Wei, L., Shi, Q., 2016. A review of groundwater contamination near municipal solid waste landfill sites in China. Sci. Total Environ., 569(31), 85–91. https://doi.org/10.1016/j.scitotenv.2016.06.201
8. Juliardi, A.R.N.R., Wiyanti, R.I., 2018. The test ability of fish tawes to leachate garbage dump (TPA) Benowo. In: Journal of Physics: Conference Series. https://doi.org/10.1088/1742–6596/953/1/012223
9. Koda, E., 2012. Influence of vertical barrier sur-rounding old sanitary landfill on eliminating trans-port of pollutants on the basis of numerical model-ing and monitoring results. Polish J. Environ. Stud., 21(4), 929–935.
10. Koda, E., Osinski, P., Sieczka, A., Wychowaniak, D., 2015. Areal distribution of ammonium contam-ination of soil-water environment in the vicinity of old municipal landfill site with vertical barrier. Water (Switzerland), 7(6), 2656–2672. https://doi.org/10.3390/w7062656
11. Koda, E., Tkaczyk, A., Lech, M., Osiński, P., 2017. Application of electrical resistivity data sets for the evaluation of the pollution concentration level with-in landfill subsoil. Appl. Sci., 7(3), 53–70. https://doi.org/10.3390/app7030262
12. Kostova, I., 2006. Leachate from sanitary landfills–origin, characteristics, treatment. University Of Architecture. Civ. Eng. Geod. Summer Sch. 26e29 July. 54(1), 310–329.

210
Journal of Ecological Engineering 2021, 22(3), 199–210
13. Lee, S.-I, Kitanidis, P.K., 1993. Analysis of ground-water flow and travel times for a landfill site in an arid region with a thick vadose zone. Hydrol. Process., 7(4), 373–387. https://doi.org/10.1002/hyp.3360070404
14. Ling, C., Zhang, Q., 2017. Evaluation of surface water and groundwater contamination in a MSW landfill area using hydrochemical analysis and elec-trical resistivity tomography: A case study in Si-chuan Province, Southwest China. Environ. Monit. Assess., 189(4), 65–95. https://doi.org/10.1007/s10661–017–5832–7
15. Longe, E.O., Balogun, M.R., 2010. Groundwater quality assessment near a municipal landfill, La-gos, Nigeria. Res. J. Appl. Sci. Eng. Technol., 2(1), 39–44.
16. Lumban Gaol, M., Warmadewanthi, I.D.A.A., 2017. Prediksi dampak lingkungan pengelolaan sampah di TPA Jabon, Kabupaten Sidoarjo. J. Tek. ITS, 6(2), https://doi.org/10.12962/j23373539.v6i2.25127
17. Marendra S.M.P., Tangahu B.V. 2020. Study of leachate penetration in shallow groundwater around Jabon Landfill Sidoarjo. IOP Conf. Ser. Earth Envi-ron. Sci., 506(1).
18. Moh. Mirwan, A.F.B.S., 2018. Evaluasi pencema-ran lindi pada air sumur sekitar TPA Jabon. J. En-virotek, 10(2), 856–871. https://doi.org/10.33005/envirotek.v10i2.1235
19. Mor, S., Ravindra, K., Dahiya, R.P., Chandra, A., 2006. Leachate characterization and assessment of groundwater pollution near municipal solid waste landfill site. Environ. Monit. Assess. 118(1–3). 435–456. https://doi.org/10.1007/s10661–006–1505–7
20. Pande, G., Sinha, A., Agrawal, S., 2015. Impacts of leachate percolation on ground water quality: A Case study of Dhanbad City. Glob. Nest J., 17(1), 162–174. https://doi.org/10.30955/gnj.001377
21. Selvam, S., Dar, F.A., Magesh, N.S., Singaraja, C., Venkatramanan, S., Chung, S.Y., 2016. Applica-tion Of Remote Sensing And GIS For Delineating Groundwater Recharge Potential Zones Of Kovil-patti Municipality, Tamil Nadu Using IF Technique. Earth Sci. Informatics, 9(2), 137–150. https://doi.org/10.1007/s12145–015–0242–2
22. Vinet, L., Zhedanov, A., 2011. A “missing” family of classical orthogonal polynomials. J. Phys. A Math. Theor., 44(8), 65–89. https://doi.org/10.1088/1751–8113/44/8/085201