shaik mastan vali ppt
TRANSCRIPT

8/6/2019 Shaik Mastan Vali Ppt
http://slidepdf.com/reader/full/shaik-mastan-vali-ppt 1/20
8/6/2019 Shaik Mastan Vali Ppt
http://slidepdf.com/reader/full/shaik-mastan-vali-ppt 2/20
NAME : SHAIK MASTANVALI
REGD NO : 109227402043.
SPECIALIZATION : FINANCE &MARKETING.
AGGREGATE : 6.8
STRENGTHS : HARDWORKING AND SELF MOTIVATION

8/6/2019 Shaik Mastan Vali Ppt
http://slidepdf.com/reader/full/shaik-mastan-vali-ppt 3/20
SEMESTER-I
101 Perspectives of Management
102 Accounting for Management
103 Business Environment
104 Managerial Economics
105 Managerial Communication
Skills
106 Organizational Behaviour107 Quantitative Techniques for
Management
SEMESTER -II
201 Marketing Management
202 Financial Management
203 Human Resource Management
204 Operations Management
205 Corporate Legal Framework
206 Computer Applications in
Management
207 Research Methodology for
Management

8/6/2019 Shaik Mastan Vali Ppt
http://slidepdf.com/reader/full/shaik-mastan-vali-ppt 4/20
SEMESTER -III301 Business Policy & Strategic
Management
302 Operations Research
303 International Business
304 Financial Markets & Services
305 Security Analysis & Portfolio
Management
305 Consumer Behaviour & Customer
Relationship Management
305 Sales & Distribution Management
SEMESTER -IV
401 Entrepreneurship & Small Business
Management
402 Financial Derivatives
403 Strategic Financial Management
404 International Financial Management
402 Services Marketing
403 Advertising and Brand Management
404 Global Marketing
Industrial Visits : 12

8/6/2019 Shaik Mastan Vali Ppt
http://slidepdf.com/reader/full/shaik-mastan-vali-ppt 5/20
TOPIC:FINANCIAL STATEMENT ANALYSIS

8/6/2019 Shaik Mastan Vali Ppt
http://slidepdf.com/reader/full/shaik-mastan-vali-ppt 6/20
` To know the current financial position of the company
` To evaluate the short term and long term solvency
position of the company
` To study the company¶s profitability position
` To offer suggestions if any for better financial
performance of the company.
To evaluate the performance of the company ensuring
various accounting and financial tools as a yardstick to
measure the efficiency of the company
8/6/2019 Shaik Mastan Vali Ppt
http://slidepdf.com/reader/full/shaik-mastan-vali-ppt 7/20
To know the prospects of each company
To know the liquidity position of the company
To know the solvency position of the company
To know the profitability performance of the
company
To know the funds flow & cash flow analysis
represents the figures containing the condensed
report of the position development and problems of
the concern.

8/6/2019 Shaik Mastan Vali Ppt
http://slidepdf.com/reader/full/shaik-mastan-vali-ppt 8/20
Methodology, describes the method of achievingobjectives through collection of data, the data collected can be either primary or secondary. The above information iscarried on with the cooperation of management of ICM LTD.
Primary Data
` Most of the Information is collected from internal interviews& discussion with various officials in the finance departmentsand concerned executives & other departments.
Secondary Data
` The information is collected from the financial statementsand its information brochures of the organization information brochures of the organization. The data collected fromvarious years books published articles & published annualreports of ICM LTD and other materials.

8/6/2019 Shaik Mastan Vali Ppt
http://slidepdf.com/reader/full/shaik-mastan-vali-ppt 9/20
Idupulapadu Cotton mills was established in 2000
with 13,000 spindles with the expansion of 10,000 spindlesevery year, it is now equipped with 60,000 spindles capacityand have the capacity to produce 20 tons of ring spun, 6 tonsof open and 4 tons of ring doubling and tfo yarns 100% cottonyarns per day.
` The mill has a complete range of Lakshmi Trumac Machineryfrom blow room to spinning departments with Muratec andsavio auto corners.
` All the blow lines are connected to the cards with the chute
system, which inturn is connected with automatic wastecollection system.
` The company has a strong clientele based at different regionsof Andhra Pradesh, Gujarat, Karnataka, Maharastra, Rajasthanand Tamil Nadu.
8/6/2019 Shaik Mastan Vali Ppt
http://slidepdf.com/reader/full/shaik-mastan-vali-ppt 10/20
INDUSTRY PROFILE` Cotton is a soft, staple fiber that grows around the
seeds of the cotton plant. It is a natural fiber harvestedfrom the cotton plant. The fiber most often is spun intoyarn or thread and used to make a soft, breathable
textile, which is the most widely used natural-fiber cloth in clothing today.
Processing of Cotton in India
` In India the raw cotton, also called as Kapas is
processed in a multi-stage process described as below.The Products of processing are
` Yarn.
` Cottonseed Oil.
` Cottonseed Meal.
8/6/2019 Shaik Mastan Vali Ppt
http://slidepdf.com/reader/full/shaik-mastan-vali-ppt 11/20
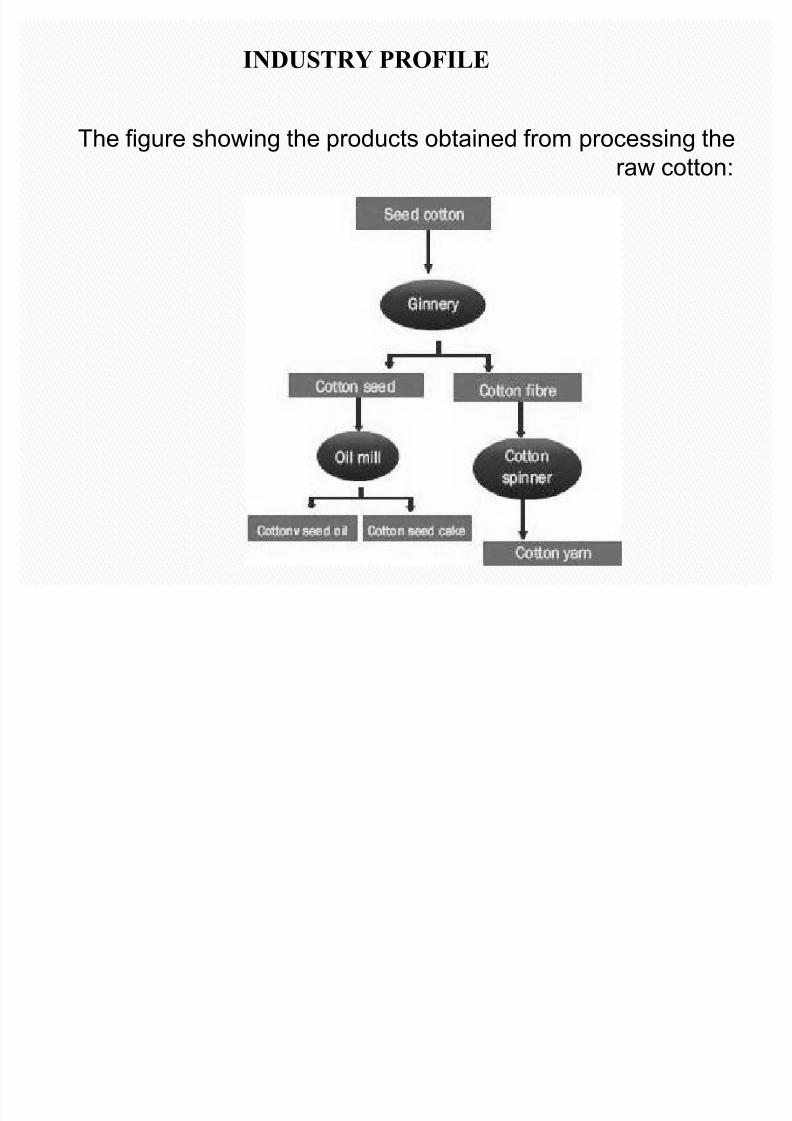
The figure showing the products obtained from processing theraw cotton:
INDUSTRY PROFILE
8/6/2019 Shaik Mastan Vali Ppt
http://slidepdf.com/reader/full/shaik-mastan-vali-ppt 12/20
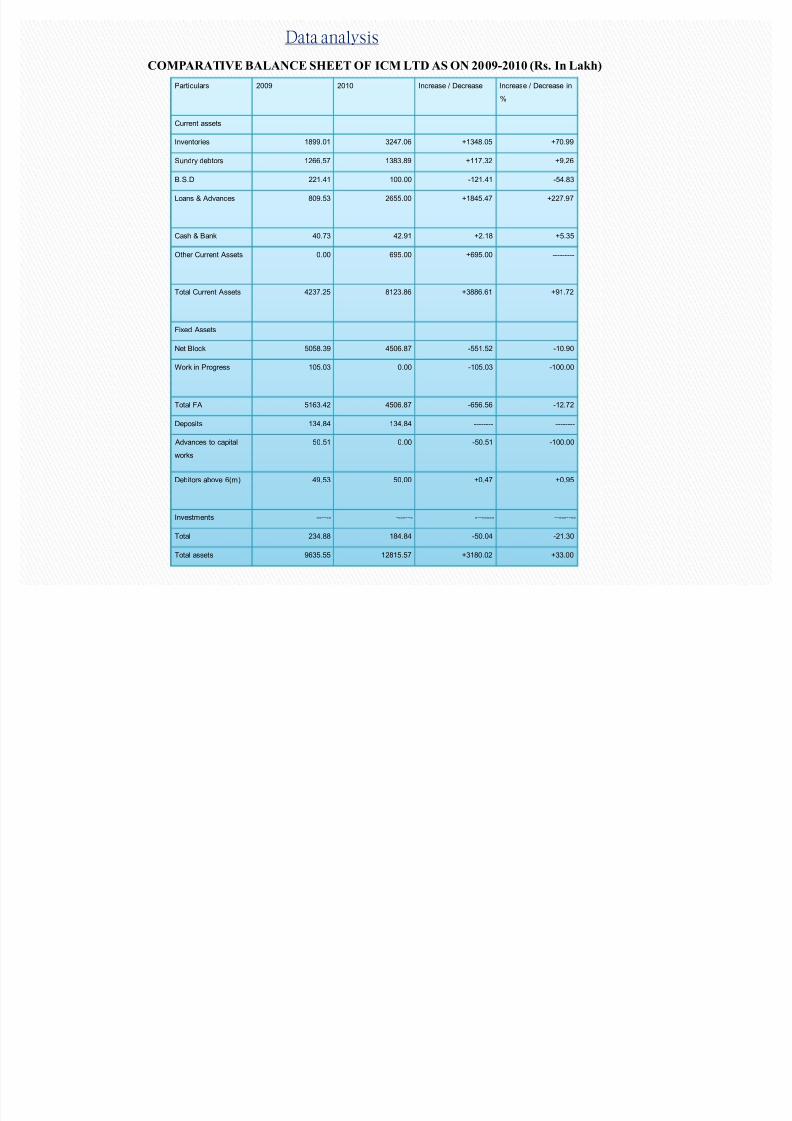
Particulars 2009 2010 Increase / Decrease Increase / Decrease in
%
Current assets
Inventories 1899.01 3247.06 +1348.05 +70.99
Sundry debtors 1266.57 1383.89 +117.32 +9.26
B.S.D 221.41 100.00 -121.41 -54.83
Loans & Advances 809.53 2655.00 +1845.47 +227.97
Cash & Bank 40.73 42.91 +2.18 +5.35
Other Current Assets 0.00 695.00 +695.00 ---------
Total Current Assets 4237.25 8123.86 +3886.61 +91.72
Fixed Assets
Net Block 5058.39 4506.87 -551.52 -10.90
Work in Progress 105.03 0.00 -105.03 -100.00
Total FA 5163.42 4506.87 -656.56 -12.72
Deposits 134.84 134.84 -------- --------
Advances to capital
works
50.51 0.00 -50.51 -100.00
Debitors above 6(m) 49.53 50.00 +0.47 +0.95
Investments ------ ------- -------- ---------
Total 234.88 184.84 -50.04 -21.30
Total assets 9635.55 12815.57 +3180.02 +33.00
COMPARATIVE BALANCE SHEET OF ICM LTD AS ON 2009-2010 (Rs. In Lakh)
Data analysis

8/6/2019 Shaik Mastan Vali Ppt
http://slidepdf.com/reader/full/shaik-mastan-vali-ppt 13/20
Liabilities (Rs. In Lakh) 2009 2010 Increase / Decrease Increase /Decrease in %
Current Liabilities
TMB OCC 1380.08 4000.00 +2619.92 +189.84
TMB OD 8.79 0.00 -8.79 -100.00
Sundry Creditors 646.91 713.15 +66.24 +10.24
Other current liabilities 776.82 1000.00 +223.18 +28.73
Interest on term loans 28.83 0.00 -28.83 +100.00
IT Provision 3.47 25.00 +21.53 +620.46
Total current liabilities 2844.9 5738.15 +2893.25 +101.69
Term liabilities
Unsecured loans 392.92 400.00 +7.08 +1.80
Sales tax department 489.74 690.00 +200.26 +40.89
Term loans TMB 1468.31 1086.16 -382.15 -26.03
Term loans Andhra Bank 1623.01 1735.39 +112.38 +6.92
Creditors for capital works 30.15 0.00 -30.15 -------
Total Term liabilities 4004.13 3911.5 -92.58 -2.31
Share Holders Fund
Share Capital 783.66 783.66 -------- -------
Share application money 214.91 214.91 ------- -------
Reserves & surplus 1787.95 2167.30 +379.35 +21.22
2786.52 3165.87 +379.35 +21.22
Total liabilities 9635.55 12815.57 +3180.02 +33.00
8/6/2019 Shaik Mastan Vali Ppt
http://slidepdf.com/reader/full/shaik-mastan-vali-ppt 14/20
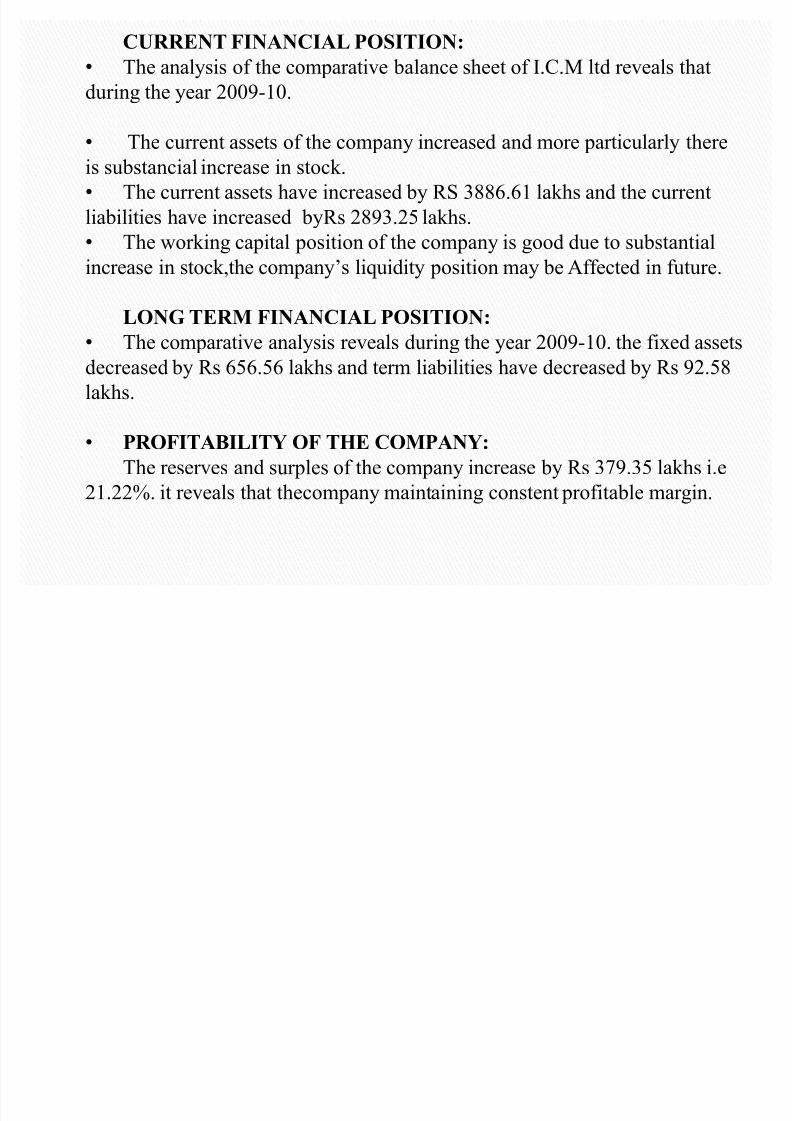
CURRENT FINANCIAL POSITION:
� The analysis of the comparative balance sheet of I.C.M ltd reveals that
during the year 2009-10.
� The current assets of the company increased and more particularly there
is substancial increase in stock.
� The current assets have increased by RS 3886.61 lakhs and the current
liabilities have increased byRs 2893.25 lakhs.
� The working capital position of the company is good due to substantial
increase
in
stock,the company¶s
liquidity
position
may
be
Affected
in
future.
LONG TERM FINANCIAL POSITION:
� The comparative analysis reveals during the year 2009-10. the fixed assets
decreased by Rs 656.56 lakhs and term liabilities have decreased by Rs 92.58
lakhs.
� PROFITABILITY OF THE COMPANY:
The reserves and surples of the company increase by Rs 379.35 lakhs i.e
21.22%. it reveals that thecompany maintaining constent profitable margin.
8/6/2019 Shaik Mastan Vali Ppt
http://slidepdf.com/reader/full/shaik-mastan-vali-ppt 15/20
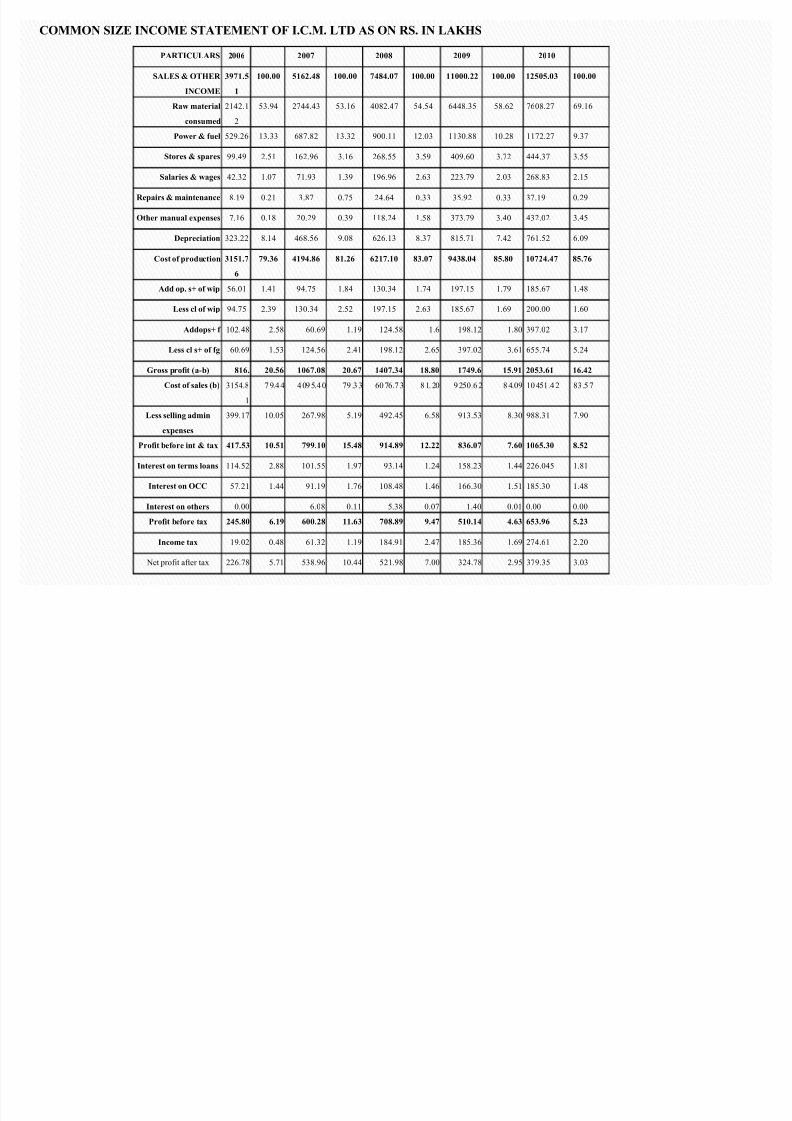
PARTICULARS 2006 2007 2008 2009 2010
SALES & OTHER
INCOME
3971.5
1
100.00 5162.48 100.00 7484.07 100.00 11000.22 100.00 12505.03 100.00
Raw material
consumed
2142.1
2
53.94 2744.43 53.16 4082.47 54.54 6448.35 58.62 7608.27 69.16
Power & fuel 529.26 13.33 687.82 13.32 900.11 12.03 1130.88 10.28 1172.27 9.37
Stores & spares 99.49 2.51 162.96 3.16 268.55 3.59 409.60 3.72 444.37 3.55
Salaries & wages 42.32 1.07 71.93 1.39 196.96 2.63 223.79 2.03 268.83 2.15
Repairs & maintenance 8.19 0.21 3.87 0.75 24.64 0.33 35.92 0.33 37.19 0.29
Other manual expenses 7.16 0.18 20.29 0.39 118.24 1.58 373.79 3.40 432.02 3.45
Depreciation 323.22 8.14 468.56 9.08 626.13 8.37 815.71 7.42 761.52 6.09
Cost of production 3151.7
6
79.36 4194.86 81.26 6217.10 83.07 9438.04 85.80 10724.47 85.76
Add op. s+ of wip 56.01 1.41 94.75 1.84 130.34 1.74 197.15 1.79 185.67 1.48
Less cl of wip 94.75 2.39 130.34 2.52 197.15 2.63 185.67 1.69 200.00 1.60
Addops+ f 102.48 2.58 60.69 1.19 124.58 1.6 198.12 1.80 397.02 3.17
Less cl s+ of fg 60.69 1.53 124.56 2.41 198.12 2.65 397.02 3.61 655.74 5.24
Gross profit (a-b) 816. 20.56 1067.08 20.67 1407.34 18.80 1749.6 15.91 2053.61 16.42
Cost of sales (b) 3154.8
1
7 9.4 4 4 09 5.4 0 79 .3 3 60 76.7 3 8 1. 20 9 250 .6 2 8 4.09 10 451 .4 2 83 .5 7
Less selling admin
expenses
399.17 10.05 267.98 5.19 492.45 6.58 913.53 8.30 988.31 7.90
Profit before int & tax 417.53 10.51 799.10 15.48 914.89 12.22 836.07 7.60 1065.30 8.52
Interest on terms loans 114.52 2.88 101.55 1.97 93.14 1.24 158.23 1.44 226.045 1.81
Interest on OCC 57.21 1.44 91.19 1.76 108.48 1.46 166.30 1.51 185.30 1.48
Interest on others 0.00 6.08 0.11 5.38 0.07 1.40 0.01 0.00 0.00
Profit before tax 245.80 6.19 600.28 11.63 708.89 9.47 510.14 4.63 653.96 5.23
Income tax 19.02 0.48 61.32 1.19 184.91 2.47 185.36 1.69 274.61 2.20
Net profit after tax 226.78 5.71 538.96 10.44 521.98 7.00 324.78 2.95 379.35 3.03
COMMON SIZE INCOME STATEMENT OF I.C.M. LTD AS ON RS. IN LAKHS
8/6/2019 Shaik Mastan Vali Ppt
http://slidepdf.com/reader/full/shaik-mastan-vali-ppt 16/20
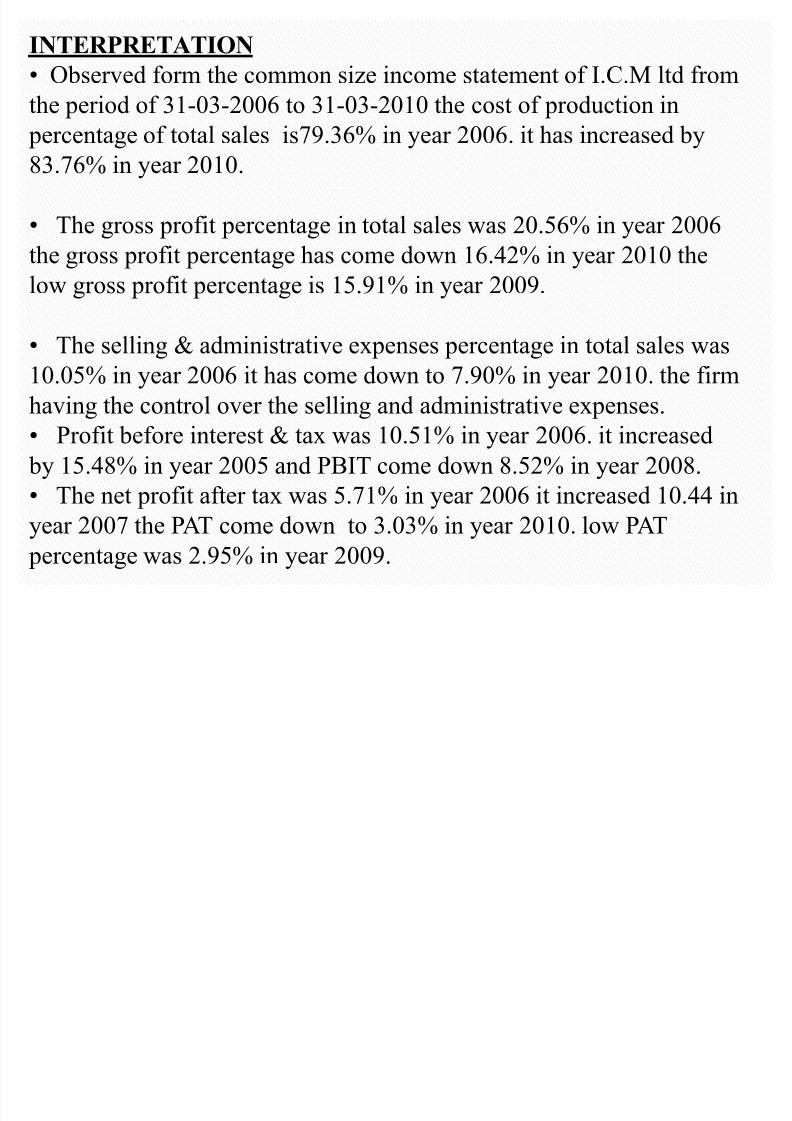
INTERPRETATION
� O bserved form the common size income statement of I.C.M ltd from
the period of 31-03-2006 to 31-03-2010 the cost of production in
percentage of total sales is79.36% in year 2006. it has increased by 83.76% in year 2010.
� The gross profit percentage in total sales was 20.56% in year 2006
the gross profit percentage has come down 16.42% in year 2010 the
low gross profit percentage is 15.91% in year 2009.
� The selling & administrative expenses percentage in total sales was
10.05% in year 2006 it has come down to 7.90% in year 2010. the firm
having the
control
over
the
selling
and
administrative
expenses.
� Profit before interest & tax was 10.51% in year 2006. it increased
by 15.48% in year 2005 and PBIT come down 8.52% in year 2008.
� The net profit after tax was 5.71% in year 2006 it increased 10.44 in
year 2007 the PAT come down to 3.03% in year 2010. low PAT
percentage was 2.95% in year 2009.
8/6/2019 Shaik Mastan Vali Ppt
http://slidepdf.com/reader/full/shaik-mastan-vali-ppt 17/20
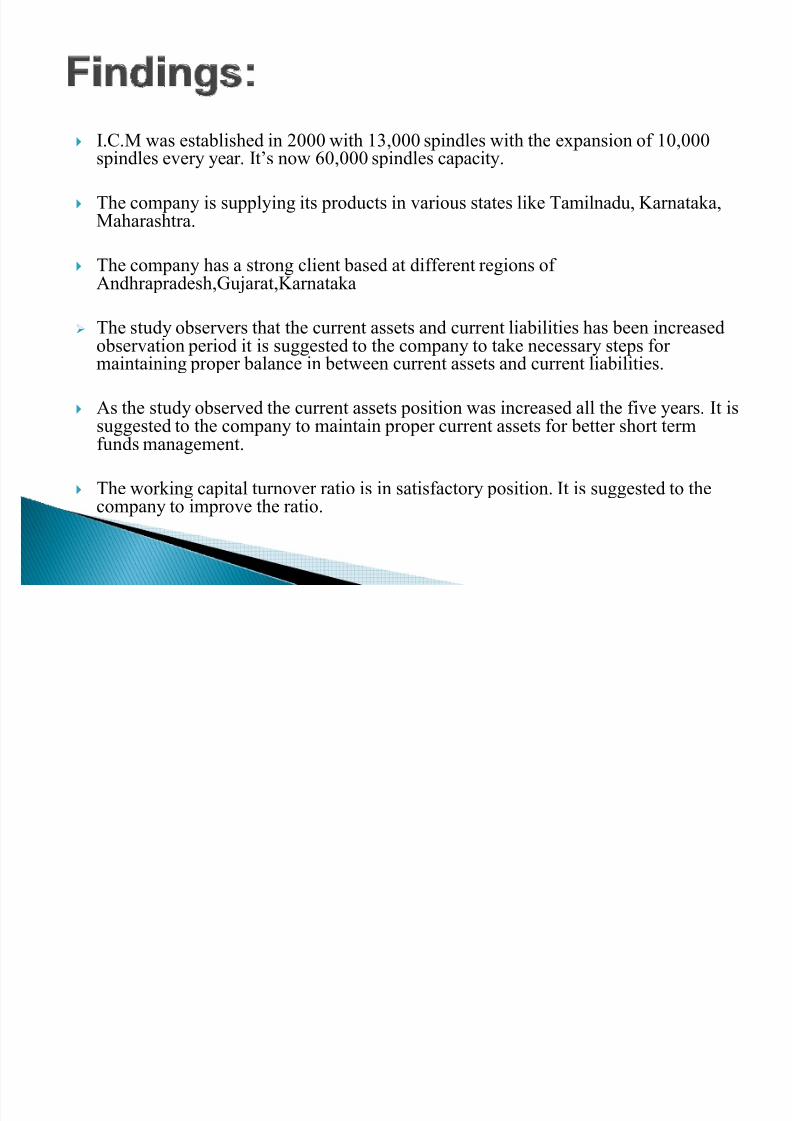
` I.C.M was established in 2000 with 13,000 spindles with the expansion of 10,000 spindles every year. It¶s now 60,000 spindles capacity.
` The company is supplying its products in various states like Tamilnadu, Karnataka, Maharashtra.
` The company has a strong client based at different regions of Andhrapradesh,Gujarat,Karnataka
The study observers that the current assets and current liabilities has been increased
observation period it is suggested to the company to take necessary steps for maintaining proper balance in between current assets and current liabilities.
`
As the
study
observed
the
current
assets
position
was
increased
all
the
five
years.
It
is
suggested to the company to maintain proper current assets for better short term
funds management.
` The working capital turnover ratio is in satisfactory position. It is suggested to the
company to improve the ratio.
8/6/2019 Shaik Mastan Vali Ppt
http://slidepdf.com/reader/full/shaik-mastan-vali-ppt 18/20
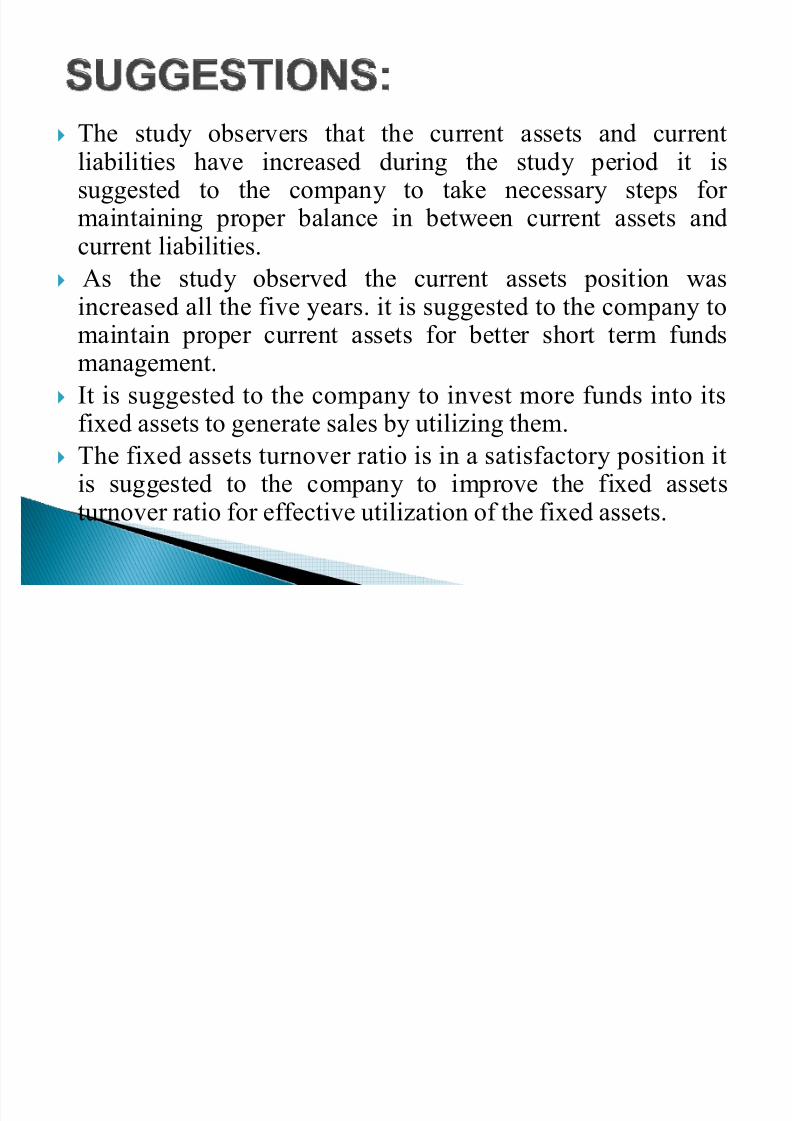
` The study observers that the current assets and currentliabilities have increased during the study period it issuggested to the company to take necessary steps for maintaining proper balance in between current assets andcurrent liabilities.
` As the study observed the current assets position wasincreased all the five years. it is suggested to the company tomaintain proper current assets for better short term fundsmanagement.
` It is suggested to the company to invest more funds into its
fixed assets to generate sales by utilizing them.` The fixed assets turnover ratio is in a satisfactory position it
is suggested to the company to improve the fixed assetsturnover ratio for effective utilization of the fixed assets.
8/6/2019 Shaik Mastan Vali Ppt
http://slidepdf.com/reader/full/shaik-mastan-vali-ppt 19/20
` FINANCIAL MANAGEMENT Prasanna Chandra(theory and practice)
` FINANCIAL MANAGEMENT Khan and Jain
`
FINANCIAL MANAGEMENT I.M.P
andey
` FINANCIAL MANAGEMENT PRINCIPLES Dr.S.N.Maheswary AND PR ACTICE
` Website:
` www.google.com` www.icmtex.com

8/6/2019 Shaik Mastan Vali Ppt
http://slidepdf.com/reader/full/shaik-mastan-vali-ppt 20/20