sgma meeting -- 04 october 2003 -- dallas, tx university of massachusetts lowell baseball research...
TRANSCRIPT

SGMA Meeting -- 04 October 2003 -- Dallas, TXUniversity of Massachusetts LowellBaseball Research Center 1
James A. SherwoodPatrick J. Drane
SGMA Meeting 04 October 2003
An Experimental Investigation of Workhardening Effect of Aluminum Bats

SGMA Meeting -- 04 October 2003 -- Dallas, TXUniversity of Massachusetts LowellBaseball Research Center 2
Introduction
Effect of Use on Aluminum Baseball Bat Performance
• Machine testing
• Field hitting
SGMA Meeting -- 04 October 2003 -- Dallas, TXUniversity of Massachusetts LowellBaseball Research Center 3
Outline
• Background
• Test Methodologies
• Analysis Methodologies
• Effect of Use Results
• Conclusions
• Recommendations

SGMA Meeting -- 04 October 2003 -- Dallas, TXUniversity of Massachusetts LowellBaseball Research Center 4
Outline
• Background• Test Methodologies• Analysis Methodologies• Effect of Use Results• Conclusions• Recommendations
•Motivation•History•UMLBRC•Past Research•Theory
SGMA Meeting -- 04 October 2003 -- Dallas, TXUniversity of Massachusetts LowellBaseball Research Center 5
Motivation for Research
• Maintaining the integrity of collegiate baseball
• Increased interest in what drives changes in performance

SGMA Meeting -- 04 October 2003 -- Dallas, TXUniversity of Massachusetts LowellBaseball Research Center 6
Effect of Use
• Aluminum bats can be used for a long period of time
• Aluminum bats are certified for the NCAA with a performance limit– Concern: An increase in performance resulting
from use of a bat could cause certified bat to exceed limit

SGMA Meeting -- 04 October 2003 -- Dallas, TXUniversity of Massachusetts LowellBaseball Research Center 7
UMLBRC
• Established in 1998
• Research testing for MLB
• Official certification center for all bats used in NCAA and high school baseball
SGMA Meeting -- 04 October 2003 -- Dallas, TXUniversity of Massachusetts LowellBaseball Research Center 8
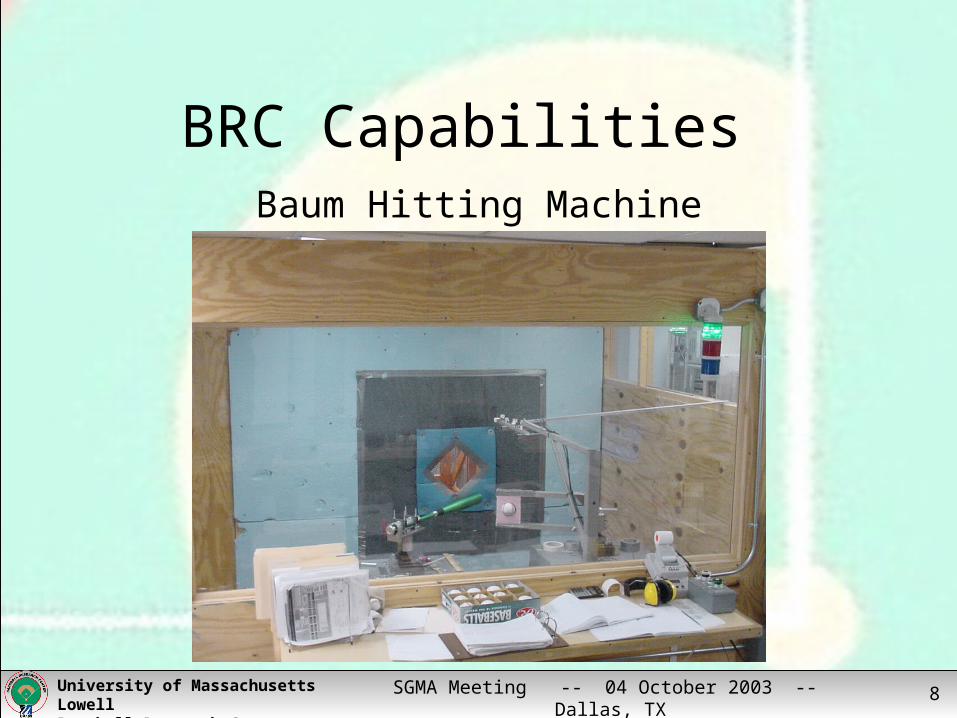
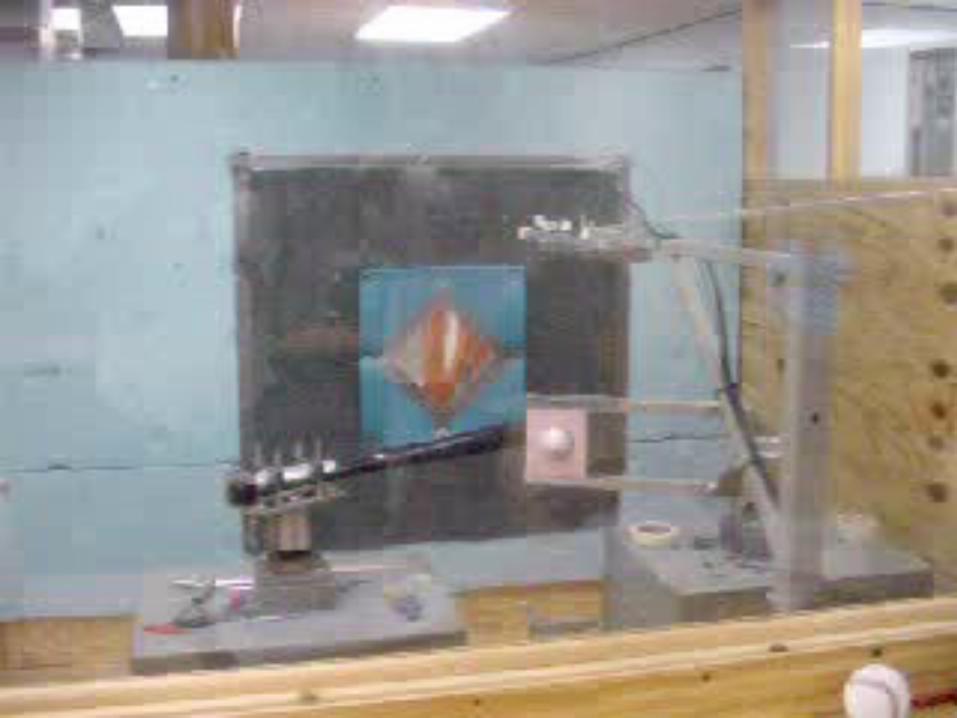
BRC Capabilities Baum Hitting Machine
SGMA Meeting -- 04 October 2003 -- Dallas, TXUniversity of Massachusetts LowellBaseball Research Center 9

SGMA Meeting -- 04 October 2003 -- Dallas, TXUniversity of Massachusetts LowellBaseball Research Center 10
UMLBRC Capabilities• 3-Pt Bend Testing • Modal Testing
• Finite Element Modeling
• Baseball Dissection
• COR Testing
SGMA Meeting -- 04 October 2003 -- Dallas, TXUniversity of Massachusetts LowellBaseball Research Center 11
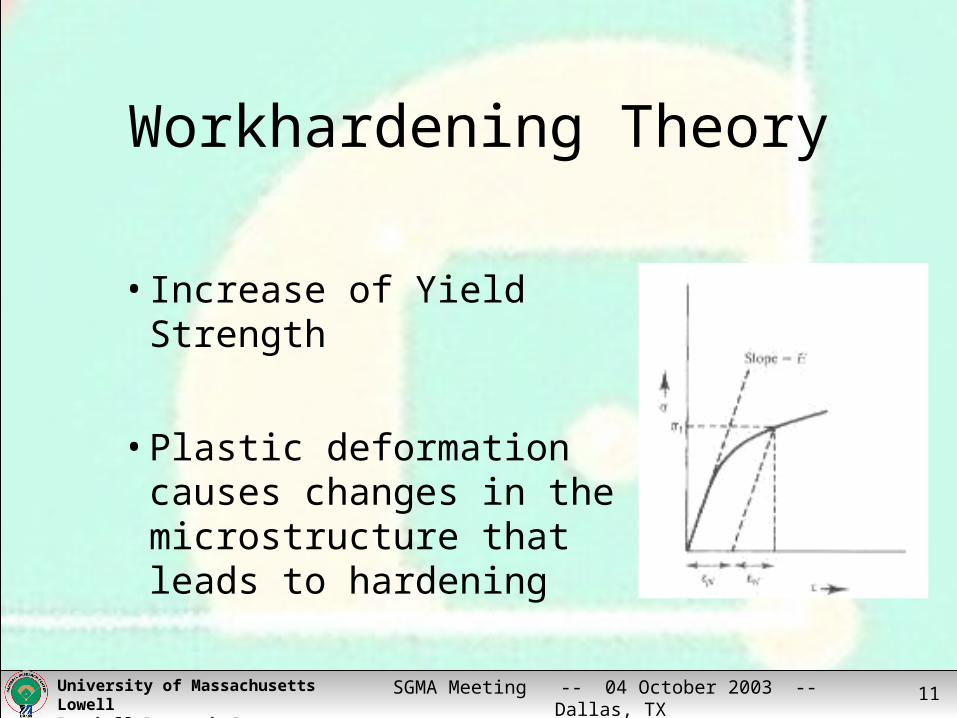
Workhardening Theory
• Increase of Yield Strength
• Plastic deformation causes changes in the microstructure that leads to hardening
SGMA Meeting -- 04 October 2003 -- Dallas, TXUniversity of Massachusetts LowellBaseball Research Center 12
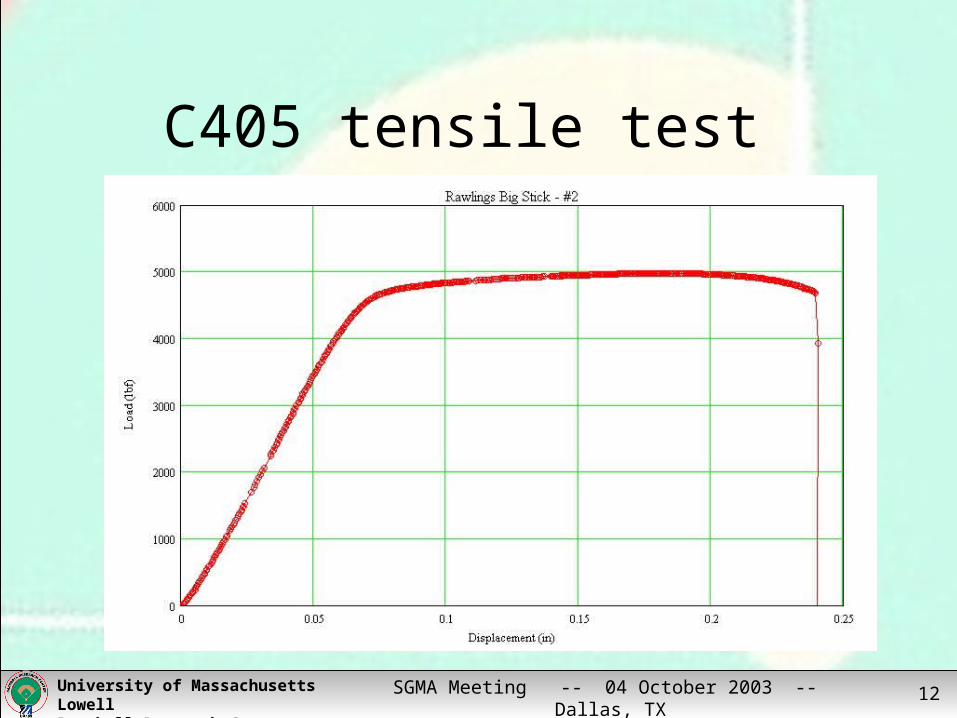
C405 tensile test

SGMA Meeting -- 04 October 2003 -- Dallas, TXUniversity of Massachusetts LowellBaseball Research Center 13
Terminology
• Bat Performance
• Sweet Spot
• Certification Cycle
• The Bat Knob Handle Throat / Taper Barrel Tip
SGMA Meeting -- 04 October 2003 -- Dallas, TXUniversity of Massachusetts LowellBaseball Research Center 14
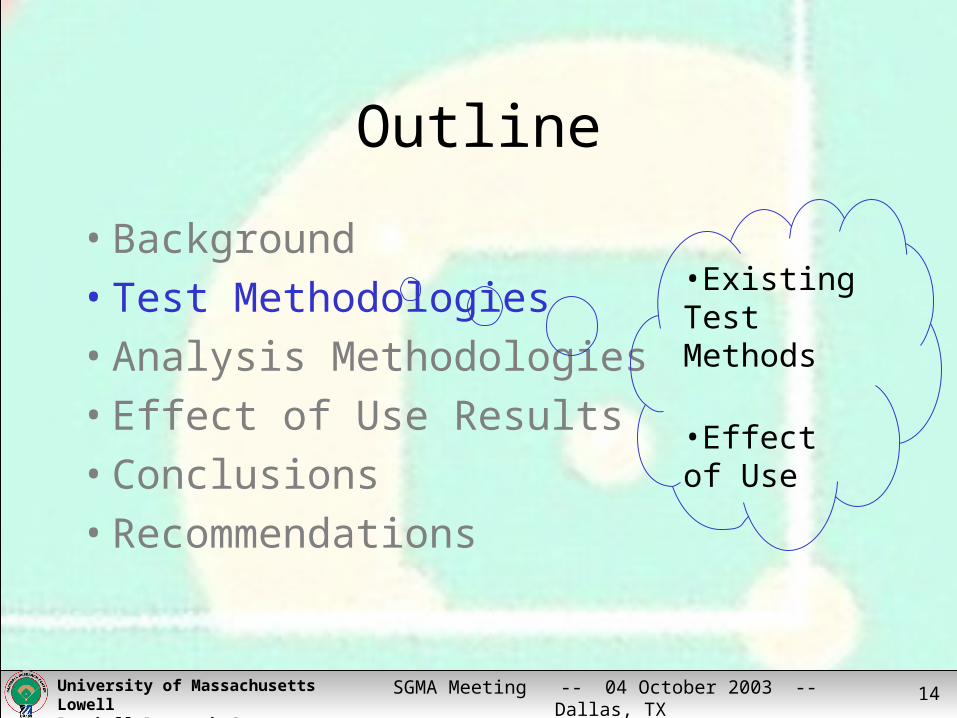
Outline
• Background
• Test Methodologies
• Analysis Methodologies
• Effect of Use Results
• Conclusions
• Recommendations
•Existing Test Methods
•Effect of Use
SGMA Meeting -- 04 October 2003 -- Dallas, TXUniversity of Massachusetts LowellBaseball Research Center 15
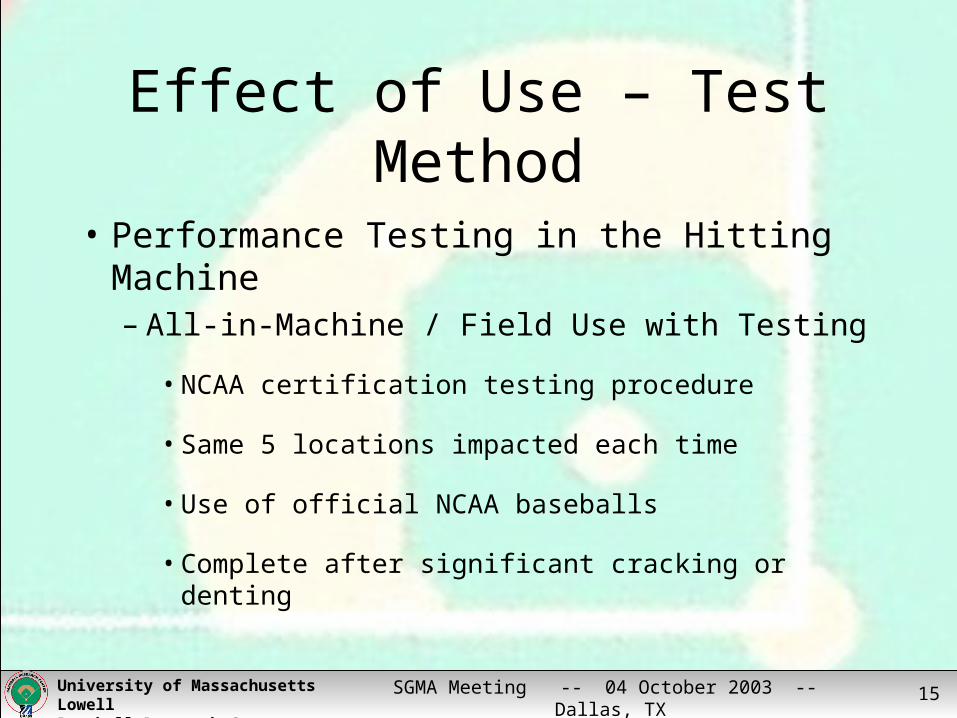
Effect of Use – Test Method
• Performance Testing in the Hitting Machine– All-in-Machine / Field Use with Testing
• NCAA certification testing procedure
• Same 5 locations impacted each time
• Use of official NCAA baseballs
• Complete after significant cracking or denting

SGMA Meeting -- 04 October 2003 -- Dallas, TXUniversity of Massachusetts LowellBaseball Research Center 16
Outline
• Background
• Test Methodologies
• Analysis Methodologies
• Effect of Use Results
• Conclusions
• Recommendations
•BESR•95% confidence•t-test•Control Charts

SGMA Meeting -- 04 October 2003 -- Dallas, TXUniversity of Massachusetts LowellBaseball Research Center 17
vV
vVv
BESR
2
)375.5(
)375.11(
Ll
lVV C
BESRConservation of Momentum
&Coefficient of Restitution
btb ve
Ve
v
11
1
btb vVv 2
12
1
)1(2
21
e
=BESR=ƒ(e,μ)
)( tbtb VveVv
bbttbbtt vmVMvmVM
SGMA Meeting -- 04 October 2003 -- Dallas, TXUniversity of Massachusetts LowellBaseball Research Center 18
Outline
• Background
• Test Methodologies
• Analysis Methodologies
• Effect of Use Results
• Conclusions
• Recommendations
•Performance•Surface Deformation•Hardness•Microscopy
SGMA Meeting -- 04 October 2003 -- Dallas, TXUniversity of Massachusetts LowellBaseball Research Center 19
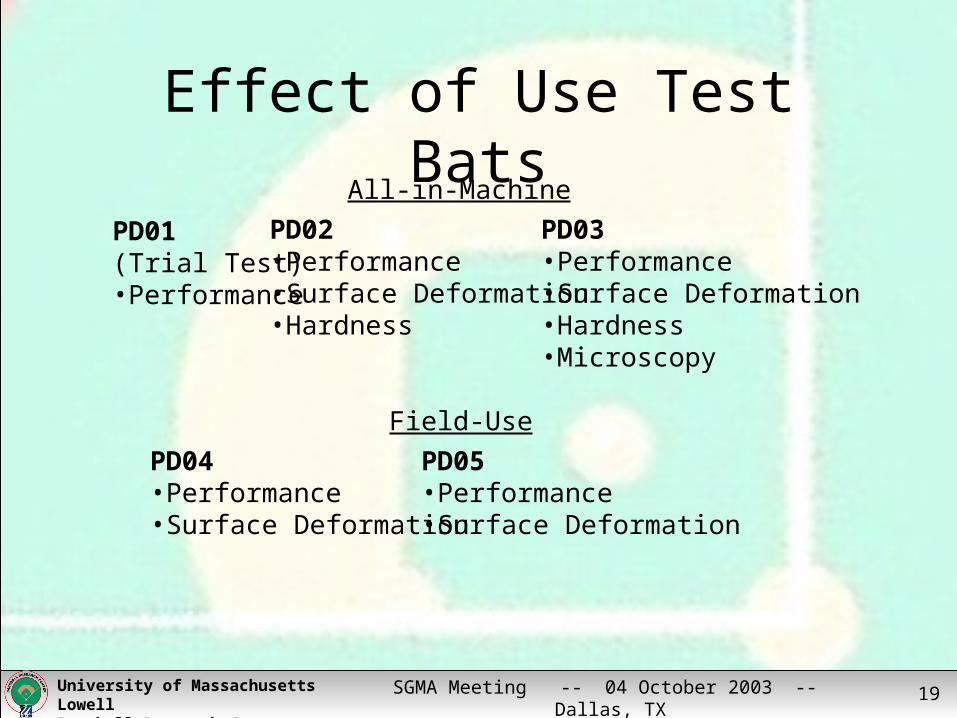
Effect of Use Test Bats
PD01(Trial Test)•Performance
PD02•Performance•Surface Deformation•Hardness
PD03•Performance•Surface Deformation•Hardness•Microscopy
PD04•Performance•Surface Deformation
PD05•Performance•Surface Deformation
All-in-Machine
Field-Use

SGMA Meeting -- 04 October 2003 -- Dallas, TXUniversity of Massachusetts LowellBaseball Research Center 20
PD01Average Exit Velocity (AEV) – Sweet Spot
0 2 0 0 4 0 0 6 0 0 8 0 0 1 0 0 0N u m b er o f H its o n B at
9 4
9 5
9 6
9 7
9 8
9 9
Bat
ted-
ball
Vel
ocity
(m
ph)
0 2 0 0 4 0 0 6 0 0 8 0 0 1 0 0 0N u m b er o f H its o n B at
9 4
9 5
9 6
9 7
9 8
9 9
Bat
ted-
ball
Vel
ocity
(m
ph)
SGMA Meeting -- 04 October 2003 -- Dallas, TXUniversity of Massachusetts LowellBaseball Research Center 21
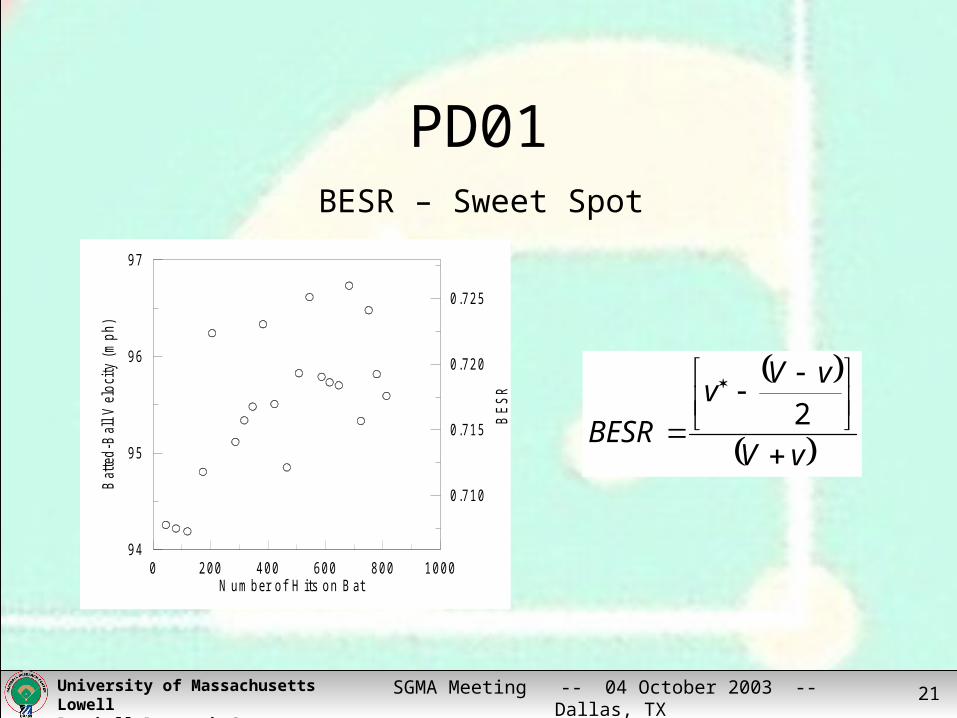
PD01
0 2 0 0 4 0 0 6 0 0 8 0 0 1 0 0 0N u m b er o f H its o n B at
9 4
9 5
9 6
9 7
Bat
ted-
Bal
l Vel
ocity
(m
ph)
0 .7 1 0
0 .7 1 5
0 .7 2 0
0 .7 2 5
BE
SR
BESR – Sweet Spot
vV
vVv
BESR
2

SGMA Meeting -- 04 October 2003 -- Dallas, TXUniversity of Massachusetts LowellBaseball Research Center 22
PD01
0 2 0 0 4 0 0 6 0 0 8 0 0 1 0 0 0N u m b er o f H its o n B at
9 3
9 4
9 5
9 6
9 7
9 8
Bat
ted-
Bal
l Vel
ocity
(m
ph)
B a tte d -b a ll V e lo c ity (R a w D a ta )
B a ll C e rtif ic a tio n (B a se lin e )
0 2 0 0 4 0 0 6 0 0 8 0 0 1 0 0 0N u m b er o f H its o n B at
9 3
9 4
9 5
9 6
9 7
9 8
Bat
ted-
Bal
l Vel
ocity
(m
ph) B a tte d -b a ll V e lo c ity
B a ll C e rtif ic a tio n (B a se lin e )
AEV – Average All 5 Locations

SGMA Meeting -- 04 October 2003 -- Dallas, TXUniversity of Massachusetts LowellBaseball Research Center 23
PD01
0 2 0 0 4 0 0 6 0 0 8 0 0 1 0 0 0N u m b er o f H its o n B at
9 2
9 3
9 4
9 5
9 6
Bat
ted-
Bal
l Vel
ocity
(m
ph)
0 .6 9 5
0 .7 0 0
0 .7 0 5
0 .7 1 0
0 .7 1 5
0 .7 2 0
BE
SR
BESR – Average All 5 Locations

SGMA Meeting -- 04 October 2003 -- Dallas, TXUniversity of Massachusetts LowellBaseball Research Center 24
Cycle Probability (%)
2 95.0
3 46.0
4 67.6
5 0.7
6 73.0
7 55.4
8 13.5
9 11.4
10 29.6
11 82.2
12 10.0
13 0.4
14 44.7
15 26.3
16 47.5
17 1.2
18 87.8
19 6.2
20 44.3
21 43.7
PD01 – AEV – Sweet Spot
0 2 0 0 4 0 0 6 0 0 8 0 0 1 0 0 0N u m b er o f H its o n B at
9 2
9 3
9 4
9 5
9 6
9 7
9 8
Bat
ted-
ball
Vel
ocity
(m
ph)
3 of 20

SGMA Meeting -- 04 October 2003 -- Dallas, TXUniversity of Massachusetts LowellBaseball Research Center 25
Confidence Intervals
• Statistical tool for evaluating magnitude of confidence in test average
• Helps to predicts likelihood of samples being from the same population
• 95% Confidence used

SGMA Meeting -- 04 October 2003 -- Dallas, TXUniversity of Massachusetts LowellBaseball Research Center 26
Cycle Probability (%)
2 94.1
3 92.4
4 45.8
5 0.1
6 12.0
7 16.7
8 13.9
9 1.4
10 11.1
11 32.1
12 5.3
13 0.002
14 13.2
15 2.2
16 29.0
17 0.5
18 9.7
19 2.9
20 0.6
21 20.1
PD01 – BESR – Sweet Spot
0 2 0 0 4 0 0 6 0 0 8 0 0 1 0 0 0N u m b er o f H its o n B at
9 2
9 3
9 4
9 5
9 6
9 7
9 8
9 9
Bat
ted-
ball
Vel
ocity
(m
ph)
0 .6 9 5
0 .7 0 0
0 .7 0 5
0 .7 1 0
0 .7 1 5
0 .7 2 0
0 .7 2 5
0 .7 3 0
0 .7 3 5
0 .7 4 0
BE
SR
7 of 20

SGMA Meeting -- 04 October 2003 -- Dallas, TXUniversity of Massachusetts LowellBaseball Research Center 27
Cycle Probability (%)
2 93.3
3 98.2
4 25.3
5 1.3
6 15.0
7 13.3
8 4.0
9 0.3
10 2.5
11 6.7
12 0.8
13 2.6
14 6.7
15 3.6
16 2.5
17 0.8
18 20.6
19 1.0
20 3.8
21 1.7
PD01 – AEV – All 5 Locations
0 2 0 0 4 0 0 6 0 0 8 0 0 1 0 0 0N u m b er o f H its o n B at
9 2
9 3
9 4
9 5
9 6
Bat
ted-
ball
Vel
ocity
(m
ph)
9 of 20
SGMA Meeting -- 04 October 2003 -- Dallas, TXUniversity of Massachusetts LowellBaseball Research Center 28
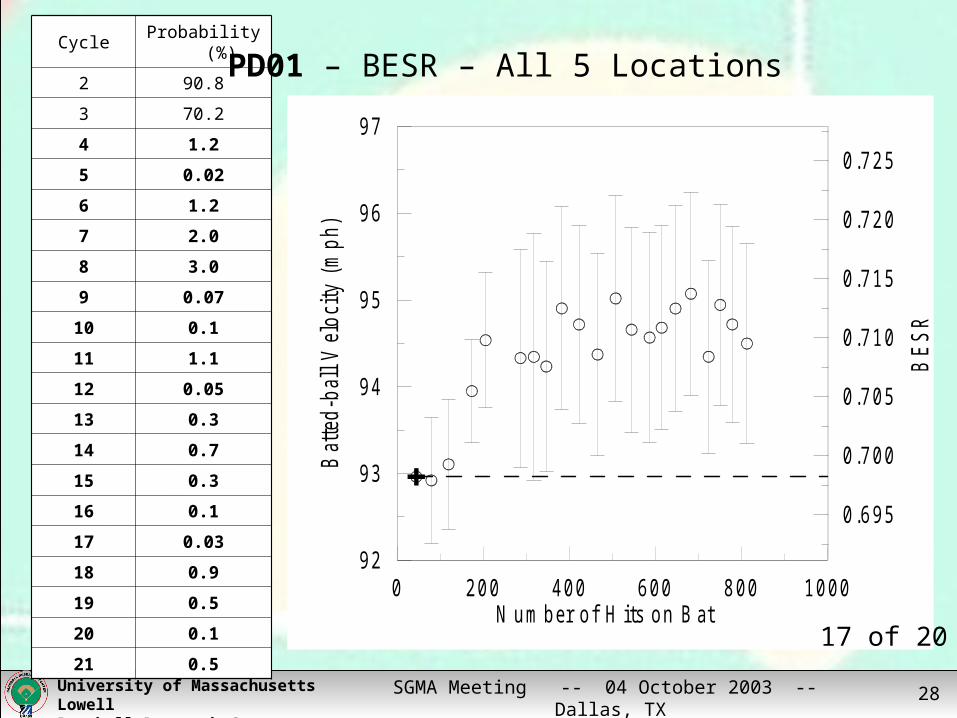
Cycle Probability (%)
2 90.8
3 70.2
4 1.2
5 0.02
6 1.2
7 2.0
8 3.0
9 0.07
10 0.1
11 1.1
12 0.05
13 0.3
14 0.7
15 0.3
16 0.1
17 0.03
18 0.9
19 0.5
20 0.1
21 0.5
PD01 – BESR – All 5 Locations
0 2 0 0 4 0 0 6 0 0 8 0 0 1 0 0 0N u m b er o f H its o n B at
9 2
9 3
9 4
9 5
9 6
9 7
Bat
ted-
ball
Vel
ocity
(m
ph)
0 .6 9 5
0 .7 0 0
0 .7 0 5
0 .7 1 0
0 .7 1 5
0 .7 2 0
0 .7 2 5
BE
SR
17 of 20

SGMA Meeting -- 04 October 2003 -- Dallas, TXUniversity of Massachusetts LowellBaseball Research Center 29
PD01
0 2 0 0 4 0 0 6 0 0 8 0 0 1 0 0 0N u m b er o f H its o n B at
9 3
9 4
9 5
9 6
9 7
Bat
ted-
ball
Vel
ocity
(m
ph)
Lumped Analysis – Sweet Spot
0 2 0 0 4 0 0 6 0 0 8 0 0 1 0 0 0N u m b er o f H its o n B at
9 3
9 4
9 5
9 6
9 7
Bat
ted-
ball
Vel
ocity
(m
ph)
0 .7 0 0
0 .7 0 5
0 .7 1 0
0 .7 1 5
0 .7 2 0
0 .7 2 5
BE
SR
SGMA Meeting -- 04 October 2003 -- Dallas, TXUniversity of Massachusetts LowellBaseball Research Center 30
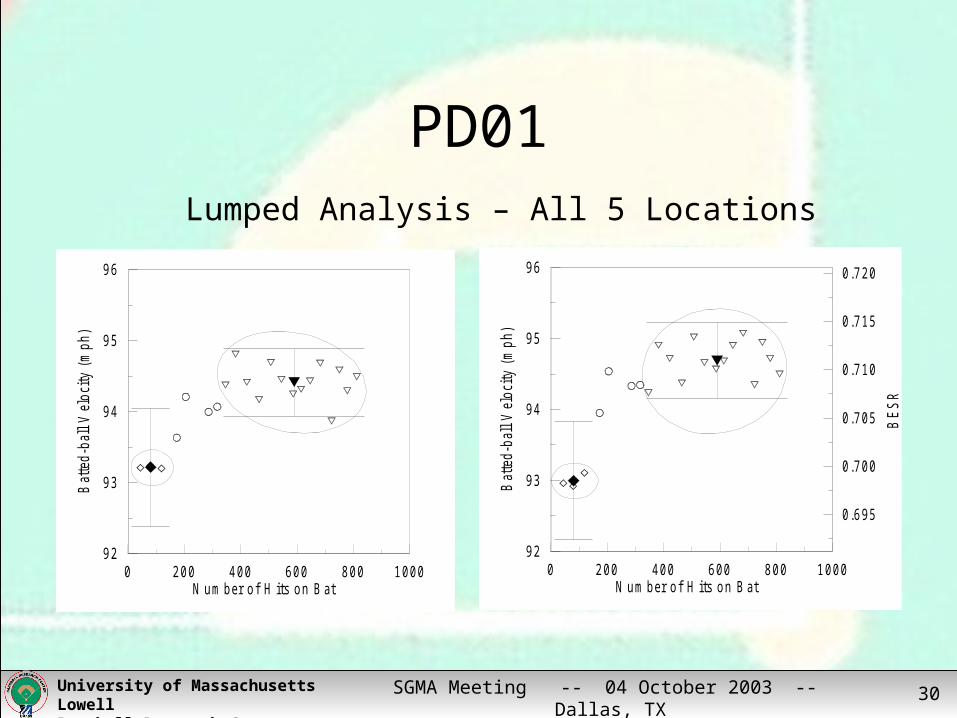
PD01
0 2 0 0 4 0 0 6 0 0 8 0 0 1 0 0 0N u m b er o f H its o n B at
9 2
9 3
9 4
9 5
9 6
Bat
ted-
ball
Vel
ocity
(m
ph)
Lumped Analysis – All 5 Locations
0 2 0 0 4 0 0 6 0 0 8 0 0 1 0 0 0N u m b er o f H its o n B at
9 2
9 3
9 4
9 5
9 6
Bat
ted-
ball
Vel
ocity
(m
ph)
0 .6 9 5
0 .7 0 0
0 .7 0 5
0 .7 1 0
0 .7 1 5
0 .7 2 0
BE
SR

SGMA Meeting -- 04 October 2003 -- Dallas, TXUniversity of Massachusetts LowellBaseball Research Center 31
PD01
Performance Summary
Analysis MethodRange(mph)
Min(mph)
Max(mph)
Sweet Spot AEV 0.86±0.88 -0.02 1.74
Sweet Spot BESR-based AEV 1.63±0.97 0.66 2.60
All Hits of Cycle AEV 1.20±0.95 0.25 2.15
All Hits of Cycle BESR-based AEV 1.69±0.98 0.71 2.67

SGMA Meeting -- 04 October 2003 -- Dallas, TXUniversity of Massachusetts LowellBaseball Research Center 32
PD02BESR – All 5 Locations
Analysis Method Range (mph) Min (mph) Max (mph)
All Hits of Cycle BESR-based AEV -0.64±1.12 -1.76 0.48
0 2 0 0 4 0 0 6 0 0 8 0 0 1 0 0 0N u m b er o f H its o n B at
9 2
9 3
9 4
9 5
9 6
9 7
Bat
ted-
Bal
l Vel
ocity
(m
ph)
0 .6 9 5
0 .7 0 0
0 .7 0 5
0 .7 1 0
0 .7 1 5
0 .7 2 0
0 .7 2 5
BE
SR
SGMA Meeting -- 04 October 2003 -- Dallas, TXUniversity of Massachusetts LowellBaseball Research Center 33
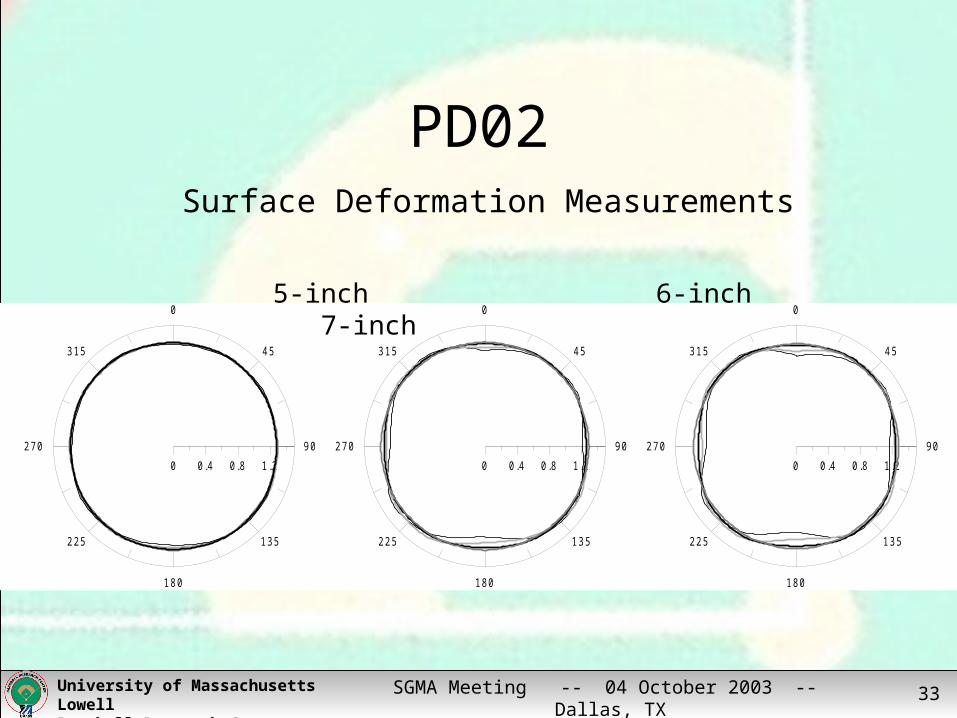
PD02
0
45
90
135
180
225
270
315
0 0.4 0.8 1.2
0
45
90
135
180
225
270
315
0 0.4 0.8 1.2
Surface Deformation Measurements
0
45
90
135
180
225
270
315
0 0.4 0.8 1.2
5-inch 6-inch 7-inch

SGMA Meeting -- 04 October 2003 -- Dallas, TXUniversity of Massachusetts LowellBaseball Research Center 34
PD03
0 2 0 0 4 0 0 6 0 0 8 0 0 1 0 0 0N u m b er o f H its o n B at
9 3
9 4
9 5
9 6
9 7
9 8
9 9
1 0 0
1 0 1B
atte
d-B
all V
eloc
ity (
mph
)
0 2 0 0 4 0 0 6 0 0 8 0 0 1 0 0 0N u m b er o f H its o n B at
9 3
9 4
9 5
9 6
9 7
9 8
9 9
1 0 0
1 0 1
1 0 2
Bat
ted-
Bal
l Vel
ocity
(m
ph)
0 .7 0 00 .7 0 50 .7 1 00 .7 1 50 .7 2 00 .7 2 50 .7 3 00 .7 3 50 .7 4 00 .7 4 50 .7 5 00 .7 5 50 .7 6 0
BE
SR
0 2 0 0 4 0 0 6 0 0 8 0 0 1 0 0 0N u m b er o f H its o n B at
9 4
9 5
9 6
9 7
9 8
Bat
ted-
Bal
l Vel
ocity
(m
ph)
Sweet Spot All 5 Locations
1 of 25
0 of 250 2 0 0 4 0 0 6 0 0 8 0 0 1 0 0 0
N u m b er o f H its o n B at
9 3
9 4
9 5
9 6
9 7
9 8
Bat
ted-
Bal
l Vel
ocity
(m
ph)
0 .7 0 0
0 .7 0 5
0 .7 1 0
0 .7 1 5
0 .7 2 0
0 .7 2 5
0 .7 3 0
0 .7 3 5
BE
SR
13 of 25
7 of 25

SGMA Meeting -- 04 October 2003 -- Dallas, TXUniversity of Massachusetts LowellBaseball Research Center 35
PD03
0 2 0 0 4 0 0 6 0 0 8 0 0 1 0 0 0N u m b er o f H its o n B at
9 5
9 6
9 7
9 8
9 9
Bat
ted-
Bal
l Vel
ocity
(m
ph)
Lumped Analysis – Sweet Spot
0 2 0 0 4 0 0 6 0 0 8 0 0 1 0 0 0N u m b er o f H its o n B at
9 5
9 6
9 7
9 8
9 9
1 0 0
Bat
ted-
Bal
l Vel
ocity
(m
ph)
0 .7 1 5
0 .7 2 0
0 .7 2 5
0 .7 3 0
0 .7 3 5
0 .7 4 0
0 .7 4 5
0 .7 5 0
BE
SR

SGMA Meeting -- 04 October 2003 -- Dallas, TXUniversity of Massachusetts LowellBaseball Research Center 36
PD03
0 2 0 0 4 0 0 6 0 0 8 0 0 1 0 0 0N u m b er o f H its o n B at
9 4
9 5
9 6
9 7
Bat
ted-
Bal
l Vel
ocity
(m
ph)
Lumped Analysis – All 5 Locations
0 2 0 0 4 0 0 6 0 0 8 0 0 1 0 0 0N u m b er o f H its o n B at
9 4
9 5
9 6
9 7
Bat
ted-
Bal
l Vel
ocity
(m
ph)
0 .7 1 0
0 .7 1 5
0 .7 2 0
0 .7 2 5
BE
SR

SGMA Meeting -- 04 October 2003 -- Dallas, TXUniversity of Massachusetts LowellBaseball Research Center 37
PD03
Performance Summary
Analysis MethodRange(mph)
Min(mph)
Max(mph)
Sweet Spot AEV 0.45±0.81 -0.36 1.26
Sweet Spot BESR-based AEV 0.60±0.93 -0.33 1.53
All Hits of Cycle AEV 0.56±0.43 0.13 0.99
All Hits of Cycle BESR-based AEV 0.66±0.45 0.21 1.11
SGMA Meeting -- 04 October 2003 -- Dallas, TXUniversity of Massachusetts LowellBaseball Research Center 38
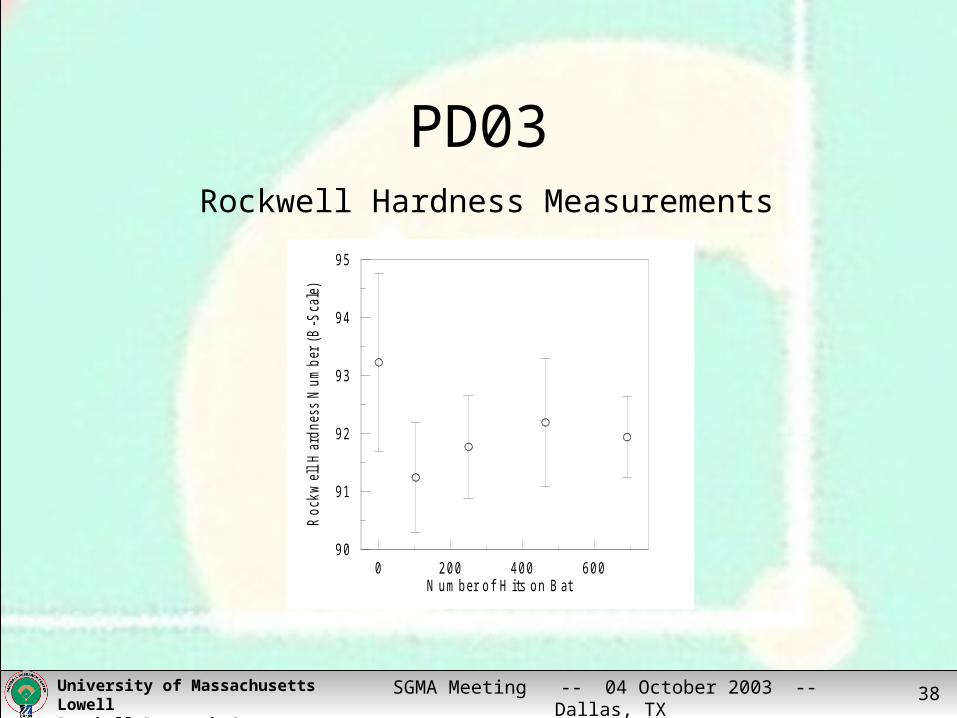
PD03Rockwell Hardness Measurements
0 2 0 0 4 0 0 6 0 0N u m b er o f H its o n B at
9 0
9 1
9 2
9 3
9 4
9 5
Roc
kwel
l Har
dnes
s N
umbe
r (B
-Sca
le)
SGMA Meeting -- 04 October 2003 -- Dallas, TXUniversity of Massachusetts LowellBaseball Research Center 39
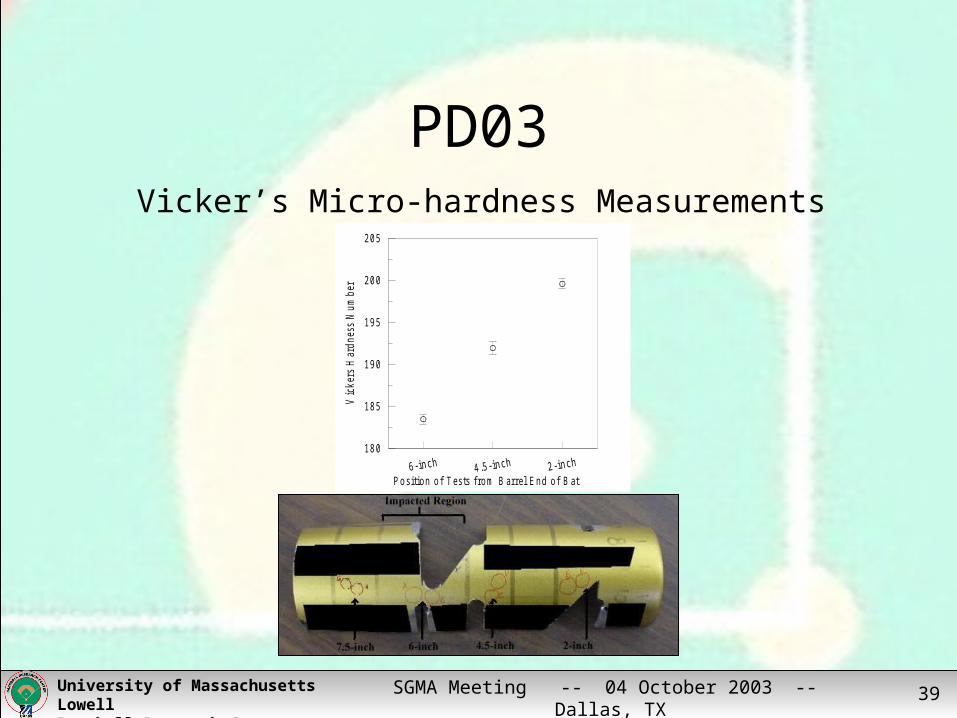
PD03Vicker’s Micro-hardness Measurements
6 -in ch 4 .5 -in ch 2 -in ch
P o s itio n o f T es ts fro m B arrel E n d o f B at
1 8 0
1 8 5
1 9 0
1 9 5
2 0 0
2 0 5
Vic
kers
Har
dnes
s N
umbe
r
SGMA Meeting -- 04 October 2003 -- Dallas, TXUniversity of Massachusetts LowellBaseball Research Center 40
PD04
0 4 0 0 8 0 0 1 2 0 0 1 6 0 0N u m b er o f H its o n B at
9 4
9 5
9 6
9 7
9 8
9 9B
atte
d-B
all V
eloc
ity (
mph
)
0 4 0 0 8 0 0 1 2 0 0 1 6 0 0N u m b er o f H its o n B at
9 4
9 5
9 6
9 7
9 8
9 9
Bat
ted-
Bal
l Vel
ocity
(m
ph)
0 .7 1 0
0 .7 1 5
0 .7 2 0
0 .7 2 5
0 .7 3 0
0 .7 3 5
0 .7 4 0
BE
SR
0 4 0 0 8 0 0 1 2 0 0 1 6 0 0N u m b er o f H its o n B at
9 4
9 5
9 6
9 7
9 8
9 9
Bat
ted-
Bal
l Vel
ocity
(m
ph)
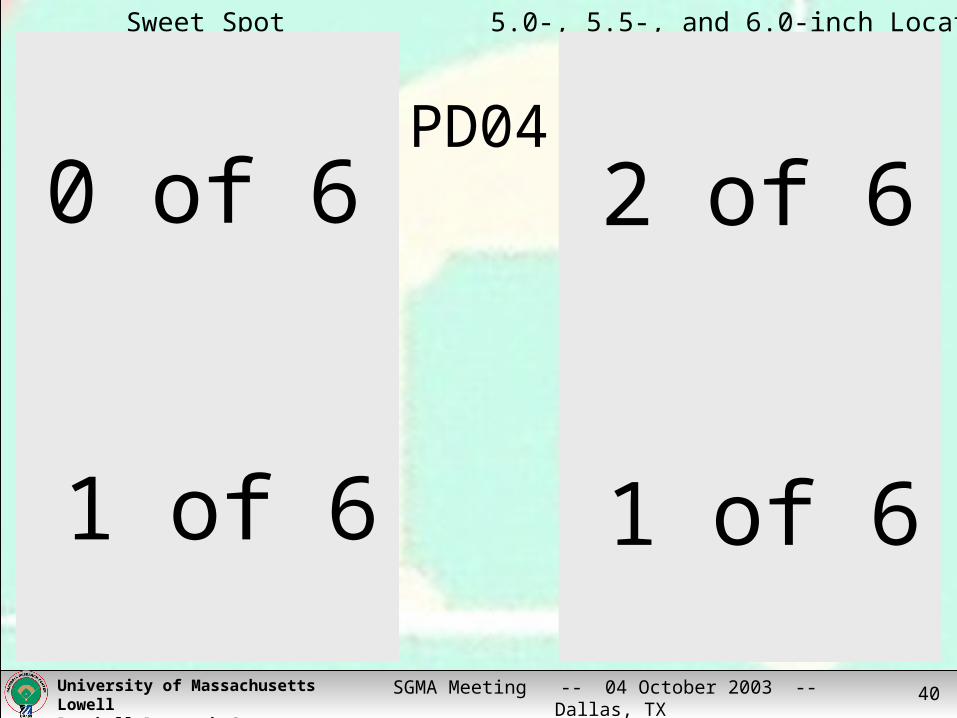
Sweet Spot 5.0-, 5.5-, and 6.0-inch Locations
1 of 6
0 of 6 2 of 6
0 4 0 0 8 0 0 1 2 0 0 1 6 0 0N u m b er o f H its o n B at
9 4
9 5
9 6
9 7
9 8
Bat
ted-
Bal
l Vel
ocity
(m
ph)
0 .7 1 0
0 .7 1 5
0 .7 2 0
0 .7 2 5
0 .7 3 0
0 .7 3 5
BE
SR
1 of 6

SGMA Meeting -- 04 October 2003 -- Dallas, TXUniversity of Massachusetts LowellBaseball Research Center 41
PD04
0 4 0 0 8 0 0 1 2 0 0 1 6 0 0N u m b er o f H its o n B at
9 5
9 6
9 7
9 8
Bat
ted-
Bal
l Vel
ocity
(m
ph)
Lumped Analysis – Sweet Spot
0 4 0 0 8 0 0 1 2 0 0 1 6 0 0N u m b er o f H its o n B at
9 5
9 6
9 7
9 8
Bat
ted-
Bal
l Vel
ocity
(m
ph)
0 .7 1 5
0 .7 2 0
0 .7 2 5
0 .7 3 0
0 .7 3 5
BE
SR
SGMA Meeting -- 04 October 2003 -- Dallas, TXUniversity of Massachusetts LowellBaseball Research Center 42
PD04
0 4 0 0 8 0 0 1 2 0 0 1 6 0 0N u m b er o f H its o n B at
9 4
9 5
9 6
9 7
9 8
Bat
ted-
Bal
l Vel
ocity
(m
ph)
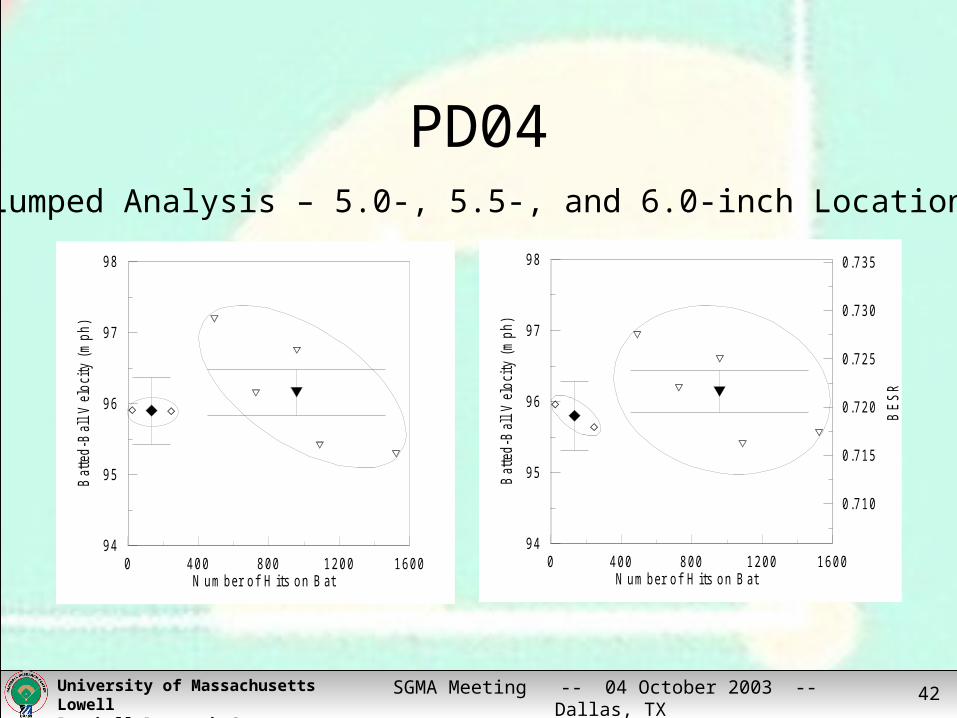
Lumped Analysis – 5.0-, 5.5-, and 6.0-inch Locations
0 4 0 0 8 0 0 1 2 0 0 1 6 0 0N u m b er o f H its o n B at
9 4
9 5
9 6
9 7
9 8
Bat
ted-
Bal
l Vel
ocity
(m
ph)
0 .7 1 0
0 .7 1 5
0 .7 2 0
0 .7 2 5
0 .7 3 0
0 .7 3 5
BE
SR
SGMA Meeting -- 04 October 2003 -- Dallas, TXUniversity of Massachusetts LowellBaseball Research Center 43
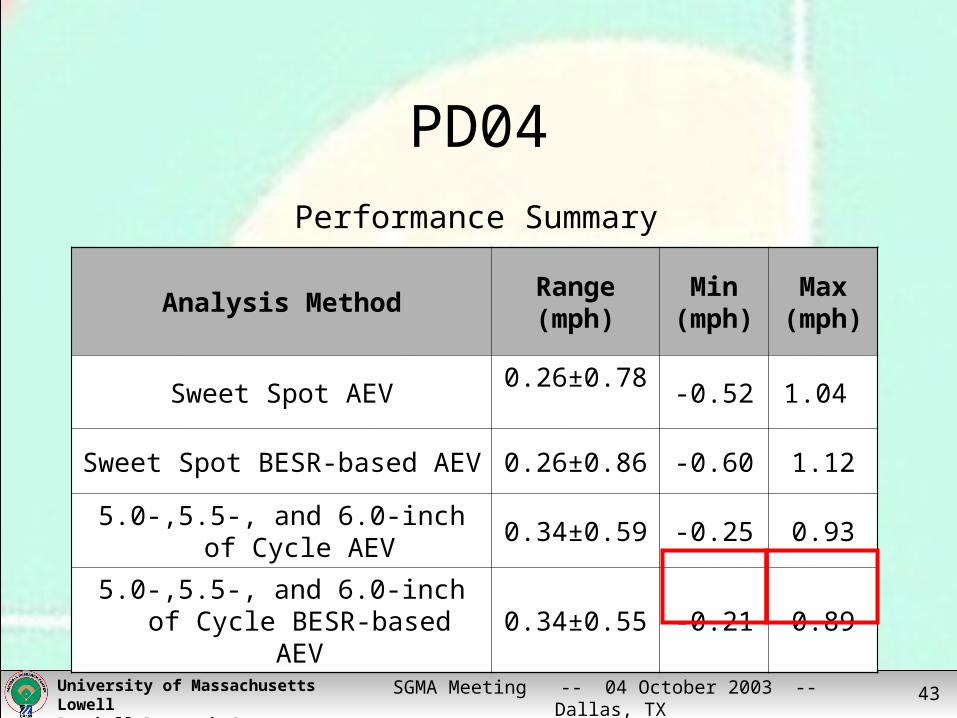
PD04
Performance Summary
Analysis MethodRange(mph)
Min(mph)
Max(mph)
Sweet Spot AEV 0.26±0.78 -0.52 1.04
Sweet Spot BESR-based AEV 0.26±0.86 -0.60 1.12
5.0-,5.5-, and 6.0-inch of Cycle AEV 0.34±0.59 -0.25 0.93
5.0-,5.5-, and 6.0-inch of Cycle BESR-based AEV
0.34±0.55 -0.21 0.89
SGMA Meeting -- 04 October 2003 -- Dallas, TXUniversity of Massachusetts LowellBaseball Research Center 44
PD05
In itia lA fte r 2 ½ m o n th s
T im e o f T es tin g
9 3
9 4
9 5
9 6
9 7
9 8
Bat
ted-
Bal
l Vel
ocity
(m
ph)
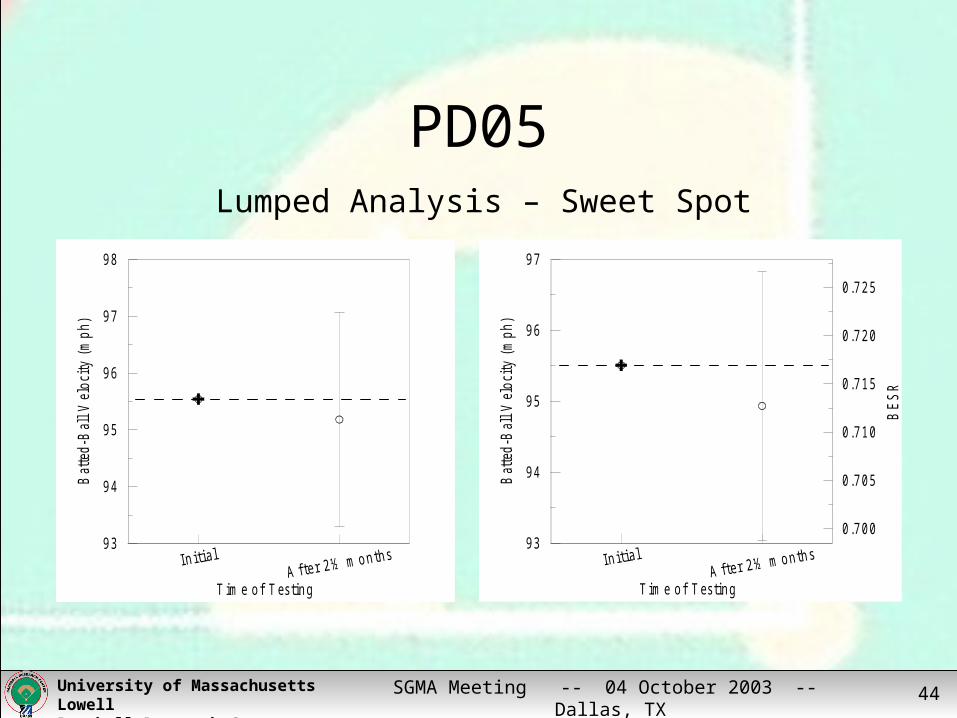
Lumped Analysis – Sweet Spot
In itia lA fte r 2 ½ m o n th s
T im e o f T es tin g
9 3
9 4
9 5
9 6
9 7
Bat
ted-
Bal
l Vel
ocity
(m
ph)
0 .7 0 0
0 .7 0 5
0 .7 1 0
0 .7 1 5
0 .7 2 0
0 .7 2 5
BE
SR

SGMA Meeting -- 04 October 2003 -- Dallas, TXUniversity of Massachusetts LowellBaseball Research Center 45
PD05
In itia lA fte r 2 ½ m o n th s
T im e o f T es tin g
9 2
9 3
9 4
9 5
9 6
Bat
ted-
Bal
l Vel
ocity
(m
ph)
Lumped Analysis – All 6 Locations
In itia lA fte r 2 ½ m o n th s
T im e o f T es tin g
9 2
9 3
9 4
9 5
9 6
Bat
ted-
Bal
l Vel
ocity
(m
ph)
0 .6 9 5
0 .7 0 0
0 .7 0 5
0 .7 1 0
0 .7 1 5
0 .7 2 0
BE
SR

SGMA Meeting -- 04 October 2003 -- Dallas, TXUniversity of Massachusetts LowellBaseball Research Center 46
PD05
Performance Summary
Analysis MethodRange(mph)
Min(mph)
Max(mph)
Sweet Spot AEV -0.36±1.88 -2.24 1.52
Sweet Spot BESR-based AEV -0.58±1.90 -2.48 1.32
All Hits of Cycle AEV -0.41±1.22 -1.63 0.81
All Hits of Cycle BESR-based AEV -0.15±1.26 -1.41 1.11
SGMA Meeting -- 04 October 2003 -- Dallas, TXUniversity of Massachusetts LowellBaseball Research Center 47
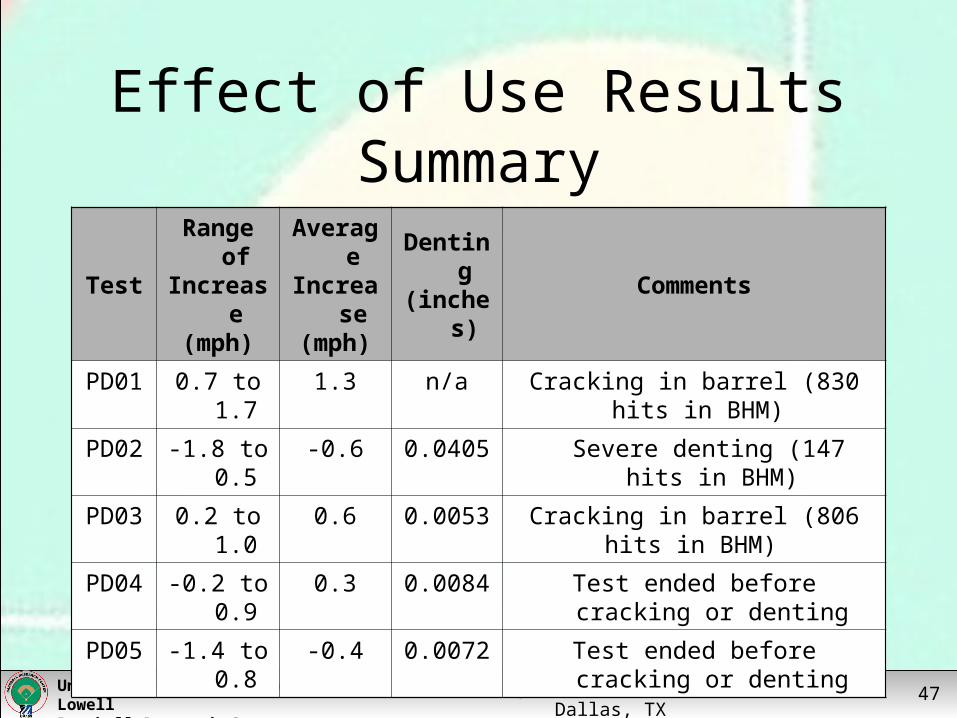
Effect of Use Results Summary
TestRange ofIncrease
(mph)
AverageIncrease
(mph)
Denting(inches)
Comments
PD01 0.7 to 1.7 1.3 n/a Cracking in barrel (830 hits in BHM)
PD02 -1.8 to 0.5 -0.6 0.0405 Severe denting (147 hits in BHM)
PD03 0.2 to 1.0 0.6 0.0053 Cracking in barrel (806 hits in BHM)
PD04 -0.2 to 0.9 0.3 0.0084 Test ended before cracking or denting
PD05 -1.4 to 0.8 -0.4 0.0072 Test ended before cracking or denting
SGMA Meeting -- 04 October 2003 -- Dallas, TXUniversity of Massachusetts LowellBaseball Research Center 48
Outline
• Background
• Test Methodologies
• Analysis Methodologies
• Effect of Use Results
• Effect of Moisture Content Results
• Conclusions
• Recommendations
SGMA Meeting -- 04 October 2003 -- Dallas, TXUniversity of Massachusetts LowellBaseball Research Center 49
Conclusion
• The result of using an aluminum baseball bat may lead to a slight increase in batted-ball performance
• Increase is probably a result of softening of the aluminum – due to increased contact time