sexual harassment in talbot county public schools: 2000 and 2003 susan m. lester talbot county...
TRANSCRIPT

Sexual Harassment in Talbot County Public Schools:
2000 and 2003
Susan M. LesterTalbot County Public Schools

Statement of the Problem
Sexual harassment is pervasive in secondary schools.
Girls consider sexual harassment a problem.
Behavior happens in public places.
Students have difficulty getting help.
Purpose of the study
To determine if Talbot County’s prevention and maintenance efforts have produced the desired attitudes about sexual harassment among students in grades 8 through 11.

Sexual Harassment Prevention Program Implementation Timeline
1993-95 Drama Dept. Play Cultural Diversity and Tolerance of Individual Differences. Volunteer leaders trained from each school.
1996 Easton High School students shown video; Pay Attention. TCPS harassment policy reviewed. MSDE trained school volunteers. Management team, faculty and staff trained.
1997 Continued training of faculty and staff, media materials collected.
1998 Training for all students in grades 6 to 12. Videos, survivor testimony, pamphlets, TAP.
1999 MSDE Nondiscrimination Sexual Harassment Policy.
Easton AAUW branch conducted replication of the 1993 national survey in TCPS.
Grants obtained. 2000 Beyond Hostile Hallways published. Coordinate with other efforts, efforts to include parents, etc.

Research Questions
Question 1
Have the number, type, location and sources of sexual harassment changed from 2000 to 2003 for male and female students in grades 8 through 11 in the Talbot County Public School system?
Question 2
Are there differences between the 2000 and 2003 students in grades 8 through 11 regarding: Awareness of sexual
harassment? Fear of being
sexually harassed?

Research Questions
Question 3 Are there differences between
minority and non-minority students in Talbot County Public Schools in middle and high school students from 2000 and 2003 in: Numbers of sexual
harassment incidents identified?
Types of sexual harassment incidents experienced?
Location of sexual harassment incidents?
Question 4
Has sexual harassment had any educational, emotional, or behavioral impact on Talbot County middle and high school students and if so, has that impact changed between the year 2000 and 2003?

Methodology
Repeated measures design using survey methodology.
Survey data collected at 2 different points in time. 2000 TCPS replication of previous survey.
2003 TCPS survey replication of previous surveys with additional question.

Methodolgy
Participants696 males747 females1443 valid surveys394 minority, (28%) 1049 non- minorities (72%)
Validity IssuesSurvey saturationResearcher biasStudent maturation, exposure to media and other sources
Research Question 1
Have the number, type, location and sources of sexual harassment changed from 2000 to 2003 for male and female students in grades 8 through 11 in the Talbot County Public School System?

Type of sexual harassment incidents for males and females
Sexual comments, jokes, gestures, looks.
Touched, grabbed, or pinched in a sexual way.
Victim of sexual rumors. Called gay or lesbian.
Percent of TCPS students who reported incidents of sexual harassment
2000 2003
male malen=496-502 n=577-600
25 15
18 12
18 27
15 18
2000 2003
female femalen=513-518 n=657-664
36 29
27 24
9 20
9 16
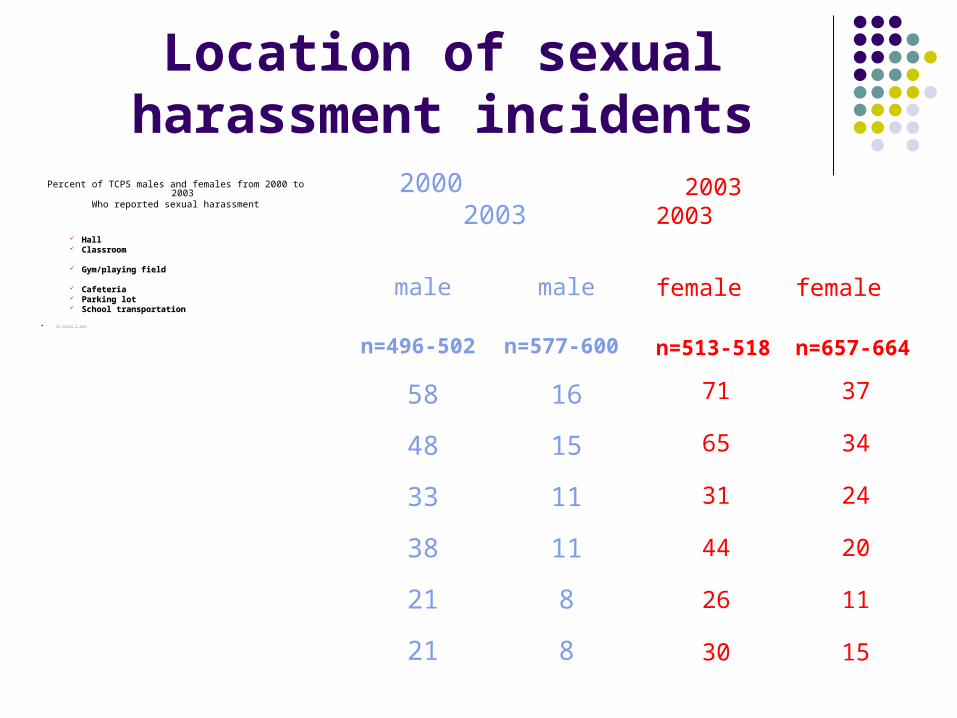
Location of sexual harassment incidents
Percent of TCPS males and females from 2000 to 2003Who reported sexual harassment
Hall Hall Classroom Classroom
Gym/playing fieldGym/playing field
Cafeteria Cafeteria Parking lot Parking lot School transportation School transportation
SH Table 2.wpd
2003 2003
female female
n=513-518 n=657-664
71 37
65 34
31 24
44 20
26 11
30 15
2000 2003
male male
n=496-502 n=577-600
58 16
48 15
33 11
38 11
21 8
21 8
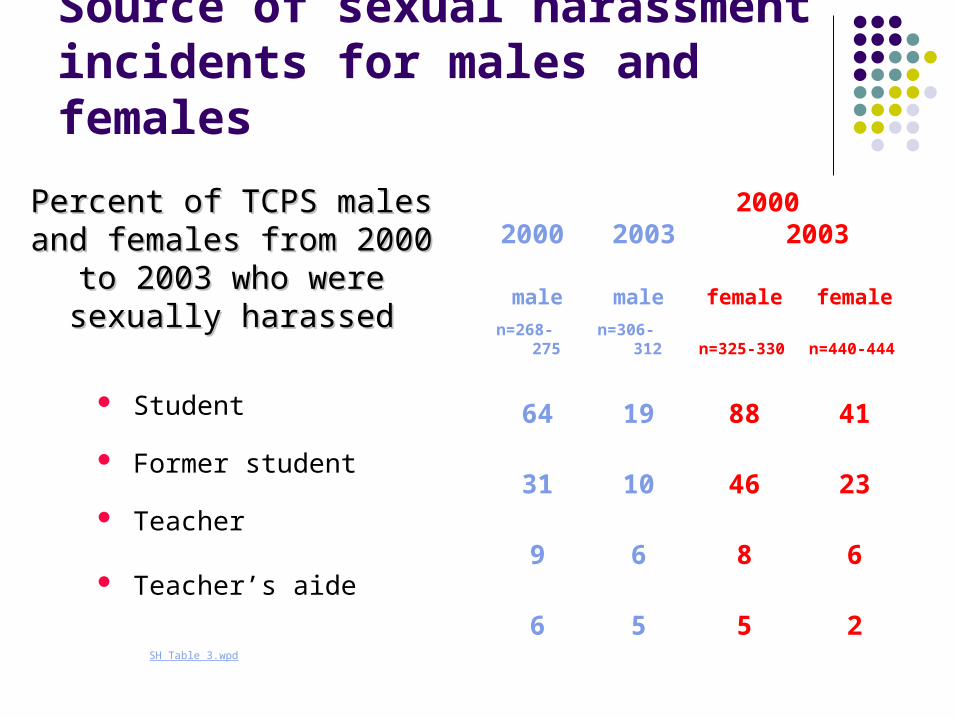
Source of sexual harassment incidents for males and females
Student
Former student
Teacher
Teacher’s aide
SH Table 3.wpd
Percent of TCPS males and Percent of TCPS males and females from 2000 to 2003 females from 2000 to 2003
who were sexually who were sexually harassedharassed
2000 2003 2000 2003
male male female female
n=268-275 n=306-312 n=325-330 n=440-444
64 19 88 41
31 10 46 23
9 6 8 6
6 5 5 2
Research Question 2
Are there differences between the 2000 and 2003 students in grades 8 through 11 regarding: Awareness of sexual
harassment? Fear of being sexually
harassed?

Awareness of Sexual Harassment
Students feel there is less sexual harassment in 2003
St. Michael’s Middle/High School students reported the highest perception that there is a lot of sexual harassment
Note: EMS includes grade 8, EHS includes grades 9-11, STMMHS includes grades 8-11
AWARENESS OF SEXUAL HARASSMENT
14 15 13 13 14 15
56 5765 62 69
56
13 8 10 10 6 91320
13 16 1120
0
20
40
60
80
100
n=207 n=405 n=174 n=178 n=633 n=792
EMS2000
EMS2003
StMMHS2000
StMMHS2003
EHS2000
EHS 2003
a lot
a little
none
not sure
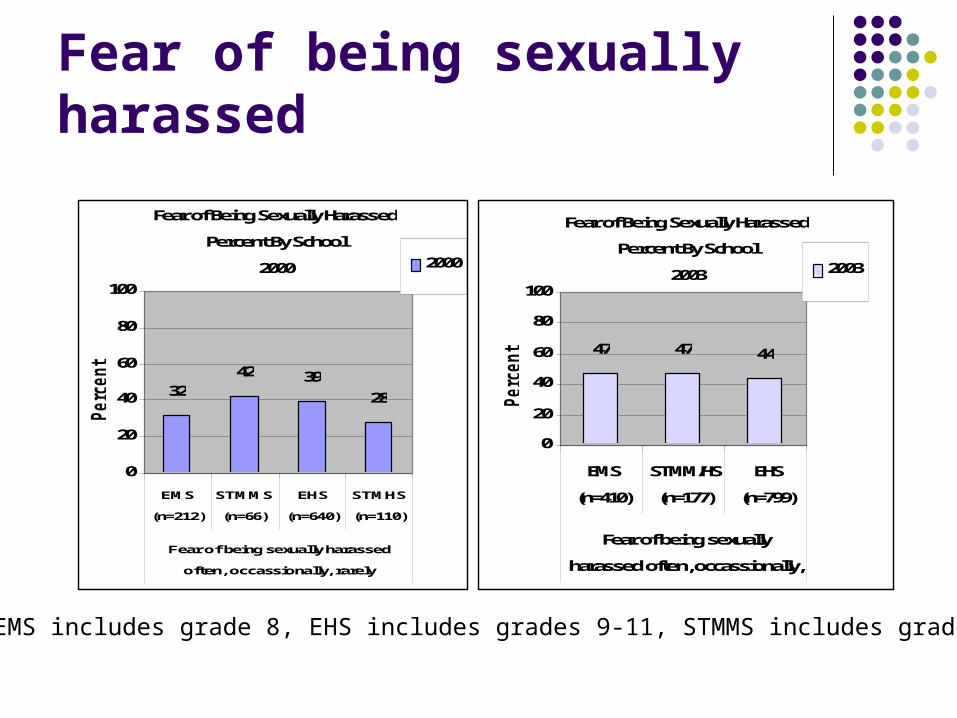
Fear of being sexually harassed
Fear of Being Sexually Harassed
Percent By School
2000
3242 39
28
0
20
40
60
80
100
EMS
(n=212)
STMMS
(n=66)
EHS
(n=640)
STMHS
(n=110)
Fear of being sexually harassed
often, occassionally, rarely
Percen
t
2000
Fear of Being Sexually Harassed
Percent By School
2003
47 47 44
0
20
40
60
80
100
EMS
(n=410)
STMM/HS
(n=177)
EHS
(n=799)
Fear of being sexually
harassed often, occassionally,
Percen
t
2003
Note: EMS includes grade 8, EHS includes grades 9-11, STMMS includes grades 8-11

Research Question 3
Are there differences between 2000 and 2003 minority and non-minority students in Talbot County middle and high school in: Numbers of sexual harassment incidents
identified? Types of sexual harassment incidents
experienced? Location of sexual harassment incidents?
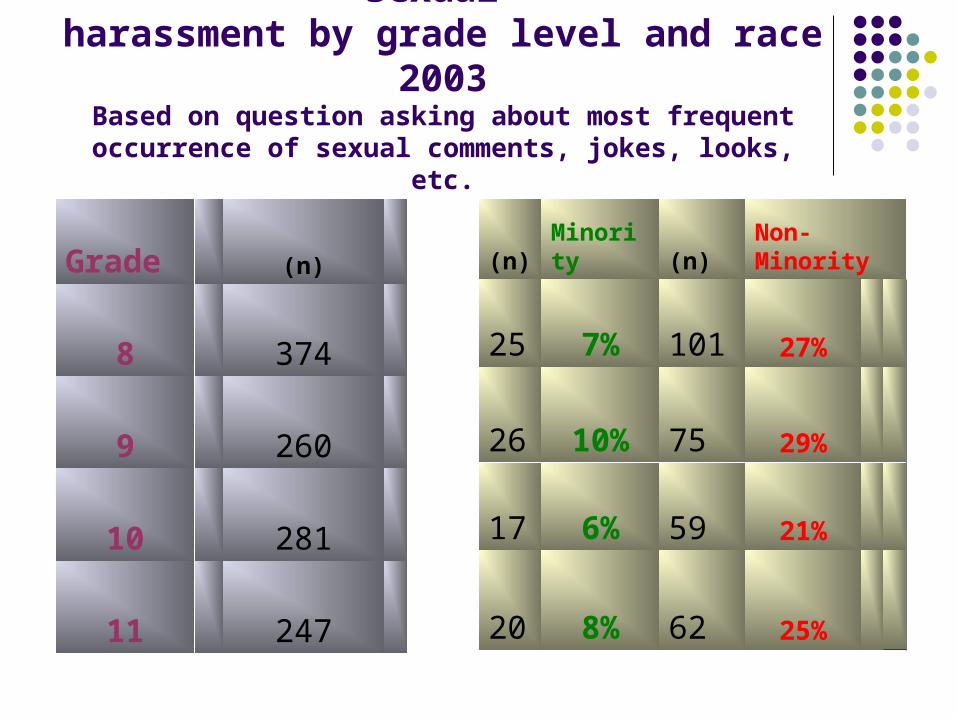
Numbers of students reporting sexual harassment by grade level and race
2003Based on question asking about most frequent occurrence
of sexual comments, jokes, looks, etc.
Grade (n)
8 374
9 260
10 281
11 247
(n) Minority (n)Non-Minority
25 7% 101 27%
26 10% 75 29%
17 6% 59 21%
20 8% 62 25%

Types of sexual harassment incidents for
minority and non-minority students
Sexual comments, jokes, gestures and looks.
2003
Middle school (n=31) minorities
31% (n=195) non-minorities 51%
High school (n=139) minorities
46% (n=444) non-minorities 44%
2000
(n=170) Minorities 56%(n=802) Non-minorities 62%
SH Table 5.wpd
Touched, grabbed, pinched in a sexual way.
Intentionally brushed against in a sexual way.
Victim of sexual rumors
Called gay or lesbian

Locations of sexual harassment incidents for minority and non-minority students
Hall 2000 (n=119) Minority 71% (n=593) Non-minority 64%
2003Middle School (n=44) Minority 70% (n=122) Non-minority 52%High School (n=80) Minority
54% (n=244) non-minority 55%
ClassroomOutside on school groundsCafeteriaGym or playing fieldSchool transportationLocker areaParking lotRestroom
Research Question 4
Has sexual harassment had any educational, emotional, or behavioral impact on Talbot County middle and high school students and if so, has that impact changed between the year 2000 and 2003?

Emotional Impact From 2000 to 2003:
Feeling embarrassed decreaseddecreased 18% for middle school and 11% for high school students.
Being self-conscious decreaseddecreased for middle school 12%, and decreaseddecreased for high school 7%.
2000 Middle and High School Combined
42
37
25
23
19
13
0 20 40 60 80 100
embarrassed
self-conscious
less confident
afraid/scared
less popular
more popular
MS/HS
2003 Middle and High School
24
20
16
13
15
15
31
30
22
14
13
13
0 20 40 60 80 100
embarrassed
self-conscious
less confident
afraid/scared
less popular
more popularHS
MS
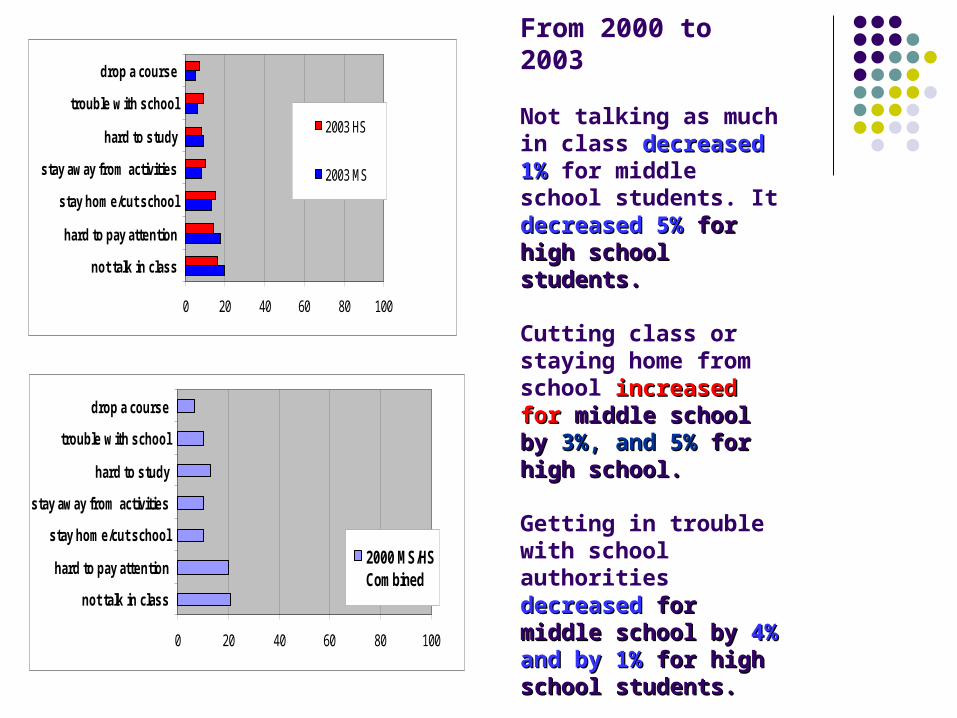
Educational Impact
From 2000 to 2003
Not talking as much in class decreaseddecreased 1%1% for middle school students. It decreased decreased 5% 5% for high school for high school students.students.
Cutting class or staying home from school increased for increased for middle school bymiddle school by 3%, 3%, and 5% and 5% for high school.for high school.
Getting in trouble with school authorities decreased decreased for middle school byfor middle school by 4% 4% and by 1% and by 1% for high for high school students.school students.
0 20 40 60 80 100
not talk in class
hard to pay attention
stay home/cut school
stay away from activities
hard to study
trouble w ith school
drop a course
2000 MS/HSCombined
0 20 40 60 80 100
not talk in class
hard to pay attention
stay home/cut school
stay away from activities
hard to study
trouble with school
drop a course
2003 HS
2003 MS

Behavioral Impact
From 2000 to 2003:
Avoiding harasser increased 21% for high school students and 18% for middle school students.
Changing friends decreased 3% for middle school and 1% for high school.
Remainder decreased slightly.
2000 Behavioral Combined
0 20 40 60 80 100
Avoid harasser
change seat in class
loss of appetite
trouble sleeping
change friends
change path to /from school2000 combined
2003 Behavioral Impact
0 20 40 60 80 100
Avoid harasser
change seat in class
loss of appetite
trouble sleeping
change friends
change path to /from school 2003 HS
2003 MS
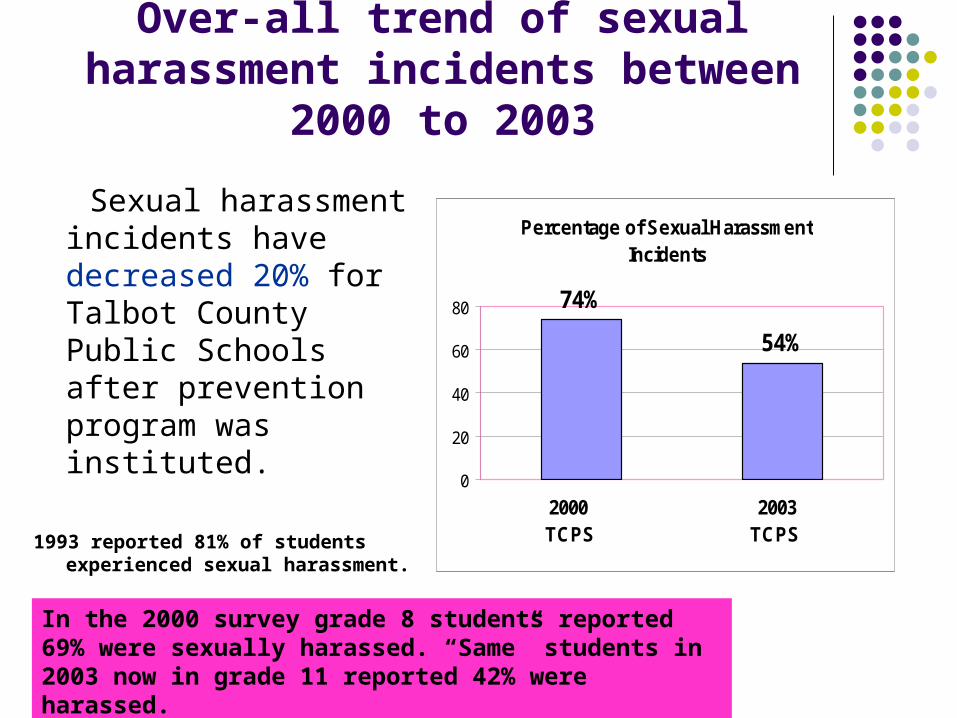
Over-all trend of sexual harassment incidents between 2000 to 2003
Sexual harassment incidents have decreased 20% for Talbot County Public Schools after prevention program was instituted.
1993 reported 81% of students experienced sexual harassment.
Percentage of Sexual Harassment Incidents
74%
54%
0
20
40
60
80
2000 2003TCPS TCPS
In the 2000 survey grade 8 students reported 69% were sexually harassed. “Same” students in 2003 now in grade 11 reported 42% were harassed.

Discussion Program emphasis from 1998 to
present Recent cases Middle school problems Future emphasis
Earlier grades Bullying- hazing Reinforce correct terminology Small group conferences to build girls
self-esteem Monthly newsletter to involve parents Visuals at school such as posters in the
halls Overcome the stigma of reporting Investigate when students frequently miss
school to see if there is a harassment problem.
Future Research
Qualitative study Perceptions of sexual harassment with round table
discussions and interviews. How to prevent bullying. The connection between being bullied and mass violence. Why are minority reports fewer than non-minority?
Study of day care children Learned assertiveness or survival skills. Aggressiveness in young children. Media influence

An injustice anywhereIs an injustice everywhere.
Martin Luther King Jr.Letters From a Birmingham Jail1963