sewerage system asset management plan · 2018-04-02 · sewerage system asset management plan...
TRANSCRIPT

BERRIGAN SHIRE COUNCIL
SEWERAGE SYSTEM
ASSET MANAGEMENT PLAN
Version
Adopted by Council 21 October 2009

G:\Management\MANUAL\PLANS\Asset Management Plans\Sewer Asset Management Plan Oct 2009\Sewer Asset Man Plan Final 2009.Doc
Document Control
Document ID: 59_07_070909_nams.plus_amp template v11
Rev No Date Revision Details Author Reviewer Approver
© Copyright 2007 – All rights reserved.
The Institute of Public Works Engineering Australia.

G:\Management\MANUAL\PLANS\Asset Management Plans\Sewer Asset Management Plan Oct 2009\Sewer Asset Man Plan Final 2009.Doc
TABLE OF CONTENTS
ABBREVIATIONS ............................................................................................................. i GLOSSARY ...................................................................................................................... ii 1. EXECUTIVE SUMMARY ......................................................................................... 1
What Council Provides ............................................................................................. 1 What does it Cost? ................................................................................................... 1 Plans for the Future .................................................................................................. 1 Measuring our Performance ..................................................................................... 2 The Next Steps ........................................................................................................ 2
2. INTRODUCTION ...................................................................................................... 3 2.1 Background ....................................................................................................... 3 2.2 Goals and Objectives of Asset Management .................................................... 4 2.3 Plan Framework ................................................................................................ 6 2.4 Core and Advanced Asset Management ........................................................... 8
3. LEVELS OF SERVICE............................................................................................. 8 3.1 Customer Research and Expectations .............................................................. 8 3.2 Legislative Requirements .................................................................................. 8 3.3 Current Levels of Service .................................................................................. 9 3.4 Desired Levels of Service ................................................................................ 10
4. FUTURE DEMAND ................................................................................................ 11 4.1 Demand Forecast ............................................................................................ 11 4.2 Changes in Technology ................................................................................... 11 4.3 Demand Management Plan ............................................................................. 11 4.4 New Assets from Growth ................................................................................. 12
5. LIFECYCLE MANAGEMENT PLAN ..................................................................... 13 5.1 Background Data ............................................................................................. 13 5.1.1 Physical parameters ................................................................................ 13 5.1.2 Asset capacity and performance ............................................................. 14 5.1.3 Asset condition ........................................................................................ 15 5.1.4 Asset valuations ...................................................................................... 15 5.2 Risk Management Plan ................................................................................... 15 5.3 Routine Maintenance Plan .............................................................................. 16 5.3.1 Maintenance plan .................................................................................... 16 5.3.2 Standards and specifications ................................................................... 17 5.3.3 Summary of future maintenance expenditures ........................................ 17 5.4 Renewal/Replacement Plan ............................................................................ 17 5.4.1 Renewal plan ........................................................................................... 18 5.4.2 Renewal standards .................................................................................. 18 5.4.3 Summary of future renewal expenditure .................................................. 18 5.5 Creation/Acquisition/Upgrade Plan ................................................................. 19 5.5.1 Selection criteria ...................................................................................... 19 5.5.2 Standards and specifications ................................................................... 20 5.5.3 Summary of future upgrade/new assets expenditure .............................. 20 5.6 Disposal Plan .................................................................................................. 21
6. FINANCIAL SUMMARY ........................................................................................ 22 6.1 Financial Statements and Projections ............................................................. 22 6.1.1 Sustainability of service delivery .............................................................. 23 6.2 Funding Strategy ............................................................................................. 25 6.3 Valuation Forecasts ......................................................................................... 26 6.4 Key Assumptions made in Financial Forecasts ............................................... 28
7. ASSET MANAGEMENT PRACTICES .................................................................. 30 7.1 Accounting/Financial Systems ........................................................................ 30 7.2 Asset Management Systems ........................................................................... 30
G:\Management\MANUAL\PLANS\Asset Management Plans\Sewer Asset Management Plan Oct 2009\Sewer Asset Man Plan Final 2009.Doc
7.3 Information Flow Requirements and Processes .............................................. 31 7.4 Standards and Guidelines ............................................................................... 31
8. PLAN IMPROVEMENT AND MONITORING ......................................................... 32 8.1 Performance Measures ................................................................................... 32 8.2 Improvement Plan ........................................................................................... 32 8.3 Monitoring and Review Procedures ................................................................ 33
REFERENCES ................................................................................................................ 34 APPENDICES ................................................................................................................. 35
Appendix A Plans of Sewer Reticulation for Barooga, Berrigan, Finley and Tocumwal ......................................................................................................... 35 Appendix B Projected 20 year Capital Renewal Works Program ........................ 35 Appendix C Planned Upgrade/Exp/New 20 year Capital Works Program ........... 35 Appendix D 10 Year Long Term Financial Plan ................................................... 35
- i -
G:\Management\MANUAL\PLANS\Asset Management Plans\Sewer Asset Management Plan Oct 2009\Sewer Asset Man Plan Final 2009.Doc
ABBREVIATIONS
AAAC Average annual asset consumption
AMP Asset management plan
ARI Average recurrence interval
BOD Biochemical (biological) oxygen demand
CRC Current replacement cost
CWMS Community wastewater management systems
DA Depreciable amount
DoH Department of Health
EF Earthworks/formation
IRMP Infrastructure risk management plan
LCC Life Cycle cost
LCE Life cycle expenditure
MMS Maintenance management system
PCI Pavement condition index
RV Residual value
SS Suspended solids
vph Vehicles per hour

- ii -
G:\Management\MANUAL\PLANS\Asset Management Plans\Sewer Asset Management Plan Oct 2009\Sewer Asset Man Plan Final 2009.Doc
GLOSSARY
Annual service cost (ASC) An estimate of the cost that would be tendered, per annum, if tenders were called for the supply of a service to a performance specification for a fixed term. The Annual Service Cost includes operating, maintenance, depreciation, finance/ opportunity and disposal costs, less revenue.
Asset class Grouping of assets of a similar nature and use in an entity's operations (AASB 166.37).
Asset condition assessment The process of continuous or periodic inspection, assessment, measurement and interpretation of the resultant data to indicate the condition of a specific asset so as to determine the need for some preventative or remedial action.
Asset management The combination of management, financial, economic, engineering and other practices applied to physical assets with the objective of providing the required level of service in the most cost effective manner.
Assets Future economic benefits controlled by the entity as a result of past transactions or other past events (AAS27.12).
Property, plant and equipment including infrastructure and other assets (such as furniture and fittings) with benefits expected to last more than 12 month.
Average annual asset consumption (AAAC)* The amount of a local government’s asset base consumed during a year. This may be calculated by dividing the Depreciable Amount (DA) by the Useful Life and totalled for each and every asset OR by dividing the Fair Value (Depreciated Replacement Cost) by the Remaining Life and totalled for each and every asset in an asset category or class.
Brownfield asset values** Asset (re)valuation values based on the cost to replace the asset including demolition and restoration costs.
Capital expansion expenditure Expenditure that extends an existing asset, at the same standard as is currently enjoyed by residents, to a new group of users. It is discretional expenditure, which increases future operating, and maintenance costs, because it increases council’s asset base, but may be associated with additional revenue from the new user group, eg. extending a drainage or road network, the provision of an oval or park in a new suburb for new residents.
Capital expenditure Relatively large (material) expenditure, which has benefits, expected to last for more than 12 months. Capital expenditure includes renewal, expansion and upgrade. Where capital projects involve a combination of renewal, expansion and/or upgrade expenditures, the total project cost needs to be allocated accordingly.
Capital funding Funding to pay for capital expenditure.
Capital grants Monies received generally tied to the specific projects for which they are granted, which are often upgrade and/or expansion or new investment proposals.
Capital investment expenditure See capital expenditure definition
Capital new expenditure Expenditure which creates a new asset providing a new service to the community that did not exist beforehand. As it increases service potential it may impact revenue and will increase future operating and maintenance expenditure.
Capital renewal expenditure Expenditure on an existing asset, which returns the service potential or the life of the asset up to that which it had originally. It is periodically required expenditure, relatively large (material) in value compared with the value of the components or sub-components of the asset being renewed. As it reinstates existing service potential, it has no impact on revenue, but may reduce future operating and maintenance expenditure if completed at the optimum time, eg. resurfacing or resheeting a material part of a road network, replacing a material section of a drainage network with pipes of the same capacity, resurfacing an oval. Where capital projects involve a combination of renewal, expansion and/or upgrade expenditures, the total project cost needs to be allocated accordingly.
Capital upgrade expenditure Expenditure, which enhances an existing asset to provide a higher level of service or expenditure that will increase the life of the asset beyond that which it had originally. Upgrade expenditure is discretional and often does not result in additional revenue unless direct user charges apply. It will increase operating and maintenance expenditure in the future because of the increase in the council’s asset base, eg. widening the sealed area of an existing road, replacing drainage pipes with pipes of a greater capacity, enlarging a grandstand at a sporting facility. Where capital projects involve a combination of renewal, expansion and/or upgrade

- iii -
G:\Management\MANUAL\PLANS\Asset Management Plans\Sewer Asset Management Plan Oct 2009\Sewer Asset Man Plan Final 2009.Doc
expenditures, the total project cost needs to be allocated accordingly.
Carrying amount The amount at which an asset is recognised after deducting any accumulated depreciation / amortisation and accumulated impairment losses thereon.
Class of assets See asset class definition
Component An individual part of an asset which contributes to the composition of the whole and can be separated from or attached to an asset or a system.
Cost of an asset The amount of cash or cash equivalents paid or the fair value of the consideration given to acquire an asset at the time of its acquisition or construction, plus any costs necessary to place the asset into service. This includes one-off design and project management costs.
Current replacement cost (CRC) The cost the entity would incur to acquire the asset on the reporting date. The cost is measured by reference to the lowest cost at which the gross future economic benefits could be obtained in the normal course of business or the minimum it would cost, to replace the existing asset with a technologically modern equivalent new asset (not a second hand one) with the same economic benefits (gross service potential) allowing for any differences in the quantity and quality of output and in operating costs.
Current replacement cost “As New” (CRC) The current cost of replacing the original service potential of an existing asset, with a similar modern equivalent asset, i.e. the total cost of replacing an existing asset with an as NEW or similar asset expressed in current dollar values.
Cyclic Maintenance** Replacement of higher value components/sub-components of assets that is undertaken on a regular cycle including repainting, building roof replacement, cycle, replacement of air conditioning equipment, etc. This work generally falls below the capital/ maintenance threshold and needs to be identified in a specific maintenance budget allocation.
Depreciable amount The cost of an asset, or other amount substituted for its cost, less its residual value (AASB 116.6)
Depreciated replacement cost (DRC) The current replacement cost (CRC) of an asset less, where applicable, accumulated depreciation calculated on the basis of such cost to reflect the already consumed or expired future economic benefits of the asset
Depreciation / amortisation The systematic allocation of the depreciable amount (service potential) of an asset over its useful life.
Economic life See useful life definition.
Expenditure The spending of money on goods and services. Expenditure includes recurrent and capital.
Fair value The amount for which an asset could be exchanged, or a liability settled, between knowledgeable, willing parties, in an arms length transaction.
Greenfield asset values ** Asset (re)valuation values based on the cost to initially acquire the asset.
Heritage asset An asset with historic, artistic, scientific, technological, geographical or environmental qualities that is held and maintained principally for its contribution to knowledge and culture and this purpose is central to the objectives of the entity holding it.
Impairment Loss The amount by which the carrying amount of an asset exceeds its recoverable amount.
Infrastructure assets Physical assets of the entity or of another entity that contribute to meeting the public's need for access to major economic and social facilities and services, eg. roads, drainage, footpaths and cycleways. These are typically large, interconnected networks or portfolios of composite assets The components of these assets may be separately maintained, renewed or replaced individually so that the required level and standard of service from the network of assets is continuously sustained. Generally the components and hence the assets have long lives. They are fixed in place and are often have no market value.
Investment property Property held to earn rentals or for capital appreciation or both, rather than for: (a) use in the production or supply of goods or services or for administrative purposes; or (b) sale in the ordinary course of business (AASB 140.5)
Level of service The defined service quality for a particular service against which service performance may be measured. Service levels usually relate to quality, quantity, reliability, responsiveness, environmental, acceptability and cost).

- iv -
G:\Management\MANUAL\PLANS\Asset Management Plans\Sewer Asset Management Plan Oct 2009\Sewer Asset Man Plan Final 2009.Doc
Life Cycle Cost ** The life cycle cost (LCC) is average cost to provide the service over the longest asset life cycle. It comprises annual maintenance and asset consumption expense, represented by depreciation expense. The Life Cycle Cost does not indicate the funds required to provide the service in a particular year.
Life Cycle Expenditure ** The Life Cycle Expenditure (LCE) is the actual or planned annual maintenance and capital renewal expenditure incurred in providing the service in a particular year. Life Cycle Expenditure may be compared to Life Cycle Expenditure to give an initial indicator of life cycle sustainability.
Loans / borrowings Loans result in funds being received which are then repaid over a period of time with interest (an additional cost). Their primary benefit is in ‘spreading the burden’ of capital expenditure over time. Although loans enable works to be completed sooner, they are only ultimately cost effective where the capital works funded (generally renewals) result in operating and maintenance cost savings, which are greater than the cost of the loan (interest and charges).
Maintenance and renewal gap Difference between estimated budgets and projected expenditures for maintenance and renewal of assets, totalled over a defined time (eg 5, 10 and 15 years).
Maintenance and renewal sustainability index Ratio of estimated budget to projected expenditure for maintenance and renewal of assets over a defined time (eg 5, 10 and 15 years).
Maintenance expenditure Recurrent expenditure, which is periodically or regularly required as part of the anticipated schedule of works required to ensure that the asset achieves its useful life and provides the required level of service. It is expenditure, which was anticipated in determining the asset’s useful life.
Materiality An item is material is its omission or misstatement could influence the economic decisions of users taken on the basis of the financial report. Materiality depends on the size and nature of the omission or misstatement judged in the surrounding circumstances.
Modern equivalent asset. A structure similar to an existing structure and having the equivalent productive capacity, which could be built using modern materials, techniques and design. Replacement cost is the basis used to estimate the cost of constructing a modern equivalent asset.
Non-revenue generating investments Investments for the provision of goods and services to sustain or improve services to the community that are not expected to generate any savings or revenue to the Council, eg. parks and playgrounds, footpaths, roads and bridges, libraries, etc.
Operating expenditure Recurrent expenditure, which is continuously required excluding maintenance and depreciation, eg power, fuel, staff, plant equipment, on-costs and overheads.
Pavement management system A systematic process for measuring and predicting the condition of road pavements and wearing surfaces over time and recommending corrective actions.
Planned Maintenance** Repair work that is identified and managed through a maintenance management system (MMS). MMS activities include inspection, assessing the condition against failure/breakdown criteria/experience, prioritising scheduling, actioning the work and reporting what was done to develop a maintenance history and improve maintenance and service delivery performance.
PMS Score A measure of condition of a road segment determined from a Pavement Management System.
Rate of annual asset consumption* A measure of average annual consumption of assets (AAAC) expressed as a percentage of the depreciable amount (AAAC/DA). Depreciation may be used for AAAC.
Rate of annual asset renewal* A measure of the rate at which assets are being renewed per annum expressed as a percentage of depreciable amount (capital renewal expenditure/DA).
Rate of annual asset upgrade* A measure of the rate at which assets are being upgraded and expanded per annum expressed as a percentage of depreciable amount (capital upgrade/expansion expenditure/DA).
Reactive maintenance Unplanned repair work that carried out in response to service requests and management/supervisory directions.
Recoverable amount The higher of an asset's fair value, less costs to sell and its value in use.

- v -
G:\Management\MANUAL\PLANS\Asset Management Plans\Sewer Asset Management Plan Oct 2009\Sewer Asset Man Plan Final 2009.Doc
Recurrent expenditure Relatively small (immaterial) expenditure or that which has benefits expected to last less than 12 months. Recurrent expenditure includes operating and maintenance expenditure.
Recurrent funding Funding to pay for recurrent expenditure.
Rehabilitation See capital renewal expenditure definition above.
Remaining life The time remaining until an asset ceases to provide the required service level or economic usefulness. Age plus remaining life is economic life.
Renewal See capital renewal expenditure definition above.
Residual value The net amount which an entity expects to obtain for an asset at the end of its useful life after deducting the expected costs of disposal.
Revenue generating investments Investments for the provision of goods and services to sustain or improve services to the community that are expected to generate some savings or revenue to offset operating costs, eg public halls and theatres, childcare centres, sporting and recreation facilities, tourist information centres, etc.
Risk management The application of a formal process to the range of possible values relating to key factors associated with a risk in order to determine the resultant ranges of outcomes and their probability of occurrence.
Section or segment A self-contained part or piece of an infrastructure asset.
Service potential The capacity to provide goods and services in accordance with the entity's objectives, whether those objectives are the generation of net cash inflows or the provision of goods and services of a particular volume and quantity to the beneficiaries thereof.
Service potential remaining* A measure of the remaining life of assets expressed as a percentage of economic life. It is also a measure of the percentage of the asset’s potential to provide services that is still available for use in providing services (DRC/DA).
Strategic Management Plan (SA)** Documents Council objectives for a specified period (3-5 yrs), the principle activities to achieve the objectives, the means by which that will be carried out, estimated income and expenditure, measures to assess performance and how rating policy relates to the Council’s objectives and activities.
Sub-component Smaller individual parts that make up a component part.
Useful life Either: (a) the period over which an asset is expected to be
available for use by an entity, or (b) the number of production or similar units expected to
be obtained from the asset by the entity. It is estimated or expected time between placing the asset into service and removing it from service, or the estimated period of time over which the future economic benefits embodied in a depreciable asset, are expected to be consumed by the council. It is the same as the economic life.
Value in Use The present value of estimated future cash flows expected to arise from the continuing use of an asset and from its disposal at the end of its useful life. It is deemed to be depreciated replacement cost (DRC) for those assets whose future economic benefits are not primarily dependent on the asset's ability to generate new cash flows, where if deprived of the asset its future economic benefits would be replaced.
Source: DVC 2006, Glossary Note: Items shown * modified to use DA instead of CRC Additional glossary items shown **

- 1 -
G:\Management\MANUAL\PLANS\Asset Management Plans\Sewer Asset Management Plan Oct 2009\Sewer Asset Man Plan Final 2009.Doc
1. EXECUTIVE SUMMARY What Council Provides Council provides a sewerage network in each of its four townships to enable the efficient collection, treatment and disposal of waste water.
This asset management plan covers the following infrastructure assets:
Sewerage infrastructure for the townships of Barooga, Berrigan, Finley and Tocumwal
Table 2.1. Assets covered by this Plan
Asset category Dimension Replacement Value ($M)
Gravity Mains including Manholes and Property Connections
72.5 km $15,890,770
Rising Mains 34.7 km $5,185,282
Pump Stations 47 No. $10,780,000
Treatment Works 4 No. $4,780,000
Storage Ponds 5 No. $834,000
TOTAL $37,470,052
What does it Cost? There are two key indicators of cost to provide the sewerage service.
The life cycle cost being the average cost over the life cycle of the asset, and The total maintenance and capital renewal expenditure required to deliver existing service levels in the next 10 years
covered by Council’s long term financial plan.
The life cycle cost to provide the sewerage service is estimated at $1,091,814 per annum. Council’s planned life cycle expenditure for year 1 of the asset management plan is $460,172 which gives a life cycle sustainability index of 0.42.
The total maintenance and capital renewal expenditure required to provide the sewerage service the in the next 10 years is estimated at $9,094,370. This is an average of $909,437 per annum.
Council’s maintenance and capital renewal expenditure for year 1 of the asset management plan of $535,390 giving a 10 year sustainability index of 0.59.
Plans for the Future Council plans to operate and maintain the sewerage network to achieve the following strategic objectives.
1. Ensure the sewerage network is maintained at a safe and functional standard as set out in this asset management plan. 2. Ensure sufficient funds are raised through fees and charges to provide for sewer asset renewal over the life of the assets. 3. Meet or exceed community expectations in relation to sewer services.

- 2 -
G:\Management\MANUAL\PLANS\Asset Management Plans\Sewer Asset Management Plan Oct 2009\Sewer Asset Man Plan Final 2009.Doc
Measuring our Performance Quality Sewer assets will be maintained in a reasonably usable condition. Defects found or reported that are outside our service standard will be repaired. See our maintenance response service levels for details of defect prioritisation and response time.
Function Our intent is that an appropriate sewerage network is maintained in partnership with other levels of government and stakeholders to collect, treat and dispose of waste water from the townships of Barooga, Berrigan, Finley and Tocumwal.
Sewer asset attributes will be maintained at a safe level and associated signage and equipment be provided as needed to ensure public safety. We need to ensure key functional objectives are met:
• Waste water is efficiently and effectively collected from properties, conveyed to the sewer treatment plants, treated and re used or disposed of.
• The operation of the sewerage system does not result in an adverse impact on the environment.
The main functional consequence of ensuring the sewerage network is maintained at a safe and functional standard as set out in this asset management plan is the continued provision of sewerage services to the four townships within the Berrigan Shire at a level acceptable to the community and other stakeholders..
Safety We inspect all sewerage infrastructure regularly and prioritise and repair defects in accordance with our inspection schedule to ensure they are safe.
The Next Steps The actions resulting from this asset management plan are:
• Complete the Improvement Plan as set out in Table 8.2
• Make provision for the completion of the Capital Works Program attached as Appendix C
• Carry out community consultation
Table 8.2 Improvement Plan
Task No
Task Responsibility Resources Required
Timeline
1. Condition Rating of assets including CCTV survey of gravity mains
EE Staff June 2012
2. Review of remaining life of assets following condition ratings
EE Staff June 2012
3. Componentisation of point assets such as pumping stations and treatment plants including review of unit costs
EE, TOA Staff March 2012
4. Document methodology and procedures for asset useful lives, asset unit costs, condition rating and depreciation calculations
DTS, DCS Staff June 2010
5. Develop chart of accounts to allow separation of operation costs and maintenance costs and to split the maintenance costs into reactive, planned and cyclic and to separate capital expenditure into renewal, new and upgrade works.
FM Staff June 2010
6. Investigate options for integration of the Asset Management System with the Accounting/Financial System
FM, EXE Staff March 2012
7. Carry out community consultation to allow the development of Desired Levels of Service when this plan is reviewed in 2013
DCS Staff/External March 2013

- 3 -
G:\Management\MANUAL\PLANS\Asset Management Plans\Sewer Asset Management Plan Oct 2009\Sewer Asset Man Plan Final 2009.Doc
2. INTRODUCTION
2.1 Background
This asset management plan is to demonstrate responsive management of assets (and services provided from assets), compliance with regulatory requirements, and to communicate funding required to provide the required levels of service.
The asset management plan is to be read with the following associated planning documents:
Berrigan Shire Council Management Plan
Report on Water and Wastewater Infrastructure Maintenance Strategy, GHD, 1997
Sewerage Strategic Business Plan, Fisher Stewart,1997
OH&S Audit Report of the Water and Sewerage Schemes Facilities, DPWS, 1999
Finley Urban Water Plan, DPWS, 2000
Planning Workshop No. 2 Report, DPWS, 2000
Water and Sewerage Strategic Business Planning Review, DPWS, 2001
Water and Sewerage Strategic Business Planning Review, BSC, 2004
Berrigan Shire Council – State of Environment Report, 2008
Berrigan Shire Council – Local Environmental Plan, 1992
Berriquin Land and Water Management Plan, 1995
This asset management plan covers the following infrastructure assets:
Sewerage infrastructure for the townships of Barooga, Berrigan, Finley and Tocumwal
Table 2.1. Assets covered by this Plan
Asset category Dimension Replacement Value ($M)
Gravity Mains including Manholes and Property Connections
72.5 km $15,890,770
Rising Mains 34.7 km $5,185,282
Pump Stations 47 No. $10,780,000
Treatment Works 4 No. $4,780,000
Storage Ponds 5 No. $834,000
TOTAL $37,470,052
Key stakeholders in the preparation and implementation of this asset management plan are:

- 4 -
G:\Management\MANUAL\PLANS\Asset Management Plans\Sewer Asset Management Plan Oct 2009\Sewer Asset Man Plan Final 2009.Doc
State local members Represent community interest
Department of Water and Energy
State department responsible for management of sewerage services
Department of Commerce Service provider for technical support
NSW EPA Pollution prevention Protection of environmental values Legislative requirements are met
Murray Irrigation Protection of irrigation canals and drainage channels from polluting discharges
Murray Catchment Management Authority
Coordinate management strategies within the Murray Catchment for the sustainable use of its natural resources
Department of Environment & Climate Change
Possible source of funding for recycling and energy saving projects – Protection of the natural environment and the equitable use of natural resources – Contains EPA
Department of Health Advice on public health issues and monitoring of water quality for re-used effluent.
Berrigan Shire Council Meet expectations of the customers with respect to levels of service Comply with EPA directive
The General Public Improved recreational opportunities Improved visual amenity Maximise property values Reduction of flooding disruption
Tocumwal Golf Club Utilisation of treated effluent for irrigation of greens and fairways
Finley Golf Club Utilisation of treated effluent for irrigation of greens and fairways
Berrigan Race Club Utilisation of treated effluent for irrigation of greens and fairways
Local businesses Efficient disposal of waste water Improve recreational opportunities and visual amenity
Sewer Customers Efficient disposal of waste water Improve recreational opportunities and visual amenity
2.2 Goals and Objectives of Asset Management
The Council exists to provide services to its community. Some of these services are provided by infrastructure assets. Council has acquired infrastructure assets by ‘purchase’, by contract, construction by council staff and by donation of assets constructed by developers and others to meet increased levels of service.
Council’s goal in managing infrastructure assets is to meet the required level of service in the most cost effective manner for present and future consumers. The key elements of infrastructure asset management are:
- 5 -
G:\Management\MANUAL\PLANS\Asset Management Plans\Sewer Asset Management Plan Oct 2009\Sewer Asset Man Plan Final 2009.Doc
• Taking a life cycle approach, • Developing cost-effective management strategies for the long term, • Providing a defined level of service and monitoring performance, • Understanding and meeting the demands of growth through demand management and
infrastructure investment, • Managing risks associated with asset failures, • Sustainable use of physical resources, • Continuous improvement in asset management practices.1
This asset management plan is prepared under the direction of Council’s vision, mission, goals and objectives.
Council’s vision is:
The vision of the Berrigan Shire Council is to create a sustainable, healthy and vibrant community that takes advantage of economic opportunities, promotes innovation and diversification, realises the potential of existing businesses and welcomes compatible strategic investment into the Shire.
In expanding the Council’s vision to the 30 year planning horizon for the provision of sewerage services, the following expectations have been identified:
Government policy provides regional and local leadership.
Council will shape Government policy to better serve the community.
A sense of belonging and pride will come from a partnership between Council and the community.
Quality of life means a clean, safe environment with high social and community values
Infrastructure will be properly planned and maintained.
Economic development.
Quality and value for money demonstrated by market testing and benchmarking.
Council’s vision has implications for the provision of the sewerage services to provide excellence in service to the community to enable enhanced quality of life. This will be achieved through:
Integrity Leadership Selflessness Objectivity
1 IIMM 2006 Sec 1.1.3, p 1.3

- 6 -
G:\Management\MANUAL\PLANS\Asset Management Plans\Sewer Asset Management Plan Oct 2009\Sewer Asset Man Plan Final 2009.Doc
Accountability Openness Honesty Respect Trust and teamwork Advocacy Partners
2.3 Plan Framework
Key elements of the plan are
• Levels of service – specifies the services and levels of service to be provided by council. • Future demand – how this will impact on future service delivery and how this is to be met. • Life cycle management – how Council will manage its existing and future assets to provide the
required services • Financial summary – what funds are required to provide the required services. • Asset management practices • Monitoring – how the plan will be monitored to ensure it is meeting Council’s objectives. • Asset management improvement plan
A road map for preparing an asset management plan is shown below.

- 7 -
G:\Management\MANUAL\PLANS\Asset Management Plans\Sewer Asset Management Plan Oct 2009\Sewer Asset Man Plan Final 2009.Doc
Road Map for preparing an Asset Management Plan Source: IIMM Fig 1.5.1, p 1.11
IS THE PLAN AFFORDABLE?
CORPORATE PLANNINGConfirm strategic objectives and establish AM policies, strategies & goals. Define responsibilities & ownership.Decide core or advanced AM Pan.Gain organisation commitment.
REVIEW/COLLATE ASSET INFORMATIONExisting information sourcesIdentify & describe assets.Data collectionCondition assessmentsPerformance monitoringValuation Data
ESTABLISH LEVELS OF SERVICEEstablish strategic linkagesDefine & adopt statementsEstablish measures & targetsConsultation
LIFECYCLE MANAGEMENT STRATEGIESDevelop lifecycle strategiesDescribe service delivery strategyRisk management strategiesDemand forecasting and managementOptimised decision making (renewals, new works, disposals)Optimise maintenance strategies
FINANCIAL FORECASTSLifecycle analysisFinancial forecast summaryValuation DepreciationFunding
IMPROVEMENT PLANAssess current/desired practicesDevelop improvement plan
ITERATIONReconsider service statementsOptions for fundingConsult with CouncilConsult with Community
DEFINE SCOPE & STRUCTURE OF PLAN
INFO
RM
ATIO
N M
AN
AG
EM
EN
T, a
nd D
ATA
IMPR
OV
EME
NT
AM PLAN REVIEW AND
AUDIT
IMPLEMENT IMPROVEMENT
STRATEGY
ANNUAL PLAN / BUSINESS PLAN
INFO
RM
ATIO
N M
AN
AG
EM
EN
T, a
nd D
ATA
IMPR
OV
EME
NT

- 8 -
G:\Management\MANUAL\PLANS\Asset Management Plans\Sewer Asset Management Plan Oct 2009\Sewer Asset Man Plan Final 2009.Doc
2.4 Core and Advanced Asset Management
This asset management plan is prepared as a ‘core’ asset management plan in accordance with the International Infrastructure Management Manual. It is prepared to meet minimum legislative and organisational requirements for sustainable service delivery and long term financial planning and reporting. Core asset management is a ‘top down’ approach where analysis is applied at the ‘system’ or ‘network’ level.
Future revisions of this asset management plan will move towards ‘advanced’ asset management using a ‘bottom up’ approach for gathering asset information for individual assets to support the optimisation of activities and programs to meet agreed service levels.
3. LEVELS OF SERVICE
3.1 Customer Research and Expectations
Council has not carried out any research on customer expectations. Levels of service for previous plans have been determined from consultation with internal stakeholders ie. Council Staff. A formal system of complaints/requests is maintained with proforma sheets being distributed to all property owners with their annual rates notices. This system has not identified any obvious short falls in the current levels of service. A more formal research program to determine customer expectations will be investigated for future updates of the asset management plan.
3.2 Legislative Requirements
Council has to meet many legislative requirements including Australian and State legislation and State regulations. These include:
Table 3.2. Legislative Requirements
Legislation Requirement
Local Government Act 1993 • Sets out role, purpose, responsibilities and powers of local governments including the preparation of a long term financial plan supported by asset management plans for sustainable service delivery.
Environmental Planning and Assessment Act 1979
&
Environmental Planning and Assessment Amendment Act 2008
• Requirement for Local Environmental Plans and Development Control Plans.
• Provides for Council control of development of towns and approval of infrastructure expansion.
Catchment Management Authorities Act 2003
• Requirement for ongoing management plan.
• Promotes the coordination of activities within catchment areas.
• Under the provision of this Act, Local Catchment Management Authorities oversee this process in the region.
Soil Conservation Act 1938 • Preservation of water course environment.
Public Health Act 1991 • Protection of public health from handling and treatment of waste water including effluent reuse.

- 9 -
G:\Management\MANUAL\PLANS\Asset Management Plans\Sewer Asset Management Plan Oct 2009\Sewer Asset Man Plan Final 2009.Doc
Public Works Act 1912 • Provides authority for the Department of Water and Energy to construct sewerage works within the Council’s area and regulates activities concerning the acquisition of land for sewerage works.
Water Act 1912 & Water Management Act 2000 & Water Management Amendment Act 2008
• Water rights, licenses, allocations and determination of developer charges.
Occupational health and Safety Act 2000
• Impacts all operations in relation to safety of workers and the public.
• Council’s responsibility to ensure health, safety and welfare of employees and others at places of work.
Independent Pricing and Regulatory Tribunal Act 1992
• Gives powers to the Independent Pricing and regulatory Tribunal to inquire into and regulate prices.
Protection of the Environment Operations Act 1997
• Need to control wastewater and stormwater disposal.
• Control of run-off or escape of contaminants entering water courses.
• Regulating pollution activities and issue of licenses as well as the monitoring of and reporting on waste output.
• This act includes “Due Diligence requirements, disposal procedures for chemicals and sludge and details penalties for causing environmental impacts.
3.3 Current Levels of Service
Council has defined service levels in two terms.
Community Levels of Service relate to how the community receives the service in terms of safety, quality, quantity, reliability, responsiveness, cost/efficiency and legislative compliance.
Supporting the community service levels are operational or technical measures of performance developed to ensure that the minimum community levels of service are met. These technical measures relate to service criteria such as:
Service Criteria Technical measures may relate to Quality Smoothness of roads Quantity Area of parks per resident Availability Distance from a dwelling to a sealed road Safety Number of injury accidents
Council’s current service levels are detailed in Table 3.3.
- 10 -
G:\Management\MANUAL\PLANS\Asset Management Plans\Sewer Asset Management Plan Oct 2009\Sewer Asset Man Plan Final 2009.Doc
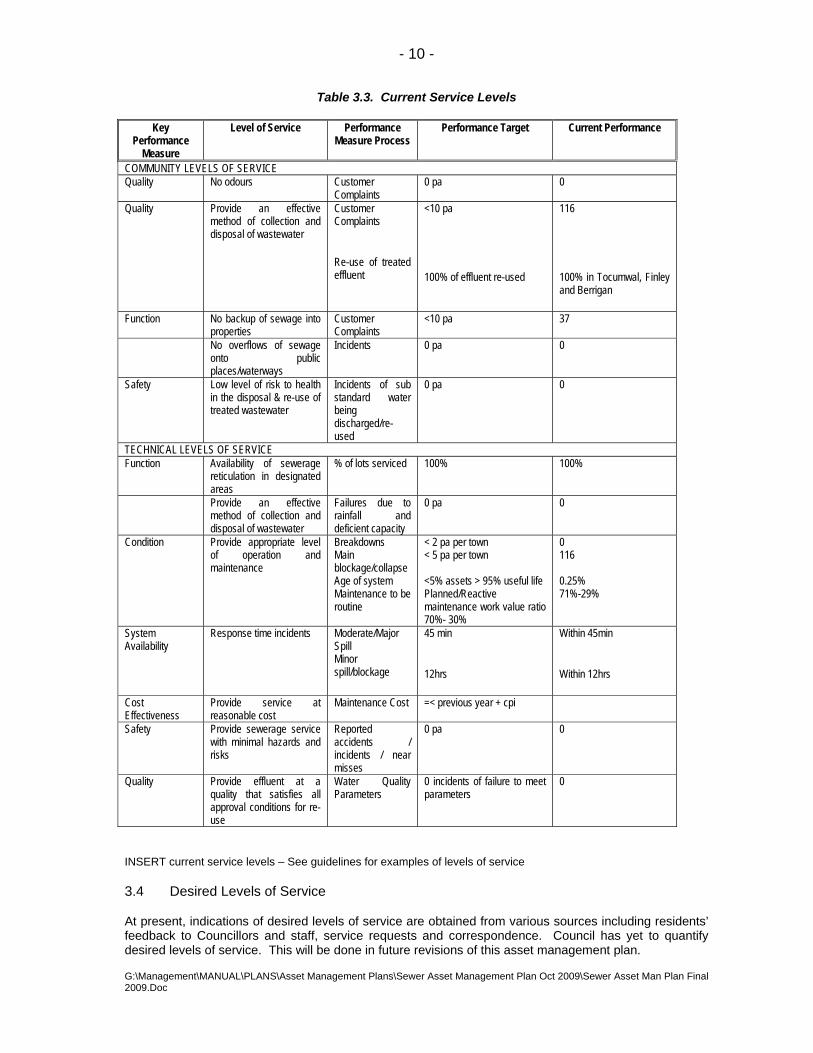
Table 3.3. Current Service Levels
Key Performance
Measure
Level of Service Performance Measure Process
Performance Target Current Performance
COMMUNITY LEVELS OF SERVICE Quality No odours Customer
Complaints 0 pa 0
Quality Provide an effective method of collection and disposal of wastewater
Customer Complaints
Re-use of treated effluent
<10 pa
100% of effluent re-used
116
100% in Tocumwal, Finley and Berrigan
Function No backup of sewage into properties
Customer Complaints
<10 pa 37
No overflows of sewage onto public places/waterways
Incidents 0 pa 0
Safety Low level of risk to health in the disposal & re-use of treated wastewater
Incidents of sub standard water being discharged/re-used
0 pa 0
TECHNICAL LEVELS OF SERVICE Function Availability of sewerage
reticulation in designated areas
% of lots serviced 100% 100%
Provide an effective method of collection and disposal of wastewater
Failures due to rainfall and deficient capacity
0 pa 0
Condition Provide appropriate level of operation and maintenance
Breakdowns Main blockage/collapse Age of system Maintenance to be routine
< 2 pa per town < 5 pa per town <5% assets > 95% useful life Planned/Reactive maintenance work value ratio 70%- 30%
0 116 0.25% 71%-29%
System Availability
Response time incidents Moderate/Major Spill Minor spill/blockage
45 min
12hrs
Within 45min
Within 12hrs
Cost Effectiveness
Provide service at reasonable cost
Maintenance Cost =< previous year + cpi
Safety Provide sewerage service with minimal hazards and risks
Reported accidents / incidents / near misses
0 pa 0
Quality Provide effluent at a quality that satisfies all approval conditions for re-use
Water Quality Parameters
0 incidents of failure to meet parameters
0
INSERT current service levels – See guidelines for examples of levels of service
3.4 Desired Levels of Service
At present, indications of desired levels of service are obtained from various sources including residents’ feedback to Councillors and staff, service requests and correspondence. Council has yet to quantify desired levels of service. This will be done in future revisions of this asset management plan.

- 11 -
G:\Management\MANUAL\PLANS\Asset Management Plans\Sewer Asset Management Plan Oct 2009\Sewer Asset Man Plan Final 2009.Doc
4. FUTURE DEMAND
4.1 Demand Forecast
Factors affecting demand include population change, changes in demographics, seasonal factors, vehicle ownership, consumer preferences and expectations, economic factors, agricultural practices, environmental awareness, etc.
Demand factor trends and impacts on service delivery are summarised in Table 4.1.
Table 4.1. Demand Factors, Projections and Impact on Services
Demand factor Present position Projection Impact on services Population Barooga 1453 (2006) Barooga 2668 (2028) Treatment facilities, pump stations and trunk
mains will have adequate capacity. New reticulation works will be funded by developers.
Berrigan 929 (2006) Berrigan 1094 (2028) Treatment facilities, pump stations and trunk mains will have adequate capacity. New reticulation works will be funded by developers.
Finley 2053 (2006) Finley 2555 (2028) Treatment facilities, pump stations and trunk mains will have adequate capacity. New reticulation works will be funded by developers.
Tocumwal 1861 (2006) Tocumwal 3344 (2028) Treatment facilities, pump stations and trunk mains will have adequate capacity. New reticulation works will be funded by developers.
4.2 Changes in Technology
Technology changes are forecast to affect the delivery of services covered by this plan in the following areas.
Table 4.2. Changes in Technology and Forecast effect on Service Delivery
Technology Change Effect on Service Delivery
Trenchless Pipeline Techniques Should reduce the cost of pipeline maintenance and renewal
Will reduce the impact of works on the community and environment.
4.3 Demand Management Plan
Demand for new services will be managed through a combination of managing existing assets, upgrading of existing assets and providing new assets to meet demand and demand management. Demand management practices include non-asset solutions, insuring against risks and managing failures.
Opportunities identified to date for demand management are shown in Table 4.3. Further opportunities will be developed in future revisions of this asset management plan.
- 12 -
G:\Management\MANUAL\PLANS\Asset Management Plans\Sewer Asset Management Plan Oct 2009\Sewer Asset Man Plan Final 2009.Doc
Table 4.3. Demand Management Plan Summary
Service Activity Demand Management Plan
Expansion of reticulation network to serve new developments.
Reticulation expansion to be provided by developers of new developments.
Re-use of effluent from Barooga STP.
Develop agreement with adjoining property owner to purchase available effluent for agricultural re-use.
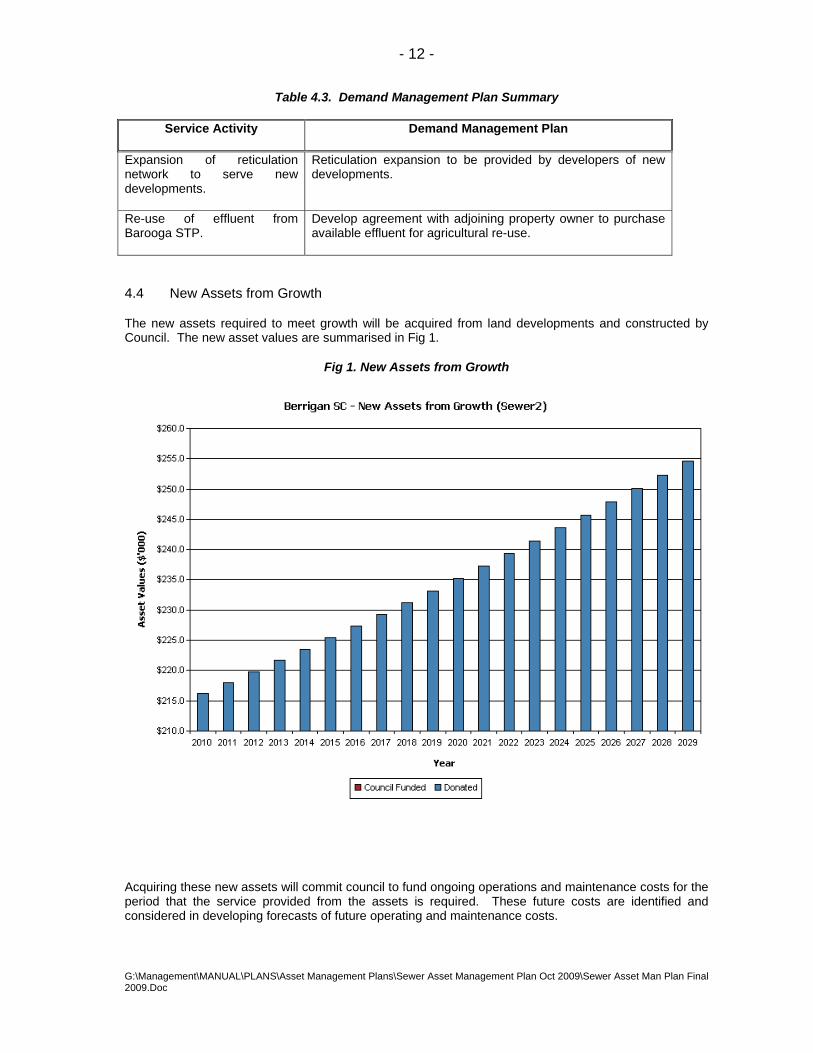
4.4 New Assets from Growth
The new assets required to meet growth will be acquired from land developments and constructed by Council. The new asset values are summarised in Fig 1.
Fig 1. New Assets from Growth
Acquiring these new assets will commit council to fund ongoing operations and maintenance costs for the period that the service provided from the assets is required. These future costs are identified and considered in developing forecasts of future operating and maintenance costs.
- 13 -
G:\Management\MANUAL\PLANS\Asset Management Plans\Sewer Asset Management Plan Oct 2009\Sewer Asset Man Plan Final 2009.Doc
5. LIFECYCLE MANAGEMENT PLAN The lifecycle management plan details how Council plans to manage and operate the assets at the agreed levels of service (defined in section 3) while optimising life cycle costs.
5.1 Background Data
5.1.1 Physical parameters
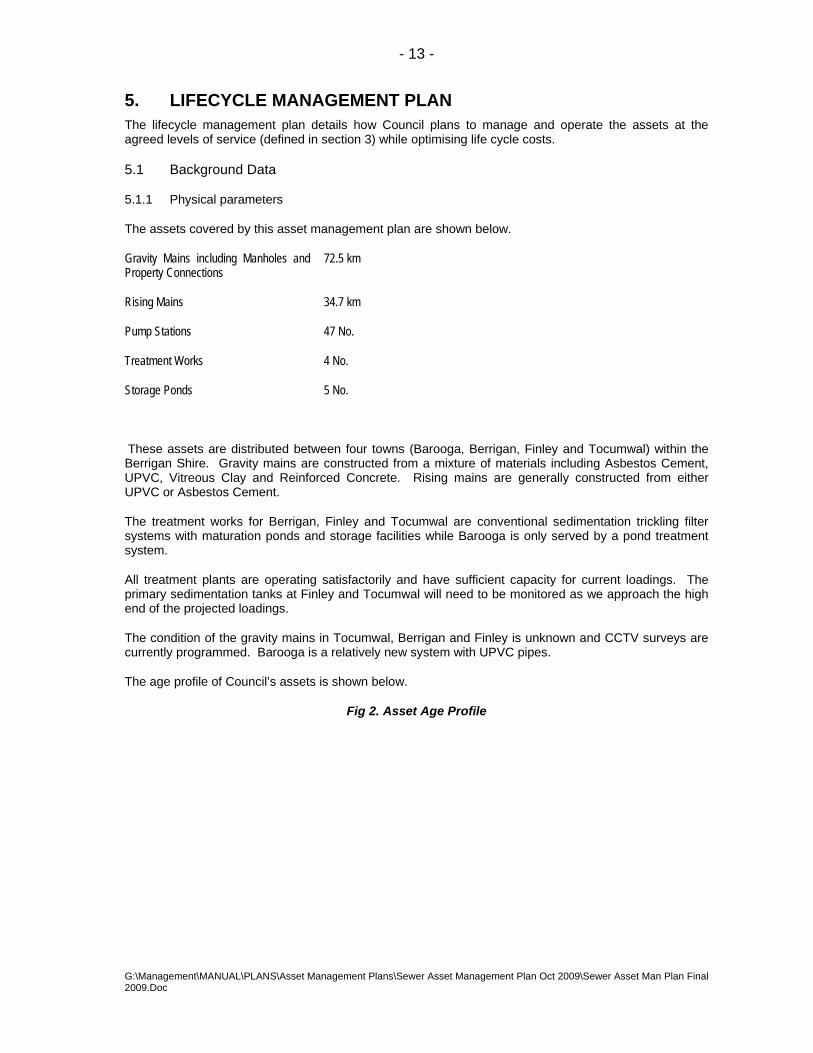
The assets covered by this asset management plan are shown below.
Gravity Mains including Manholes and Property Connections
72.5 km
Rising Mains 34.7 km
Pump Stations 47 No.
Treatment Works 4 No.
Storage Ponds 5 No.
These assets are distributed between four towns (Barooga, Berrigan, Finley and Tocumwal) within the Berrigan Shire. Gravity mains are constructed from a mixture of materials including Asbestos Cement, UPVC, Vitreous Clay and Reinforced Concrete. Rising mains are generally constructed from either UPVC or Asbestos Cement.
The treatment works for Berrigan, Finley and Tocumwal are conventional sedimentation trickling filter systems with maturation ponds and storage facilities while Barooga is only served by a pond treatment system.
All treatment plants are operating satisfactorily and have sufficient capacity for current loadings. The primary sedimentation tanks at Finley and Tocumwal will need to be monitored as we approach the high end of the projected loadings.
The condition of the gravity mains in Tocumwal, Berrigan and Finley is unknown and CCTV surveys are currently programmed. Barooga is a relatively new system with UPVC pipes.
The age profile of Council’s assets is shown below.
Fig 2. Asset Age Profile

- 14 -
G:\Management\MANUAL\PLANS\Asset Management Plans\Sewer Asset Management Plan Oct 2009\Sewer Asset Man Plan Final 2009.Doc
Plans of the sewer assets for each town are attached as Appendix A
5.1.2 Asset capacity and performance
Council’s services are generally provided to meet design standards where these are available.
Locations where deficiencies in service performance are known are detailed in Table 5.1.2.
Table 5.1.2. Known Service Performance Deficiencies
Location Service Deficiency
Berrigan Reticulation Excessive blockages from tree roots
Finley Reticulation Excessive blockages from tree roots
Tocumwal Reticulation Excessive blockages from tree roots
Barooga STP No provision for effluent re-use.
The above service deficiencies were identified from maintenance records and officers knowledge of systems.

- 15 -
G:\Management\MANUAL\PLANS\Asset Management Plans\Sewer Asset Management Plan Oct 2009\Sewer Asset Man Plan Final 2009.Doc
5.1.3 Asset condition
The condition profile of Council’s assets is currently unknown and will be determined via inspections of assets to be carried out over the next two years. Reticulation will be inspected using CCTV equipment.
Council’s current sewer inventory in the BizeAssets asset management system had a substantial length of asbestos cement sewers with a useful life of 45 years that were reaching this useful life over the next 3 years. Due to the fact that we have not been experiencing many failures of these pipes to this point it has been assumed that their remaining life can be increased by 10 years. This will be further substantiated and/or adjusted following the CCTV surveys of the pipes to assess condition.
Condition data will be included in future updates of this plan.
Condition will be measured using a 1 – 5 rating system.2
Rating Description of Condition 1 Excellent condition: Only planned maintenance required. 2 Very good: Minor maintenance required plus planned maintenance. 3 Good: Significant maintenance required. 4 Average: Significant renewal/upgrade required. 5 Poor: Unserviceable.
5.1.4 Asset valuations
The value of assets as at 30th June, 2007 covered by this asset management plan is summarised below. Assets were last revalued at 30th June, 2007. Assets are valued at greenfield rates.
Current Replacement Cost $37,470,052
Depreciable Amount $37,470,052
Depreciated Replacement Cost $15,121,280
Annual Depreciation Expense $701,642
Council’s sustainability reporting reports the rate of annual asset consumption and compares this to asset renewal and asset upgrade and expansion.
Asset Consumption 1.87%
Asset renewal 0.05%
Annual Upgrade/expansion 1.11%
5.2 Risk Management Plan
An assessment of risks3 associated with service delivery from infrastructure assets has identified critical risks to Council. The risk assessment process identifies credible risks, the likliehood of the risk event occurring, the consequences should the event occur, develops a risk rating, evaluates the risk and develops a risk treatment plan for non-acceptable risks.
2 IIMM 2006, Appendix B, p B:1-3 (‘cyclic’ modified to ‘planned’) 3 Berrigan Shire Council ‘Core’ Infrastructure Risk Management Plan - Sewer – April 2009
- 16 -
G:\Management\MANUAL\PLANS\Asset Management Plans\Sewer Asset Management Plan Oct 2009\Sewer Asset Man Plan Final 2009.Doc
Critical risks, being those assessed as ‘Very High’ - requiring immediate corrective action and ‘High’ – requiring prioritised corrective action identified in the infrastructure risk management plan are summarised in Table 5.2.
Table 5.2. Critical Risks and Treatment Plans
Asset at Risk What can Happen Risk Rating (VH, H)
Risk Treatment Plan
Tocumwal and Finley Golf Courses and Berrigan Racetrack
Poor quality effluent delivered for re-use systems
H Prepare and implement Operational Environment Management Plans for all sites that receive treated effluent for re-use.
Reticulation Systems Collapse of pipes or manholes H Carry out CCTV inspections of all sewer reticulation and repair all structural defects.
5.3 Routine Maintenance Plan
Routine maintenance is the regular on-going work that is necessary to keep assets operating, including instances where portions of the asset fail and need immediate repair to make the asset operational again.
5.3.1 Maintenance plan
Maintenance includes reactive, planned and cyclic maintenance work activities.
Reactive maintenance is unplanned repair work carried out in response to service requests and management/supervisory directions.
Planned maintenance is repair work that is identified and managed through a maintenance management system (MMS). MMS activities include inspection, assessing the condition against failure/breakdown experience, prioritising, scheduling, actioning the work and reporting what was done to develop a maintenance history and improve maintenance and service delivery performance.
Cyclic maintenance is replacement of higher value components/sub-components of assets that is undertaken on a regular cycle including repainting, building roof replacement, etc. This work generally falls below the capital/maintenance threshold.
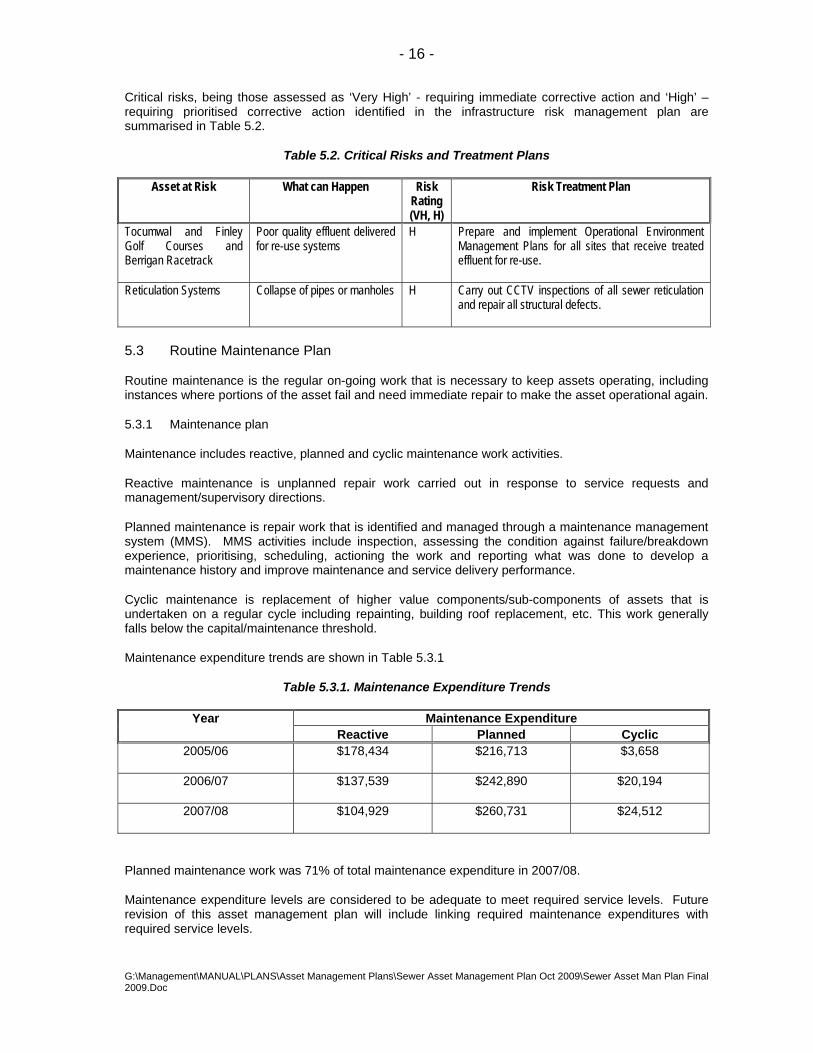
Maintenance expenditure trends are shown in Table 5.3.1
Table 5.3.1. Maintenance Expenditure Trends
Year Maintenance Expenditure Reactive Planned Cyclic
2005/06 $178,434 $216,713 $3,658
2006/07 $137,539 $242,890 $20,194
2007/08 $104,929 $260,731 $24,512
Planned maintenance work was 71% of total maintenance expenditure in 2007/08.
Maintenance expenditure levels are considered to be adequate to meet required service levels. Future revision of this asset management plan will include linking required maintenance expenditures with required service levels.
- 17 -
G:\Management\MANUAL\PLANS\Asset Management Plans\Sewer Asset Management Plan Oct 2009\Sewer Asset Man Plan Final 2009.Doc
Assessment and prioritisation of reactive maintenance is undertaken by Council staff using experience and judgement.
5.3.2 Standards and specifications
Maintenance work is carried out in accordance with sound industry practices, Berrigan Shire Council standard operating procedures and safe work method statements and requirements set down by manufacturers of proprietary products.
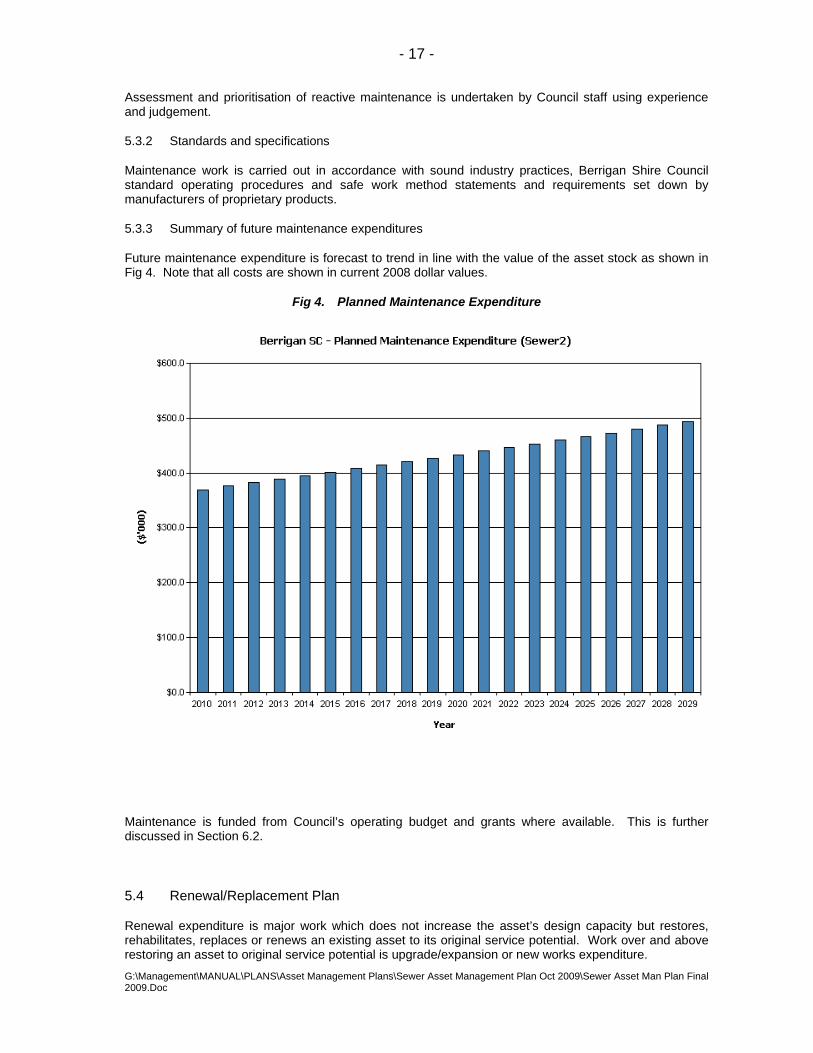
5.3.3 Summary of future maintenance expenditures
Future maintenance expenditure is forecast to trend in line with the value of the asset stock as shown in Fig 4. Note that all costs are shown in current 2008 dollar values.
Fig 4. Planned Maintenance Expenditure
Maintenance is funded from Council’s operating budget and grants where available. This is further discussed in Section 6.2.
5.4 Renewal/Replacement Plan
Renewal expenditure is major work which does not increase the asset’s design capacity but restores, rehabilitates, replaces or renews an existing asset to its original service potential. Work over and above restoring an asset to original service potential is upgrade/expansion or new works expenditure.
- 18 -
G:\Management\MANUAL\PLANS\Asset Management Plans\Sewer Asset Management Plan Oct 2009\Sewer Asset Man Plan Final 2009.Doc
5.4.1 Renewal plan
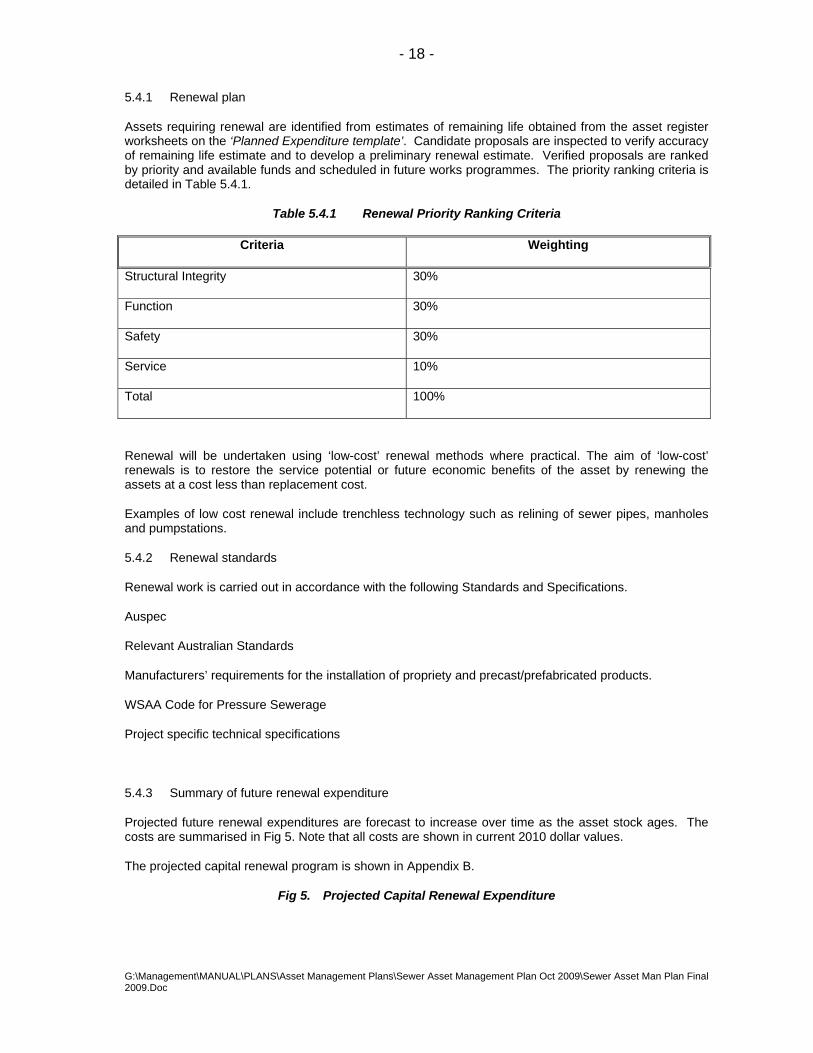
Assets requiring renewal are identified from estimates of remaining life obtained from the asset register worksheets on the ‘Planned Expenditure template’. Candidate proposals are inspected to verify accuracy of remaining life estimate and to develop a preliminary renewal estimate. Verified proposals are ranked by priority and available funds and scheduled in future works programmes. The priority ranking criteria is detailed in Table 5.4.1.
Table 5.4.1 Renewal Priority Ranking Criteria
Criteria Weighting
Structural Integrity 30%
Function 30%
Safety 30%
Service 10%
Total 100%
Renewal will be undertaken using ‘low-cost’ renewal methods where practical. The aim of ‘low-cost’ renewals is to restore the service potential or future economic benefits of the asset by renewing the assets at a cost less than replacement cost.
Examples of low cost renewal include trenchless technology such as relining of sewer pipes, manholes and pumpstations.
5.4.2 Renewal standards
Renewal work is carried out in accordance with the following Standards and Specifications.
Auspec
Relevant Australian Standards
Manufacturers’ requirements for the installation of propriety and precast/prefabricated products.
WSAA Code for Pressure Sewerage
Project specific technical specifications
5.4.3 Summary of future renewal expenditure
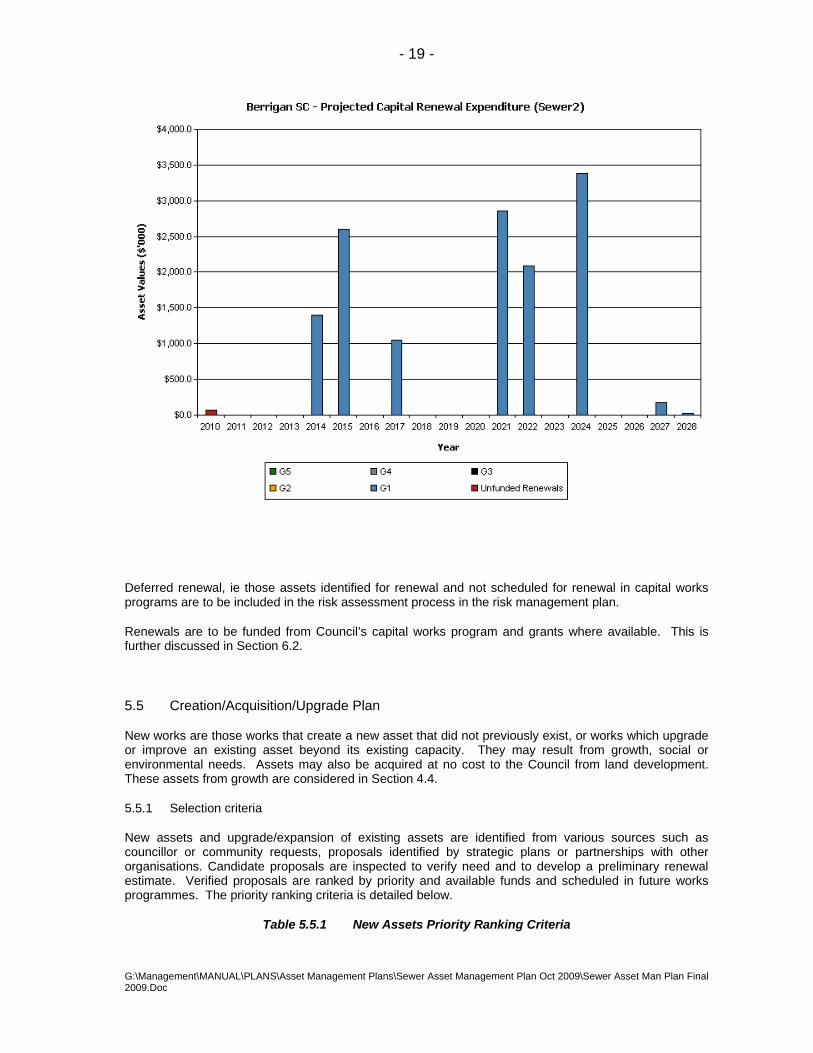
Projected future renewal expenditures are forecast to increase over time as the asset stock ages. The costs are summarised in Fig 5. Note that all costs are shown in current 2010 dollar values.
The projected capital renewal program is shown in Appendix B.
Fig 5. Projected Capital Renewal Expenditure
- 19 -
G:\Management\MANUAL\PLANS\Asset Management Plans\Sewer Asset Management Plan Oct 2009\Sewer Asset Man Plan Final 2009.Doc
Deferred renewal, ie those assets identified for renewal and not scheduled for renewal in capital works programs are to be included in the risk assessment process in the risk management plan.
Renewals are to be funded from Council’s capital works program and grants where available. This is further discussed in Section 6.2.
5.5 Creation/Acquisition/Upgrade Plan
New works are those works that create a new asset that did not previously exist, or works which upgrade or improve an existing asset beyond its existing capacity. They may result from growth, social or environmental needs. Assets may also be acquired at no cost to the Council from land development. These assets from growth are considered in Section 4.4.
5.5.1 Selection criteria
New assets and upgrade/expansion of existing assets are identified from various sources such as councillor or community requests, proposals identified by strategic plans or partnerships with other organisations. Candidate proposals are inspected to verify need and to develop a preliminary renewal estimate. Verified proposals are ranked by priority and available funds and scheduled in future works programmes. The priority ranking criteria is detailed below.
Table 5.5.1 New Assets Priority Ranking Criteria
- 20 -
G:\Management\MANUAL\PLANS\Asset Management Plans\Sewer Asset Management Plan Oct 2009\Sewer Asset Man Plan Final 2009.Doc
Criteria Weighting
Inadequate capacity 50%
Increased re-use quantities 30%
Improved amenity 20%
5.5.2 Standards and specifications
Standards and specifications for new assets and for upgrade/expansion of existing assets are the same as those for renewal shown in Section 5.4.2.
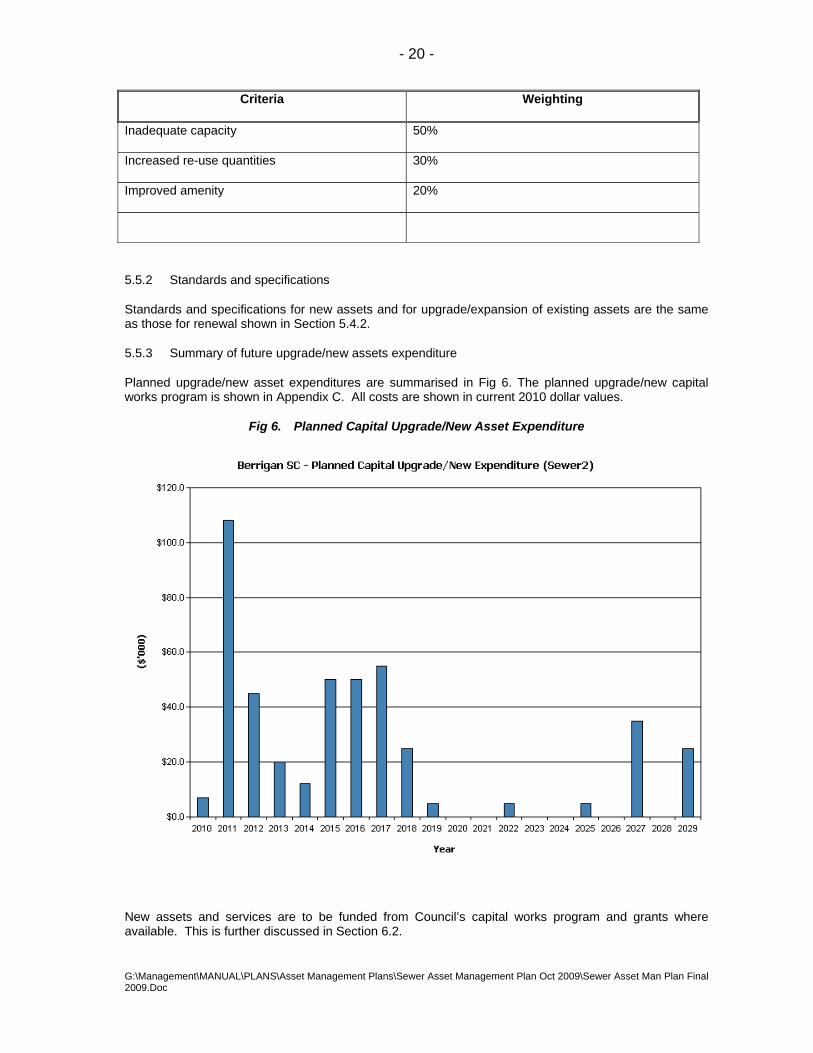
5.5.3 Summary of future upgrade/new assets expenditure
Planned upgrade/new asset expenditures are summarised in Fig 6. The planned upgrade/new capital works program is shown in Appendix C. All costs are shown in current 2010 dollar values.
Fig 6. Planned Capital Upgrade/New Asset Expenditure
New assets and services are to be funded from Council’s capital works program and grants where available. This is further discussed in Section 6.2.

- 21 -
G:\Management\MANUAL\PLANS\Asset Management Plans\Sewer Asset Management Plan Oct 2009\Sewer Asset Man Plan Final 2009.Doc
5.6 Disposal Plan
Disposal includes any activity associated with disposal of a decommissioned asset including sale, demolition or relocation. There have been no assets identified for possible decommissioning and disposal at this time.
- 22 -
G:\Management\MANUAL\PLANS\Asset Management Plans\Sewer Asset Management Plan Oct 2009\Sewer Asset Man Plan Final 2009.Doc
6. FINANCIAL SUMMARY This section contains the financial requirements resulting from all the information presented in the previous sections of this asset management plan. The financial projections will be improved as further information becomes available on desired levels of service and current and projected future asset performance.
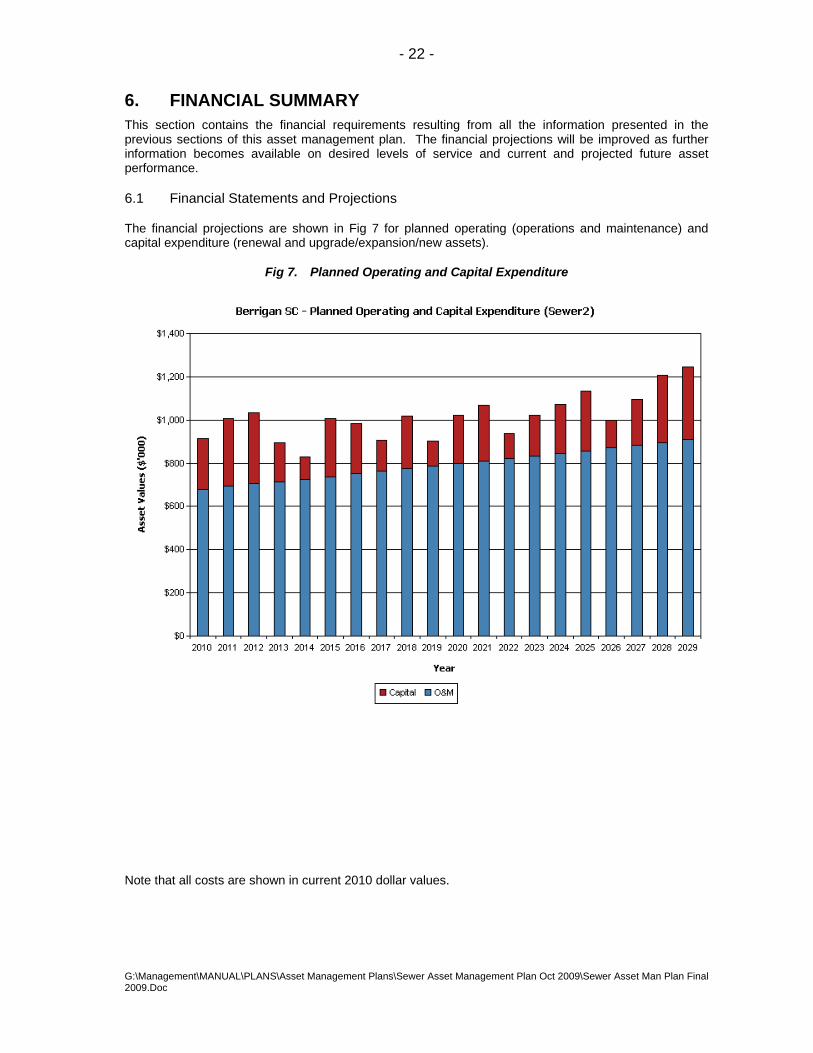
6.1 Financial Statements and Projections
The financial projections are shown in Fig 7 for planned operating (operations and maintenance) and capital expenditure (renewal and upgrade/expansion/new assets).
Fig 7. Planned Operating and Capital Expenditure
Note that all costs are shown in current 2010 dollar values.
- 23 -
G:\Management\MANUAL\PLANS\Asset Management Plans\Sewer Asset Management Plan Oct 2009\Sewer Asset Man Plan Final 2009.Doc
6.1.1 Sustainability of service delivery
There are two key indicators for financial sustainability that have been considered in the analysis of the services provided by this asset category, these being long term life cycle costs and medium term costs over the 10 year financial planning period.
Long term - Life Cycle Cost
Life cycle costs (or whole of life costs) are the average costs that are required to sustain the service levels over the longest asset life. Life cycle costs include maintenance and asset consumption (depreciation expense). The annual average life cycle cost for the services covered in this asset management plan is $1,091,814.
Life cycle costs can be compared to life cycle expenditure to give an indicator of sustainability in service provision. Life cycle expenditure includes maintenance plus capital renewal expenditure. Life cycle expenditure will vary depending on the timing of asset renewals. The life cycle expenditure at the start of the plan is $460,172.
A gap between life cycle costs and life cycle expenditure gives an indication as to whether present consumers are paying their share of the assets they are consuming each year. The purpose of this Sewer asset management plan is to identify levels of service that the community needs and can afford and develop the necessary long term financial plans to provide the service in a sustainable manner.
The life cycle gap for services covered by this asset management plan is $631,642 per annum. The life cycle sustainability index is 0.42
Medium term – 10 year financial planning period
This asset management plan identifies the estimated maintenance and capital expenditures required to provide an agreed level of service to the community over a 20 year period for input into a 10 year financial plan and funding plan to provide the service in a sustainable manner.
This may be compared to existing or planned expenditures in the 20 year period to identify any gap. In a core asset management plan, a gap is generally due to increasing asset renewals.
Fig 8 shows the projected asset renewals in the 20 year planning period from the asset register. The projected asset renewals are compared to planned renewal expenditure in the capital works program and capital renewal expenditure in year 1 of the planning period as shown in Fig 8. Table 6.1.1 shows the annual and cumulative funding gap between projected and planned renewals.
Fig 8. Projected and Planned Renewals and Current Renewal Expenditure

- 24 -
G:\Management\MANUAL\PLANS\Asset Management Plans\Sewer Asset Management Plan Oct 2009\Sewer Asset Man Plan Final 2009.Doc
Table 6.1.1 shows the gap between projected and planned renewals.
Table 6.1.1 Projected and Planned Renewals and Expenditure Gap
Year Projected Renewals Planned Renewals Renewal Funding Gap Cumulative Gap 2010 $73.25 $229.00 ‐$155.75 ‐$155.75
2011 $0.00 $207.80 ‐$207.80 ‐$363.55
2012 $0.00 $285.00 ‐$285.00 ‐$648.55
2013 $0.00 $160.00 ‐$160.00 ‐$808.55
2014 $1,402.20 $92.50 $1,309.70 $501.15
2015 $2,599.72 $218.00 $2,381.72 $2,882.87
2016 $0.00 $183.00 ‐$183.00 $2,699.87
2017 $1,051.65 $90.00 $961.65 $3,661.52
2018 $0.00 $218.00 ‐$218.00 $3,443.52
2019 $0.00 $112.50 ‐$112.50 $3,331.02

- 25 -
G:\Management\MANUAL\PLANS\Asset Management Plans\Sewer Asset Management Plan Oct 2009\Sewer Asset Man Plan Final 2009.Doc
2020 $0.00 $223.00 ‐$223.00 $3,108.02
2021 $2,856.27 $258.00 $2,598.27 $5,706.29
2022 $2,084.21 $110.00 $1,974.21 $7,680.50
2023 $0.00 $190.00 ‐$190.00 $7,490.50
2024 $3,385.15 $227.50 $3,157.65 $10,648.15
2025 $3.93 $270.00 ‐$266.07 $10,382.08
2026 $0.00 $130.00 ‐$130.00 $10,252.08
2027 $178.20 $178.00 $0.20 $10,252.28
2028 $18.15 $312.50 ‐$291.85 $9,960.43
2029 $0.00 $312.50
‐$312.50 $9,647.93
Providing services in a sustainable manner will require matching of projected asset renewals to meet agreed service levels with planned capital works programs and available revenue.
A gap between projected asset renewals, planned asset renewals and funding indicates that further work is required to manage required service levels and funding to eliminate any funding gap. The quantum of the gap will be greatly impacted by any changes in the useful life of assets and in particular the sewer reticulation pipes. As many of these pipes are reaching the end of their nominal useful life it is imperative that CCTV inspections be carried out for these pipes to allow an estimation of their remaining useful life.
Council will manage the ‘gap’ by developing this asset management plan to provide guidance on future service levels and resources required to provide these services, and by inspecting the pipe network to estimate the remaining useful life of these assets. Once this work is complete it will be necessary to review this plan.
Council’s long term financial plan covers the first 10 years of the 20 year planning period. The total maintenance and capital renewal expenditure required over the 10 years is $9,094,370.
This is an average expenditure of $909,437. Estimated maintenance and capital renewal expenditure in year 1 is $535,390 and this would give a 10 year sustainability index of 0.59.
6.2 Funding Strategy
Projected expenditure identified in Section 6.1 is to be funded from Council’s operating and capital budgets. The funding strategy is detailed in the Council’s 10 year long term financial plan (Attached as Appendix D)and this allows for the build up of reserve funds to balance projected renewal costs over the life of the assets.
Maintaining the current level of fees and charges should see sufficient funds raised to cover the long term sustainability of all sewer assets. Within the 10 year time frame a surplus of $5.8m will be accumulated over the proposed expenditure and this compares to an $8m surplus over this period if only projected renewal works are completed.

- 26 -
G:\Management\MANUAL\PLANS\Asset Management Plans\Sewer Asset Management Plan Oct 2009\Sewer Asset Man Plan Final 2009.Doc
Achieving the financial strategy will require the maintenance of current levels of fees and charges for sewerage services in real terms and the smoothing of asset renewal expenditure by prioritising renewals in line with criteria set out in Table 5.4.1.
6.3 Valuation Forecasts
Asset values are forecast to increase as additional assets are added to the asset stock from construction and acquisition by Council and from assets constructed by land developers and others and donated to Council. Fig 9 shows the projected replacement cost asset values over the planning period in current 2010 dollar values.
Fig 9. Projected Asset Values
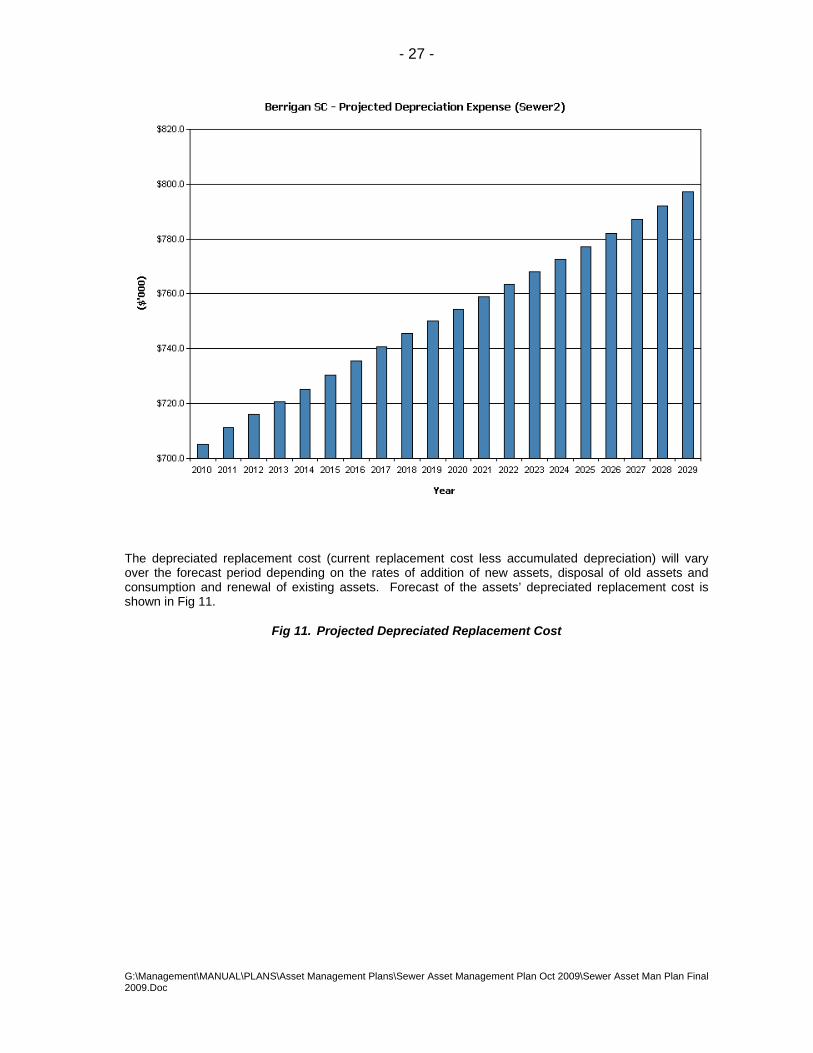
Depreciation expense values are forecast in line with asset values as shown in Fig 10.
Fig 10. Projected Depreciation Expense
- 27 -
G:\Management\MANUAL\PLANS\Asset Management Plans\Sewer Asset Management Plan Oct 2009\Sewer Asset Man Plan Final 2009.Doc
The depreciated replacement cost (current replacement cost less accumulated depreciation) will vary over the forecast period depending on the rates of addition of new assets, disposal of old assets and consumption and renewal of existing assets. Forecast of the assets’ depreciated replacement cost is shown in Fig 11.
Fig 11. Projected Depreciated Replacement Cost

- 28 -
G:\Management\MANUAL\PLANS\Asset Management Plans\Sewer Asset Management Plan Oct 2009\Sewer Asset Man Plan Final 2009.Doc
6.4 Key Assumptions made in Financial Forecasts
This section details the key assumptions made in presenting the information contained in this asset management plan and in preparing forecasts of required operating and capital expenditure and asset values, depreciation expense and carrying amount estimates. It is presented to enable readers to gain an understanding of the levels of confidence in the data behind the financial forecasts.
Key assumptions made in this asset management plan are:
• Renewal costs for gravity mains are 80% of current replacement value as the mains would be relined rather than replaced
• Assets have been given nominal useful life values on the basis of guidelines produced by the NSW Department of Local Government.
• The useful life of all asbestos cement gravity mains have been increased from 45 years to 55 years pending CCTV survey of condition.
Accuracy of future financial forecasts may be improved in future revisions of this asset management plan by the following actions.
• Condition assessments to be carried out for all assets to estimate remaining life and subsequently reassess the useful life values.
• The expected distribution of revised useful life values will allow for a smoothing of projected renewal costs and a more accurate forecast of renewal cost projections.

- 29 -
G:\Management\MANUAL\PLANS\Asset Management Plans\Sewer Asset Management Plan Oct 2009\Sewer Asset Man Plan Final 2009.Doc
• The completion of CCTV surveys of all gravity mains in Tocumwal, Finley and Berrigan is essential to provide accurate financial forecasts.
• Construction costs need to be monitored to ensure the replacement costs being used in the plan are realistic.

- 30 -
G:\Management\MANUAL\PLANS\Asset Management Plans\Sewer Asset Management Plan Oct 2009\Sewer Asset Man Plan Final 2009.Doc
7. ASSET MANAGEMENT PRACTICES
7.1 Accounting/Financial Systems
The accounting/financial system used by Berrigan Shire is Civica PCS and the costing accounts for sewer are basically broken into maintenance and capital. It would be desirable for the chart of accounts to be further developed to enable the clear separation of operation costs and maintenance costs and to split the maintenance costs into reactive, planned and cyclic. It would also be desirable to clearly separate capital expenditure into renewal, new and upgrade works.
The financial system is controlled by the Finance Manager with assistance from the Finance Officer. The Finance Manager is accountable for configuration and maintenance of the system. Area managers are responsible for the timely provision of data to be input into the system and various officers subordinate to the Finance Manager are responsible for the accurate and timely input of data to the system.
The following accounting standards/regulations/guidelines shall be complied with:
Applicable Australian equivalents to International Financial Reporting Standards (AIFRSs)’
Other authoritative pronouncements for the Australian Accounting Standards Board,
Urgent Issues Group Interpretations,
The Local Government Act (1993) and Regulations and
The Local Government Code of Accounting Practice and Financial Reporting.
Where work is carried out on an asset that will increase its useful life and is greater than $5,000 in value it will be considered a capital improvement.
The chart of accounts will be further developed to enable the clear separation of operation costs and maintenance costs and to split the maintenance costs into reactive, planned and cyclic. It will also be developed to clearly separate capital expenditure into renewal, new and upgrade works.
7.2 Asset Management Systems
Sewer assets are managed using the BizeAsset system. This system is map based using MapInfo/Microsoft Access for inventory and special records. The sewer asset inventory is complete at the global level, however, it could be improved by separating assets such as pumping stations and treatment works into smaller components. The BizeAsset system also provides modelling tools for asset replacement, however, these have not been used to this point as the emphasis has been on inputting inventory data.
A maintenance management system called CWorks is also used for programming and recording maintenance activities.
Currently neither of these systems is directly linked to the Civica PCS accounting/financial system, however, such a link would be desirable to provide accuracy and consistency of information between the systems. Depreciation calculations are completed using BizeAsset and the results then transferred to Civica PCS.
The asset management system is controlled by the Director Technical Services with assistance from the Executive Engineer. Data input and validation of data is carried out by the Technical Officer – Assets with security of the system being the responsibility of the IT Officer.

- 31 -
G:\Management\MANUAL\PLANS\Asset Management Plans\Sewer Asset Management Plan Oct 2009\Sewer Asset Man Plan Final 2009.Doc
It is not envisaged that the asset management system will change in the period to the next review of this plan. It would be desirable for the asset management systems to be integrated with the accounting/financial system and this is a possibility with the development of Civica products. The estimated cost of such an integration puts it out of reach within the short term.
7.3 Information Flow Requirements and Processes
The key information flows into this asset management plan are:
• The asset register data on size, age, value, remaining life of the network; • The unit rates for categories of work/material; • The adopted service levels; • Projections of various factors affecting future demand for services; • Correlations between maintenance and renewal, including decay models; • Data on new assets acquired by council.
The key information flows from this asset management plan are:
• The assumed Works Program and trends; • The resulting budget, valuation and depreciation projections; • The useful life analysis.
These will impact the Long Term Financial Plan, Strategic Business Plan, annual budget and departmental business plans and budgets.
The financial reports generated by BizeAsset including valuations, depreciation calculations etc. are provided to the Finance Manager for input into Civica PCS financial system. Actual construction costs for capital works are provided by financial services staff to the Technical Officer – Assets for input into BizeAsset.
New assets constructed by Council are captured by the Technical Officer – Assets from the adopted works program with confirmation of construction from the Environmental Engineer. Actual construction costs for capital works are provided by financial services staff to the Technical Officer – Assets for input into BizeAsset.
New assets gifted to Council by developers are captured by the Technical Officer – Assets from ‘As Constructed’ drawings and cost estimates submitted by developers. These plans and estimates are checked and signed off by the Environmental Engineer as correct.
7.4 Standards and Guidelines
The standards and guidelines relevant to this plan are set out below:
AAS27, Financial Reporting by Local Governments, Australian Accounting Standards, June 1996
AASB1031, Materiality, Australian Accounting Standards Board, July 2004
AASB116, Property, Plant and Equipment, Australian Accounting Standards Board, July 2007
2009/2010 Management Plan, Berrigan Shire Council
International Infrastructure Management Manual, Institute of Public Works Engineering Australia, 2006
Local Government Asset Accounting Manual, Department of Local Government, New South Wales, Update No. 4, 1999

- 32 -
G:\Management\MANUAL\PLANS\Asset Management Plans\Sewer Asset Management Plan Oct 2009\Sewer Asset Man Plan Final 2009.Doc
8. PLAN IMPROVEMENT AND MONITORING
8.1 Performance Measures
The effectiveness of the asset management plan can be measured in the following ways:
• The degree to which the required cashflows identified in this asset management plan are incorporated into council’s long term financial plan and Strategic Management Plan;
• The degree to which 1-5 year detailed works programs, budgets, business plans and organisational structures take into account the ‘global’ works program trends provided by the asset management plan;
8.2 Improvement Plan
The asset management improvement plan generated from this asset management plan is shown in Table 8.2.
Table 8.2 Improvement Plan
Task No
Task Responsibility Resources Required
Timeline
1. Condition Rating of assets including CCTV survey of gravity mains
EE Staff June 2012
2. Review of remaining life of assets following condition ratings
EE Staff June 2012
3. Componentisation of point assets such as pumping stations and treatment plants including review of unit costs
EE, TOA Staff March 2012
4. Document methodology and procedures for asset useful lives, asset unit costs, condition rating and depreciation calculations
DTS, DCS Staff June 2010
5. Develop chart of accounts to allow separation of operation costs and maintenance costs and to split the maintenance costs into reactive, planned and cyclic and to separate capital expenditure into renewal, new and upgrade works.
FM Staff June 2010
6. Investigate options for integration of the Asset Management System with the Accounting/Financial System
FM, EXE Staff March 2012
7. Carry out community consultation to allow the development of Desired Levels of Service when this plan is reviewed in 2013
DCS Staff/External March 2013

- 33 -
G:\Management\MANUAL\PLANS\Asset Management Plans\Sewer Asset Management Plan Oct 2009\Sewer Asset Man Plan Final 2009.Doc
8.3 Monitoring and Review Procedures
This asset management plan will be reviewed during annual budget preparation and amended to recognise any changes in service levels and/or resources available to provide those services as a result of the budget decision process.
The Plan has a life of 4 years and is due for revision and updating within 2 years of each Council election.

- 34 -
G:\Management\MANUAL\PLANS\Asset Management Plans\Sewer Asset Management Plan Oct 2009\Sewer Asset Man Plan Final 2009.Doc
REFERENCES DVC, 2006, ‘Asset Investment Guidelines’, ‘Glossary’, Department for Victorian Communities, Local Government Victoria, Melbourne, http://www.dvc.vic.gov.au/web20/dvclgv.nsf/allDocs/RWP1C79EC4A7225CD2FCA257170003259F6?OpenDocument
IPWEA, 2006, ‘International Infrastructure Management Manual’, Institute of Public Works Engineering Australia, Sydney, www.ipwea.org.au
AAS27, Financial Reporting by Local Governments, Australian Accounting Standards, June 1996
AASB1031, Materiality, Australian Accounting Standards Board, July 2004
AASB116, Property, Plant and Equipment, Australian Accounting Standards Board, July 2007
2009/2010 Management Plan, Berrigan Shire Council
Local Government Asset Accounting Manual, Department of Local Government, New South Wales, Update No. 4, 1999
IPWEA NAMS.PLUS, Asset Management, A Guided Pathway to Asset Management Planning
Report on Water and Wastewater Infrastructure Maintenance Strategy, GHD, 1997
Sewerage Strategic Business Plan, Fisher Stewart,1997
OH&S Audit Report of the Water and Sewerage Schemes Facilities, DPWS, 1999
Finley Urban Water Plan, DPWS, 2000
Planning Workshop No. 2 Report, DPWS, 2000
Water and Sewerage Strategic Business Planning Review, DPWS, 2001
Water and Sewerage Strategic Business Planning Review, BSC, 2004
Berrigan Shire Council – State of Environment Report, 2008
Berrigan Shire Council – Local Environmental Plan, 1992
Berriquin Land and Water Management Plan, 1995
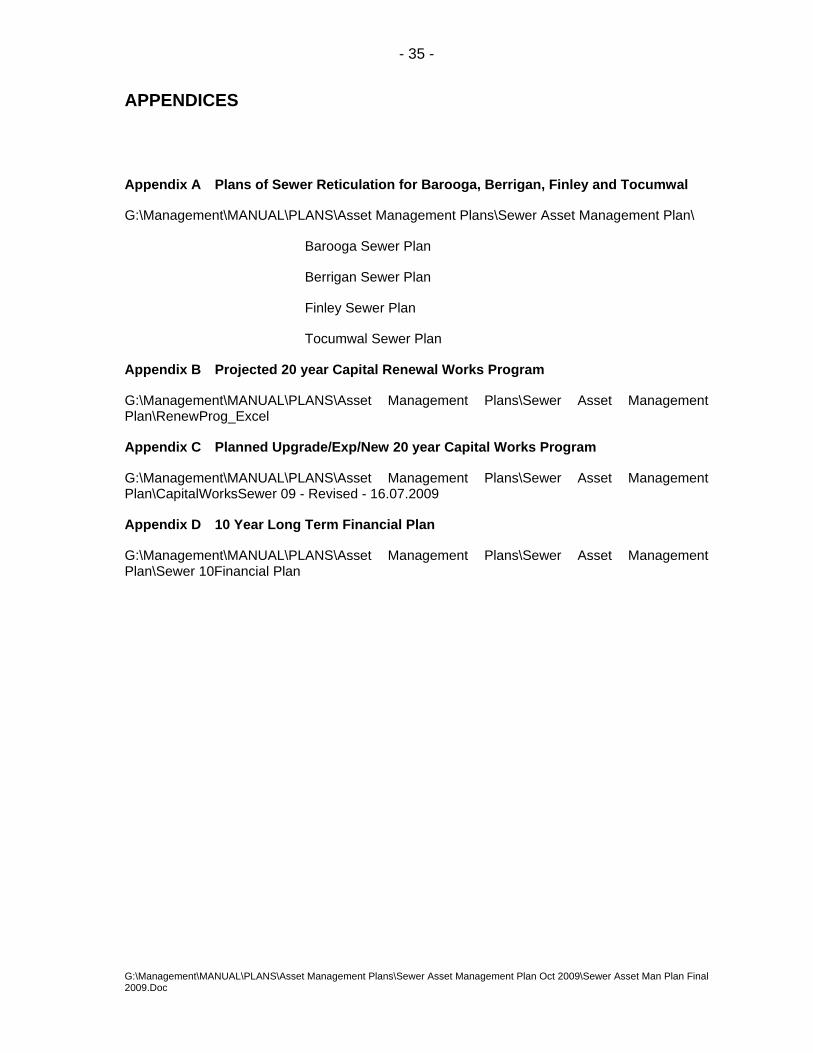
- 35 -
G:\Management\MANUAL\PLANS\Asset Management Plans\Sewer Asset Management Plan Oct 2009\Sewer Asset Man Plan Final 2009.Doc
APPENDICES
Appendix A Plans of Sewer Reticulation for Barooga, Berrigan, Finley and Tocumwal
G:\Management\MANUAL\PLANS\Asset Management Plans\Sewer Asset Management Plan\
Barooga Sewer Plan
Berrigan Sewer Plan
Finley Sewer Plan
Tocumwal Sewer Plan
Appendix B Projected 20 year Capital Renewal Works Program
G:\Management\MANUAL\PLANS\Asset Management Plans\Sewer Asset Management Plan\RenewProg_Excel
Appendix C Planned Upgrade/Exp/New 20 year Capital Works Program
G:\Management\MANUAL\PLANS\Asset Management Plans\Sewer Asset Management Plan\CapitalWorksSewer 09 - Revised - 16.07.2009
Appendix D 10 Year Long Term Financial Plan
G:\Management\MANUAL\PLANS\Asset Management Plans\Sewer Asset Management Plan\Sewer 10Financial Plan

Berrigan Shire Council
‘Core’ Infrastructure Risk Management Plan
Sewer
Version
Adopted by Council 21 October 2009

G:\Management\MANUAL\PLANS\Asset Management Plans\Sewer Asset Management Plan Oct 2009\Sewer Risk.Doc
Document Control
Document ID: 59_07_070909 nams.plus core irmp template v6
Rev No Date Revision Details Author Reviewer Approver
© Copyright 2007 – All rights reserved.
The Institute of Public Works Engineering Australia.

G:\Management\MANUAL\PLANS\Asset Management Plans\Sewer Asset Management Plan Oct 2009\Sewer Risk.Doc
TABLE OF CONTENTS
1. INTRODUCTION ...................................................................................................... 1 1.1 Aim .................................................................................................................... 1 1.2 Objectives.......................................................................................................... 1 1.3 Core and Advanced Risk Management ............................................................. 1 1.4 Scope ................................................................................................................ 1 1.5 The Risk Management Context ......................................................................... 1 1.6 Risk Management Model ................................................................................... 2
2. COMMUNICATION AND CONSULTATION ............................................................ 3 3. RISK IDENTIFICATION ........................................................................................... 3
3.1 General.............................................................................................................. 3 4. RISK ANALYSIS ...................................................................................................... 4
4.1 General.............................................................................................................. 4 4.2 Likelihood .......................................................................................................... 4 4.3 Consequences .................................................................................................. 4 4.4 Method .............................................................................................................. 4 4.4.1 Likelihood .................................................................................................. 4 4.4.2 Consequences .......................................................................................... 5 4.4.3 Risk Assessment ....................................................................................... 5 4.4.4 Indicator of Risk Treatment ....................................................................... 5 4.4.5 Analysis of Risk ......................................................................................... 6 4.5 Risk Evaluation.................................................................................................. 6
5. RISK TREATMENT PLANS ..................................................................................... 7 5.1 General.............................................................................................................. 7 5.2 Risk Treatment Process .................................................................................... 7 5.3 Risk Treatments ................................................................................................ 7 5.4 Risk Treatment Plans ........................................................................................ 7
6. MONITORING AND REVIEW .................................................................................. 8 7. REFERENCES ......................................................................................................... 8 APPENDIX A RISK REGISTER ....................................................................................... 9

- 1 -
G:\Management\MANUAL\PLANS\Asset Management Plans\Sewer Asset Management Plan Oct 2009\Sewer Risk.Doc
1. INTRODUCTION
1.1 Aim
The purpose of this core infrastructure risk management plan is document the results and recommendations resulting from periodic identification, assessment and treatment of risks associated with providing services to the community from infrastructure, using the fundamentals of Australian Standard for Risk Management, AS/NZS 4360; 2004.
Risk Management is defined in AS/NZS 4360; 2004 as: “the culture, processes and structures that are directed towards realising potential opportunities whilst managing adverse effects” 1.
1.2 Objectives
The objectives of the plan are:
• to identify risks to the Berrigan Shire Council that may impact of the delivery of services from infrastructure
• to select credible risks for detailed analysis, • to analyse and evaluate risks in accordance with AS/NZS 4360:2004, • to prioritise risks, • to identify risks requiring treatment by management action, • to develop risk treatment plans identifying the tasks required to manage the risks, the person
responsible for each task, the resources required and the due completion date.
1.3 Core and Advanced Risk Management
This core risk management plan has been designed to be read as a supporting document to the infrastructure and asset management plan. It has been prepared using the fundamentals of Australian Standard for Risk Management, AS/NZS 4360:2004.
Future revisions of this risk management plan will move toward more comprehensive documentation in accordance with Australian Standard for Risk Management, AS/NZS 4360:2004.
1.4 Scope
This plan considers risks associated with delivery of services from infrastructure.
1.5 The Risk Management Context
Council has implemented many management practices and procedures to identify and manage risks associated with providing services from infrastructure assets. These include:
• operating a reactive maintenance service for all assets and services; • operating a planned maintenance system for key assets; • monitoring condition and remaining service life of assets nearing the end of their service life; • renewing and upgrading assets to maintain service delivery; • closing and disposing of assets not providing the required service level; and • acquiring or constructing new assets to provide new and improved services.
1 p4

- 2 -
G:\Management\MANUAL\PLANS\Asset Management Plans\Sewer Asset Management Plan Oct 2009\Sewer Risk.Doc
Council has assigned responsibilities for managing risks associated with sewer assets and service delivery to its Technical Services Department.
1.6 Risk Management Model
The risk management process used in this project is shown in Fig 1.6 below.
It is an analysis and problem solving technique designed to provide a logical process for the selection of treatment plans and management actions to protect the community against unacceptable risks.
The process is based on the fundamentals of Australian Standard AS/NZS 4360:2004, Risk Management.
TREAT RISKS
- Identify options- Assess options- Treatment plans
ANALYSE & EVALUATE RISKS
- Consequences- Likelihood - Level of Risk- Evaluate
IDENTIFY RISKS
- What can happen ?- When and why ?- How and why ?
Fig 1.6. Risk Management Process – Abridged Source: Adapted from AS/NZS 4360:2004, Fig 3.1 p 13

- 3 -
G:\Management\MANUAL\PLANS\Asset Management Plans\Sewer Asset Management Plan Oct 2009\Sewer Risk.Doc
2. COMMUNICATION AND CONSULTATION
Risk communication is ‘the interactive process of exchange of information and opinion involving multiple messages about the nature of risk and risk management’. 2
‘Appropriate communication and consultation seeks to:
• Improve people’s understanding of risks and the risk management processes; • Ensure that the varied views of stakeholders are considered; and • Ensure that all participants are aware of their roles and responsibilities.’
The development of this infrastructure risk management plan was undertaken using a consultative team approach to:-
• Identify stakeholders and specialist advisors who need to be involved in the risk management process;
• Discuss and take into account the views of stakeholder and specialist advisors; and • Communicate the results of the risk management process to ensure that all stakeholders are aware
of and understand their and roles and responsibilities in risk treatment plans.
Members of the team responsible for preparation of this risk management plan are:
• Fred Exton – Director Technical Services • Muneeb Sunna – Environmental Engineer • Garry Graham – Technical Officer Water and Sewer • Michelle Koopman – Enterprise Risk Manager • Tony Davis – Technical Officer Assets • Arlena Pyle – Finance Officer
3. RISK IDENTIFICATION
3.1 General
Potential risks associated with providing services from infrastructure were identified at meetings of the council’s infrastructure risk management team.
Team members were asked to identify “What can happen, where and when” to the various council services and then to identify possible “Why and how can it happen” as causes for each potential event.
Each risk was then tested for credibility to ensure that available resources were applied to those risks that the team considered were necessary to proceed with detailed risk analysis
The assets at risk, what can happen, when, possible cause(s), existing controls and credibility are shown in Appendix A – Risk Register.
Credible risks are subjected to risk analysis in Section 4.4.5. Risks assessed as non-credible were not considered further and will be managed by routine procedures.
2 HB 436:2004, Sec 3.1, p 20

- 4 -
G:\Management\MANUAL\PLANS\Asset Management Plans\Sewer Asset Management Plan Oct 2009\Sewer Risk.Doc
4. RISK ANALYSIS
4.1 General
Credible risks which have been identified during the risk identification stage were analysed. This process takes into account the ‘likelihood’ and the ‘consequences’ of the event. The objective of the analysis is to separate the minor acceptable risks from the major risks and to provide data to assist in the assessment and management of risks.
The risk analysis process is applied to all credible risks to determine levels of risk. The process acts as a filter by applying a reasoned and consistent process. Minor risks can be eliminated from further consideration and dealt with within standard operating procedures.
The remaining risks will therefore be of such significance as to consider the development of risk treatment options and plans.
4.2 Likelihood
Likelihood is a qualitative description of probability of an event occurring. The process of determining likelihood involves combining information about estimated or calculated probability, history or experience. Where possible it is based on past records, relevant experience, industry practice and experience, published literature or expert judgement.
4.3 Consequences
Consequences are a qualitative description of the effect of the event. The process of determining consequences involved combining information about estimated or calculated effects, history and experience.
4.4 Method
The risk analysis method uses the risk rating chart shown in Section 4.4.3. This process uses a qualitative assessment of likelihood/probability and history/experience compared against a qualitative assessment of severity of consequences to derive a risk rating.
The qualitative descriptors for each assessment are shown below.
4.4.1 Likelihood
Likliehood Descriptor Probability of occurrence
Rare May occur only in exceptional circumstances
More than 20 years
Unlikely Could occur at some time Within 10-20 years Possible Might occur at some time Within 3-5 years
Likely Will probably occur in most circumstances
Within 2 years
Almost certain
Expected to occur in most circumstances
Within 1 year
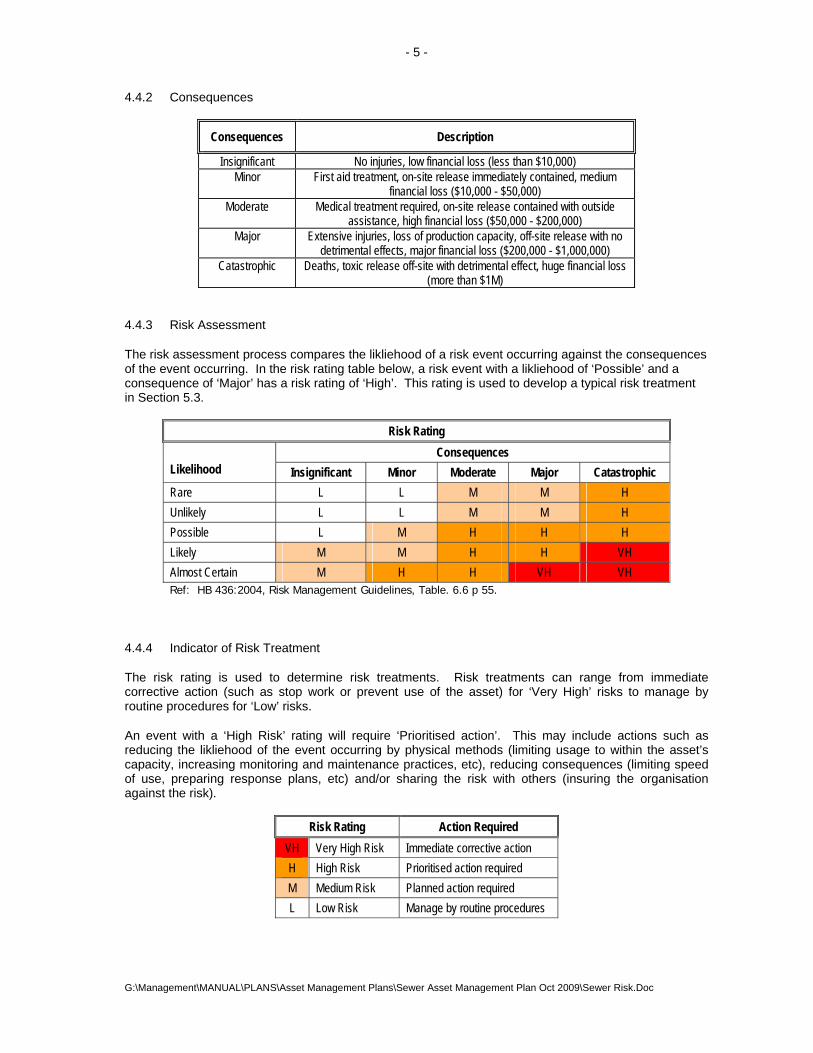
- 5 -
G:\Management\MANUAL\PLANS\Asset Management Plans\Sewer Asset Management Plan Oct 2009\Sewer Risk.Doc
4.4.2 Consequences
Consequences Description
Insignificant No injuries, low financial loss (less than $10,000) Minor First aid treatment, on-site release immediately contained, medium
financial loss ($10,000 - $50,000) Moderate Medical treatment required, on-site release contained with outside
assistance, high financial loss ($50,000 - $200,000) Major Extensive injuries, loss of production capacity, off-site release with no
detrimental effects, major financial loss ($200,000 - $1,000,000) Catastrophic Deaths, toxic release off-site with detrimental effect, huge financial loss
(more than $1M)
4.4.3 Risk Assessment
The risk assessment process compares the likliehood of a risk event occurring against the consequences of the event occurring. In the risk rating table below, a risk event with a likliehood of ‘Possible’ and a consequence of ‘Major’ has a risk rating of ‘High’. This rating is used to develop a typical risk treatment in Section 5.3.
Risk Rating Likelihood
Consequences Insignificant Minor Moderate Major Catastrophic
Rare L L M M H Unlikely L L M M H Possible L M H H H Likely M M H H VH Almost Certain M H H VH VH Ref: HB 436:2004, Risk Management Guidelines, Table. 6.6 p 55.
4.4.4 Indicator of Risk Treatment
The risk rating is used to determine risk treatments. Risk treatments can range from immediate corrective action (such as stop work or prevent use of the asset) for ‘Very High’ risks to manage by routine procedures for ‘Low’ risks.
An event with a ‘High Risk’ rating will require ‘Prioritised action’. This may include actions such as reducing the likliehood of the event occurring by physical methods (limiting usage to within the asset’s capacity, increasing monitoring and maintenance practices, etc), reducing consequences (limiting speed of use, preparing response plans, etc) and/or sharing the risk with others (insuring the organisation against the risk).
Risk Rating Action Required VH Very High Risk Immediate corrective action H High Risk Prioritised action required M Medium Risk Planned action required L Low Risk Manage by routine procedures

- 6 -
G:\Management\MANUAL\PLANS\Asset Management Plans\Sewer Asset Management Plan Oct 2009\Sewer Risk.Doc
4.4.5 Analysis of Risk
The team conducted an analysis of credible risks identified in section 3.1 using the method described above to determine a risk rating for each credible risk.
The credible risks and risk ratings are shown in Appendix A – Risk Register
4.5 Risk Evaluation
The risk management team evaluated the need for risk treatment plans using an overall assessment of the following evaluation criteria to answer the question “is the risk acceptable?”
Criterion Risk Evaluation Notes Operational Risks that have the potential to reduce services for a period of time
unacceptable to the community and/or adversely affect the council’s public image.
Technical Risks that cannot be treated by council’s existing and/or readily available technical resources.
Financial Risks that cannot be treated within council’s normal maintenance budgets or by reallocation of an annual capital works program.
Legal Risks that have the potential to generate unacceptable exposure to litigation.
Social Risks that have the potential to: - cause personal injury or death and/or - cause significant social/political disruption in the community.
Environmental Risks that have the potential to cause environmental harm.
The evaluation criteria are to provide guidance to evaluate whether the risks are acceptable to the council and its stakeholders in providing services to the community. Risks that do not meet the evaluation criteria above are deemed to be unacceptable and risk treatment plans are required to be developed and documented in this Infrastructure Risk Management Plan.
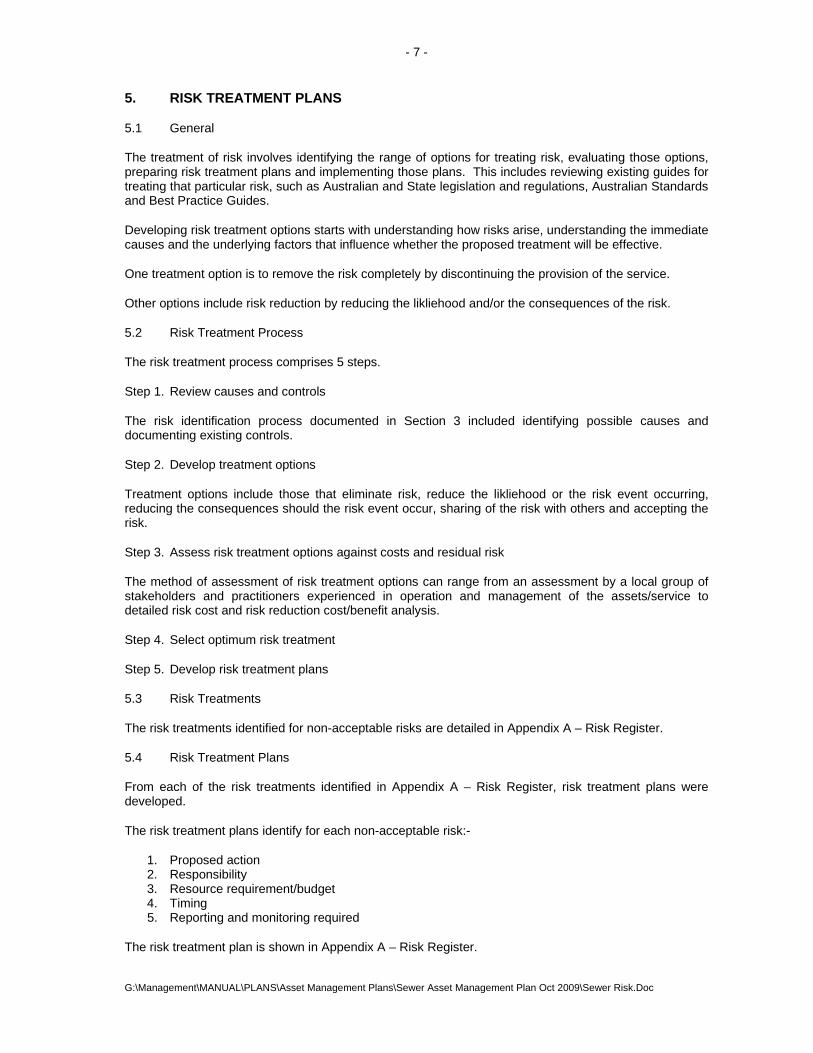
- 7 -
G:\Management\MANUAL\PLANS\Asset Management Plans\Sewer Asset Management Plan Oct 2009\Sewer Risk.Doc
5. RISK TREATMENT PLANS
5.1 General
The treatment of risk involves identifying the range of options for treating risk, evaluating those options, preparing risk treatment plans and implementing those plans. This includes reviewing existing guides for treating that particular risk, such as Australian and State legislation and regulations, Australian Standards and Best Practice Guides.
Developing risk treatment options starts with understanding how risks arise, understanding the immediate causes and the underlying factors that influence whether the proposed treatment will be effective.
One treatment option is to remove the risk completely by discontinuing the provision of the service.
Other options include risk reduction by reducing the likliehood and/or the consequences of the risk.
5.2 Risk Treatment Process
The risk treatment process comprises 5 steps.
Step 1. Review causes and controls
The risk identification process documented in Section 3 included identifying possible causes and documenting existing controls.
Step 2. Develop treatment options
Treatment options include those that eliminate risk, reduce the likliehood or the risk event occurring, reducing the consequences should the risk event occur, sharing of the risk with others and accepting the risk.
Step 3. Assess risk treatment options against costs and residual risk
The method of assessment of risk treatment options can range from an assessment by a local group of stakeholders and practitioners experienced in operation and management of the assets/service to detailed risk cost and risk reduction cost/benefit analysis.
Step 4. Select optimum risk treatment
Step 5. Develop risk treatment plans
5.3 Risk Treatments
The risk treatments identified for non-acceptable risks are detailed in Appendix A – Risk Register.
5.4 Risk Treatment Plans
From each of the risk treatments identified in Appendix A – Risk Register, risk treatment plans were developed.
The risk treatment plans identify for each non-acceptable risk:-
1. Proposed action 2. Responsibility 3. Resource requirement/budget 4. Timing 5. Reporting and monitoring required
The risk treatment plan is shown in Appendix A – Risk Register.

- 8 -
G:\Management\MANUAL\PLANS\Asset Management Plans\Sewer Asset Management Plan Oct 2009\Sewer Risk.Doc
6. MONITORING AND REVIEW
The plan will be monitored and reviewed as follows.
Activity Review Process
Review of new risks and changes to existing risks
Annual review by team with stakeholders and report to council
Review of Risk Management Plan 3 yearly review and re-write by team and report to council
Performance review of Risk Treatment Plan
Action plan tasks incorporated in council staff performance criteria with 6 monthly performance review.
Action plan tasks for other organisations reviewed at annual team review meeting
7. REFERENCES
AS/NZS 4360:2004, Australian/New Zealand Standard, Risk Management, Standards Australia, Sydney.
HB 436:2004, Risk Management Guidelines, Companion to AS/NZS 4360:2004, Standards Australia, Sydney.
International Infrastructure Management Manual, 2006, Institute of Public ~Works Engineering Australia, Sydney, 2006 www.ipwea.org.au

- 9 -
G:\Management\MANUAL\PLANS\Asset Management Plans\Sewer Asset Management Plan Oct 2009\Sewer Risk.Doc
APPENDIX A RISK REGISTER
RISK IDENTIFICATION RISK ANALYSIS RISK TREATMENT RISK TREATMENT PLAN Risk No.
Asset at Risk
What can happen?
When can it occur?
Possible cause
Existing controls
Is risk credible?
Likelihood Consequ-ences
Risk rating
Action required
Is risk accept-able?
Treatment option(s)
Residual risk
Risk treatment plan
Actions Responsibility
Re-sources
Bud-get
Date due
1 Sewer Treatment Plants
Overflow to environment or reduction to water treatment due to power failure
Anytime now
Mains power failure
Bypass arrangements and pond system to buffer water quality
Yes Unlikely Minor Low Manage by routine procedures
Yes
2 Sewer Treatment Plants
Overflow to environment or reduction to water treatment due to component failure
Anytime now
Failure of mechanical/electrical components of pumps
Scheduled inspection of plant components and completion of required maintenance
Yes Possible Minor Medium Planned action required
Yes
3 Sewer Mains
Overflow to environment due to sewer blockage
Anytime now
Blockage by tree roots or other foreign objects
Incident response and repair
Yes Likely Minor Medium Planned action required
Yes
4 Effluent Ponds
Overtopping of ponds
Within 2-3 years
Exceptionally wet season
Monitoring of pond levels and transfer of water
Yes Unlikely Moderate Medium Planned action required
Yes
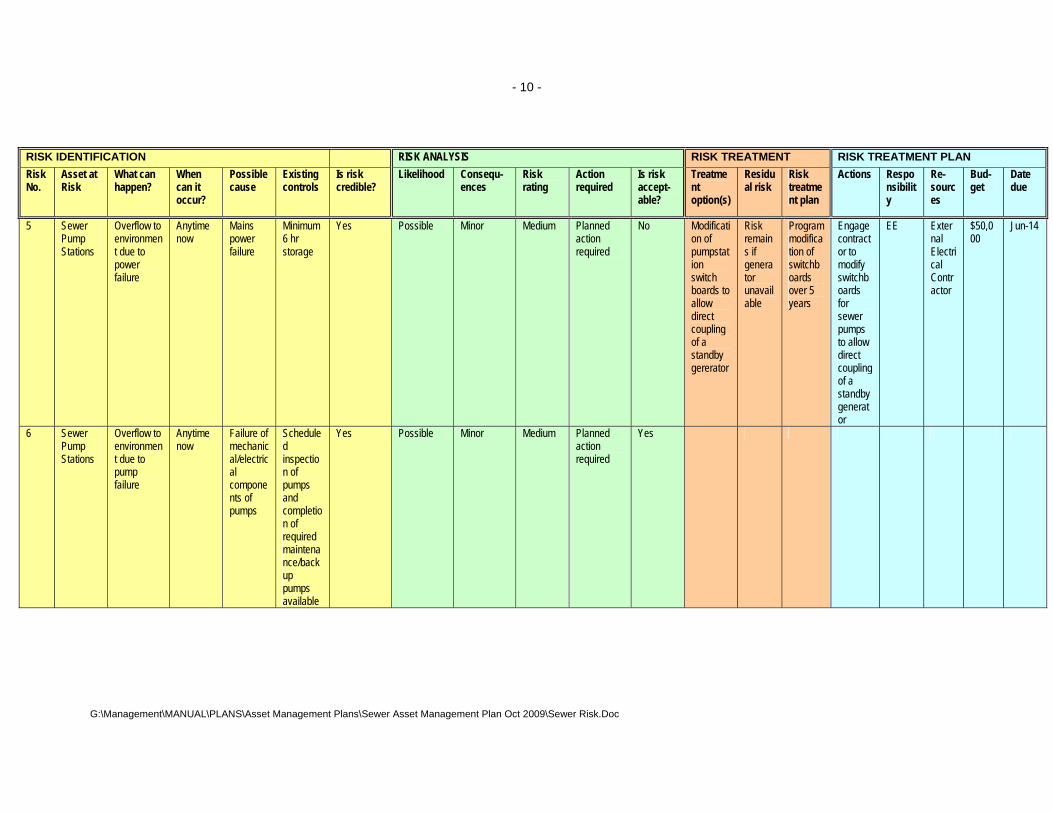
- 10 -
G:\Management\MANUAL\PLANS\Asset Management Plans\Sewer Asset Management Plan Oct 2009\Sewer Risk.Doc
RISK IDENTIFICATION RISK ANALYSIS RISK TREATMENT RISK TREATMENT PLAN Risk No.
Asset at Risk
What can happen?
When can it occur?
Possible cause
Existing controls
Is risk credible?
Likelihood Consequ-ences
Risk rating
Action required
Is risk accept-able?
Treatment option(s)
Residual risk
Risk treatment plan
Actions Responsibility
Re-sources
Bud-get
Date due
5 Sewer Pump Stations
Overflow to environment due to power failure
Anytime now
Mains power failure
Minimum 6 hr storage
Yes Possible Minor Medium Planned action required
No Modification of pumpstation switch boards to allow direct coupling of a standby gererator
Risk remains if generator unavailable
Program modification of switchboards over 5 years
Engage contractor to modify switchboards for sewer pumps to allow direct coupling of a standby generator
EE External Electrical Contractor
$50,000
Jun-14
6 Sewer Pump Stations
Overflow to environment due to pump failure
Anytime now
Failure of mechanical/electrical components of pumps
Scheduled inspection of pumps and completion of required maintenance/backup pumps available
Yes Possible Minor Medium Planned action required
Yes

- 11 -
G:\Management\MANUAL\PLANS\Asset Management Plans\Sewer Asset Management Plan Oct 2009\Sewer Risk.Doc
RISK IDENTIFICATION RISK ANALYSIS RISK TREATMENT RISK TREATMENT PLAN Risk No.
Asset at Risk
What can happen?
When can it occur?
Possible cause
Existing controls
Is risk credible?
Likelihood Consequ-ences
Risk rating
Action required
Is risk accept-able?
Treatment option(s)
Residual risk
Risk treatment plan
Actions Responsibility
Re-sources
Bud-get
Date due
7 Tocumwal Recycle Pond
Overtopping of ponds
Within 2-3 years
Extended wet conditions
Monitoring of pond levels and transfer of water
Yes Unlikely
Minor Low Manage by routine procedures
Yes

- 12 -
G:\Management\MANUAL\PLANS\Asset Management Plans\Sewer Asset Management Plan Oct 2009\Sewer Risk.Doc
RISK IDENTIFICATION RISK ANALYSIS RISK TREATMENT RISK TREATMENT PLAN Risk No.
Asset at Risk
What can happen?
When can it occur?
Possible cause
Existing controls
Is risk credible?
Likelihood Consequ-ences
Risk rating
Action required
Is risk accept-able?
Treatment option(s)
Residual risk
Risk treatment plan
Actions Responsibility
Re-sources
Bud-get
Date due
8 Tocumwal & Finley Golf Courses, Berrigan Race Track
Poor quality effluent delivered for reuse system
Anytime in the future
Failure of chlorination system
Scheduled inspection of chorination unit and maintenance of unit and monitoring and changing of gas bottles
Yes Possible Major High Prioritised action required
No Operational Environmental Management Plans prepared for end use sites that provide controls on exposure to effluent
Risk can be controlled but not eliminated
Prepare and implement OEMP's for all sites that receive treated effluent for reuse
12.1 Prepare OEMPs 12.2 Implement OEMPs including response activities and controls
EE Council Staff Responsible staff from venues receiving recycled effluent
$10,000/annum/plant for additional operational activities required to manage re-use
Jun-09
9 Effluent Quality
Ingress of stormwater into system
Anytime now
Inclement weather combined with illegal connections and poor maintenance
Scheduled inspection of reticulation and repairs. Inspection of new building connections.
Yes Likely Minor Medium Planned action required
Yes
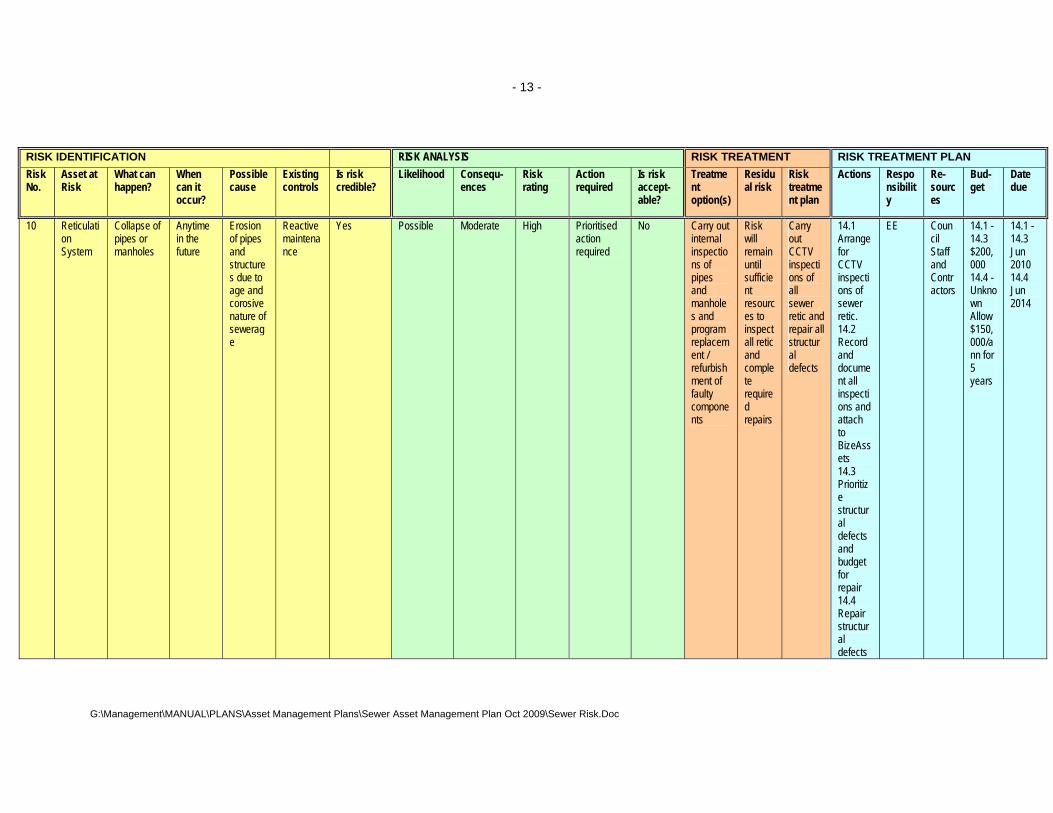
- 13 -
G:\Management\MANUAL\PLANS\Asset Management Plans\Sewer Asset Management Plan Oct 2009\Sewer Risk.Doc
RISK IDENTIFICATION RISK ANALYSIS RISK TREATMENT RISK TREATMENT PLAN Risk No.
Asset at Risk
What can happen?
When can it occur?
Possible cause
Existing controls
Is risk credible?
Likelihood Consequ-ences
Risk rating
Action required
Is risk accept-able?
Treatment option(s)
Residual risk
Risk treatment plan
Actions Responsibility
Re-sources
Bud-get
Date due
10 Reticulation System
Collapse of pipes or manholes
Anytime in the future
Erosion of pipes and structures due to age and corosive nature of sewerage
Reactive maintenance
Yes Possible Moderate High Prioritised action required
No Carry out internal inspections of pipes and manholes and program replacement / refurbishment of faulty components
Risk will remain until sufficient resources to inspect all retic and complete required repairs
Carry out CCTV inspections of all sewer retic and repair all structural defects
14.1 Arrange for CCTV inspections of sewer retic. 14.2 Record and document all inspections and attach to BizeAssets 14.3 Prioritize structural defects and budget for repair 14.4 Repair structural defects
EE Council Staff and Contractors
14.1 - 14.3 $200,000 14.4 - Unknown Allow $150,000/ann for 5 years
14.1 - 14.3 Jun 2010 14.4 Jun 2014

- 14 -
G:\Management\MANUAL\PLANS\Asset Management Plans\Sewer Asset Management Plan Oct 2009\Sewer Risk.Doc


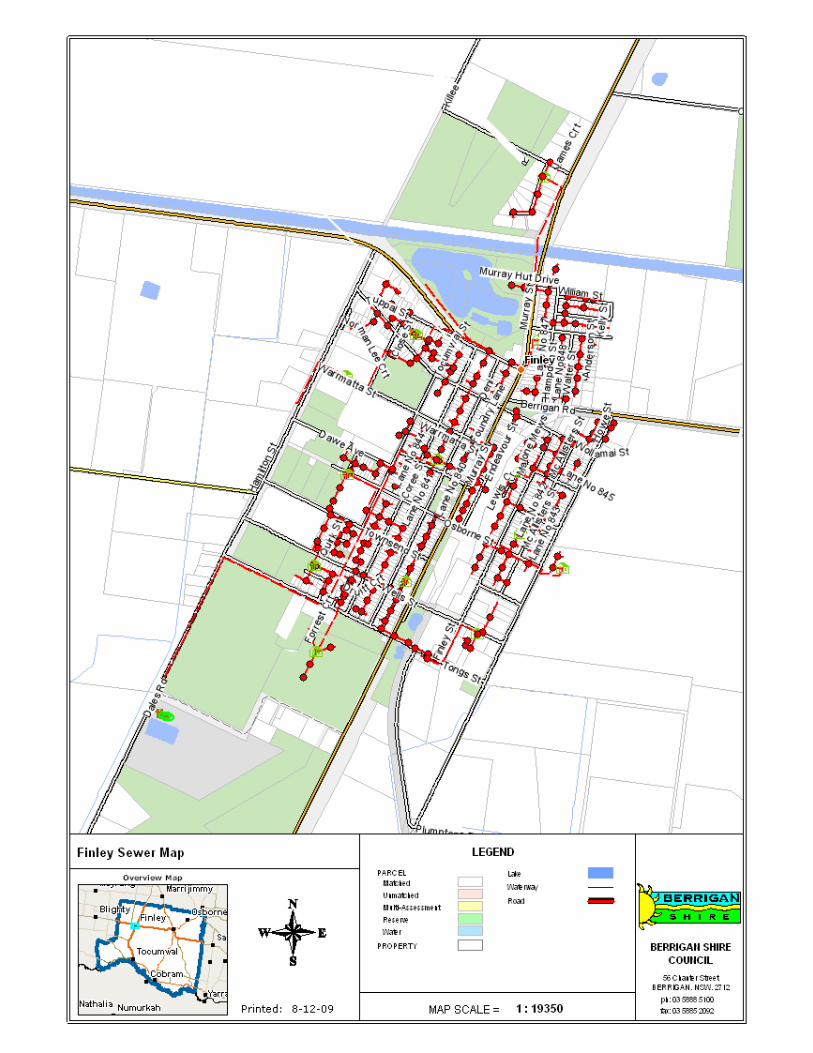


Sub Rem Planned Renewal UsefulCategory Life Renewal Cost Life
(Years) Year ($) (Years)2881099 2.00708E+13 Tocumwal Rising Mains Rising Main PRIVATE LAND 0 2010 $73,252.55 55
$73,252.55
2881141 2.00501E+13 Tocumwal Pump Stations Pump Station BRUTON ST PS/NO5 4 2014 $175,275.00 482881140 2.00501E+13 Tocumwal Pump Stations Pump Station KELLY ST PS/3 4 2014 $175,275.00 482881138 2.00412E+13 Tocumwal Pump Stations Pump Station LANE NO 957 PS/NO1 4 2014 $175,275.00 482881142 2.00501E+13 Tocumwal Pump Stations Pump Station LANE NO 946 PS/NO6 4 2014 $175,275.00 482881143 2.00501E+13 Tocumwal Pump Stations Pump Station LANE NO 947 PS/7 4 2014 $175,275.00 482881144 2.00501E+13 Tocumwal Pump Stations Pump Station LANE NO 948 PS/2 4 2014 $175,275.00 482881150 2.00708E+13 Tocumwal Pump Stations Pump Station PRIVATE LAND 4 2014 $175,275.00 482881139 2.00412E+13 Tocumwal Pump Stations Pump Station PRIVATE LAND PS/NO4 4 2014 $175,275.00 48
$1,402,200.00
2881119 2.00409E+13 Berrigan Pump Stations Pump Station ALEXANDER AVE P/S NO/6 5 2015 $175,275.00 482881124 2.00411E+13 Berrigan Pump Stations Pump Station BERRIGAN LANE 741 PS/5 5 2015 $175,275.00 482881122 2.00409E+13 Berrigan Pump Stations Pump Station HARRIS ST BERRIGAN P/S NO/1 5 2015 $175,275.00 482881120 2.00409E+13 Berrigan Pump Stations Pump Station LANE 733 P/S NO4 5 2015 $175,275.00 482881123 2.00409E+13 Berrigan Pump Stations Pump Station LANE 740 P/S NO/2 5 2015 $175,275.00 482881121 2.00409E+13 Berrigan Pump Stations Pump Station LANE 744 P/S NO 3 5 2015 $175,275.00 482880978 2.00708E+13 Tocumwal Gravity Mains Gravity Main PRIVATE LAND 5 2015 $19,303.07 702880993 2.00708E+13 Tocumwal Gravity Mains Gravity Main PRIVATE LAND 5 2015 $16,072.47 702880995 2.00708E+13 Tocumwal Gravity Mains Gravity Main PRIVATE LAND 5 2015 $20,234.91 702880996 2.00708E+13 Tocumwal Gravity Mains Gravity Main PRIVATE LAND 5 2015 $16,146.18 702881000 2.00708E+13 Tocumwal Gravity Mains Gravity Main PRIVATE LAND 5 2015 $16,191.40 702881003 2.00708E+13 Tocumwal Gravity Mains Gravity Main PRIVATE LAND 5 2015 $16,210.80 702881009 2.00708E+13 Tocumwal Gravity Mains Gravity Main PRIVATE LAND 5 2015 $16,335.69 70
Subtotal
Subtotal
Berrigan SC >> Renewal Program (Sewer2)
UID Asset ID Asset Name From To

2881011 2.00708E+13 Tocumwal Gravity Mains Gravity Main PRIVATE LAND 5 2015 $16,368.86 702881012 2.00708E+13 Tocumwal Gravity Mains Gravity Main PRIVATE LAND 5 2015 $16,377.69 702881014 2.00708E+13 Tocumwal Gravity Mains Gravity Main PRIVATE LAND 5 2015 $12,280.70 702881017 2.00708E+13 Tocumwal Gravity Mains Gravity Main PRIVATE LAND 5 2015 $16,447.76 702881019 2.00708E+13 Tocumwal Gravity Mains Gravity Main PRIVATE LAND 5 2015 $12,312.29 702881022 2.00708E+13 Tocumwal Gravity Mains Gravity Main PRIVATE LAND 5 2015 $16,480.50 702881025 2.00708E+13 Tocumwal Gravity Mains Gravity Main PRIVATE LAND 5 2015 $20,737.49 702881026 2.00708E+13 Tocumwal Gravity Mains Gravity Main PRIVATE LAND 5 2015 $16,567.40 702881158 2.00708E+13 Tocumwal STP Treatment Plant 2 PRIVATE LAND 5 2015 $1,300,000.00 70
$2,599,717.20
2881128 2.00501E+13 Finley Pump Stations Pump Station LANE NO 842 PS/D 7 2017 $175,275.00 482881125 2.00501E+13 Finley Pump Stations Pump Station LANE NO 847 PS/E 7 2017 $175,275.00 482881131 2.00502E+13 Finley Pump Stations Pump Station PRIVATE LAND PS/B 7 2017 $175,275.00 482881130 2.00501E+13 Finley Pump Stations Pump Station PRIVATE LAND PS/C 7 2017 $175,275.00 482881127 2.00501E+13 Finley Pump Stations Pump Station PRIVATE LAND PS/F 7 2017 $175,275.00 482881129 2.00501E+13 Finley Pump Stations Pump Station PRIVATE LAND PS/A 7 2017 $175,275.00 48
$1,051,650.00
2880969 2.00412E+13 Tocumwal Gravity Mains Gravity Main ANZAC AVE L/11 TO L/10 74M 11 2021 $14,960.83 552881037 2.00412E+13 Tocumwal Gravity Mains Gravity Main BARKER ST CG/2 TO CG/1 82M 11 2021 $21,004.37 552880854 2.00412E+13 Tocumwal Gravity Mains Gravity Main BARKER ST CG/3 TO CG/2 55M 11 2021 $14,027.82 552881057 2.00412E+13 Tocumwal Gravity Mains Gravity Main BARKER ST CG/4 TO CG/3 90M 11 2021 $22,914.42 552880681 2.00501E+13 Tocumwal Gravity Mains Gravity Main BAROOGA ST M/2 TO M/1 26M 11 2021 $4,130.57 552880716 2.00412E+13 Tocumwal Gravity Mains Gravity Main BAROOGA ST NTH CC/3 TO CC/2 32M 11 2021 $6,403.44 552880986 2.00501E+13 Tocumwal Gravity Mains Gravity Main BENT ST M/4 TO M/3 78M 11 2021 $8,480.67 552880648 2.00412E+13 Tocumwal Gravity Mains Gravity Main BRIDGE ST E/2 TO E/1 22M 11 2021 $4,341.31 552880875 2.00412E+13 Tocumwal Gravity Mains Gravity Main BRIDGE ST F/1 TO E/1 58M 11 2021 $11,481.05 552880918 2.00412E+13 Tocumwal Gravity Mains Gravity Main BRIDGE ST F/2 TO F/1 63M 11 2021 $9,769.93 552880627 2.00412E+13 Tocumwal Gravity Mains Gravity Main BRIDGE ST G/1 TO F/2 18M 11 2021 $2,798.11 552880591 2.00412E+13 Tocumwal Gravity Mains Gravity Main BRIDGE ST G/1DE TO G/1 6M 11 2021 $675.24 55
Subtotal
Subtotal
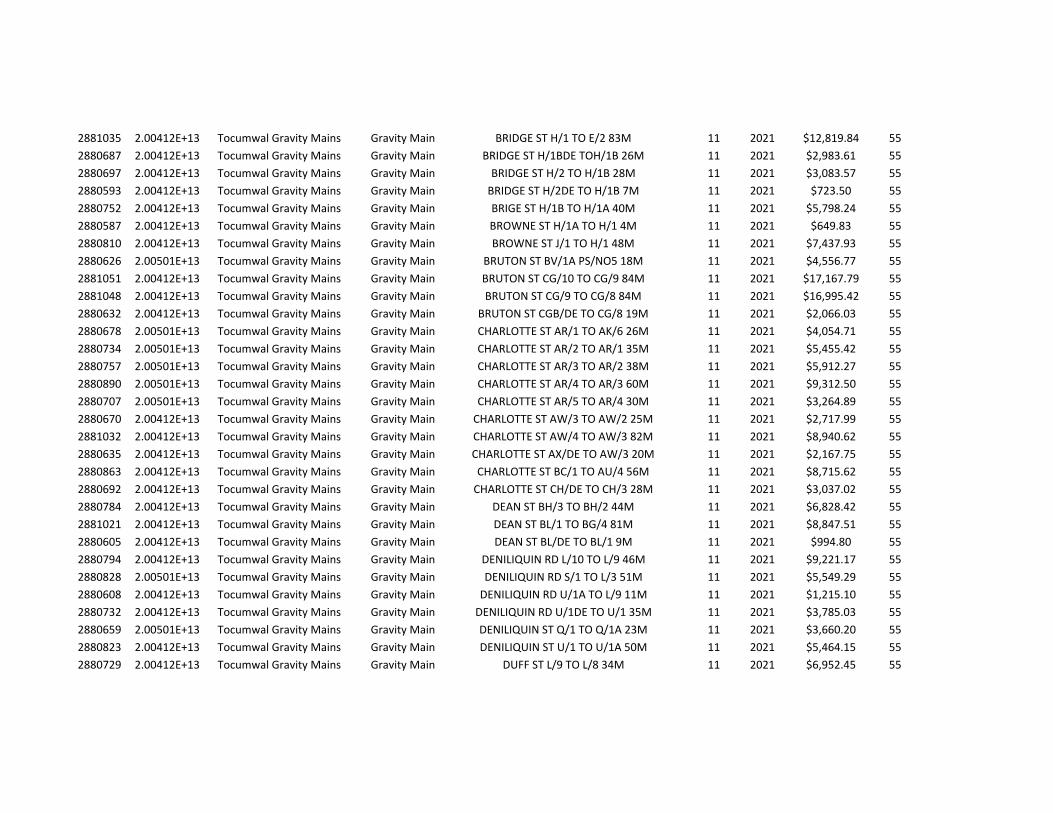
2881035 2.00412E+13 Tocumwal Gravity Mains Gravity Main BRIDGE ST H/1 TO E/2 83M 11 2021 $12,819.84 552880687 2.00412E+13 Tocumwal Gravity Mains Gravity Main BRIDGE ST H/1BDE TOH/1B 26M 11 2021 $2,983.61 552880697 2.00412E+13 Tocumwal Gravity Mains Gravity Main BRIDGE ST H/2 TO H/1B 28M 11 2021 $3,083.57 552880593 2.00412E+13 Tocumwal Gravity Mains Gravity Main BRIDGE ST H/2DE TO H/1B 7M 11 2021 $723.50 552880752 2.00412E+13 Tocumwal Gravity Mains Gravity Main BRIGE ST H/1B TO H/1A 40M 11 2021 $5,798.24 552880587 2.00412E+13 Tocumwal Gravity Mains Gravity Main BROWNE ST H/1A TO H/1 4M 11 2021 $649.83 552880810 2.00412E+13 Tocumwal Gravity Mains Gravity Main BROWNE ST J/1 TO H/1 48M 11 2021 $7,437.93 552880626 2.00501E+13 Tocumwal Gravity Mains Gravity Main BRUTON ST BV/1A PS/NO5 18M 11 2021 $4,556.77 552881051 2.00412E+13 Tocumwal Gravity Mains Gravity Main BRUTON ST CG/10 TO CG/9 84M 11 2021 $17,167.79 552881048 2.00412E+13 Tocumwal Gravity Mains Gravity Main BRUTON ST CG/9 TO CG/8 84M 11 2021 $16,995.42 552880632 2.00412E+13 Tocumwal Gravity Mains Gravity Main BRUTON ST CGB/DE TO CG/8 19M 11 2021 $2,066.03 552880678 2.00501E+13 Tocumwal Gravity Mains Gravity Main CHARLOTTE ST AR/1 TO AK/6 26M 11 2021 $4,054.71 552880734 2.00501E+13 Tocumwal Gravity Mains Gravity Main CHARLOTTE ST AR/2 TO AR/1 35M 11 2021 $5,455.42 552880757 2.00501E+13 Tocumwal Gravity Mains Gravity Main CHARLOTTE ST AR/3 TO AR/2 38M 11 2021 $5,912.27 552880890 2.00501E+13 Tocumwal Gravity Mains Gravity Main CHARLOTTE ST AR/4 TO AR/3 60M 11 2021 $9,312.50 552880707 2.00501E+13 Tocumwal Gravity Mains Gravity Main CHARLOTTE ST AR/5 TO AR/4 30M 11 2021 $3,264.89 552880670 2.00412E+13 Tocumwal Gravity Mains Gravity Main CHARLOTTE ST AW/3 TO AW/2 25M 11 2021 $2,717.99 552881032 2.00412E+13 Tocumwal Gravity Mains Gravity Main CHARLOTTE ST AW/4 TO AW/3 82M 11 2021 $8,940.62 552880635 2.00412E+13 Tocumwal Gravity Mains Gravity Main CHARLOTTE ST AX/DE TO AW/3 20M 11 2021 $2,167.75 552880863 2.00412E+13 Tocumwal Gravity Mains Gravity Main CHARLOTTE ST BC/1 TO AU/4 56M 11 2021 $8,715.62 552880692 2.00412E+13 Tocumwal Gravity Mains Gravity Main CHARLOTTE ST CH/DE TO CH/3 28M 11 2021 $3,037.02 552880784 2.00412E+13 Tocumwal Gravity Mains Gravity Main DEAN ST BH/3 TO BH/2 44M 11 2021 $6,828.42 552881021 2.00412E+13 Tocumwal Gravity Mains Gravity Main DEAN ST BL/1 TO BG/4 81M 11 2021 $8,847.51 552880605 2.00412E+13 Tocumwal Gravity Mains Gravity Main DEAN ST BL/DE TO BL/1 9M 11 2021 $994.80 552880794 2.00412E+13 Tocumwal Gravity Mains Gravity Main DENILIQUIN RD L/10 TO L/9 46M 11 2021 $9,221.17 552880828 2.00501E+13 Tocumwal Gravity Mains Gravity Main DENILIQUIN RD S/1 TO L/3 51M 11 2021 $5,549.29 552880608 2.00412E+13 Tocumwal Gravity Mains Gravity Main DENILIQUIN RD U/1A TO L/9 11M 11 2021 $1,215.10 552880732 2.00412E+13 Tocumwal Gravity Mains Gravity Main DENILIQUIN RD U/1DE TO U/1 35M 11 2021 $3,785.03 552880659 2.00501E+13 Tocumwal Gravity Mains Gravity Main DENILIQUIN ST Q/1 TO Q/1A 23M 11 2021 $3,660.20 552880823 2.00412E+13 Tocumwal Gravity Mains Gravity Main DENILIQUIN ST U/1 TO U/1A 50M 11 2021 $5,464.15 552880729 2.00412E+13 Tocumwal Gravity Mains Gravity Main DUFF ST L/9 TO L/8 34M 11 2021 $6,952.45 55
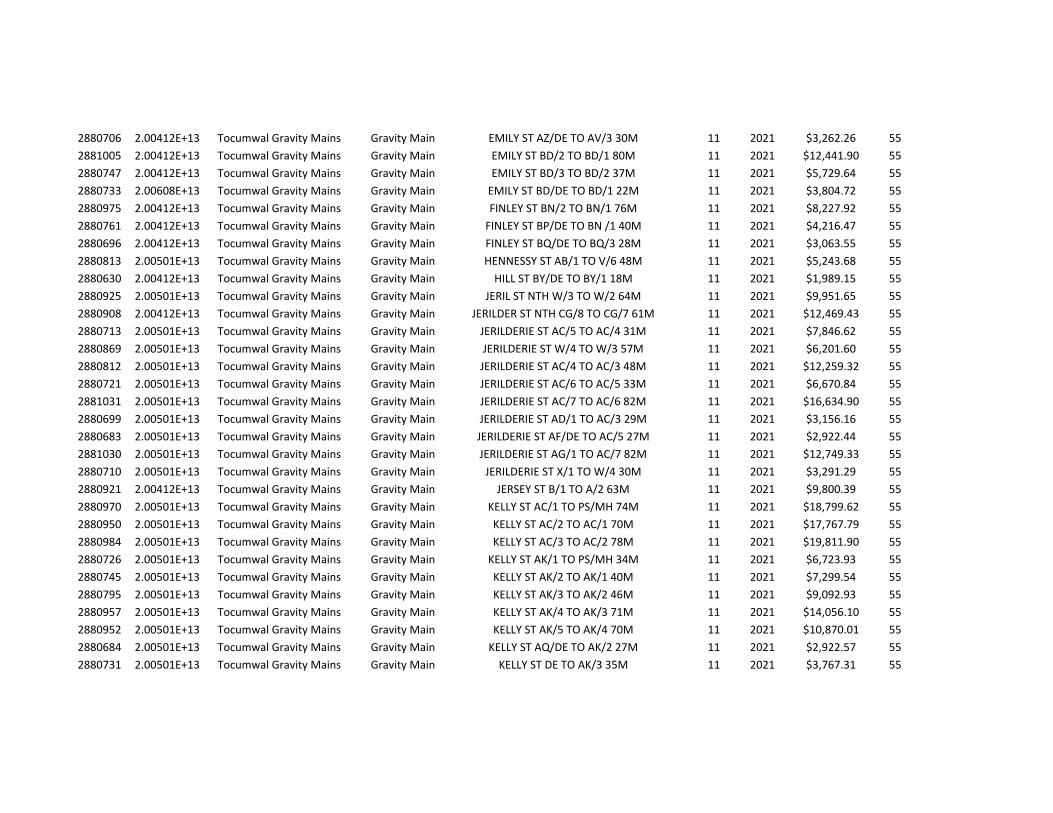
2880706 2.00412E+13 Tocumwal Gravity Mains Gravity Main EMILY ST AZ/DE TO AV/3 30M 11 2021 $3,262.26 552881005 2.00412E+13 Tocumwal Gravity Mains Gravity Main EMILY ST BD/2 TO BD/1 80M 11 2021 $12,441.90 552880747 2.00412E+13 Tocumwal Gravity Mains Gravity Main EMILY ST BD/3 TO BD/2 37M 11 2021 $5,729.64 552880733 2.00608E+13 Tocumwal Gravity Mains Gravity Main EMILY ST BD/DE TO BD/1 22M 11 2021 $3,804.72 552880975 2.00412E+13 Tocumwal Gravity Mains Gravity Main FINLEY ST BN/2 TO BN/1 76M 11 2021 $8,227.92 552880761 2.00412E+13 Tocumwal Gravity Mains Gravity Main FINLEY ST BP/DE TO BN /1 40M 11 2021 $4,216.47 552880696 2.00412E+13 Tocumwal Gravity Mains Gravity Main FINLEY ST BQ/DE TO BQ/3 28M 11 2021 $3,063.55 552880813 2.00501E+13 Tocumwal Gravity Mains Gravity Main HENNESSY ST AB/1 TO V/6 48M 11 2021 $5,243.68 552880630 2.00412E+13 Tocumwal Gravity Mains Gravity Main HILL ST BY/DE TO BY/1 18M 11 2021 $1,989.15 552880925 2.00501E+13 Tocumwal Gravity Mains Gravity Main JERIL ST NTH W/3 TO W/2 64M 11 2021 $9,951.65 552880908 2.00412E+13 Tocumwal Gravity Mains Gravity Main JERILDER ST NTH CG/8 TO CG/7 61M 11 2021 $12,469.43 552880713 2.00501E+13 Tocumwal Gravity Mains Gravity Main JERILDERIE ST AC/5 TO AC/4 31M 11 2021 $7,846.62 552880869 2.00501E+13 Tocumwal Gravity Mains Gravity Main JERILDERIE ST W/4 TO W/3 57M 11 2021 $6,201.60 552880812 2.00501E+13 Tocumwal Gravity Mains Gravity Main JERILDERIE ST AC/4 TO AC/3 48M 11 2021 $12,259.32 552880721 2.00501E+13 Tocumwal Gravity Mains Gravity Main JERILDERIE ST AC/6 TO AC/5 33M 11 2021 $6,670.84 552881031 2.00501E+13 Tocumwal Gravity Mains Gravity Main JERILDERIE ST AC/7 TO AC/6 82M 11 2021 $16,634.90 552880699 2.00501E+13 Tocumwal Gravity Mains Gravity Main JERILDERIE ST AD/1 TO AC/3 29M 11 2021 $3,156.16 552880683 2.00501E+13 Tocumwal Gravity Mains Gravity Main JERILDERIE ST AF/DE TO AC/5 27M 11 2021 $2,922.44 552881030 2.00501E+13 Tocumwal Gravity Mains Gravity Main JERILDERIE ST AG/1 TO AC/7 82M 11 2021 $12,749.33 552880710 2.00501E+13 Tocumwal Gravity Mains Gravity Main JERILDERIE ST X/1 TO W/4 30M 11 2021 $3,291.29 552880921 2.00412E+13 Tocumwal Gravity Mains Gravity Main JERSEY ST B/1 TO A/2 63M 11 2021 $9,800.39 552880970 2.00501E+13 Tocumwal Gravity Mains Gravity Main KELLY ST AC/1 TO PS/MH 74M 11 2021 $18,799.62 552880950 2.00501E+13 Tocumwal Gravity Mains Gravity Main KELLY ST AC/2 TO AC/1 70M 11 2021 $17,767.79 552880984 2.00501E+13 Tocumwal Gravity Mains Gravity Main KELLY ST AC/3 TO AC/2 78M 11 2021 $19,811.90 552880726 2.00501E+13 Tocumwal Gravity Mains Gravity Main KELLY ST AK/1 TO PS/MH 34M 11 2021 $6,723.93 552880745 2.00501E+13 Tocumwal Gravity Mains Gravity Main KELLY ST AK/2 TO AK/1 40M 11 2021 $7,299.54 552880795 2.00501E+13 Tocumwal Gravity Mains Gravity Main KELLY ST AK/3 TO AK/2 46M 11 2021 $9,092.93 552880957 2.00501E+13 Tocumwal Gravity Mains Gravity Main KELLY ST AK/4 TO AK/3 71M 11 2021 $14,056.10 552880952 2.00501E+13 Tocumwal Gravity Mains Gravity Main KELLY ST AK/5 TO AK/4 70M 11 2021 $10,870.01 552880684 2.00501E+13 Tocumwal Gravity Mains Gravity Main KELLY ST AQ/DE TO AK/2 27M 11 2021 $2,922.57 552880731 2.00501E+13 Tocumwal Gravity Mains Gravity Main KELLY ST DE TO AK/3 35M 11 2021 $3,767.31 55
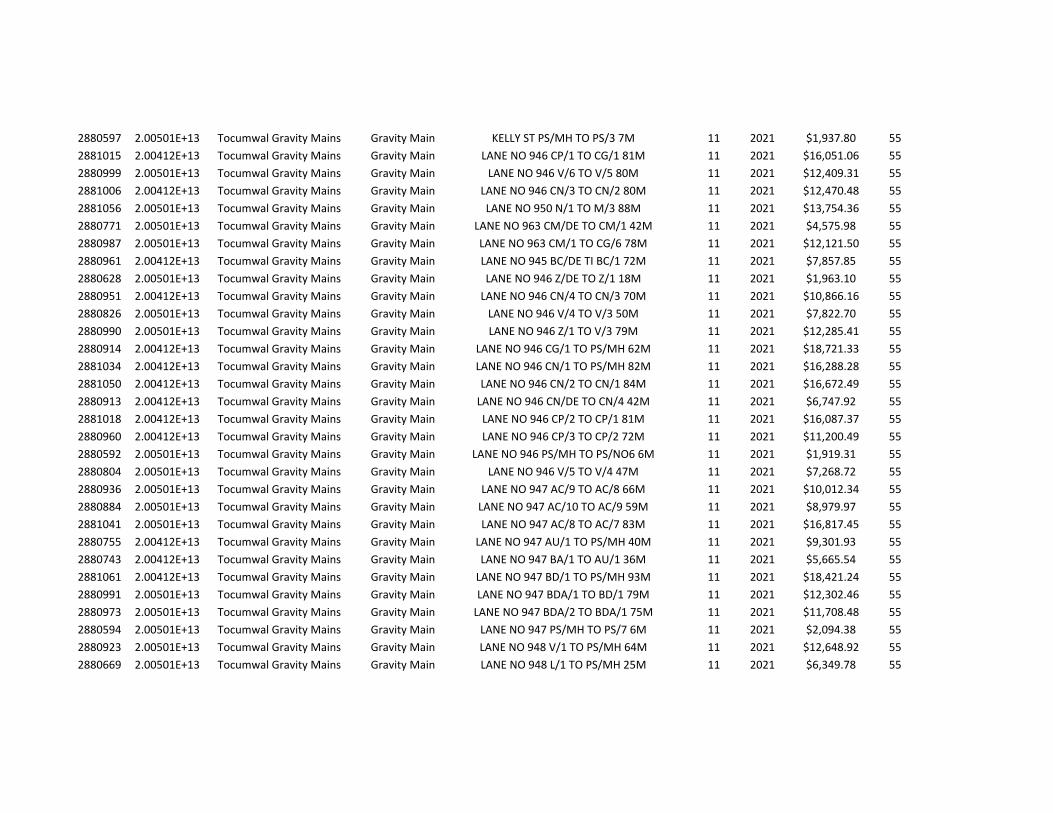
2880597 2.00501E+13 Tocumwal Gravity Mains Gravity Main KELLY ST PS/MH TO PS/3 7M 11 2021 $1,937.80 552881015 2.00412E+13 Tocumwal Gravity Mains Gravity Main LANE NO 946 CP/1 TO CG/1 81M 11 2021 $16,051.06 552880999 2.00501E+13 Tocumwal Gravity Mains Gravity Main LANE NO 946 V/6 TO V/5 80M 11 2021 $12,409.31 552881006 2.00412E+13 Tocumwal Gravity Mains Gravity Main LANE NO 946 CN/3 TO CN/2 80M 11 2021 $12,470.48 552881056 2.00501E+13 Tocumwal Gravity Mains Gravity Main LANE NO 950 N/1 TO M/3 88M 11 2021 $13,754.36 552880771 2.00501E+13 Tocumwal Gravity Mains Gravity Main LANE NO 963 CM/DE TO CM/1 42M 11 2021 $4,575.98 552880987 2.00501E+13 Tocumwal Gravity Mains Gravity Main LANE NO 963 CM/1 TO CG/6 78M 11 2021 $12,121.50 552880961 2.00412E+13 Tocumwal Gravity Mains Gravity Main LANE NO 945 BC/DE TI BC/1 72M 11 2021 $7,857.85 552880628 2.00501E+13 Tocumwal Gravity Mains Gravity Main LANE NO 946 Z/DE TO Z/1 18M 11 2021 $1,963.10 552880951 2.00412E+13 Tocumwal Gravity Mains Gravity Main LANE NO 946 CN/4 TO CN/3 70M 11 2021 $10,866.16 552880826 2.00501E+13 Tocumwal Gravity Mains Gravity Main LANE NO 946 V/4 TO V/3 50M 11 2021 $7,822.70 552880990 2.00501E+13 Tocumwal Gravity Mains Gravity Main LANE NO 946 Z/1 TO V/3 79M 11 2021 $12,285.41 552880914 2.00412E+13 Tocumwal Gravity Mains Gravity Main LANE NO 946 CG/1 TO PS/MH 62M 11 2021 $18,721.33 552881034 2.00412E+13 Tocumwal Gravity Mains Gravity Main LANE NO 946 CN/1 TO PS/MH 82M 11 2021 $16,288.28 552881050 2.00412E+13 Tocumwal Gravity Mains Gravity Main LANE NO 946 CN/2 TO CN/1 84M 11 2021 $16,672.49 552880913 2.00412E+13 Tocumwal Gravity Mains Gravity Main LANE NO 946 CN/DE TO CN/4 42M 11 2021 $6,747.92 552881018 2.00412E+13 Tocumwal Gravity Mains Gravity Main LANE NO 946 CP/2 TO CP/1 81M 11 2021 $16,087.37 552880960 2.00412E+13 Tocumwal Gravity Mains Gravity Main LANE NO 946 CP/3 TO CP/2 72M 11 2021 $11,200.49 552880592 2.00501E+13 Tocumwal Gravity Mains Gravity Main LANE NO 946 PS/MH TO PS/NO6 6M 11 2021 $1,919.31 552880804 2.00501E+13 Tocumwal Gravity Mains Gravity Main LANE NO 946 V/5 TO V/4 47M 11 2021 $7,268.72 552880936 2.00501E+13 Tocumwal Gravity Mains Gravity Main LANE NO 947 AC/9 TO AC/8 66M 11 2021 $10,012.34 552880884 2.00501E+13 Tocumwal Gravity Mains Gravity Main LANE NO 947 AC/10 TO AC/9 59M 11 2021 $8,979.97 552881041 2.00501E+13 Tocumwal Gravity Mains Gravity Main LANE NO 947 AC/8 TO AC/7 83M 11 2021 $16,817.45 552880755 2.00412E+13 Tocumwal Gravity Mains Gravity Main LANE NO 947 AU/1 TO PS/MH 40M 11 2021 $9,301.93 552880743 2.00412E+13 Tocumwal Gravity Mains Gravity Main LANE NO 947 BA/1 TO AU/1 36M 11 2021 $5,665.54 552881061 2.00412E+13 Tocumwal Gravity Mains Gravity Main LANE NO 947 BD/1 TO PS/MH 93M 11 2021 $18,421.24 552880991 2.00501E+13 Tocumwal Gravity Mains Gravity Main LANE NO 947 BDA/1 TO BD/1 79M 11 2021 $12,302.46 552880973 2.00501E+13 Tocumwal Gravity Mains Gravity Main LANE NO 947 BDA/2 TO BDA/1 75M 11 2021 $11,708.48 552880594 2.00501E+13 Tocumwal Gravity Mains Gravity Main LANE NO 947 PS/MH TO PS/7 6M 11 2021 $2,094.38 552880923 2.00501E+13 Tocumwal Gravity Mains Gravity Main LANE NO 948 V/1 TO PS/MH 64M 11 2021 $12,648.92 552880669 2.00501E+13 Tocumwal Gravity Mains Gravity Main LANE NO 948 L/1 TO PS/MH 25M 11 2021 $6,349.78 55
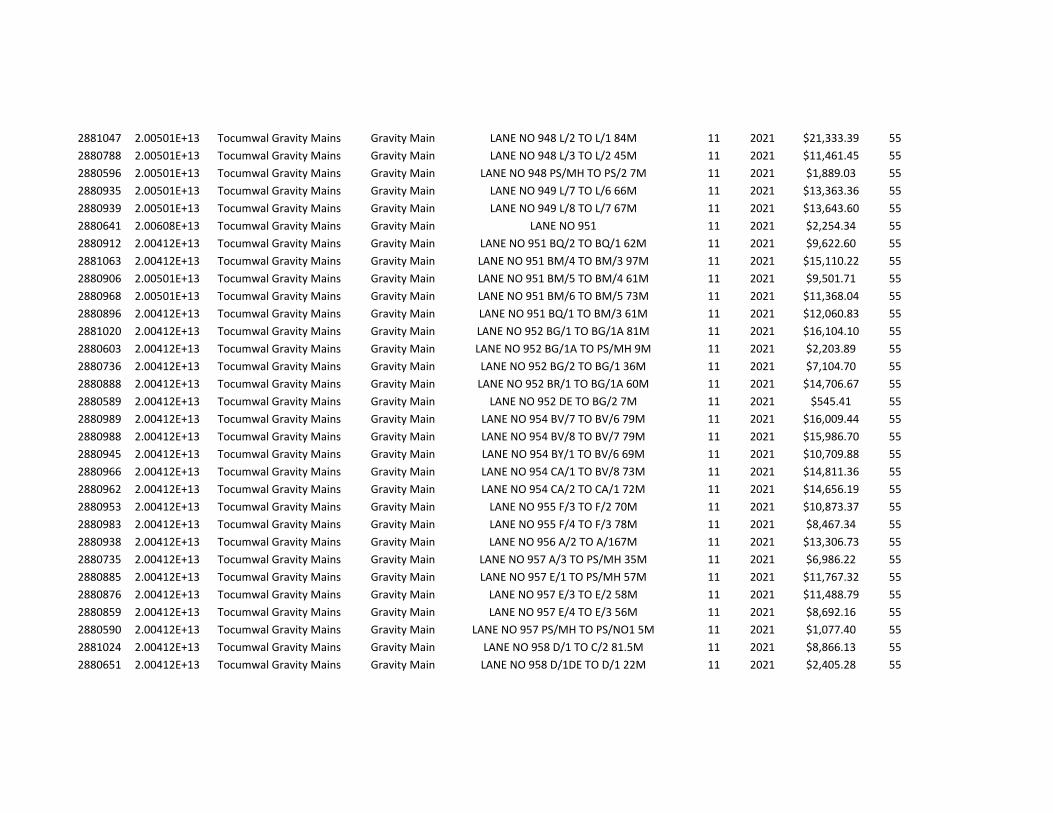
2881047 2.00501E+13 Tocumwal Gravity Mains Gravity Main LANE NO 948 L/2 TO L/1 84M 11 2021 $21,333.39 552880788 2.00501E+13 Tocumwal Gravity Mains Gravity Main LANE NO 948 L/3 TO L/2 45M 11 2021 $11,461.45 552880596 2.00501E+13 Tocumwal Gravity Mains Gravity Main LANE NO 948 PS/MH TO PS/2 7M 11 2021 $1,889.03 552880935 2.00501E+13 Tocumwal Gravity Mains Gravity Main LANE NO 949 L/7 TO L/6 66M 11 2021 $13,363.36 552880939 2.00501E+13 Tocumwal Gravity Mains Gravity Main LANE NO 949 L/8 TO L/7 67M 11 2021 $13,643.60 552880641 2.00608E+13 Tocumwal Gravity Mains Gravity Main LANE NO 951 11 2021 $2,254.34 552880912 2.00412E+13 Tocumwal Gravity Mains Gravity Main LANE NO 951 BQ/2 TO BQ/1 62M 11 2021 $9,622.60 552881063 2.00412E+13 Tocumwal Gravity Mains Gravity Main LANE NO 951 BM/4 TO BM/3 97M 11 2021 $15,110.22 552880906 2.00501E+13 Tocumwal Gravity Mains Gravity Main LANE NO 951 BM/5 TO BM/4 61M 11 2021 $9,501.71 552880968 2.00501E+13 Tocumwal Gravity Mains Gravity Main LANE NO 951 BM/6 TO BM/5 73M 11 2021 $11,368.04 552880896 2.00412E+13 Tocumwal Gravity Mains Gravity Main LANE NO 951 BQ/1 TO BM/3 61M 11 2021 $12,060.83 552881020 2.00412E+13 Tocumwal Gravity Mains Gravity Main LANE NO 952 BG/1 TO BG/1A 81M 11 2021 $16,104.10 552880603 2.00412E+13 Tocumwal Gravity Mains Gravity Main LANE NO 952 BG/1A TO PS/MH 9M 11 2021 $2,203.89 552880736 2.00412E+13 Tocumwal Gravity Mains Gravity Main LANE NO 952 BG/2 TO BG/1 36M 11 2021 $7,104.70 552880888 2.00412E+13 Tocumwal Gravity Mains Gravity Main LANE NO 952 BR/1 TO BG/1A 60M 11 2021 $14,706.67 552880589 2.00412E+13 Tocumwal Gravity Mains Gravity Main LANE NO 952 DE TO BG/2 7M 11 2021 $545.41 552880989 2.00412E+13 Tocumwal Gravity Mains Gravity Main LANE NO 954 BV/7 TO BV/6 79M 11 2021 $16,009.44 552880988 2.00412E+13 Tocumwal Gravity Mains Gravity Main LANE NO 954 BV/8 TO BV/7 79M 11 2021 $15,986.70 552880945 2.00412E+13 Tocumwal Gravity Mains Gravity Main LANE NO 954 BY/1 TO BV/6 69M 11 2021 $10,709.88 552880966 2.00412E+13 Tocumwal Gravity Mains Gravity Main LANE NO 954 CA/1 TO BV/8 73M 11 2021 $14,811.36 552880962 2.00412E+13 Tocumwal Gravity Mains Gravity Main LANE NO 954 CA/2 TO CA/1 72M 11 2021 $14,656.19 552880953 2.00412E+13 Tocumwal Gravity Mains Gravity Main LANE NO 955 F/3 TO F/2 70M 11 2021 $10,873.37 552880983 2.00412E+13 Tocumwal Gravity Mains Gravity Main LANE NO 955 F/4 TO F/3 78M 11 2021 $8,467.34 552880938 2.00412E+13 Tocumwal Gravity Mains Gravity Main LANE NO 956 A/2 TO A/167M 11 2021 $13,306.73 552880735 2.00412E+13 Tocumwal Gravity Mains Gravity Main LANE NO 957 A/3 TO PS/MH 35M 11 2021 $6,986.22 552880885 2.00412E+13 Tocumwal Gravity Mains Gravity Main LANE NO 957 E/1 TO PS/MH 57M 11 2021 $11,767.32 552880876 2.00412E+13 Tocumwal Gravity Mains Gravity Main LANE NO 957 E/3 TO E/2 58M 11 2021 $11,488.79 552880859 2.00412E+13 Tocumwal Gravity Mains Gravity Main LANE NO 957 E/4 TO E/3 56M 11 2021 $8,692.16 552880590 2.00412E+13 Tocumwal Gravity Mains Gravity Main LANE NO 957 PS/MH TO PS/NO1 5M 11 2021 $1,077.40 552881024 2.00412E+13 Tocumwal Gravity Mains Gravity Main LANE NO 958 D/1 TO C/2 81.5M 11 2021 $8,866.13 552880651 2.00412E+13 Tocumwal Gravity Mains Gravity Main LANE NO 958 D/1DE TO D/1 22M 11 2021 $2,405.28 55

2880893 2.00412E+13 Tocumwal Gravity Mains Gravity Main LANE NO 959 BR/3 TO BR/2 60M 11 2021 $9,362.87 552880892 2.00412E+13 Tocumwal Gravity Mains Gravity Main LANE NO 959 BR/4 TO BR/3 60M 11 2021 $9,358.59 552880979 2.00412E+13 Tocumwal Gravity Mains Gravity Main LANE NO 959 BS/1 TO BR/2 76M 11 2021 $11,790.36 552880609 2.00412E+13 Tocumwal Gravity Mains Gravity Main LANE NO 959 BS/DE TO BS/1 11M 11 2021 $1,229.86 552881053 2.00412E+13 Tocumwal Gravity Mains Gravity Main LANE NO 960 AV/3 TO AV/2 86M 11 2021 $13,381.35 552880926 2.00501E+13 Tocumwal Gravity Mains Gravity Main LANE NO 960 AV/4 TO AV/3 64M 11 2021 $9,953.16 552880900 2.00501E+13 Tocumwal Gravity Mains Gravity Main LANE NO 960 AV/5 TO AV/4 61M 11 2021 $9,468.01 552880898 2.00501E+13 Tocumwal Gravity Mains Gravity Main LANE NO 960 AV/6 TO AV/5 61M 11 2021 $6,629.62 552880675 2.00501E+13 Tocumwal Gravity Mains Gravity Main LANE NO 960 AV/DE TO AV/6 26M 11 2021 $2,822.36 552880855 2.00412E+13 Tocumwal Gravity Mains Gravity Main LANE NO 960 AW/1 TO AV/2 55M 11 2021 $8,583.13 552880929 2.00412E+13 Tocumwal Gravity Mains Gravity Main LANE NO 960 AW/2 TO AW/1 64M 11 2021 $9,967.50 552880834 2.00412E+13 Tocumwal Gravity Mains Gravity Main LANE NO 961 CD/1 TO CC/1 52M 11 2021 $8,097.91 552880940 2.00412E+13 Tocumwal Gravity Mains Gravity Main LANE NO 962 CC/6 TO CC/5 68M 11 2021 $7,399.64 552880924 2.00412E+13 Tocumwal Gravity Mains Gravity Main LANE NO 962 CC/5 TO CC/4 64M 11 2021 $9,950.76 552880927 2.00412E+13 Tocumwal Gravity Mains Gravity Main LANE NO 962 CF/1 TO CC/4 64M 11 2021 $9,956.97 552880967 2.00501E+13 Tocumwal Gravity Mains Gravity Main LANE NO 963 CL/1 TO CG/6 73M 11 2021 $11,367.77 552880722 2.00412E+13 Tocumwal Gravity Mains Gravity Main LANE NO 964 CJ/DE TO CJ/3 33M 11 2021 $3,595.26 552880977 2.00412E+13 Tocumwal Gravity Mains Gravity Main LANE NO 964 CH/2 TO CH/1 76M 11 2021 $11,778.83 552880976 2.00412E+13 Tocumwal Gravity Mains Gravity Main LANE NO 964 CH/3 TO CH/2 76M 11 2021 $11,777.72 552881029 2.00412E+13 Tocumwal Gravity Mains Gravity Main LANE NO 964 CJ/1 TO CG/3 82M 11 2021 $16,242.08 552881027 2.00412E+13 Tocumwal Gravity Mains Gravity Main LANE NO 964 CJ/2 TO CJ/1 82M 11 2021 $16,230.08 552881049 2.00412E+13 Tocumwal Gravity Mains Gravity Main LANE NO 964 CJ/3 TO CJ/2 84M 11 2021 $9,136.85 552881007 2.00412E+13 Tocumwal Gravity Mains Gravity Main LANENO 964 CH/1 TO CG/3 80M 11 2021 $15,914.51 552880725 2.00412E+13 Tocumwal Gravity Mains Gravity Main MOORE ST BR/DE TO BR/4 22M 11 2021 $3,690.02 552880719 2.00412E+13 Tocumwal Gravity Mains Gravity Main MOORE ST BT/DE TO BR/4 32M 11 2021 $3,561.76 552880746 2.00412E+13 Tocumwal Gravity Mains Gravity Main MOORE ST BV/9 TO BV/8 37M 11 2021 $4,009.34 552880727 2.00412E+13 Tocumwal Gravity Mains Gravity Main MOORE ST BZ/DE TO BV/8 34M 11 2021 $3,716.16 552880865 2.00501E+13 Tocumwal Gravity Mains Gravity Main MORRIS ST V/2 TO V/1 56M 11 2021 $11,145.36 552881042 2.00501E+13 Tocumwal Gravity Mains Gravity Main MORRIS ST V/3 TO V/2 83M 11 2021 $16,462.97 552880790 2.00501E+13 Tocumwal Gravity Mains Gravity Main MORRIS ST AC/11 TO AC/10 45M 11 2021 $6,844.33 552880800 2.00501E+13 Tocumwal Gravity Mains Gravity Main MORRIS ST AC/12 TO AC/11 47M 11 2021 $7,088.52 55

2880644 2.00501E+13 Tocumwal Gravity Mains Gravity Main MORRIS ST ACA/DE TO AC/10 21M 11 2021 $2,287.49 552880827 2.00501E+13 Tocumwal Gravity Mains Gravity Main MORRIS ST W/1 TO V/1 51M 11 2021 $10,093.54 552880728 2.00608E+13 Tocumwal Gravity Mains Gravity Main MURRAY ST 11 2021 $3,729.81 552880779 2.00501E+13 Tocumwal Gravity Mains Gravity Main MURRAY ST L/4 TO L/3 43M 11 2021 $11,006.97 552880858 2.00501E+13 Tocumwal Gravity Mains Gravity Main MURRAY ST Q/1A TO L/3 56M 11 2021 $8,687.30 552880679 2.00412E+13 Tocumwal Gravity Mains Gravity Main MURRAY ST BV/5 TO BV/4 27M 11 2021 $5,305.18 552880740 2.00412E+13 Tocumwal Gravity Mains Gravity Main MURRAY ST BX/DE TO BV/4 36M 11 2021 $3,941.10 552880931 2.00501E+13 Tocumwal Gravity Mains Gravity Main MURRAY ST L/5 TO L/4 66M 11 2021 $13,132.49 552880819 2.00412E+13 Tocumwal Gravity Mains Gravity Main PARKES ST CK/1 TO CG/5 50M 11 2021 $7,776.16 552880824 2.00412E+13 Tocumwal Gravity Mains Gravity Main PARKES ST CK/2 TO CK/1 50M 11 2021 $7,804.30 552880758 2.00412E+13 Tocumwal Gravity Mains Gravity Main PARKES ST CK/DE TO CK/2 38M 11 2021 $4,145.66 552880802 2.00608E+13 Tocumwal Gravity Mains Gravity Main PRIVATE LAND 11 2021 $5,089.86 552880689 2.00608E+13 Tocumwal Gravity Mains Gravity Main PRIVATE LAND 11 2021 $3,024.27 552880604 2.00608E+13 Tocumwal Gravity Mains Gravity Main PRIVATE LAND 11 2021 $977.54 552880637 2.00501E+13 Tocumwal Gravity Mains Gravity Main PRIVATE LAND AA/DE TO V/5 20M 11 2021 $2,200.56 552881040 2.00501E+13 Tocumwal Gravity Mains Gravity Main PRIVATE LAND AE/1 TO AC/4 83M 11 2021 $12,876.59 552880941 2.00501E+13 Tocumwal Gravity Mains Gravity Main PRIVATE LAND AL/4 TO AL/3 68M 11 2021 $10,579.89 552880741 2.00502E+13 Tocumwal Gravity Mains Gravity Main PRIVATE LAND BV/2 TO MH/5 36M 11 2021 $9,258.59 552880985 2.00412E+13 Tocumwal Gravity Mains Gravity Main PRIVATE LAND CB/1 TO BV/1A 78M 11 2021 $12,106.08 552880602 2.00501E+13 Tocumwal Gravity Mains Gravity Main PRIVATE LAND DE TO V LINE 9M 11 2021 $955.43 552880852 2.00501E+13 Tocumwal Gravity Mains Gravity Main PRIVATE LAND M/3 TO M/2 55M 11 2021 $8,546.48 552880715 2.00501E+13 Tocumwal Gravity Mains Gravity Main PRIVATE LAND N/DE TO N/1 30M 11 2021 $3,482.03 552880614 2.00501E+13 Tocumwal Gravity Mains Gravity Main PRIVATE LAND R/DE TO Q/2 14M 11 2021 $1,506.36 552880664 2.00501E+13 Tocumwal Gravity Mains Gravity Main PRIVATE LAND T/DE TO L/6 25M 11 2021 $2,681.22 552880871 2.00501E+13 Tocumwal Gravity Mains Gravity Main PRIVATE LAND V/7 TO V/6 57M 11 2021 $6,214.52 552880691 2.00501E+13 Tocumwal Gravity Mains Gravity Main PRIVATE LAND W/DE TO W/5 28M 11 2021 $3,036.39 552880674 2.00501E+13 Tocumwal Gravity Mains Gravity Main PRIVATE LAND Y/DE TO W/5 26M 11 2021 $2,811.98 552880982 2.00412E+13 Tocumwal Gravity Mains Gravity Main PRIVATE LAND A/3 TO A/2 73M 11 2021 $11,967.90 552880980 2.00412E+13 Tocumwal Gravity Mains Gravity Main PRIVATE LAND A/4 TO A/3 73M 11 2021 $11,820.45 552880815 2.00412E+13 Tocumwal Gravity Mains Gravity Main PRIVATE LAND A/5 TO A/4 52.3M 11 2021 $5,312.61 552880862 2.00501E+13 Tocumwal Gravity Mains Gravity Main PRIVATE LAND AB/2 TO AB/1 56M 11 2021 $6,097.32 55

2881028 2.00501E+13 Tocumwal Gravity Mains Gravity Main PRIVATE LAND AH/1 TO PS3/MH 11 2021 $12,730.35 552880947 2.00501E+13 Tocumwal Gravity Mains Gravity Main PRIVATE LAND AH/2 TO AH/1 70M 11 2021 $10,733.28 552880971 2.00501E+13 Tocumwal Gravity Mains Gravity Main PRIVATE LAND AH/3 TO AH/2 74M 11 2021 $11,492.41 552880958 2.00501E+13 Tocumwal Gravity Mains Gravity Main PRIVATE LAND AJ/1 TO AH/1 71M 11 2021 $11,089.16 552881036 2.00501E+13 Tocumwal Gravity Mains Gravity Main PRIVATE LAND AJ/2 TO AJ/1 82M 11 2021 $12,825.65 552880873 2.00501E+13 Tocumwal Gravity Mains Gravity Main PRIVATE LAND AK/6 TO AK/5 58M 11 2021 $8,953.35 552880994 2.00501E+13 Tocumwal Gravity Mains Gravity Main PRIVATE LAND AK/7 TO AK/6 79M 11 2021 $12,352.28 552880882 2.00501E+13 Tocumwal Gravity Mains Gravity Main PRIVATE LAND AK/8 TO AK/7 60M 11 2021 $6,437.88 552880903 2.00501E+13 Tocumwal Gravity Mains Gravity Main PRIVATE LAND AK/9 TO AK/8 61M 11 2021 $6,634.82 552880693 2.00501E+13 Tocumwal Gravity Mains Gravity Main PRIVATE LAND AK/DE TO AK/9 28M 11 2021 $3,049.64 552880887 2.00501E+13 Tocumwal Gravity Mains Gravity Main PRIVATE LAND AL/5 TO AL/4 60M 11 2021 $6,505.75 552880946 2.00501E+13 Tocumwal Gravity Mains Gravity Main PRIVATE LAND AM/1 TO AL/1 69M 11 2021 $10,711.13 552880964 2.00501E+13 Tocumwal Gravity Mains Gravity Main PRIVATE LAND AM/2 TO AM/1 73M 11 2021 $7,936.56 552880756 2.00501E+13 Tocumwal Gravity Mains Gravity Main PRIVATE LAND ANA/1 TO AN/4 38M 11 2021 $4,128.86 552880631 2.00501E+13 Tocumwal Gravity Mains Gravity Main PRIVATE LAND ANA/DE TO ANA/1 23M 11 2021 $1,993.81 552880880 2.00501E+13 Tocumwal Gravity Mains Gravity Main PRIVATE LAND AT/1 TO AK/9 59M 11 2021 $6,417.62 552880897 2.00501E+13 Tocumwal Gravity Mains Gravity Main PRIVATE LAND AT/2 TO AT/1 61M 11 2021 $6,629.50 552881001 2.00412E+13 Tocumwal Gravity Mains Gravity Main PRIVATE LAND AU/2 TO AU/1 80M 11 2021 $15,831.90 552880868 2.00412E+13 Tocumwal Gravity Mains Gravity Main PRIVATE LAND AV/1 TO PS/MH 57M 11 2021 $11,289.49 552881038 2.00412E+13 Tocumwal Gravity Mains Gravity Main PRIVATE LAND AV/2 TO AV/1 83M 11 2021 $16,414.76 552880838 2.00501E+13 Tocumwal Gravity Mains Gravity Main PRIVATE LAND BD/4 TO BD/3 53M 11 2021 $8,230.89 552880867 2.00501E+13 Tocumwal Gravity Mains Gravity Main PRIVATE LAND BD/5 TO BD/4 57M 11 2021 $6,178.17 552880881 2.00412E+13 Tocumwal Gravity Mains Gravity Main PRIVATE LAND BG/3 TO BG/2 59M 11 2021 $11,695.28 552880904 2.00412E+13 Tocumwal Gravity Mains Gravity Main PRIVATE LAND BG/4 TO BG/3 61M 11 2021 $9,490.19 552880853 2.00412E+13 Tocumwal Gravity Mains Gravity Main PRIVATE LAND BG/5 TO BG/4 55M 11 2021 $8,555.75 552880821 2.00412E+13 Tocumwal Gravity Mains Gravity Main PRIVATE LAND BG/6 TO BG/5 50M 11 2021 $7,782.63 552880861 2.00412E+13 Tocumwal Gravity Mains Gravity Main PRIVATE LAND BG/7 TO BG/6 56M 11 2021 $6,092.00 552880760 2.00412E+13 Tocumwal Gravity Mains Gravity Main PRIVATE LAND BG/DE TO BG/3 38M 11 2021 $4,190.21 552880616 2.00412E+13 Tocumwal Gravity Mains Gravity Main PRIVATE LAND BG/DE TO BG/7 14M 11 2021 $1,530.70 552880833 2.00412E+13 Tocumwal Gravity Mains Gravity Main PRIVATE LAND BH/1 TO BG/1 52M 11 2021 $10,309.76 552881016 2.00412E+13 Tocumwal Gravity Mains Gravity Main PRIVATE LAND BH/2 TO BH/1 81M 11 2021 $16,056.67 55

2880778 2.00412E+13 Tocumwal Gravity Mains Gravity Main PRIVATE LAND BH/4 TO BH/3 45M 11 2021 $6,693.68 552880837 2.00412E+13 Tocumwal Gravity Mains Gravity Main PRIVATE LAND BH/5 TO BH/4 80M 11 2021 $8,172.96 552881013 2.00501E+13 Tocumwal Gravity Mains Gravity Main PRIVATE LAND BH/6 TO BH/5 85M 11 2021 $8,808.52 552880657 2.00412E+13 Tocumwal Gravity Mains Gravity Main PRIVATE LAND BH/DE TO BH/1 23M 11 2021 $2,534.59 552880783 2.00412E+13 Tocumwal Gravity Mains Gravity Main PRIVATE LAND BM/1 TO PS/MH4 44M 11 2021 $10,779.89 552880848 2.00412E+13 Tocumwal Gravity Mains Gravity Main PRIVATE LAND BM/2 TO BM/1 54M 11 2021 $10,755.62 552880954 2.00412E+13 Tocumwal Gravity Mains Gravity Main PRIVATE LAND BM/3 TO BM/2 70M 11 2021 $13,892.52 552880633 2.00501E+13 Tocumwal Gravity Mains Gravity Main PRIVATE LAND BM/DE TO BM/6 19M 11 2021 $2,104.70 552881059 2.00412E+13 Tocumwal Gravity Mains Gravity Main PRIVATE LAND BN/1 TO BM/3 91M 11 2021 $14,190.60 552880934 2.00412E+13 Tocumwal Gravity Mains Gravity Main PRIVATE LAND BQ/3 TO BQ/2 66M 11 2021 $7,170.67 552880724 2.00412E+13 Tocumwal Gravity Mains Gravity Main PRIVATE LAND BQA/DE TO BQ/2 34M 11 2021 $3,673.12 552880920 2.00412E+13 Tocumwal Gravity Mains Gravity Main PRIVATE LAND BR/2 TO BR/1 63M 11 2021 $12,467.94 552880709 2.00412E+13 Tocumwal Gravity Mains Gravity Main PRIVATE LAND BSA/DE TO BS/1 30M 11 2021 $3,270.32 552880901 2.00412E+13 Tocumwal Gravity Mains Gravity Main PRIVATE LAND BU/1 TO BG/1A 11 2021 $12,076.77 552880902 2.00412E+13 Tocumwal Gravity Mains Gravity Main PRIVATE LAND BU/2 TO BU/1 61M 11 2021 $12,078.15 552881052 2.00412E+13 Tocumwal Gravity Mains Gravity Main PRIVATE LAND BV/1 TO BV/1A 86M 11 2021 $21,910.92 552880932 2.00412E+13 Tocumwal Gravity Mains Gravity Main PRIVATE LAND BV/4 TO BV/3 65M 11 2021 $13,221.26 552880781 2.00412E+13 Tocumwal Gravity Mains Gravity Main PRIVATE LAND BV/6 TO BV/5 44M 11 2021 $8,846.70 552881023 2.00412E+13 Tocumwal Gravity Mains Gravity Main PRIVATE LAND C/1 TO A/1 82M 11 2021 $16,141.35 552880842 2.00412E+13 Tocumwal Gravity Mains Gravity Main PRIVATE LAND C/2 TO C/1 54M 11 2021 $8,386.91 552881044 2.00412E+13 Tocumwal Gravity Mains Gravity Main PRIVATE LAND C/3 TO C/2 83M 11 2021 $9,058.14 552880647 2.00412E+13 Tocumwal Gravity Mains Gravity Main PRIVATE LAND CA/DE TO CA/2 22M 11 2021 $2,382.08 552881054 2.00412E+13 Tocumwal Gravity Mains Gravity Main PRIVATE LAND CC/1 TO BV/4 87M 11 2021 $17,243.26 552880851 2.00412E+13 Tocumwal Gravity Mains Gravity Main PRIVATE LAND CC/2 TO CC/1 60M 11 2021 $10,876.74 552880846 2.00412E+13 Tocumwal Gravity Mains Gravity Main PRIVATE LAND CC/4 TO CC/3 54M 11 2021 $8,418.45 552880694 2.00412E+13 Tocumwal Gravity Mains Gravity Main PRIVATE LAND CG/5 TO CG/4 25M 11 2021 $7,157.68 552881033 2.00412E+13 Tocumwal Gravity Mains Gravity Main PRIVATE LAND CG/6 TO CG/5 82M 11 2021 $16,649.54 552880849 2.00412E+13 Tocumwal Gravity Mains Gravity Main PRIVATE LAND CG/7 TO CG/6 54M 11 2021 $11,046.63 552880805 2.00412E+13 Tocumwal Gravity Mains Gravity Main PRIVATE LAND CGA/1 CG/8 47M 11 2021 $7,319.12 552880720 2.00412E+13 Tocumwal Gravity Mains Gravity Main PRIVATE LAND CP/DE TO CP/3 32M 11 2021 $5,090.52 552880645 2.00412E+13 Tocumwal Gravity Mains Gravity Main PRIVATE LAND DE TO C/3 11 2021 $2,309.74 55

2880703 2.00501E+13 Tocumwal Gravity Mains Gravity Main PRIVATE LAND DE TO N/1 30M 11 2021 $3,258.00 552880860 2.00412E+13 Tocumwal Gravity Mains Gravity Main PRIVATE LAND E/5 TO E/4 56M 11 2021 $8,694.36 552880661 2.00412E+13 Tocumwal Gravity Mains Gravity Main PRIVATE LAND E/5DE TO E/5 24M 11 2021 $2,593.01 552880793 2.00412E+13 Tocumwal Gravity Mains Gravity Main PRIVATE LAND F/5 TO F/4 45M 11 2021 $4,945.56 552880770 2.00412E+13 Tocumwal Gravity Mains Gravity Main PRIVATE LAND L/12 TO L/11 42M 11 2021 $6,360.63 552880744 2.00501E+13 Tocumwal Gravity Mains Gravity Main PRIVATE LAND L/6 TO L/5 36M 11 2021 $7,399.61 552880864 2.00501E+13 Tocumwal Gravity Mains Gravity Main PRIVATE LAND M/1 TO L/1 56M 11 2021 $8,718.57 552880606 2.00502E+13 Tocumwal Gravity Mains Gravity Main PRIVATE LAND MH/7 TO BV/2 11M 11 2021 $1,862.99 552880922 2.00502E+13 Tocumwal Gravity Mains Gravity Main PRIVATE LAND MH/9 TO BV/3 63M 11 2021 $9,839.82 552880585 2.00412E+13 Tocumwal Gravity Mains Gravity Main PRIVATE LAND PS/MH TO PS/4 3M 11 2021 $739.16 552880748 2.00501E+13 Tocumwal Gravity Mains Gravity Main PRIVATE LAND Q/2 TO Q/1 37M 11 2021 $5,747.30 552880704 2.00501E+13 Tocumwal Gravity Mains Gravity Main PRIVATE LAND Q/3 TO Q/2 30M 11 2021 $4,651.17 552880847 2.00501E+13 Tocumwal Gravity Mains Gravity Main PRIVATE LAND W/2 TO W/1 54M 11 2021 $8,430.77 552880759 2.00501E+13 Tocumwal Gravity Mains Gravity Main PRIVATE LAND W/5 TO W/4 38M 11 2021 $4,157.57 552880723 2.00501E+13 Tocumwal Gravity Mains Gravity Main SHORT ST AH/DE TO AH/3 33M 11 2021 $3,595.27 552880870 2.00501E+13 Tocumwal Gravity Mains Gravity Main SHORT ST AL/1 TO AK/1 57M 11 2021 $8,870.88 552880956 2.00501E+13 Tocumwal Gravity Mains Gravity Main SHORT ST AL/2 TO AL/1 70M 11 2021 $10,920.64 552880822 2.00501E+13 Tocumwal Gravity Mains Gravity Main SHORT ST AL/3 TO AL/2 50M 11 2021 $9,930.64 552880671 2.00501E+13 Tocumwal Gravity Mains Gravity Main SHORT ST AN/1 TO AL/3 25M 11 2021 $3,883.61 552880754 2.00501E+13 Tocumwal Gravity Mains Gravity Main SHORT ST AN/2 TO AN/1 38M 11 2021 $5,879.59 552880911 2.00501E+13 Tocumwal Gravity Mains Gravity Main SHORT ST AN/3 TO AN/2 62M 11 2021 $9,622.04 552880708 2.00501E+13 Tocumwal Gravity Mains Gravity Main SHORT ST AP/DE TO AL/3 30M 11 2021 $3,266.66 552881010 2.00501E+13 Tocumwal Gravity Mains Gravity Main TUPPAL ST AG/2 TO AG/1 81M 11 2021 $8,790.19 552880948 2.00501E+13 Tocumwal Gravity Mains Gravity Main TUPPAL ST AN/4 TO AN/3 64M 11 2021 $10,744.33 552880636 2.00501E+13 Tocumwal Gravity Mains Gravity Main TUPPAL ST AN/DE TO AN/4 25M 11 2021 $2,172.18 552880797 2.00501E+13 Tocumwal Gravity Mains Gravity Main TUPPAL ST AO/1 TO AN/3 46M 11 2021 $5,012.69 552880816 2.00412E+13 Tocumwal Gravity Mains Gravity Main TUPPAL ST AU/3 TO AU/2 49M 11 2021 $9,699.32 552880866 2.00412E+13 Tocumwal Gravity Mains Gravity Main TUPPAL ST AU/4 TO AU/3 56M 11 2021 $8,781.30 552881002 2.00412E+13 Tocumwal Gravity Mains Gravity Main TUPPAL ST AU/5 TO AU/4 80M 11 2021 $12,423.92 552880777 2.00412E+13 Tocumwal Gravity Mains Gravity Main TUPPAL ST BB/1 TO AU/2 43M 11 2021 $4,683.59 552880803 2.00412E+13 Tocumwal Gravity Mains Gravity Main TUPPAL ST BF/1 TO BD/2 47M 11 2021 $5,090.25 55
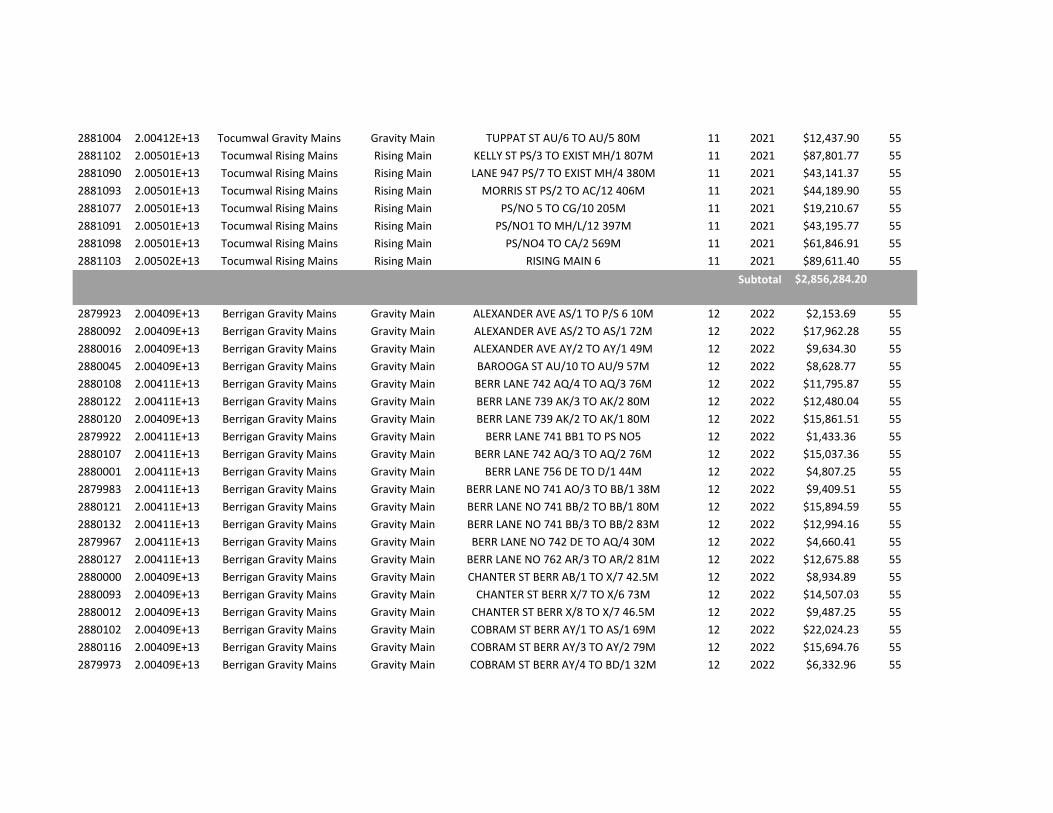
2881004 2.00412E+13 Tocumwal Gravity Mains Gravity Main TUPPAT ST AU/6 TO AU/5 80M 11 2021 $12,437.90 552881102 2.00501E+13 Tocumwal Rising Mains Rising Main KELLY ST PS/3 TO EXIST MH/1 807M 11 2021 $87,801.77 552881090 2.00501E+13 Tocumwal Rising Mains Rising Main LANE 947 PS/7 TO EXIST MH/4 380M 11 2021 $43,141.37 552881093 2.00501E+13 Tocumwal Rising Mains Rising Main MORRIS ST PS/2 TO AC/12 406M 11 2021 $44,189.90 552881077 2.00501E+13 Tocumwal Rising Mains Rising Main PS/NO 5 TO CG/10 205M 11 2021 $19,210.67 552881091 2.00501E+13 Tocumwal Rising Mains Rising Main PS/NO1 TO MH/L/12 397M 11 2021 $43,195.77 552881098 2.00501E+13 Tocumwal Rising Mains Rising Main PS/NO4 TO CA/2 569M 11 2021 $61,846.91 552881103 2.00502E+13 Tocumwal Rising Mains Rising Main RISING MAIN 6 11 2021 $89,611.40 55
$2,856,284.20
2879923 2.00409E+13 Berrigan Gravity Mains Gravity Main ALEXANDER AVE AS/1 TO P/S 6 10M 12 2022 $2,153.69 552880092 2.00409E+13 Berrigan Gravity Mains Gravity Main ALEXANDER AVE AS/2 TO AS/1 72M 12 2022 $17,962.28 552880016 2.00409E+13 Berrigan Gravity Mains Gravity Main ALEXANDER AVE AY/2 TO AY/1 49M 12 2022 $9,634.30 552880045 2.00409E+13 Berrigan Gravity Mains Gravity Main BAROOGA ST AU/10 TO AU/9 57M 12 2022 $8,628.77 552880108 2.00411E+13 Berrigan Gravity Mains Gravity Main BERR LANE 742 AQ/4 TO AQ/3 76M 12 2022 $11,795.87 552880122 2.00411E+13 Berrigan Gravity Mains Gravity Main BERR LANE 739 AK/3 TO AK/2 80M 12 2022 $12,480.04 552880120 2.00409E+13 Berrigan Gravity Mains Gravity Main BERR LANE 739 AK/2 TO AK/1 80M 12 2022 $15,861.51 552879922 2.00411E+13 Berrigan Gravity Mains Gravity Main BERR LANE 741 BB1 TO PS NO5 12 2022 $1,433.36 552880107 2.00411E+13 Berrigan Gravity Mains Gravity Main BERR LANE 742 AQ/3 TO AQ/2 76M 12 2022 $15,037.36 552880001 2.00411E+13 Berrigan Gravity Mains Gravity Main BERR LANE 756 DE TO D/1 44M 12 2022 $4,807.25 552879983 2.00411E+13 Berrigan Gravity Mains Gravity Main BERR LANE NO 741 AO/3 TO BB/1 38M 12 2022 $9,409.51 552880121 2.00411E+13 Berrigan Gravity Mains Gravity Main BERR LANE NO 741 BB/2 TO BB/1 80M 12 2022 $15,894.59 552880132 2.00411E+13 Berrigan Gravity Mains Gravity Main BERR LANE NO 741 BB/3 TO BB/2 83M 12 2022 $12,994.16 552879967 2.00411E+13 Berrigan Gravity Mains Gravity Main BERR LANE NO 742 DE TO AQ/4 30M 12 2022 $4,660.41 552880127 2.00411E+13 Berrigan Gravity Mains Gravity Main BERR LANE NO 762 AR/3 TO AR/2 81M 12 2022 $12,675.88 552880000 2.00409E+13 Berrigan Gravity Mains Gravity Main CHANTER ST BERR AB/1 TO X/7 42.5M 12 2022 $8,934.89 552880093 2.00409E+13 Berrigan Gravity Mains Gravity Main CHANTER ST BERR X/7 TO X/6 73M 12 2022 $14,507.03 552880012 2.00409E+13 Berrigan Gravity Mains Gravity Main CHANTER ST BERR X/8 TO X/7 46.5M 12 2022 $9,487.25 552880102 2.00409E+13 Berrigan Gravity Mains Gravity Main COBRAM ST BERR AY/1 TO AS/1 69M 12 2022 $22,024.23 552880116 2.00409E+13 Berrigan Gravity Mains Gravity Main COBRAM ST BERR AY/3 TO AY/2 79M 12 2022 $15,694.76 552879973 2.00409E+13 Berrigan Gravity Mains Gravity Main COBRAM ST BERR AY/4 TO BD/1 32M 12 2022 $6,332.96 55
Subtotal

2880112 2.00409E+13 Berrigan Gravity Mains Gravity Main COBRAM ST BERR AY/5 TO AY/4 74M 12 2022 $15,344.25 552880097 2.00409E+13 Berrigan Gravity Mains Gravity Main COBRAM ST BERR AY/6 TO AY/5 72M 12 2022 $7,879.19 552879997 2.00409E+13 Berrigan Gravity Mains Gravity Main COBRAM ST BERR AZ/1 TO AY/1 47M 12 2022 $11,140.19 552880061 2.00409E+13 Berrigan Gravity Mains Gravity Main COBRAM ST BERR AZ/2 TOAZ/1 63M 12 2022 $12,696.23 552880053 2.00409E+13 Berrigan Gravity Mains Gravity Main COBRAM ST BERR AZ/3 TO AZ/2 60M 12 2022 $12,326.47 552880017 2.00409E+13 Berrigan Gravity Mains Gravity Main COBRAM ST BERR BA/1 TO AZ/2 48M 12 2022 $7,555.97 552879992 2.00409E+13 Berrigan Gravity Mains Gravity Main COBRAM ST BERR BD/1 TO AY/3 V42M 12 2022 $8,352.33 552879950 2.00409E+13 Berrigan Gravity Mains Gravity Main COBRAM ST BERR DE TO AY/6 24M 12 2022 $2,720.55 552879949 2.00409E+13 Berrigan Gravity Mains Gravity Main COBRAM ST BERR DE TO AZ/3 25M 12 2022 $2,707.99 552879980 2.00409E+13 Berrigan Gravity Mains Gravity Main COBRAM ST BERR DE TO BA/1 36M 12 2022 $3,921.05 552880095 2.00411E+13 Berrigan Gravity Mains Gravity Main COBRAM ST BERR DE TO BD /2 72M 12 2022 $7,857.09 552880128 2.00411E+13 Berrigan Gravity Mains Gravity Main CREED ST BERR AR/1 TO AQ/2 82M 12 2022 $16,362.86 552880040 2.00411E+13 Berrigan Gravity Mains Gravity Main CREED ST BERR AR/2 TO AR/1 56M 12 2022 $8,615.39 552880126 2.00607E+13 Berrigan Gravity Mains Gravity Main DAVIS ST AH/1 TO AS/7 68M 12 2022 $12,659.29 552880009 2.00409E+13 Berrigan Gravity Mains Gravity Main DAVIS ST AH/2 TO AH/1 48M 12 2022 $4,988.90 552880069 2.00409E+13 Berrigan Gravity Mains Gravity Main DAVIS ST AS/3 TO AS/2 64M 12 2022 $16,289.82 552880066 2.00411E+13 Berrigan Gravity Mains Gravity Main DENISON ST BERR AQ/2 TO AQ/1 63M 12 2022 $12,506.43 552879945 2.00409E+13 Berrigan Gravity Mains Gravity Main DRUMMOND SR BERR Q/3 TO Q/2 23M 12 2022 $2,551.56 552880085 2.00409E+13 Berrigan Gravity Mains Gravity Main DRUMMOND ST AC/3 TO AC/2 70M 12 2022 $13,740.60 552880096 2.00409E+13 Berrigan Gravity Mains Gravity Main DRUMMOND ST AC/4 TO AC/3 73M 12 2022 $11,235.14 552879952 2.00409E+13 Berrigan Gravity Mains Gravity Main DRUMMOND ST DE TO AC/3 25M 12 2022 $2,749.18 552879934 2.00607E+13 Berrigan Gravity Mains Gravity Main GREGGERYS RD 12 2022 $2,880.15 552879953 2.00409E+13 Berrigan Gravity Mains Gravity Main GREGGERYS RD F/4 TO F/3 25.4M 12 2022 $5,023.56 552880063 2.00409E+13 Berrigan Gravity Mains Gravity Main GREGGERYS RD K/1 TO F/4 63M 12 2022 $12,467.37 552880024 2.00409E+13 Berrigan Gravity Mains Gravity Main GREGGERYS RD K/2 TO K/1 50M 12 2022 $7,801.37 552880023 2.00409E+13 Berrigan Gravity Mains Gravity Main GREGGERYS RD K/3 TO K/2 50M 12 2022 $7,777.32 552879940 2.00409E+13 Berrigan Gravity Mains Gravity Main GREGGERYS RD L/1 TO K/1 22M 12 2022 $3,431.09 552879924 2.00411E+13 Berrigan Gravity Mains Gravity Main HARRIS ST BERR A/1 TO P/S1 7M 12 2022 $1,427.78 552879926 2.00409E+13 Berrigan Gravity Mains Gravity Main HARRIS ST BERR A/2 TO A/1 9M 12 2022 $1,769.03 552880051 2.00411E+13 Berrigan Gravity Mains Gravity Main HARRIS ST BERR D/1 TO C/2 60M 12 2022 $9,296.51 552879955 2.00409E+13 Berrigan Gravity Mains Gravity Main HARRIS ST BERR DE TO A/2 26M 12 2022 $3,999.34 55
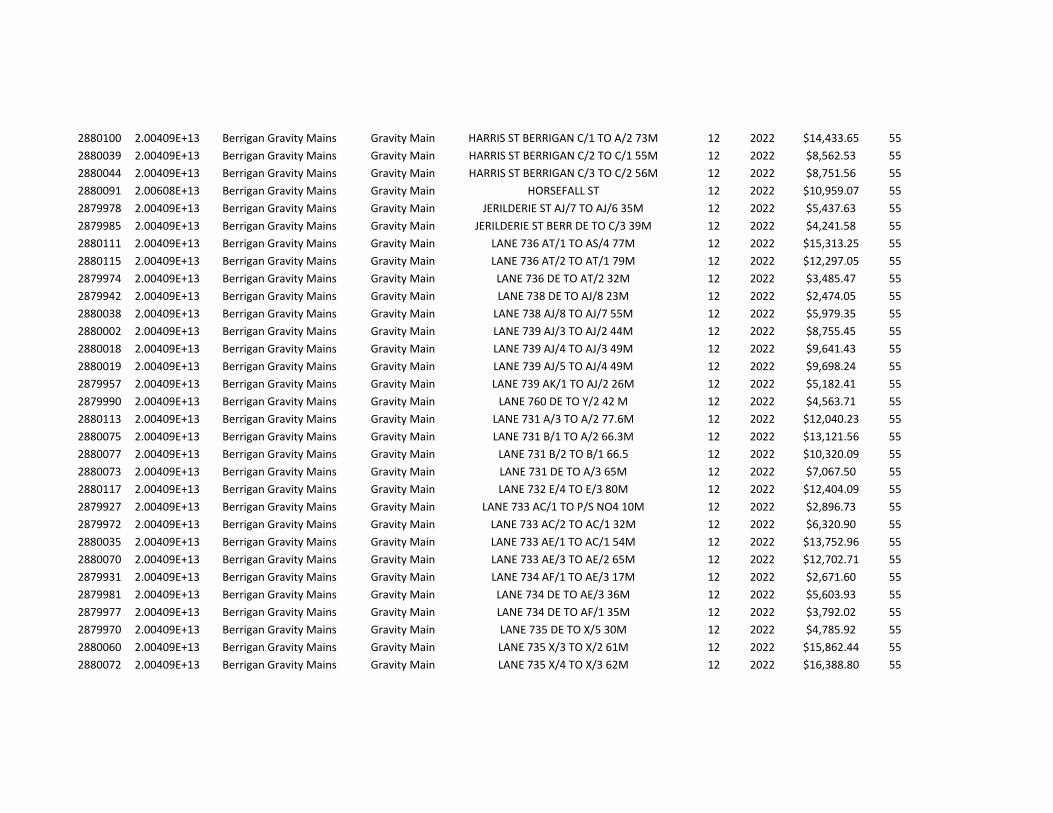
2880100 2.00409E+13 Berrigan Gravity Mains Gravity Main HARRIS ST BERRIGAN C/1 TO A/2 73M 12 2022 $14,433.65 552880039 2.00409E+13 Berrigan Gravity Mains Gravity Main HARRIS ST BERRIGAN C/2 TO C/1 55M 12 2022 $8,562.53 552880044 2.00409E+13 Berrigan Gravity Mains Gravity Main HARRIS ST BERRIGAN C/3 TO C/2 56M 12 2022 $8,751.56 552880091 2.00608E+13 Berrigan Gravity Mains Gravity Main HORSEFALL ST 12 2022 $10,959.07 552879978 2.00409E+13 Berrigan Gravity Mains Gravity Main JERILDERIE ST AJ/7 TO AJ/6 35M 12 2022 $5,437.63 552879985 2.00409E+13 Berrigan Gravity Mains Gravity Main JERILDERIE ST BERR DE TO C/3 39M 12 2022 $4,241.58 552880111 2.00409E+13 Berrigan Gravity Mains Gravity Main LANE 736 AT/1 TO AS/4 77M 12 2022 $15,313.25 552880115 2.00409E+13 Berrigan Gravity Mains Gravity Main LANE 736 AT/2 TO AT/1 79M 12 2022 $12,297.05 552879974 2.00409E+13 Berrigan Gravity Mains Gravity Main LANE 736 DE TO AT/2 32M 12 2022 $3,485.47 552879942 2.00409E+13 Berrigan Gravity Mains Gravity Main LANE 738 DE TO AJ/8 23M 12 2022 $2,474.05 552880038 2.00409E+13 Berrigan Gravity Mains Gravity Main LANE 738 AJ/8 TO AJ/7 55M 12 2022 $5,979.35 552880002 2.00409E+13 Berrigan Gravity Mains Gravity Main LANE 739 AJ/3 TO AJ/2 44M 12 2022 $8,755.45 552880018 2.00409E+13 Berrigan Gravity Mains Gravity Main LANE 739 AJ/4 TO AJ/3 49M 12 2022 $9,641.43 552880019 2.00409E+13 Berrigan Gravity Mains Gravity Main LANE 739 AJ/5 TO AJ/4 49M 12 2022 $9,698.24 552879957 2.00409E+13 Berrigan Gravity Mains Gravity Main LANE 739 AK/1 TO AJ/2 26M 12 2022 $5,182.41 552879990 2.00409E+13 Berrigan Gravity Mains Gravity Main LANE 760 DE TO Y/2 42 M 12 2022 $4,563.71 552880113 2.00409E+13 Berrigan Gravity Mains Gravity Main LANE 731 A/3 TO A/2 77.6M 12 2022 $12,040.23 552880075 2.00409E+13 Berrigan Gravity Mains Gravity Main LANE 731 B/1 TO A/2 66.3M 12 2022 $13,121.56 552880077 2.00409E+13 Berrigan Gravity Mains Gravity Main LANE 731 B/2 TO B/1 66.5 12 2022 $10,320.09 552880073 2.00409E+13 Berrigan Gravity Mains Gravity Main LANE 731 DE TO A/3 65M 12 2022 $7,067.50 552880117 2.00409E+13 Berrigan Gravity Mains Gravity Main LANE 732 E/4 TO E/3 80M 12 2022 $12,404.09 552879927 2.00409E+13 Berrigan Gravity Mains Gravity Main LANE 733 AC/1 TO P/S NO4 10M 12 2022 $2,896.73 552879972 2.00409E+13 Berrigan Gravity Mains Gravity Main LANE 733 AC/2 TO AC/1 32M 12 2022 $6,320.90 552880035 2.00409E+13 Berrigan Gravity Mains Gravity Main LANE 733 AE/1 TO AC/1 54M 12 2022 $13,752.96 552880070 2.00409E+13 Berrigan Gravity Mains Gravity Main LANE 733 AE/3 TO AE/2 65M 12 2022 $12,702.71 552879931 2.00409E+13 Berrigan Gravity Mains Gravity Main LANE 734 AF/1 TO AE/3 17M 12 2022 $2,671.60 552879981 2.00409E+13 Berrigan Gravity Mains Gravity Main LANE 734 DE TO AE/3 36M 12 2022 $5,603.93 552879977 2.00409E+13 Berrigan Gravity Mains Gravity Main LANE 734 DE TO AF/1 35M 12 2022 $3,792.02 552879970 2.00409E+13 Berrigan Gravity Mains Gravity Main LANE 735 DE TO X/5 30M 12 2022 $4,785.92 552880060 2.00409E+13 Berrigan Gravity Mains Gravity Main LANE 735 X/3 TO X/2 61M 12 2022 $15,862.44 552880072 2.00409E+13 Berrigan Gravity Mains Gravity Main LANE 735 X/4 TO X/3 62M 12 2022 $16,388.80 55

2880056 2.00409E+13 Berrigan Gravity Mains Gravity Main LANE 735 X/5 TO X/4 63M 12 2022 $15,694.88 552880059 2.00409E+13 Berrigan Gravity Mains Gravity Main LANE 735 X/6 TO X/5 63M 12 2022 $15,849.00 552880088 2.00409E+13 Berrigan Gravity Mains Gravity Main LANE 735 Y/1 TO X/2 70M 12 2022 $13,889.93 552880087 2.00409E+13 Berrigan Gravity Mains Gravity Main LANE 735 Y/2 TO Y/1 70M 12 2022 $10,880.65 552880114 2.00409E+13 Berrigan Gravity Mains Gravity Main LANE 736 AS/6 TOAS/5 78M 12 2022 $15,592.73 552880133 2.00409E+13 Berrigan Gravity Mains Gravity Main LANE 736 AS/7 TO AS/6 84M 12 2022 $13,086.52 552880047 2.00409E+13 Berrigan Gravity Mains Gravity Main LANE 737 AS/8 TO AS/7 67M 12 2022 $8,957.72 552879951 2.00409E+13 Berrigan Gravity Mains Gravity Main LANE 738 DE TO AJ/8 25M 12 2022 $2,723.39 552880004 2.00409E+13 Berrigan Gravity Mains Gravity Main LANE 739 AU/3 TO AU/2 44.5M 12 2022 $11,315.18 552880130 2.00409E+13 Berrigan Gravity Mains Gravity Main LANE 739 AV/1 TO AU/3 83M 12 2022 $16,431.50 552880031 2.00409E+13 Berrigan Gravity Mains Gravity Main LANE 739 F/5 TO F/ 4 53M 12 2022 $10,482.52 552880064 2.00409E+13 Berrigan Gravity Mains Gravity Main LANE 739 F/6 TO F/ 5 63M 12 2022 $9,776.55 552880034 2.00409E+13 Berrigan Gravity Mains Gravity Main LANE 739 F/7 TO F/6 54M 12 2022 $8,386.25 552880026 2.00409E+13 Berrigan Gravity Mains Gravity Main LANE 740 E1/A TO F/1 50.6M 12 2022 $10,019.28 552879928 2.00409E+13 Berrigan Gravity Mains Gravity Main LANE 740 F/1 TO P/S NO/2 10M 12 2022 $1,984.82 552880076 2.00409E+13 Berrigan Gravity Mains Gravity Main LANE 740 E/1 TO E1/A 66M 12 2022 $13,136.97 552880086 2.00409E+13 Berrigan Gravity Mains Gravity Main LANE 740 E/2 TO E/1 70M 12 2022 $10,877.84 552879993 2.00409E+13 Berrigan Gravity Mains Gravity Main LANE 740 F/2 TO F/3 42.5M 12 2022 $8,413.85 552880049 2.00409E+13 Berrigan Gravity Mains Gravity Main LANE 740 F/3 TO F/2 59M 12 2022 $11,686.42 552880106 2.00409E+13 Berrigan Gravity Mains Gravity Main LANE 741 AO/2 TO AO/1 75M 12 2022 $14,856.92 552880101 2.00409E+13 Berrigan Gravity Mains Gravity Main LANE 741 AO/3 TO AO/2 73M 12 2022 $14,491.43 552880003 2.00409E+13 Berrigan Gravity Mains Gravity Main LANE 741 AU/6 TO AU/5 44.5M 12 2022 $9,010.63 552880123 2.00411E+13 Berrigan Gravity Mains Gravity Main LANE 741 AW/1 TO AU/5 81M 12 2022 $12,580.19 552879984 2.00409E+13 Berrigan Gravity Mains Gravity Main LANE 741 DE TO AW/1 39M 12 2022 $4,230.32 552880041 2.00409E+13 Berrigan Gravity Mains Gravity Main LANE 741 K/4 TO K/3 56M 12 2022 $8,690.72 552880082 2.00409E+13 Berrigan Gravity Mains Gravity Main LANE 743 AS/10 TO AS/9 67M 12 2022 $10,615.34 552880013 2.00612E+13 Berrigan Gravity Mains Gravity Main LANE 743 AS/9 TO AS/8 47M 12 2022 $7,376.28 552879963 2.00409E+13 Berrigan Gravity Mains Gravity Main LANE 744 N/1 TO V/1 28M 12 2022 $7,186.67 552879921 2.00409E+13 Berrigan Gravity Mains Gravity Main LANE 744 V/1 TO P/S NO 3 4.3M 12 2022 $1,285.82 552880084 2.00409E+13 Berrigan Gravity Mains Gravity Main LANE 744 V/2 TO V/1 68.8M 12 2022 $13,615.23 552880079 2.00409E+13 Berrigan Gravity Mains Gravity Main LANE 744 V/3 TO V/2 66.8M 12 2022 $13,231.13 55

2880071 2.00409E+13 Berrigan Gravity Mains Gravity Main LANE 744 V/4 TO V/3 64.4M 12 2022 $9,996.50 552879987 2.00409E+13 Berrigan Gravity Mains Gravity Main LANE 745 N/2 TO N/1 40M 12 2022 $10,154.84 552880008 2.00409E+13 Berrigan Gravity Mains Gravity Main LANE 745 N/3 TO N/2 45.4M 12 2022 $11,547.61 552880062 2.00409E+13 Berrigan Gravity Mains Gravity Main LANE 745 N/4 TO N/3 63M 12 2022 $15,995.91 552880007 2.00409E+13 Berrigan Gravity Mains Gravity Main LANE 745 U/1 TO N/1 45M 12 2022 $8,941.16 552880010 2.00409E+13 Berrigan Gravity Mains Gravity Main LANE 745 U/2 TO U/1 45M 12 2022 $7,153.07 552880083 2.00409E+13 Berrigan Gravity Mains Gravity Main LANE 748 W/1 TO V/4 68.5M 12 2022 $7,449.20 552880105 2.00409E+13 Berrigan Gravity Mains Gravity Main LANE 749 DE TO O/1 74M 12 2022 $11,544.10 552879943 2.00409E+13 Berrigan Gravity Mains Gravity Main LANE 759 DE TO U/2 23M 12 2022 $2,498.84 552880011 2.00409E+13 Berrigan Gravity Mains Gravity Main LANE 763 N/8 TO N/7 50M 12 2022 $5,064.82 552879994 2.00607E+13 Berrigan Gravity Mains Gravity Main LANE NO 733 DE TO AC/3 42M 12 2022 $4,657.94 552880058 2.00608E+13 Berrigan Gravity Mains Gravity Main LANE NO 739 12 2022 $12,338.36 552879996 2.00608E+13 Berrigan Gravity Mains Gravity Main LANE NO 741 12 2022 $6,695.51 552879962 2.00608E+13 Berrigan Gravity Mains Gravity Main LANE NO 741 12 2022 $3,019.65 552879938 2.00409E+13 Berrigan Gravity Mains Gravity Main MARY ST BERR DE TO E1/A 22M 12 2022 $2,397.68 552880118 2.00409E+13 Berrigan Gravity Mains Gravity Main MARY ST BERRIGAN G/1 TO E1/A 80M 12 2022 $15,846.88 552880109 2.00409E+13 Berrigan Gravity Mains Gravity Main MITCHEL ST BERR X/2 TO X/1 76M 12 2022 $19,354.26 552880067 2.00409E+13 Berrigan Gravity Mains Gravity Main MITCHEL ST BERR AE/2 TO AE/1 63M 12 2022 $12,592.01 552880103 2.00409E+13 Berrigan Gravity Mains Gravity Main MITCHEL ST BERR AG/1 TO AE/1 73M 12 2022 $14,558.76 552880021 2.00409E+13 Berrigan Gravity Mains Gravity Main MITCHEL ST BERR X/1 TO AE/1 50M 12 2022 $12,684.34 552880033 2.00409E+13 Berrigan Gravity Mains Gravity Main MOMA LONG ST AS/4 TO AS/3 54M 12 2022 $13,722.30 552879954 2.00409E+13 Berrigan Gravity Mains Gravity Main MOMA LONG ST AS/5 TO AS/4 24M 12 2022 $6,480.56 552879960 2.00409E+13 Berrigan Gravity Mains Gravity Main MOMALONG ST AU/7 TO AU/6 27M 12 2022 $5,473.01 552880065 2.00409E+13 Berrigan Gravity Mains Gravity Main MOMALONG ST AU/1 TO AS/5 63M 12 2022 $16,041.39 552880134 2.00409E+13 Berrigan Gravity Mains Gravity Main MOMALONG ST AU/2 TO AU/1 85M 12 2022 $21,612.03 552879961 2.00409E+13 Berrigan Gravity Mains Gravity Main MOMALONG ST DE TO AS/4 26M 12 2022 $4,293.60 552880119 2.00409E+13 Berrigan Gravity Mains Gravity Main NANGUNIA ST AJ/1 TO AO/1 80M 12 2022 $15,848.52 552880037 2.00409E+13 Berrigan Gravity Mains Gravity Main NANGUNIA ST AJ/2 TO AJ/1 55M 12 2022 $10,886.30 552880054 2.00607E+13 Berrigan Gravity Mains Gravity Main PIVATE LAND 12 2022 $9,467.27 552880057 2.00607E+13 Berrigan Gravity Mains Gravity Main PRIVATE LAND 12 2022 $9,653.36 552880052 2.00607E+13 Berrigan Gravity Mains Gravity Main PRIVATE LAND 12 2022 $8,211.68 55
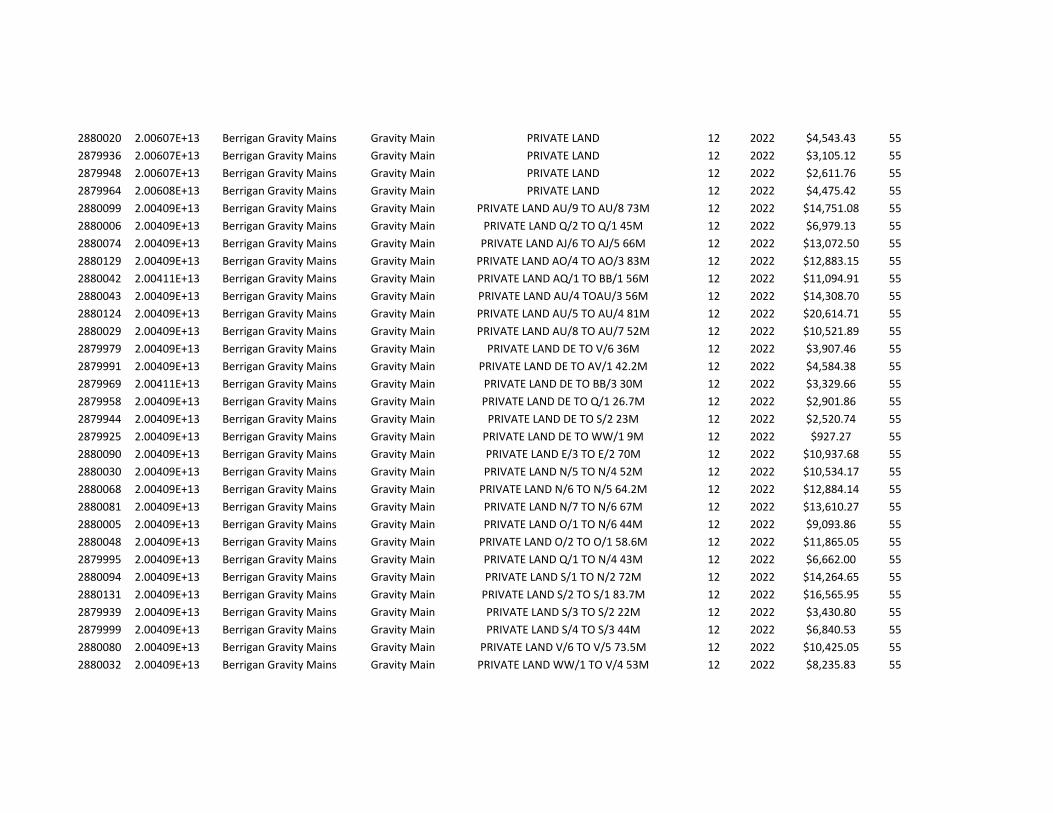
2880020 2.00607E+13 Berrigan Gravity Mains Gravity Main PRIVATE LAND 12 2022 $4,543.43 552879936 2.00607E+13 Berrigan Gravity Mains Gravity Main PRIVATE LAND 12 2022 $3,105.12 552879948 2.00607E+13 Berrigan Gravity Mains Gravity Main PRIVATE LAND 12 2022 $2,611.76 552879964 2.00608E+13 Berrigan Gravity Mains Gravity Main PRIVATE LAND 12 2022 $4,475.42 552880099 2.00409E+13 Berrigan Gravity Mains Gravity Main PRIVATE LAND AU/9 TO AU/8 73M 12 2022 $14,751.08 552880006 2.00409E+13 Berrigan Gravity Mains Gravity Main PRIVATE LAND Q/2 TO Q/1 45M 12 2022 $6,979.13 552880074 2.00409E+13 Berrigan Gravity Mains Gravity Main PRIVATE LAND AJ/6 TO AJ/5 66M 12 2022 $13,072.50 552880129 2.00409E+13 Berrigan Gravity Mains Gravity Main PRIVATE LAND AO/4 TO AO/3 83M 12 2022 $12,883.15 552880042 2.00411E+13 Berrigan Gravity Mains Gravity Main PRIVATE LAND AQ/1 TO BB/1 56M 12 2022 $11,094.91 552880043 2.00409E+13 Berrigan Gravity Mains Gravity Main PRIVATE LAND AU/4 TOAU/3 56M 12 2022 $14,308.70 552880124 2.00409E+13 Berrigan Gravity Mains Gravity Main PRIVATE LAND AU/5 TO AU/4 81M 12 2022 $20,614.71 552880029 2.00409E+13 Berrigan Gravity Mains Gravity Main PRIVATE LAND AU/8 TO AU/7 52M 12 2022 $10,521.89 552879979 2.00409E+13 Berrigan Gravity Mains Gravity Main PRIVATE LAND DE TO V/6 36M 12 2022 $3,907.46 552879991 2.00409E+13 Berrigan Gravity Mains Gravity Main PRIVATE LAND DE TO AV/1 42.2M 12 2022 $4,584.38 552879969 2.00411E+13 Berrigan Gravity Mains Gravity Main PRIVATE LAND DE TO BB/3 30M 12 2022 $3,329.66 552879958 2.00409E+13 Berrigan Gravity Mains Gravity Main PRIVATE LAND DE TO Q/1 26.7M 12 2022 $2,901.86 552879944 2.00409E+13 Berrigan Gravity Mains Gravity Main PRIVATE LAND DE TO S/2 23M 12 2022 $2,520.74 552879925 2.00409E+13 Berrigan Gravity Mains Gravity Main PRIVATE LAND DE TO WW/1 9M 12 2022 $927.27 552880090 2.00409E+13 Berrigan Gravity Mains Gravity Main PRIVATE LAND E/3 TO E/2 70M 12 2022 $10,937.68 552880030 2.00409E+13 Berrigan Gravity Mains Gravity Main PRIVATE LAND N/5 TO N/4 52M 12 2022 $10,534.17 552880068 2.00409E+13 Berrigan Gravity Mains Gravity Main PRIVATE LAND N/6 TO N/5 64.2M 12 2022 $12,884.14 552880081 2.00409E+13 Berrigan Gravity Mains Gravity Main PRIVATE LAND N/7 TO N/6 67M 12 2022 $13,610.27 552880005 2.00409E+13 Berrigan Gravity Mains Gravity Main PRIVATE LAND O/1 TO N/6 44M 12 2022 $9,093.86 552880048 2.00409E+13 Berrigan Gravity Mains Gravity Main PRIVATE LAND O/2 TO O/1 58.6M 12 2022 $11,865.05 552879995 2.00409E+13 Berrigan Gravity Mains Gravity Main PRIVATE LAND Q/1 TO N/4 43M 12 2022 $6,662.00 552880094 2.00409E+13 Berrigan Gravity Mains Gravity Main PRIVATE LAND S/1 TO N/2 72M 12 2022 $14,264.65 552880131 2.00409E+13 Berrigan Gravity Mains Gravity Main PRIVATE LAND S/2 TO S/1 83.7M 12 2022 $16,565.95 552879939 2.00409E+13 Berrigan Gravity Mains Gravity Main PRIVATE LAND S/3 TO S/2 22M 12 2022 $3,430.80 552879999 2.00409E+13 Berrigan Gravity Mains Gravity Main PRIVATE LAND S/4 TO S/3 44M 12 2022 $6,840.53 552880080 2.00409E+13 Berrigan Gravity Mains Gravity Main PRIVATE LAND V/6 TO V/5 73.5M 12 2022 $10,425.05 552880032 2.00409E+13 Berrigan Gravity Mains Gravity Main PRIVATE LAND WW/1 TO V/4 53M 12 2022 $8,235.83 55
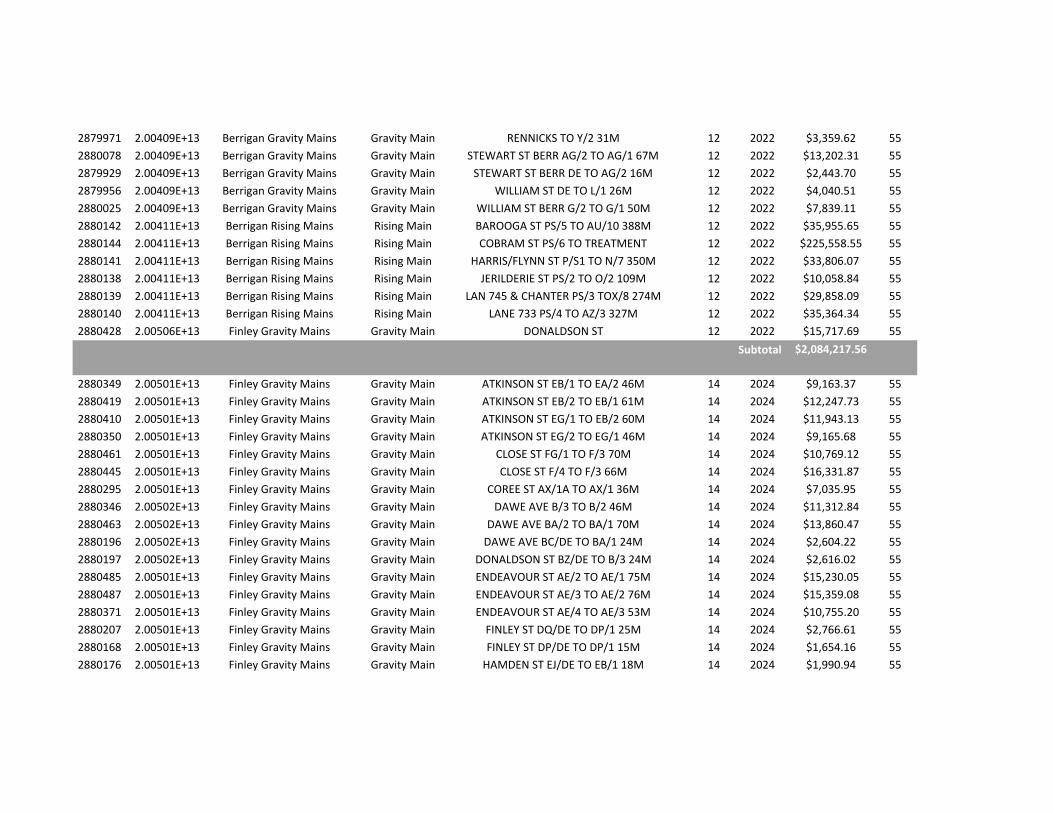
2879971 2.00409E+13 Berrigan Gravity Mains Gravity Main RENNICKS TO Y/2 31M 12 2022 $3,359.62 552880078 2.00409E+13 Berrigan Gravity Mains Gravity Main STEWART ST BERR AG/2 TO AG/1 67M 12 2022 $13,202.31 552879929 2.00409E+13 Berrigan Gravity Mains Gravity Main STEWART ST BERR DE TO AG/2 16M 12 2022 $2,443.70 552879956 2.00409E+13 Berrigan Gravity Mains Gravity Main WILLIAM ST DE TO L/1 26M 12 2022 $4,040.51 552880025 2.00409E+13 Berrigan Gravity Mains Gravity Main WILLIAM ST BERR G/2 TO G/1 50M 12 2022 $7,839.11 552880142 2.00411E+13 Berrigan Rising Mains Rising Main BAROOGA ST PS/5 TO AU/10 388M 12 2022 $35,955.65 552880144 2.00411E+13 Berrigan Rising Mains Rising Main COBRAM ST PS/6 TO TREATMENT 12 2022 $225,558.55 552880141 2.00411E+13 Berrigan Rising Mains Rising Main HARRIS/FLYNN ST P/S1 TO N/7 350M 12 2022 $33,806.07 552880138 2.00411E+13 Berrigan Rising Mains Rising Main JERILDERIE ST PS/2 TO O/2 109M 12 2022 $10,058.84 552880139 2.00411E+13 Berrigan Rising Mains Rising Main LAN 745 & CHANTER PS/3 TOX/8 274M 12 2022 $29,858.09 552880140 2.00411E+13 Berrigan Rising Mains Rising Main LANE 733 PS/4 TO AZ/3 327M 12 2022 $35,364.34 552880428 2.00506E+13 Finley Gravity Mains Gravity Main DONALDSON ST 12 2022 $15,717.69 55
$2,084,217.56
2880349 2.00501E+13 Finley Gravity Mains Gravity Main ATKINSON ST EB/1 TO EA/2 46M 14 2024 $9,163.37 552880419 2.00501E+13 Finley Gravity Mains Gravity Main ATKINSON ST EB/2 TO EB/1 61M 14 2024 $12,247.73 552880410 2.00501E+13 Finley Gravity Mains Gravity Main ATKINSON ST EG/1 TO EB/2 60M 14 2024 $11,943.13 552880350 2.00501E+13 Finley Gravity Mains Gravity Main ATKINSON ST EG/2 TO EG/1 46M 14 2024 $9,165.68 552880461 2.00501E+13 Finley Gravity Mains Gravity Main CLOSE ST FG/1 TO F/3 70M 14 2024 $10,769.12 552880445 2.00501E+13 Finley Gravity Mains Gravity Main CLOSE ST F/4 TO F/3 66M 14 2024 $16,331.87 552880295 2.00501E+13 Finley Gravity Mains Gravity Main COREE ST AX/1A TO AX/1 36M 14 2024 $7,035.95 552880346 2.00502E+13 Finley Gravity Mains Gravity Main DAWE AVE B/3 TO B/2 46M 14 2024 $11,312.84 552880463 2.00502E+13 Finley Gravity Mains Gravity Main DAWE AVE BA/2 TO BA/1 70M 14 2024 $13,860.47 552880196 2.00502E+13 Finley Gravity Mains Gravity Main DAWE AVE BC/DE TO BA/1 24M 14 2024 $2,604.22 552880197 2.00502E+13 Finley Gravity Mains Gravity Main DONALDSON ST BZ/DE TO B/3 24M 14 2024 $2,616.02 552880485 2.00501E+13 Finley Gravity Mains Gravity Main ENDEAVOUR ST AE/2 TO AE/1 75M 14 2024 $15,230.05 552880487 2.00501E+13 Finley Gravity Mains Gravity Main ENDEAVOUR ST AE/3 TO AE/2 76M 14 2024 $15,359.08 552880371 2.00501E+13 Finley Gravity Mains Gravity Main ENDEAVOUR ST AE/4 TO AE/3 53M 14 2024 $10,755.20 552880207 2.00501E+13 Finley Gravity Mains Gravity Main FINLEY ST DQ/DE TO DP/1 25M 14 2024 $2,766.61 552880168 2.00501E+13 Finley Gravity Mains Gravity Main FINLEY ST DP/DE TO DP/1 15M 14 2024 $1,654.16 552880176 2.00501E+13 Finley Gravity Mains Gravity Main HAMDEN ST EJ/DE TO EB/1 18M 14 2024 $1,990.94 55
Subtotal

2880261 2.00501E+13 Finley Gravity Mains Gravity Main HEADFORD ST DE TO DB/3 30M 14 2024 $3,272.05 552880229 2.00501E+13 Finley Gravity Mains Gravity Main HEADFORD ST DL/DE TO DB/3 28M 14 2024 $3,071.99 552880260 2.00501E+13 Finley Gravity Mains Gravity Main HEADFORD ST DT/DE TO D/3 30M 14 2024 $3,270.14 552880456 2.00501E+13 Finley Gravity Mains Gravity Main HOWE ST D/15 TO D/14 69M 14 2024 $13,936.76 552880273 2.00501E+13 Finley Gravity Mains Gravity Main HOWE ST D/16 TO D/15 32M 14 2024 $6,438.71 552880442 2.00501E+13 Finley Gravity Mains Gravity Main LANE NO 840 AC/5 TO AC/4 66M 14 2024 $13,386.31 552880438 2.00501E+13 Finley Gravity Mains Gravity Main LANE NO 840 C/1A TO CA/1 66M 14 2024 $16,161.04 552880489 2.00501E+13 Finley Gravity Mains Gravity Main LANE NO 840 CA/2 TO CA/1 76M 14 2024 $18,651.14 552880486 2.00501E+13 Finley Gravity Mains Gravity Main LANE NO 840 CA/3 TO CA/2 75M 14 2024 $14,929.58 552880212 2.00501E+13 Finley Gravity Mains Gravity Main LANE NO 840 CA/DE TO CA/4 26M 14 2024 $2,834.35 552880421 2.00501E+13 Finley Gravity Mains Gravity Main LANE NO 841 AW/1 TO A/7 62M 14 2024 $9,640.70 552880480 2.00501E+13 Finley Gravity Mains Gravity Main LANE NO 841 CC/1 TO CC/1A 75M 14 2024 $14,827.61 552880213 2.00501E+13 Finley Gravity Mains Gravity Main LANE NO 841 CC/1A TO CB/2 26M 14 2024 $6,392.44 552880488 2.00501E+13 Finley Gravity Mains Gravity Main LANE NO 841 CC/2 TO CC/1 76M 14 2024 $11,792.99 552880508 2.00501E+13 Finley Gravity Mains Gravity Main LANE NO 841 A/5 TO A/4 80M 14 2024 $20,343.41 552880378 2.00501E+13 Finley Gravity Mains Gravity Main LANE NO 841 A/6 TO A/5 55M 14 2024 $11,138.93 552880322 2.00501E+13 Finley Gravity Mains Gravity Main LANE NO 841 A/7 TO A/6 43M 14 2024 $8,667.02 552880321 2.00501E+13 Finley Gravity Mains Gravity Main LANE NO 838 FB/1 TO FB/1A 42M 14 2024 $10,354.51 552880318 2.00501E+13 Finley Gravity Mains Gravity Main LANE NO 840 AB/11 TO AB/10 42M 14 2024 $8,493.13 552880468 2.00501E+13 Finley Gravity Mains Gravity Main LANE NO 840 AB/13TO AB/12 71M 14 2024 $14,393.50 552880494 2.00501E+13 Finley Gravity Mains Gravity Main LANE NO 840 AB/8 TO AB/7 78M 14 2024 $19,852.67 552880457 2.00501E+13 Finley Gravity Mains Gravity Main LANE NO 840 AC/6 TO AC/5 69M 14 2024 $13,969.76 552880150 2.00501E+13 Finley Gravity Mains Gravity Main LANE NO 840 CA/1 TO PS/C 7M 14 2024 $1,742.01 552880159 2.00501E+13 Finley Gravity Mains Gravity Main LANE NO 840 AB/10A TO AB/9 12M 14 2024 $2,534.90 552880500 2.00501E+13 Finley Gravity Mains Gravity Main LANE NO 840 AB/12 TO AB/11 79M 14 2024 $15,994.41 552880484 2.00501E+13 Finley Gravity Mains Gravity Main LANE NO 840 AB/9 TO AB/8 75M 14 2024 $19,121.24 552880416 2.00501E+13 Finley Gravity Mains Gravity Main LANE NO 840 CA/4 TO CA/3 61M 14 2024 $12,100.13 552880383 2.00606E+13 Finley Gravity Mains Gravity Main LANE NO 841 AA/4 TO AA/3 60M 14 2024 $14,101.19 552880477 2.00501E+13 Finley Gravity Mains Gravity Main LANE NO 841 AA/5 TO AA/4 78M 14 2024 $18,733.08 552880472 2.00502E+13 Finley Gravity Mains Gravity Main LANE NO 841 AA/6 TO AA/5 73M 14 2024 $18,522.47 552880552 2.00501E+13 Finley Gravity Mains Gravity Main LANE NO 841 AA/7 TO AA/6 88M 14 2024 $17,907.87 55

2880149 2.00501E+13 Finley Gravity Mains Gravity Main LANE NO 842 D/1 TO PS/D 7M 14 2024 $1,060.39 552880381 2.00501E+13 Finley Gravity Mains Gravity Main LANE NO 842 D/2 TO D/1 55M 14 2024 $8,385.11 552880465 2.00501E+13 Finley Gravity Mains Gravity Main LANE NO 842 D/3 TO D/2 70M 14 2024 $10,608.47 552880536 2.00501E+13 Finley Gravity Mains Gravity Main LANE NO 842 D/4 TO D/3 82M 14 2024 $12,461.66 552880545 2.00501E+13 Finley Gravity Mains Gravity Main LANE NO 842 D/5 TO D/4 84M 14 2024 $12,801.93 552880432 2.00501E+13 Finley Gravity Mains Gravity Main LANE NO 842 D/6 TO D/5 65M 14 2024 $9,845.39 552880478 2.00508E+13 Finley Gravity Mains Gravity Main LANE NO 842 D/8 TO D/7 74M 14 2024 $18,831.46 552880347 2.00502E+13 Finley Gravity Mains Gravity Main LANE NO 844 AA/8 TO AA/7 46M 14 2024 $9,342.91 552880503 2.00501E+13 Finley Gravity Mains Gravity Main LANE NO 844 AA/9 TO AA/8 80M 14 2024 $16,143.76 552880194 2.00501E+13 Finley Gravity Mains Gravity Main LANE NO 844 FD/DE TO FD/1 23M 14 2024 $2,501.59 552880425 2.00502E+13 Finley Gravity Mains Gravity Main LANE NO 834 BB/1 TO BA/4 63M 14 2024 $9,879.32 552880237 2.00502E+13 Finley Gravity Mains Gravity Main LANE NO 834 BE/DE TO BB/1 29M 14 2024 $3,156.89 552880272 2.00502E+13 Finley Gravity Mains Gravity Main LANE NO 834 DE TO BA/5 32M 14 2024 $3,454.10 552880183 2.00502E+13 Finley Gravity Mains Gravity Main LANE NO 834 DE TO BB/1 20M 14 2024 $2,182.28 552880385 2.00606E+13 Finley Gravity Mains Gravity Main LANE NO 834 BA/5 TO BA/4 56M 14 2024 $8,686.60 552880236 2.00501E+13 Finley Gravity Mains Gravity Main LANE NO 834 BD/DE TO BA/5 29M 14 2024 $3,154.05 552880372 2.00607E+13 Finley Gravity Mains Gravity Main LANE NO 838 14 2024 $13,259.36 552880412 2.00501E+13 Finley Gravity Mains Gravity Main LANE NO 839 EB/6 TO EB/5 61M 14 2024 $9,459.71 552880451 2.00501E+13 Finley Gravity Mains Gravity Main LANE NO 840 AB/4 TO AB/3 68M 14 2024 $17,290.10 552880422 2.00501E+13 Finley Gravity Mains Gravity Main LANE NO 840 AB/5 TO AB/4 62M 14 2024 $15,789.35 552880433 2.00501E+13 Finley Gravity Mains Gravity Main LANE NO 840 AB/6 TO AB/5 65M 14 2024 $16,536.05 552880420 2.00501E+13 Finley Gravity Mains Gravity Main LANE NO 840 AC/1 TO AB/3 62M 14 2024 $15,731.61 552880414 2.00501E+13 Finley Gravity Mains Gravity Main LANE NO 840 AC/2 TO AC/1 61M 14 2024 $15,513.58 552880406 2.00501E+13 Finley Gravity Mains Gravity Main LANE NO 840 AC/3 TO AC/2 60M 14 2024 $12,165.18 552880540 2.00501E+13 Finley Gravity Mains Gravity Main LANE NO 840 AC/4 TO AC/3 83M 14 2024 $16,884.67 552880309 2.00501E+13 Finley Gravity Mains Gravity Main LANE NO 840 AO/DE TO AB/5 40M 14 2024 $4,369.11 552880334 2.00501E+13 Finley Gravity Mains Gravity Main LANE NO 840 C/1 TO C/1A 48M 14 2024 $10,961.49 552880458 2.00501E+13 Finley Gravity Mains Gravity Main LANE NO 840 C/2 TO C/1 69M 14 2024 $16,948.04 552880429 2.00501E+13 Finley Gravity Mains Gravity Main LANE NO 840 C/3 TO C/2 64M 14 2024 $15,726.37 552880335 2.00501E+13 Finley Gravity Mains Gravity Main LANE NO 840 C/4 TO C/3 45M 14 2024 $8,904.50 552880311 2.00607E+13 Finley Gravity Mains Gravity Main LANE NO 840 AB/7 TO AB/6 40M 14 2024 $10,276.29 55
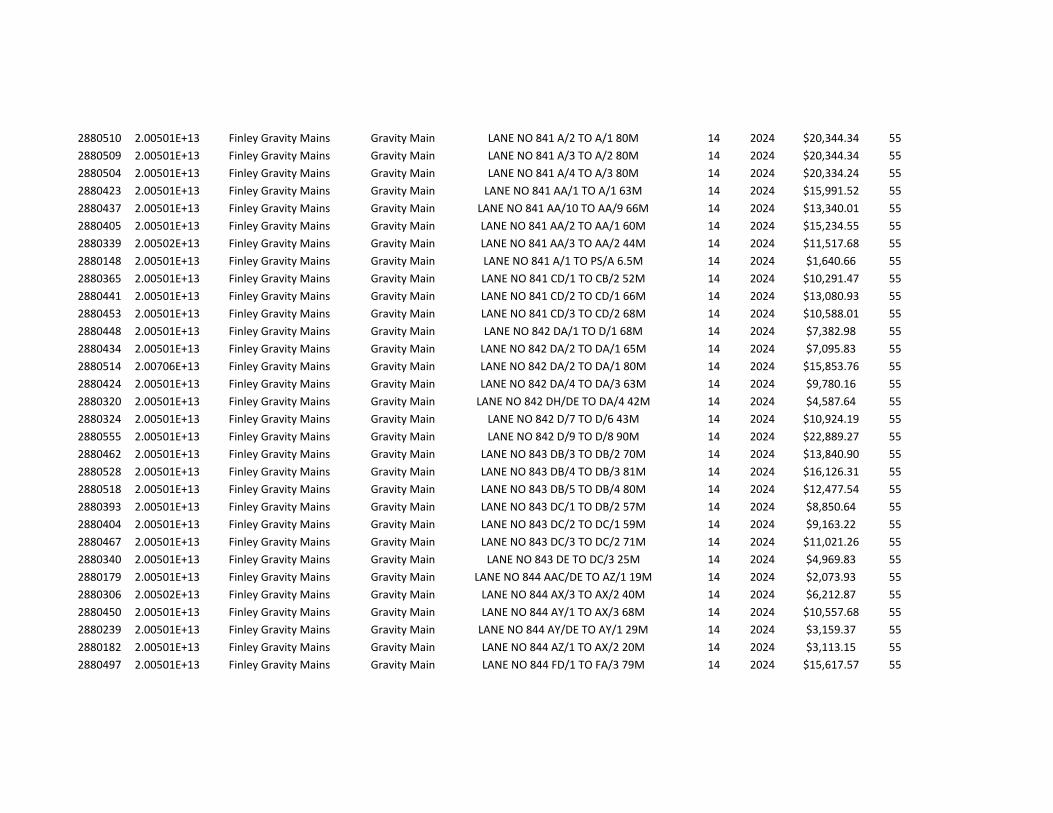
2880510 2.00501E+13 Finley Gravity Mains Gravity Main LANE NO 841 A/2 TO A/1 80M 14 2024 $20,344.34 552880509 2.00501E+13 Finley Gravity Mains Gravity Main LANE NO 841 A/3 TO A/2 80M 14 2024 $20,344.34 552880504 2.00501E+13 Finley Gravity Mains Gravity Main LANE NO 841 A/4 TO A/3 80M 14 2024 $20,334.24 552880423 2.00501E+13 Finley Gravity Mains Gravity Main LANE NO 841 AA/1 TO A/1 63M 14 2024 $15,991.52 552880437 2.00501E+13 Finley Gravity Mains Gravity Main LANE NO 841 AA/10 TO AA/9 66M 14 2024 $13,340.01 552880405 2.00501E+13 Finley Gravity Mains Gravity Main LANE NO 841 AA/2 TO AA/1 60M 14 2024 $15,234.55 552880339 2.00502E+13 Finley Gravity Mains Gravity Main LANE NO 841 AA/3 TO AA/2 44M 14 2024 $11,517.68 552880148 2.00501E+13 Finley Gravity Mains Gravity Main LANE NO 841 A/1 TO PS/A 6.5M 14 2024 $1,640.66 552880365 2.00501E+13 Finley Gravity Mains Gravity Main LANE NO 841 CD/1 TO CB/2 52M 14 2024 $10,291.47 552880441 2.00501E+13 Finley Gravity Mains Gravity Main LANE NO 841 CD/2 TO CD/1 66M 14 2024 $13,080.93 552880453 2.00501E+13 Finley Gravity Mains Gravity Main LANE NO 841 CD/3 TO CD/2 68M 14 2024 $10,588.01 552880448 2.00501E+13 Finley Gravity Mains Gravity Main LANE NO 842 DA/1 TO D/1 68M 14 2024 $7,382.98 552880434 2.00501E+13 Finley Gravity Mains Gravity Main LANE NO 842 DA/2 TO DA/1 65M 14 2024 $7,095.83 552880514 2.00706E+13 Finley Gravity Mains Gravity Main LANE NO 842 DA/2 TO DA/1 80M 14 2024 $15,853.76 552880424 2.00501E+13 Finley Gravity Mains Gravity Main LANE NO 842 DA/4 TO DA/3 63M 14 2024 $9,780.16 552880320 2.00501E+13 Finley Gravity Mains Gravity Main LANE NO 842 DH/DE TO DA/4 42M 14 2024 $4,587.64 552880324 2.00501E+13 Finley Gravity Mains Gravity Main LANE NO 842 D/7 TO D/6 43M 14 2024 $10,924.19 552880555 2.00501E+13 Finley Gravity Mains Gravity Main LANE NO 842 D/9 TO D/8 90M 14 2024 $22,889.27 552880462 2.00501E+13 Finley Gravity Mains Gravity Main LANE NO 843 DB/3 TO DB/2 70M 14 2024 $13,840.90 552880528 2.00501E+13 Finley Gravity Mains Gravity Main LANE NO 843 DB/4 TO DB/3 81M 14 2024 $16,126.31 552880518 2.00501E+13 Finley Gravity Mains Gravity Main LANE NO 843 DB/5 TO DB/4 80M 14 2024 $12,477.54 552880393 2.00501E+13 Finley Gravity Mains Gravity Main LANE NO 843 DC/1 TO DB/2 57M 14 2024 $8,850.64 552880404 2.00501E+13 Finley Gravity Mains Gravity Main LANE NO 843 DC/2 TO DC/1 59M 14 2024 $9,163.22 552880467 2.00501E+13 Finley Gravity Mains Gravity Main LANE NO 843 DC/3 TO DC/2 71M 14 2024 $11,021.26 552880340 2.00501E+13 Finley Gravity Mains Gravity Main LANE NO 843 DE TO DC/3 25M 14 2024 $4,969.83 552880179 2.00501E+13 Finley Gravity Mains Gravity Main LANE NO 844 AAC/DE TO AZ/1 19M 14 2024 $2,073.93 552880306 2.00502E+13 Finley Gravity Mains Gravity Main LANE NO 844 AX/3 TO AX/2 40M 14 2024 $6,212.87 552880450 2.00501E+13 Finley Gravity Mains Gravity Main LANE NO 844 AY/1 TO AX/3 68M 14 2024 $10,557.68 552880239 2.00501E+13 Finley Gravity Mains Gravity Main LANE NO 844 AY/DE TO AY/1 29M 14 2024 $3,159.37 552880182 2.00501E+13 Finley Gravity Mains Gravity Main LANE NO 844 AZ/1 TO AX/2 20M 14 2024 $3,113.15 552880497 2.00501E+13 Finley Gravity Mains Gravity Main LANE NO 844 FD/1 TO FA/3 79M 14 2024 $15,617.57 55

2880202 2.00501E+13 Finley Gravity Mains Gravity Main LANE NO 844 FA/4 TO FA/3 25M 14 2024 $4,934.93 552880524 2.00501E+13 Finley Gravity Mains Gravity Main LANE NO 847 E/4 TO E/2 81M 14 2024 $19,848.59 552880169 2.00501E+13 Finley Gravity Mains Gravity Main LANE NO 847 EM/DE TO EA/4 16M 14 2024 $1,742.77 552880157 2.00501E+13 Finley Gravity Mains Gravity Main LANE NO 847 E/1 TO PS/E 10M 14 2024 $2,459.43 552880302 2.00501E+13 Finley Gravity Mains Gravity Main LANE NO 847 E/2 TO E/1 38M 14 2024 $9,322.41 552880519 2.00501E+13 Finley Gravity Mains Gravity Main LANE NO 847 E/3 TO E/2 81M 14 2024 $19,724.80 552880483 2.00501E+13 Finley Gravity Mains Gravity Main LANE NO 847 E/5 TO E/4 75M 14 2024 $14,863.83 552880344 2.00502E+13 Finley Gravity Mains Gravity Main LANE NO 847 E/6 TO E/5 46M 14 2024 $7,124.90 552880327 2.00501E+13 Finley Gravity Mains Gravity Main LANE NO 847 EA/1 TO E/1 43M 14 2024 $10,563.56 552880502 2.00501E+13 Finley Gravity Mains Gravity Main LANE NO 847 EA/2 TO EA/1 79M 14 2024 $15,676.10 552880513 2.00501E+13 Finley Gravity Mains Gravity Main LANE NO 847 EA/3 TO EA/2 80M 14 2024 $15,851.69 552880526 2.00501E+13 Finley Gravity Mains Gravity Main LANE NO 847 EA/4 TO EA/3 81M 14 2024 $12,570.33 552880398 2.00501E+13 Finley Gravity Mains Gravity Main LANE NO 848 EB/5 TO EB/4 58M 14 2024 $9,012.61 552880499 2.00501E+13 Finley Gravity Mains Gravity Main LANE NO 848 EC/2 TO EC/1 79M 14 2024 $12,259.09 552880280 2.00501E+13 Finley Gravity Mains Gravity Main LANE NO 848 EH/DE TO EB/5 32M 14 2024 $3,532.63 552880388 2.00501E+13 Finley Gravity Mains Gravity Main LANE NO 848 EB/3 TO EB/2 56M 14 2024 $11,100.01 552880392 2.00501E+13 Finley Gravity Mains Gravity Main LANE NO 848 EB/4 TO EB/3 57M 14 2024 $11,279.00 552880491 2.00501E+13 Finley Gravity Mains Gravity Main LANE NO 848 EC/1 TO EB/2 76M 14 2024 $11,864.92 552880269 2.00502E+13 Finley Gravity Mains Gravity Main OSBORNE ST B/2 TO B/1 34M 14 2024 $7,733.48 552880218 2.00501E+13 Finley Gravity Mains Gravity Main OSBORNE ST DF/DE TO DA/2 27M 14 2024 $2,941.19 552880276 2.00501E+13 Finley Gravity Mains Gravity Main OSBORNE ST AJ/DE TO AC/4 32M 14 2024 $3,487.99 552880264 2.00501E+13 Finley Gravity Mains Gravity Main OSBORNE ST DS/DE TO DC/3 30M 14 2024 $3,284.97 552880234 2.00607E+13 Finley Gravity Mains Gravity Main PRIVATE LAND 14 2024 $3,145.17 552880220 2.00501E+13 Finley Gravity Mains Gravity Main PRIVATE LAND 14 2024 $2,952.54 552880172 2.00607E+13 Finley Gravity Mains Gravity Main PRIVATE LAND 14 2024 $1,894.65 552880330 2.00501E+13 Finley Gravity Mains Gravity Main PRIVATE LAND 14 2024 $10,614.38 552880511 2.00502E+13 Finley Gravity Mains Gravity Main PRIVATE LAND AD/5 TO AD/4 80M 14 2024 $16,204.81 552880493 2.00501E+13 Finley Gravity Mains Gravity Main PRIVATE LAND A/10 TO A/9 78M 14 2024 $15,733.41 552880538 2.00501E+13 Finley Gravity Mains Gravity Main PRIVATE LAND A/8 TO A/7 83M 14 2024 $16,797.26 552880403 2.00501E+13 Finley Gravity Mains Gravity Main PRIVATE LAND A/9 TO A/8 59M 14 2024 $11,948.48 552880307 2.00501E+13 Finley Gravity Mains Gravity Main PRIVATE LAND AD/3 TO AD/2 40M 14 2024 $8,109.68 55

2880553 2.00501E+13 Finley Gravity Mains Gravity Main PRIVATE LAND AD/4 TO AD/3 89M 14 2024 $18,018.71 552880366 2.00501E+13 Finley Gravity Mains Gravity Main PRIVATE LAND AD/6 TO AD/5 52M 14 2024 $10,541.06 552880492 2.00502E+13 Finley Gravity Mains Gravity Main PRIVATE LAND AD/7 TO AD/6 77M 14 2024 $15,606.79 552880315 2.00501E+13 Finley Gravity Mains Gravity Main PRIVATE LAND AD/8 TO AD/7 41M 14 2024 $8,296.41 552880360 2.00501E+13 Finley Gravity Mains Gravity Main PRIVATE LAND AD/9 TO AD/8 50M 14 2024 $10,139.42 552880427 2.00501E+13 Finley Gravity Mains Gravity Main PRIVATE LAND AF/1 TO AD/5 65M 14 2024 $9,945.13 552880232 2.00501E+13 Finley Gravity Mains Gravity Main PRIVATE LAND AH/DE TO AC/5 29M 14 2024 $3,127.28 552880221 2.00607E+13 Finley Gravity Mains Gravity Main PRIVATE LAND AK/DE TO AA/4 27M 14 2024 $2,959.51 552880238 2.00502E+13 Finley Gravity Mains Gravity Main PRIVATE LAND AL/DE TO AA/4 29M 14 2024 $3,158.83 552880263 2.00501E+13 Finley Gravity Mains Gravity Main PRIVATE LAND AP/DE TO AA/2 30M 14 2024 $3,274.90 552880266 2.00501E+13 Finley Gravity Mains Gravity Main PRIVATE LAND AQ/DE TO AA/2 31M 14 2024 $3,365.48 552880313 2.00501E+13 Finley Gravity Mains Gravity Main PRIVATE LAND AR/DE TO AA/7 39M 14 2024 $4,420.92 552880352 2.00501E+13 Finley Gravity Mains Gravity Main PRIVATE LAND AT/DE TO AB/7 47M 14 2024 $5,149.43 552880387 2.00501E+13 Finley Gravity Mains Gravity Main PRIVATE LAND AU/1 TO A/9 56M 14 2024 $8,696.22 552880277 2.00502E+13 Finley Gravity Mains Gravity Main PRIVATE LAND AU/DE TO AU/1 32M 14 2024 $3,488.21 552880211 2.00502E+13 Finley Gravity Mains Gravity Main PRIVATE LAND AUA/DE TO AU/1 26M 14 2024 $2,826.35 552880258 2.00502E+13 Finley Gravity Mains Gravity Main PRIVATE LAND AV/DE TO AV/1 30M 14 2024 $3,267.09 552880286 2.00502E+13 Finley Gravity Mains Gravity Main PRIVATE LAND AVA/DE TO AV/1 33M 14 2024 $3,607.09 552880233 2.00501E+13 Finley Gravity Mains Gravity Main PRIVATE LAND AW/DE TO AW/1 29M 14 2024 $3,137.18 552880379 2.00501E+13 Finley Gravity Mains Gravity Main PRIVATE LAND AX/2 TO AX/1A 55M 14 2024 $10,916.43 552880537 2.00501E+13 Finley Gravity Mains Gravity Main PRIVATE LAND AX/4 TO AX/3 82M 14 2024 $12,770.53 552880312 2.00501E+13 Finley Gravity Mains Gravity Main PRIVATE LAND AX/5 TO AX/4 41M 14 2024 $4,410.79 552880235 2.00501E+13 Finley Gravity Mains Gravity Main PRIVATE LAND AZ/DE TO AZ/1 29M 14 2024 $3,152.70 552880153 2.00502E+13 Finley Gravity Mains Gravity Main PRIVATE LAND B/1 TO PS /B 5M 14 2024 $1,868.54 552880391 2.00501E+13 Finley Gravity Mains Gravity Main PRIVATE LAND B/4 TO B/3 56M 14 2024 $13,810.44 552880473 2.00501E+13 Finley Gravity Mains Gravity Main PRIVATE LAND B/5 TO B/4 73M 14 2024 $14,465.19 552880407 2.00502E+13 Finley Gravity Mains Gravity Main PRIVATE LAND BA/1 TO B/5 60M 14 2024 $11,904.28 552880382 2.00502E+13 Finley Gravity Mains Gravity Main PRIVATE LAND BA/4 TO BA/3 55M 14 2024 $8,603.71 552880506 2.00604E+13 Finley Gravity Mains Gravity Main PRIVATE LAND BG/1 TO B/1 80M 14 2024 $19,619.18 552880520 2.00502E+13 Finley Gravity Mains Gravity Main PRIVATE LAND BG/2 TO BG/1 80M 14 2024 $19,764.28 552880358 2.00502E+13 Finley Gravity Mains Gravity Main PRIVATE LAND BG/3 TO BG/2 49M 14 2024 $12,073.09 55

2880274 2.00502E+13 Finley Gravity Mains Gravity Main PRIVATE LAND BN/DE TO B/5 32M 14 2024 $3,466.03 552880231 2.00501E+13 Finley Gravity Mains Gravity Main PRIVATE LAND CC/DE TO CC/2 29M 14 2024 $3,123.48 552880247 2.00501E+13 Finley Gravity Mains Gravity Main PRIVATE LAND CH/DE TO C/3 29M 14 2024 $3,187.27 552880230 2.00501E+13 Finley Gravity Mains Gravity Main PRIVATE LAND CK/DE TO CA/4 28M 14 2024 $3,072.23 552880297 2.00501E+13 Finley Gravity Mains Gravity Main PRIVATE LAND D/13 TO D/12 38M 14 2024 $7,305.43 552880481 2.00501E+13 Finley Gravity Mains Gravity Main PRIVATE LAND D/14 TO D/13 75M 14 2024 $15,173.54 552880402 2.00502E+13 Finley Gravity Mains Gravity Main PRIVATE LAND DA/5 TO DA/4 59M 14 2024 $9,129.70 552880409 2.00501E+13 Finley Gravity Mains Gravity Main PRIVATE LAND DB/1 TO D/2 60M 14 2024 $6,546.03 552880399 2.00606E+13 Finley Gravity Mains Gravity Main PRIVATE LAND DB/2 TO DB/1 58M 14 2024 $6,324.12 552880241 2.00501E+13 Finley Gravity Mains Gravity Main PRIVATE LAND DB/DE TO DB/5 29M 14 2024 $3,163.24 552880397 2.00501E+13 Finley Gravity Mains Gravity Main PRIVATE LAND DD/1 TO D/7 58M 14 2024 $11,485.52 552880435 2.00501E+13 Finley Gravity Mains Gravity Main PRIVATE LAND DD/2 TO DD/1 65M 14 2024 $12,937.98 552880188 2.00501E+13 Finley Gravity Mains Gravity Main PRIVATE LAND DD/DE TO DD/3 21M 14 2024 $2,292.83 552880210 2.00502E+13 Finley Gravity Mains Gravity Main PRIVATE LAND DE TO BF/1 26M 14 2024 $2,825.15 552880216 2.00501E+13 Finley Gravity Mains Gravity Main PRIVATE LAND DEA/DE TO D/12 27M 14 2024 $2,918.04 552880294 2.00501E+13 Finley Gravity Mains Gravity Main PRIVATE LAND DK/DE TO DB/2 35M 14 2024 $3,827.14 552880206 2.00501E+13 Finley Gravity Mains Gravity Main PRIVATE LAND DM/DE TO DB/5 27M 14 2024 $2,742.77 552880444 2.00501E+13 Finley Gravity Mains Gravity Main PRIVATE LAND DO/1 TO D/13 67M 14 2024 $10,332.06 552880224 2.00501E+13 Finley Gravity Mains Gravity Main PRIVATE LAND DU/DE TO D/5 28M 14 2024 $3,026.84 552880287 2.00501E+13 Finley Gravity Mains Gravity Main PRIVATE LAND DV/DE TO D/5 33M 14 2024 $3,615.48 552880248 2.00501E+13 Finley Gravity Mains Gravity Main PRIVATE LAND DW/DE TO DC/2 29M 14 2024 $3,190.82 552880336 2.00501E+13 Finley Gravity Mains Gravity Main PRIVATE LAND EA/5 TO EA/4 45M 14 2024 $4,891.78 552880278 2.00501E+13 Finley Gravity Mains Gravity Main PRIVATE LAND EA/DE TO EA/5 32M 14 2024 $3,496.07 552880418 2.00501E+13 Finley Gravity Mains Gravity Main PRIVATE LAND EK/1 TO EG/2 61M 14 2024 $9,549.08 552880476 2.00501E+13 Finley Gravity Mains Gravity Main PRIVATE LAND EK/2 TO EK/1 73M 14 2024 $11,373.47 552880227 2.00501E+13 Finley Gravity Mains Gravity Main PRIVATE LAND EK/DE TO EK/2 28M 14 2024 $3,054.63 552880152 2.00501E+13 Finley Gravity Mains Gravity Main PRIVATE LAND F/1 TO PS/F 8M 14 2024 $1,779.70 552880293 2.00501E+13 Finley Gravity Mains Gravity Main PRIVATE LAND F/2 TO F/1 36M 14 2024 $8,628.66 552880240 2.00501E+13 Finley Gravity Mains Gravity Main PRIVATE LAND FA/1A TO FA/1 29M 14 2024 $7,132.28 552880471 2.00501E+13 Finley Gravity Mains Gravity Main PRIVATE LAND FA/2 TO FA/1A 72M 14 2024 $17,650.27 552880376 2.00501E+13 Finley Gravity Mains Gravity Main PRIVATE LAND FA/3 TO FA/2 55M 14 2024 $10,837.82 55
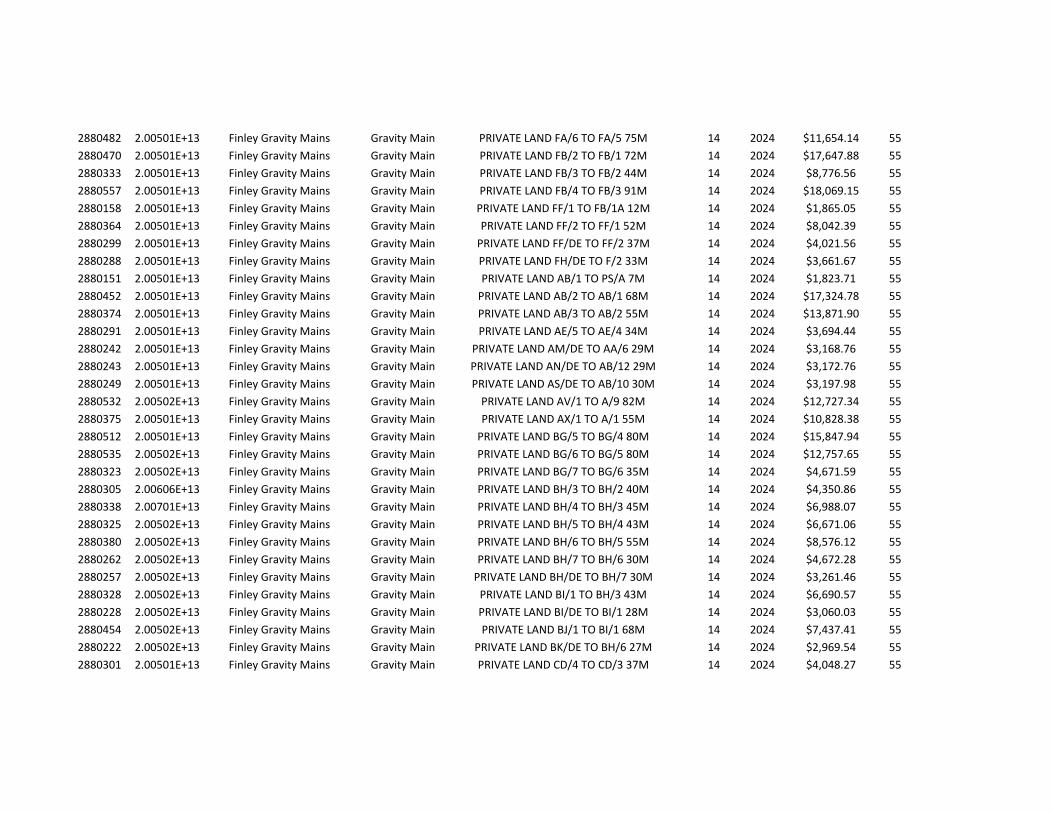
2880482 2.00501E+13 Finley Gravity Mains Gravity Main PRIVATE LAND FA/6 TO FA/5 75M 14 2024 $11,654.14 552880470 2.00501E+13 Finley Gravity Mains Gravity Main PRIVATE LAND FB/2 TO FB/1 72M 14 2024 $17,647.88 552880333 2.00501E+13 Finley Gravity Mains Gravity Main PRIVATE LAND FB/3 TO FB/2 44M 14 2024 $8,776.56 552880557 2.00501E+13 Finley Gravity Mains Gravity Main PRIVATE LAND FB/4 TO FB/3 91M 14 2024 $18,069.15 552880158 2.00501E+13 Finley Gravity Mains Gravity Main PRIVATE LAND FF/1 TO FB/1A 12M 14 2024 $1,865.05 552880364 2.00501E+13 Finley Gravity Mains Gravity Main PRIVATE LAND FF/2 TO FF/1 52M 14 2024 $8,042.39 552880299 2.00501E+13 Finley Gravity Mains Gravity Main PRIVATE LAND FF/DE TO FF/2 37M 14 2024 $4,021.56 552880288 2.00501E+13 Finley Gravity Mains Gravity Main PRIVATE LAND FH/DE TO F/2 33M 14 2024 $3,661.67 552880151 2.00501E+13 Finley Gravity Mains Gravity Main PRIVATE LAND AB/1 TO PS/A 7M 14 2024 $1,823.71 552880452 2.00501E+13 Finley Gravity Mains Gravity Main PRIVATE LAND AB/2 TO AB/1 68M 14 2024 $17,324.78 552880374 2.00501E+13 Finley Gravity Mains Gravity Main PRIVATE LAND AB/3 TO AB/2 55M 14 2024 $13,871.90 552880291 2.00501E+13 Finley Gravity Mains Gravity Main PRIVATE LAND AE/5 TO AE/4 34M 14 2024 $3,694.44 552880242 2.00501E+13 Finley Gravity Mains Gravity Main PRIVATE LAND AM/DE TO AA/6 29M 14 2024 $3,168.76 552880243 2.00501E+13 Finley Gravity Mains Gravity Main PRIVATE LAND AN/DE TO AB/12 29M 14 2024 $3,172.76 552880249 2.00501E+13 Finley Gravity Mains Gravity Main PRIVATE LAND AS/DE TO AB/10 30M 14 2024 $3,197.98 552880532 2.00502E+13 Finley Gravity Mains Gravity Main PRIVATE LAND AV/1 TO A/9 82M 14 2024 $12,727.34 552880375 2.00501E+13 Finley Gravity Mains Gravity Main PRIVATE LAND AX/1 TO A/1 55M 14 2024 $10,828.38 552880512 2.00501E+13 Finley Gravity Mains Gravity Main PRIVATE LAND BG/5 TO BG/4 80M 14 2024 $15,847.94 552880535 2.00502E+13 Finley Gravity Mains Gravity Main PRIVATE LAND BG/6 TO BG/5 80M 14 2024 $12,757.65 552880323 2.00502E+13 Finley Gravity Mains Gravity Main PRIVATE LAND BG/7 TO BG/6 35M 14 2024 $4,671.59 552880305 2.00606E+13 Finley Gravity Mains Gravity Main PRIVATE LAND BH/3 TO BH/2 40M 14 2024 $4,350.86 552880338 2.00701E+13 Finley Gravity Mains Gravity Main PRIVATE LAND BH/4 TO BH/3 45M 14 2024 $6,988.07 552880325 2.00502E+13 Finley Gravity Mains Gravity Main PRIVATE LAND BH/5 TO BH/4 43M 14 2024 $6,671.06 552880380 2.00502E+13 Finley Gravity Mains Gravity Main PRIVATE LAND BH/6 TO BH/5 55M 14 2024 $8,576.12 552880262 2.00502E+13 Finley Gravity Mains Gravity Main PRIVATE LAND BH/7 TO BH/6 30M 14 2024 $4,672.28 552880257 2.00502E+13 Finley Gravity Mains Gravity Main PRIVATE LAND BH/DE TO BH/7 30M 14 2024 $3,261.46 552880328 2.00502E+13 Finley Gravity Mains Gravity Main PRIVATE LAND BI/1 TO BH/3 43M 14 2024 $6,690.57 552880228 2.00502E+13 Finley Gravity Mains Gravity Main PRIVATE LAND BI/DE TO BI/1 28M 14 2024 $3,060.03 552880454 2.00502E+13 Finley Gravity Mains Gravity Main PRIVATE LAND BJ/1 TO BI/1 68M 14 2024 $7,437.41 552880222 2.00502E+13 Finley Gravity Mains Gravity Main PRIVATE LAND BK/DE TO BH/6 27M 14 2024 $2,969.54 552880301 2.00501E+13 Finley Gravity Mains Gravity Main PRIVATE LAND CD/4 TO CD/3 37M 14 2024 $4,048.27 55
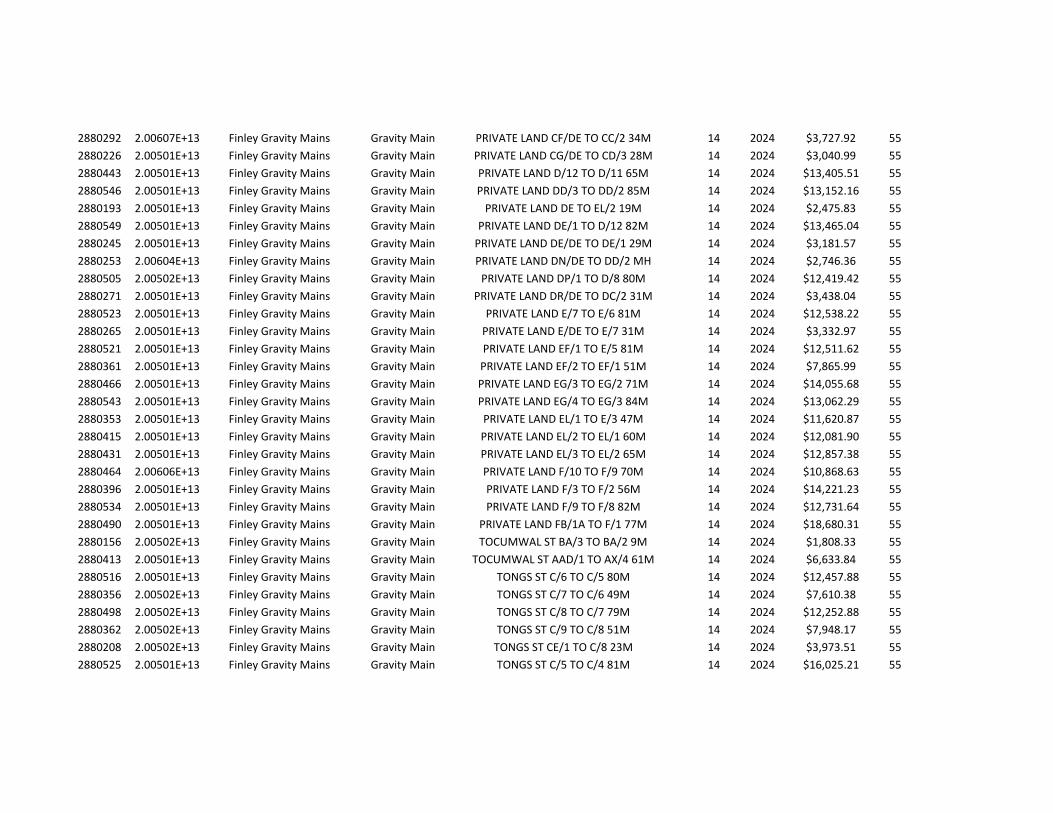
2880292 2.00607E+13 Finley Gravity Mains Gravity Main PRIVATE LAND CF/DE TO CC/2 34M 14 2024 $3,727.92 552880226 2.00501E+13 Finley Gravity Mains Gravity Main PRIVATE LAND CG/DE TO CD/3 28M 14 2024 $3,040.99 552880443 2.00501E+13 Finley Gravity Mains Gravity Main PRIVATE LAND D/12 TO D/11 65M 14 2024 $13,405.51 552880546 2.00501E+13 Finley Gravity Mains Gravity Main PRIVATE LAND DD/3 TO DD/2 85M 14 2024 $13,152.16 552880193 2.00501E+13 Finley Gravity Mains Gravity Main PRIVATE LAND DE TO EL/2 19M 14 2024 $2,475.83 552880549 2.00501E+13 Finley Gravity Mains Gravity Main PRIVATE LAND DE/1 TO D/12 82M 14 2024 $13,465.04 552880245 2.00501E+13 Finley Gravity Mains Gravity Main PRIVATE LAND DE/DE TO DE/1 29M 14 2024 $3,181.57 552880253 2.00604E+13 Finley Gravity Mains Gravity Main PRIVATE LAND DN/DE TO DD/2 MH 14 2024 $2,746.36 552880505 2.00502E+13 Finley Gravity Mains Gravity Main PRIVATE LAND DP/1 TO D/8 80M 14 2024 $12,419.42 552880271 2.00501E+13 Finley Gravity Mains Gravity Main PRIVATE LAND DR/DE TO DC/2 31M 14 2024 $3,438.04 552880523 2.00501E+13 Finley Gravity Mains Gravity Main PRIVATE LAND E/7 TO E/6 81M 14 2024 $12,538.22 552880265 2.00501E+13 Finley Gravity Mains Gravity Main PRIVATE LAND E/DE TO E/7 31M 14 2024 $3,332.97 552880521 2.00501E+13 Finley Gravity Mains Gravity Main PRIVATE LAND EF/1 TO E/5 81M 14 2024 $12,511.62 552880361 2.00501E+13 Finley Gravity Mains Gravity Main PRIVATE LAND EF/2 TO EF/1 51M 14 2024 $7,865.99 552880466 2.00501E+13 Finley Gravity Mains Gravity Main PRIVATE LAND EG/3 TO EG/2 71M 14 2024 $14,055.68 552880543 2.00501E+13 Finley Gravity Mains Gravity Main PRIVATE LAND EG/4 TO EG/3 84M 14 2024 $13,062.29 552880353 2.00501E+13 Finley Gravity Mains Gravity Main PRIVATE LAND EL/1 TO E/3 47M 14 2024 $11,620.87 552880415 2.00501E+13 Finley Gravity Mains Gravity Main PRIVATE LAND EL/2 TO EL/1 60M 14 2024 $12,081.90 552880431 2.00501E+13 Finley Gravity Mains Gravity Main PRIVATE LAND EL/3 TO EL/2 65M 14 2024 $12,857.38 552880464 2.00606E+13 Finley Gravity Mains Gravity Main PRIVATE LAND F/10 TO F/9 70M 14 2024 $10,868.63 552880396 2.00501E+13 Finley Gravity Mains Gravity Main PRIVATE LAND F/3 TO F/2 56M 14 2024 $14,221.23 552880534 2.00501E+13 Finley Gravity Mains Gravity Main PRIVATE LAND F/9 TO F/8 82M 14 2024 $12,731.64 552880490 2.00501E+13 Finley Gravity Mains Gravity Main PRIVATE LAND FB/1A TO F/1 77M 14 2024 $18,680.31 552880156 2.00502E+13 Finley Gravity Mains Gravity Main TOCUMWAL ST BA/3 TO BA/2 9M 14 2024 $1,808.33 552880413 2.00501E+13 Finley Gravity Mains Gravity Main TOCUMWAL ST AAD/1 TO AX/4 61M 14 2024 $6,633.84 552880516 2.00501E+13 Finley Gravity Mains Gravity Main TONGS ST C/6 TO C/5 80M 14 2024 $12,457.88 552880356 2.00502E+13 Finley Gravity Mains Gravity Main TONGS ST C/7 TO C/6 49M 14 2024 $7,610.38 552880498 2.00502E+13 Finley Gravity Mains Gravity Main TONGS ST C/8 TO C/7 79M 14 2024 $12,252.88 552880362 2.00502E+13 Finley Gravity Mains Gravity Main TONGS ST C/9 TO C/8 51M 14 2024 $7,948.17 552880208 2.00502E+13 Finley Gravity Mains Gravity Main TONGS ST CE/1 TO C/8 23M 14 2024 $3,973.51 552880525 2.00501E+13 Finley Gravity Mains Gravity Main TONGS ST C/5 TO C/4 81M 14 2024 $16,025.21 55
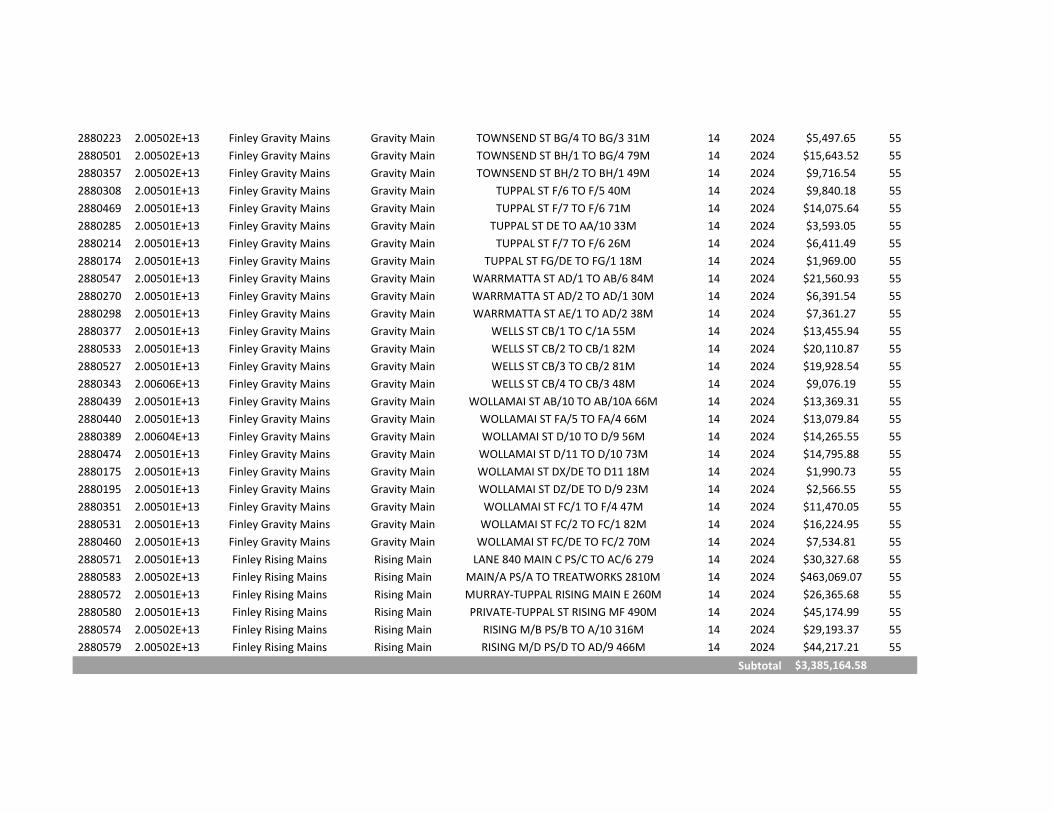
2880223 2.00502E+13 Finley Gravity Mains Gravity Main TOWNSEND ST BG/4 TO BG/3 31M 14 2024 $5,497.65 552880501 2.00502E+13 Finley Gravity Mains Gravity Main TOWNSEND ST BH/1 TO BG/4 79M 14 2024 $15,643.52 552880357 2.00502E+13 Finley Gravity Mains Gravity Main TOWNSEND ST BH/2 TO BH/1 49M 14 2024 $9,716.54 552880308 2.00501E+13 Finley Gravity Mains Gravity Main TUPPAL ST F/6 TO F/5 40M 14 2024 $9,840.18 552880469 2.00501E+13 Finley Gravity Mains Gravity Main TUPPAL ST F/7 TO F/6 71M 14 2024 $14,075.64 552880285 2.00501E+13 Finley Gravity Mains Gravity Main TUPPAL ST DE TO AA/10 33M 14 2024 $3,593.05 552880214 2.00501E+13 Finley Gravity Mains Gravity Main TUPPAL ST F/7 TO F/6 26M 14 2024 $6,411.49 552880174 2.00501E+13 Finley Gravity Mains Gravity Main TUPPAL ST FG/DE TO FG/1 18M 14 2024 $1,969.00 552880547 2.00501E+13 Finley Gravity Mains Gravity Main WARRMATTA ST AD/1 TO AB/6 84M 14 2024 $21,560.93 552880270 2.00501E+13 Finley Gravity Mains Gravity Main WARRMATTA ST AD/2 TO AD/1 30M 14 2024 $6,391.54 552880298 2.00501E+13 Finley Gravity Mains Gravity Main WARRMATTA ST AE/1 TO AD/2 38M 14 2024 $7,361.27 552880377 2.00501E+13 Finley Gravity Mains Gravity Main WELLS ST CB/1 TO C/1A 55M 14 2024 $13,455.94 552880533 2.00501E+13 Finley Gravity Mains Gravity Main WELLS ST CB/2 TO CB/1 82M 14 2024 $20,110.87 552880527 2.00501E+13 Finley Gravity Mains Gravity Main WELLS ST CB/3 TO CB/2 81M 14 2024 $19,928.54 552880343 2.00606E+13 Finley Gravity Mains Gravity Main WELLS ST CB/4 TO CB/3 48M 14 2024 $9,076.19 552880439 2.00501E+13 Finley Gravity Mains Gravity Main WOLLAMAI ST AB/10 TO AB/10A 66M 14 2024 $13,369.31 552880440 2.00501E+13 Finley Gravity Mains Gravity Main WOLLAMAI ST FA/5 TO FA/4 66M 14 2024 $13,079.84 552880389 2.00604E+13 Finley Gravity Mains Gravity Main WOLLAMAI ST D/10 TO D/9 56M 14 2024 $14,265.55 552880474 2.00501E+13 Finley Gravity Mains Gravity Main WOLLAMAI ST D/11 TO D/10 73M 14 2024 $14,795.88 552880175 2.00501E+13 Finley Gravity Mains Gravity Main WOLLAMAI ST DX/DE TO D11 18M 14 2024 $1,990.73 552880195 2.00501E+13 Finley Gravity Mains Gravity Main WOLLAMAI ST DZ/DE TO D/9 23M 14 2024 $2,566.55 552880351 2.00501E+13 Finley Gravity Mains Gravity Main WOLLAMAI ST FC/1 TO F/4 47M 14 2024 $11,470.05 552880531 2.00501E+13 Finley Gravity Mains Gravity Main WOLLAMAI ST FC/2 TO FC/1 82M 14 2024 $16,224.95 552880460 2.00501E+13 Finley Gravity Mains Gravity Main WOLLAMAI ST FC/DE TO FC/2 70M 14 2024 $7,534.81 552880571 2.00501E+13 Finley Rising Mains Rising Main LANE 840 MAIN C PS/C TO AC/6 279 14 2024 $30,327.68 552880583 2.00502E+13 Finley Rising Mains Rising Main MAIN/A PS/A TO TREATWORKS 2810M 14 2024 $463,069.07 552880572 2.00501E+13 Finley Rising Mains Rising Main MURRAY‐TUPPAL RISING MAIN E 260M 14 2024 $26,365.68 552880580 2.00501E+13 Finley Rising Mains Rising Main PRIVATE‐TUPPAL ST RISING MF 490M 14 2024 $45,174.99 552880574 2.00502E+13 Finley Rising Mains Rising Main RISING M/B PS/B TO A/10 316M 14 2024 $29,193.37 552880579 2.00502E+13 Finley Rising Mains Rising Main RISING M/D PS/D TO AD/9 466M 14 2024 $44,217.21 55
$3,385,164.58Subtotal

2880738 2.00612E+13 Tocumwal Gravity Mains Gravity Main BENT ST 15 2025 $3,928.40 55
$3,928.40
2880217 2.00607E+13 Finley Gravity Mains Gravity Main WELLS ST 17 2027 $2,928.64 552881137 2.00706E+13 Finley Pump Stations Pump Station SHOWGROUND 17 2027 $175,275.00 48
$178,203.64
2880098 2.00409E+13 Berrigan Gravity Mains Gravity Main COBRAM ST BERR BD/2 TO BD/1 73M 18 2028 $14,400.12 552879976 2.00409E+13 Berrigan Gravity Mains Gravity Main COBRAM ST BERR DE TO BD/2 35M 18 2028 $3,750.11 55
$18,150.23Subtotal
Program Total $13,652,768.35
Subtotal
Subtotal

BERRIGAN COUNCIL - STRATEGIC ACTION PLANNING (SEWERAGE) ESTIMATED COSTS ($)CAPITAL WORKS (Sewerage)
Data Source 09/10 10/11 11/12 12/13 13/14 14/15 15/16 16/17 17/18 18/19 19/20 20/21 21/22 22/23 23/24 24/25 25/26 26/27 27/28 28/29 29/30 TotalMajor works Berrigan 0
Finley: 0
Barooga: 0
Tocumwal: 0
Sub-total (major works) 0 0 0 0 0 0 0 0 0 0 0 0 0 0 0 0 0 0 0 0 0 00
Minor New Works 0General 0Alternative power supply arrangements for PS 0Upgrade the telemetry system 10,000 5,000 5,000 5,000 5,000 5,000 5,000 5,000 45,000Berrigan 0Desilt primary pond 50,000 50,000Desilt the sludge lagoons 20,000 20,000 40,000Bank L shaped Pond 13000 13,000Barooga 0Desilt primary pond 50,000 50,000Gravel Pond Banks 9,000 9,000Effluent Recycling System 7,000 7,000Rock Beaching to Ponds 20,000 20,000Finley 0Desilt primary pond 50,000 50,000Desilt the sludge lagoons 35,000 30,000 65,000Overflow/Transfer line for the ponds 3,000 3,000Improve OH & S conditions for gaining access to recycling pump 3,000 3,000Gravel Pond Banks 10,000 10,000Tocumwal 0Desilt the maturation pond 25,000 25,000Bypass line and control valve on the S. dam outlet 7,000 7,000New line and stop valve to bypass the first "old" pond 12,000 12,000Upgrade the central column of the trickling filter 25,000 25,000Sludge treatment lagoon 0Safety Rail to Concrete Path 3,000 3,000Lock Up Storage 3,000 3,000Gravel Pond Banks 7000 7,000Sub-total (Minor works) 7,000 108,000 45,000 20,000 12,000 50,000 50,000 55,000 25,000 5,000 0 0 5,000 0 0 5,000 0 35,000 0 25,000 0 447,000
Renewals:General
SBP App B Digester Valves 10,000 20,000 20,000 50,000STP exposed pipe Works 30,000 30,000Trickling Filter Arm 60,000 60,000 120,000Replace/Upgrade central column of trickling filter 60,000Upgrade ammenities at STP's 20,000Berrigan:Refurbish concrete work TF, ST, Channel 40,000
SBP App B Pump/valve Replacement (STP) 15,000 20,000 35,000SBP App B Pump Stations upgrade 10,000 10,000 20,000 10,000 30,000 25,000 25,000 130,000
Truck Wash Avdata/Pump 10,000 10,000 20,000Trickling Filter Arm 20,000 20,000 40,000Sewer Replacement 5,000 5,000 30,000 40,000 40,000 100,000 100,000 320,000other minor works 20,000 20,000 20,000 20,000 20,000 20,000 20,000 20,000 20,000 30,000 30,000 30,000 30,000 30,000 30,000 30,000 30,000 30,000 30,000 30,000 510,000Finley:Truck Wash Avdata/Pump 10,000 10,000 20,000Refurbish concrete work 10,000replace slip rings of the clarifiers 2,500 2,500 2,500 2,500STP effluent pump 6,000 8,000 14,000STP exposed pipe Works 15,000 15,000Sewer Replacement 5,000 5,000 10,000 10,000 40,000 40,000 100,000 210,000other minor works 20,000 20,000 20,000 20,000 20,000 20,000 20,000 20,000 20,000 30,000 30,000 30,000 30,000 30,000 30,000 30,000 30,000 30,000 30,000 30,000 510,000Barooga: 0Desilt the sludge lagoons 50,000
SBP App B Pump Stations upgrade 52,000 15,000 5,000 20,000 20,000 20,000 20,000 152,000Fencing 20,000 20,000Sewer Replacement 0Other minor works 10,000 10,000 10,000 10,000 10,000 10,000 10,000 10,000 10,000 10,000 20,000 20,000 20,000 20,000 20,000 20,000 20,000 20,000 20,000 20,000 300,000Tocumwal 0Operation/enveng/data/capitalworkssewer
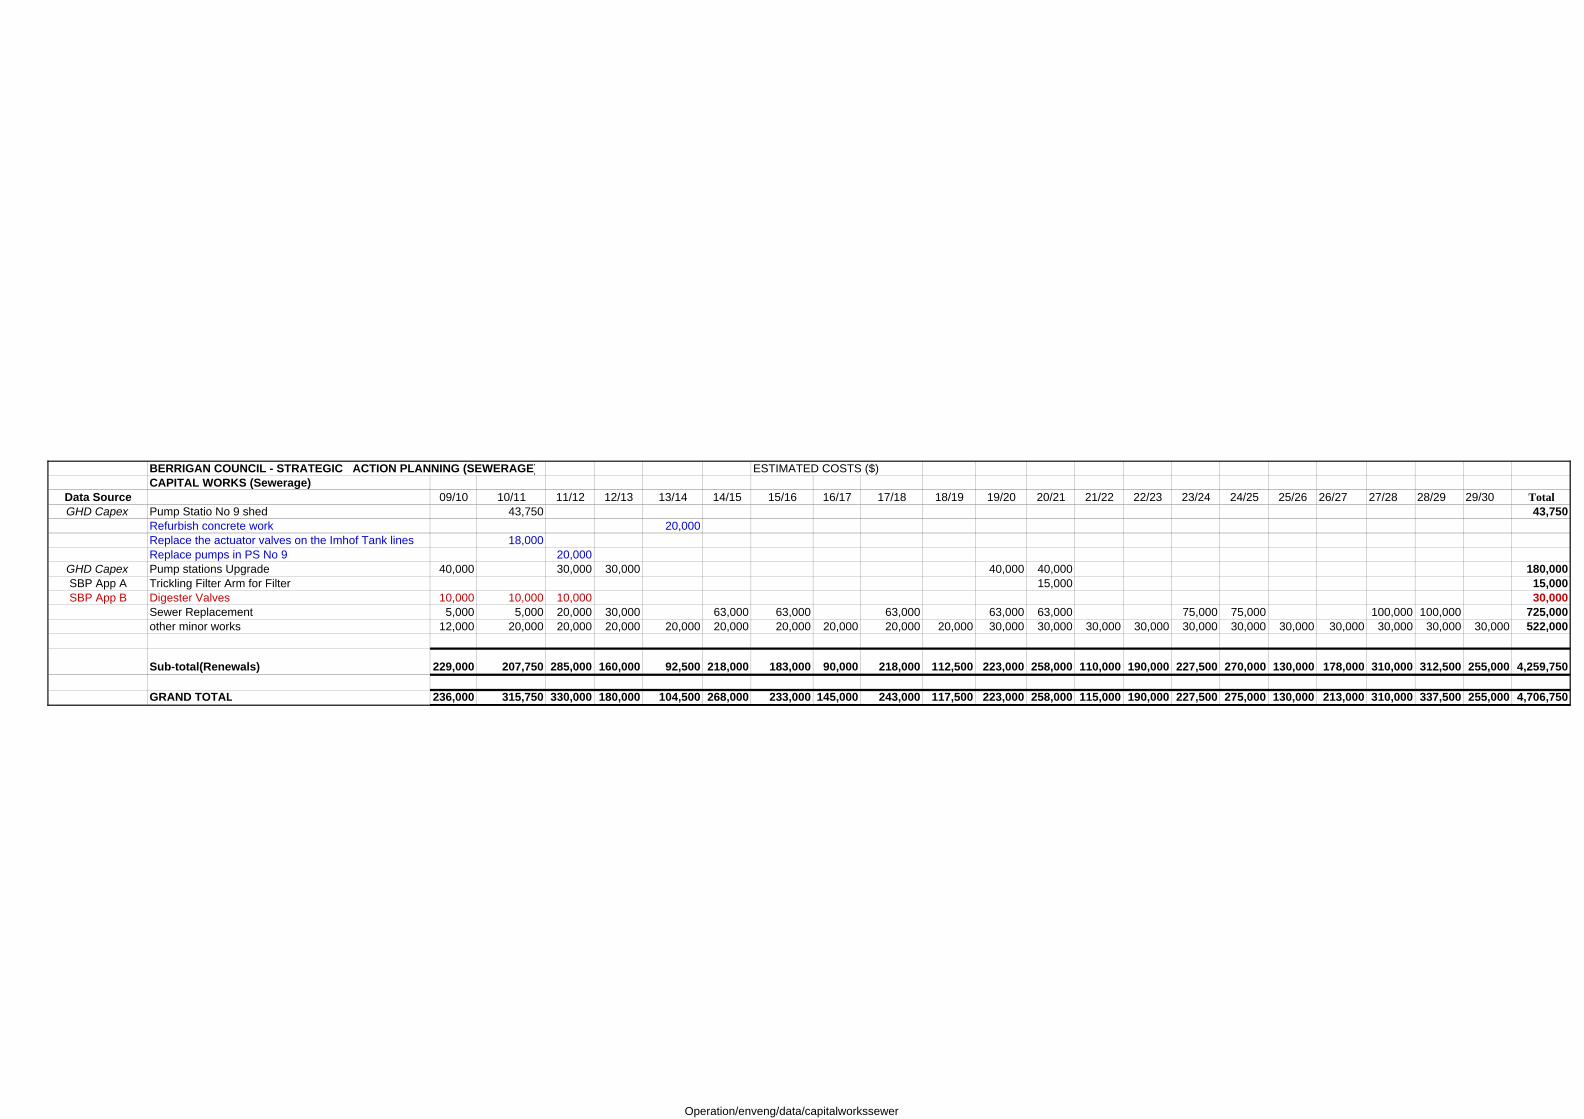
BERRIGAN COUNCIL - STRATEGIC ACTION PLANNING (SEWERAGE) ESTIMATED COSTS ($)CAPITAL WORKS (Sewerage)
Data Source 09/10 10/11 11/12 12/13 13/14 14/15 15/16 16/17 17/18 18/19 19/20 20/21 21/22 22/23 23/24 24/25 25/26 26/27 27/28 28/29 29/30 TotalGHD Capex Pump Statio No 9 shed 43,750 43,750
Refurbish concrete work 20,000Replace the actuator valves on the Imhof Tank lines 18,000Replace pumps in PS No 9 20,000
GHD Capex Pump stations Upgrade 40,000 30,000 30,000 40,000 40,000 180,000SBP App A Trickling Filter Arm for Filter 15,000 15,000SBP App B Digester Valves 10,000 10,000 10,000 30,000
Sewer Replacement 5,000 5,000 20,000 30,000 63,000 63,000 63,000 63,000 63,000 75,000 75,000 100,000 100,000 725,000other minor works 12,000 20,000 20,000 20,000 20,000 20,000 20,000 20,000 20,000 20,000 30,000 30,000 30,000 30,000 30,000 30,000 30,000 30,000 30,000 30,000 30,000 522,000
Sub-total(Renewals) 229,000 207,750 285,000 160,000 92,500 218,000 183,000 90,000 218,000 112,500 223,000 258,000 110,000 190,000 227,500 270,000 130,000 178,000 310,000 312,500 255,000 4,259,750
GRAND TOTAL 236,000 315,750 330,000 180,000 104,500 268,000 233,000 145,000 243,000 117,500 223,000 258,000 115,000 190,000 227,500 275,000 130,000 213,000 310,000 337,500 255,000 4,706,750
Operation/enveng/data/capitalworkssewer

Appendix "D"
Cashflow Units Jun-10 Jun-11 Jun-12 Jun-13 Jun-14 Jun-15 Jun-16 Jun-17 Jun-18 Jun-19 TotalsGrowth Factor 1.9% 1.9% 1.9% 1.9% 1.9% 1.9% 1.9% 1.9% 1.9% 1.9%Inflation Factor 1.0% 1.0% 1.0% 1.0% 1.0% 1.0% 1.0% 1.0% 1.0% 1.0%Assessments 3,300 3,300 3,361 3,423 3,486 3,550 3,616 3,683 3,751 3,820 3,891
Brought Forward 2,697.0 3,100.7 3,456.4 3,818.4 4,371.0 5,038.2 5,585.6 6,206.8 6,958.7 7,660.4
Reserve 2,697.0
Receipts:Rates 1,202.50$ 1,203 1,225 1,248 1,271 1,295 1,319 1,343 1,368 1,393 1,419 13,083.5Interest on Investment @ 4.0% 107.9 124.0 138.3 152.7 174.8 201.5 223.4 248.3 278.3 306.4 1,955.6Contributions 5 5 5 5 5 5 5 5 5 5 5 50.0Total Receipts 1,315.4 1,354.0 1,391.3 1,428.7 1,474.8 1,525.5 1,571.4 1,621.3 1,676.3 1,730.4 15,089.1
Payments:Management 308.5 311.6 314.7 317.8 321.0 324.2 327.4 330.7 334.0 337.3 3,227.2Maintenance 367.2 370.9 374.6 378.3 382.1 385.9 389.8 393.7 397.6 401.6 3,841.7Debt Redemption @ 7% -$ 0.0 0.0 0.0 0.0 0.0 0.0 0.0 0.0 0.0 0.0 0.0Interest on Overdraft @ 0.0% 0.0 0.0 0.0 0.0 0.0 0.0 0.0 0.0 0.0 0.0Capital Works 236.0 315.8 340.0 180.0 104.5 268.0 233.0 145.0 243.0 117.5 2,182.8Total Payments 911.7 998.3 1,029.3 876.1 807.6 978.1 950.2 869.4 974.6 856.4 9,251.7
Carried Forward 2,697.0 3,100.7 3,456.4 3,818.4 4,371.0 5,038.2 5,585.6 6,206.8 6,958.7 7,660.4 8,534.4 5,837.4
Annual Average Life Cycle Cost 1092 1,092.0 1,102.9 1,113.9 1,125.0 1,136.3 1,147.7 1,159.2 1,170.8 1,182.5 1,194.3 11,424.6Sustainability Cost (AALCC + Management) 1,400.5 1,414.5 1,428.6 1,442.8 1,457.3 1,471.9 1,486.6 1,501.5 1,516.5 1,531.6 14,651.8
Receipts - SC -85.1 -60.5 -37.3 -14.1 17.5 53.6 84.8 119.8 159.8 198.8 437.3Life Cycle Sustainability Index 0.94 0.96 0.97 0.99 1.01 1.04 1.06 1.08 1.11 1.13
Projected Renewal Costs+Upgrade 80.3 108.0 45.0 20.0 1,414.2 2,649.7 50.0 1,106.7 25.0 5.0
Total Projected Payments 756.0 790.5 734.3 716.1 2,117.3 3,359.8 767.2 1,831.1 756.6 743.9 7,068.9Receipts - TPP 559.5 563.5 657.0 712.6 -642.5 -1,834.3 804.2 -209.8 919.7 986.5 8,020.2
10 YEAR FINANCIAL PLAN
G:\Management\MANUAL\PLANS\Asset Management Plans\Sewer Asset Management Plan Oct 2009\Sewer 10Financial PlanSewer 10Financial Plan