sewage plume in a sand and gravel aquifer, … · otis air force base sewage treatment facility 5...
TRANSCRIPT

Sewage Plume in aSand and Gravel Aquifer,
Cape Cod,
Massachusetts
United States Geological S u rvey Water-Supply Paper 2218
Prepared in cooperation with the Massachusetts Department of Environmental Quality Engineering Division of Water Pollution Control

Sewage Plume in aSand and Gravel Aquifer,Cape Cod, Massachusetts
By Dennis R . LeBlanc
Prepared in cooperation with the Massachusetts Department of Environmental Quality Engineering Division of Water Pollution Control

������
DEPARTMENT OF THE INTERIOR WILLIAM P. CLARK, Secretary
U.S . GEOLOGICAL SURVEY Dallas L . Peck, Director
UNITED STATES GOVERNMENT PRINTING OFFICE, WASHINGTON : 1984
For sale by Distribution Branch U.S . Geological Survey 604 South Pickett Street Alexandria, Virginia 22304
Library of Congress Cataloging in Publication Data
LeBlanc, Denis R.Sewage plume in a sand and gravel aquifer, Cape Cod, Massachusetts.
(U .S . Geological Survey water-supply paper ; 2218)Bibliography 28 p.Supt. of Docs . no . : 119.13 :22181. Water, Underground-Pollution-Massachusetts-Cape Cod 2. Sewage disposal in the ground-Mas
sachusetts-Cape Cod I . Massachusetts. Division of Water pollution Control II . Title III . Series : U.S . Geological Survey water-supply paper ; 2218 TD225.C253L43 1984 628.3'62 82-600319

�������������������������������������
CONTENTS Abstract 1Introduction 1
Purpose 1Objectives and approach 3Definition of terms 3Acknowledgments 3
Physical and cultural setting 3Otis Air Force Base sewage treatment facility 5Aquifer at Otis Air Force Base 5
Hydrogeology 5Hydrology 7
Results of chemical analyses 9Introduction 9Maps and sections used to present results 9Selected constituents and properties 11
Specific conductance and temperature 11Boron 13Chloride and sodium 13Phosphorus 14Nitrogen 18Ammonia, nitrate, and dissolved oxygen 18Detergents 20
Discussion 22Processes that affect the distribution of contaminants in the plume 22Vertical location of the plume 24Path of the plume 25
Summary 25Selected references 27
FIGURES
1 . Map showing study area 22 . Map showing physical and cultural features 43 . Photograph showing Otis Air Force Base sewage treatment plant 64 . Graph showing volume of sewage treated at the Otis Air Force Base treatment
plant from 1936 through 1980 75 . Geologic section showing hydrogeologic units in the study area 76 . Map showing water-table contours and direction of ground-water flow 87 . Idealized diagram showing relationship between the center of the plume and
the map and sections used to describe the distributions of contaminants 118 . Map showing areal distribution of specific conductance and temperature of ground
water 129 . Longitudinal and transverse sections showing vertical distribution of boron in
ground water 1410 . Map showing areal distribution of chloride and sodium in ground water 1511 . Longitudinal sections showing vertical distribution of chloride and sodium in
ground water 1612 . Map showing areal distribution of phosphorus in ground water 1713 . Map showing areal distribution of nitrogen in ground water 19
Contents III

�������
FIGURES
14 . Longitudinal sections showing vertical distribution of ammonia, nitrate, and dissolved oxygen in ground water . 20
15 . Longitudinal and transverse sections showing vertical distribution of detergentsin ground water 21
16 . Map showing the relationship between the water table and the distributions of boron, phosphorus, and detergents in the plume 23
17 . Longitudinal section showing vertical location of the plume as shown by the distribution of boron in ground water 24
18 . Map showing area and projected path of plume 26
TABLES
l . Five phases of study 3 2 . Chemical analyses showing quality of treated sewage, contaminated ground
water in the plume, and uncontaminated ground water 10
Metric Conversion Factors The following factors may be used to convert inch-pound units to the International
System of Units (SI) .
Multiply inch-pound units
inch (in) foot (ft) mile (mi) square mile (mil) acre gallon (gal) million gallons (Mgal) billion gallons (13gal) inch per year (in/yr) foot per day (ft/d) foot per mile (ft/mi) million gallons per day (Mgal/d) micromho (amho)
By
2 .540 0 .3048 1 .609 2 .590 0 .4047 3 .785
3,785 3,785,000
25 .4 0 .3048 0 .1894
3,785 1 .000
To obtain SI Units
centimeter (cm) meter (m) kilometer (km) square kilometer (km2) square hectometer (hm2) liter (L) cubic meter (m3 ) cubic meter (m3 ) millimeter per year (mm/a) meter per day (m/d) meter per kilometer (m/km) cubic meters per day (m3/d) microsiemen (WS)
NGVD of 1929 (National Geodetic Vertical Datum of 1929) : A geodetic vertical datum derived from a general adjustment of the first-order level nets of both the United States and Canada, formerly called mean sea level . NGVD of 1929 is referred to as sea level in this report .
IV Contents

Sewage Plume in a Sand and Gravel Aquifer,Cape Cod, Massachusetts
By Denis R. LeBlanc
Abstract
Secondarily treated domestic sewage has been disposed of on surface sand beds at the sewage treatment facility at Otis Air Force Base, Massachusetts, since 1936 . Infiltration of the sewage through the sand beds into the underlying unconfined sand and gravel aquifer has resulted in a plume of sewage-contaminated ground water that is 2,500 to 3,500 feet wide, 75 feet thick, and more than 11,000 feet long . The plume extends south and southwest of the sand beds in the same direction as the regional flow of ground water, and is overlain by 20 to 50 feet of ground water derived from precipitation that recharges the aquifer. The bottom of the plume generally coincides with the contact between the permeable sand and gravel and underlying finer grained sediments.
The distributions in the aquifer of specific conductance, temperature, boron, chloride, sodium, phosphorus, nitrogen (total of all species), ammonia, nitrate, dis solved oxygen, and detergents are used to delineate the plume . In ground water outside the plume, the detergent concentration is less than 0.1 milligrams per liter as MBAs (methylene blue active substances), the ammonia-nitrogen concentration is less than 0.1 milligrams per liter, the boron concentration is less than 50 micrograms per liter, and specific conductance is less than 80 micromhos per centimeter . In the center of the plume, deter-gent concentrations as high as 2 .6 milligrams per liter as MBAS, ammonia-nitrogen concentrations as high as 20 milligrams per liter, boron concentrations as high as 400 micrograms per liter, and specific conductance as high as 405 micromhos per centimter were measured .
Chloride, sodium, and boron are transported by the southward-flowing ground water without significant retardation, and seem to be diluted only by hydro dynamic dispersion . The movement of phosphorus is greatly restricted by sorption . Phosphorus concentrations do not exceed 0.05 milligrams per liter farther than 2,500 feet from the sand beds . Detergent concentrations in the plume are highest between 3,000 and 10,000 feet from the sand beds and reflect the introduction of nonbiodegradable detergents in 1946 and the conversion to biodegradable detergents in 1964 .
The center of the plume as far as 5,000 feet from the sand beds contains nitrogen as ammonia, but no nitrate and no dissolved oxygen . Ammonia is gradually oxidized to nitrate between 5,000 and 8,000 feet from the sand beds, and at distances greater than 8,000 feet oxidation of ammonia is essentially complete . Ammonia
also is oxidized to nitrate along the top and sides of the plume within 5,000 feet of the beds where the contaminated ground water mixes with uncontaminated ground water that contains up to 11 milligrams per liter dissolved oxygen .
INTRODUCTION
Effluent produced by sewage treatment facilities commonly is discharged to surface water or onto land surface . One method of land disposal of treated sewage-in filtration-percolation or rapid infiltration-has been used at Otis AFB (Air Force Base), Cape Cod, Mass . (fig . 1) since 1936 . At the Otis AFB facility, the treatment-plant effluent is discharged onto 12 acres of rectangular sand beds . The effluent then rapidly infiltrates the ground and percolates to the water table . Infiltration-percolation is used to dispose of treated sewage to the ground at other locations in Massachusetts and has been proposed for use by several communities on Cape Cod.
Rapid infiltration of treated sewage has caused contamination of ground water at other sites where this method of land disposal is used (Preul, 1968 ; Schmidt, 1973; Bouwer, 1973 ; Aulenbach and Tofflemire, 1975 ; Hughes, 1975; Koerner and Haws, 1979 ; Cox, 1979) . Be-cause most rapid-infiltration facilities in Massachusetts are located on sand and gravel aquifers and many communities in the State obtain most or all of their water supplies from these aquifers, the public and water-supply officials are concerned that land disposal of sewage may adversely affect the chemical quality of ground water.
Purpose
Because of local, State, and Federal concern about the effects of land disposal of sewage on ground-water quality, the U.S . Geological Survey, in cooperation with the Massachusetts Department of Environmental Quality Engineering, Division of Water Pollution Control, has studied the impact on ground-water quality of 45 years of sewage disposal at the Otis AFB sewage treatment facility . The purposes of the study were (1) to describe the extent and chemical composition of the zone of contaminated ground water at the Otis AFB facility and (2) to
Introduction 1

����
---
11100' 73 100' 72°30' 72 100' 71130' _r,+ -.I_--i
7000'
70° 40' 35' 701 30'
41 140'
NANTI!CKF 1 11)01'N1)
10 KILOMETERS
5 MILES EXPLANATION
STUDY AREA-Area shown in figures 2, 6, 8, 10, 12, 13, and 16
TOWN BOUNDARY
Figure 1 . Study area .
2 Sewage Plume in a Sand and Gravel Aquifer

�������
provide, through a detailed study at one site, a basis for evaluating the potential for ground-water contamination at the other land-disposal sites in the State .
Objectives and Approach
The objectives of the study were to (1) determine the lateral and vertical extent of the zone of sewage-contaminated ground water in the aquifer, and (2) determine the concentrations of dissolved substances in the contaminated zone . The approach used to meet these objectives is outlined in table 1 . Information about ground-water quality and ground-water flow in the Otis AFB area (Meade and Vaccaro, 1971 ; Palmer, 1977) and on Cape Cod in general (Frimpter and Gay, 1979 ; Guswa and LeBlanc, 1981) were used to design the approach .
Definition of Terms
In this report, ground water that contains dissolved substances introduced into the aquifer by sewage disposal at the Otis AFB treatment facility is referred to as contami-
Table 1 . Five phases of study
PHASE 1 : Assemble and interpret data collected during earlier studies . Determine the most likely path of plumefrom preliminary water-table map and water-qualityinformation .
PHASE 2 : Locate private wells along likely path of plume,and collect and analyze water samples for specificconductance, nitrate, ammonia, and chloride to de tect contaminated zone . Determine the chemical composition of the treated sewage .
PHASE 3 : Design a network of observation wells . Drill wells, measure water levels, and collect and analyze water samples to (1) improve water-table map and (2) determine the general location of plume .
PHASE 4 : Design a second-level network of observation sites . Drill test holes and collect water samples for chemical analysis in the field during drilling to guideselection of screen-setting depths and subsequentdrilling sites . Install clusters of wells screened at different depths to sample the center and boundaries of plume .
PHASE 5 : Analyze lithologic, hydrologic, and chemical data to describe the location and chemical compositionof the plume .
nated ground water . The body of contaminated ground water in the aquifer is referred to as the plume . The waste-water treated at the Otis AFB facility is referred to as sewage because the wastewater is generated primarily by domestic sources .
Acknowledgments
The author thanks the many persons who have kindly given time, information, and guidance during this study . Particular thanks are given to persons in the Geological Survey who assisted in the data collection and the preparation of this report and to the following individuals and agencies : Edward Cox, Robert Shedlock, and Julio Olimpio of the Geological Survey, who reviewed the re-port ; Abram Peters, Otis Air Force Base ; Richard Witt, Falmouth Department of Public Works ; Lou Hambly, Massachusetts Division of Fisheries and Wildlife ; Ralph Vaccaro, Woods Hole Oceanographic Institution ; Francis G . Sullivan ; Paul Harvey ; Ernest Doherty ; the late Harold McMahon; and the Massachusetts Audubon Society .
PHYSICAL AND CULTURAL SETTING
The Otis AFB sewage treatment facility is located on a broad sand and gravel outwash plain that slopes gently southward to Nantucket Sound (fig . 1) . The treat ment facility is 7 miles south and 2 miles east of hills and ridges of recessional moraines which bound the out-wash plain and 4 miles north of the heads of several narrow saltwater bays which extend 2 miles inland from Nantucket Sound.
The study area includes 7 mil of the sand and gravel plain at and south of the sand beds at the Otis AFB sewage treatment plant (fig . 2) . The plain is pitted with many kettle holes, some of which contain ponds . The largest ponds are Coonamessett, Ashumet, and Johns Ponds (fig . 2) . The Coonamessett River, which flows south from Coonamessett Pond, is the only stream in the study area . Several broad valleys cross the outwash plain from north to south . The valleys contain a few wetlands and ponds, but most of the valleys do not contain streams . The Ashumet Valley (fig . 2) is 500 to 900 feet wide and 30 feet deep but contains no surface-water bodies except at its lower end near Nantucket Sound .
The study area south of Otis AFB is predominantly rural . A wildlife management area which contains fields and woodlands of pitch pine and oak covers 1 .9 mil . Two
Physical and Cultural Setting 3

�����
70° 34'
41° 38'
41° 37'
Base from U.S. Geological SCALE 1 :25 000 Survey, 1 :24,000; Falmouth, 0
500 1000 1500 METERS 1972 and Pocasset, 1967
Photorevised 1979 I- I
I
0 5000 FEET
CONTOUR INTERVAL 10 FEET
NATIONAL GEODETIC VERTICAL DATUM OF 1929
Figure 2. Physical and cultural features .
golf courses cover a total of 0.4 mil . Sandwich Road velopment along these routes . Most private homes in the and Route 151 are the major roads that pass through the area have been built since 1960 and are located near area . There has been little commercial and industrial de- Ashumet and Johns Ponds, Plum Hollow Road, and
4 Sewage Plume in aSand and Gravel Aquifer

�
Ashumet Valley north of Route 151 . These homes obtain drinking water from shallow small-diameter wells and use septic tanks and cesspools for wastewater disposal . Cranberry bogs along the Coonamessett River and several horse stables are the main agricultural activities in the area, although the wildlife management area occupies land once used for ranching and vegetable farming .
Otis AFB has been a military reservation since at least 1936 . During World War 11 the reservation housed as many as 70,000 troops, and between 1948 and 1973 the base was a major installation of the U .S . Air Force. Since 1973, the base has been used by the Massachusetts Air and Army National Guards and the U.S . Coast Guard .
OTIS AIR FORCE BASE SEWAGE TREATMENT FACILITY
The Otis AFB sewage treatment facility (fig . 3) provides secondary treatment to sewage produced on the base . A small treatment plant with 4 acres of sand beds served the base between 1936 and 1941 . The present treatment plant was constructed in 1941 at the site of the smaller plant . Primary treatment of the sewage consists of a comminutor with a bar screen, an aerated grease-removal unit, and Imhoff tanks . Secondary treatment consists of trick-ling filters and secondary settling tanks .
The treated sewage is discharged to 24 one-half-acre sand beds (fig . 3) . The beds are rectangular and have flat sandy surfaces . Each sand bed was designed to be flooded with an average of 125,000 gallons of treated sew-age per day . The treated sewage then infiltrates the ground and percolates to the water table . The surface of the beds is about 20 feet above the water table . Sediment cores collected at one bed from land surface to the water table showed 1 foot of sand, 2 feet of sandy loam and silt, and 18 feet of medium sand (Kerfoot and Ketchum, 1974, p . 20) .
The treatment plant was designed to treat an average of 3 Mgal/d and a maximum of 6 Mgal/d of sewage . However, actual sewage flows since World War II have been lower than the design rates . The estimated daily volume of sewage treated at the Otis AFB facility from 1936 through 1980 is shown in figure 4 . Records of the volume of sewage treated at the plant were available for only part of the 45-year period . Sewage flows for the remainder of the period were estimated from water-supply records and from the history of the base . Based on data from figure 4, eight billion gallons of sewage were treated at the Otis AFB facility from 1936 through 1980 .
Sludge from the treatment plant is dried on sludge-drying beds and transported for disposal to the Otis AFB landfill 2 .5 miles northwest of the plant . Sludge may have been stored or buried at the sewage treatment plant in the past .
The chemical quality of samples of the treated sew-age collected between January 1974 and August 1980 is summarized in table 2 . Few data are available on the chemical quality of the treated sewage prior to 1974 . Kerfoot and others (1975, p . 52-53) reported that the concentrations of some chemicals in the treated sewage, such as ammonia and nitrate, vary seasonally due to changes in air temperature that affect the treatment process . The concentrations of other substances in the treated sewage, such as detergents, have changed over longer periods as the type and quantity of chemicals used on the base have changed .
AQUIFER AT OTIS AIR FORCE BASE
Hydrogeology
The aquifer recharged by treated sewage at the Otis AFB facility is composed of sand, gravel, silt, and clay deposited during the retreat of the Pleistocene ice sheets from southern New England 14,000 years ago (Oldale, 1976, p . 1) . A hydrogeologic section of the aquifer through the study area is shown in figure 5 . The lithologic descriptions and stratigraphy were determined from samples collected from the test borings shown on the section and from 11 additional borings that penetrated to depths of more than 100 feet below land surface and are shown on the location map in figure 5 .
The top 90 to 140 feet of the aquifer is well sorted, brown, medium to very coarse sand with some gravel . North of Route 151, the sand and gravel outwash overlies fine to very fine sand and some silt . South of Route 151, the outwash overlies fine to very fine sand and silt and dense sandy till . The till contains lenses of silt and clay and sand and gravel . These unconsolidated sediments overlie crystalline bedrock . The bedrock surface generally slopes from west to east through the study area (Oldale, 1969, p . B123) .
Hydraulic conductivity is a measure of the ability of the aquifer sediments to transmit water and is defined as the volume of water at the existing kinematic viscosity that will move in a unit time under a unit hydraulic gradient through a unit area of the aquifer measured at right angles to the direction of flow . The hydraulic conductivity of the sediments was estimated by comparison with measured values of the hydraulic conductivity of similar sediments at other locations on Cape Cod (Guswa and Londquist, 1976 ; Guswa and LeBlanc, 1981) and from general relationships between grain-size distribution of sediments and hydraulic conductivity (Freeze and Cherry, 1979, p . 29 ; Todd, 1980, p . 71-72) . The estimated hydraulic conductivity of the sand and gravel outwash is 200 to 300 ft/d . The hydraulic conductivity of the fine to very fine sand and the sandy till is lower than the
Aquifer at Otis Air Force Base 5

�
Figure 3. View northwest of the Otis Air Force Base sewage treatment plant . Photograph courtesy of the U.S . Air National Guard .
hydraulic conductivity of the sand and gravel, but the The crystalline bedrock has a very low hydraulic magnitude of this difference cannot be estimated from conductivity compared to the hydraulic conductivity of the available data . unconsolidated sediments . Because of its very low hydrau-
6 Sewage Plume in a Sand and Gravel Aquifer

�������
2.0 i
Measured value z.a Estimated from water-supply records 30 Inferred from base history OerJ W u_ (L Water pumped for supplyw (/)
aoJ W J
0 w QOir -I 0.5W J
Q 0O LO O M O M O M O M O LO M M 't -It u) LO co to n n 00 00
1 T Q) (~! m ~?m
Figure 4 . Volume of sewage treated at the Otis Air Force Base treatment plant from 1936 through 1980 .
lic conductivity, the bedrock is assumed to be the bottom of the ground-water flow system .
Hydrology
Ground water in the aquifer occurs under unconfined, or water-table, conditions in which the top of the ground water is the water table . The water table slopes
NORTH Otis A.F .B . sand beds
A
r w w u_ Z_ w
F HJQ
EXPLANATION
to the south and southwest at 8 ft/mi (fig . 6) . The water-table contour map shown in figure 6 is based on water levels measured in 50 wells and 6 ponds during November 1979 . Water levels during this period were near average for the period of 1963-76 (Guswa and LeBlanc, 1981) . Seasonal variations in aquifer recharge cause the altitude of the water table to fluctuate 1 to 3 feet each year . The altitude of the water table is highest in the spring and lowest in late fall .
The primary sources of ground water are recharge by precipitation and inflow from adjacent parts of the aquifer . Surface runoff is negligible because the sandy soils are very permeable . Therefore, precipitation which does not return to the atmosphere by evaporation and transpiration recharges the aquifer . The estimated recharge to the aquifer is 21 in/yr, or about 45 percent of the aver-age annual precipitation . A method based on empirical correlations between evapotranspiration and climatic factors and developed by Thornthwaite and Mather (1957) was applied to climatic data to obtain this estimate .
The water-table contour map (fig . 6) shows that in-flow of ground water from adjacent parts of the aquifer occurs mostly across the northern boundary of the study area . The rate of inflow, 5 to 8 Mgal/d, was estimated from Darcy's Law and flow-net analysis of a regional water-table map (LeBlanc and Guswa, 1977) .
Ground water in the study area generally flows south
70' 34' 70 1 32'
41°38'
MEDIUM TO VERY COARSE SAND ; SOME GRAVEL
VERY FINE TO FINE SAND ; SOME SILT 41 ° 37'
DENSE TILL (HARDPAN), WITH LENSES AND LAYERS OF SAND, GRAVEL, SILT, AND CLAY
BEDROCK 0 1500 METERS
TEST BORING SITE-Lithologic data collected at site used to con-0 5000 FEET
struct section LOCATION OF SECTIONS AND TEST BORINGS
Figure 5 . Geologic section showing hydrogeologic units in the study area .
Aquifer at Otis Air Force Base 7

�����
35.0 35.3
500 1000 1500 MFTERS I
I -
2500 5000 FEET
EXPLANATION
t35- WATER-TABLE CONTOUR, NOVEMBER 1979-Shows 32.0 WATER-LEVEL OBSERVATION WELL-Numberis altitude1 altitude of water table. Contour interval 1 foot . of water level, in feet above sea level
Datum is sea level . Arrows show direction of 44 .7 POND LEVEL-Number is altitude of pond water level, inground-water movement . Contours dashed where feet above sea levelinferred
Figure 6. Water-table contour map and direction of ground-water flow .
and southwest, although the flow pattern is distorted near of flow is assumed to be perpendicular to the water-tablethe large ponds . The direction of flow was inferred from contours because, in horizontal directions, the hydraulicthe water-table map (fig . 6) . The horizontal component conductivity of the sand and gravel is essentially
8 Sewage Plume in a Sand and Gravel Aquifer

�����
homogeneous and isotropic . Ground-water flow is essentially horizontal at most locations . Hydraulic head is constant with depth at the six sites where water levels have been measured in clusters of observation wells .
The estimated rate of ground-water flow through the sand and gravel is 0.8 to 2.3 ft/d . This estimate was obtained from Darcy's Law :
= K(dh/dl) n
wherev = average velocityK = hydraulic conductivitydh/dl = hydraulic gradient (change in water-table altitude
with distance), and n = effective porosity .
Using the values of hydraulic conductivity and water-table slope given above and assuming an effective porosity of 0.20 to 0.40 for sand and gravel,
G=(200 to 300 ft/d)(8 ft/5280 ft)=0.8 to 2 .3 ft/d . (2)
0.20 to 0.40
The average velocity of ground water in the fine to very fine sand and silt and the sandy till is lower than the velocity in the sand and gravel because the hydraulic conductivity of the fine-grained sediments is much lower than the hydraulic conductivity of the sand and gravel .
Most ground water flows across the southern boundary of the area and ultimately discharges to streams, ponds, and wetlands in southern Falmouth and to Nantuc ket Sound . Ground water also discharges to ponds, although only Coonamessett and Johns Ponds are drained by streams (fig . 6) . The net discharge through wells is small because most water is returned to the aquifer by onsite wastewater recharge and by return flows from irrigation . Direct evapotranspiration of ground water probably is small because the water table is more than 10 feet below land surface in much of the study area .
RESULTS OF CHEMICAL ANALYSES
Introduction
Water samples collected during this study were analyzed for (1) common chemical constituents, (2) physical properties, and (3) selected indicators of sewage con tamination such as detergents to locate the plume and de-fine its chemical composition . Results of chemical analyses of selected samples of (1) treated sewage discharged to the sand beds, (2) ground water in the plume, and (3) ground water outside the plume are shown in table
2 . These analyses show that the concentrations of most dissolved substances in the plume are intermediate be-tween the concentrations in the treated sewage and the concentrations in the uncontaminated ground water .
The chemical analyses of the Otis AFB treatment-plant effluent shown in table 2 (columns 1, 2, and 3) are indicative of the general chemical quality of the treated sewage, although the composition of the treated sewage varies seasonally and has varied during the 45 years that the sand beds have been in use . The chemical analysis of the uncontaminated ground water (column 6) is typical of the chemical quality of ground water on Cape Cod that has not been significantly affected by man's activities and is low in dissolved solids (Frimpter and Gay, 1979, p . 3-4) ; the dissolved-solids concentrations are low be-cause the aquifer is sand and gravel composed predominantly of quartz and some feldspar derived from crystalline bedrock . The ground water has a low alkalinity because of the absence of carbonate minerals in the aquifer . The pH of uncontaminated ground water in the study area typically is less than 6.0 . The samples of ground water in the plume were collected from wells located in the core of the contaminated zone, at distances along the ground-water flow path of 3,000 feet (column 4) and 7,000 feet (column 5) from the sand beds .
The water samples were collected from 66 wells during May 1978 through May 1979 . Each well was sampled once, although a few wells were sampled several times during this period . Ideally, samples should be collected for chemical analyses over a much shorter period . Interpretation of the distribution of contaminants in the plume from analyses of samples collected over a 1-year period may provide an averaged or distorted view of the distributions of contaminants . However, preliminary analyses of a second set of samples collected in late 1980 indicate that the distribution of contaminants shown by the initial set of samples had not changed significantly . Collection and analysis of water samples over a longer period of time would be required to determine whether or not the distributions of dissolved substances are changing with time .
Maps and Sections Used to Present Results
Eleven chemical constituents and physical properties were selected to show the vertical and horizontal extent of the plume and to show the distribution of contaminants in the plume . These constituents and properties are : specific conductance, temperature, boron, chloride, sodium,
phosphorus, nitrogen (total of all species), ammonia, ni
trate, dissolved oxygen, and detergents . These constituents and properties were selected because they (1) provide a clear contrast between contaminated and uncontaminated water, (2) move through the sand and gravel
Results of Chemical Analyses 9

�������
---
------
------ --- --- ---
---
------
---
---
------
Table 2 . Chemical analyses showing quality of treated sewage, contaminated ground water in the plume, and uncontaminated ground water [Analyses by U .S . Geological Survey (columns 1, 2, 4-6) and Vaccaro and others, 1979 (column 3) . Concentrations are in milligrams per liter, except as indicated .]
Treated sewage, Otis Air Force Base Contaminated ground water
Constituents and U.S . Geological Survey
properties (1) (2)
Collection date . . . . . . . . . . . . . . . . . . . . . . . . . 11-20-79 8-29-80 Top of well screen below water
table, ft . . . . . . . . . . . . . . . . . . . . . . . . . . . . . . . Bottom of well screen below water
table, ft . . . . . . . . . . . . . . . . . . . . . . . . . . . . . . .
Specific conductance, wmho/crn . . . . 390 394 Temperature, °C . . . . . . . . . . . . . . . . . . . . . . . . 11 .0 22.5 Dissolved oxygen . . . . . . . . . . . . . . . . . . . . . . 5 .0 pH . . . . . . . . . . . . . . . . . . . . . . . . . . . . . . . . . . . . . . . . . 6 .8 5 .9 Dissolved solids, sum of constituents 178 155
Alkalinity (as CaC03) . . . . . . . . . . . . . . . . . 30 3 Bicarbonate (as HC03) . . . . . . . . . . . . . . . Chloride (CI) . . . . . . . . . . . . . . . . . . . . . . . . . . . .
36 33
7 34
Sulfate (S04) . . . . . . . . . . . . . . . . . . . . . . . . . . . Fluoride (F) . . . . . . . . . . . . . . . . . . . . . . . . . . . . .
37 .4
34 .2
Boron (B), Wg/L . . . . . . . . . . . . . . . . . . . . . . . Calcium (Ca) . . . . . . . . . . . . . . . . . . . . . . . . . . .
510 12
450 13
Magnesium (Mg) . . . . . . . . . . . . . . . . . . . . . . . 4 .4 5 .5 Sodium (Na) . . . . . . . . . . . . . . . . . . . . . . . . . . . . 52 43 Potassium (K) . . . . . . . . . . . . . . . . . . . . . . . . . . 8 .4 9 .2 Silica NOD . . . . . . . . . . . . . . . . . . . . . . . . . . . . 13 14
Total nitrogen (N) . . . . . . . . . . . . . . . . . . . . . Nitrate (N03 as N) . . . . . . . . . . . . . . . . . . . Nitrite (N02 as N) . . . . . . . . . . . . . . . . . . . .
19 16
.35
24 12
.50 Ammonia (NH4 as N) . . . . . . . . . . . . . . . .72 6.4 Organic nitrogen (as N) . . . . . . . . . . . . . 2 .6 5 .6 Total phosphorus (P) . . . . . . . . . . . . . . . . . 6 .0 9 .0 Orthophosphorus (P04 as P) . . . . . . . . 6 .1 6 .7
Total organic carbon (as C) . . . . . . . . 16 19 MBAS3 (detergents) . . . . . . . . . . . . . . . . . . . Fecal coliform, colonies/100 ml . . .
.2 .4
Iron, total recoverable (Fe), Wg/L . 590 Manganese, total recoverable
(Mn), Wg/L . . . . . . . . . . . . . . . . . . . . . . . . . . 30 Sulfide (as S) . . . . . . . . . . . . . . . . . . . . . . . . . .
Average values 2U.S . Geological Survey well numbers 3MBAS (methylene blue active substances)°Collection date, 7-12-79
aquifer and can be used to track the contaminated ground water, or (3) indicate contamination by sewage .
The distribution of the eleven constituents and properties in three dimensions is illustrated in this report with maps and sections . A diagram showing the general re lationship between the plume of contaminated ground
1 0 Sewage Plume in a Sand and Gravel Aquifer
Vaccaro Well FSW2 258 Well FSW 264 Uncontaminated and others 3,000 feet 7,000 feet ground water
(1979) from beds from beds Well FSW242 (3) (4) (5) (6)
1-74 to 3-78 1-23-79 279 1-23-79
57 73 51
60 76 54
343 377 300 46 11 .0 10.0 11 .0 40.0 6. 0
6 .9 7.0 6.2 5 .8 5 117 7 152 739
58 50 6 71 61 7
27 28 27 8 .1 25 33 38 5.2
.2 .1 < .1 560 280 410 7
8.6 5 .7 15 1 .8 3 .5 5.0 8.3 1 .7
41 32 32 5.5 9.6 9.6 1 .9 .6
___
56 .0 711 79 .1
16 3.6 .42 8.2 < .1 3 .2 .42 .2 < .01 .02 < .01
6.9 14 .13 .01 2.0 .26 < . 1 < .01 .02 .01
7.2 < .01 .01 < .01
57 .0 73 .5 72 .1 .5 2 .6 .0
191 5810 7 140 770
20 5880 7 30 7<10
___
SCollection date, 8-27-80 6Collection date, 7-25-79 Collection date, 8-28-80
water and the maps and sections presented in subsequent parts of this report is shown in figure 7 .
Map views of the plume were prepared from chemical analyses of water samples collected from wells with screens set in a 25-foot-thick zone of the aquifer. This zone intersects the center line of the plume (surface A

�
Figure 7 . Idealized diagram showing relationship between the center of the plume and the map and sections used to describe the distributions of contaminants .
in fig . 7) . Analyses of water collected from wells open to the aquifer above or below this lateral zone were not used to prepare the maps . Maps prepared with data collected from wells screened at all depths in the aquifer could misrepresent the areal distribution of contaminants in the aquifer .
Sections along the axis of the plume (surface B in fig . 7) and perpendicular to the axis of the plume (surface C in fig . 7) were prepared from analyses of water samples collected from clusters of wells screened at different depths in the aquifer . Most of the wells used to prepare the sections are open to 3 feet of the aquifer at the bottom of the wells . Two wells used to prepare the longitudinal sections have 10-foot-long screens .
Selected Constituents and Properties
Specific Conductance and Temperature
Specific conductance, which is easily measured in the field, was used to map the extent of the plume and to indicate the relative concentration of dissolved sub stances in the contaminated ground water . Specific conductance is a measure of the ability of water to conduct an electrical current, which is related to the concentrations of dissolved ionic substances in the water . Because many
of the dissolved substances in ground water are ionic sub-stances, specific conductance is an indicator of the dissolved-solids concentration of ground water (Frimpter and Gay, 1979, p . 3) .
The specific conductance of the treated sewage is four to five times higher than the maximum observed conductance of the uncontaminated ground water, 80 p,mho (micromhos per centimeter at 25° Celsius), because the dissolved-solids concentration of water is increased when water is used for domestic and industrial purposes . The conductance of the ground water contaminated by the treated sewage therefore is higher than the conductance of the uncontaminated ground water . The plume of contaminated ground water is delineated by a zone of elevated conductance shown in figure 8 . The conductance of ground water in the plume exceeds 200 p,mho in a zone that is 2,000 to 2,500 feet wide and 8,000 feet long .
The longitudinal axis of the plume is oriented in the direction of ground-water flow shown in figure 6 . This observation is consistent with descriptions of other plumes in sand and gravel (Kimmel and Braids, 1980 ; Hughes, 1975) which show that the contaminants are transported primarily by the flowing ground water . The plume extends to at least 11,000 feet downgradient of the sand beds . Wells were not drilled and water samples were not collected beyond 11,000 feet from the beds in this study,
Results of Chemical Analyses 11

��
0 2500 5000 FEET
EXPLANATION
300AREA OF ELEVATED TEMPERATURE-Ground-water 10 .0 WATERWELL-Number above the line is specific conduc
temperature greater than 12 degrees Celsius tance in micromhos per centimeter at 25 degrees Celsius . Number below the line is temperature in-100-- LINE OF EQUAL SPECIFIC CONDUCTANCE-Interval 100 degrees Celsius .micromhos per centimeter at 25 degrees Celsius .
Dashed where inferred
Figure 8. Areal distribution of specific conductance and temperature of ground water, May1978 through May 1979 .
1 2 Sewage Plume in a Sand and Gravel Aquifer

�
so the lines of equal specific conductance in figure 8 have not been drawn beyond this distance . However, the plume undoubtedly extends farther than 11,000 feet from the sand beds . The dashed lines of equal specific conductance through Ashumet Pond are shown in figure 8 because evidence discussed later in this report suggests that the plume passes beneath the bottom of the pond .
Ground water in the center of the plume is warmer than the surrounding ground water at least as far as 2,600 feet from the sand beds (fig . 8) . Temperatures as high as 14.0°C were measured in the center of the plume, while the ambient ground-water temperature generally is 9 .5°C to 11 .0°C . The higher temperatures in the plume may be the result of chemical and biochemical reactions occurring in the contaminated ground water . The most likely cause of the observed temperature pattern, however, is the seasonal pattern of land disposal of the treated sewage . More sewage is treated and recharged to the aquifer during the summer when the effluent is warmer than the uncontaminated ground water than during the winter when the effluent is cooler than the uncontaminated ground water .
Boron
Boron concentrations in the ground water also were used to show the extent of the plume . The longitudinal and transverse sections in figure 9 show that boron con centrations in the plume exceed 100 p,g/L . The boron concentrations in the center of the plume are as high as 410 wg/L, and the uncontaminated ground water generally contains less than 50 I-tg/L boron . The boron content of the treated sewage (table 2) is 500 Rg/L . The major sources of boron in the sewage are detergents and other cleaning agents . Human wastes and household and industrial chemicals also add some boron to the sewage .
Several characteristics of the plume are illustrated in figure 9 by the shape of the zone containing more than 100 p,g/L boron . At 3,000 feet downgradient of the sand beds, the plume is 75 feet thick, and the center of the plume is 75 feet below the water table . The plume is overlain by 20 to 50 feet of uncontaminated ground water . The bottom of the plume generally coincides with the boundary between the sand and gravel and the fine to very fine sand and silt and sandy till (fig . 5) .
Boron is a good indicator of the shape and extent of the plume because (1) the concentration of boron is much higher in the treated sewage than in the uncontami nated ground water, and (2) the boron moves readily in the aquifer . The longitudinal section of the plume in figure 9 shows that boron movement in the sand and gravel is not appreciably retarded by chemical reactions or adsorption onto aquifer materials . Boron adsorption onto sediments has been reported by Bassett (1976, p . 202-208) .
However, the movement of boron in sand and gravel aquifers without significant retardation by chemical reactions or adsorption was also observed by Kimmel and Braids (1980, p . 20), Koerner and Haws (1979, p . 80), and Bouwer (1973, p . 172) . The boron concentration of ground water in the center of the plume as far as 7,000 feet from the sand beds is as high as 80 percent of the boron concentration of the treated sewage . Thus, boron concentrations seem to be attenuated primarily by dilution, the mixing of contaminated and uncontaminated ground water .
Chloride and Sodium
The distributions of chloride and sodium also were used to delineate the plume (fig . 10) . The concentrations of chloride and sodium are higher in the treated sewage than in the uncontaminated ground water partly because sodium and chloride are common constituents of the human diet . Samples of the treated sewage collected be-tween March 1974 and August 1980 contained average concentrations of 30 mg/L chloride and 45 mg/L sodium (table 2), although the sodium content was variable . The uncontaminated ground water generally contains less than 15 mg/L chloride and less than 10 mg/L sodium .
The attenuation of chloride and sodium concentrations in the plume is due primarily to mixing of the contaminated and uncontaminated ground water . The chloride concentration in the center of the plume (fig . 10) exceeds 20 mg/L, 67 percent of the chloride concentration in the treated sewage, as far as 8,000 feet from the sand beds . The sodium concentration (fig . 10) exceeds 30 mg/L, 67 percent of the sodium concentration of the treated sewage, as far as 7,000 feet from the sand beds . The comparable attenuation of concentrations with distance suggests that both sodium and chloride are conservative species and move through the aquifer without significant retardation by chemical reactions and adsorption .
The observed conservative behavior of chloride and sodium in the plume is consistent with observations of chloride and sodium transport in sand and gravel on Long Island (Kimmel and Braids, 1980, p . 14) . The conservative behavior of chloride in ground water has been de-scribed by Hem (1970, p . 172) . Two factors reduce the likelihood that sodium will be removed by adsorption on the sediments . First, the sediments would be expected to have a low capacity for sodium adsorption because the sand and gravel is composed predominantly of quartz and feldspar and has a very low clay-mineral content . Second, the adsorption affinity of sodium is weaker than the ad-sorption affinity of the other common cations in the treated sewage (potassium, calcium, and magnesium) .
Sections along the longitudinal axis of the plume
Results of Chemical Analyses 1 3

����
EAST 70° 34' 70' 32'
B'
FLU 41°38'w
Z_wD7H 41 1 37'HJ Q
1500 METERS
0 5000 FEET LOCATION OF SECTIONS
EXPLANATION
-200-- LINE OF EQUAL BORON CONCEN-TRATION-Interval 100 micrograms per liter . Dashed where inferred
WELL SITE-Horizontal lines indicate points sampled,
1500 METERS 40 3-foot-long screen . Numbers are boron concentrations in
0 5000 FEET 20 micrograms per liter
VERTICAL EXAGGERATION X 10
40 generally a test well with a
Figure 9 . Vertical distribution of boron in ground water, May 1978 through May 1979 .
show the concentrations of chloride and sodium (fig . 11) in the contaminated ground water . The shape of the plume as defined by chloride and sodium is similar to the shape of the plume as defined by boron (fig . 9) . The plume is contained in the sand and gravel aquifer and is overlain by uncontaminated ground water .
Water collected from several shallow wells south of Route 151 (fig . 11) that are screened above the plume contained more than 20 mg/L chloride and more than 15 mg/L sodium . These concentrations of chloride and sodium are higher than the concentrations in uncontaminated ground water . However, the boron concentration of water collected from these shallow wells (fig . 9) is less than 50 jig/L, the maximum boron concentration measured in the uncontaminated ground water . This combination of constituents suggests a source other than the sewage disposal .
The only known large-scale source of sodium chloride in ground water in the study area other than land disposal of sewage at Otis AFB is road salting . Several roads that cross the path of the plume are salted duringthe winter . These roads include Route 151, and Sandwich, Ashumet, and Hayway Roads (fig . 10) . The shallow wells that contain the elevated levels of sodium and chloride are downgradient of these roads .
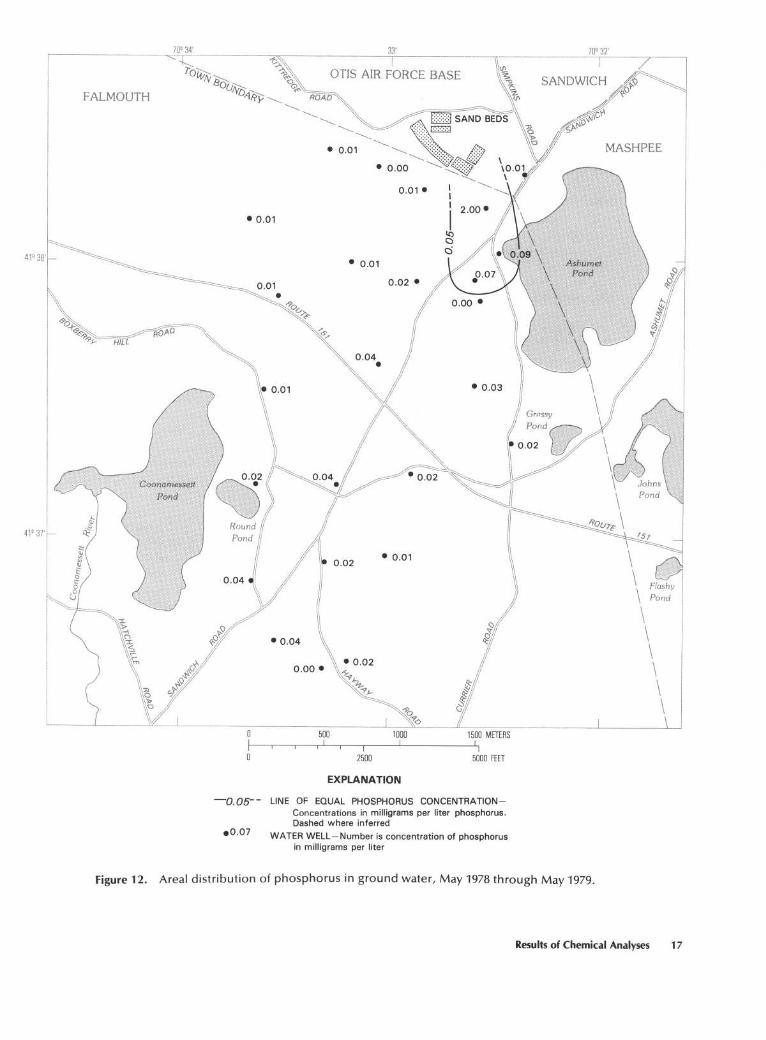
Phosphorus
Phosphorus (P) concentrations in the aquifer are shown in figure 12 . The area in which phosphorus concen-trations in the contaminated ground water exceed concen trations in the uncontaminated ground water is much smaller than the area of the plume delineated by specific conductance (fig . 8) and by chloride and sodium (fig . 10) .
1 4 Sewage Plume in a Sand and Gravel Aquifer

���������
-- --
15 9.2
500 1000 1500 METERS
I I 2500 5000 FEET
EXPLANATION
-20- LINE OF EQUAL CHLORIDE CONCENTRATION-Con- 27 WATER WELL-Number above line is chloride con centration in milligrams per liter . 32 centration in milligrams per liter . Number below line
15 LINE OF EQUAL SODIUM CONCENTRATION-Interval 15 is sodium concentration in milligrams per liter
milligrams per liter
Figure 10 . Area] distribution of chloride and sodium in ground water, May 1978 through May 1979 .
Results of Chemical Analyses 15

������
10° 34' 70° 32'
4138'
41° 37'
240 5000 FEET 14
LOCATION OF SECTIONS 14
500 1000 1500 METERS I I J _
5000 FEET VERTICAL EXAGGERATION X 10
EXPLANATION
AREA OF ELEVATED CHLORIDE AND SODIUM CONCENTRATIONS OUTSIDE PLUME-Chloride concentration greater than 20 milligrams per liter . Sodium concentration greater than 15 milligrams per liter . Road salting is most likely source
LINE OF EQUAL CONCENTRATION-Concentrations of sodium and chloride in milligrams per liter . Interval varies . Dashed where inferred
WELL SITE-Horizontal lines indicate points sampled, generally a test well with a 3-foot-long screen . Numbers are chloride and sodium concentrations in milligrams per liter
Figure 11 . Vertical distribution of chloride and sodium in ground water, May 1978 through May 1979 .
The phosphorus concentrations in the contaminated ground water do not exceed 0 .05 mg/L farther than 2,500 feet downgradient of the sand beds . Uncontaminated ground water in the study area generally contains less than 0.05 mg/L phosphorus . Most phosphorus in the secondarily treated sewage is in the form of orthophosphate (P04
3- ), the predominant form of dissolved inorganic phosphorus in water . Between 1974 and 1980, the average concentration of orthophosphate (as phosphorus) in the treated sew-age was 7 mg/L (table 2) .
The limited extent of elevated phosphorus concentrations in the plume compared to boron, sodium, and chloride most likely is caused by adsorption of phosphorus on the sediments and by the formation of insoluble phosphorus compounds . Phosphorus is adsorbed on metal
oxides, particularly ferric hydroxide (Hem, 1970, p . 185), which typically coat the sediment grains of sand and gravel . Phosphorus also has a strong tendency to form phosphorus compounds of low solubility by reacting with the iron and aluminum which are available in the aquifer . The effect of these two processes, jointly referred to as sorption, is to remove phosphorus from solution and to retard the movement of the phosphorus front through the aquifer . Therefore, phosphorus appears to move much more slowly from the contamination source than conservative species such as chloride . The retardation of phosphorus movement away from sewage-disposal sites in sand and gravel has also been observed by Koerner and Haws (1979, p . 84-86), Aulenbach and Tofflemire (1975, p . 166), and Bouwer (1973, p . 172) .
1 6 Sewage Plume in a Sand and Gravel Aquifer
��������
--Concentrations
---7
OTIS AIR FORCE BASE ' '^~~'~~'' ^ ~ ~amuwu.u v
~` ~, ^ ""="..,~ ~^~"
*o01
o
«24*
/ /z5H 5000 FEET
EXPLANATION
no*_- LINE OF EQUAL PHOSPHORUS cowCENTRAnON-Concentrations in milligrams per liter phosphorus . Dashed where inferred
°o.or WATER WELL-Number is concentration of phosphorus in mMigrems per liter
Figure 12 . Areal distribution of phosphorus in ground water, May 1978 through May1979 .
Results of Chemical Analyses 17

�
Nitrogen
Nitrogen is an important component of domestic sewage that is derived from human and food wastes . The concentrations of nitrogen in ground water are shown in figure 13 . Nitrogen concentrations as high as 24 mg/L were measured in water samples collected from the plume . The treated sewage from the Otis AFB facility contained 20 to 25 mg/L total nitrogen during 1979-80 (table 2) . Ground water outside the plume which has not been contaminated by other activities of man generally contains less than 0.5 mg/L nitrogen (Frimpter and Gay, 1979, p . 9) .
The area in which the contaminated ground water contains more than 2 mg/L nitrogen (fig . 13) delineates a plume that is similar in shape and location to the area delineated by specific conductance (fig . 8) and by chloride and sodium (fig . 10) . Nitrogen exceeds 2.0 mg/L in water samples collected from two wells located near the intersection of Boxberry Hill Road and Sandwich Road (fig . 13), 11,000 feet downgradient of the sand beds . These wells are located at the farthest point from the sand beds at which water samples were collected . The zone in the plume that contains more than 2.0 mg/L nitrogen most likely extends more than 11,000 feet from the sand beds in the southwesterly direction of ground-water flow .
Septic tank and cesspool effluents, fertilizers applied to golf courses and food crops, and sewage sludges that may have been buried in the past near the Otis AFB treat ment plant also are potential sources of nitrogen in the ground water . Elevated nitrogen concentrations in water samples collected from wells located outside the plume probably result from these additional sources . Most of these wells are shallow and are located on or near the two golf courses (fig . 2) or are adjacent to onsite wastewater disposal systems . Water collected from several deeper wells which seem to be outside the plume (for example, well FSW 234 in fig . 13) contained more than 1 .0 mg/L nitrogen . Data presently available are insufficient to identify the source of the nitrogen at these locations .
Ammonia, Nitrate, and Dissolved Oxygen Nitrogen (N) occurs in several forms in ground
water . The vertical distributions of the two predominant species of nitrogen in the plume, nitrate (N03) and ammonia as the ammonium (NH4 + ), are shown in figure 14 . Nitrogen in the center of the plume as far as 5,000 feet from the sand beds is mostly in the form of ammonia . A thin zone of ground water containing more than 1 mg/L nitrate-nitrogen overlies the center of the plume in this region . Between 5,000 feet and 8,000 feet from the sand beds, the predominant species of nitrogen in the plume changes from ammonia to nitrate . Nitrogen is in the nit-
1 8 Sewage Plume in a Sand and Gravel Aquifer
rate form farther than 8,000 feet from the sand beds . In this region, ammonia concentrations are less than 0 .05 mg/L .
The observed change in the species of nitrogen in the plume as the contaminated ground water moves away from the sand beds is the result of oxidation of ammonia to nitrite (NOZ) and nitrate (N03) in the presence of dissolved oxygen . This oxidation process, called nitrification, is mediated by bacteria which occur naturally in ground water (Behnke, 1975) . Because oxygen combines chemically with nitrogen during oxidation, the distributions of ammonia and nitrate in the plume are closely related to the distribution of dissolved oxygen (fig . 14) .
In the center of the plume, within 5,000 feet of the sand beds, dissolved oxygen is absent . In this zone, most nitrogen is in the form of ammonia, and nitrate is absent . Small amounts of nitrogen also are present in organic compounds and as nitrite but the distributions of these other forms are not shown in figure 14 .
Ammonia is oxidized to nitrate in a thin boundary zone along the top and sides of the plume within 5,000 feet of the sand beds (fig . 14) . In this zone, ground water outside the plume which contains as much as 11 mg/L dissolved oxygen mixes with the contaminated ground water that contains elevated levels of ammonia . Uncontaminated ground water on Cape Cod typically contains dissolved oxygen (Frimpter and Gay, 1979, p . 7-8) . The dissolved oxygen is introduced with recharge through the sandy and gravelly soils that have a low organic matter content .
The oxidation of ammonia to nitrate also occurs in the center of the plume between 5,000 and 8,000 feet from the sand beds as the contaminated and uncontami nated ground water mix by hydrodynamic dispersion . The oxidation of ammonia to nitrate in the center of the plume is most evident in water samples collected from wells FSW 262-266 located 7,000 feet from the sand beds (fig . 14) . Both ammonia and nitrate are present at concentrations greater than 1 mg/L at this site . The oxidation of ammonia is essentially complete 8,000 feet downgradient of the sand beds .
Dissolved oxygen was not detected in the fine-grained sediments beneath the sand and gravel (fig . 5), but there is no evidence that ground water in these sedi ments has been contaminated by the sewage disposal at Otis AFB . The lack of dissolved oxygen in the deeper part of the aquifer below the plume may reflect the natural tendency for dissolved oxygen to be depleted in ground-water systems as the residence time of water in the aquifer increases .
The distributions of ammonia and nitrate (fig . 14) show that ammonia has moved readily in the aquifer and that oxidation of ammonia to nitrate is the primary cause

������
SANDWICH A^\ ~~
500 1000 1500 METERS f 0 2500 5000 FEET
EXPLANATION
-7-- LINE OF EQUAL NITROGEN CONCENTRATION-Concentration in milligrams per total liter nitrogen . Interval varies . Dashed where inferred
0 7 .4 WATER WELL-Number is concentration of nitrogen in milligrams per liter
Figure 13 . Areal distribution of nitrogen in ground water, May 1978 through May 1979 .
Results of Chemical Analyses 19

�����
500 1000 1500 METERS 70° 34' 70° 32'
5000 FEET VERTICAL EXAGGERATION X 10
41' 38' EXPLANATION
LINE OF EQUAL CONCENTRATION-Concentrations of ammonia and nitrate in milligrams per liter as nitrogen and dissolved oxygen in milligrams per liter . Interval varies . Dashed where inferred
41' 37' WELL SITE-Horizontal lines indicate points sampled, generally a test
0 .53 well with a 3-foot-long screen . Numbers are ammonia and 2 .3 nitrate concentrations in milligrams per liter as nitrogen and
2 .6 dissolved oxygen concentrations in milligrams per liter
0 1500 METERS
LOCATION OF SECTIONS
Figure 14 . Vertical distribution of ammonia, nitrate, and May 1979 .
of attenuation of ammonia concentrations in the plume . Nitrate, the end product of nitrification, is the stable species of nitrogen in an oxidizing ground-water environment and moves through the aquifer without reacting with other chemical constituents or with the sediments (Freeze and Cherry, 1979, p . 413) .
Detergents
Detergents in ground water are a definite indication of contamination by wastewater disposal . Sewage typically contains detergents introduced into water from laundry and
20 Sewage Plume in a Sand and Gravel Aquifer
dissolved oxygen in ground water, May 1978 through
dishwashing wastes . Because detergents are manmade chemicals, they do not exist in ground water that has not been contaminated by wastewater disposal .
Detergents were first used in the United States around 1946 (Hughes, 1975, p . 22), and became the dominant cleaning agent, exceeding the use of soaps, in 1953 (Wayman and others, 1965, p . 2) . The primary active agents in detergents are surface active agents, or surfactants . Prior to 1964, the most common surfactant used in detergents was alkyl benzene sulfonate (ABS) . ABS is nonbiodegradable . Numerous instances of ABS con-

�����
Otis A.F .B .NORTH sand beds A I
100 -
Water tables
SEA LEVEL
100 -
FLUw
Z_ w
H HJ Q
EAST
C,
SEA LEVEL
100 -
200
5000 FEET
VERTICAL EXAGGERATION X10
70° 34' 70° 32'
41' 38'
41' 37'
0 1500 METERS
0 5000 FEET
LOCATION OF SECTIONS
EXPLANATION
-0.5-- LINE OF EQUAL DETERGENT CONCENTRATION-Concentrations in milligrams per liter methylene blue active substances . Interval varies . Dashed where inferred .
WELL SITE-Horizontal lines indicate points sampled, generally a test well with a 3-foot-long screen . Numbers are detergent concentrations in milligrams per liter meth-
0 .0 ylene blue active sub-stances .
Figure 15 . Vertical distribution of detergents in ground water, May 1978 through May 1979 .
tamination of ground water have been reported (Suess, 1964, p . 89 ; Perlmutter and Lieber, 1970) . In 1964, ABS was replaced by LAS (linear alkyl sulfonates) to reduce the environmental impacts of detergent use . LAS is biodegradable and secondary sewage treatment plants can remove LAS effectively under favorable conditions .
The concentration of detergents in water is measured by the MBAS (methylene blue active substances) test and is expressed in milligrams per liter MBAS (American Pub lic Health Association and others, 1975, p . 600) . This test determines the concentration of surfactants in the water but does not distinguish between the nonbiodegradable (ABS) and the biodegradable (LAS) surfactants .
Although data are not available that show the detergent content of the Otis AFB treated sewage between 1946 and 1979,. chemical analyses of treated sewage from simi lar treatment plants (Kardos and Sopper, 1973, p . 150-151 ; Hunter and Kotalik, 1973, p . 11 ; Wayman and
others, 1965, p . 8 ; Hughes, 1975, p . 12-13) show deter-gent concentrations of 3 to 10 mg/L MBAS prior to 1966 and 0.2 to 1 .0 mg/L MBAS after the biodegradable forms became prevalent . Samples of the treated sewage collected at the Otis AFB facility in November 1979 and August 1980 (table 2) contained 0.2 and 0 .4 mg/L MBAS .
The distribution of detergents in the aquifer is shown in figure 15 . Detergent concentrations exceed 0 .5 mg/L MBAS in a zone between 3,000 and 10,000 feet downgra dient of the sand beds . A water sample collected from a well located 7,000 feet from the sand beds contained 2 .6 mg/L MBAS, the highest detergent concentration detected during this study . Detergents were not detected in ground water outside the plume .
The observed distribution of detergents in the plume may be the result of one or more factors which include : (1) Historical changes in the volume of sewage applied to the beds, (2) historical changes in the detergent concen-
Results of Chemical Analyses 2 1
7

�
trations in the sewage, (3) changes in the treatment or disposal processes at the sewage treatment plant such as sand-bed rotation and bed loading rates that changed the detergent concentrations in the treated sewage, and (4) spatial or temporal changes in adsorption and degradation of surfactants in the aquifer . Available data are insufficient to evaluate these potential factors in detail . However, the distribution of detergents in the plume (fig . 15) most likely is related to the change in 1964 from nonbiodegradable (ABS) to biodegradable (LAS) surfactants .
Detergents in the zone of the plume that contains elevated detergent concentrations are derived from pre-1964 disposal of treated sewage containing non biodegradable detergents . These nonbiodegradable deter-gents have moved more than 3,000 feet downgradient of the sand beds . The lower concentration of detergents (lessthan 0.5 mg/L MBAS) in the plume within 3,000 feet of the sand beds is the result of the lower detergent con-tent of the treated sewage following the introduction of biodegradable surfactants . The decrease in the volume of sewage treated at the Otis AFB plant between 1968 and 1978 (fig . 4) also may have contributed to the lower deter-gent concentrations in this zone .
Detergents have moved readily in the aquifer . Unlike phosphorus (fig . 12), attenuation of detergent concentrations in the plume by chemical reactions and adsorptionis not evident in figure 15 . This observation is consistent with laboratory studies by Wayman and others (1965, p . 49-96) which showed that ABS does not degrade chemically in most ground-water environments and is not adsorbed significantly on sand and gravel composed pre-dominantly of quartz . LAS is more likely to degrade chemically (Wayman and others, 1965) or to be adsorbed on the sediments (Freeze and Cherry, 1979, p . 440) . However, Wayman and others (1965, p . 56) showed that biodegradation of LAS is very slow in oxygen-containing ground water at 10°C and may be insignificant in ground water that is devoid of dissolved oxygen . Therefore, detergents, particularly nonbiodegradable (ABS) surfactants, most likely behave conservatively in the aquifer and can be used to determine the extent of the contaminated ground water .
DISCUSSION
Processes that Affect the Distribution of Contaminants in the Plume
The transport of contaminants in the plume is affected by processes which tend to spread the contaminants in the aquifer and by processes which tend to retard or restrict the movement of the dissolved substances . Two processes that tend to spread the contaminants in the
22 Sewage Plume in a Sand and Gravel Aquifer
aquifer are advection and hydrodynamic dispersion . The contaminants introduced into the aquifer by land disposalof treated sewage at the sand beds are carried away from the disposal site primarily by flowing ground water, a process called advection . The large extent of the plume(fig . 16) shows that advection is very effective in moving the contaminants through the aquifer . Because the contaminants are transported primarily by the flowing ground water, the plume is alined with the direction of ground-water flow shown by arrows drawn perpendicular to the water-table contours (fig . 16) .
Hydrodynamic dispersion is the other process that spreads the contaminants in the aquifer . Dispersion results from mechanical mixing as ground water moves throughthe tortuous, branching, and interfingering pores of different sizes between the sediment grains and from molecular diffusion in the pore water . The effect of hydrodynamic dispersion is the dilution of contaminated ground water by uncontaminated ground water as the plume spreads in the direction of ground-water flow and, to a much lesser extent, perpendicular to the direction of flow . The distribution of boron in the plume (fig . 16) shows that the concentration of boron decreases gradually from greater than 300 p,g/L in the center of the plume to less than 100 wg/L along the sides of the plume . If the dissolved substances were transported only by advection, a sharp boundary instead of a gradual transition would separate contaminated from uncontaminated ground water .
Processes which tend to retard the movement of contaminants in the aquifer include chemical and biochemical reactions between the contaminant and other dissolved substances in the ground water and between the contaminant and the sediments . The removal of phosphorus from the plume by precipitation and adsorption (fig . 12) and the oxidation of ammonia to nitrate (fig . 14) are examples of these processes . The net effect of these processes is that some substances, such as boron (fig . 16), move through the aquifer at approximately the same velocity as the ground water and other substances, such as phosphorus (fig . 16), appear to move much more slowly than the ground water .
In addition to advection, dispersion, and retardation, changes in the chemical quality and volume of the treated sewage applied to the sand beds also affect the extent and composition of the plume . For example, the distribution of detergents (fig . 16) reflects the decrease in deter-gent content of the treated sewage following the conversion from nonbiodegradable (ABS) to biodegradable (LAS) surfactants in 1964 . Past changes in the concentrations of other contaminants in the treated sewage also may be reflected in the distributions of contaminants in the plume . However, historical data on the chemical quality of the treated sewage generally are insufficient to document these variations and their effects on the extent and composition of the plume .

�����
70'32'
OTIS AIR FORCE BASE
SAND BEDS
NA, MASHPEE
41 0 38' ~-44
Johr Pond
_`moo 500 1000 1500 METERS
1 i~
2500 5000 FEET
EXPLANATION
AREA OF LOW BORON CONCENTRATION-Boron concentration 100-200 micrograms per liter
AREA OF MODERATE BORON CONCENTRATION-Boron concentration 200-300 micrograms per liter
AREA OF HIGH BORON CONCENTRATION-Boron concentration greater than 300 micrograms per liter
AREA OF HIGH PHOSPHORUS CONCENTRATION-Phosphorus concentration greater than 0 .05 milligrams per liter
AREA OF HIGH DETERGENTS CONCENTRATION-Detergent concentration greater than 0.5 milligrams per liter methylene blue active substances
-{-50- WATER-TABLE CONTOUR-Shows altitude of water table . Contour interval 2 feet . Datum is sea level . Arrows show direction of ground-water movement
Figure 16 . Relationship between the water table and the distributions of boron, phosphorus, and detergents in the plume.
Discussion 23

������
SOUTH
A'
ww
Z_ w O 7 H H J Q
200 VERTICAL EXAGGERATION x 10 A 500
0 5000 FEET
EXPLANATION
COARSE-GRAINED SEDIMENTS-Medium to very coarse sand ; some gravel
FINE-GRAINED SEDIMENTS-Very fine to fine sand, silt, and till
GROUND WATER CONTAINING LESS THAN 100 MICROGRAMS PER LITER BORON
GROUND WATER CONTAINING MORE THAN 100 MICROGRAMS PER LITER BORON
WATER WELL-Block shows well screen
70`34' 20^32'
41' 38'
41' 37'
1500 METERS
0 5000 FEET
LOCATION OF SECTIONS
Figure 17. Vertical location of the plume as shown by the distribution of boron in ground water .
Vertical Location of the Plume
The plume is contained almost entirely in the sand and gravel (fig . 17) . The bottom of the contaminated zone coincides with the boundary between the permeable sand and gravel and the less permeable fine-grained sediments . The nearly horizontal flow of ground water through the sand and gravel transports the contaminants by advection through this permeable zone of the aquifer .
The plume is overlain by 20 to 50 feet of uncontami-nated ground water (fig . 17) . The depth to the top of the plume below the water table generally increases with increasing distance from the sand beds, especially within 5,000 feet of the beds . The primary source of the uncontaminated ground water above the plume is the addition of recharge from precipitation along the path of the plume . The ground water above the plume contains as much as 11 mg/L dissolved oxygen, which suggests that it is de-rived from precipitation that has recently recharged the aquifer . Downward displacement of the contaminated zone also may be caused in part by vertical movement of contaminated ground water at the disposal site and by a small density difference between the contaminated and uncontaminated ground water which would cause the plume to sink into the aquifer (Kimmel and Braids, 1980, p . 31-32) . The contribution of these two factors to the observed
24 Sewage Plume in a Sand and Gravel Aquifer
depression of the plume cannot be determined from avail-able data .
The impact of the plume on the quality of ground water discharging to wells and surface-water bodies is related in part to the vertical location of the contaminated zone . Some domestic-supply wells are located directly over the plume . These wells usually do not penetrate more than 15 feet below the water table, however, and they generally are pumped at low rates (100 to 600 gal/d) . Therefore, these wells, although located along the path of the plume, tap the uncontaminated ground water overlying the plume (fig . 17) . Because most domestic-supply wells are screened above the plume, the collection and analysis of water samples from private wells performed in phase 2 of the study (table l) did not detect the contaminated zone . Domestic wells drilled deeper into the aquifer, however, may tap the plume .
Wells screened above the plume that are pumped for sustained durations at higher rates may induce vertical movement of the contaminated water up and into the well . This process is affected by the distance between the well screen and the plume and by the duration and rate of pumping . For example, a large-capacity well is located 8,000 feet from the sand beds along the path of the plume . The well, known as the Ashumet Well (fig . 17), is part of the public water-supply system of the town of Falmouth . The screen of the well is 10 feet long and is set

above the center of the plume . In January 1979, water from the well contained 0.9 mg/L detergents after the well had been pumped continuously at 0.75 Mgal/d during most of the previous summer, fall, and early winter . The well was shut down on June 10, 1979, due to the detergents in the water; the U .S . Environmental Protection Agency recommended concentration limit for detergents (foaming agents) in drinking water is 0.5 mg/L MBAS (U .S . Environmental Protection Agency, 1979, p . 42198) . The deter-gent concentration of the water subsequently decreased to 0.6 mg/L after 45 days, 0.4 mg/L after 291 days, and 0.3 mg/L after 451 days from the shutdown. Although this decrease could have been caused by other reasons, the plume probably was drawn up into the well during the prolonged pumping and returned to its original position after pumping ceased .
Several ponds along the path of the plume (fig . 8) are connected hydraulically to the aquifer and receive ground-water discharge during all or part of the year (R . S . McVoy, Massachusetts Division of Water Pollution Control, written commun ., 1981) . Ashumet Pond, for ex-ample, is located 1,700 feet from the sand beds . Field evidence indicates that ground water discharges into the pond along its northwestern shore . The specific conductance of ground water (fig . 8) shows that the path of the plume intercepts the pond along this part of the shore . However, chemical analyses of water samples collected from three wells located along the northwestern shore of the pond show that the top of the plume at this location is more than 10 feet below the water table and the center of the plume is 40 to 50 feet below the water table . There-fore, the uncontaminated ground water overlying the plume (fig . 17) may be the source of discharge to the pond, and most or all of the contaminated ground water may pass beneath the pond bottom .
Path of the Plume
The dissolved substances in the plume from the Otis AFB sewage treatment facility are moving south and southwest (fig . 18) . Although samples of the plume were not collected farther than 2 .1 miles (11,000 feet) from the sewage treatment plant during this study, the regional water-table map shows that the contaminated ground water moves toward the downstream end of the Coonamessett River and toward other small streams, ponds, wetlands, and saltwater bays east of the river . Delineation of the path of the plume farther than 2 .1 miles from the sand beds would require the drilling of additional wells, and the collection and analysis of additional water samples .
Positive identification of the contaminated ground water after it has traveled more than 2 .1 miles from the sand beds or as it discharges to surface-water bodies in southern Falmouth may be difficult for two reasons . First,
dilution of the contaminated ground water by hydro-dynamic dispersion makes it increasingly difficult to distinguish the plume from the surrounding, uncontaminated ground water as the distance from the sand beds increases . Second, contaminants from the treatment facility may be difficult to differentiate from dissolved substances added to ground water from other sources in developed areas in southern Falmouth such as road salts, fertilizers, and domestic wastewater .
The present path of the plume is alined with the regional pattern of ground-water flow (fig . 18) . Large-scale ground-water development that changes the direction of ground-water flow also will affect the path of the plume . This development includes pumping for water sup-ply and land disposal of wastewater . Although the Ashumet Well is the only public-supply well in the path of the plume, several potential well sites identified by the town of Falmouth are located along or adjacent to the path of the plume (Richard Witt, Falmouth Department of Public Works, oral commun ., 1981) .
SUMMARY
A plume of contaminated ground water has been formed by 45 years of disposal of treated sewage to a sand and gravel aquifer at Otis AFB . The secondarily treated sewage is recharged to the aquifer by rapid infiltration through sand beds . The plume extends more than 11,000 feet south and southwest of the sand beds in the same direction as the regional flow of ground water, and is 2,500 to 3,500 feet wide and 75 feet thick . The plume is contained primarily in the 90- to 140-foot-thick permeable sand and gravel that overlies less permeable fine-grained sediments . The plume is overlain by 20 to 50 feet of uncontaminated ground water . The source of the overlying uncontaminated ground water is recharge from precipitation along the path of the plume .
The lateral and vertical extent of the plume was delineated as far as 11,000 feet downgradient of the sand beds . The location of the plume beyond this point was not determined directly by field observations during this study . However, the regional water-table map shows that the contaminated ground water moves toward the downstream end of the Coonamessett River and small streams, ponds, wetlands, and saltwater bays east of the river .
The path and hydrochemistry of the plume is shown by the distributions in the aquifer of 11 physical properties and chemical constituents : Specific conductance, tempera ture, boron, chloride, sodium, phosphorus, nitrogen, ammonia, nitrate, dissolved oxygen, and detergents . The distributions of these properties and chemicals in the aquifer were determined by chemical analysis of water samples
Summary 25

��������
------
7q° �"
OTIS AIR FORCE BASE
SANDWICH °f? ,/ / I
iu
SCALE 1 :125000 0 5 10 KILOMETERS
EXPLANATION
AREA OF PLUME DELINEATED DURING FIELD -20- WATER-TABLE CONTOUR-Shows altitude of the STUDY-Denoted by nitrogen concentration water table . Contour interval 10 feet . Datum is greater than 2 milligrams per liter sea level . From Guswa and LeBlanc (1981)
PROJECTED PATH OF PLUME TOWN BOUNDARY
OTIS AIR FORCE BASE BOUNDARY
Figure 18 . Area and projected path of plume of ground water contaminated by land disposal of treated sewageat Otis Air Force Base .
26 Sewage Plume in a Sand and Gravel Aquifer
�
collected from 66 wells during May 1978 through May 1979 .
The specific conductance of ground water in the plume is as high as 405 micromhos per centimeter . The conductance of uncontaminated ground water in the study area generally is less than 80 micromhos per centimeter . The concentrations of boron, chloride, sodium, phosphorus, total nitrogen, ammonia, nitrate, and detergents are higher in the contaminated ground water than in the uncontaminated ground water. The distributions of these substances in the plume are related to the processes that affect the movement of contaminants in the aquifer (advection, hydrodynamic dispersion, and chemical reactions) and to changes in the chemical composition of the treated sew-age.
Boron, chloride, and sodium move readily in the aquifer and appear to be attenuated primarily by hydro-dynamic dispersion . The movement of phosphorus is greatly restricted, however, by sorption on the sediments . Ammonia in the plume is oxidized to nitrate as the contaminated ground water mixes with uncontaminated ground water containing up to 11 mg/L dissolved oxygen . Concentrations of detergents exceed 0.5 mg/L MBAS from 3,000 feet to 10,000 feet downgradient of the sand beds. The high concentrations of detergents in this zone reflect the use of nonbiodegradable detergents in the United States between 1946 and 1964 .
SELECTED REFERENCES American Public Health Association, American Water Works
Association, and Water Pollution Control Federation, 1975, Standard methods for the examination of water and wastewater, 14th edition : American Public Health Association, Washington, D.C ., 1193 p.
Aulenbach, D. B ., and Tofflemire, T . J ., 1975, Thirty-five years of continuous discharge of secondary treated effluent onto sand beds : Ground Water, v . 13, no . 2, p. 161-166.
Bassett, R. L., 1976, The geochemistry of boron in thermal waters : Stanford, Calif., Stanford University, Ph . D. dissertation .
Behnke, Jerold, 1975, A summary of the biogeochemistry of nitrogen compounds in ground water: Journal of Hydro-logy, v. 27, p. 155-167.
Bouwer, Herman, 1973, Renovating secondary effluent by groundwater recharge with infiltration basins, in Sopper, W. E., and Kardos, L. T., eds ., Recycling treated munici pal wastewater and sludge through forest and cropland : University Park, The Pennsylvania State University Press, p. 164-175 .
Cox, E . R., 1979, Preliminary study of wastewater movement in Yellowstone National Park, Wyoming, October 1976 through September 1977 : U .S . Geological Survey Open-File Report 79-084, 59 p.
Freeze, R . A ., and Cherry, J. A., 1979, Groundwater : Englewood Cliffs, N.J ., Prentice-Hall, 604 p.
Frimpter, M. H., and Gay, F. B ., 1979, Chemical quality of ground water on Cape Cod, Massachusetts : U .S . Geological Survey Water-Resources Investigations 79-05, 11 p .
Guswa, J . H ., and LeBlanc, D . R., 1981, Digital models of ground-water flow in the Cape Cod aquifer system, Massachusetts : U .S . Geological Survey Water-Resources In-vestigations Open-File Report 80-07, 128 p.
Guswa, J. H., and Londquist, C. J., 1976, Potential for development of ground water at a test site near Truro, Massachusetts : U.S . Geological Survey Open-File Report 76-614, 22 p.
Hem, J. D ., 1970, Study and interpretation of the chemical characteristics of natural water: U.S . Geological Survey Water-Supply Paper 1473, 2d edition, 363 p.
Hughes, J . L., 1975, Evaluation of ground-water degradation resulting from waste disposal to alluvium near Barstow, California : U .S . Geological Survey Professional Paper 878, 33 p .
Hunter, J. V ., and Kotalik, T. A., 1973, Chemical and biological quality of treated sewage effluents, in Sopper, W. E., and Kardos, L. T., eds., Recycling treated municipal wastewater and sludge through forest and cropland : University Park, The Pennsylvania State University Press, p . 6-25 .
Kardos, L. T., and Sopper, W. E., 1973, Renovation of municipal wastewater through land disposal by spray irrigation, in Sopper, W. E., and Kardos, L. T., eds ., Recycling treated municipal wastewater and sludge through forest and cropland: University Park, The Pennsylvania State University Press, p . 148-163 .
Kerfoot, W . B ., and others, 1975, Cape Cod waste water renovation and retrieval system, a study of water treatment and conservation, first year of operation, annual report, June 11, 1974-June 10, 1975 : Woods Hole Oceanographic Institution Technical Report WHOI-75-32, 194 p .
Kerfoot, W. B., and Ketchum, B. T., 1974, Cape Cod waste water renovation and retrieval system, a study of water treatment and conservation, annual report, June 11, 1973-June 10, 1974 : Woods Hole Oceanographic Institution Technical Report WHOI-74-13, 67 p.
Kimmel, G. E., and Braids, O. C ., 1980, Leachate plumes in ground water from Babylon and Islip landfills, Long Is-land, New York : U .S . Geological Survey Professional Paper 1085, 38 p.
Koerner, E. L ., and Haws, D. A ., 1979, Long-term effects of land application of domestic wastewater, Vineland, New Jersey, rapid infiltration site : U.S . Environmental Protection Agency Report EPA-600/2-79-072, 166 p.
LeBlanc, D . R ., and Guswa, J. H., 1977, Water-table map of Cape Cod, Massachusetts, May 23-27, 1976 : U .S . Geological Survey Open-File Report 77-419, scale 1 :48,000, 2 sheets .
LeGrand, H . E., 1965, Patterns of contaminated zones of water in the ground: Water Resources Research, v. 1, no . 1, p.83-95 .
Selected References 27

Lohman, S . W., and others, 1972, Definitions of selected ground-water terms-revisions and conceptual refinements: U.S . Geological Survey Water-Supply Paper 1988, 21 P.
Meade, R. H ., and Vaccaro, R. F., 1971, Sewage disposal in Falmouth, Massachusetts-III . Predicted effects of inland disposal and sea outfall on groundwater: Boston Society of Civil Engineers Journal, v . 58, no . 4, p . 278-297 .
Oldale, R . N., 1969, Seismic investigations on Cape Cod, Martha's Vineyard, and Nantucket, Massachusetts, and a topographic map of the basement surface from Cape Cod Bay to the Islands : U.S . Geological Survey Professional Paper 650-B, p. B 122-B 127. 1976, Notes on the generalized geologic map of Cape Cod: U.S . Geological Survey Open-File Report 76-765, 23 P.
Palmer, C . D., 1977, Hydrogeological implications of various wastewater management proposals for the Falmouth area of Cape Cod, Massachusetts : Woods Hole Oceanographic Institution Technical Report WHOI-77-32 (appendix), 142 p.
Perlmutter, N. M., and Lieber, Maxim, 1970, Dispersal of plating wastes and sewage contaminants in ground water and surface water, South Farmingdale-Massapequa area, Nas sau County, New York : U .S Geological Survey Water-Supply Paper 1879-G, 67 p.
28 Sewage Plume in a Sand and Gravel Aquifer
Preul, H. C ., 1968, Contaminants in groundwaters near waste stabilization ponds: Water Pollution Control Federation Journal, v. 40, no . 4 p . 659-669 .
Schmidt, K . D., 1973, Groundwater quality in the Cortaro area, northwest of Tucson, Arizona: Water Resources Bulletin, v. 9, no . 3, p. 598-606.
Suess, M . J ., 1964, Retardation of ABS in different aquifers : American Water Works Association Journal, v. 56, no . 1, p. 89-91 .
Thornthwaite, C. W., and Mather, J. R., 1957, Instructions and tables for computing potential evapotranspiration and the water balance, in Publications in Climatology : Centerton, N .J ., Drexel Institute of Technology, v. 10, no . 3, p. 185-311 .
Todd, D. K., 1980, Groundwater hydrology: New York, John Wiley and Sons, 535 p.
U.S . Environmental Protection Agency, 1979, National secondary drinking water regulations : Federal Register, v. 44, no . 140, Thursday, July 19, 1979, p. 42195-42202.
Vaccaro, R. F., and others, 1979, Wastewater renovation and retrieval on Cape Cod: U.S . Environmental Protection Agency Report EPA-600/2-79-176, 174 p.
Wayman, Cooper, Page, H. L., and Robertson, J. B ., 1965, Behavior of surfactants and other detergent components in water and soil-water environments : Federal Housing Administration FHA No . 532, Washington, D.C ., 142 p.
4 U.S . GOVERrM[F PRINTING OFFICE : 1985 - 576-049/20,011