seven percent of health care spending is both out-of ... services ib 3.2.16_0.pdf · vices than on...
TRANSCRIPT

1 www.healthcostinstitute.org
KEY FINDINGS
At most, 43% of the $524.2 billion
spent on health care by individuals
with ESI in 2011 was spent on shop-
pable services.
About 15% of total spending in
2011 was spent by consumers out-
of-pocket.
$37.7 billion (7% of total spending)
of the out-of-pocket spending in
2011 was on shoppable services.
Overall, the potential gains from the consumer price shopping as-pect of price transparency efforts are modest.
Spending on Shoppable
Services in Health Care
In the United States, the price of health
care services is often not known to pa-
tients prior to receiving care. This is
generally true regardless of whether
the patient is covered by health insur-
ance. Over the last several years a
movement to introduce price transpar-
ency—information about the price be-
fore the service is rendered—has
emerged.
As consumers are asked to pay more
for health care services, understanding
and anticipating those costs may be
increasingly important to them. At the
same time, consumers must be able to
consume value through shopping, by
choosing lower-priced high-quality pro-
viders. Insurers, employers, and gov-
ernments also have an interest in great-
er price transparency as they hope it
will lead to lower spending on health
care. In general, two main arguments
have been advanced for how price
transparency may lower spending on
health care.1 First, consumers will be
able to know the full cost of services
before receiving them, and will be able
to choose lower-cost services or provid-
ers, while holding quality constant. Sec-
ond, when pricing information is public-
ly available, health care providers will
be incentivized to lower their prices to
be more competitive (for more infor-
mation about the difficulties with this,
see CBO 20082). This issue brief focuses
on the first of these: the potential for
consumer activity to lower overall
health care spending.
One study has estimated that price
transparency efforts could save $100
billion dollars over a decade.3 Of this
amount, $18 billion could come from
greater consumer access to pricing in-
formation. In theory, consumers would
use pricing information to comparison
shop for their health care services and
providers. However, not all health care
services are shoppable. It should not be
expected that someone pull out his or
her Smartphone and research the low-
est price emergency room before dial-
ing 911. For a health care service to be
“shoppable,” it must be a common
health care service that can be re-
searched (“shopped”) in advance; mul-
tiple providers of that service must be
available in a market (i.e., competition);
and sufficient data about the prices and
quality of services must be available.
Another study has estimated that only
about one third of total health care
spending in a given year is on services
that are shoppable.4 Also notable is
that consumer shopping does not have
to be limited to comparisons across
providers for Service X. Consumers may
also choose to compare the cost of Ser-
vice X with the cost of Service Y or even
choose not to receive Service X at all.
Issue Brief #11
March 2016
Analysis
This analysis replicated the White and
Eguchi methodology as closely as possible
using the HCCI dataset weighted to be
nationally representative. The HCCI study
population comprised individuals younger
than age 65 and covered by employer-
sponsored insurance (ESI). The analysis
was conducted using 2011 data compara-
ble to those of White and Eguchi. Using
their definition of “shoppable” health care
services, we examined the total spending
on these services. As defined by White
and Eguchi, shoppable services are those
that are both the highest-spending and
could be scheduled in advance of receiv-
ing the service. That is not to say that
shopping for each of these services would
be practical for an individual, only that he
or she could shop for the service. Health
care services are divided into six general
categories, as shown in Table 1.5 (See Data
and Methods for more information about
the categories of services and the meth-

2 www.healthcostinstitute.org
odology used in the analysis.) The num-
bers presented in this issue brief should
be viewed as estimated upper-bound
maximums for the amount of money that
could be spent on shoppable and non-
shoppable services. It is important to
note that this analysis did not incorporate
market features (e.g., number of provid-
ers in a market, insurer concentration),
geographic location (e.g., rural, urban,
population), or health status (e.g., per-
centage of population with serious health
problems).
Total health care spending
In 2011, total spending on all health care
services for the national ESI population
was estimated at $524.2 billion. Of this
amount, we found that at most, 43% of
total spending was on services that can
be considered shoppable. This is in con-
trast to, and higher than, the one-third of
spending on shoppable services found by
White and Eguchi. One reason for this
difference could be the study popula-
tions, as the White and Eguchi study pop-
ulation included mainly urban auto-
workers and their families, whereas the
HCCI population was weighted to be na-
tionally representative.
As seen in Figure 1, the largest piece of
the spending “pie” was for shoppable
outpatient/physician services (34% of
total spending), followed by non-
shoppable outpatient/physician services
(33% of total spending). This suggests
that in 2011, more dollars were spent on
shoppable outpatient/physician services
than on non-shoppable outpatient/
physician services. In contrast, more was
spent on non-shoppable inpatient ser-
vices than on shoppable inpatient ser-
vices. And hip and knee replacements,
which are considered shoppable, add
only an additional 1.3% to the shoppable
inpatient services category. These dispar-
ate findings may reflect differences in the
mix and use of services between the two
categories: inpatient services and outpa-
tient/physician services. For example,
there are more services that are consid-
ered shoppable among the shoppable
outpatient/physician services than
among the shoppable inpatient services
category, and far more outpatient/
physician services than inpatient admis-
sions are used in a given year. Overall,
however, more than half of the spending
in 2011 was on services not considered
shoppable.
Out-of-pocket spending for health care
For consumers—those potentially actual-
ly shopping—out-of-pocket spending
should be more important than total
Source: HCCI, 2016. Claims data from employer-sponsored insurance (ESI) population younger than age 65 for the year 2011, data weighted to be nationally representa-tive.
Source: HCCI, 20156 Note: Categories of services used in the analysis are based on the schema designed by Chapin and White..
Table 1: Description of Categories of Services
Shoppable Inpatient Admissions
Shoppable Knee and Hip Replace-ment Admissions
Shoppable Outpa-tient/Physician Services
Non-Shoppable Inpatient Admis-sions
Non-Shoppable Outpatient/Physician Services
Prescription Drugs
68 DRG-based ad-missions
5 DRG-based ad-missions
277 CPT or HCPCS codes
Other hospital admissions not considered shop-pable
Other outpatient/physician claims not considered shoppable
Prescription drug and device claims filled through a pharmacy
3 www.healthcostinstitute.org
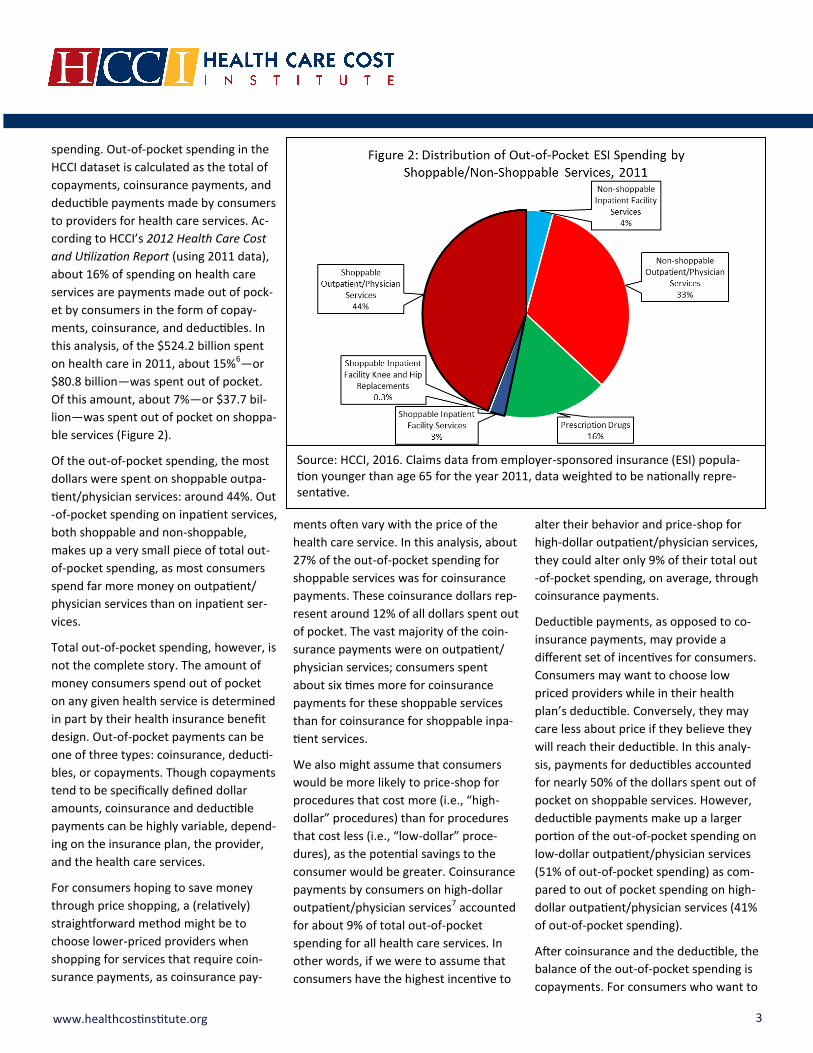
spending. Out-of-pocket spending in the
HCCI dataset is calculated as the total of
copayments, coinsurance payments, and
deductible payments made by consumers
to providers for health care services. Ac-
cording to HCCI’s 2012 Health Care Cost
and Utilization Report (using 2011 data),
about 16% of spending on health care
services are payments made out of pock-
et by consumers in the form of copay-
ments, coinsurance, and deductibles. In
this analysis, of the $524.2 billion spent
on health care in 2011, about 15%6—or
$80.8 billion—was spent out of pocket.
Of this amount, about 7%—or $37.7 bil-
lion—was spent out of pocket on shoppa-
ble services (Figure 2).
Of the out-of-pocket spending, the most
dollars were spent on shoppable outpa-
tient/physician services: around 44%. Out
-of-pocket spending on inpatient services,
both shoppable and non-shoppable,
makes up a very small piece of total out-
of-pocket spending, as most consumers
spend far more money on outpatient/
physician services than on inpatient ser-
vices.
Total out-of-pocket spending, however, is
not the complete story. The amount of
money consumers spend out of pocket
on any given health service is determined
in part by their health insurance benefit
design. Out-of-pocket payments can be
one of three types: coinsurance, deducti-
bles, or copayments. Though copayments
tend to be specifically defined dollar
amounts, coinsurance and deductible
payments can be highly variable, depend-
ing on the insurance plan, the provider,
and the health care services.
For consumers hoping to save money
through price shopping, a (relatively)
straightforward method might be to
choose lower-priced providers when
shopping for services that require coin-
surance payments, as coinsurance pay-
ments often vary with the price of the
health care service. In this analysis, about
27% of the out-of-pocket spending for
shoppable services was for coinsurance
payments. These coinsurance dollars rep-
resent around 12% of all dollars spent out
of pocket. The vast majority of the coin-
surance payments were on outpatient/
physician services; consumers spent
about six times more for coinsurance
payments for these shoppable services
than for coinsurance for shoppable inpa-
tient services.
We also might assume that consumers
would be more likely to price-shop for
procedures that cost more (i.e., “high-
dollar” procedures) than for procedures
that cost less (i.e., “low-dollar” proce-
dures), as the potential savings to the
consumer would be greater. Coinsurance
payments by consumers on high-dollar
outpatient/physician services7 accounted
for about 9% of total out-of-pocket
spending for all health care services. In
other words, if we were to assume that
consumers have the highest incentive to
alter their behavior and price-shop for
high-dollar outpatient/physician services,
they could alter only 9% of their total out
-of-pocket spending, on average, through
coinsurance payments.
Deductible payments, as opposed to co-
insurance payments, may provide a
different set of incentives for consumers.
Consumers may want to choose low
priced providers while in their health
plan’s deductible. Conversely, they may
care less about price if they believe they
will reach their deductible. In this analy-
sis, payments for deductibles accounted
for nearly 50% of the dollars spent out of
pocket on shoppable services. However,
deductible payments make up a larger
portion of the out-of-pocket spending on
low-dollar outpatient/physician services
(51% of out-of-pocket spending) as com-
pared to out of pocket spending on high-
dollar outpatient/physician services (41%
of out-of-pocket spending).
After coinsurance and the deductible, the
balance of the out-of-pocket spending is
copayments. For consumers who want to
Source: HCCI, 2016. Claims data from employer-sponsored insurance (ESI) popula-tion younger than age 65 for the year 2011, data weighted to be nationally repre-sentative.
4 www.healthcostinstitute.org
save money on their health care services,
price-shopping services that are mainly
paid for by copayments (rather than
through coinsurance or deductible pay-
ments) may not be a very effective way
to save money. Copayments are generally
a fixed price for a service and are set by
the health plan: for example, a $20 flat
fee to see an in-network primary care
provider. One fourth of the dollars spent
out of pocket on shoppable services were
for copayments in 2011. Copayments
seem to have the largest effect on low-
dollar shoppable outpatient/physician
services, where 30% of out-of-pocket
spending on this category of services was
through copayments. In contrast, copay-
ments on shoppable high-dollar outpa-
tient/physician services accounted for
only 2% of the out-of-pocket spending.
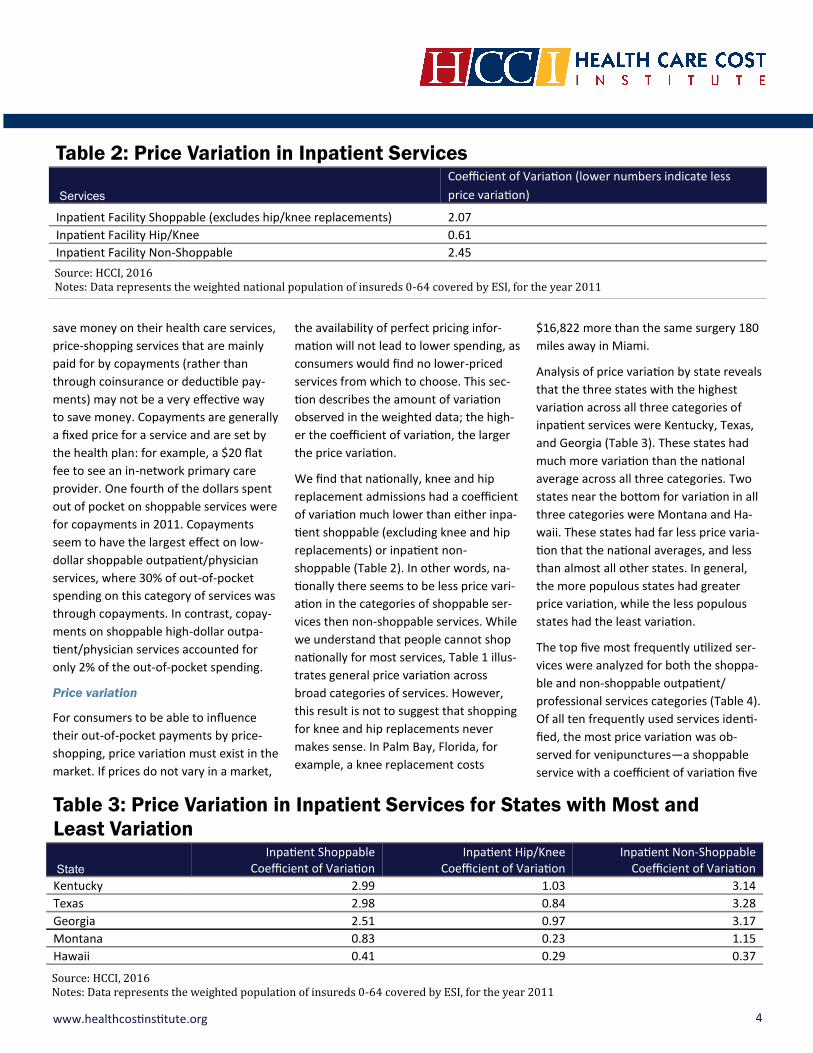
Price variation
For consumers to be able to influence
their out-of-pocket payments by price-
shopping, price variation must exist in the
market. If prices do not vary in a market,
the availability of perfect pricing infor-
mation will not lead to lower spending, as
consumers would find no lower-priced
services from which to choose. This sec-
tion describes the amount of variation
observed in the weighted data; the high-
er the coefficient of variation, the larger
the price variation.
We find that nationally, knee and hip
replacement admissions had a coefficient
of variation much lower than either inpa-
tient shoppable (excluding knee and hip
replacements) or inpatient non-
shoppable (Table 2). In other words, na-
tionally there seems to be less price vari-
ation in the categories of shoppable ser-
vices then non-shoppable services. While
we understand that people cannot shop
nationally for most services, Table 1 illus-
trates general price variation across
broad categories of services. However,
this result is not to suggest that shopping
for knee and hip replacements never
makes sense. In Palm Bay, Florida, for
example, a knee replacement costs
$16,822 more than the same surgery 180
miles away in Miami.
Analysis of price variation by state reveals
that the three states with the highest
variation across all three categories of
inpatient services were Kentucky, Texas,
and Georgia (Table 3). These states had
much more variation than the national
average across all three categories. Two
states near the bottom for variation in all
three categories were Montana and Ha-
waii. These states had far less price varia-
tion that the national averages, and less
than almost all other states. In general,
the more populous states had greater
price variation, while the less populous
states had the least variation.
The top five most frequently utilized ser-
vices were analyzed for both the shoppa-
ble and non-shoppable outpatient/
professional services categories (Table 4).
Of all ten frequently used services identi-
fied, the most price variation was ob-
served for venipunctures—a shoppable
service with a coefficient of variation five
Table 2: Price Variation in Inpatient Services
Services
Coefficient of Variation (lower numbers indicate less
price variation)
Inpatient Facility Shoppable (excludes hip/knee replacements) 2.07
Inpatient Facility Hip/Knee 0.61
Inpatient Facility Non-Shoppable 2.45
Source: HCCI, 2016 Notes: Data represents the weighted national population of insureds 0-64 covered by ESI, for the year 2011
Table 3: Price Variation in Inpatient Services for States with Most and
Least Variation
State
Inpatient Shoppable Coefficient of Variation
Inpatient Hip/Knee Coefficient of Variation
Inpatient Non-Shoppable Coefficient of Variation
Kentucky 2.99 1.03 3.14
Texas 2.98 0.84 3.28
Georgia 2.51 0.97 3.17
Montana 0.83 0.23 1.15
Hawaii 0.41 0.29 0.37
Source: HCCI, 2016 Notes: Data represents the weighted population of insureds 0-64 covered by ESI, for the year 2011

5 www.healthcostinstitute.org
times larger than that for urinalysis, the
service with the second-most observed
price variation. Overall, the level of varia-
tion is fairly similar across categories and
is possibly a bit higher for the shoppable
identified services as compared to the
non-shoppable services.
Another frequently discussed shoppable
procedure is colonoscopies (CPT code
45378). The national price variation for
colonoscopies (coefficient of variation =
0.95) is relatively similar to that of the
procedures displayed in Table 4. Howev-
er, as noted above, price variation also
varies across geographies. The greatest
price variation for colonoscopies was ob-
served for Arizona (coefficient of variation
= 1.36); Florida (coefficient of variation =
1.35); and Kentucky (coefficient of varia-
tion = 1.32). At the other end of the spec-
trum, the states with the least variation
were South Dakota (coefficient of varia-
tion = 0.30); Alaska (coefficient of varia-
tion = 0.29); and Hawaii (coefficient of
variation = 0.15).
Discussion
One barrier to consumer shopping is the
presence and/or perception of transac-
tion costs, whereby the costs of shopping
appear to be higher than the perceived
benefits. This may apply especially to low-
er-cost services, and services with con-
sumer payments mandated by the benefit
design (e.g., pre-set copayments for doc-
tor visits). In terms of a simple calculus:
the benefits of shopping must exceed the
individual’s costs associated with shop-
ping, in order to achieve the desired out-
come of price shopping. This provides two
possible ways whereby interventions
could encourage consumers to price-shop
for the health care services: lowering
costs and/or increasing benefits.
Lowering the costs associated with shop-
ping is possible and there are many pri-
vate and public efforts made at this. For
example, HCCI’s Guroo.com, pricing tools
available to the members of many health
insurers, and state efforts at building all-
payer claims databases (APCDs)—in
states such as Vermont—and creating
pricing Websites as in New Hampshire
and Maine. However, even in a world
with perfect pricing information, consum-
ers must perceive benefits to want to
gather and then apply the information.
While raising benefits may seem more
difficult than lowering the costs associat-
ed with shopping, early efforts at these
types of efforts are ongoing and may
prove fruitful at saving money. One nota-
ble example of this is the reference-based
pricing program implemented by Califor-
nia Public Employees’ Retirement System
(CalPERS) for knee and hip replacements.
Based on the implementation of this pro-
gram, procedures at lower-cost facilities
increased while procedures at higher-cost
facilities decreased. This reference price
program was estimated to save the state
of California $2.8 million and saved
CalPERS members an additional $300,000
in out-of-pocket costs.8
Another idea would be a modification of
the reference price model into a benefits-
sharing model. Once the reference price
is set, if consumers chose providers with
prices above the reference price, they
would pay the difference, whereas if they
chose a provider under the reference
price—holding quality constant—they
would share in the savings. An important
note is that this type of incentive struc-
ture would require information about
provider quality, so consumers were not
forced to choose lower-quality care to
save money. And, at the same time,
standardizing quality across the health
care system would remove quality from
this process. Additionally, this type of
Table 4: Price Variation in the Most Frequently Utilized Procedures for
Shoppable and Non-Shoppable Outpatient/Professional Services
Outpatient Shoppable CPT Code Coefficient of Variation
Outpatient Non-Shoppable CPT Code Coefficient of Variation
Established patient office visit, level 3: 99213 0.54
Immunization administra-tion: 90460 0.86
Established patient office visit, level 4: 99214 0.51
Chiropractic manipulative therapy: 98940 0.51
Collection of venous blood through venipuncture: 36415 10.89 Urinalysis: 81001 2.02
Therapeutic exercises: 97110 1.05
E&M emergency room visit, moderate severity: 99283 0.88
Manual therapy techniques: 97140 1.08 Rapid strep test: 87880 0.80
Source: HCCI, 2016 Notes: Data represents the weighted national population of insureds 0-64 covered by ESI., for the year 2011

6 www.healthcostinstitute.org
incentive structure could work only for
specific health services that are shoppa-
ble; if prices are high; where consumer
payments are not set ahead of time (i.e.,
copayments); pricing and quality infor-
mation is available; there are a sufficient
number of providers in market from
which to choose; and where there is a
wide variation in the distribution of prices
for that service within the geography.
The limits of price transparency and
shopping
Some evidence suggests that greater
price transparency and emphasis on price
shopping by consumers might lower
spending on health care—for states, in-
surers, employers, and consumers.3 At the
same time, however, logistical and incen-
tive roadblocks prevent full realization of
the goals of price transparency efforts.
Patient limits: Some of the biggest limita-
tions in price-shopping by consumers are
from the patients themselves. Most im-
portant, if an individual is very sick, he or
she might not be able or willing to shop
for services, even if the needed services
can be defined—or utilized by others—as
shoppable. Additionally, though some
services might be considered shoppable,
such as a venipuncture, shopping for that
service might not be convenient, practi-
cal, or advisable. Many such services
often take place at a patient’s usual care
source (i.e., their primary care physician’s
office) and, as such, shopping for a differ-
ent provider to provide small routine ser-
vices may present difficulties, or even
hardships, to many. There is also a sizable
segment of the ESI-covered population
that is largely unengaged from the health
care system. In any given year, roughly
25% of HCCI’s ESI population does not
have a health care claim (see “The per-
centage of HCCI’s ESI population that has
no health insurance claim (2010–2014)”).
Engaging these individuals as consumer
price shoppers may be difficult and not
immediately productive.
Integrated care: An important theme
within the Affordable Care Act was the
development of a comprehensive and
integrated medical records system across
the health care system. However, nearly 4
years out from the ACA implementation,
this worthy goal has yet to be wholly real-
ized. Shopping for low priced health care
services seems likely to lead to consumers
accessing care and services from a variety
of providers. Without an integrated rec-
ords system, health care providers will
have a difficult time providing quality
care. This shopping for providers also may
be at odds with other ACA initiatives, such
as Accountable Care Organizations
(ACOs), whose goal is to coordinate pa-
tient care across providers.
Prescription drugs: In this analysis, pre-
scription drugs are not considered shop-
pable services. This is not because it is
impossible for consumers to shop for low-
er drug prices; rather, it is an open ques-
tion as to how consumers should be in-
centivized to shop for their prescriptions.
Without an integrated data system, shop-
ping could increase the risk of drug inter-
actions.
Benefit design: As noted above, consumer
payments made out of pocket on health
care services are often largely determined
by the specific benefit design of their in-
surance plan. Some basic benefit design
features may make consumers either
more or less likely to price-shop, absent
any other cost or benefit calculations. On
one hand, for example, benefit designs
that are heavily dominated by copay-
ments may deter consumers from price
shopping. On the other hand, shopping
may make the most sense for people in
high-deductible health plans (HDHPs), as
these consumers tend to face the highest
(and perhaps the most variable) deducti-
ble and coinsurance costs.
Conclusions
The analysis presented here suggests that
a large portion of health care spending
every year is on services for which con-
sumers could price-shop ahead of receiv-
ing them. As much as 43% of the dollars
spent on health care services in 2011
The percentage of HCCI’s ESI population that has no health insurance claim (2010-2014)
In any given year, about 25% of the population of individuals younger than age 65 and covered by ESI in HCCI’s dataset (unweighted) have no health care claim filed with their insurer. Though this percentage of non-utilizers has increased slightly over time, it has remained at around a quarter of the population in all years.
Year Percentage of Non-Utilizers
2010 25.3%
2011 24.3%
2012 24.6%
2013 25.1%
2014 26.9%
Source: HCCI, 2016 Notes: Data represents the population of insureds 0-64 covered by ESI..
7 www.healthcostinstitute.org
were for such shoppable services. For
consumers, shoppable services totaled
about 47% of their portion of the health
care bill. This is an interesting finding—
that consumers might be able to effect,
on average, up to nearly half of their
yearly out-of-pocket payments by price-
shopping. Given the limits of benefit de-
sign, however, altering some of this total
may be difficult for consumers.
The parts of out-of-pocket spending that
might be variable, and therefore have the
potential to be lowered through price-
shopping, are coinsurance and deductible
payments. Coinsurance and deductible
payments made up 75% of the out-of-
pocket spending on shoppable services in
2011. This totaled 35% of all of the out-of
-pocket spending in that year. One take-
away from this might be that on average,
consumers may be able to alter a third of
their out-of-pocket health care spending
in a given year. This could mean im-
portant savings for people with serious
health conditions or people with high
deductible plans. At the same time, this
also suggests that on average, consumers
will have difficulty altering 65% of the out
-of-pocket spending. While 46% of total
out-of-pocket spending was on shoppa-
ble services, 53% of out-of-pocket spend-
ing was on non-shoppable services.
Overall, we come to the conclusion that
the potential gains from the consumer
price shopping aspect of price transpar-
ency efforts are modest. There are those
arguing that we need to design health
care systems and price transparency
tools with consumer price shopping as
central goals. Though one important fea-
ture of properly functioning markets is
the availability of both price and quality
information, consumer activity driven by
this information should not be the focus.
Rather, we believe that delivery systems
should be designed without consumer
shopping at the fore and view any bene-
fits from shopping as a positive outcome.
Limitations
Our study has several limitations that can
affect the interpretation of the findings.
For this reason, HCCI considers its work a
starting point for analysis and research
on the cost of shoppable services for indi-
viduals younger than age 65 covered by
ESI.
Our findings are estimates for the United
States ESI population based on a sample
of approximately 25% of ESI insureds
younger than age 65. The estimates for
numbers of insured individuals by each
plan type were weighted to account for
any demographic differences between
the analytic sample and population esti-
mates based on the United States Cen-
sus, making the dataset representative of
the national, ESI population younger than
age 65. The tables and figures presented
are limited to descriptive statistics for
they study population. Finally, the num-
bers presented here represent an outer-
upper bounds for potential totals of
spending and shoppable services. Follow
up analyses that include finer precision
and more potential factors, such as place
of service, could further refine these
numbers.
Data and Methods
This issue brief utilized the Health Care
Cost Institutes’ dataset of private insur-
ance health care claims. The final analytic
dataset consisted of individuals who
were covered by ESI for calendar year
2011. To be included in the study popula-
tion individuals must have been younger
than age 65 in 2011, had an identifiable
age and gender, and a valid state, zip
code, or core-based statistical area
(CBSA) of residence. If an individual had
multiple states of residence listed in
2011, the state from the first month of
insurance in 2011 was used. The final
study population was weighted by age-
gender-state to be representative of the
national population.
Emergency room visits: The original
methodology designed by White and
Eguchi classified otherwise shoppable
services (inpatient and outpatient/
physician) as non-shoppable if there was
evidence of an emergency room (ER) visit
within the 3 days prior to the service uti-
lization. ER visits were identified as out-
patient claims with a 23 point of service
(POS) claim or a 450, 451, 452, 456, or
459 revenue code.
Outpatient/physician services: Outpa-
tient and physician claims were com-
bined and then divided into shoppable
and non-shoppable services by the CPT
or HCPCS code on the claim (see outpa-
tient/physician shoppable CPT and HCPCS
codes). Claim lines were removed from
the sample if there were null vales for
the procedure code, and all three diagno-
sis codes.
Inpatient admissions: To create an inpa-
tient admission, all inpatient claim lines
with the same patient identification num-
ber, admit identification number, and
first admission date were combined. The
three categories of inpatient admissions
(shoppable inpatient admissions – ex-
cluding knee and hip replacements; shop-
pable knee and hip replacements; non-
shoppable inpatient admissions) were
classified by the diagnosis-related group
(DRG) for each admission (see all shoppa-
ble inpatient admissions DRGs). If any
claim line in an admission had a DRG
from the list of shoppable DRGs, admis-
sion was considered shoppable. If an ad-
mission had DRGs from both the shoppa-
ble inpatient and shoppable knee and hip
replacement lists then the following rules
were applied. 1) If the DRG was 945, 462,

8 www.healthcostinstitute.org
494, or 491, then the admission was con-
sidered a shoppable knee and hip re-
placement. 2) If the DRG was any other
from the shoppable admissions list, than
the admission was classified by the DRG
with the earliest claim date. If the total
allowed amount of an admission
summed to less than $50, the average
allowed amount for the whole category
was substituted for the less than $50
amount. Several rules were also applied
to limit outlier admissions. Admissions
were removed from the sample if:
The length of stay was greater than 180
days or less than 1 day;
The allowed amount on the admission
summed to less than or equal to zero
dollars;
All claim lines for the admission had a
null DRG or null major diagnostic cate-
gory (MDC).
Endnotes
1. Muir MA, Alessi SA, King JS. “Clarifying
Costs: Can Increased Price Transpar-
ency Reduce Healthcare Spending?”
William & Mary Policy Review 4
(2013): 319-–366. Web.
2. Congressional Budget Office.
“Increasing Transparency in the Pric-
ing of Health Care Services and Phar-
maceuticals.” CBO.gov. Web. 2008.
3. White C, Ginsburg PB, Tu HT, Reschov-
sky JD et al. Healthcare Price Trans-
parency: Policy Approaches and Esti-
mated Impacts on Spending. West
Health Policy Center. Web. May 2014.
4. White C, Eguchi M. Reference Pricing:
A Small Piece of the Health Care Price
and Quality Puzzle. National Institute
for Health Care Reform Research Brief
Number 18. Web. October 2014.
5. For a full list of DRG and CPT/HCPCS
used to categorize services, see the
online appendix of White and Eguchi.
6. Differences between these two num-
bers are likely due to small differences
in study populations and population
weighting techniques.
7. High dollar outpatient/physician ser-
vices are defined here as services
whose average price is two standard
deviations above the mean price for
the whole category. For shoppable
outpatient/physician services this is
an average price of about $1,000.
8. Robinson JC, Brown TT. “Increases in
Consumer Cost Sharing Redirect Pa-
tient Volumes and Reduce Hospital
Prices for Orthopedic Surgery.” Health
Affairs 32.8 (2013): 1392-1397
Authors
Amanda Frost, David Newman
Contact
Amanda Frost
Health Care Cost Institute, Inc. 1100 G Street NW, Suite 600 Washington, DC 20005 202-803-5200
This HCCI research product originated in response to sugges-tions by an independent third party. The authors retained control over all methods, content, and dissemination of the results.
Copyright 2016
Health Care Cost Institute, Inc. Unless explicitly noted, the content of this report is licensed under a Creative Commons Attribution Non-Commercial No Derivatives 4.0 International License
Acknowledgements
The authors would like to acknowledge and thank Lynn Quincy and Chapin White for their assistance in the develop-ment of this issue brief.