setton et al. - 2015 - identifying potential exposure reduction priorities using regional rankings...
TRANSCRIPT
Identifying potential exposure reduction prioritiesusing regional rankings based on emissions ofknown and suspected carcinogens to outdoor airin CanadaSetton et al.
Setton et al. Environmental Health (2015) 14:69 DOI 10.1186/s12940-015-0055-2
RESEARCH Open Access
Identifying potential exposure reductionpriorities using regional rankings based onemissions of known and suspectedcarcinogens to outdoor air in CanadaEleanor M. Setton1*, Basil Veerman1, Anders Erickson1, Steeve Deschenes1, Roz Cheasley1, Karla Poplawski1,Paul A. Demers2 and C. Peter Keller1
Abstract
Background: Emissions inventories aid in understanding the sources of hazardous air pollutants and how thesevary regionally, supporting targeted reduction actions. Integrating information on the relative toxicity of emittedpollutants with respect to cancer in humans helps to further refine reduction actions or recommendations, but fewnational programs exist in North America that use emissions estimates in this way. The CAREX Canada EmissionsMapping Project provides key regional indicators of emissions (total annual and total annual toxic equivalent, circa2011) of 21 selected known and suspected carcinogens.
Methods: The indicators were calculated from industrial emissions reported to the National Pollutant ReleaseInventory (NPRI) and estimates of emissions from transportation (airports, trains, and car and truck traffic) andresidential heating (oil, gas and wood), in conjunction with human toxicity potential factors. We also includesubstance-specific annual emissions in toxic equivalent kilograms and annual emissions in kilograms, to allow forranking substances within any region.
Results: For provinces and territories in Canada, the indicators suggest the top five substances contributing to thetotal toxic equivalent emissions in any region could be prioritized for further investigation. Residents of Quebec andNew Brunswick may be more at risk of exposure to industrial emissions than those in other regions, suggesting thata more detailed study of exposure to industrial emissions in these provinces is warranted. Residential wood smokemay be an important emission to control, particularly in the north and eastern regions of Canada. Residential oiland gas heating, along with rail emissions contribute little to regional emissions and therefore may not be animmediate regional priority.
Conclusions: The developed indicators support the identification of pollutants and sources for additional investigationwhen planning exposure reduction actions among Canadian provinces and territories, but have important limitationssimilar to other emissions inventory-based tools. Additional research is required to evaluate how the EmissionsMapping Project is used by different groups and organizations with respect to informing actions aimed atreducing Canadians’ potential exposure to harmful air pollutants.
Keywords: Canada, Pollution, Toxicity, Health, Provinces, Industry, Transportation, Residential heating
* Correspondence: [email protected] Sciences Research Lab, University of Victoria – Geography, PO Box3060 STN CSC, Victoria, BC V8W 3R4, CanadaFull list of author information is available at the end of the article
© 2015 Setton et al. Open Access This article is distributed under the terms of the Creative Commons Attribution 4.0International License (http://creativecommons.org/licenses/by/4.0/), which permits unrestricted use, distribution, andreproduction in any medium, provided you give appropriate credit to the original author(s) and the source, provide a link tothe Creative Commons license, and indicate if changes were made. The Creative Commons Public Domain Dedication waiver(http://creativecommons.org/publicdomain/zero/1.0/) applies to the data made available in this article, unless otherwise stated.
Setton et al. Environmental Health (2015) 14:69 DOI 10.1186/s12940-015-0055-2
BackgroundExposure to hazardous pollutants in outdoor air is ubi-quitous, affecting large populations and impacting health[1–4]. In conjunction with measuring pollutant levels inoutdoor air, understanding the sources of pollutants,their relative and cumulative contribution to potentialhealth impacts, and how these vary regionally is key todeveloping targeted emissions reduction strategies [5].Emissions inventories are commonly used to estimate
the relative contributions of various sources of pollut-ants in one or more geographic areas. Emitters are typic-ally spatially referenced and categorized as point sources(e.g., industrial and commercial operations at specificlocations), line sources (e.g., transportation), and areasources (e.g., agriculture). In Canada, the federal govern-ment maintains the National Pollutant Release Inventory(NPRI) and requires industrial and commercial pointsources above a certain size to report annual releasesand transfers to air, land and water [6]. National emissionsinventories that include point, line and area sources areprepared by the federal government [7], and more detailedregional or local emissions inventories are sometimesprepared by provincial and municipal governments [8, 9].While emissions inventories provide readily available
information on the relative contribution of many differ-ent sources to total emissions for individual pollutants,there are limitations in using them for directly prioritiz-ing population exposure reduction activities. Firstly, theemission levels may not be based on actual monitoringdata at each site, but on industrial production levels orfuel usage in combination with emission factors, whichprovides only estimates of emissions amounts [10]. Emis-sion factors can be difficult to establish (or missing) formany pollutants, and can be out of date if technologieschange [11]. Secondly, the amount of a substance emittedis a coarse indicator of population exposure. Many factorsinfluence the actual concentration of a pollutant in out-door air, including wind speed and direction at the time ofemission, and how quickly the pollutant degrades or set-tles. These dispersion factors affect the spatial pattern ofpollution levels and in turn, how many people are actuallyexposed. Thirdly, the toxicity of each pollutant is an im-portant consideration when prioritizing exposure reduc-tion activities. A small emission of a highly toxic pollutantmay be a higher priority than a large emission of a rela-tively benign pollutant.In North America, only one national initiative has
used a detailed emissions inventory in combination withboth air quality modelling and toxicity information todevelop indicators for ranking pollutant emissions basedon potential health impacts. The United States Environ-mental Protection Agency (US EPA) conducts ongoingevaluations of a wide range of air pollutants under theNational-Scale Air Toxics Assessment (NATA) program
[12]. Four national assessments have been completed todate (1996, 1999, 2002 and 2005), each providing esti-mates of ambient concentrations of toxic air pollutantsfor most census tracts in the US and the associatedcancer and non-cancer chronic risks (when possible andapplicable) for their residents. In 2005, census tract-levelambient concentration estimates for 177 air pollutantswere produced by modelling the dispersion of emissionsfrom a variety of sources, including large industries asreported to the Toxic Release Inventory (TRI), smallpoint sources such as gas stations and dry cleaners, on-and off-road vehicle traffic, as well as marine vessels andtrains. Given estimated ambient concentrations, long-term health risks (cancer and non-cancer) were esti-mated by calculating exposure (intake) and applyingcancer risk factors or non-cancer hazard quotients tothe resulting intake level. This process enables the rank-ing of air pollutants based on lifetime excess cancer riskor non-cancer hazard indices in each census tract.Other national initiatives exist but are not as compre-
hensive as NATA. Scorecard [13], a non-governmentalinitiative in the US, presents hazard indicators based onthe 1996 NATA estimates of ambient concentrations inconjunction with their own selection of cancer and non-cancer potency factors and, in some cases, more currentpopulation data (year 2000). Unlike the NATA indica-tors, the Scorecard indicators do not calculate exposureusing standard breathing rates and time spent outdoors,but instead treat the estimated ambient concentration asequivalent to individual exposure. Taking Stock Online[14], developed by the Commission for EnvironmentalCooperation (CEC), provides a synthesis of emissions re-ported to the Canadian NPRI, the US TRI, and Mexico'sRegistro de Emisiones y Transferencia de Contaminates(RETC), but does not include emissions from other non-reporting sources (i.e., transportation). The same cancerand non-cancer potency factors used by Scorecard areapplied to emission amounts to produce toxic equivalentemissions which are presented as risk scores. In Canada,Pollution Watch uses only NPRI data and so does notinclude emissions from other potential sources. Pollut-ants are categorized according to potential health effects(carcinogen, endocrine disruptor, respiratory toxicant, orreproductive/development toxicant). Total emissions,not toxic equivalent emissions, are used as indicators forranking.Spatial querying and reporting using online maps is a
feature common to NATA, Scorecard, Taking StockOnline and Pollution Watch. NATA produces results forevery county in the US and Google Earth files showingindicators for cumulative cancer and non-cancer riskdue to inhalation of air toxics can be downloaded stateby state [15]. In Google Earth, each county has a pop-up window providing details about the pollutants
Setton et al. Environmental Health (2015) 14:69 Page 2 of 15

contributing to the health risk and the major sources.Scorecard provides a clickable map interface on theirwebsite to access state-specific reports, and allowszipcodes to be entered to see community-based reports[16]. Taking Stock Online lets users select reportingregions (national and state/province), air pollutants byname or type (e.g., developmental/reproductive toxins orknown/ suspected carcinogens) and display the toxicequivalent emissions. In addition, a Google Earth filecan be downloaded showing the location of each emit-ting facility in North America [17]. Pollution Watchincludes an option on their website to create a report ofemitters by substance type or specific name, or for aresidential address and user-defined buffer distance [18].Canadian information on air pollutants is provided by
Pollution Watch and Taking Stock Online, althoughboth initiatives are based solely on emissions reported tothe NPRI, omitting potentially large sources of pollut-ants. For example, in 2011, Environment Canada esti-mated emissions of fine particulates in Canada to be onthe order of 1.18 million tonnes [7]. Of that, 73 % wasattributed to dust from agriculture, construction, andtransportation; 9 % to residential wood burning; 6 % toforest fires; and only 6 % to industrial activities (of whichthe NPRI captures only those above the reportingthresholds). Similarly, of the 2 million tonnes of totalvolatile organic compounds estimated to be emitted byhuman sources in 2011, 691,000 tonnes were attributedto industrial activities, 470,228 to mobile sources, and148,425 to residential wood burning. Developing an ac-curate, spatially detailed emissions inventory of the kindrequired to support air quality modelling comparable toNATA is a substantial undertaking beyond the scope ofmany organizations. The goal of understanding whichhuman sources and associated pollutants contributemost to potential health impacts, however, suggests thatit would be useful to include at least the most significantsources in addition to industrial activities.The objectives of this paper are twofold. First, we
describe the development and implementation of theCAREX Emissions Mapping Project (EMP) in Canada, aGoogle Earth-based data set that includes indicatorsbased on emissions of 21 known and suspected carcino-gens to air, as reported to the NPRI and from our ownestimates of emissions from transportation and residen-tial heating, circa 2011 [19]. The EMP thus representsan intermediate level between those initiatives using onlyreported industrial emissions, and those requiring highlydetailed spatial data on emissions and expertise in dis-persion modelling. Secondly, we illustrate the use of theindicators for identifying potential exposure reductionpriorities among provinces and territories in Canada. Ingeneral, the indicators should be considered as analo-gous to screening-level risk or impact assessments.
These relatively simple indicators serve only as a firstpass, helping to highlight substances or sources that maybe of concern, and therefore warrant additional attentionthrough more detailed analyses.
MethodsOur approach was informed by four key goals: 1) to benational in scope; 2) to support prioritization of poten-tial exposure reduction activities both among substancesand geographic regions; 3) to support surveillance oftrends; and 4) to use only publicly available existing data.We use total toxic equivalent emissions (Total TEQ)
as the overall indicator for the EMP, which is the sum ofannual emissions to air, in toxic equivalent kilograms ofbenzene, for 17 of the 21 selected known and suspectedcarcinogens. The indicator is meant to illustrate differ-ences in Canadians’ potential exposure to these sub-stances in outdoor air for the year 2011. Total TEQ wascalculated from data reported to the National PollutantRelease Inventory (NPRI) and our own estimates ofemissions from transportation (airports, trains, and carand truck traffic) and residential heating (oil and gas,wood), in conjunction with human toxicity potentialfactors developed by EG Hertwich et al. [20]. We alsoinclude substance-specific annual emissions in toxicequivalent kilograms (TEQ), and annual emission inkilograms (TE), to allow for ranking substances withinany region. TE was calculated for four additional sub-stances of interest that were not included in Total TEQor TEQ due to the lack of a toxicity factor.The indicators were calculated for Canada as a whole
(n = 1), each province or territory (n = 13), ecozones(n = 15) health regions (n = 133), watersheds (n = 594),and within 25 km of major cities (n = 159). We choseto provide the indicators for different region types fortwo reasons: first, the larger regions provide the indicatorsfor areas of interest to policy makers and regulators (prov-inces/territories, health regions, watersheds and ecore-gions), and; secondly, the city-level indicators (within25 km of city centres) provide a better level of spatialdetail in terms of population locations. For example, auser could look at the indicators for health regions, andoverlay the indicators for major cities to get a better un-derstanding of the potential population exposure.In addition to the indicators, we provide geo-
referenced files of the major industrial emitters thatcan be overlaid with the region files, again to provide avisualization of the relative size of emissions reportedand proximity to population centres. Although notincluded in the calculation of the indicators, geo-referenced files of federally-listed contaminated sites[21] and mine tailings and waste rock sites [22] are alsomade available.
Setton et al. Environmental Health (2015) 14:69 Page 3 of 15

All data were acquired from publicly available websitesand processing steps for calculating the indicators arediscussed here briefly. More detailed information is pro-vided in the Additional file 1.
Industrial emissions estimatesIn Canada, all companies and organizations that emitcertain substances to air, water or land and meet certainthreshold requirements must report annual emissions tothe federal NPRI. There are currently 362 substances onthe NPRI list [23]. For most substances, reporting re-quirements are based on the number of employees atthe facility; the quantity of the substance(s) manufac-tured, processed, used or released; and the type of activ-ities performed at the facility. Although comprehensive,the NPRI does not include emissions from any activitiesthat do not meet the reporting requirements. Thesetypically include small operations and facilities acrossmany sectors, such as “forest product manufacturingfacilities, foundries, rubber and plastics manufacturingplants, transportation equipment manufacturing facilities(except major automobile assembly plants), conventionaloil and gas extraction facilities, pits and quarries, certaintypes of mines, and wastewater facilities” [24]. In somecases, the amount of emissions reported is based onmonitoring data. In other cases, emissions are estimatedusing production levels and emission factors. Guidancein preparing these estimates is provided and emissionfactors are typically based on or are similar to those pub-lished by the United Stated Environmental ProtectionAgency or the Australia National Pollutant Inventoryguides [25]. Total annual emissions for 21 known or sus-pected carcinogens (Table 1) were extracted by facility,along with geographic coordinates, from the NPRI Excelfile for 2011. All amounts were converted to kilogramsto produce TE, which was then multiplied by the appro-priate toxic equivalent factor to produce TEQ.
Transportation and residential heating estimatesThese estimates rely on combining activity data (i.e.,vehicle kilometres travelled or number of landings andtakeoffs at airports) with emission factors (i.e., gramsof substance emitted per vehicle kilometre travelled)specific to each substance and sometimes specific tofuel type as well. In some cases, estimates were madefor a class of substances (i.e., volatile organic com-pounds) and then speciation factors were applied (i.e.,grams of benzene per kilogram of volatile organiccompound). We use Canadian activity data collectedby either Statistics Canada or Environment Canada,with the exception of railway activity which was re-ported by the Railway Association of Canada. Emissionfactors and speciation factors were not available from asingle source for all our substances of interest. We
used factors reported in the Environment Canadaemissions inventory guidebook [26] when possible, butalso used factors from the United States EnvironmentalProtection Agency and the Australian National PollutionInventory program, both of which are recommended asappropriate sources by Environment Canada for develop-ing emissions estimates [25]. For residential heating, wealso undertook a literature review to identify emission fac-tors for as many substances on our list as possible.
AirportsFlight type and volume statistics for all major airports(n = 98) in Canada for 2011 were acquired from Statis-tics Canada's annual Aircraft Movement Statistics report[27]. Only airplanes taking off and landing were includedin our estimate. Emissions from airplanes flying at alti-tude and emissions from ground equipment at airportswere not included. Based on the type of flight (local oritinerant), general destination (international or domestic)and for domestic flights, percent of light weight planesversus medium weight planes, total hydrocarbons andtotal suspended particulate emissions in kilograms wereestimated using factors from Environment Australia[28], which provided the most comprehensive set offactors for our selected substances. These were furtherbroken down into substance specific totals using speci-ation factors from the same report. Table 1 indicateswhich substances' emissions were estimated for airplanes.Airport names, provided in the Statistics Canada data,were matched to a spatial file of airports from DMTISpatial [29], acquired under the Data Liberation Initiativeagreement with Canadian educational institutions.
TrainsWe used total litres of diesel fuel consumed in Canadain 2011, as reported in the Locomotive Emissions Mon-itoring Program 2010 report [30], in conjunction with aspatial file providing the geographic location andlengths of railways in operation in 2011 from DMTISpatial [29]. Fuel consumption was assigned to each railsegment proportionally, and emissions factors from En-vironment Australia were used to calculate total emis-sions for 11 of the 22 substances (Table 1). We werenot able to find any provincial volume data that wouldaid in refining this estimate. All kilometers of railwayare treated as having the same volume of rail traffic,which may under- or over-estimate emissions for anyone railway segment.
Car and truck trafficProvincial and territorial data on vehicle kilometers trav-elled (VKT) by cars (light duty vehicles) and trucks(heavy duty vehicles) on local roads and highways,along with fuel types (gas, diesel, other) were available
Setton et al. Environmental Health (2015) 14:69 Page 4 of 15

for 2009 from Statistics Canada [31]. Emission factorsfrom Environment Australia and from literature reviewwere used with VKT's for each category to calculateemissions for 10 of 22 substances (Table 1) for eachprovince and territory [32]. In order to allocate theemissions more closely to the population centres gen-erating vehicle traffic, we then used a two-step process.First, we used the 2011 Statistics Canada digital blockpopulation file [33] and the 2011 Statistics Canadadigital population ecumene file [34], which identifiesall areas in Canada with a minimum population dens-ity of 0.4 persons per square kilometer, to allocate thetotal provincial emissions to areas within the ecumeneand outside the ecumene in proportion to the totalpopulation residing in each. Secondly, using a digitalfile of Canadian roadways from DMTI Spatial [29], wecalculated the emissions per kilometer of roadways toget a specific emission factor for each area (within theecumene and outside the ecumene in each provinceand territory). We were unable to find enough actual
traffic volume data, which would increase the spatialaccuracy of the emissions estimates. Our method mayoverestimate emissions for areas within the ecumenethat are at the lower limit of population density, andunderestimate the emissions for areas within the ecu-mene that are very densely populated, such as majorurban centres. Still, this method is an improvement toassigning all provincial road segments the same emis-sion factors.
Residential heatingProvincial and territorial data on consumption of naturalgas and fuel oil for residential heating purposes in 2011were acquired from Statistics Canada [35], and data onconsumption of wood for residential heating by appli-ance type (e.g., fireplaces, inserts, stoves, or boilers) werereported by Environment Canada [26]. Information onthe percentage of dwellings using gas, oil or wood forheating in major Census Metropolitan Areas (CMAs)and non-CMAs in Canada was available for 2006 from
Table 1 Summary of available data for emissions and toxic equivalent factors by substance and source
Substance Carcinogencategorya
NRPI Vehicles Trains Airplanes Residential-oil
Residential-gas
Residential-wood
Toxic Equivalentfactor
Y = Data available N = data not available NO EF = No emission factors found NO TEQ = no toxic equivalent factor
1,3,-butadiene 1 Y Y Y Y NO EF NO EF Y 0.54
Arsenic 1 Y NO EF Y Y NO EF Y Y 2600
Benzene 1 Y Y Y Y NO EF Y Y 1
Cadmium 1 Y Y Y Y Y Y Y 28
Fine particulate 1 Y Y Y Y Y Y Y NO TEQ
Formaldehyde 1 Y Y Y Y NO EF Y Y 0.02
HexavalentChromium
1 Y Y Y Y NO EF NO EF Y NO TEQ
Nickel 1 Y Y Y Y NO EF Y Y 2.8
TCDD 1 Yb NO EF NO EF NO EF Y NO EF Y 1,200,000,000
Lead 2A Y Y Y Y Y NO EF Y 28
Tetrachloroethylene 2A Y NO EF NO EF – – – – 0.92
Acetaldehyde 2B Y Y Y Y – – Y 0.017
Benzo[a]anthracene 2B Y NO EF NO EF NO EF NO EF Y Y 54
Benzo[a]pyrene 2B Y NO EF NO EF NO EF Y Y Y 6400
Benzo[b]fluoranthene 2B Y NO EF NO EF NO EF Y Y Y 130
Benzo[k]fluoranthene 2B Y NO EF NO EF NO EF Y Y Y NO TEQ
Chlorform 2B Y NO EF NO EF NO EF – – – 1.6
Chrysene 2B Y NO EF NO EF NO EF NO EF NO EF Y 5.1
Dichloromethane 2B Y NO EF NO EF – – – – 0.2
Ethylbenzene 2B Y Y Y Y NO EF NO EF NO EF NO TEQ
Indeno[1,2,3-cd]pyrene
2B Y NO EF NO EF NO EF Y Y Y 280
aInternational Agency for Research on Cancer (IARC) categories: Known carcinogen (1), probable carcinogen (2A) and possible carcinogen (2B)bTCDD is included in the NPRI, but no emissions were reported for 2011
Setton et al. Environmental Health (2015) 14:69 Page 5 of 15
Statistics Canada [36] and was incorporated to help al-locate the consumption levels more accurately witheach province and territory. In addition, we used thedigital block population file from Statistics Canada [33]with associated dwelling counts to identify the propor-tion of dwellings in CMAs and non-CMAs. Fuel con-sumption (gas, oil, and wood) was allocated to eachprovincial or territory CMA or non-CMA street blockusing the proportion of dwellings. Emission factors spe-cific to oil and gas consumption, and wood combustionby appliance type were synthesized from a variety ofsources [26, 37–45]. We were not able to estimateemissions due to residential heating for all substances(Table 1).
Toxic equivalent factorsWe used the toxic equivalent factors derived by EGHertwich et al. [20]. Briefly these factors were derivedusing a:
“fate and exposure model which determines thedistribution of a chemical in a model environmentand accounts for a number of exposure routes,including inhalation of gases and particles, ingestionof produce, fish, meat and dermal contact withwater and soil.”[20]
Thus, the toxic equivalent factors take potential expos-ure levels into account based on the substances’ physicalproperties. Substances with higher potential for humanexposure due to persistence in exposure pathways have ahigher toxic equivalent factor. All toxic equivalent fac-tors are expressed relative to benzene, which allows forsubsequent summing of toxic equivalent emissions.These were available only for 17 of the 21 substances ofinterest (Table 1), so the indicators Total TEQ and TEQare based only on 17 substances.
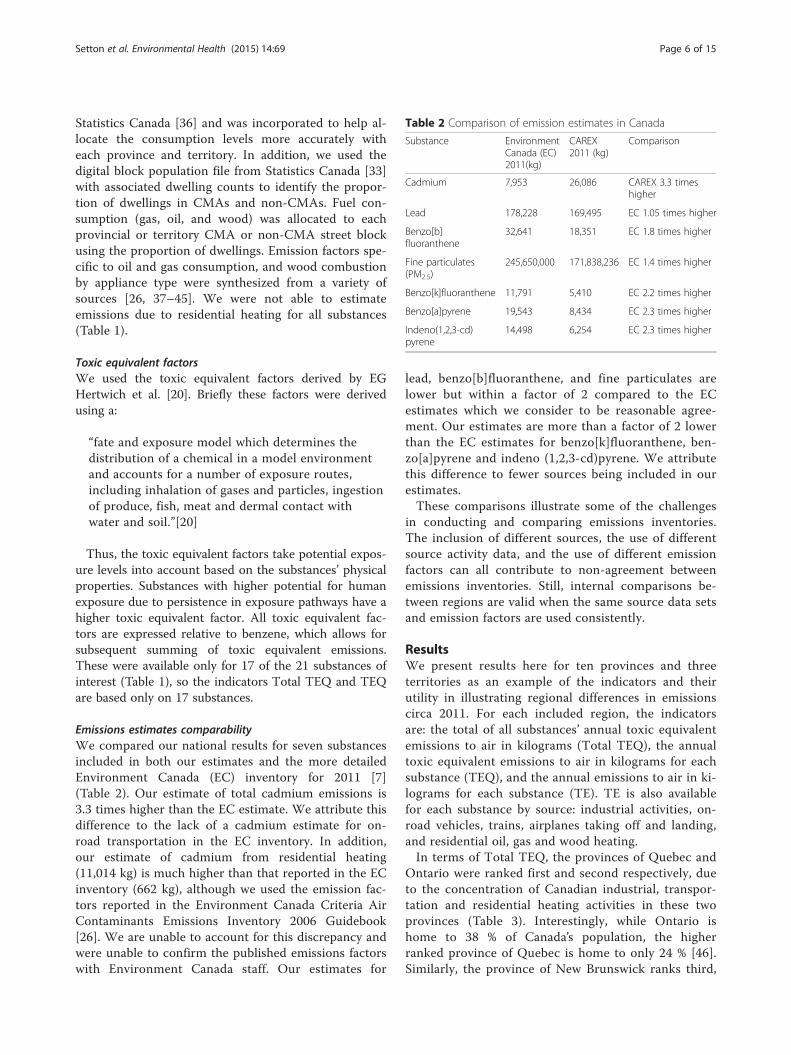
Emissions estimates comparabilityWe compared our national results for seven substancesincluded in both our estimates and the more detailedEnvironment Canada (EC) inventory for 2011 [7](Table 2). Our estimate of total cadmium emissions is3.3 times higher than the EC estimate. We attribute thisdifference to the lack of a cadmium estimate for on-road transportation in the EC inventory. In addition,our estimate of cadmium from residential heating(11,014 kg) is much higher than that reported in the ECinventory (662 kg), although we used the emission fac-tors reported in the Environment Canada Criteria AirContaminants Emissions Inventory 2006 Guidebook[26]. We are unable to account for this discrepancy andwere unable to confirm the published emissions factorswith Environment Canada staff. Our estimates for
lead, benzo[b]fluoranthene, and fine particulates arelower but within a factor of 2 compared to the ECestimates which we consider to be reasonable agree-ment. Our estimates are more than a factor of 2 lowerthan the EC estimates for benzo[k]fluoranthene, ben-zo[a]pyrene and indeno (1,2,3-cd)pyrene. We attributethis difference to fewer sources being included in ourestimates.These comparisons illustrate some of the challenges
in conducting and comparing emissions inventories.The inclusion of different sources, the use of differentsource activity data, and the use of different emissionfactors can all contribute to non-agreement betweenemissions inventories. Still, internal comparisons be-tween regions are valid when the same source data setsand emission factors are used consistently.
ResultsWe present results here for ten provinces and threeterritories as an example of the indicators and theirutility in illustrating regional differences in emissionscirca 2011. For each included region, the indicatorsare: the total of all substances’ annual toxic equivalentemissions to air in kilograms (Total TEQ), the annualtoxic equivalent emissions to air in kilograms for eachsubstance (TEQ), and the annual emissions to air in ki-lograms for each substance (TE). TE is also availablefor each substance by source: industrial activities, on-road vehicles, trains, airplanes taking off and landing,and residential oil, gas and wood heating.In terms of Total TEQ, the provinces of Quebec and
Ontario were ranked first and second respectively, dueto the concentration of Canadian industrial, transpor-tation and residential heating activities in these twoprovinces (Table 3). Interestingly, while Ontario ishome to 38 % of Canada’s population, the higherranked province of Quebec is home to only 24 % [46].Similarly, the province of New Brunswick ranks third,
Table 2 Comparison of emission estimates in Canada
Substance EnvironmentCanada (EC)2011(kg)
CAREX2011 (kg)
Comparison
Cadmium 7,953 26,086 CAREX 3.3 timeshigher
Lead 178,228 169,495 EC 1.05 times higher
Benzo[b]fluoranthene
32,641 18,351 EC 1.8 times higher
Fine particulates(PM2.5)
245,650,000 171,838,236 EC 1.4 times higher
Benzo[k]fluoranthene 11,791 5,410 EC 2.2 times higher
Benzo[a]pyrene 19,543 8,434 EC 2.3 times higher
Indeno(1,2,3-cd)pyrene
14,498 6,254 EC 2.3 times higher
Setton et al. Environmental Health (2015) 14:69 Page 6 of 15

but only 2.2 % of Canada's population lives in thisprovince. Since our emission estimates for transporta-tion and residential heating are population weighted,high ranks for provinces with lower populations sug-gests that industrial sources likely dominate the rank-ing. In fact, 88 % of New Brunswick's indicator is dueto emissions reported to the NPRI (Table 4), the high-est of any province or territory. Quebec also has a highproportion of industrial emissions (71 % of indicatortotal) compared to other sources. Table 4 also showsthat while rail, residential gas heating and residentialoil heating contribute very little to the overall rankingsfor any of the provinces and territories, residentialheating with wood can be a significant source of harm-ful pollutants (e.g., the northern territories and theMaritime provinces), relative to other sources.While we include toxic equivalent emission estimates
for 17 substances, in general, between 94 and 99 % ofTotal TEQ for each province or territory is contributedby only five substances, based on the associated TEQranks (Table 5). Arsenic was most frequently the topcontributor to Total TEQ, followed by benzene, ben-zo[a]pyrene, 2, 3, 7, 8-tetrachlorodibenzo -p-dioxin(TCDD), 1,3-butadiene, lead and benzo[b]fluoranthene(Fig. 1). The substance-specific toxic equivalent factorplays an important role - arsenic, benzo[a]pyrene, andespecially TCDD have high toxic equivalent factors (seeMethods section) which elevate the influence of therelatively small amounts emitted (indicated by TE foreach substance). Interestingly, the top five substancesvary among provinces and territories. No more thantwo provinces or territories share the same top five
substances in the same order (Quebec and Newfound-land/Labrador; Ontario and New Brunswick; Nova Scotiaand Nunavut), and seven have unique lists when order isconsidered.Regional variation in Total TEQ and substance TEQ
ranks reflect the differences in sources. For example,Table 6 shows the contribution of each substance to thetotal of the top five TEQ. Clearly, in New Brunswick,arsenic is responsible for 88 % of the province's rela-tively high overall ranking, and as per Table 4, indus-trial sources are the major contributor. Additionalexploration is required to better understand sources inthe top-ranked province of Quebec, where only 50 %of the ranking is due to arsenic. Table 7 shows therelative contribution of each source to the top fivesubstances in Quebec specifically. In this case, arsenicfrom industrial sources (as reported to the NPRI)makes up 97 % of the total arsenic TEQ. In contrast,roughly two thirds of the benzo[a]pyrene TEQ is asso-ciated with industrial sources and one third with resi-dential wood burning, while 87 % of the benzene TEQis associated with traffic on roads.It will be important to conduct additional investiga-
tions to ascertain the likelihood of significant popula-tion exposure to these substances, given that theemissions are attributed to such large regions. It is en-tirely possible that some of the emissions are not re-leased near population centres of any size. While wehave attempted to spatially allocate emissions as
Table 3 Rank and population by province and territory
Rank Province/Territory
2011 population (thousands)[percent of national total]
Indicator:total TEQ (kg)
1 Quebec 8,007.7 [23.6] 93,966,697
2 Ontario 13,263.5 [38.4] 55,718,108
3 New Brunswick 755.5 [2.2] 24,757,165
4 British Columbia 4,449.1 [13.1] 23,462,727
5 Alberta 3,790.2 [10.9] 10,570,015
6 Newfoundland/Labrador
525.0 [1.5] 4,804,302
7 Manitoba 1,233.7 [3.6] 4,531,379
8 Nova Scotia 944.5 [2.8] 3,786,719
9 Saskatchewan 1,066.3 [3.1] 2,757,480
10 Prince EdwardIsland
144.0 [0.4] 453,195
11 NorthwestTerritories
43.5 [0.1] 201,167
12 Yukon 35.4[0.1] 133,327
13 Nunavut 34.2 [0.1] 83,538
Table 4 Contribution of sources to rank by province andterritory
Percent of Indicator by emission source
Industry Transportation Residentialheating
Rank Region NPRI Airports Rail Roads Gas Oil Wood
1 Quebec 71 1 <1 11 <1 <1 17
2 Ontario 49 3 <1 31 1 <1 15
3 New Brunswick 88 1 <1 5 <1 <1 6
4 BritishColumbia
54 7 <1 22 <1 <1 17
5 Alberta 14 10 <1 62 2 <1 12
6 NewfoundlandLabrador
56 3 <1 14 <1 1 26
7 Manitoba 41 8 <1 35 1 <1 16
8 Nova Scotia 11 5 <1 37 <1 3 44
9 Saskatchewan 4 10 1 62 2 <1 21
10 Prince EdwardIsland
1 4 0 40 <1 6 48
11 Northwest Terr. 2 53 <1 19 1 2 22
12 Yukon 0 29 <1 45 1 1 24
13 Nunavut <1 63 0 6 0 0 31
Setton et al. Environmental Health (2015) 14:69 Page 7 of 15

accurately as possible (i.e., restricting vehicle emis-sions to areas within the population ecumene), this isnot reflected in the provincial/territorial ranks. Forthis reason, we have calculated the ranks for major cit-ies (n = 159), and also provide supplementary filesshowing the location of large industrial emitters viathe Google Earth platform, as described in the follow-ing example.The Google Earth platform provides different and
more dynamic views of the CAREX EMP results.Opening the provincial ranks file produces an overlaymap of each province and territory in Canada, with asimple colour code indicating relative rank order fromhigh to low (Fig. 2). Clicking on any region opens aninformation box with a simple graph at the top
showing the Total TEQ rank compared to all otherregions and six columns of data (Fig. 3). The first col-umn lists all included substances (sorted alphabetic-ally). The second column gives TE – the total annualemissions in kilograms. The third column shows thetoxic equivalent factor, and the fourth gives TEQ (TEmultiplied by the toxic equivalent factor). The fifthand sixth columns gives the numerical rank (i.e., first,second, third, etc.) of the substance TEQ compared toall other regions. For example, in Fig. 3, acetaldehydehas a substance rank of 1 (column 5) out of 13 regions(column 6) in the province of Quebec. This means noother province or region has a higher emission of acet-aldehyde. Each of the columns can be sorted by click-ing on the column header.
Table 5 Total TEQ of top 5 substances by province and territory
Rank Province/Territory Total TEQ (kg) TEQ (kg) oftop 5 substances
Top 5 TEQ (kg) aspercent of TotalTEQ (kg)
1 Quebec 93,966,697 90,063,593 96
2 Ontario 55,718,108 53,149,650 95
3 New Brunswick 24,757,165 24,451,448 99
4 British Columbia 23,462,727 22,087,689 94
5 Alberta 10,570,015 10,095,747 96
6 Newfoundland Labrador 4,804,302 4,615,482 96
7 Manitoba 4,531,379 4,276,081 94
8 Nova Scotia 3,786,719 3,604,741 95
9 Saskatchewan 2,757,480 2,617,953 95
10 Prince Edward Island 453,195 429,651 95
11 Northwest Territories 201,167 189,937 94
12 Yukon 133,327 125,988 94
13 Nunavut 83,538 80,111 96
Fig. 1 Rank of top 5 substances by province and territory
Setton et al. Environmental Health (2015) 14:69 Page 8 of 15

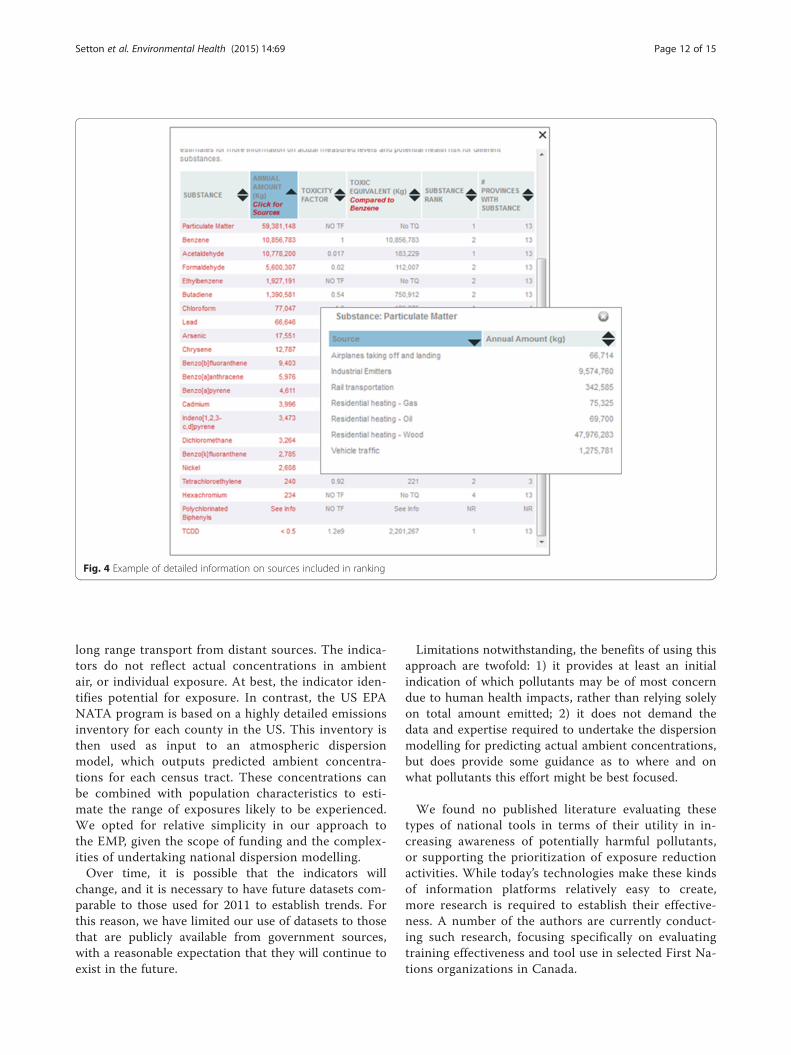
The information box is the first ‘layer’ of informationavailable to the user. Each of the substance names inthe first column are linked to substance profiles on anexternal website (e.g., http://www.carexcanada.ca/en/benzene/) which include detailed information about thesubstance. Each of the TE amounts listed in the secondcolumn is linked to a pop-up box that gives the TE foreach source (Fig. 4). At the top left, users can link to adownloadable report for the region.The CAREX EMP includes a range of supporting
files in addition to the ranked regions. Feedback fromvarious potential users during development identifiedthe value of having both substance- and source-specific files available to help visualize sources withinany particular region. Given that the ranked regionsonly give the total emissions, these additional files canbe used to explore the geographic distribution ofsources and their relative emissions within a region.For example, in Quebec, arsenic emissions are the topcontributor to Total TEQ. The rank file provides thetotal amount of arsenic emitted to air – 17,007 kg in
2011 – and the associated file of industrial emitters ofarsenic to air shows one major source (16,597 kg in2011) not in proximity to any major population centresand numerous very small sources (Fig. 5). This may re-duce the priority for additional analysis of arsenic as apotential population exposure concern.Altogether, these views provide easy access to a wide
range of information about the known and suspectedcarcinogens included in the CAREX EMP.
DiscussionWe used publicly available data and Google Earth todevelop and implement an information platform (theCAREX EMP) for emissions of selected known and sus-pected carcinogens in various regions of Canada. Thisis the first platform of its kind in Canada. Althoughsimilar in part to Pollution Watch and Taking Stockwhich are based on NPRI data, the CAREX EMP in-cludes estimates of emissions from sources not requiredto report to the NPRI, namely transportation (on-road
Table 6 Percent contribution to TEQ of top five substances
Percent contribution to top 5 TEQ
Rank Province Arsenic Benzo[a]pyrene Benzene TCDD 1,3-butadiene Lead Benzo[b]fluoranthene
1 Quebec 51 33 12 2 2
2 Ontario 48 14 32 2 3
3 New Brunswick 88 4 5 1 2
4 British Columbia 18 54 23 2 3
5 Alberta 24 8 62 4 2
6 Newfoundland Labrador 60 18 16 5 1
7 Manitoba 49 11 35 2 2
8 Nova Scotia 17 30 40 10 3
9 Saskatchewan 12 17 64 3 4
10 Prince Edward Island 7 32 44 14 3
11 Northwest Territories 56 15 21 6 2
12 Yukon 30 16 46 5 3
13 Nunavut 63 21 10 5 1
Table 7 Top 5 substances by source (percent) - Quebec
Percent contribution to total substance emitted
Substance Airports NPRI Rail Res gas Res oil Res wood Roads
Arsenic 2 97 <1 <1 0 1 0
Benzo[a]pyrene 0 65 0 <1 <1 35 0
Benzene <1 <1 <1 <1 0 13 87
TCDD 0 0 0 0 6 94 0
Lead <1 88 <1 0 <1 1 10
Setton et al. Environmental Health (2015) 14:69 Page 9 of 15

vehicles, airplanes and trains) and residential heating(oil, gas and wood).The overall region rank (Total TEQ) and associated
substance ranks (TEQ and TE) allow users to makeuseful relative comparisons among regions and sub-stances. These comparisons can highlight differencesin environmental quality, and may have important im-plications for developing policies or regulations aimedat reducing potential exposures to harmful emissions.The provincial/territorial rankings illustrated in the re-sults give support for a range of priorities, for example:1) the substances that contribute most to the TotalTEQ in any region could be prioritized for further in-vestigation (i.e., the top five substances based on theirindividual TEQs); 2) residents of Quebec and NewBrunswick may be more at risk of exposure to indus-trial emissions than those in other regions, suggesting
that a more detailed study of exposure to industrialemissions in these provinces is warranted (and can beaccomplished initially by using additional Google filesfrom the EMP, such as substance-specific emissionfiles; 3) given the relative lack of large industrial emit-ters in the Maritimes and the north, residential wood-smoke may be the most important emission source tocontrol; and 4) residential oil and gas heating, alongwith rail emissions contribute little to regional emis-sions and therefore may NOT be an immediate re-gional priority.Perhaps the most critical limitation of our approach is
the lack of emission and toxic equivalent factors forsome substances of interest (which are therefore omittedfrom the ranking), as well as the accuracy of those fac-tors that are available. This may have a large impact, asthe inclusion of new substances or changes in existing
Fig. 2 Canadian provinces and territories ranked by total toxic emissions of selected carcinogens to air (2011)
Setton et al. Environmental Health (2015) 14:69 Page 10 of 15

factors could affect the overall indicator and the indi-vidual substance rankings in unknown ways. Canada-specific emission factors were not readily available formany substances and sources of interest, and it is dif-ficult to assess how different these might be from theones used for the EMP. These limitations are not ex-clusive to the EMP, but would also affect any othersummary of emissions and their toxic equivalents,such as emission inventories produced by national orregional governments, or projects like Taking Stock,Pollution Watch or Scorecard.Other limitations exist. We have only incorporated
major sources of emissions. There may be othersources, in which case our estimates would be lowerthan actual emissions. For example, we did not includeemissions from marine transportation, although thereare large ports associated with major cities on both
coasts and along the St. Lawrence Seaway. Accordingto the EC emissions inventory for 2011 [7], this sourcecontributes less than 1 % of the annual emissions offine particulates, lead, volatile organic compounds as agroup, and polycyclic aromatic hydrocarbons as agroup. However, approximately 3.4 and 28 % of annualemissions of cadmium and dioxins/furans respectivelyare associated with marine transportation. Given theextremely high toxicity factor for the dioxin TCDD,the presence of a port could affect regional rankings.Open burning is also identified as a significant sourceof dioxins/furans (24 % of the annual total) in the ECemissions inventory. These sources could be added infuture updates of the EMP. The geographic boundariesare somewhat arbitrary, and summing total emissionsto air within a region does not account for the move-ment of air across boundaries from nearby sources, or
Fig. 3 Example of supporting information available for the ranking via Google Earth
Setton et al. Environmental Health (2015) 14:69 Page 11 of 15
long range transport from distant sources. The indica-tors do not reflect actual concentrations in ambientair, or individual exposure. At best, the indicator iden-tifies potential for exposure. In contrast, the US EPANATA program is based on a highly detailed emissionsinventory for each county in the US. This inventory isthen used as input to an atmospheric dispersionmodel, which outputs predicted ambient concentra-tions for each census tract. These concentrations canbe combined with population characteristics to esti-mate the range of exposures likely to be experienced.We opted for relative simplicity in our approach tothe EMP, given the scope of funding and the complex-ities of undertaking national dispersion modelling.Over time, it is possible that the indicators will
change, and it is necessary to have future datasets com-parable to those used for 2011 to establish trends. Forthis reason, we have limited our use of datasets to thosethat are publicly available from government sources,with a reasonable expectation that they will continue toexist in the future.
Limitations notwithstanding, the benefits of using thisapproach are twofold: 1) it provides at least an initialindication of which pollutants may be of most concerndue to human health impacts, rather than relying solelyon total amount emitted; 2) it does not demand thedata and expertise required to undertake the dispersionmodelling for predicting actual ambient concentrations,but does provide some guidance as to where and onwhat pollutants this effort might be best focused.
We found no published literature evaluating thesetypes of national tools in terms of their utility in in-creasing awareness of potentially harmful pollutants,or supporting the prioritization of exposure reductionactivities. While today’s technologies make these kindsof information platforms relatively easy to create,more research is required to establish their effective-ness. A number of the authors are currently conduct-ing such research, focusing specifically on evaluatingtraining effectiveness and tool use in selected First Na-tions organizations in Canada.
Fig. 4 Example of detailed information on sources included in ranking
Setton et al. Environmental Health (2015) 14:69 Page 12 of 15

ConclusionIndicators showing the total emissions and total toxicequivalent emissions can be relatively easy to imple-ment, and may support increasing awareness and evi-dence for exposure reduction actions with respect toknown and suspected carcinogens emitted to air. Forexample, our results suggest that wood smoke fromresidential heating may be an important source ofcancer-related pollutants, indicating a shift away fromfocusing on industrial activities may be warranted insome regions of Canada. Importantly, the impact ofmissing or out-of-date emission factors and toxicequivalent factors is not easily quantifiable, and is akey limitation of this approach. Further research is re-quired to evaluate how users employ the informationprovided, and what kinds of impacts the EMP has onfuture activities aimed at reducing potential exposuresof the Canadian public.
Additional file
Additional file 1: EMP methods report 2011 final. (PDF 1205 kb)
AbbreviationsCEC: Commission for Environmental Cooperation; EMP: Emissions MappingProject; kg: kilograms; NATA: National Air Toxics Assessment; NPRI: NationalPollutant Release Inventory; RETC: Registro de Emisiones y Transferencia deContaminates; TCDD: 2,3,7,8-tetrachlorodibenzo-p-dioxin; TE: Total emissions;TEQ: Toxic equivalent emissions; TRI: Toxic Release Inventory; US EPA: UnitedStates Environmental Protection Agency.
Competing interestsThe authors declare they have no competing interests, financial or otherwise,related to the work and interpretation of results presented herein.
Authors’ contributionsES developed the conceptual framework for this research, led the researchteam throughout the project, prepared emissions inventories, and developedthe manuscript. BV developed the Google Earth Platform, led the datastandardization component, and critically reviewed the manuscript. AEcontributed to the conceptual framework, prepared emissions inventories,
Fig. 5 Example of additional Google Earth file providing spatial context for sources within a ranked region
Setton et al. Environmental Health (2015) 14:69 Page 13 of 15
provided feedback on the content and design of the EMP, and criticallyreviewed the manuscript. SD and RC acquired and synthesized data,provided feedback on the content and design of the EMP, and criticallyreviewed the manuscript. KP contributed to the conceptual framework,provided feedback on the content and design of the EMP, and criticallyreviewed the manuscript. PD provided feedback on the content and designof the EMP, and critically reviewed the manuscript. PK critically reviewed themanuscript. All authors read and approved the final manuscript.
AcknowledgementsFunding was provided by the Canadian Partnership Against Cancer via theCAREX Canada project, and by the Canadian Institutes of Health Research.
Author details1Spatial Sciences Research Lab, University of Victoria – Geography, PO Box3060 STN CSC, Victoria, BC V8W 3R4, Canada. 2Occupational Cancer ResearchCentre, Cancer Care Ontario, 525 University Avenue 3rd Floor, Toronto, ONM5G 2L3, Canada.
Received: 18 March 2015 Accepted: 10 August 2015
References1. Brender JD, Maantay JA, Chakraborty J. Residential proximity to environmental
hazards and adverse health outcomes. Am J Public Health.2011;101(S1):S37–52.
2. Henschel S, Atkinson R, Zeka A, Le Tertre A, Analitis A, Katsouyanni K, et al.Air pollution interventions and their impact on public health. Int J Publichealth. 2012;57(5):757–68.
3. Kampa M, Castanas E. Human health effects of air pollution. Environ Pollut.2008;151(2):362–7.
4. O'Neill MS, Breton CV, Devlin RB, Utell MJ. Air pollution and health: emerginginformation on susceptible populations. Air Quality, Atmosphere Health.2012;5(2):189–201.
5. Ayala A, Brauer M, Mauderly JL, Samet JM. Air pollutants and sourcesassociated with health effects. Air Quality, Atmosphere Health.2012;5(2):151–67.
6. Environment Canada. National Pollutant Release Inventory. URL:http://www.ec.gc.ca/inrp-npri/. Access Date: 2015 Jan. 28.
7. Environment Canada. 2011 Air Pollutant Emission Summaries and HistoricalEmission Trends. URL: https://www.ec.gc.ca/inrp-npri/default.asp?lang=En&n=D999B315-1. Access Date: 2015 Jan. 28.
8. British Columbia Ministry of Environment. BC Air Quality Emissions Inventories.URL: http://www.bcairquality.ca/assessment/emissions-inventories.html.Access Date: 2015 July 24.
9. Metro Vancouver. Emission Inventories and Forecasts. URL: http://www.metrovancouver.org/services/air-quality/emissions-monitoring/emissions/emission-inventories/Pages/default.aspx. Access Date: 2015 July 24.
10. Environment Canada. National Pollutant Release Inventory UncertaintyAnalysis of Emission Estimates for Selected Sectors. URL: http://www.ec.gc.ca/inrp-npri/default.asp?lang=En&n=DBB696D2-1. Access Date: 2015 Jan. 5.
11. Miller CA, Hidy G, Hales J, Kolb CE, Werner AS, Haneke B, et al. Air emissioninventories in north america: a critical assessment. J Air Waste ManageAssoc. 2006;56(8):1115–29.
12. United States Environmental Protection Agency. National Air Toxics Assessment.URL: http://www.epa.gov/airtoxics/natamain/. Access Date: 2015 Jan. 29.
13. Good Guide. Scorecard The Pollution Information Site. URL: http://scorecard.goodguide.com/. Access Date: 2015 Jan. 29.
14. Commission for Environmental Cooperation. Taking Stock Online. URL:http://www.cec.org/Page.asp?PageID=924&SiteNodeID=1097. AccessDate: 2015 Jan. 29.
15. United States Environmental Protection Agency. 2005 Assessment Results -State Summaries. URL: http://www.epa.gov/ttn/atw/nata2005/tables.html#int.Access Date: 2015 Jan. 29.
16. Good Guide. Pollution Locator - Toxic Chemical Releases. URL: http://scorecard.goodguide.com/env-releases/us-map.tcl. Access Date: 2015 Jan. 29.
17. Commission for Environmental Cooperation. Google Earth PRTR Facility MapLayer. URL: http://www.cec.org/Page.asp?PageID=751&SiteNodeID=1120.Access Date: 2015 Jan. 29.
18. Canadian Environmental Law Association, Environmental Defence. MapYour Community. URL: http://www.pollutionwatch.org/mapsearch.do.Access Date: 2015 Jan. 29.
19. Setton E, Veerman B, Erickson A, Poplawski K, Cheasley R, Whittaker C et al.CAREX Emissions Mapping Project. URL: http://carexcanada.uvic.ca/emp/.Access Date: 2015 Jan. 29.
20. Hertwich E, Mateles SF, Pease WS, McKone TE. An Update of the HumanToxicity Potential with Special Consideration of Conventional AirPollutants. URL: https://www.ntnu.no/c/document_library/get_file?uuid=a76b6602-6052-4a03-a48d-e1d274223eee&groupId=10370. Access Date:2015 July 24.
21. Treasury Board of Canada. Federal Contaminated Sites Inventory. URL:http://www.tbs-sct.gc.ca/fcsi-rscf/home-accueil-eng.aspx. Access Date:2015 July 24.
22. Environment Canada. National Pollutant Release Inventory and Air PollutantEmission Summaries and Trends Downloadable Datasets. URL: http://www.ec.gc.ca/inrp-npri/default.asp?lang=en&n=0EC58C98-#Emission_Summaries.Access Date: 2015 Jan. 28.
23. Environment Canada. National Pollutant Release Inventory (NPRI) SubstanceList. URL: http://www.ec.gc.ca/inrp-npri/default.asp?lang=En&n=E2BFC2DB-1.Access Date: 2015 July 24.
24. Environment Canada. Overview of Findings of the National Pollutant ReleaseInventory (NPRI) Sector Coverage Study for the 2008 Reporting Year. URL:http://www.ec.gc.ca/inrp-npri/default.asp?lang=En&n=615C413A-1. AccessDate: 2015 July 24.
25. Environment Canada. National Pollutant Release Inventory (NPRI) Toolbox.URL: http://www.ec.gc.ca/inrp-npri/default.asp?lang=En&n=65A75CDF-1.Access Date: 2015 July 24.
26. Environment Canada Pollution Data Division. 1-1-2008. Criteria Air ContaminantsEmissions Inventory 2006 Guidebook. Government of Canada. Ottawa.
27. Statistics Canada. Aircraft Movement Statistics: NAC CANADA Towers andFlight Service Stations: Anual Report (TP 577). Ottawa, ON: Government ofCanada; 2011.
28. Environment Australia. 3-25-2003. Emissions Estimation Technique Manualfor Aggregated Emissions from Aircraft Version 2.2. Commonwealth ofAustralia. Canberra.
29. DMTI Spatial. CanMap. URL: http://www.dmtispatial.com/canmap/. AccessDate: 2015 Jan. 30.
30. Railway Association of Canada. Locomotive Emissions Monitoring Program2010. Ottawa, ON: Railway Association of Canada; 2010.
31. Statistics Canada. Canadian Vehicle Survey: Annual 2009 No. 53-233-X. Ottawa,ON: Government of Canada; 2010.
32. Environment Australia. 11-22-2000. Emissions Estimation Technique Manualfor Aggregated Emissions from Motor Vehicles Version 1.0. Commonwealthof Australia. Canberra.
33. Statistics Canada. Dissemination block (DB). URL: http://www12.statcan.gc.ca/census-recensement/2011/ref/dict/geo014-eng.cfm. Access Date:2015 Jan. 30.
34. Statistics Canada. Population Ecumene file. URL: http://www.statcan.gc.ca/pub/92-159-g/2011001/use-utiliser-eng.htm. Access Date: 2015 July 24.
35. Canada S. Report on Energy Supply and Demand in Canada 2011 PreliminaryNo. 57-003-X. Ottawa, ON: Government of Canada; 2011.
36. Statistics Canada. Households and the Environment Survey (HES) 2005–2006.Ottawa, ON: Government of Canada; 2007.
37. Environment Australia. 11-1-1999. Emissions Estimation Technique Manualfor Aggregated Emissions from Domestic Solid Fuel Burning Version 1.0.Commonwealth of Australia. Canberra.
38. Environment Canada and Hearth Products Association of Canada.Characterization of Organic Compunds from Selected Residential WoodStoves and Fuels. Ottawa: Government of Canada; 2000.
39. Fisher LH, Houck JE, Tiegs PE, McGaughey J. Long-term Performance ofEPA-Certified Phase 2 Woodstoves, Klamath Falls and Portland, Oregon:1998/1999. United States Environmental Protection Agency. OH:Cincinnati; 2000.
40. Gullett BK, Touati A, Hays MD. PCDD/F, PCB, HxCBz, PAH, and PM emissionfactors for fireplace and woodstove combustion in the San Francisco Bayregion. Environ Sci Technol. 2003;37(9):1758–65.
41. Hays MD, Smith ND, Kinsey J, Dong Y, Kariher P. Polycyclic aromatichydrocarbon size distributions in aerosols from appliances of residentialwood combustion as determined by direct thermal desorption - GC/MS.J Aerosol Sci. 2003;34(8):1061–84.
Setton et al. Environmental Health (2015) 14:69 Page 14 of 15
42. Houck JE, Crouch J. Updated Emissions Data for Revision of AP-42 Section1.9, Residential Fireplaces. United States Environmental Protection Agency.NC: Research Triangle Park; 2002.
43. Houck JE, Eagle JE. Task 4 Technical memorandum 2 (Emission Inventory)Control Analysis and Documentation for Residential Wood Combustioninthe MANE-VU Region. Baltimore, Maryland: Mid-Atlantic Regional AirMangement Association; 2006.
44. Conventional LV, Study WEF. 16th Anual International Emission InventoryConference. Raleigh, NC: 16th Anual International Emission InventoryConference; 2007.
45. United States Environmental Protection Agency. Emissions Factors and AP42, Compilation of Air Pollutant Emission Factors. URL: http://www.epa.gov/ttn/chief/ap42/index.html. Access Date: 2015 Jan. 31.
46. Statistics Canada. Population by year, province and territory. URL:http://www.statcan.gc.ca/tables-tableaux/sum-som/l01/cst01/demo02a-eng.htm. Access Date: 2015 Jan. 29.
Submit your next manuscript to BioMed Centraland take full advantage of:
• Convenient online submission
• Thorough peer review
• No space constraints or color figure charges
• Immediate publication on acceptance
• Inclusion in PubMed, CAS, Scopus and Google Scholar
• Research which is freely available for redistribution
Submit your manuscript at www.biomedcentral.com/submit
Setton et al. Environmental Health (2015) 14:69 Page 15 of 15