setting up of an innovative procedure for · pdf fileaps ammonium persulfate bsa bovine serum...
TRANSCRIPT
UNIVERSITÀ DEGLI STUDI DI PADOVA
DIPARTIMENTO DI MEDICINA MOLECOLARE
SCUOLA DI DOTTORATO DI RICERCA IN: BIOMEDICINA
CICLO XXV
SETTING UP OF AN INNOVATIVE PROCEDURE
FOR REDOX PROTEOMICS
AND ITS APPLICATION FOR DEFINITION OF THE REDOX
STATUS OF CELLS WITH HIGH METASTATIC POTENTIAL
Direttore della Scuola: Ch.mo Prof. Giorgio Palù
Supervisore: Ch.mo Prof. Fulvio Ursini
Dottorando: Mattia Zaccarin


1
ABBREVIATIONS
2D Two-dimensional
5-IAF 5-(Iodoacetamido)fluorescein
Ab Antibody
ACN Acetonitrile
APS Ammonium persulfate
BSA Bovine serum albumine
CCB Coomassie Colloidal Blue
CID Collision induced dissociation
CSCs Cancer Stem Cells
DIGE Differential in Gel Electrophoresis
DOC Sodium deoxycholate
DTNB 3,3’-dithio-bis(6-nitrobenzoic acid)
DTT Dithiothreithol
EDTA Ethylenediaminetetraacetic acid
EMT Epithelial to mesenchymal transition
ESI Electrospray ionization
FA Formic acid
G6PDH Glucose-6-phosphate dehydrogenase
GSH Reduced glutathione
HPDP N-[6-(Biotinamido)hexyl]-3´-(2´-pyridyldithio)propionamide
HRP Horseradish peroxidase
IAA Iodoacetic acid
IAM Iodoacetamide
LC Liquid chromatography
m/z Mass to charge ratio
MS Mass Spectrometry
MS/MS Tandem mass spectrometry
MW Molecular weight
NEM N-ethylmaleimide
PAGE Polyacrylamide electrophoresis
PBS Phosphate buffered saline
PEP Posterior Error Probability
PPP Pentose phosphate pathway
Q-TOF Quarupole – Time of flight
RNS Reactive nitrogen species
ROS Reactive oxygen species
RPC Reverse phase chromatography
Rt Retention time
SDS Sodium dodecyl sulphate
TCA 2,2,2-Trichloroacetic acid
TCEP Tris(2-carboxyethyl)phosphine
TEMED Tetramethylethylenediamine
TrisHCl Trishydroxymethylaminomethane hydrochloride
Wb Western blotting

2
CONTENTS
ABBREVIATIONS.................................................................................................................... 1
1. ABSTRACT ........................................................................................................................... 5
RIASSUNTO ............................................................................................................................. 6
2. INTRODUCTION ................................................................................................................. 8
2.1 REDOX STATUS OF PROTEINS .................................................................................................... 8
2.1.1 Reactivity of Cysteine residues ........................................................................................ 9 Disulfides........................................................................................................................................... 10 Thiyl radical ...................................................................................................................................... 11 Sulfenic acid ...................................................................................................................................... 12 Reaction of thiols with hydrogen peroxide ........................................................................................ 13
2.1.2 Redox switches ............................................................................................................... 14
2.1.3 Structural and functional disulfides ............................................................................... 17
2.2 OXIDATION RATE AND REDUCTION RATE ............................................................................... 20 Specificity and reversibility of redox signalling ................................................................................ 20 Dynamic equilibrium: oxidation and reduction rate .......................................................................... 21
2.2.1 Electrophiles and nucleophiles formation ..................................................................... 23 Sources of biologically relevant ROS ................................................................................................ 24 Antioxidant defense mechanisms ...................................................................................................... 25
2.2.2 Nrf2-Keap1 feedback loop ............................................................................................. 27 Nrf2 in cancer prevention and promotion: dual roles of Nrf2 ............................................................ 28
2.3 EVENTS RELATED TO MALIGNANCY ARE REDOX REGULATED................................................. 29
2.3.1 Oxidation ....................................................................................................................... 31 DNA and lipids .................................................................................................................................. 31 Proteins .............................................................................................................................................. 32 Non receptor tyrosine kinases (PTKs): Src ........................................................................................ 33 Rat Sarcoma genes product (Ras) and the Raf/MEK/ERK pathway ................................................. 33 PI3K/AKT pathway and protein tyrosine phosphatases: PTP1B and PTEN ..................................... 34
2.3.2 Reduction ....................................................................................................................... 35
2.3.3 Localization ................................................................................................................... 37 GSH/GSSG redox potential in cellular compartments ....................................................................... 37 Redox regulation of cell migration and adhesion .............................................................................. 38
2.4 METHODOLOGICAL APPROACH: TRADITIONAL AND INNOVATIVE METHODS FOR DISULFIDE
BONDS ASSESSMENT..................................................................................................................... 40
2.4.1 Disulfide proteome of complex samples......................................................................... 42
3. MATHERIALS AND METHODS ...................................................................................... 44
3.1 CELL CULTURES ..................................................................................................................... 44
3.2 SUB-CELLULAR FRACTION ENRICHMENT ................................................................................ 44
3.2.1 Protein assay ................................................................................................................. 45
3.2.2 DTNB assay ................................................................................................................... 45
3.3 DIFFERENTIAL “REDOX” LABELLING ...................................................................................... 46 Alkylation of free thiols ..................................................................................................................... 46 Reduction of oxidized thiols .............................................................................................................. 46 HPDP Labelling................................................................................................................................. 46 Enrichment of labelled proteins ......................................................................................................... 46 Alkylation of formerly oxidized thiols .............................................................................................. 47
3.3.1 HPDP assay ................................................................................................................... 48

3
3.3.2 Electrophoresis .............................................................................................................. 48
3.3.3 Western blotting............................................................................................................. 48
3.4 SAMPLE PREPARATION FOR MS ANALYSIS ............................................................................. 49
3.5 Q-TOF ANALYSIS .................................................................................................................. 49
3.6 G6PDH ENZYMATIC ACTIVITY MEASUREMENT ..................................................................... 50
3.7 DATA ANALYSIS..................................................................................................................... 51
3.7.1 Input data ...................................................................................................................... 52
3.7.2 Identification ................................................................................................................. 52
3.7.3 Quantification ................................................................................................................ 54
3.7.4 Results filtering and score ranking ................................................................................ 55
4. RESULTS............................................................................................................................. 57
4.1 DEVELOPMENT OF LABEL FREE METHODOLOGY TO CHARACTERIZE AND DIFFERENTIALLY
QUANTIFY OXIDATIVELY MODIFIED PROTEINS IN COMPLEX SAMPLE ............................................ 57
4.1.1 Differential redox labelling ........................................................................................... 57 4.1.1.1 Trapping of the native redox state of thiols ........................................................................... 57 4.1.1.2 Reduction of oxidized thiols .................................................................................................. 58 4.1.1.3 Labelling reaction .................................................................................................................. 59 4.1.1.4 Critical aspects of elution ...................................................................................................... 59
4.1.2 Quantification of extracted proteins .............................................................................. 60 4.1.2.1 Ion abundance linearity ......................................................................................................... 60 4.1.2.2 Workflow development: from identification to quantification .............................................. 62 4.1.2.3 Workflow validation ............................................................................................................. 64 4.1.2.4 Decision-making criteria ....................................................................................................... 65
4.2 DIFFERENCES IN M2 AND M2T REDOXOME ........................................................................... 67
4.2.1 Differential protein list .................................................................................................. 68
4.2.2 Differential proteins characterization ........................................................................... 71
4.2.3 “Totally reduced” controls ........................................................................................... 72
4.2.4 Mapping of specific modifications ................................................................................. 73
4.3 REDOX ENVIRONMENT OF M2 AND M2T CELL LINES ............................................................. 75
4.4 G6PDH ACTIVITY .................................................................................................................. 75
4.4.1 G6PDH activity is affected by redox status ................................................................... 75
4.4.2 G6PDH reduced and oxidized forms ............................................................................. 78
4.5 NRF2 PATHWAY GENE EXPRESSION DATA .............................................................................. 79
5. DISCUSSION ....................................................................................................................... 81
5.1 REDOX PROTEOMICS: A TECHNICAL CHALLENGE ................................................................... 81
5.1.1 General strategies to screen for protein thiol modifications ......................................... 81 Loss of selective labelling due to thiol modification ......................................................................... 81 Selective reduction of reversible protein thiol modifications ............................................................ 82 Selective reaction of particular protein thiol modifications ............................................................... 83
5.1.2 The “biotin-switch” method .......................................................................................... 83
5.2 INNOVATIVE PROCEDURE FOR REDOX PROTEOMICS ............................................................... 84 Unmodified thiols blocking ............................................................................................................... 85 Selective reduction ............................................................................................................................ 86 Affinity purification .......................................................................................................................... 86
5.2.1 Label-free approach: computational analysis ............................................................... 86 The choice of the features quantification approach ........................................................................... 87 Reproducibility and relative-quantification criteria ........................................................................... 88
5.2.2 Limits and improvements of the approach ..................................................................... 89

4
5.3 G6PDH AS PUTATIVE MASTER REGULATOR OF REDOX EQUILIBRIUM ..................................... 90
5.3.1 Cancer metabolism and ECM detachment..................................................................... 90
5.3.2 G6PDH redox regulation............................................................................................... 92
5.4 CONCLUDING REMARKS ......................................................................................................... 93
6. REFERENCES .................................................................................................................... 95
OTHER STUDIES CARRIED OUT DURING PHD PROGRAM ...................................... 104
AKNWOLEDGMENTS ........................................................................................................ 105
5
1. ABSTRACT
BACKGROUND: The cysteine (Cys) proteome includes 214.000 Cys with thiol
and other forms. Of these, only a relatively small subset functions in cell
signalling. Redox-active Cys are more susceptible to oxidation, and their oxidized
form is more susceptible to reduction. Specific proteomic techniques are required
to identify these modifications and to study their regulation in different cell
processes that are collectively known as redox proteomics. Thus, it is of interest to
be able to identify both the proteins and the cysteine residues affected, and to
quantify the extent of the modification involved.The quantification of differences
between two or more physiological states of a biological system is among the
most challenging technical tasks in proteomics: liquid chromatography coupled to
mass spectrometry (LC-MS) based quantification methods have gained increasing
robustness and reliability over the past five years. Many authors still share a view
of redox signalling in which the fate of the cell is dependent mainly on the
intensity and duration of pro-oxidant stimulus: here we sustain the involvement of
an equilibrium encompassing the action of both nucleophiles and electrophiles at
the same time.
AIM: The dual aim of my PhD work has been both to develop suitable
methodology to identify and quantify redox-active proteins in complex samples
and to apply it to the study of a cellular model of breast cancer (MCF10A)
engineered to reproduce malignancy.
METHODS: In order to pursue this aim, I took advantage of an approach
integrating differential chemical sample labelling (non-isotopic) with Cys reactive
probes (NEM, IAM, HPDP) and chromatographic purification of redox-sensitive
proteins, with subsequent LC-MS/MS analysis and computational data handling
for OpenMS-based label-free quantification. All the steps of this methodology
have been developed and validated in close collaboration with experts from both
the biochemistry and bioinformatics field.
RESULTS: We obtained an efficient cost-effective and isotopes-free
methodology to characterize the redoxome in complex protein samples.
Application of our quantification protocol to benchmark dataset leads to 100%
correct estimates of under/over expression of the protein moiety. Application of
the methodology to the breast cancer cellular model lead to identification of more
than 300 proteins and allowed us to group-up unchanged and differentially
oxidized redox-sensitive proteins in the more malignant cells in respect to their
less aggressive counterpart.
CONCLUSION: Despite the commonly accepted association between cancer and
higher oxidative-stress, this study links higher breast cancer cells malignancy to a
finely tuned dynamic equilibrium in which selected protein targets are oxidized in
the context of a more reduced cell environment. Preliminary results point at the
enzyme G6PDH as a crucial regulator of this redox process.

6
RIASSUNTO
STATO DELL’ARTE: Il proteoma include 214.000 cisteine in forma di gruppi
tiolici liberi od altra forma. Di queste, solamente un insieme relativamente
ristretto ha un ruolo nella mediazione di segnali cellulari. Tali cisteine, attive dal
punto di vista dell’ossido-riduzione, sono più sensibili all’ossidazione e la loro
forma ossidata è più facilmente riducibile. Sono dunque necessarie specifiche
tecniche di proteomica, globalmente indicate con il termine proteomica delle
ossido-riduzioni, per identificare tali modifiche e studiarne la regolazione in
diversi processi cellulari. Risulta quindi determinante la capacità di identificare
sia le proteine che i residui coinvolti e di quantificarne il grado di modificazione.
E proprio la quantificazione delle differenze tra due o più stati di un sistema
biologico, si colloca tra gli obiettivi tecnicamente più sfidanti della proteomica:
nel corso degli ultimi cinque anni, tecniche basate sulla spettrometria di massa
associata a cromatografia in fase liquida hanno progressivamente guadagnato
affidabilità e robustezza. Molti autori condividono tuttora una visione delle
ossido-riduzioni nella mediazione del segnale in cui il destino cellulare dipende
principalmente dall’intensità e dalla durata degli stimoli ossidanti: nel presente
lavoro si vuole invece sostenere il coinvolgimento di un equilibrio che includa
l’azione concomitante sia di specie nucleofile sia di specie elettrofile.
OBIETTIVO: Il duplice obiettivo del mio lavoro di Dottorato è stato sia lo
sviluppo di una metodologia idonea all’identificazione e quantificazione di
proteine, attive dal punto di vista delle ossido-riduzioni, in campioni complessi,
sia l’applicazione di tale metodologia allo studio di un sistema cellulare
ingegnerizzato di carcinoma mammario (MCF10A) caratterizzato da diversi gradi
di malignità.
METODI: Al fine di perseguire tale obiettivo ho tratto vantaggio da un approccio
che integra la marcatura chimica differenziale (non-isotopica) per mezzo di sonde
reattive con i residui di cisteina (NEM, IAM, HPDP) e la purificazione
cromatografica delle proteine attive dal punto di vista ossido-riduttivo, alla
successiva analisi LC-MS/MS ed elaborazione informatizzata dei dati mediante
OpenMS per una quantificazione label-free. Tutti i passaggi di tale metodologia
sono quindi stati messi a punto e validati in stretta collaborazione con esperti
biochimici e bioinformatici.
RISULTATI: E’ stato sviluppato un metodo efficiente ed economico, non basato
sull’utilizzo di marcatori isotopici, per la caratterizzazione delle proteine attive dal
punto di vista ossido-riduttivo in campioni proteici complessi. L’applicazione del
protocollo di quantificazione ad un campione test ha dato il 100% di stime
corrette di sovra/sotto-espressione della miscela proteica. L’applicazione del
metodo allo studio del modello cellulare di carcinoma mammario ha portato
all’identificazione di più di 300 proteine ed ha permesso il raggruppamento di
quelle sensibili dal punto di vista ossido-riduttivo in gruppi non differenziali e

7
sovra- o sotto-ossidate nelle cellule più maligne rispetto alla loro controparte
meno aggressiva.
CONCLUSIONI: Nonostante sia comunemente riconosciuta l’associazione tra
fenomeni neoplastici ed uno stress ossidativo, questo studio collega la maggiore
malignità di un modello cellulare di carcinoma mammario ad un complesso
equilibrio ossido-riduttivo. In questo contesto, specifici bersagli proteici sono
ossidati mentre viene mantenuto un ambiente cellulare complessivamente ridotto.
Risultati preliminari evidenziano poi l’enzima G6PDH come possibile elemento
chiave nella regolazione di tale equilibrio.

8
2. INTRODUCTION
2.1 Redox status of proteins
Despite some ostensible formalism clarification of essential definitions, speaking
of redox proteomics is not just a mere semantic task. Redox status is a term that
has been used to describe the ratio of the convertible oxidized and reduced forms
of a specific redox couple and it should not be extended to description of the
general redox environment of a cell since the latter is a reflection of the state of
sets of redox couples. Moreover, we should also distinguish a redox pair from a
redox couple, since the former refers to both oxidizing and reducing species
involved in a reaction while the latter describes the behaviour of the reducing
specie and its corresponding oxidized form.
So a more precise definition of redox status of a redox couple could be intended
as the half-cell reduction potential of that couple while redox environment of a
linked set of redox couples (redox pairs) is the summation of the products of the
reduction potential and reducing capacity of the linked redox couples present. In
these definitions reducing capacity refers to the concentration of reducing
equivalents available (strength of the redox buffer). Each protein in the cell could
be seen as a redox couple on its own and thus described as an electrochemical
cell. Nernst equation allows us to determine the reduction potential for the half-
cell (Ered)which is the potential when the half reaction takes place at cathode (a
measure of the tendency of the oxidizing agent to be reduced).
So given the Nernst equation for the half cell reaction:
Where:
Ered = Half-cell reduction potential at the temperature of interest
Standard reduction potential
R = Universal gas costant = 8.314472 J K-1
mol-1
T = Absolute temperature in K
z = Number of moles of electrons transferred in the cell half-reaction
F = Faraday constant = 9.64853399*104 C mol
-1
aRed/Ox = Chemical activity of the reductant/oxidant specie.
a = activity coefficient * [Red/Ox]
For low concentrations activity coefficient = 1 and a = [Red/Ox]
Overflying chemical and mathematical details we can then obtain the Nernst
equation for the one electron process: Ox + e- Red

9
So we can state that each protein is characterized by its own redox status which
could be described by means of the reduction potential of the redox couple
considered. Definitely the redox status of a protein is the ratio of its reduced and
oxidized form. Moreover, the Nernst equation could be used to determine the
electromotive force between two redox couples (ΔE). Given species being
oxidized (E1) and species being reduced (E2) we then have: ΔE = E2 – E1.
If ΔE is zero, there is no electron flow. When ΔE is not zero the sign determines
the direction of electron flow (the direction of the redox reaction). As an example,
given a ratio of NADPH/NADP+ of 100:1 Reduction potential (Ered) for this
couple is equal to -374 mV from Nernst equation. This very negative reduction
potential supports the idea that the NADPH/NADP+ couple is a major driving
force for maintaining the reducing environment in cells and tissues. Moreover, as
the redox state of couples such as NADPH/NADP+change, they can force changes
in other redox pairs, for example signalling proteins.
If we go deeper into considering the redox status of a protein we should analyse
which are the modifications characterizing its reduced or oxidized status.
Obviously, the targets of such modifications are amino acid (AA) residues and,
specifically the ones having “redox-reactive” side chain functional group.
2.1.1 Reactivity of Cysteine residues
Regulation of protein function via post-translational modification (PTM) has
always been a leading area of interest in the struggle to comprehend both normal
and pathological cellular processes. PTMs study is a growing area of interest
supported by advances in high throughput proteomics. Intracellular signalling
mediated by reversible phosphorylation of serine (Ser), threonine (Thr) and
tyrosine (Tyr) residues of proteins is the best characterized PTM process. More
recently multiple modifications of arginine (Arg) and lysine (Lys) residues have
come to the fore. For example, Lys can undergo methylation, acetylation and
hydroxylation; and can also be covalently cross-linked to different proteins in
ubiquitination and similar processes, as well as transglutamination [Begg et al.,
2006]. Modifications of Lys mediate diverse processes from epigenetics, to
protein fate and structural processes. In addition to these two basic residues,
another residue which undergoes multiple modifications but which has received
considerably less attention is cysteine (Cys). The diversity of modifications of Cys
is extensive and crucial to sustainable life in the oxidizing environment of this
planet [Wouters et al., 2010; Nagahara et al., 2009]. Despite their importance Cys
modifications are often transitory and refractory to analysis [Riederer, 2009].
Interestingly, Cys has one of the shortest sidechains whereas Lys and Arg have
among the longest, extending up to 6.5 Å (Lys) or 7.5 Å (Arg) from the
polypeptide backbone [Wouters et al., 2011]. As a result, surface modifications of
10
Arg and Lys are tethered far from the backbone, almost like labels on the protein.
In contrast, modifications of Cys residues occur closer to the protein surface and
are often accompanied by conformational changes of the backbone. In addition,
Cys has the unique ability to form disulfide bonds, enabling some spectacular
redox-driven conformational changes. Thiols are unable to undergo autoxidation
in the absence of a catalyst, but several free metal ions markedly increase the rate
of autoxidation. Other factors, such as temperature, type of buffer, type of
catalyst, and oxygen concentration, are important. Moreover it has been observed
that the rate of autoxidation depends on pH, indicating the participation of the
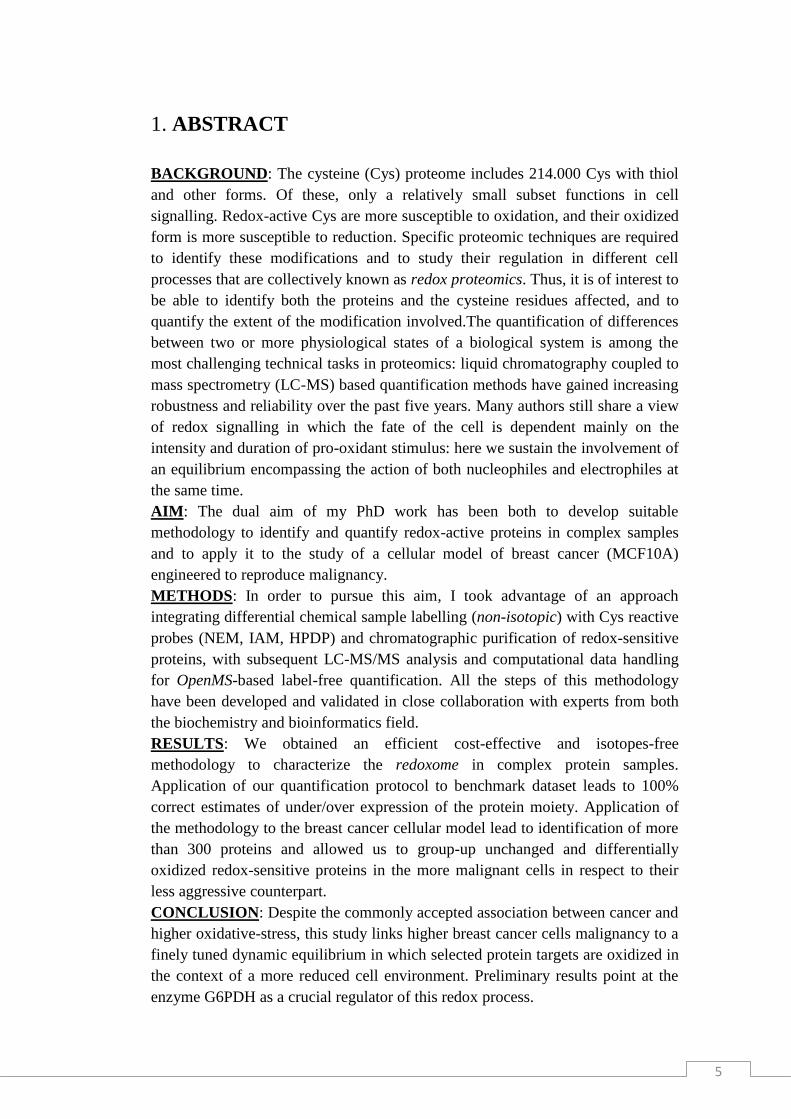
thiolate species in the reaction [Bindoli et al., 2008]. The oxidation status of sulfur
in different “reactive sulfur species” [Gregory et al., 2001] that we are going to
see is summarized in table 2.a
Table 2.a
Reactive Species Structure Oxidation
status of sulfur
Electrons required for
complete reduction to
thiol status (-2)
Thyil radical RS• -1 1
Disulfide RSSR -1 2
Disulfide-S-monoxide RS(O)SR +1;-1 4
Disulfide-S-dioxide RS(O)2SR +3;-1 6
Sulfenic acid RSOH 0 2
Hydroxyl radical HO• -1 1
Peroxide ROOR -1 2
Superoxide O2- -0.5 3
Disulfides
In biochemistry, the most familiar oxidation reaction of thiols involves the well-
known thiols/disulfide redox transition:
2 R-SH R-S-S-R + 2e- + 2 H
+
Disulfides are formed under mild oxidizing conditions and usually do not proceed
to further oxidation in the cell. However both thiols (1) and disulfides(2) can form
oxygen derivatives as follow (from Bindoli et al., 2008. Intermediates reported in

11
brackets are unstable) and both pathways are interconnected leading to the
sulfonic species which are the highest oxidized species of sulphur:
(1) R-SH [R-SOH] R-S(O)OH R-S(O)2OH
thiol sulfenic acid sulfinic acid sulfonic acid
(2) R-S-S-R R-S(O)-S-R R-S(O)2-S-R [R-S(O)2-S(O)-R]
disulfide thiosulfinate thiosulfonate disulfide trioxide
R-S(O)2-S(O)2-R R-S(O)2OH
disulfone sulfonic acid
Oxidation of disulfides is generally favoured by anhydrous conditions and finally
results in the formation of sulfonic acids after scission of the S-S bond.
Thiolsulfinates are the first members of the disulfide oxidation products and occur
naturally in biologic systems such as the well-known component of garlic allicin
(diallyldisulfide monoxides) exhibiting antibacterial and fungicidal properties.
Thiosulfinates can be easily reduced to the corresponding disulfides by thiols with
the intermediate formation of sulfenic acid, hence revealing their importance in
the biologic redox processes.
Thiosulfonatesare endowed with antimicrobial properties an act as protectants
against ionizing radiation. Those compounds hydrolize in the presence of waters
to the corresponding sulfinic acids and disulfides and their reaction with thiols
leads to sulfinic acid and disulfides.
Thiyl radical
Thiols can also be oxidized by radiation of different energies such as χ/β/γ-rays
and UV light. In this case reactions proceed through the formation of a thyil
radical (3) (thyil radicals can also be formed by transition metal-catalyzed
oxidation of thiols) which, in addition to dimerization to a disulphide (4), can
interact with oxygen forming a thioperoxyl radical intermediate (5):
(3) R-SH R-S• + H+ + e
-
(4) 2 R-S• R-S-S-R
(5) R-S• + O2 R-SOO•
Thioperoxyl radicals can interact with the parent thiols, leading to the formation
of sulfenic acid(6) [Wardman P., 1998] and regeneration of the thyil radical (7):
(6) R-S-OO• + R-SH R-SOH + R-SO•
(7) R-S-O• + R-SH R-SOH + R-S•

12
A well-established reaction of the thyil radical is its interaction with the thiolate
anion, forming first the strong reductant disulfide radical anion (8), which, in turn,
forms superoxide anion on reaction with oxygen (9) [Wardman P., 1998]:
(8) R-S• + R-S- (R-S-S-R)•
-
(9) (R-S-S-R)•- + O2 R-S-S-R + O2•
-
Sulfenic acid
Sulfenic acid (R-SOH) is the first member of sulphur oxy-acids and, although
unstable and highly reactive, has gained growing interest in biologic systems.
Because of their instability, sulfenic acids are viewed as reaction intermediates,
and are difficult to isolate. Sulfenic acids are formed after the reaction of the
thiolate group with hydrogen peroxide (10) and other hydroperoxydes
(alkylhydroperoxides and peroxynitrite) or from hydrolysis of S-nitrosothiols (11)
and after reaction of thiols with thiosulfinates (12):
(10) P-S- + H2O2 Protein-SO
- + H2O
(11) R-SNO + H2O R-S-OH + HNO
(12) R-S(O)-S-R + R’-SH R-SOH + R-S-S-R’
It is noteworthy that the rate of formation of sulfenic acid from many thiolates via
reaction with hydrogen peroxide is too slow to happen in vivo, and even if it did
form the presence of millimolar GSH in cells would convert it rapidly to protein-
S-S-G mixed disulfide form (14) [Bindoli et al., 2008]. The same could happen
also for the sulfenamide subsequently formed from sulfenic acid (15) as in the
case of PTP1B [Salmeenet al., 2003]. Sulfenic acids can however find stabilizing
conditions in some proteins, like apolar microenvironment that limits solvent
accessibility and allows the stability of the –SOH residue by hydrogen bonding.
Probably the most important factor in stabilizing sulfenic acids in proteins is the
absence of proximal thiol groups or other nucleophiles. Indeed a thiol group
would rapidly interact with the sulfenic moiety forming a disulfide (13) [Allison
WS., 1976]:
(13) R-SOH + R-SH R-S-S-R + H2O
This reaction is particularly relevant in enzymes involved in redox signalling, as
the reaction of sulfenic acid residues with glutathione, present in high
concentrations in cells, leads to the formation of a mixed disulfide (i.e.
glutathionylation of specific proteins (14):
(14) P-SOH + G-SH P-S-S-G + H2O
13
The formation of mixed disulfides, together with that of sulfenamides(15)
[Salmeenet al., 2003] prevents over-oxidation of the cysteine residues to sulfinic
and sulfonic acids:
(15) R-SOH + R’-N(H)-R’’ R’-N(R’’)-SR + H2O
Moreover sulfenic acids can undergo both electrophilic and nucleophilic
reactions, according to different reaction conditions [Allison WS., 1976]. For
instance, sulfenic acid are reactive toward nucleophilic reagents such as dimedone
(5,5’–dimethyl-1,3-cyclohexanedienone) or TNB- (2-nitro-5-thiobenzoate anion)
derived from the reduction of the thiol reagent DTNB (5,5’-dithiobis(2-
nitrobenzoic acid)). Indeed dimedone and TNB- are used to identify cysteine
sulfenic acids in proteins. Finally sulfenic acids can easily condense to form a
thiosulfinate (16) [Bindoli et al., 2008]:
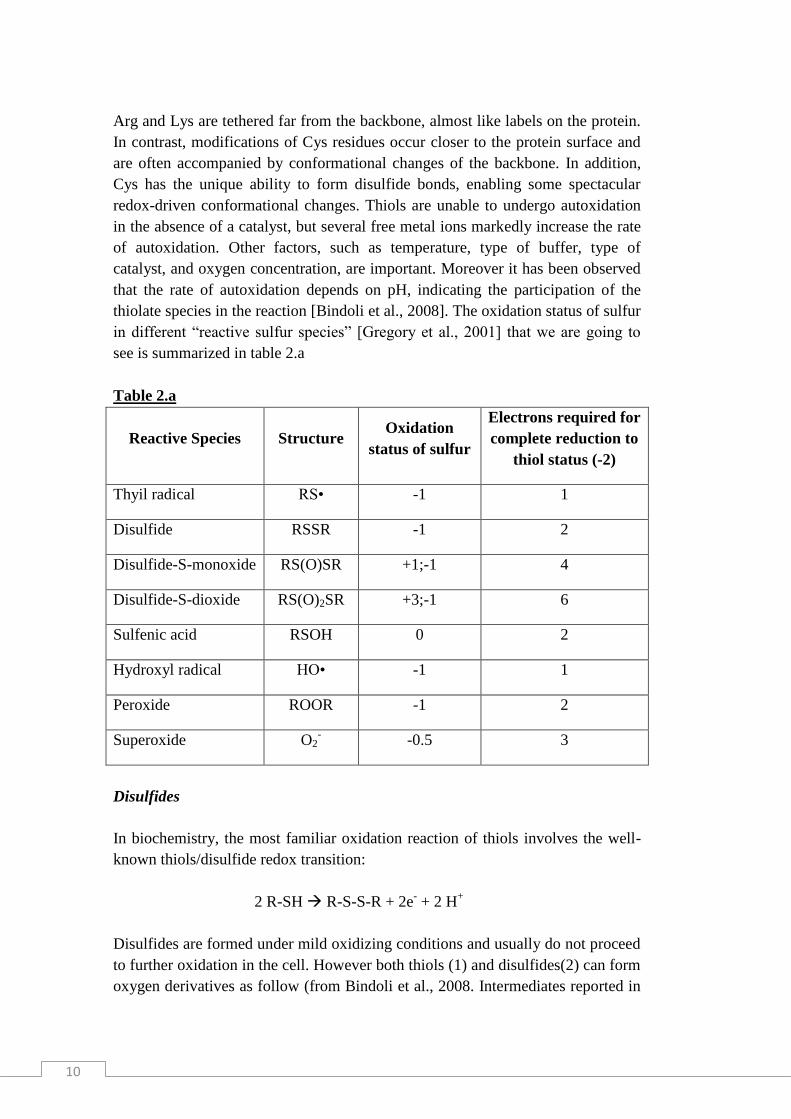
(16) 2 R-SOH R-S-(O)-S-R + H2O
In this reaction (16) dehydration of sulfenic acids proceeds through the formation
of a dimer in which the two sulfenic acids are hydrogen-bonded and involves a
nucleophilic attack exerted by the sulfenic acid sulfur on the sulfur of the second
sulfenic acid molecule (reaction from Bindoli et al., 2008 to follow):
This reaction is a clear example of both the nucleophilic and electrophilic
character of these acids.
Reaction of thiols with hydrogen peroxide
The reaction of protein thiols with hydrogen peroxide is of particular relevance for
biologic systems. It is know that thiols could be oxidized by hydrogen peroxide in
the absence of metal catalysis [Bindoli et al., 2008]. Moreover studies on the
sulphydryl enzyme glyceraldehyde-3-phosphate dehydrogenase [Little et al.,
1969] demonstrated that peroxide treatment did not involve disulfide formation
but rather oxidation of protein thiol to a sulfenic acid residue. Moreover the
reaction was pH dependent, indicating the involvement of a thiolate group acting
as a nucleophile on hydrogen peroxide (see 10 above) [Bindoli et al., 2008]. The
peroxide-inactivated enzyme can be reactivated if quickly treated with an excess
of low molecular weight thiols, but if such treatment is delayed, the inhibition
becomes irreversible, thus indicating that the sulfenic residue undergoes further
oxidation to sulfonic acid [Little et al., 1969]. Reaction kinetic of low molecular
weight thiols with H2O2 falls in the range of 18-26 M-1
s-1
and turns out to be of
14
scarce significance in biological context. Similarly proteins containing low pKa
thiols despite 20 – 30 fold increased rate constant with H2O2, are still far from
competing against glutathione peroxidases and peroxiredoxins which are orders of
magnitude more efficient in reducing hydrogen peroxide [Winterbourn et al.,
1999]. This point to the fact that deprotonation of the thiol group alone is not
sufficient to bring the interaction of hydrogen peroxide in proteins to a level
comparable to that of thiol or selenium peroxidases. Moreover a study of the
second-order rate constants of various proteins with hydrogen peroxide [Stone,
2004] indicates that only peroxidases and the bacterial sensor OxyR exhibit rate
constants on the order of 105-10
6 M
-1 s
-1 whereas phosphatases and other enzymes
such as glyceraldehyde-3-phosphate dehydrogenase and papain are in the range of
10-102 M
-1 s
-1. This sustain the idea that, to react rapidly with hydrogen peroxide,
the low pKa of cysteine is not a sufficient condition, but the thiolate requires a
proper environment defined by specific amino acid residues able to stabilize the
transition state intermediate [Tosatto et al., 2008].
2.1.2 Redox switches
Cysteine is a rarely used amino acid that accounts for about 2% of the amino acids
in eukaryotic proteins and about 1% in proteins from eubacteria and archaea. As
reported above thelarge, polarizable sulfur atom in its thiol group is electron-rich
and highly nucleophilic; hence, cysteines can undergo a broad range of chemical
reactions.Nevertheless, despite the fact that all cysteines, from a chemical point of
view, are “reactive”, not all of them could act as redox switches.Here we may look
at redox switches as specific protein-cysteine-thiols characterized by peculiar
reactivity which make them target of choice for oxidative modification.As we
have seen the intrinsic reactivity of protein thiols depends not only on their pKa
but also on other structural features, such as their accessibility. For example,
although the –SH of bovine albumin has a much lower pKa [Lewis et al., 1980]
than glutathione (GSH), it has a relatively low apparent reactivity which probably
depends on steric hindrance.On the other hand we have also seen that peroxidases
are reasonable targets acting as both redox signal sensors and transducers: indeed
peroxidases bear cysteine residueshighly reactive with H2O2.Definitely redox
signaling often implies a post-translational protein modification of cysteine
residues and a particular cysteine residue may be differentially modified in
response to diverse stimuli. Post-translationally modified cysteines are not
necessarily directly involved in the catalytic activities of enzymes, but may
function at an allosteric site and, thus, regulate the enzymatic activities or other
protein functions through structural changes. So a large part of biological
properties and functions involving protein structure as well as enzyme catalysis
and redox-signalling pathways depends on the redox properties of the thiol group
present both in protein and in low-molecular-weight molecules [Bindoli et al.,
2008]. Nevertheless the maintenance of intracellular redox homeostasis was

15
thought to be mainly controlled by the GSH/GSSH ratio. Thus, with GSH and its
enzymes as the main actors, the contribution of protein –SH groups (PSH) as a
molecular entity capable of reacting with electrophiles and oxygen-derived
species was generally considered to be negligible. Anyway this assumption does
not consider the fact that PSH may play an antioxidant role, as GSH does, and at
the same time perform more specific regulatory functions [Di Simplicio et al.,
1998].
So their structural environment and pKa value make cysteine redox-sensitive and
make proteins potentially redox regulated. Most cytoplasmic protein thiols have
pKa values greater than 8.0, which render the thiol groups predominantly
protonated and largely non-reactive at intracellular pH [Giles et al., 2001]. Thiol
groups of redox-sensitive cysteines, on the other hand, have characteristically
much lower pKa values, ranging from as low as 3.5 in thiols transferase to 5.1-
5.6 in protein tyrosine phosphatases. The low pKa values of redox-sensitive
cysteines arise primarily from stabilizing charge-charge interactions between the
thiolate anion and neighbouring positively charged or aromatic side chains. So
under physiological pH conditions, these thiols are therefore present as
deprotonated, highly reactive thiolate anions [Brandes et al., 2009].
Fig. 2.a Oxidative thiol modifications
Oxidation of cysteine thiol groups by H2O2 leads to sulfenic acid (R-SOH) formation. Sulfenic
acids are either stabilized by nearby charges or react with neighboring thiols or proximal nitrogen
to form disulfide bonds (R’-S-S-R”) or sulfenamide bonds (R’-S-NH-R’), respectively. In the
presence of high H2O2 concentrations, overoxidation to sulfinic (R-SO2H) or sulfonic acid (R-
SO3H) occurs. Although a few protein-specific sulfinic acid reductases have been identified,
overoxidation is still considered to be largely irreversible in vivo. Alternatively, reaction of
thiolate anions (RS-) with oxidized cysteines of other proteins or low molecular weight thiols such
16
as glutathione (GSSG) leads to mixed disulfide bond formation (R’-S-S-R”) or S-glutathionylation
(R-S-SG), respectively. Overoxidation of disulfide bonds in the presence of strong oxidants can
cause thiosulfinate (R’-SO-S-R”) or irreversible thiosulfonate (R’-SO2-S-R”) formation. Most
oxidative thiol modifications are reduced by members of the glutaredoxin (Grx) system and
thioredoxin (Trx) system (reductants), which draw their reducing power from cellular NADPH.
Exposure of thiolate anions to reactive nitrogen oxide species causes S-nitrosothiol formation,
whereas treatment with peroxynitrite yields S-nitrothiol formation. The exact mechanism by which
individual RNS cause oxidative thiol modifications in vivo is still under investigation. [From
Brandes et al., 2009]
Thiolate anion are highly susceptible to oxidation by electrophiles and can
undergo a wide spectrum of oxidative modifications, including: sulfenic (SOH),
sulfinic (SO2H) and sulfonic (SO3H) acids, disulfide bonds (PSSP) or
nitrosothiols (SNO). Cysteine sulfenic acids and their deprotonated cysteine-
sulfenates are frequently formed upon reaction of protein thiols with H2O2 and
represents reactive and versatile oxidation products. As we have seen, sulfenic
acids are highly reactive and thus often considered metastable intermediates
undergoing further reactions to form stable modifications, such as disulfides with
other protein thiols or glutathione (S-glutathionilation) [Fig. 2.a]. Most oxidative
modifications are fully reversible in vivo and utilize dedicated oxidoreductases,
such as thioredoxin or glutaredoxin system, to quickly restore the original redox
state upon the cell’s return to nonstress conditions. It appears that it is the reaction
rate with these dedicated oxidoreductases that often determines the lifespan of
oxidized proteins and supports their accumulation even in an overall reducing
environment [Leichert at al., 2004]. The type and extent of oxidative
modifications in redox-regulated proteins depends on the type of oxidative pulse,
its intensity, duration and distance with respect to sensor/transducers. Even small
changes in the basal level of intracellular electrophiles can cause oxidative
modifications in proteins that are specifically sensitive to these oxidants: such
proteins are those bearing so called “redox-switches”.
So redox signalling does not simply represent non-specific oxidative damage and
candidate redox-switches cysteines balance diverse redox signalling responses to
multiple stimuli. The susceptibility of cysteine residues to modification by a
defined electrophile is dictated by a combination of factors including the pKa of
the thiol and the local pH of the intracellular compartment: for example, the high
intra-mitochondrial pH (8.0 – 8.5) may be one reason mitochondrial protein thiols
are particularly susceptible to modification and play a key role in cell signalling
[Murphy, 2011]. Other factors are the accessibility of the thiol within protein
structure and the reactivity of the thiols-modifying agent: a thiol having a pKa of
7.4 for example will be 50% deprotonated at physiological pH, that is to say it
will be in its more nucleophilic thiolate form. Thus lower pKa thiols, which are
more likely to be deprotonated at physiological pH, are favoured in their reaction
with electrophiles and are more suitable candidates as redox-switches [Higdon et
al., 2012]. Localization of thiol residues within a protein also seems to be

17
important in dictating their relative susceptibilities to modification: the most
accessible thiol residue is more likely to be modified than those less accessible
[Fig. 2.b].
Fig. 2.b Factors which determine susceptibility to thiol modification and
cellular thiol targets The local protein environment is a very important determinant of thiol reactivity. For example, an
inaccessible, high pK a protein thiol would be considered the least prone to modification.
However, a low pKa accessible thiol would be a highly sensitive target. [From Higdon et al., 2012]
Thus the combination of steric and biochemical factors result in a functional
hierarchy for the activation of cellular signalling pathways on exposure of cells to
an electrophile. The first pathways to respond are those which are the closes to the
site of formation or exposure to the electrophile. The functional consequence of
these factors is that the “first responders to electrophile exposure” are not
necessarily the most abundant thiol-containing proteins [Higdon et al., 2012].
2.1.3 Structural and functional disulfides
Taking protein chemistry into account a disulfide bond is purely the covalent link
between two sulfur atoms generated by the oxidation of two cysteines residues.
Such bonds are important for the stabilization of the native structure of proteins
and determination of their arrangements into wild type or recombinant proteins
can provide insights into their folds as well as information to guide structural
determination by NMR or X-ray crystallography. The very first determination of
the amino acid sequence of Insulin by Sanger (1959) was indeed accompanied by
investigation of its disulfide arrangement in order to complete the description of
its primary chemical structure. Also characterization of the disulfides of
ribonuclease by Spackman et al. (1960) was another informative study into the
determination of such protein structural element. Summarizing what we have seen
above (§ 2.1.1) Various pathways can lead to the formation of disulfides:

18
(a) free radical oxidation of the thiol, evolving to disulfide with a proximal
thiol, trough the formation of the intermediate disulfide anion radical
[Mottley et al., 2001]
R’• + RSH R’H + RS•
RS• + R’’S- (RSSR”) •
-
(RSSR”) •- + O2RSSR” + O2•
-
(b) Nucleophilic displacement reaction in the presence of a hydrogen peroxide
producing a sulfenic acid residue [Dickinson et al.,2002].
RSH + H2O2 RSOH + H2O
RSOH + R’SH RSSR’ + H2O2
(c) Thiol-disulfide exchange reaction [Maiorino et al., 2007]
R’SSR” + R”’SH R’SSR”’ + R”SH
Mechanism (a) is more likely to be involved as antioxidant mechanism in the
presence of oxidizing free radicals, while pathways (b) and (c) are relevant for the
formation and reshuffling of disulfides in proteins respectively. Beside
mechanisms underlying their formation, as stated at the beginning of this
paragraph, intra-protein disulfide bonds are classically viewed as part of the
tertiary structure of the protein and their formation is an important step in protein
folding. Similarly, many disulfide bonds are important in the quaternary structure
of proteins (ie – in the formation of homo or hetero multimers). Nevertheless,
aerobic organisms maintain a reduced state in the cell despite the highly oxidizing
environment (21% oxygen, at sea level) where they live and we have seen (§
2.1.2) that the redox state of protein thiols is then dependent on their cellular
location [Ghezzi, 2005]. In the cytoplasm, the environment is highly reduced,
mainly due to the high intracellular concentration of GSH, and the GSH/GSSG
ratio is 30–100. For this reason cysteine residues of cytoplasmic proteins are
mainly present as free thiols, both in mammalian cells and bacteria. It is generally
thought that the only disulfide bonds in the cytoplasm are transient ones formed as
a part of the oxidation-reduction reactions of enzymes. In contrast, extracellular
proteins are mainly disulfide proteins, because of the oxidative extracellular
environment. On the other hand, structural disulfide bonds are formed during the
folding process in the endoplasmic reticulum as this intracellular compartment is
different from the cytosol in that it is highly oxidizing, with a GSH/GSSG ratio of
approx. 1 [Hwang et al., 1992]. Recent studies of redox proteomics have
challenged the belief that cytosolic proteins only have free cysteines, showing that
many disulfide bonds are formed in a large number (∼100) of cytoplasmic
proteins in cardiomyocytes and neuronal cells exposed to oxidants [Brennan et al.,
19
2004; Cumming et al., 2004]. Evidence that a substantial amount of glutathione is
present as mixed disulfide with proteins also points in this direction. However,
most of these disulfide bonds are different from those important for the structural
integrity of proteins. These non-structural disulfide bonds differ from structural
ones in that the former are reversible, and both reduced and oxidized forms of
these proteins coexist. For a comparison, redox potentials in thiol-disulfide
oxidoreductases range from -95 mV to -330 mV, whereas structural disulfides
may have potentials as low as -470 mV. In other words, such structural disulfides
would never be found as dithiols under normal physiological conditions.
In his exhaustive review Wouters [Wouters et al., 2010] pointed out at least 14
different kinds of non-structural disulfides as those contradicting Richardson and
Thornton rules (RT rules from now on) and called them “forbidden disulfides”.
Very briefly, Richardson and Thornton pinpointed constraints in protein backbone
where disulfides between resident cysteine residues could not form if not at the
cost of strain introduction into protein structure.
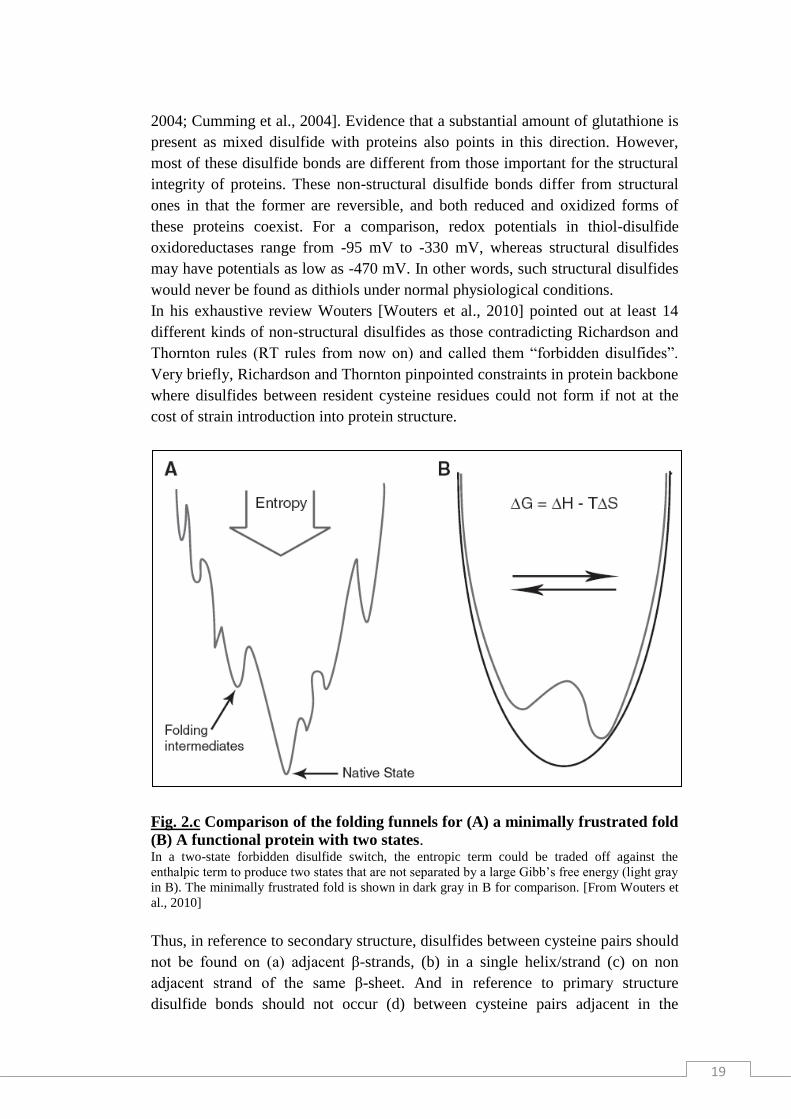
Fig. 2.c Comparison of the folding funnels for (A) a minimally frustrated fold
(B) A functional protein with two states. In a two-state forbidden disulfide switch, the entropic term could be traded off against the
enthalpic term to produce two states that are not separated by a large Gibb’s free energy (light gray
in B). The minimally frustrated fold is shown in dark gray in B for comparison. [From Wouters et
al., 2010]
Thus, in reference to secondary structure, disulfides between cysteine pairs should
not be found on (a) adjacent β-strands, (b) in a single helix/strand (c) on non
adjacent strand of the same β-sheet. And in reference to primary structure
disulfide bonds should not occur (d) between cysteine pairs adjacent in the
20
sequence [Wouters et al., 2010 and references therein]. From a thermodynamic
point of view forbidden disulfides are defined as a “bi-stable switch” [Wouters et
al., 2010]: a bi-stable switch is characterized by two states, both of which must
contain sufficient stored potential energy to help drive the switch into the opposite
state in response to the appropriate signal. Forbidden disulfides may operate as bi-
stable switches by trading off different terms in the Gibb’s free energy: forming
the disulfide bond decrease the entropy of the chain, however, for forbidden
disulfides there is a significant cost in terms of enthalpy to form the bond because
of the abnormal stereochemistry adopted by the protein chain (Fig. 2.c). Definitely
disulfides disobeying RT rules are likely candidates to act as redox switches.
2.2 Oxidation rate and reduction rate
Specificity and reversibility of redox signalling
Changes in cellular redox environment can initiate signalling cascades and lead to
biological consequences, such as proliferation, differentiation, apoptosis etc. This
phenomenon could be pointed out as redox regulation, a term defined as “a
reversible post-translational alteration in the properties of a protein, typically the
activity of an enzyme, as a result of change in its oxidation state”. Authors of this
definition made a clear distinction between redox regulation and terminal
oxidation, which they defined as “an irreversible reaction that parks protein for
degradation” and is implicitly understood to impair protein function. On the other
hand, the term redox signalling, despite some interchange ability with redox
regulation, extends the meaning to include entire chains involving cascades of
redox reactions, eventually leading to changes in gene expression.
So far we have seen that different kinds of electrophiles in cell, together with
specific proteins cysteine residues with particular reactivity, have the requisites to
account for signalling functions. In a very simplified view we could say that every
signal needs to fulfil at least two requisites: (a) it should be specific (b) it should
be reversible (c) its action should be limited in time and space. As for the
specificity it is often conferred by protein-protein interaction or just by limiting
reactivity of signalling molecules in respect to signalling sensors/transducers.
Nevertheless, in the case of redox signalling it is not so “easy” to speak of
specificity, since electrophiles acting as signalling molecules are often
characterized by high chemical reactivity without specificity for targets to react
with and, considering for example hydroperoxides, we cannot even invoke
interaction specificity. Of course among candidate signalling molecules it is
possible to pinpoint hydrogen peroxide as preferential choice instead of far more
aggressive species like radicals the reactivity of whom is almost diffusion-rate
limited. Moreover, we have seen previously that only specific cysteine residues in
proteins will undergo oxidative switching in response to electrophiles. The
combination of aforementioned elements can thus confer some degree of
21
specificity even to redox signalling. Furthermore, another possible mechanism of
specificity is in that proteins bearing redox sensible cysteine residues like
peroxidases/thioredoxins could act themselves both as sensors and transducers of
the signal: thus protein-protein interaction also takes its role in redox signalling.
As for the reversibility of redox signalling: first we already demonstrated that
cysteine residues acting as redox switches are characterized by reversible
oxidative modification (see above); second, the cell is constitutively endowed
with complex enzymatic oxidants scavenging machinery (peroxidases, redoxins,
reductase system). Despite historical limiting view of such antioxidant defence
system as a merely instrument to counteract deleterious oxidative damage, the
whole apparatus could act as a finely tuned switch-off mechanism in the context
of redox signalling. Finally, limited action in time and space of redox signalling
could be achieved by both switching off mechanisms and localized production
inside the cell of signalling molecules. Indeed, as we will see later, different
localized and specific sources of electrophiles could be found inside the cell.
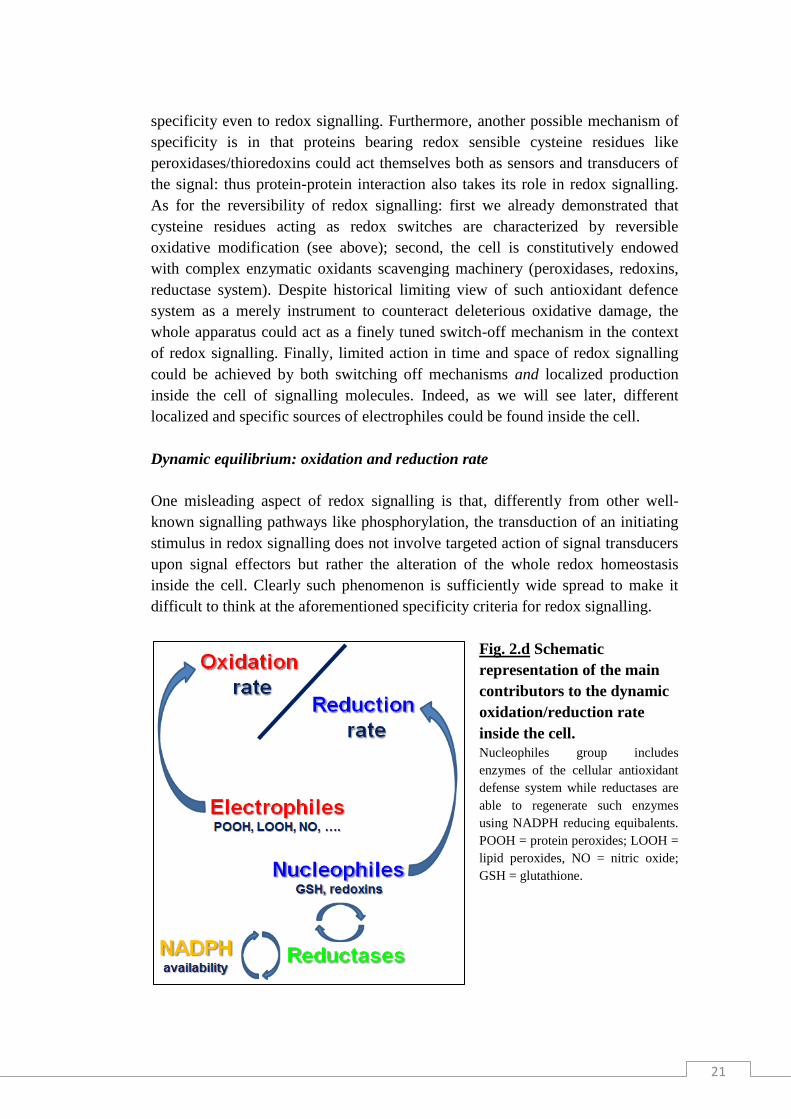
Dynamic equilibrium: oxidation and reduction rate
One misleading aspect of redox signalling is that, differently from other well-
known signalling pathways like phosphorylation, the transduction of an initiating
stimulus in redox signalling does not involve targeted action of signal transducers
upon signal effectors but rather the alteration of the whole redox homeostasis
inside the cell. Clearly such phenomenon is sufficiently wide spread to make it
difficult to think at the aforementioned specificity criteria for redox signalling.
Fig. 2.d Schematic
representation of the main
contributors to the dynamic
oxidation/reduction rate
inside the cell.
Nucleophiles group includes
enzymes of the cellular antioxidant
defense system while reductases are
able to regenerate such enzymes
using NADPH reducing equibalents.
POOH = protein peroxides; LOOH =
lipid peroxides, NO = nitric oxide;
GSH = glutathione.
22
Moreover also the enzymatic switch off machinery is distributed inside the cell
and so it is unlikely to act by turning off oxidative stimulus just locally. Definitely
rather than thinking of a point-targeted specific modification of signal effectors or
transducers we should better look at a more general dynamic equilibrium between
oxidation and reduction rate inside the cell. A simplified view of the main actors
of such mechanism is reported in Fig. 2.d while a more general view of the
cellular systems taking part in the regulation of oxidation/reduction rate is
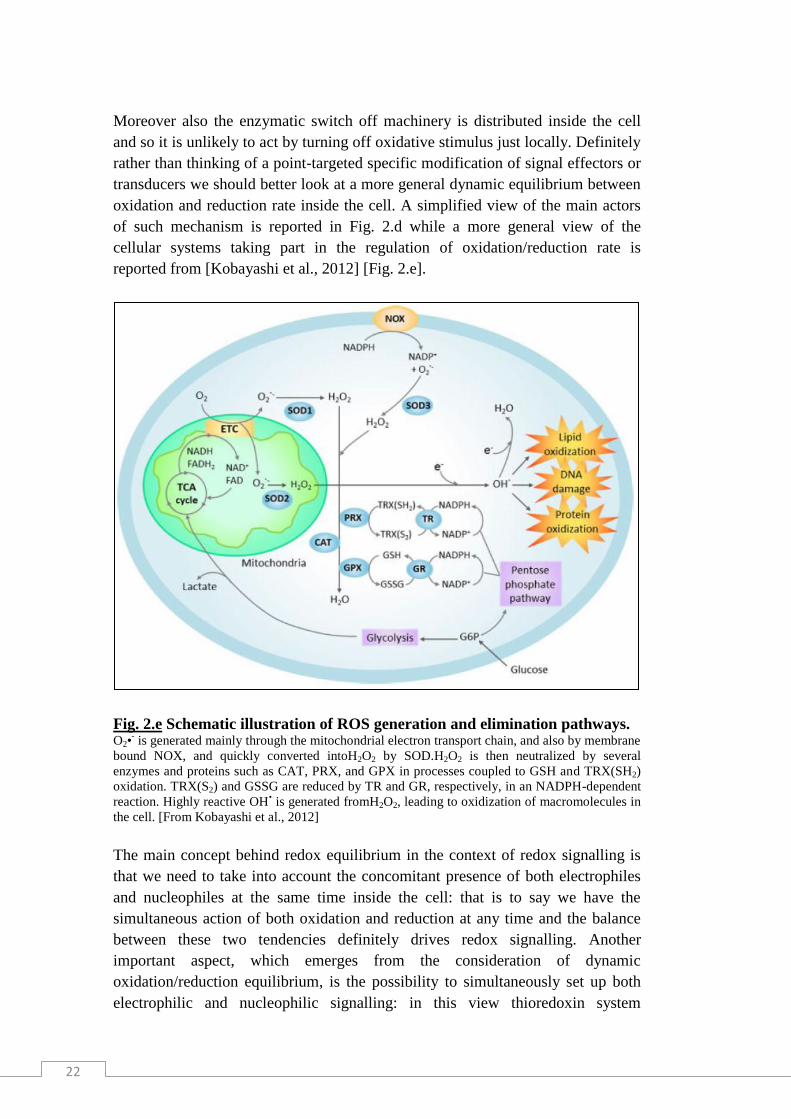
reported from [Kobayashi et al., 2012] [Fig. 2.e].
Fig. 2.e Schematic illustration of ROS generation and elimination pathways. O2•
- is generated mainly through the mitochondrial electron transport chain, and also by membrane
bound NOX, and quickly converted intoH2O2 by SOD.H2O2 is then neutralized by several
enzymes and proteins such as CAT, PRX, and GPX in processes coupled to GSH and TRX(SH2)
oxidation. TRX(S2) and GSSG are reduced by TR and GR, respectively, in an NADPH-dependent
reaction. Highly reactive OH• is generated fromH2O2, leading to oxidization of macromolecules in
the cell. [From Kobayashi et al., 2012]
The main concept behind redox equilibrium in the context of redox signalling is
that we need to take into account the concomitant presence of both electrophiles
and nucleophiles at the same time inside the cell: that is to say we have the
simultaneous action of both oxidation and reduction at any time and the balance
between these two tendencies definitely drives redox signalling. Another
important aspect, which emerges from the consideration of dynamic
oxidation/reduction equilibrium, is the possibility to simultaneously set up both
electrophilic and nucleophilic signalling: in this view thioredoxin system
23
(nucleophiles) should reverse target thiols oxidized by electrophiles. The balance
between oxidation and reduction rate is then determined by both thermodynamic
and kinetic criteria, where kinetic mainly accounts for peroxidases activity on one
side and thermodynamic constraints determine which thiols will be reversed by
thioredoxins system and which will not.
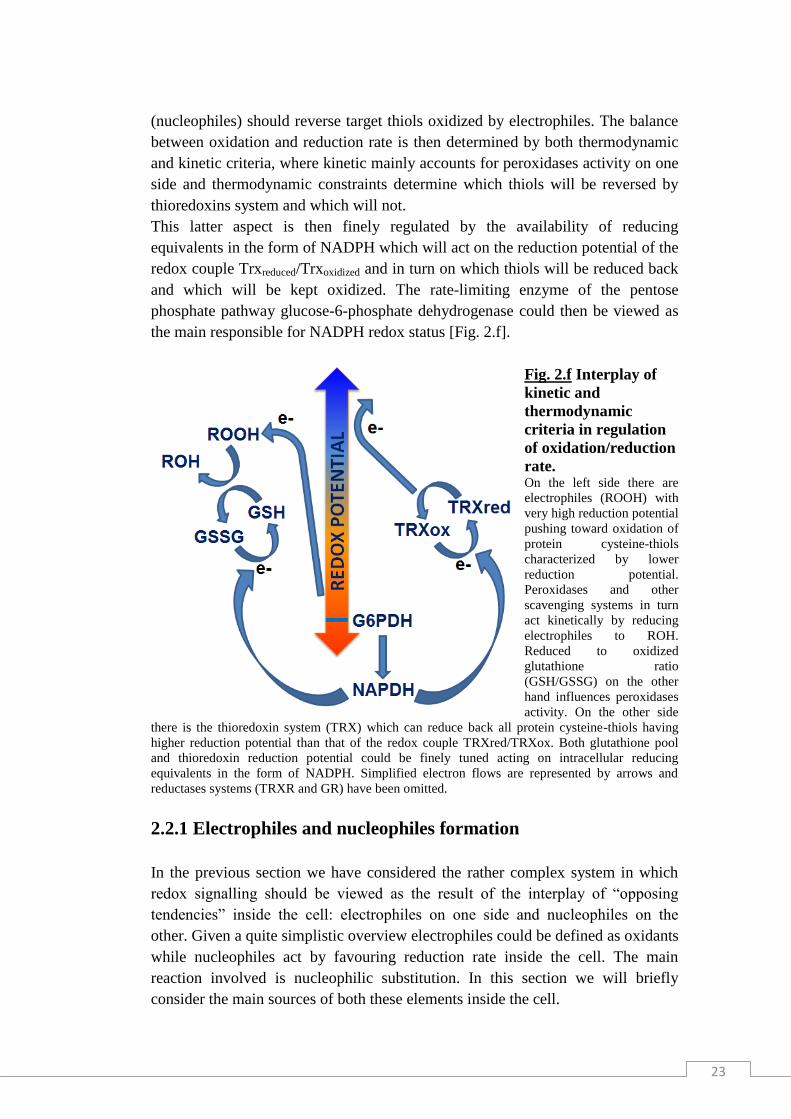
This latter aspect is then finely regulated by the availability of reducing
equivalents in the form of NADPH which will act on the reduction potential of the
redox couple Trxreduced/Trxoxidized and in turn on which thiols will be reduced back
and which will be kept oxidized. The rate-limiting enzyme of the pentose
phosphate pathway glucose-6-phosphate dehydrogenase could then be viewed as
the main responsible for NADPH redox status [Fig. 2.f].
Fig. 2.f Interplay of
kinetic and
thermodynamic
criteria in regulation
of oxidation/reduction
rate. On the left side there are
electrophiles (ROOH) with
very high reduction potential
pushing toward oxidation of
protein cysteine-thiols
characterized by lower
reduction potential.
Peroxidases and other
scavenging systems in turn
act kinetically by reducing
electrophiles to ROH.
Reduced to oxidized
glutathione ratio
(GSH/GSSG) on the other
hand influences peroxidases
activity. On the other side
there is the thioredoxin system (TRX) which can reduce back all protein cysteine-thiols having
higher reduction potential than that of the redox couple TRXred/TRXox. Both glutathione pool
and thioredoxin reduction potential could be finely tuned acting on intracellular reducing
equivalents in the form of NADPH. Simplified electron flows are represented by arrows and
reductases systems (TRXR and GR) have been omitted.
2.2.1 Electrophiles and nucleophiles formation
In the previous section we have considered the rather complex system in which
redox signalling should be viewed as the result of the interplay of “opposing
tendencies” inside the cell: electrophiles on one side and nucleophiles on the
other. Given a quite simplistic overview electrophiles could be defined as oxidants
while nucleophiles act by favouring reduction rate inside the cell. The main
reaction involved is nucleophilic substitution. In this section we will briefly
consider the main sources of both these elements inside the cell.
24
Sources of biologically relevant ROS
According to Kobayashi [Kobayashi et al., 2012] the term Reactive Oxygen
Species (ROS) could be defined as a collective term for oxygen species that are
more reactive than free oxygen. Superoxide, hydrogen peroxide, hydroxyl radical,
and singlet oxygen comprise the main ROS. But broadly speaking, ROS also
encompasses nitric oxide. Another author [Gupta et al., 2012] distinguishes ROS
into two main types: the free oxygen radical and the non-radical. While free
oxygen radical ROS contain one or more unpaired electron in their outer
molecular orbital, the non-radical ROS lack unpaired electrons but are chemically
reactive and can be converted to radical ROS. The sources of ROS are both
extracellular and intracellular. Extracellular ROS con be found as pollutants,
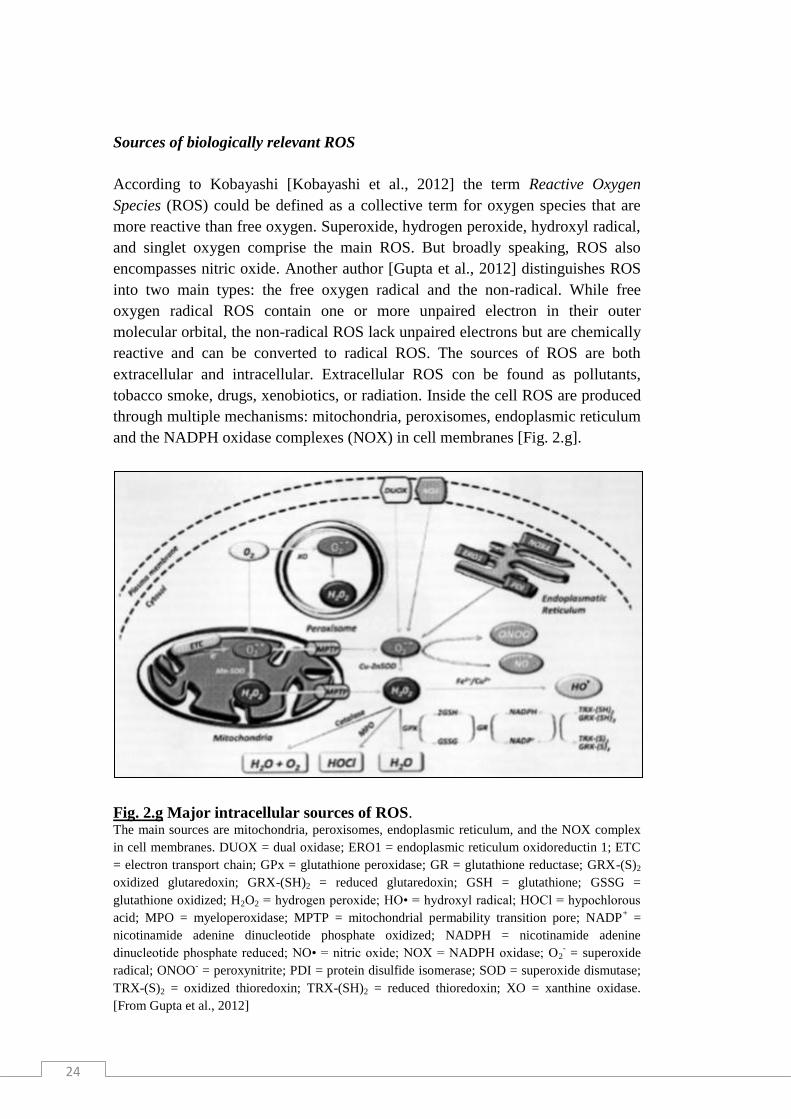
tobacco smoke, drugs, xenobiotics, or radiation. Inside the cell ROS are produced
through multiple mechanisms: mitochondria, peroxisomes, endoplasmic reticulum
and the NADPH oxidase complexes (NOX) in cell membranes [Fig. 2.g].
Fig. 2.g Major intracellular sources of ROS. The main sources are mitochondria, peroxisomes, endoplasmic reticulum, and the NOX complex
in cell membranes. DUOX = dual oxidase; ERO1 = endoplasmic reticulum oxidoreductin 1; ETC
= electron transport chain; GPx = glutathione peroxidase; GR = glutathione reductase; GRX-(S)2
oxidized glutaredoxin; GRX-(SH)2 = reduced glutaredoxin; GSH = glutathione; GSSG =
glutathione oxidized; H2O2 = hydrogen peroxide; HO• = hydroxyl radical; HOCl = hypochlorous
acid; MPO = myeloperoxidase; MPTP = mitochondrial permability transition pore; NADP+ =
nicotinamide adenine dinucleotide phosphate oxidized; NADPH = nicotinamide adenine
dinucleotide phosphate reduced; NO• = nitric oxide; NOX = NADPH oxidase; O2- = superoxide
radical; ONOO- = peroxynitrite; PDI = protein disulfide isomerase; SOD = superoxide dismutase;
TRX-(S)2 = oxidized thioredoxin; TRX-(SH)2 = reduced thioredoxin; XO = xanthine oxidase.
[From Gupta et al., 2012]

25
Mitochondria house the electron transport chain, which transfers to oxygen
electrons from NADH and succinate during respiratory ATP synthesis. The
leakage of electrons from the electron transport chain during such process results
in the reduction of molecular oxygen to superoxide [Murphy, 2009]. The
mitochondrial permeability transition pore in the outer membrane of mitochondria
allows leakage of superoxide into the cytoplasm. Superoxide is then dismutated
into hydrogen peroxide either in the mitochondrial matrix (by Mn-SOD) or in the
cytosol (by Cu-ZnSOD). H2O2, which is highly diffusible oxygen specie can be
converted to water by catalase and peroxidases, or, in the presence of transition
metals, it can be converted to highly reactive hydroxyl radicals. Moreover,
superoxide can also react with the reactive nitric oxide (NO•) to form
peroxynitrite (ONOO-). Another major source of ROS, in the form of superoxide
or hydrogen peroxide, are NOX and its dual oxidase relatives (DUOX) [Lambeth,
2004], which are localized to various cellular membranes. NOX system consists
of NOX1, NOX2, NOX4, NOX5, p22phox
, p47phox
, and the small G protein Rac1.
ROS are also generated in the endoplasmic reticulum during the process of protein
folding and disulphide bond formation. The glycoprotein endoplasmic reticulum
oxidoreductin 1, the protein disulphide isomerase, and NOX4 are the major
sources of ROS in the endoplasmic reticulum [Gupta et al., 2012].
Antioxidant defense mechanisms
Under normoxic conditions, intracellular levels of ROS are kept low to protect
cells from damage. The formation of reactive oxygen and nitrogen species is
balanced by the action of both enzymatic and non-enzymatic antioxidants. The
most efficient enzymatic antioxidants involve superoxide dismutase, catalase and
glutathione peroxidases. Instead non-enzymatic antioxidants encompass Vitamin
C, Vitamin E, carotenoids, glutathione, lipoic acid, natural flavonoids, melatonin
and other compounds [Valko et al., 2006 and references therein]. Moreover
certain antioxidants are able to regenerate other antioxidants and thus restore their
original function (antioxidant network). About the antioxidant network Bindoli et
al. [Bindoli et al., 2008] talk out the concept of “cellular thiol redox state control
by thioredoxin and glutathione system” which was first introduced to indicate the
signalling action of the thioredoxin system on the thiol enzyme activity.
The cellular thiol redox state is controlled by two major systems, the thioredoxin
and glutathione systems, which are in close communication with hydrogen
peroxide through peroxiredoxins and glutathione peroxidases, respectively [Fig.
2.h]. They are present both in the cytosol and mitochondria and, in either systems,
the reducing equivalents are fed by NADPH. Different pathways of NADP+
reduction are operative in the cytosol and mitochondria. Whereas cytosolic
NADP+ is reduced in the pentose phosphate pathway, in mitochondria, electrons
are delivered through the various dehydrogenases coupled to the energy-linked
transhydrogenase that catalyzes the transfer of reducing equivalents from NADH

26
to NADP+. Furthermore, the mitochondrial glutamate and isocitrate
dehydrogenases, in addition to NAD+, use NADP
+ for the oxidation of their
respective substrates, providing a further source of NADPH. The thioredoxin
system includes thioredoxin reductases (TrxR) and thioredoxins (Trx), which act
sequentially in transferring electrons delivered by NADPH. Thioredoxins act as
electron donors for a number of enzymes, such as ribonucleotide reductase,
methionine sulfoxidereductase and peroxiredoxins which may be active as
antioxidants by rapidly regulating the level of hydrogen peroxide [Bindoli et al.,
2008 and references therein]. On the other hand, glutathione is the predominant
non-protein thiol in cells where it plays essential roles as an enzyme substrate ad a
protecting agent against xenobiotics and oxidants.
Fig. 2.h Reduction of hydrogen peroxide mediated by thioredoxin (A) and
glutathione (B) pathways. Electrons are delivered by NADPH maintained reduced by the pentose phosphate pathway in the
cytosol, and by the respiratory substrates in mitochondria. The proton-translocating
transhydrogenase transfers electrons from NADH to NADP+ to form NADPH. Sulfenic and
selenenic acid residues appears as key intermediates in the thioredoxin and glutathione pathways,
respectively [From Bindoli et al., 2008]
Glutathione, maintained in the reduced state by glutathione reductase, is able to
transfer its reducing equivalents to several enzymes, such as glutathione
peroxidases (GPx), glutathione transferases (GSTs) and glutaredoxins. Although
thioredoxin and glutathione systems are apparently similar in their cellular
functions as they both maintain a reduced environment by using NADPH as
source of reducing equivalents, a major difference is represented by the cell

27
concentrations of glutathione that are far larger than that of thioredoxin.
Nevertheless, the two systems operate independently, fulfilling different roles
within the cell [Trotter et al., 2003].
2.2.2 Nrf2-Keap1 feedback loop
Upon exposure of cells to oxidative stress or chemopreventive compounds, Nrf2
translocates to the nucleus, forms a heterodimer with its obligatory partner Maf,
and binds to the antioxidant response element (ARE) sequence to activate
transcription of several different genes. The Nrf2 downstream genes reported by
Lau et al [Lau et al., 2008] can be grouped into several categories, including (1)
intracellular redox-balancing proteins: glutamate cysteine ligase (GCL),
glutathione peroxidase (GPx), thioredoxin (Trx), thioredoxin reductase (TrxR),
peroxiredoxin (Prx), and heme oxygenase-1 (HMOX-1) (2) phase II detoxifying
enzymes: glutathione-S-transferase (GST), NADPH quinone oxidoreductase-1
(NQO1), and UDP-glucuronosyltransferase (UGT), and (3) transporters:
multidrug resistance-associated protein (MRP).
Fig. 2.i Schematic model of Nrf2 regulation by Keap1. Keap1 is a key regulator of the Nrf2 signaling pathway and serves as a molecular switch to turn on
and off the Nrf2-mediated antioxidant response. (I) The switch is in off position: under basal
conditions, Keap1, functioning as an E3 ubiquitin ligase, constantly targets Nrf2 for ubiquitination
and degradation. As a consequence, there are minimal levels of Nrf2. (II) The switch is turned on:
oxidative stress or chemopreventive compounds inhibit activity of the Keap1-Cul3-Rbx1 E3
ubiquitin ligase, resulting in increased levels of Nrf2 and activation of its downstream target genes.
28
(III) The switch is turned off again: Upon recovery of cellular redox homeostasis, Keap1 travels
into the nucleus to remove Nrf2 from the ARE. The Nrf2- Keap1 complex is then transported out
of the nucleus by the nuclear export sequence (NES) in Keap1. In the cytosol, the Nrf2-Keap1
complex associates with the Cul3-Rbx1 core ubiquitin machinery, leading to degradation of Nrf2.
For clarity, the constitutive cytoplasmic-nuclear shuttling of Nrf2, Keap1, and the complex is
omitted. [From Lau et al., 2008]
The primary function of intracellular redox-balancing proteins is to maintain
cellular glutathione and Trx levels and reduce levels of reactive oxygen species.
Phase II enzymes function in two aspects: (I) metabolize xenobiotics into less
toxic forms, or (II) catalyse conjugation reactions to increase the solubility of
xenobiotics, thereby, facilitating their elimination. Lastly, the main function of
transporters is to control uptake and efflux of endogenous substances and
xenobiotics. The majority of genes downstream of Nrf2 contain an ARE sequence
in their promoter. The activity of Nrf2 is negatively regulated by Kelch-like ECH-
associated protein 1 (Keap1). It has been proposed that Keap1 acts as a molecular
switch that is able to turn the Nrf2 signalling pathway on or off according to
intracellular redox conditions. Serving as a molecular switch, Keap1 possesses
dual functions: it is able to (I) “sense” changes in the redox homeostasis and (II)
turn the Nrf2-mediated response on or off. Keap1 is rich in cysteine residues (27
cysteine residues in human Keap1), which encodes the sensor mechanism. Under
basal conditions, when redox homeostasis is maintained in cells, the molecular
switch of Keap1 is in an “off” position. This is achieved through constant Keap1-
mediated degradation of Nrf2 by the ubiquitin-mediated proteasomal degradation
system. Lau et al. propose a model of Keap1 functions in switching on/off the
Nrf2 signaling pathway (Fig. 2.i). Under basal conditions, Keap1 switches the
Nrf2 signalling pathway off and mantains low basal levels of Nrf2 by constantly
targeting Nrf2 for ubiquitin-mediated protein degradation. When Keap1 senses an
alteration in the redox balance, the cysteine residues in Keap1 are modified,
resulting in a conformational change of the E3 ubiquitin ligase to a configuration
not conducive for Nrf2 ubiquitination. Consequently, Nrf2 accumulates under
oxidative conditions, which allows free Nrf2 to translocate to the nucleus and
transcriptionally activate downstream genes by binding to the ARE sequences and
switching the Nrf2 signalling pathway on. Upon recovery of the redox balance,
Keap1 travels into the nucleus, where it causes dissociation of Nrf2 from the ARE
sequence. Subsequently, Keap1 escorts Nrf2 out of the nucleus to the cytoplasmic
Cul3-dependent E3 ubiquitin ligase machinery for degradation. Thus, a low level
of Nrf2 is re-established, turning the Nrf2 signalling pathway off [Lau et al.,
2008].
Nrf2 in cancer prevention and promotion: dual roles of Nrf2
In their work Lau et al. summarizes half a century of reports on the concept of
chemoprevention through the use of dietary compounds or synthetic chemicals
able to decrease or related to decrease of the incidence of cancer. Moreover, as
29
many of the compounds possessing chemopreventive activities are
phytochemicals, many well studied chemopreventive compounds have been
identified as Nrf2 inducers. Examples of potent Nrf2 inducers from plants include
sulforaphane (cruciferous vegetables), curcumin (a widely used spice),
epigallocatechin-3-gallate (EGCG) (green tea), resveratrol (grapes), caffeic acid
phenethyl ester (conifer trees), wasabi (Japanese horseradish), cafestol and
kahweol (coffee), cinnamonyl-based compounds (cinnamon), zerumbone (ginger),
garlic organosulfur compounds (garlic), lycopene (tomato), carnosol (rosemany),
and avicins (Bentham plant) [Lau et al., 2008 and references therein]. Definitely it
has been reported that these compounds exert their chemopreventive activity by
inducing the Nrf2-dependent adaptive response, including phase II detoxifying
enzymes, antioxidants, and transporters that protect cells from carcinogenic
insults.
Nevertheless, during the last years literature on Nrf2 has revealed new data
supporting a “dark” side of Nrf2 since it seems that this transcription factor
protects not only normal cells from malignant transformation, but could also
promote the survival of cancer cells. The first evidence indicating the involvement
of Nrf2 in cancer promotion came from the finding that Nrf2 and GSTP1 were up-
regulated during development of hepatocellular carcinoma [Ikeda et al., 2004].
Many Keap1 mutations or loss of heterozygosity in the Keap1 locus have also
been identified in lung cancer cell lines or cancer tissues. In both cases the result
was inactivation of Keap1 or its reduced expression which consequently
upregulated Nrf2 protein level and transactivation of its downstream genes, thus
supporting a positive role of Nrf2 in tumorigenesis [Singh et al., 2006]. Another
study from Kim et al. indicates that Nrf2 may be responsible for chemoresistence
too. Indeed elevated expression of Nrf2 and its downstream genes, such as
HMOX-1, Trx, Prx and GCL, have been associated to acquired resistance to
tamoxifen in the breast cancer MCF-7 derived tamoxifen resistance cell line [Kim
et al., 2008]. Moreover knockdown of Nrf2 with Nrf2-siRNA reversed tamoxifen
resistance of this cell line. Investigating the molecular mechanism of acquired
resistance to tamoxifen, many Nrf2 downstream genes have been shown to
contribute to the observed Nrf2-dependent chemoresistance: those genes have the
ability to function as antioxidants and detoxifying enzymes. Finally in vitro
studies show that overexpression of Nrf2 can lead to the increased expression of
several intracellular redox-balancing proteins, phase II detoxifying enzymes, and
transporters, which can provide cancer cells with a growth advantage and cause
resistance to chemotherapy.
2.3 Events related to malignancy are redox regulated
Because oxidants electrophiles influence the redox status, they can cause either
cell proliferation or growth arrest and cell death [Valko et al., 2006]. According to
numerous authors there are two main interpretations of the physiological role of
30
ROS in several aspects of intracellular signalling: while high concentrations of
ROS cause cell death, the effects of ROS on cell proliferation occurred
exclusively at low or transient concentrations of electrophiles. In fact low
concentrations of superoxide radical and hydrogen peroxide stimulate
proliferation and enhanced survival in a wide variety of cell types. On the other
hand, excessive ROS production resulting in an overload of the thiol redox system
causes the progressive inactivation of the anti-oxidant thiols containing proteins
such that redox homeostasis becomes compromised. This represents and extreme
situation, but according to Ralph et. al [Ralph et al., 2010] for H2O2 to serve as a
signal by oxidative modifications to signalling proteins, by necessity it follows
that ROS levels must be raised above a certain threshold steady-state level
whereby the anti-oxidant cellular enzymes that otherwise counteract this build up
become inhibited. Such a view is known as the “floodgate hypothesis”.
Nevertheless redox signalling scenario is more complex as demonstrated by
accumulating evidence over the past years from both in vitro and in vivo studies
which indicated a role for ROS as a signalling mediator of angiogenesis and
metastasis [Ushio-Fukai 2008/2010]. ROS has been shown to mediate these
effects through induction of transcription factors and genes involved in
angiogenesis and metastasis, two interrelated processes that represent the final,
most devastating stage of malignancy. However, the role of ROS in modulating
tumour cell metastasis and angiogenesis has seemed paradoxical: high ROS levels
suppress tumour angiogenesis and metastasis by destroying cancer cells, whereas
sub-optimal concentrations assist cancer cells in metastasizing. Also a variety of
cytokines and growth factors that bind to receptors of different classes, such as
receptor tyrosine kinases (RTKs), have been reported to generate ROS in
nonphagocytic cells. The information is then transmitted via the activation of
mitogen-activated protein kinases (MAPKs) signalling pathways. ROS production
as a result of activated growth factor receptor signalling includes epidermal
growth factor (EGF) receptor, platelet-derived growth factor (PDGF) receptor,
vascular endothelial growth factor (VEGF) receptor, cytokine receptors (TNF-α
and IFN-γ), and interleukin receptors (IL-1β) [Valko et al., 2006 and references
therein]. It is generally accepted that ROS generated by these ligand/receptor-
initiated pathways can mediate important cellular functions such as proliferation
and programmed cell death. Moreover, abnormalities in growth factor receptor
functioning are closely associated with the development of many cancers.
It turns out that events related to malignancy are redox regulated in many ways:
from malignant transformation onset, to cancer cells survival/proliferation and
metastasis and even to cell death by apoptosis necrosis, or autophagy. Indeed
localization, timing, chemical identity, and intensity of electrophilic pulse will
determine different effects. Mechanisms underlying such regulation are still
almost unknown and we would like to summarize here the reached consensus:
while malignancy onset is probably favoured by severe oxidative unbalance
leading to spread damage to various cellular structures (DNA, lipids, proteins),
31
tumour cells survival, metastasising processes and acquisition of chemoresistence
are instead the result of a more finely tuned dynamic equilibrium between
coexisting pro-oxidant (electrophiles) and anti-oxidant (nucleophiles) stimuli.
This is why ROS seem to play a “dual role” for cancer, since they can prompt
survival as well as death signalling pathways in cancer cells.
2.3.1 Oxidation
DNA and lipids
Pro-oxidant stimuli (electrophiles, see § 2.2.1) can affect various target
biomolecules such as DNA, lipids or proteins. It has been estimated that one
human cell is exposed to approximately 1.5*105 oxidative hits a day from
hydroxyl radicals and other such reactive species. Permanent modification of
genetic material resulting from this “oxidative damage” represents the first step
involved in mutagenesis, carcinogenesis and ageing. Carcinogenesis is associated
with arrest or induction of transcription, induction of signal transduction
pathways, replication errors and genomic instability, all of which can be caused
by DNA damage. The hydroxyl radical is able to add to double bonds of DNA
bases at a second-order rate constant in the range of 3-10*109 M
-1 s
-1 and it
abstracts an H-atom from the methyl group of thymine and each of the five carbon
atoms of 2’ deoxyribose at a rate constant of approximately 2*109 M
-1 s
-1 [Valko
et al., 2006 and references therein]. An example of oxidative damage of DNA is
the formation of 8-hydroxyguanine (8-OH-G) the presence of which has first been
reported in urine by Shigenaga et al. [Shigenaga et al., 1989]. Tobacco smoking, a
carcinogenic source of ROS, increases the oxidative DNA damage rate by 35-
50%, as estimated from the urinary excretion of 8-OH-G, and the level of 8-OH-G
in leukocytes by 25-50% [Valko et al., 2006]. In addition to the extensive studies
devoted to the role of oxidative nuclear DNA damage in neoplasia, evidence
exists about the involvement of the mitochondrial oxidative DNA damage in the
carcinogenesis. The mitochondrial genome in human cells is small (16596 base
pairs (bp)) compared to the nuclear DNA although every mitochondrion contains
between 2 and 20 copies of mitochondrial DNA (mtDNA) and the copy number
of mitochondrial genomes per cell ranges from several hundreds to more than
10000 depending on the cell type (typically around 1000 mitochondria per cell).
Moreover different mtDNA content has been reported in cancer cells and the
relationship of mtDNA copy number to oxidative stress and changes in ROS
production taking place during the onset of malignancy has been outlined by
Ralph and co-workers [Ralph et al., 2010]. Indeed it was proposed that mtDNA
copy number was increased by a feedback mechanism that compensated for any
defects in those mitochondria with mutated mtDNA and defective respiratory
systems. Moreover the age-associated increased production of O2- and H2O2 in
cells was one of the factors involved in this regulation process. In conclusion, as
32
observed with oxidative genomic DNA modification, oxidative damage and the
induction of mutation in mtDNA may participate at multiple stages of the process
of carcinogenesis, involving mitochondria-derived ROS and induction of
mutations in mitochondrial genes.
It is know that metal-induced generation of oxygen radicals results in the attack of
not only DNA in the cell nucleus, but also other cellular components involving
polyunsaturated fatty acid residues of phospholipids which are extremely sensitive
to oxidation [Valko et al., 2006 and references therein]. Several experimental
models of iron overload in vivo, confirmed increased polyunsaturated fatty acids
(PUFA) oxidation of hepatic mitochondria, as well as lysosomal fragility. The
deleterious process of the peroxidation of lipids is also very important in
arteriosclerosis, cancer and inflammation. The overall process of lipid
peroxidation consists of three stages; initiation, propagation and termination. It’s
full discussion is outside the topics of this thesis and here it is sufficient to say that
among final products of the peroxidation process there are aldehydes among
which the most relevant is 4-hydroxy-2-nonenal (HNE). Malondialdehyde (MDA)
is mutagenic in bacterial and mammalian cells and carcinogenic in rats.
Hydroxynonenal is weakly mutagenic but appears to be the major toxic product of
lipid peroxidation. In addition, HNE has powerful effects on signal transduction
pathways, which in turn have a major effect on the phenotypic characteristics of
cells.
Proteins
Mechanisms involved in the oxidation of proteins by ROS were elucidated by
studies in which amino acids, simple peptides and proteins were exposed to
ionising radiations under conditions where hydroxyl radicals or a mixture of
hydroxyl/superoxide radicals are formed. The results of these studies
demonstrated that reaction with hydroxyl radicals lead to abstraction of a
hydrogen atom from the protein polypeptide backbone to form a carbon-centred
radical, which under aerobic conditions reacts readily with dioxygen to form
peroxyl radicals. The peroxyl radicals are then converted to the alkyl peroxides by
reactions with the protonated form of superoxide HO2•. In the absence of
radiation, proteins are resistant to damage by H2O2 and by other simple oxidants
unless transition metals are present. Indeed it is believed that the iron(II) binds
both to high and low-affinity metal-binding sites on the protein. The Fe(II)-protein
complex reacts with H2O2 via the Fenton reaction to yield an active oxygen
species at the site. While it has been proposed by many authors that the hydroxyl
radical represents the major species responsible for the oxidation of proteins, clear
experimental evidence is still missing.
Besides radicals initiated reactions and transition metals “assisted” oxidative
damage of proteins we have seen above that there are many proteins bearing so-
called redox switches: such redox sensible cysteine-residue thiols should be

33
considered the preferred target for reversible oxidative modifications underlying
redox signalling. The ability to “sense” even humble variations in electrophilic
tone and to readily react with mild-oxidizing non-specific molecules like H2O2
made such proteins ideal players as signal sensors, transducers and effectors as
well. Indeed low concentrations of hydrogen peroxide can regulate cytosolic
calcium concentration, protein phosphorylation and transcription factors
activation leading to different cell fates (survival, proliferation, death).
Non receptor tyrosine kinases (PTKs): Src
Several non-receptor protein kinases belonging to the Src family (src kinases) and
Janus kinase (JAK) are also activated by ROS [Esposito et al., 2003]. For example
H2O2 and O2-• induce tyrosine phosphorylation of several PTKs in different cell
types, including fibroblasts, T and B lymphocytes, macrophages and myeloid
cells. Activated Src binds to cell membranes by myristilation and initiates MAPK,
NF-κB and phosphoinositide 3-kinase (PI3K) signalling pathways [Valko et al.,
2006]. Moreover is has been demonstrated [Zhang et al., 2012] that Src could be
activated by cigarette smokes extracts in human non-small cell lung carcinoma
cell line (H358) by redox modification. Activated Src (increased Tyr418
phosphorylation) initiates in turn the epithelial-mesenchymal transition, a well
characterized process implicated in the pathogenesis of lung fibrosis and cancer
matastasis.
Rat Sarcoma genes product (Ras) and the Raf/MEK/ERK pathway
Ras gene products are membrane-bound G proteins whose main function is to
regulate cell growth and oppose apoptotic effects. Ras is activated by ROS as well
as by UV radiation (which is also know to start ROS production through radical
formation), by metals and mitogenic stimuli [Valko et al., 2006]. Inactive Ras
could be induced to exchange GDP for GTP undergoing a conformational change
and becoming active. The GTP bound active Ras can then recruit Raf to cell
membrane. Activated Raf could in turn regulate Mitogen-activated protein
kinase/ERK kinase (MEK1) activation via phosphorylation of its S residue on
catalytic domain. The main target of MEK is then extracellular-signal-regulated
kinases (ERK) the activity of which is positively regulated by MEK mediated
phosphorylation. Activated ERK could directly phosphorylate many transcription
factors including c-Jun and c-Myc. Moreover, through an indirect mechanism,
ERK can lead to activation of the nuclear factor immunoglobulin κ chain
anhancer-B cell (Nf-κB) transcription factor. From a wider point of view the
Ras/Raf/MEK/ERK pathway is responsible for coupling signals from cell surface
to transcription factors and can definitely lead to an anti-apoptotic response via
phosphorylation of the anti-apoptotic protein McL-1 and the pro-apoptotic protein
Bim which becomes ubiquitinated and targeted to proteasome. However
34
phosphorylation of Bim by another MAPK, c-jun-NH2-terminal kinase (JNK) can
instead result in apoptosis due to stimulation of the pro-apoptotic protein Bax:Bax
interaction. Thus ROS can influence Ras/Raf/MEK/ERK pathway in many ways,
one we have seen is the activation of Ras, but ROS could as well activate
receptors like EGFR and PDGF receptor by a ligand independent mechanism
[McCubrey et al., 2009]. On the same way ROS seems to activate the JNK
pathway through the apoptosis signal related kinase 1 (ASK1): reduced
thioredoxin binds to the N-terminal of ASK1 inhibiting its activity, upon oxidative
stress thioredoxin becomes oxidized and disassociates from ASK1 which in turn
oligomerize, auto-phosphorylate, and become activated [Saitoh et al., 1998].
PI3K/AKT pathway and protein tyrosine phosphatases: PTP1B and PTEN
The family of phosphoinositide 3'-kinases (PI3K) consists of several structurally
related enzymes catalyzing the phosphorylation of inositol phospholipids in the
3’-position, thus generating phosphatidylinositol-3’-phosphate (PIP),
phosphatidylinositol-3’,4’-bisphosphate (PIP2) and phosphatidylinositol-3’,4’,5’-
trisphosphate (PIP3) [Foster et al., 2003]. The classical (class Ia) PI3K is made of
heterodimers consisting of a catalytical (p110) and a regulatory (p85 or p55)
subunit, that are typically activated via receptor tyrosine kinases (RTK) after
stimulation of cells with growth factors. Generation of 3’-phospoinositides results
in recruitment of the 3’-phosphoinositide-dependent kinases (PDK1 and the
putative PDK2) to the cell membrane and consecutive activation of the serine-
/threonine kinase Akt(protein kinase B, PKB) by phosphorylation at Thr308 and
Ser473. Akt can be regarded as a master switch of the cell integrating incoming
signals on cell growth, apoptosis and metabolism. For example, activation of Akt
results in a direct phosphorylation and consecutive inhibition of the pro-apoptotic
factor Bad [Franke et al., 1997]. The anti-apoptotic effects of Akt may also be
mediated via activation of the transcription factor NF-κB by an interaction of Akt
with IκB kinase (IKK). Activation of this kinase by Akt stimulates degradation of
IκBα, a potent repressor of NF-κB [Romashkova et al., 1999]. Moreover PI3K-
dependent inactivation of FoxO1, a member of the FoxO-family of Akt directly
targeted transcription factors, results in cell cycle progression. An important
antagonist of PI3K is phosphatase and tensin homolog deleted on chromosome 10
(PTEN), a lipid phosphatase that cleaves off the 3’-phosphate from PIP, PIP2 and
PIP3, thereby inactivating the lipid products of PI3K [Barthel et al., 2007]. The
PI3K/Akt cascade is modulated also by the PTP-ases like phosphatasePTP1B,
which is able to reverse receptor tyrosine kinases tyr-phosphorylation thereby
avoiding PI3K activation. From a wider point of view, PI3K/Akt pathway
definitely leads to cell proliferation and prevention of apoptosis and is regulated
positively by Ras (see above) and negatively by PTEN and PTP1B [Chang et al.,
2003; Gao et al., 2009].

35
Protein tyrosine phosphatases are probably the best-characterised direct target of
ROS. It has been shown that inhibition of PTPs by ROS may directly trigger
PTKs and we have seen that PTPs and PTKs act in conjunction to control cell
cycle and signal transduction by regulating levels of protein tyrosine
phosphorylation in response to cellular signals. The effects of ROS occur through
targeting the cysteine residues of the active sites of tyrosine phosphatases as
demonstrated by Barrett [Barrett et al., 1999]. Protein tyrosine phosphatase 1B
(PTP1B) Cys215 has indeed been demonstrated to form both sulfenic acid
derivative and mixed disulfide with glutathione. Active site Cys215 residue
glutathionilation (by treatment with diamide and reduced glutathione or with only
glutathione disulfide) inactivates PTP1B while dithiothreitol or glutaredoxin (a
glutathione-specific dethiolase enzyme thioltransferase) are able to recover
phosphatase activity. It is then clear how ROS could interconnect at various level
both Raf/MEK/ERK pathway and PI3K/AKT pathway leading to different cell
fate like proliferation or cell death.
2.3.2 Reduction
As seen above (see § 2.3) the role of oxidation/reduction rate on intracellular
signalling is performed by both unspecific signals (e.g. – electrophiles) and
specific signal transducers/effectors bearing redox switches (e.g. – phosphatases,
kinases, transcription factors). Thus the concomitant action of cellular scavenging
systems (e.g. – nucleophile tone: peroxidases, glutathione, reductase) and
electrophile tone (e.g. – mitochondrial electron transport chain (ETC) and NOX
superoxide production) defines an equilibrium in which both pro-oxidant and anti-
oxidant signals coexist. Indeed in addition to their role in promoting cellular
proliferation or inhibiting apoptosis (see above Raf/MEK/ERK and PI3K/AKT
pathways) ROS have many functions also in tumour cell death and negative
transcription factors regulation [Gupta et al., 2012]. One of the chief
characteristics of cancer cells is their inherent capacity to survive and it has been
demonstrated that ROS have effects on apoptosis [Ozben, 2007]. Apoptosis is a
tightly controlled form of cell death and can be initiated by death receptors
(extrinsic pathway) or through mitochondria (intrinsic pathways). ROS control
both extrinsic and intrinsic pathway. In the extrinsic pathway ROS are generated
by Fas ligand as an upstream event for Fas activation. In turn, ROS are required
for Fas phosphorylation, which is a signal for subsequent recruitment of Fas-
associated protein with death domain and caspase 8 and for apoptosis induction
[Denning et al., 1992]. In contrast the intrinsic pathway of apoptosis is
characterized by the opening of the permeability transition pore complex on the
mitochondrial membrane, which results in cytochrome c release, apoptosome
formation, and caspase activation. ROS function to open the pore by both
activating pore-destabilizing proteins (Bcl-2 associated X protein, Bcl-2
homologous antagonist/killer) and inhibiting pore-stabilizing proteins (Bcl-2 and

36
Bcl-xL) [Martindale et al., 2002]. In his review on the “dual role of ROS for
cancer” Gupta also quote many sources of examples of apoptosis induction by
exogenous administration of H2O2 in lymphoma cells, bladder cancer cells,
hepatoma cells, leukemia cells, osteosarcoma, breast and lung cancer cells [Gupta
et al., 2012 and references therein]. Numerous agents have been shown to induce
ROS and apoptosis in various cancer types. The most common signalling
molecules modulated by ROS in these cell models are kinases, pro-inflammatory
transcription factors such as NF-κB, caspases, cell survival proteins, pro-apoptotic
proteins, and phosphatases like the already mentioned PTEN. Many authors still
share the floodgate-like hypothesis (see above) by virtue of which the
survival/proliferation/death fate of the cell is dependent mainly on the intensity
and duration of pro-oxidant stimulus: here we would like to sustain the possibility
of a dynamic equilibrium in the context of which specific targets could be kept
oxidized while maintaining an overall nucleophile tone thus conferring to the cell
both advantages of pro-survival signals and death-escape signals. As an example,
the transcription factor activator protein-1 (AP-1) is induced by treatment of cells
with H2O2, but its activity is directly regulated by redox in the opposite manner.
Indeed, the activity of AP-1 has been revealed to be regulated through the
conserved cysteine residues that are located in the DNA-binding domain of each
of its two dimer subunits (oncongene products Jun/Fos or Jun/Jun): modification
of these residues by a sulphydryl modifying agent, such as N-ethylmaleimide
(NEM) or diamide, reduce its activity, whereas treatment with reductants, such as
dithiothreitol (DTT), enhance DNA binding. Similarly the DNA-binding activity
of NF-κB, which induces immune response, stress response, cell growth and cell
survival gene expression, is inactivated by treatment with NEM and diamide
while DTT and β-mercaptoethanol enhance its DNA binding. Finally it has been
discovered that also the tumour suppressor gene p53 receives more complicated
redox regulation through many cysteine residues: indeed also in this case
treatment with diamide or NEM disrupts wild-type p53 conformation and inhibits
its DNA-binding activity [Kamata et al., 1999 and references therein].
ROS mediated activation of Src has also been associated to activation of EGFR
via ligand-independent phosphorylation. Redox-dependent activation of EGFR in
turn activates both extracellular signal-regulated protein kinase and Akt
downstream signalling pathwas, culminating in degradation of the pro-apoptotic
protein Bim. These results highlighted a fundamental role of ROS in ensuring
protection from the apoptotic process induced by the loss of integrin-mediated
cell-extra cellular matrix (ECM) contact. Proper attachment to the ECM is
essential for cell survival and such ECM-contact induced apoptotic process has
been called anoikis [Giannoni et al., 2008].
37
2.3.3 Localization
GSH/GSSG redox potential in cellular compartments
We have already seen (§ 2.2.1) two main intracellular sources of pro-oxidant
species: mitochondrial ETC and membrane NOX. On the other hand the
compartimentalization of peroxide-metabolizing systems within peroxisomes has
long been recognized to provide a means to utilize hydrogen peroxide as a
metabolic reagent while at the same time protect redox-sensitive cell components
in other cell compartments from oxidative damage. Moreover unique redox
characteristics have evolved with each of the major compartments in mammalian
cells. Mitochondria are the most redox-active compartment of mammalian cells,
accounting for more than 90% of electron transfer to O2 as the terminal electron
acceptor and ROS such as O2-• and its dismutation product H2O2 are derived from
several sources in mitochondria. Indeed complexes I and III within the ETC are
the main sites of electron transfer to O2 to produce O2-•. In addition to the electron
transport chain, mitochondrial ROS may also be generated by pyruvate, α-
ketoglutarate dehydrogenase, glycerol-3-phosphate dehydrogenase, and
monoamine oxidase. The redox potential of mitochondrial GSH/GSSG, is about -
280 mV. This value is more reduced than cytoplasmic values (-200 mV)
indicating that the mitochondrial GSH/GSSG redox status is more reduced than
total cellular GSH/GSSH [Go et al., 2008 and references therein]. The
GSH/GSSG redox potential in mitochondria is in turn dependent upon
concentrations of GSH and GSSG. Thus because mitochondrial GSH is not
synthesized in mitochondria, it must rely on synthesis in the cytoplasm and
subsequent transport into mitochondria. Finally, in apoptosis, oxidation of
mitochondrial GSH/GSSG stimulates cytochrome c release, and GSH depletion
resulted in increased ROS which was generated from complex III, suggesting a
role for GSH in controlling mitochondrial ROS generation. We have seen so far
that ROS serve as messengers in cell signalling but also cause oxidative damage
to macromolecules, including DNA damage. Sequestration of DNA within nuclei
protects the genome from reactive chemicals generated in other parts of the cells;
however H2O2 and organic hydroperoxides, can diffuse across membranes, thus
posing a potential damage from normal signalling events. Nevertheless, similar to
other organelles, nuclei also contain two major antioxidant systems dependent
upon GSH and Trx1. Data reported by Go et al. [Go et al., 2008] show that the
GSH/GSSG redox potential is likely to be more reduced in nuclei than in
cytoplasm and that protein S-glutathionylation is independently controlled in the
cytoplasmic and nuclear compartment. As for the redox status of cytoplasm it has
been measured using cytosolic Trx1 and GSH/GSSG. The total cellular
GSH/GSSG couple largely represents the cytoplasmic GSH/GSSG pool, even if
some misleading contribution from more negative organelles has been already
reported. Nevertheless the standard redox potential Eθred for the active site
38
dithiol/disulfide couple of Trx1 was estimated to be -230 mV [Watson et al.,
2003]. Using this value and measuring the percentage reduction with a redox
western blot [Watson et al., 2003], cellular Trx1 has a Ered of -280 mV. Moreover,
in a study on the increase of ROS which accompanies EGF binding to its receptor,
it has been shown [Halvey et al., 2005] that nuclear Trx1, mitochondrial Trx2, and
cellular GSH did not show any significant oxidation following EGF stimulation
while cytoplasmic Trx1 was oxidized. These findings demonstrated that
physiologic stimulation at the plasma membrane can cause the oxidation of
specific redox couples in the cytoplasm without affecting other subcellular
compartments. Thus as far we could generalize mitochondria as a compartment
utilizing oxidations for energy conversion, and the endoplasmic reticulum (ER) in
different cell types is specialized with different oxidative functions. In addition to
these more specialized oxidative functions, the ER has a more general oxidative
function to introduce structural disulfides in protein folding for membranal and
exported proteins: central redox proteins for these functions include the
endoplasmic reticulum oxidase-1 (Ero-1) and protein disulfideisomerase (PDI).
The GSH/GSSG ratio in the ER varies between 3/1 and 1/1 and is considerably
more oxidized tha cytoplasmic GSH/GSSG ratio (30/1 to 100/1). Based upon
these values the ER redox potential has been estimated to be -189 mV, which is
relatively oxidizing compared to other cellular compartments. Indeed a significant
amount of GSH in the ER was detected as protein mixed disulfides, and regulates
the activity of redox-active thiol containing proteins [Cuozzo et al., 1999].
Redox regulation of cell migration and adhesion
In a recent work Hurd and co-workers pointed out another interesting aspect of
redox driven cell-signalling: the regulation of migrating cell movement and non-
migrating cell matrix and cell-cell interactions. Movement and migration are
crucial during organism developmental phases but they also play important roles
in pathological processes such as cancer metastatization. Indeed, developmental
migratory programs can be inappropriately reactivated in metastatic cancer. In
both cases gradients of attractive and repulsive cues are used to direct cell
migration. Those extracellular signals are first received by receptors on the
surface of migrating cells, and intracellular transduction of such signal direct
migration by changing cellular cytoskeletal and adhesive properties for example.
It has been reported that H2O2 could be used to relay signals from activated cell
surface receptors to direct changes necessary for cell movement thus
“intrinsically” promoting movement [Hurd et al., 2012].Upon binding of growth
factors and chemoattractants to cell surface receptors, NOXs produce superoxide
or hydrogen peroxide in the extracellular or luminal space, and for ROS to
transduce signals they must first be internalized into the cytoplasm of the cell.
Once inside the cell, NOX generated hydrogen peroxide can act as a redox signal
by reversibly modifying the activity of specific proteins, as we have seen above
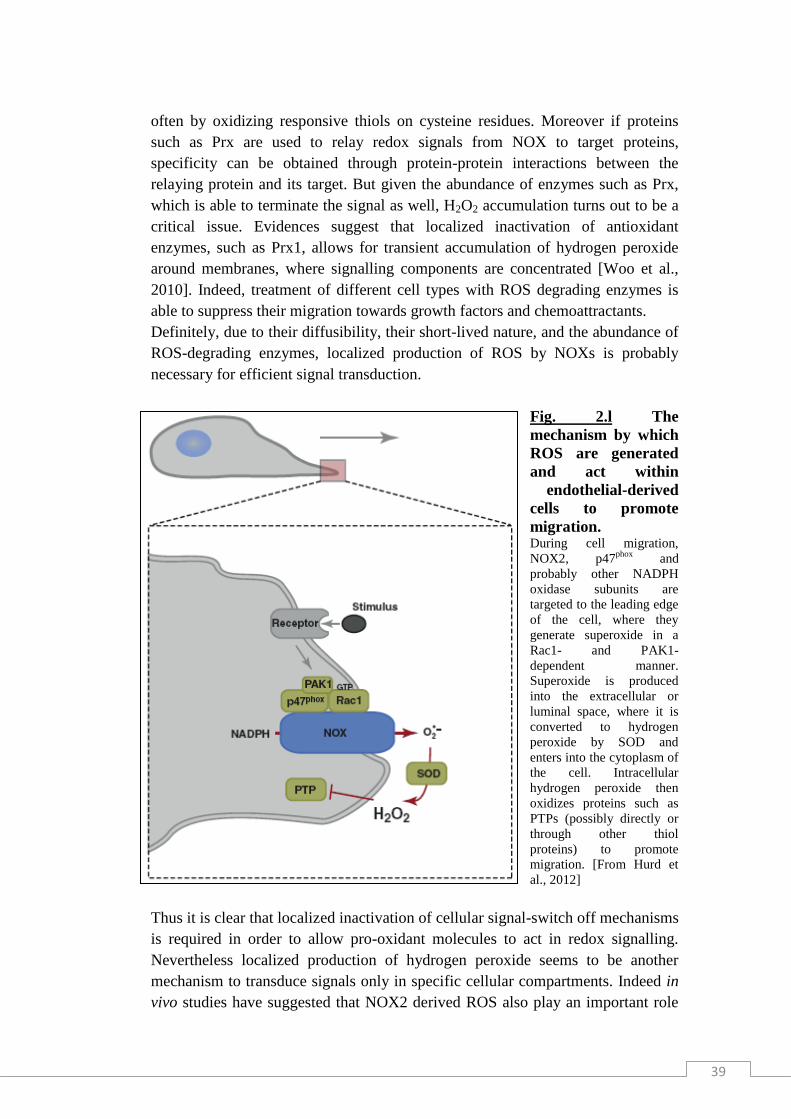
39
often by oxidizing responsive thiols on cysteine residues. Moreover if proteins
such as Prx are used to relay redox signals from NOX to target proteins,
specificity can be obtained through protein-protein interactions between the
relaying protein and its target. But given the abundance of enzymes such as Prx,
which is able to terminate the signal as well, H2O2 accumulation turns out to be a
critical issue. Evidences suggest that localized inactivation of antioxidant
enzymes, such as Prx1, allows for transient accumulation of hydrogen peroxide
around membranes, where signalling components are concentrated [Woo et al.,
2010]. Indeed, treatment of different cell types with ROS degrading enzymes is
able to suppress their migration towards growth factors and chemoattractants.
Definitely, due to their diffusibility, their short-lived nature, and the abundance of
ROS-degrading enzymes, localized production of ROS by NOXs is probably
necessary for efficient signal transduction.
Fig. 2.l The
mechanism by which
ROS are generated
and act within
endothelial-derived
cells to promote
migration. During cell migration,
NOX2, p47phox
and
probably other NADPH
oxidase subunits are
targeted to the leading edge
of the cell, where they
generate superoxide in a
Rac1- and PAK1-
dependent manner.
Superoxide is produced
into the extracellular or
luminal space, where it is
converted to hydrogen
peroxide by SOD and
enters into the cytoplasm of
the cell. Intracellular
hydrogen peroxide then
oxidizes proteins such as
PTPs (possibly directly or
through other thiol
proteins) to promote
migration. [From Hurd et
al., 2012]
Thus it is clear that localized inactivation of cellular signal-switch off mechanisms
is required in order to allow pro-oxidant molecules to act in redox signalling.
Nevertheless localized production of hydrogen peroxide seems to be another
mechanism to transduce signals only in specific cellular compartments. Indeed in
vivo studies have suggested that NOX2 derived ROS also play an important role

40
in cell migration during the formation of new blood vessels after tissue ischemia
[Hurd et al., 2012] and in vitro studies show that production of ROS in migrating
endothelial-derived cells is probably spatially and functionally coordinated at the
leading edge to promote directional cell migration (fig. 2.l). On the other hand,
PTPs negatively regulate cell migration by dephosphorylating and inactivating
proteins that promote migration. We have seen that PTPs have an active-site
cysteine with suitable characteristics to act as a redox switch (H2O2 oxidation-
dependent reversible enzyme inhibition), but it is also known that PTPs reaction
rate with hydrogen peroxide makes it unlikely that these enzymes can compete for
H2O2 in vivo. So both co-localization of PTPs with NOXs and indirect PTPs
oxidation via another thiol protein such as Prx, might facilitate PTP oxidative
inactivation, thus favouring migration.
Moreover, in addition to their role in regulating migration in migrating-cells, ROS
seem able also to mediate changes in non-migrating cells. This is the case of those
cells which permits motile cells to bind and penetrate tissues, like vascular
mammalian endothelial cells and leukocyte shuttling between the bloodstream and
interstitial tissues. ROS were first suggested to play a role in this process when it
was noted that treatment of endothelial cell cultures with moderate to high
(100μM to 5mM) concentrations of hydrogen peroxide induced cell surface
expression of the adhesion molecule 1 (ICAM-1) and P-selectin and increased the
binding of polymorphonuclear leukocytes (PMNs) to endothelial cells [Patel et al.,
1991]. It was also demonstrated that various cytokines (TNF-α, TNF.related
activation-induced cytokine TRANCE and visfatin) increase cell surface
expression of adhesion molecules through a transient increase in ROS levels in
endothelial cells. Furthermore, inhibition of NOX attenuated this increase in ROS
levels, thus sustaining the hypothesis of NOX-mediated redox signalling
transduction. The mechanism of adhesion molecule promotion by ROS is not yet
clear, but some authors reported in Hurd [Hurd et al., 2012] proposed that this
could be achieved through activation of the transcription factor NF-κB. Finally, in
addition to influencing cell-cell adhesion through adherens junctions, Hurd reports
a role for ROS also in cell-matrix interactions. Indeed ROS seem to affect cell-cell
and cell-matrix adhesion by altering the cell surface expression of integrins and
cell adhesion molecules such as vascular cell adhesion molecule 1 (VCAM-1),
and decreasing adherens junction components.
2.4 Methodological approach: traditional and innovative methods
for disulfide bonds assessment
Referring to the steps traditionally involved in disulfide bonds determination they
are: (1) fragmentation of the non-reduced protein of interest into disulfide-linked
peptides with cleavages between all half-cystine residues, if possible, and under
conditions that avoid rearrangement (interchange) of disulfide bonds; (2)
separation of disulfide-linked peptides from one another; (3)

41
location/identification of disulfide-linked peptides in various separated fractions;
(4) fragmentation of the disulfide linked peptides at the disulfide bond; and (5)
isolation and characterization of the half-cystinyl products of the disulfide
cleavage reaction. These early studies also provided insights into the experimental
conditions required for disulfide bond determination. Indeed, it was observed that
disulfide bond rearrangement could be promoted by strong acids, by the presence
of thiols at neutral pH, and by thiols produced by hydrolytic cleavage of disulfide
bonds at neutral and alkaline pH (Disulfide interchange was in fact noted under
the conditions of enzymatic cleavage at slightly alkaline pH) [Gorman et al. 2002
and references therein]. Consequently, chemical and enzymatic protein cleavage
methods like dilute acids and/or cyanogen bromide or pepsin are preferred.
Moreover also downstream analytical technologies that require disulfide-linked
fragments to be isolated for defining linkages (e.g. - amino acid analysis or
Edman degradation) are highly dependent on purification strategies. As reviewed
by Gorman et al. cation-exchange HPLC has been used to isolate disulfide-linked
peptides due to the greater retention on cation-exchange media than single-chain
peptides due to relative differences in cationic properties of these classes of
peptides at acidic pH. Another elegant method for identification of disulfide-
linked peptides and isolation of the component half-cystinyl peptides for analysis
involved diagonal peptide mapping by paper electrophoresis. This technique
involved: (1) cleavage of the non-reduced protein with pepsin; (2) separation of
the disulfide-linked peptides by one dimension of paper electrophoresis at acid
pH; (3) exposure of the original electrophoretogram to performic acid vapor; and
(4) a second dimension of separation by paper electrophoresis at right angles to
the initial direction of separation. Performic acid cleaves disulfide bonds, and
converts the half-cystine residues into highly negatively charged cysteic acids (ie
– sulphonic acid RSO3H). Thus, peptides not affected by performic acid migrated
in a diagonal fashion after the combined electrophoretic steps, and peptides with
disulfides prior to performic acid oxidation migrated off the diagonal. Peptides
that were paired by inter-chain disulfide linkages prior to oxidative cleavage
migrated with a vertical orientation to each other.All approaches mentioned so far
are quite complex and time consuming anyway and today they are progressively
substituted by modern mass spectrometry (MS) based technology. The potential
for MS to facilitate the determination of disulfide bond linkages in proteins was
realized with the advent of reliable methods for ionization of peptides and proteins
(fast atom bombardment FAB, laser desorption ionization LDI, electrospray
ionization ESI) together with the development of instruments suitable for analysis
of relatively small quantities of proteins and peptides with good resolution ad
accuracy in a reasonable mass range. With respect to traditional methods, in case
of MS approach to disulfide bonds identification separation and analysis are done
simultaneously in the mass spectrometer. When a protein potentially containing
one (or more) disulfide bonds is in its oxidized form, proteolysis produces either
single fragments containing the disulfide as intra-chain linkage or multiple

42
fragments still linked to each other by the disulfide bond. In both cases a new
peptide with a mass 2 a.m.u. (atomic mass units) lower than the mass of either the
reduces peptide or the sum of two peptides suggests an identification that could be
validated by MS/MS (tandem mass spectrometry) sequencing [Mauri et al. 2010].
Of course the issue of disulfide reshuffling during sample preparation, i.e.
especially during proteolytic digestion is still pressing and this is really true if we
consider trypsin as the most specific and standardized endoprotease used in
proteomics, both because of the reproducibility of its digestion pattern (arginine
and lysine residues are commonly always present in a reasonable amount in
almost any protein) and because of the advantage got from ionization of peptides
containing basic residues at their carboxyl-terminal ends. Indeed trypsin works
best at alkaline pH, where dissociated cys-thiols (thiolates) could account for
disulfide reshuffling by means of a nucleophilic attack of thiolate on disulfide.
2.4.1 Disulfide proteome of complex samples
Thus, given interest in the identification of proteins with redox-active cysteines, in
the past decade proteomic approaches that aimed at large-scale identification of
proteins with modified cysteines have provided tools for unraveling new redox-
regulated processes. Such studies have often been pointed out as searches for the
“redoxome” or more restrictively “disulfide proteome”. The term disulfide
proteome might be used in the strict sense as a set of proteins containing disulfide
bonds. However, it is often understood implicitly that the disulfide subproteome
of interest consists of those proteins containing disulfides, which are susceptible
to reduction by oxido-reductases (so not the structural ones). Otherwise disulfide
proteomes have also been widely defined as sets of proteins that contain cysteines,
which exhibit any kind of change in their redox state or “reactive cysteine
proteome”.The reactive nature of cysteine thiols is an experimental challenge
when determining the oxidation status of cysteines in proteins. Indeed in samples
from tissues or cell cultures, post-lysis thiol-disulfide exchange between proteins
may lead to misinterpretation of data and, if molecular oxygen is present in the
buffers together with transition metals, oxidation of thiols may also occur during
isolation. Hence, one of the critical steps when working in redox biochemistry is
to trap the thiol-disulfide status in the sample. This is usually achieved by either
acidification followed by alkylation or by direct alkylation of free thiols both
during cell lysis and immediately after. Generally speaking, different approaches
share the common principle of “differential thiols probing”, namely after the first
trapping with a first labeling reagent, oxidized thiols (e.g. disulfides not reacted
with the probe) are subsequently reduced and then blocked by a second labeling
reagent. Of course the two probes should be different and somehow
distinguishable from each other: some often used compounds are N-
ethylmaleimide (NEM), iodoacetamide (IAM), iodoacetic acid (IA) possibly
joined to reagents allowing for fluorescence, radioactivity, or differential mass

43
tags detection (fluorophores or isotopes). On the other hand di-thiothreitol (DTT),
β-Mercaptoethanol or Tris-Carboxy-ethyl-phosphine (TCEP) are often used as
reducing agents. Probes with some specificity for Cys-SOH exist too, like
dimedone or even bi-functional probes potentially able to react with both Cys
involved in a disulfide, like dibromomaleimides. Probes could also be divided
summarily into reversible tags or irreversible tags and could even be joined to
functional groups like biotin molecule allowing for affinity enrichment or fishing
of protein thiols of interest. Other known techniques aimed at the enrichment in
proteins containing reactive cysteine thiols are the activated thiols sepharose
(ATS) or Trx affinity chromatography. As for detection methods, the two main
fields we would like to consider here are the gel based non-reducing/reducing
diagonal electrophoresis and 2D-redox-DIGE (two dimensional redox differential
gel electrophoresis) and the mass spectrometry (MS)-based detection of proteins
with reactive disulfides. The latter approach is greatly affected by difficulties in
analyzing disulfide peptides by tandem mass spectrometry (MS/MS) especially
when complex samples are to be analyzed. Strong development of software tools
might then facilitate the interpretation of MS/MS spectra of disulfide linked
peptides. On the other hand, if we consider MS based method in the more
comprehensive context of differential labeling approach, it is possible to outline
labeling methodologies like cleavable isotope coded affinity tagging (cICAT) in
its forward and reverse approach and also the so called oxidative ICAT (oxICAT).

44
3. MATHERIALS AND METHODS
3.1 Cell cultures
Ras-transformed MCF10A-T1k cells (hereafter named M2) - an isogenic
derivative of the human mammary MCF10A cell line – were kindly provided as a
model of tumor progression from Prof. Stefano Piccolo’s laboratory. Precisely M2
cells overexpressing a constitutive active point mutant of the Hippo transducer
TAZ, TAZ(S89A) were provided as “case sample” (hereafter M2T) while M2
cells were used as “control sample” in this study. Thorough experimental
evidence already attested a role for TAZ in endowing M2 cells with CSCs like
properties and particularly demonstrated TAZ relationship with EMT (Piccolo et.
al., 2011). Both M2 and M2T cells were incubated at 37 °C in moisture added air-
CO2 (95 – 5 %) blend into DMEM/F12 medium (Gibco) freshly supplemented
with: 5 % heat inactivated horse serum (Gibco), 2 mM glutamine (Gibco), 10
ug/mL Insulin (I9278 SIGMA), 20 nGr/mL rH-EGF (AF-100-15, Peprotech), 8.5
nGr/mL Cholera toxin (C8052, SIGMA), 500 nGr/mL hydrocortisone (H0369,
SIGMA), 100 U/mL penicillin and 100 ug/mL stremptomycin. Cells were
cultured on 75 cm2 flasks and spread at 1:4 to 1:6 ratio when reaching sub-
confluence.
Two days before each experiment cells were seeded at a density of 30 – 35,000
cells/cm2 into 15 mL of complete culture medium without antibiotics. One day
before each experiment medium was freshly renewed and the day of each
experiment cells were harvested by trypsinization and counted. On average 7 – 8 *
106 cells/flask were gathered with > 98 % vitality at trypan blue assay (T8154,
SIGMA). Culture medium was further maintained at 37 °C for 3 – 5 more days to
assess absence of contaminations.
3.2 Sub-cellular fraction enrichment
For each experiment about 15*106 cells for both M2 and M2T cell lines were
disrupted on ice by Dounce homogenization in 1 ml of 0.1 M PBS pH 7.4, 0.25M
sucrose, 1 mM EDTA and protease inhibitor cocktail (0.1 mg/mL
Phenylmethylsulfonyl fluoride PMSF, 0.7 mg/mL pepsatin, 0.5 mg/mL
leupeptin). Homogenates were centrifuged 10’ at 1000*gat 4°C in order to
separate particulate fraction containing nuclei and cell debris (pellet I). Isolated
supernatant was then further centrifuged 60’ at 105,000*g at 4°Cto separate
cytosol from other cellular organelles (pellet II). Supernatant from this latter
centrifugation step has been provided freshly for each experiment.

45
3.2.1 Protein assay
Protein content was measured according to Lowry as modified by Bensadoun et
al., (Bensadoun et al., 1976) taking advantage of previous TCA precipitation.
Each sample to be measured was first diluted to 3 mL final volume with water. A
minimal volume of diluted DOC detergent was then added to a final concentration
of 0.02% (w/v) followed by 1 mL of diluted TCA to a final concentration of
6.25%. Sample was left to incubate 10’ at ambient temperature before spinning it
down at 3800*g 30’ at 4°C. Supernatant containing soluble contaminants was then
discarded carefully. A solution of Na2CO3 2% (w/v), NaOH 0.1 N and a solution
of CuSO4 0.5% (w/v), KNaTartrate 1% (w/v) were mixed together to a ratio of
50:1 prior to use and each precipitated sample pellet was dissolved into 1 mL of
the resulting solution and incubated for 30’ at ambient temperature in the dark.
After incubation 0.1 mL of freshly 1:1 water diluted Folin’s reagent (SIGMA)
was added to each sample and left to incubate for another 30’ at ambient
temperature in the dark. At the end of incubation each sample absorbance was
recorded at 750 nM with a Multiskan microplate reader (ThermScientific).
Sample concentrationwas then calculated with reference to a standard curve
ranging from 3 to 30 ug of BSA prepared in the same way of protein samples to
be measured.
3.2.2 DTNB assay
DTNB 10 mM solution was prepared freshly into TrisHCl 0.1 M, EDTA 1 mM
pH 8.3 and diluted to DTNB 140 M into TrisHCl 50 mM, NaCl 150 mM pH 7.5.
Up to 200 L of sample volume or sample buffer as blank were added to each 1
mL aliquot of diluted DTNB solution. This aromatic disulfide reacts with aliphatic
thiol groups to form a mixed disulfide of the protein and one mole of 2-nitro-5-
thiobenzoate per mole of protein sulfhydryl group. DTNB has little if any
absorbance, but when it reacts with thiol groups under mild alkaline conditions,
the 2-nitro-5-thiobenzoate anion gives an intense yellow color at 412 nm. Whole
soluble reduced thiols were read almost immediately, since they readily react with
DTNB, while protein thiols detection needs preventive incubation at room
temperature for 30’. Samples were kept into quartz cuvette for measurement. Scan
mode acquisition with the DU70 Spectrophotometer (Beckman Coulter) was then
performed between 380 and 480 nm, at 300 nm/min scan rate. Calibration was
done against H2O2 and blank absorbance was registered as background. Sample
absorbance values at λ = 412 nm were used to calculate thiols concentration given
the molar extinction coefficient 13.6 mM-1
cm-1
at 412 nm. Finally thiol groups
concentration per milligrams of protein were calculated dividing such values by
protein content.

46
3.3 Differential “redox” labelling
A methodological constraint to fulfil the aim of this project is to identify and
quantify proteins which could be possibly distinguished with respect to their thiols
oxidation status among different samples to compare. In order to achieve such
goal we combined a differential labelling protocol to extract proteins of interest
from the sample and mass spectrometry analysis joined to informatics data
handling to identify and quantify those proteins (fig. 3.a).
All subsequent protocol steps were carried out at the same time for both M2 and
M2T samples.
Alkylation of free thiols
First, 1mM NEM was added during cell lysis and then fraction enrichment to
avoid unwanted thiol oxidation. 180 to 200 ugr of proteins from cytosol fraction
were then subjected to buffer exchange against 0.1 M sodium-phosphate pH 8.0 1
mM EDTA on NAP-5 columns (GE Healthcare) to remove unreacted NEM.
Reduction of oxidized thiols
Eluted samples were reduced with 1mM DTT (SIGMA) for 1h at ambient
temperature. This is intended to release reversibly oxidized protein thiol groups
for subsequent reaction with HPDP probe. Again excess DTT was removed by
means of buffer exchange on NAP-10 columns (GE Healthcare) against the same
buffer.
HPDP Labelling
Eluted sampleswere then treated with EZ-Link HPDP-Biotin probe (Thermo
Scientific) at ambient temperature for 1h.1:1 protein thiol groups to probe ratio
was calculated from DTNB data on protein thiol and reaction was carried out at
pH 8. Moreover, reaction of EZ-Link HPDP-Biotin probe with protein free thiols
was monitored as reported (§ 3.3.1). Unreacted EZ-Link HPDP-Biotin was
removed from the sample by means of another step of buffer exchange on PD-10
column against PBS pH 7.0.
Enrichment of labelled proteins
Labeled proteins were then “fished out” on homemade affinity Neutravidin
columns: 125 ugr of High Capacity NeutrAvidinAgarose Resin (Thermo
Scientific) were first packed and washed extensively with PBS EDTA 1mM pH
7.4 into empty Micro Bio-Spin Columns (2 cm working bed height, 0.8 mL bed
volume, BioRad). Whole sample was then loaded into the column by adding

47
subsequently 200 L aliquots and letting each of them flown through the column
by gravity. Flow through was recovered and loaded again for two more times.
Bounded sample was instead washed three times with binding buffer (PBS EDTA
1 mM pH 7.4) and three times with TrisHCl 0.1 M EDTA 1 mM pH 8.3. Elution
was achieved by reducing back disulfides between EZ-Link Biotin-HPDP and
protein thiols with the same buffer containing DTT 5 mM. This was intended to
avoid harsh conditions normally required to disrupt biotin-neutr/avidin interaction
and allowed the obtainment of suitable conditions for subsequent MS analysis.
Elution time was critical to achieve good experimental reproducibility and five
elution steps with 1 mL of elution buffer were performed letting the elution buffer
to incubate with resin exactly 2’ at ambient temperature each time before
collecting the sample by gravity.
Alkylation of formerly oxidized thiols
Eluted samples contained reduced thiols at pH 8.3 and further alkylation was
needed to avoid disulphide reshuffling and/or random oxidation. Therefore
samples were incubated 1h at ambient temperature with 1 mM IAM and excess
reactant was blocked by adding DTT to the reaction at a final concentration of 2
mM.
Fig. 3.a Differential labelling approach
Schematic representation in figure summarizes the main steps of the methodology developed in
this work: (1) first samples are “treated” that, in the case of the M2 and M2T breast cancer cellular
model, indicates different cell strains engineered in order to express a constitutive active mutant of
TAZ; (2) right during cell lysis accessible thiol-groups are blocked with NEM to avoid unwanted

48
oxidation which would otherwise compromise results interpretation; (3) thiol-groups which were
oxidized in the starting sample, and so which did not reacted with NEM, are reduced with DTT
and let free to react for further labelling; (4) formerly oxidized thiol-groups are then marked with
HPDP which contains a biotin function allowing us to affinity purify tagged (i.e. redox-sensitive)
proteins on neutravidin resins (5); given the use of reducing agents for elution from neutravidin the
next step is to block newly-reduced thiol-groups with IAM (6). Finally, samples enriched with
redox-sensitive proteins fished out of starting samples, are digested in order to proceed with MS
analysis and label free quantification.
3.3.1 HPDP assay
The reaction of Biotin-HPDP to sulfhydryl groups results in displacement of a
pyridine-2-thione group, the concentration of which may be determined by
measuring the absorbance at 343 nm. 60 and 180 ugr of proteins, corresponding
respectively to 8 and 24 uM thiols, were incubated with 10 and 30 uM EZ-Link-
Biotin-HPDP in sodium phosphate 0.1 M pH 8.0 for up to 1h at ambient
temperature. Reaction was followed on a DU70 Spectrophotometer (Beckman
Coulter) reading absorbance at 343 nm to confirm reaction extent.
3.3.2 Electrophoresis
Samples were analyzed also by means of SDS-PAGE and Wb. For SDS-PAGE
samples were diluted into suitable quantity of sample buffer (62.5 mMTrisHCl pH
6.8, 2.5% SDS, 10% glycerol, 0.004% pyronin in H2O mQ) and
reduced/denaturated by heating to 95% for 5’ with 1 M β-mercapto-ethanol
before run. Gels were casted at a final acrylamide concentration of T = 3.9% (w/v)
for the stacking gel and T = 14% (w/v) for the separating gel using suitable
amounts of APS (Sigma) and TEMED (Sigma) as catalyst for polymerization.
SDS-PAGE Molecular Weight Standars (BioRad) in sample buffer was used as
molecular weight marker. Separation was performed at constant current and
running buffer was prepared freshly each time (25 mM TrisHCl pH 8.6, 0.19 M
glycine, 0.01% SDS in H2O mQ). Occasionally also 12% Bis-TrisCriterion XT
pre-cast gels (BioRad) were used with XT MOPS running buffer and Precision
Plus Protein Standard Unstained (BioRad) as MW marker. Gels were stained
overnight with colloidal coomassie (1 mM Coomassie Brilliant Blue G-250, 34%
(v/v) methanol, 1.3 M ammonium sulphate, 3% (v/v)phosphoric acid in H2O mQ)
and destained with H2O mQ water.
3.3.3 Western blotting
In order to evaluate oxidation status and quantity of G6PDH protein in M2 and
M2T samples we performed Wb analysis on 20 ugr of total protein previously
separated by SDS-PAGE (see above) with and without the addition of reducing
49
agent. Gel-separated samples were electro-transferred on nitrocellulose membrane
at 180 mA constant current overnight into blotting buffer (25 mM ethanolamine,
25 mM glycine and 20% v/v methanol pH 9.5) and the success of transfer was
verified by Ponceau red staining (0.2% (w/v) in 3% (v/v) TCA aqueous solution).
Immunological detection was then performed using rabbit polyclonal antibody
against human G6PD (sc-67165, Santa Cruz Biotechnology) and mouse
monoclonal antibody against human GAPDH for loading control (mAbcam 9484)
as primary antibodies and HRP-conjugated anti-rabbit and anti-mouse secondary
antibodies for detection. Detection was done with freshly prepared luminol
solution (1.1 mM luminol, 1 mM 4-iodophenol, 0.12% BSA, 1.4 M H2O2, 0.025
mMTris-HCl pH 9.25) and densitometric analysis of immunoblots was obtained
by the Image Station 440 (KODAK). All washes were done with PBS 0.1%
Tween-20, saturation with PBS, 0.1% Tween-20, 0.9% NaCl and 3% BSA and
antibodies were diluted with PBS, 1% BSA.
3.4 Sample preparation for MS analysis
In order to identify proteins present into enriched fractions from § 3.4, samples
must be digested and analysed by MS. To remove excess DTT and IAM each
sample was concentrated by means of TCA precipitation: each sample was first
diluted to 3 mL final volume with water. A minimal volume of diluted DOC
detergent was then added to a final concentration of 0.02% (w/v) followed by 1
mL of TCA to a final concentration of 8 %. Sample was left to incubate 10’ at
ambient temperature before spinning it down at 3800*g 30’ at 4°C. Supernatant
containing soluble contaminants was then discarded carefully and pellet was
washed with 1 mL of cold ethanol by vortex and spinning at 3800*g 20’ at 4°C.
Again supernatant was discarded and each precipitated sample pellet was
dissolved into 100 L of NH4HCO3 40 mM ACN 10% containing 10 nGrTrypsin
Gold Mass Spectrometry Grade (SIGMA). Digestion was performed overnight
into a 37 °C water bath and arrested by adding formic acid (FA - SIGMA)
lowering pH to 3 – 4. Trypsinized samples were then dried by vacuum
centrifugation and re-suspended into 20 L of FA 0.1% milliQ grade water
solution prior to analysis.
3.5 Q-TOF analysis
Each peptide mixture from M2 and M2T samples was analysed in triplicate.
Specifically: 6 L of sample per technical replica were injected and each time
samples runs followed this order: M2replica1_M2Treplica1;
M2replica2_M2Treplica2; M2replica3_M2Treplica3. Samples were resolved by
means of reversed-phase chromatography on a nano-fluidic HPLC-Chip apparatus
coupled with a quadrupole ion trap and time of flight mass spectrometer, using the
50
6520 Accurate-Mass Q-TOF LC/MS system (Agilent Technologies, Santa Clara,
CA, USA) equipped with MassHunter Workstation Software Qualitative Analysis
B.02.00 as graphical interface for data handling. A 1200 Rapid Resolution system
(Agilent Technologies, Santa Clara, CA, USA) containing a binary pump and
degasser and a well-plate autosampler with thermostat were associated to the
HPLC-Chip interface directly connected to a nanoESI ionization source thus
providing a rugged technology suitable for sample identification analysis. Loaded
samples were enriched on a 160 nL enrichment column and separated with an
acetonitrile gradient (50% ACN in 60’, 80% ACN in 80’ and re-equilibration to
6% ACN in 120’) on a 75 µm x 150 mm separation column packed with Zorbax
300SB-C18 5 µm material at a flow rate of 0.36 uL/min. Source parameters were:
gas temperature 325 °C and drying gas 5 L/min while voltage values for
fragmentor, skimmer and octapole were respectively 175 V, 65 V and 750 V.
Counts threshold for storage were 200 for MS data and 5 for MS/MS data or
0.01% relative to base peak intensity in both cases. MS data were acquired in the
range between 350 and 2400 m/z and MS/MS data were acquired in the range
between 59 and 3000 m/z. Scan rate was 4 spectra/second for MS and 3
spectra/second (2378 transient spectrum) for MS/MS (3213 transient spectrum).
Data dependent MS/MS analysis were then carried on the 3th most intense peaks
from each MS scan using collision induced dissociation fragmentation (3.6 V/100
Da with – 4.8 V offset). Only precursors above 1000 counts or ≥ 0.01% with
reference to base peak intensity were used for fragmentation with an isolation
width of 4 Da. Dynamic exclusion for MS/MS analysis (exclusion after 2 spectra
and release after 0.5’) was applied in order to enhance sequencing of less
abundant species too. The use of dynamic exclusion during MS/MS data
acquisition was made possible since we adopted a label free quantification
method relying on MS/MS data only for species identification, while actual
abundance values were obtained from MS feature.
3.6 G6PDH enzymatic activity measurement
Assays were performed at ambient temperature. Sample was diluted into reaction
mixture: 0.1 M TrisHCl pH 7.4, 0.15 M KCl, 5 mM EDTA, 0.1% (v/v) Triton X-
100 and 1.25mM glucose-6-phosphate disodium salt according to Scott (Scott,
1971). The reaction was initiated by the addition of 0.25mM NADP and was
followed at 340 nm for 23 min with a DU70 Spectrophotometer (Beckman).
Activities are reported in nmol of NADPH formed per min per mgr of proteins
using extinction coefficient for NADPHλ340 = 6.22 M-1
cm-1
.
For inhibition experiments, M2 and M2T samples devoid of NEM were pre-
treated with 1mM DTT in a minimal volume of 0.1 M sodium-phosphate pH 8.0,
1 mM EDTA. Activity was then measured with or without removing DTT by
means of buffer exchange. In order to block reduced protein thiol-groups, samples

51
were also treated with 1mM NEM right after 1mM DTT reduction and activity
was measured after removal of both DTT and NEM by means of buffer exchange.
3.7 Data analysis
Two of the main applications of mass spectrometry are today identification and
quantitation of compounds. Although a variety of software tools exists for those
tasks, they are often monolithic and difficult to adapt to rapidly evolving demand.
Since many different quantitation protocols exist, it is desirable to have smaller
algorithmic components that can be readily combined into more complex
workflows or tools. OpenMS, a free software package (available under the Lesser
GNU Public License LGPL from the project website at http://www.openms.de)
aims at providing exactly this functionality and is therefore more flexible than
almost all current commercial tools and most of the openly available libraries. I
took advantage of the essential collaboration of computer engineer Dr. Marco
Falda in order to improve and finely tune OpenMS to perform desired analysis on
our data. Briefly speaking, OpenMS tools have been designed following a bottom-
up philosophy: from the code library, to the command line tools, to a high level
visual block workflow. Each layer simplify the management, but also restricts the
flexibility, since it constraints the user to follow “a priori” well defined
behaviours. We then decided to work at the intermediate level represented by the
command line tools, since the most abstract level had some inconveniences; for
instance, they do not cache intermediate results nor provide any sort of flow
distribution and concurrency. Computational Proteomics tasks require complex
and long operations, such as identifying sequences or characterizing features in
terms of wavelets. For this reason the workflow has been designed distributed
over a cluster of computers supervised using a so-called “job manager”, namely
the Sun Grid Engine 6.2u5 (SGE). The caching of the results and the concurrency
of independent tasks has been obtained using the SCons build system. Scons has
been preferred over more traditional tools like make or CMake for its ease of
customization. It can be programmed in the Python programming language and all
the repertoire of this language, such as functions, list comprehensions and
dynamic types are readily available. It has also a built-in scheduler able to queue
the jobs concurrently. These jobs are distributed among the cluster workstations
by delegating them to the SGE. The cluster is composed by 3 Dell™
PowerEdge™ R410 workstations equipped with 4 Intel® Xeon® quad-core CPUs
at 2.3GHz and 32 GB RAM; the storage unit is an Dell™ EqualLogic™ PS4000.
Refer to Fig. 4.f for an overview of the reported analytical workflow.

52
3.7.1 Input data
Input data required by OpenMS are mzML files, a specific kind of XML files
(others are mzData or mzXML). Nevertheless raw data from Agilent Accurate
Mass Q-TOF LC/MS 6520 are stored by default into a multi-folder format (.d)
which can be processed by proprietary software Agilent Mass Hunter Qualitative
Analysis only (we used version B.02.00 Build 2.0.197.0) and exported into
.mzData file format. In order to best keep unbiased and unfiltered raw data to be
processed byOpenMS, raw data from each experiment have been exported into
corresponding .mzData file format without applying any filter at this level beside
the required deisotopic function (peptides model) at centroid level. No further
baseline subtraction or spectra smoothing have been applied before going ahead
with analysis workflow.
3.7.2 Identification
Input mzML files are first processed by three different search engines: X!Tandem,
OMSSA and Mascot. We used a licensed in house server version of Mascot (ver.
2.3) on the cluster which has been implemented with Mascot search engine, while
X!Tandem and OMSSA referred to their own executables installed on the same
cluster. All search engines have been used with reference to SwissProt database
dated February 2012, taxonomically limited to Homo sapiens and enriched with
both potential contaminant proteins from the common Repository of Adventitious
Protein “cRAP” (www.thegpm.org/crap/index.html) and decoy proteins obtained
by inverting all the former sequences. Decoy proteins are used to distinguish
random sequence matches and compute false discovery rate (FDR) values.
Different identification scores from search engines are equalized and merged by
means of their posterior error probability (PEP) value, computed from FDR value
(Kӓll et al., 2008). So resulting matches (identifications) are gathered and merged
through the IDMerger and ConsensusIDblocks and before being passed to FDR
block peptides are also assigned to matched proteins and flagged as belonging to
the decoy database or not (depending on the fact that they match or don’t match to
reversed proteins in decoy database) by the PeptideIndexer block. The parameters
we set for each analysis stepare shown below (please refer to http://ftp.mi.fu-
berlin.de/OpenMS/doc-1.9-official/html/TOPP_documentation.html for a complete description):
MascotAdapterOnline:
database = SwissProt_H_Decoy
enzyme = none
instrument = ESI-QUAD-TOF
missed_cleavages = 0
precursor_mass_tolerance = 5

53
precursor_error_units = ppm
fragment_mass_tolerance = 0.05
fragment_error_units = Da
charges = 2,3,4
taxonomy = Homo sapiens
fixed_modifications = []
variable_modifications = [Carbamidomethyl (C), Nethylmleimide (C)]
mass_type = monoisotopic
number_of_hits = 0 (i.e. auto)
skip_spectrum_charges = FALSE
OMSSAAdapter:
database = SwissProt_HUMAN_decoy_crap_2012_02.fasta (together with
the corresponding psq generated through command makeblastdb)
precursor_mass_tolerance = 5
precursor_mass_tolerance_unit_ppm = TRUE
fragment_mass_tolerance = 0.05
min_precursor_charge = 2
max_precursor_charge = 4
fixed_modification = []
variable_modification = [Carbamidomethyl (C), Nethylmleimide (C)]
v = 1
e = 17
hl = 1
he = 1
X!TandemAdapter:
database = SwissProt_HUMAN_decoy_crap_2012_02.fasta
missed_cleavage = 1
precursor_mass_tolerance = 5
precursor_error_units = ppm
fragment_mass_tolerance = 0.05
min_precursor_charge = 2
max_precursor_charge = 4
fixed_modifications = []
variable_modifications = [Carbamidomethyl (C), Nethylmleimide (C)]
minimum_fragment_mz = 150
cleavage_site = [X]|[X]
max_valid_expect = 0.1
no_refinement = FALSE
no_semi_cleavage = FALSE

54
IDPosteriorErrorProbability:
split_charge = TRUE
top_hits_only = TRUE
ignore_bad_data = TRUE
ConsensusID:
rt_delta = 0.1
mz_delta = 5
min_lenght = 6
use_all_hits = FALSE
algorithm = PEP_Matrix
PeptideIndexer:
decoy_string = _rev
write_protein_sequence = TRUE
keep_unreferenced_proteins = FALSE
allow_unmatched = TRUE
aaa_max = 4
FalseDiscoveryRate:
proteins_only = FALSE
peptides_only = FALSE
3.7.3 Quantification
Once that identification maps have been obtained as couples of coordinates <<mz,
Rt>, peptide>, such identifications can be correlated to the so called features
through the IDMapper block. A feature is a group of spectra generated from a
peptide and recognised by the FeatureFinderCentroided block among the complex
three dimensional raw data map which is characterized by the whole mz, RT and
intensity values from an entire LC-MS experiment (such data are given in input
with the mzML file quoted above §3.7.1). At this point M2 and M2T samples are
coupled together combining them into all nine possible ways and features are
joined between them obtaining nine consensus maps. Features correctly mapped
to identified peptides (by IDMapper) are finally quantified by means of the
ProteinQuantifier block. The parameters we set for each analysis step are shown
below (please refer to http://ftp.mi.fu-berlin.de/OpenMS/doc-1.9-
official/html/TOPP_documentation.html for a complete description):
FeatureFinderCentroided:
intensity:bins = 10

55
mass_trace:mz_tolerance = 0.02
isotopic_pattern:mz_tolerance = 0.04
isotopic_pattern:charge_low = 2
algorithm = left at default values
IDMapper:
rt_tolerance = 15
mz_tolerance = 10
mz_measure = ppm
mz_reference = precursor
ignore_charge = FALSE
use_centroid_rt = FALSE
use_centroid_mz = TRUE
FeatureLinkerUnlabeledQT:
use_identifications = TRUE
ignore_charge = FALSE
ProteinQuantifier:
top = 3
average = MEDIAN
include_all =TRUE
filter_charge = FALSE
normalize = FALSE
fix_peptides = FALSE
3.7.4 Results filtering and score ranking
The last component of the OpensMS analytical workflow, ProteinQuantifier,
ultimately produces two data tables containing respectively quantified peptides
values and values of proteins quantified starting from such peptides. Two Python
scripts allow gathering of both proteins and peptides among all the combinations
of experimental technical repetitions while another Python script create simple to
handle Excel sheets containing peptides and proteins identified during each step
of the analysis. In order to obtain reliable quantitative data strengthened by six
biological replica, we called for cut off criteria driving us in the classification of
non-differential, more oxidized and less oxidized proteins/reduced (with reference
to M2T to M2 ratio): so given theM2T/M2ratio threshold of ≤ 0.6 for reduced ≥
1.4 for oxidized groups (i.e. at least 40% relative difference), we made the
following categorisation:
Over oxidized: ≥ 1.4 for ≥ 3 experiments AND ≤ 0.6 for ≤ 2 experiments

56
Reduced: ≤ 0.6 for ≥ 3 experiments AND ≥ 1.4 for ≤ 2 experiments
Non differential: ≥ 0.6 AND ≤ 1.4 for ≥ 3 experiments AND ≤ 0.6 for ≤ 2
experiments AND ≥ 1.4 for ≤ 2 experiments
All those quantified proteins not belonging to any of the former groups have then
been classified as too variable to be characterized as oxidized/reduced in M2T
over M2 samples. This could be due of course to the fact that such proteins are not
abundant enough or too variables due to intrinsic biological variability to be
reproducibly classified. Moreover results obtained this way have been further on
ranked depending on both the number of experiments in which they have been
observed and the number of identified peptides matching the protein: globally
those parameters have been integrated into the so called f-measure. F-measure has
been calculated this way for each protein in the former groups:
Given: mean of identified peptides/max identified peptides = P
Given: n. ° of experiments confirming identification/max n. ° of experiments = B
We calculated harmonic mean of ratios as:
Such harmonic mean has then been corrected with a factorXto compensate for the
different numerosity of experiments and identified peptides:
Where X is equal to:
given: max n.° of experiments / 2 = H
B>H AND P = 1 X = 2
B>H AND P> 1 X = 4
B>H - 1 AND P = 1 X = 3
B> 1 AND P> 3 X = 2

57
4. RESULTS
4.1 Development of label free methodology to characterize and
differentially quantify oxidatively modified proteins in complex
sample
The aim of this project was to identify both the proteins and the cysteine residues
differentially oxidized in the samples and also to quantify the difference. We then
sought to develop a methodology allowing us both to label reversibly modified
residues and to purify proteins containing them in order to analyse a sample
devoid of “background” (unlabelled) proteins. Critical steps are reported.
4.1.1 Differential redox labelling
For our project we choose to rely neither on isotope labelling techniques nor on
electrophoretic fractionation which could be troublesome with respect to
reproducibility. So we choose to use simple alkylating agents like NEM and IAM
to mark reduced and oxidized cysteines in the sample and the biotinilated HPDP
probe for affinity purifying modified proteins. So main steps are:
(1) Trapping of native redox state of the thiol proteome to avoid artifactual
modification during protein isolation and labelling (with NEM).
(2) Reduction of the reversibly oxidized cysteine residues in the sample
(with DTT)
(3) Labelling of formerly oxidized cysteine residues (with biotin-HPDP)
(4) Affinity purification of modified proteins (with Neutravidin)
(5) Elution of affinity purified proteins (with DTT)
(6) Labelling of formerly modified cysteine residues (with IAM)
4.1.1.1 Trapping of the native redox state of thiols
Given that many cysteine residues are relatively labile since thiols are prone to
artifactual modification during protein isolation we needed to trap thiols in their
native state as soon as we started to process M2 and M2T cell samples. DTNB
assay on residual protein free thiols demonstrated the need for at least 1:2
[SH]:NEM ratio and incubation time of no less than 90’ Fig. 4.a. Thus we
managed to use 2x[SH] NEM already into the buffer used for cell lysis and
cytosolic fraction enrichment.

58
Fig. 4.a
We checked protein free
thiols with DTNB assay
after incubation with
NEM aimed at trapping
free thiols in native
sample. [SH]:[NEM]
ratio of 1:2 was
demonstrated to be
enough to reach the goal.
4.1.1.2 Reduction of oxidized thiols
We aimed at identifying and quantifying proteins containing reversible oxidative
modifications. Of course the number and typology of reversible oxidative
modifications which could occur inside the cell is remarkable and not all of them
could be addressed by a single methodology at the same time. So we decided to
focus on cysteine reversible oxidation products like low redox potential - solvent
accessible intra/inter-protein disulfides, sulfenic acid groups, glutathionilation and
cysteinilation products as they have been recognized as possible forms of redox
modifications entailed in signal transduction inside the cell. DTT is a common
reducing agent suitable for reducing back all the above mentioned oxidation
products and we demonstrated that 60’ incubation at ambient temperature with 1
mM DTT is enough to free our target thiol groups on proteins Fig. 4.b.
Fig. 4.b
7.5 ugr of cytosolic proteins were
reduced with 1 mM DTT at pH 8 for
up to 4h. Samples were checked after
SDS-PAGE separation with CCB
staining (A) and reduced thiols were
revealed by labelling with 5-IAF and
detecting at 518 nm (B).
250
125
30 0
1.0 1.2 1.5 2.0
Re
sid
ual
pro
tein
[SH
] u
M
[NEM]/[SH]
1.5h incubation with NEM at Tamb
1h 2h 3h 4h 1h 2h 3h 4h
A B

59
4.1.1.3 Labelling reaction
Proteins containing thiols reduced at § 4.1.1.2 were our target and thus we wanted
to isolate them out of the whole protein sample. Instead of using isotope labelling
approaches to mark reduced cysteine-residues and quantify those proteins together
with all the others (representing potential troublesome background) we sought an
affinity purification approach by means of the labelling reagent biotin-HPDP. The
biotin function on this probe allowed fishing marked proteins on neutravidin resin
while the pyridine-2-thione leaving group allowed reversible disulphide binding
of the probe to target thiol groups in the sample. Thus the pyridine-2-thione group
displaced by HPDP reaction with free thiol groups was quantified by measuring
its absorbance at 343 nm. In preliminary experiments 280 ugr of proteins,
corresponding to roughly 30 uM [SH] were incubated with 40 uM HPDP at Tamb
for 1h, final reaction volume 1 mL. Given molar extinction coefficient for
pyridine-2-thione at 343 nm = 8.08*103 M
-1 cm
-1 and Δ(A60 - A0)λ343 = 0.24
measured for the reaction, we estimated biotinylation of about 29.37 nmol/mL
[SH] therefore nearly completion. We also evaluated HPDP labelling of NEM
treated/untreated M2 and M2T samples Fig. 4.c.
Fig. 4.c Monitoring of HPHP labelling reaction
60 ugr of total proteins of M2 (A) and M2T (B) samples were incubated with 10 uM HPDP for 10
minutes (horizontal axe) and reaction was followed monitoring absorbance at 343 nm (vertical
axe). We confirmed remarkable difference between +/- NEM samples in both M2 and M2T
samples, confirming the efficacy of the trapping of natively reduced thiols (§4.2.1.1). It is
noteworthy also the higher protein thiols labelled into M2T with respect to M2 cell line as will be
confirmed also by DTNB assay hereafter.
4.1.1.4 Critical aspects of elution
We assembled Neutravidin columns suitable for the affinity purification of HPDP-
labelled samples. Among different parameters pertaining to binding and washing
steps the most important step which was tuned in order to obtain good
A B
- NEM - NEM
+ NEM + NEM
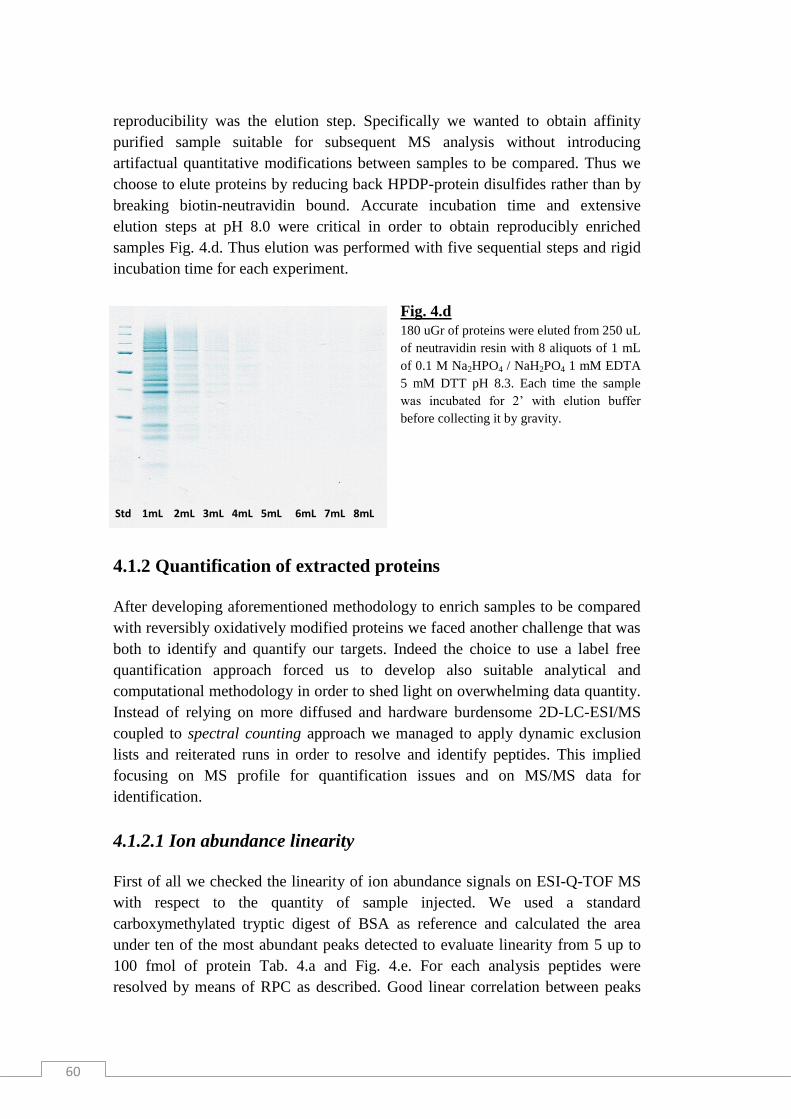
60
reproducibility was the elution step. Specifically we wanted to obtain affinity
purified sample suitable for subsequent MS analysis without introducing
artifactual quantitative modifications between samples to be compared. Thus we
choose to elute proteins by reducing back HPDP-protein disulfides rather than by
breaking biotin-neutravidin bound. Accurate incubation time and extensive
elution steps at pH 8.0 were critical in order to obtain reproducibly enriched
samples Fig. 4.d. Thus elution was performed with five sequential steps and rigid
incubation time for each experiment.
Fig. 4.d
180 uGr of proteins were eluted from 250 uL
of neutravidin resin with 8 aliquots of 1 mL
of 0.1 M Na2HPO4 / NaH2PO4 1 mM EDTA
5 mM DTT pH 8.3. Each time the sample
was incubated for 2’ with elution buffer
before collecting it by gravity.
4.1.2 Quantification of extracted proteins
After developing aforementioned methodology to enrich samples to be compared
with reversibly oxidatively modified proteins we faced another challenge that was
both to identify and quantify our targets. Indeed the choice to use a label free
quantification approach forced us to develop also suitable analytical and
computational methodology in order to shed light on overwhelming data quantity.
Instead of relying on more diffused and hardware burdensome 2D-LC-ESI/MS
coupled to spectral counting approach we managed to apply dynamic exclusion
lists and reiterated runs in order to resolve and identify peptides. This implied
focusing on MS profile for quantification issues and on MS/MS data for
identification.
4.1.2.1 Ion abundance linearity
First of all we checked the linearity of ion abundance signals on ESI-Q-TOF MS
with respect to the quantity of sample injected. We used a standard
carboxymethylated tryptic digest of BSA as reference and calculated the area
under ten of the most abundant peaks detected to evaluate linearity from 5 up to
100 fmol of protein Tab. 4.a and Fig. 4.e. For each analysis peptides were
resolved by means of RPC as described. Good linear correlation between peaks
Std 1mL 2mL 3mL 4mL 5mL 6mL 7mL 8mL

61
area and sample injected support the reliability of the MS profile quantification
approach reported hereafter.
Fig. 4.e Linear regression plot for observed peptides
sample moles sample moles
sample moles sample moles
sample moles sample moles
sample moles sample moles
sample moles sample moles
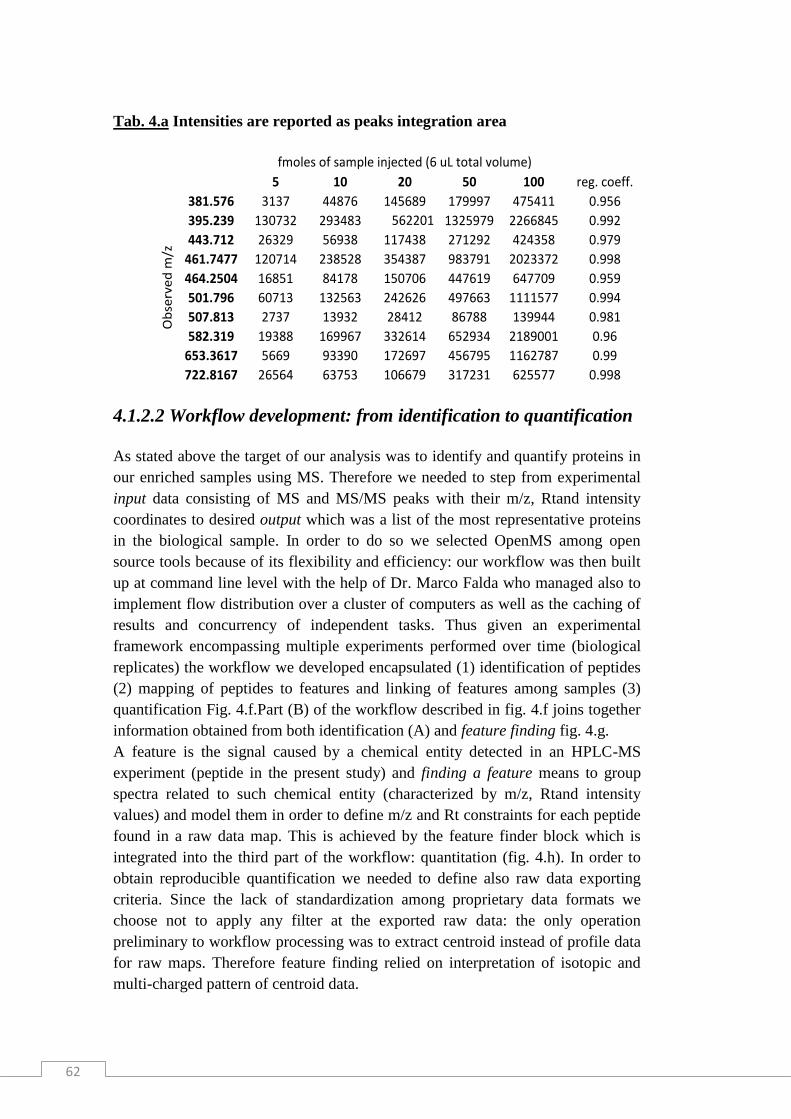
62
Tab. 4.a Intensities are reported as peaks integration area
5 10 20 50 100 reg. coeff.
381.576 3137 44876 145689 179997 475411 0.956
395.239 130732 293483 562201 1325979 2266845 0.992
443.712 26329 56938 117438 271292 424358 0.979
461.7477 120714 238528 354387 983791 2023372 0.998
464.2504 16851 84178 150706 447619 647709 0.959
501.796 60713 132563 242626 497663 1111577 0.994
507.813 2737 13932 28412 86788 139944 0.981
582.319 19388 169967 332614 652934 2189001 0.96
653.3617 5669 93390 172697 456795 1162787 0.99
722.8167 26564 63753 106679 317231 625577 0.998
fmoles of sample injected (6 uL total volume)O
bse
rve
d m
/z
4.1.2.2 Workflow development: from identification to quantification
As stated above the target of our analysis was to identify and quantify proteins in
our enriched samples using MS. Therefore we needed to step from experimental
input data consisting of MS and MS/MS peaks with their m/z, Rtand intensity
coordinates to desired output which was a list of the most representative proteins
in the biological sample. In order to do so we selected OpenMS among open
source tools because of its flexibility and efficiency: our workflow was then built
up at command line level with the help of Dr. Marco Falda who managed also to
implement flow distribution over a cluster of computers as well as the caching of
results and concurrency of independent tasks. Thus given an experimental
framework encompassing multiple experiments performed over time (biological
replicates) the workflow we developed encapsulated (1) identification of peptides
(2) mapping of peptides to features and linking of features among samples (3)
quantification Fig. 4.f.Part (B) of the workflow described in fig. 4.f joins together
information obtained from both identification (A) and feature finding fig. 4.g.
A feature is the signal caused by a chemical entity detected in an HPLC-MS
experiment (peptide in the present study) and finding a feature means to group
spectra related to such chemical entity (characterized by m/z, Rtand intensity
values) and model them in order to define m/z and Rt constraints for each peptide
found in a raw data map. This is achieved by the feature finder block which is
integrated into the third part of the workflow: quantitation (fig. 4.h). In order to
obtain reproducible quantification we needed to define also raw data exporting
criteria. Since the lack of standardization among proprietary data formats we
choose not to apply any filter at the exported raw data: the only operation
preliminary to workflow processing was to extract centroid instead of profile data
for raw maps. Therefore feature finding relied on interpretation of isotopic and
multi-charged pattern of centroid data.

63
Fig
. 4.f D
ata
an
aly
sis wo
rkflo
w
Fig
ure rep
resents a v
isual su
mm
ary o
f the O
pen
MS
wo
rkflo
w. T
he n
um
ber ab
ov
e con
necto
r arrow
s represen
ts set of file
s to b
e pro
cessed: fo
r each
exp
erimen
t inp
ut w
ere 3 M
2 sam
ples an
d 3
M2
T sam
ples. S
pecifically
: mzD
ata expo
rted raw
data m
aps (see §
3 fo
r details) w
ere used
in in
pu
t for
bo
th th
e iden
tification o
f pep
tides rely
ing
on
MS
/MS
data (A
) and
the m
app
ing
and lin
kin
g o
f features (B
). Mu
ltiple search
eng
ines m
atched
MS
/MS
fragm
ents d
ata to p
rotein
datab
ank
s scorin
g p
eptid
e to sp
ectrum
match
es (PS
M). H
eterog
eneo
us sco
ring
algo
rithm
results fro
m all th
e
search en
gin
es were th
en co
mb
ined
by
mean
s of th
e po
sterior erro
r pro
bab
ility (P
EP
) functio
n an
d th
e IDm
erger b
lock
. Co
nsen
sus id
entificatio
n
from
pep
tide id
entificatio
ns o
f several id
entificatio
n e
ng
ines w
as ob
tained
by
the C
on
sensu
sID b
lock
and
pro
tein referen
ce for each
pep
tide
(com
prisin
g m
atchin
g to
deco
y-D
B) w
as refreshed
by
the In
dex
er blo
ck. F
alse disco
very
rate was estim
ated fro
m m
atchin
g to
deco
y-D
B w
ith
respect to
ov
erall match
es and
match
es to d
ecoy
-DB
were
remo
ved
by
the F
alse Disco
very
Rate b
lock
. In th
e secon
d p
art of th
e wo
rkflo
w (B
)
iden
tification
s com
ing
from
all replicates o
f a giv
en b
iolo
gical sam
ple are m
erged
tog
ether an
d m
app
ed o
n th
e 6 files w
ho
se features h
as been
characterized
. Fro
m th
ese 6 files 9
po
ssible co
mb
inatio
ns b
etween
con
trol an
d treated
samples are lin
ked
.
A
B

64
Fig. 4.g Feature relative quantification is based on both MS and MS/MS data Mapping and linking block of the workflow (fig. 4.f B) joins information from both identification
(derived from MS/MS data) and feature finding (derived from MS data)
Fig. 4.h Quantification branch of the workflow Quantitation block find features to give as input to the merging block (B). From mapped and
linked features the quantitation block finally extracts and quantifies peptides and proteins relying
on features intensity.
4.1.2.3 Workflow validation
The aim to identify and quantify redox active proteins implies that we built
aforementioned data analysis workflow in the context of an explorative
experiment. Therefore we did not take advantage of any “fixed point” in our
samples for validation. Instead we performed two empirical checks of the
correctness of this methodology by considering both the quality of the consensus
features identified (see below) and the application of the entire workflow on a
simple benchmark experiment. After Feature Finder identified features in each of
the samples to be compared, features were mapped (i.e. identified by means of
MS/MS data association) and linked among M2 and M2T sample: the result of
feature linking is the so called consensus feature map. So consensus features are
those features contextualized in the linked map and possibly used for subsequent
quantification. We then evaluated the distance in terms of m/z and Rt values of
Featurefinding
Identification
B

65
identified consensus features with respect to the constituent mapped features Fig.
4.i.
Fig. 4.i Consensus feature alignment Rt distance in seconds (left) and m/z distance in mTh (right) of consensus feature with respect to
constituent mapped features are grouped into categories and plotted against the number of events
(consensus feature) into each category. Hyperbolic trend of both plots confirm that mapped
features are well aligned and that their distance with respect to consensus features used for
quantification in terms of Rt and m/z is between 5 sec and 0.014 Da.
In order to evaluate the reliability of our quantification workflow it was also
applied to a benchmark dataset obtained from a mixture of 13 proteins in known
quantity. Similarly to our experimental framework benchmark dataset
encompassed multiple biological and technical replicates: 3 pairs of samples to
compare (biological replicates) and each of them was measured 3 times (technical
replicates). We managed to correctly evaluate the under/over expression of 13/13
benchmark proteins and for 5/13 real values were within estimated interquartile
distance. We also identified 6 “false positives” comprising Trypsin which was
present indeed. Results of benchmark dataset analysis are reported into Fig. 4.l.
4.1.2.4 Decision-making criteria
The final output of OpenMS workflow provides quantitation ratios for peptides
and proteins in the sample based on features intensity. Further processing was
then required to compute the median values among technical replicates for each
biological replicate and to compute median among biological replicates as well.
Finally we needed to align such ratios and count them applying a criterion to filter
the proteins. The last step was then to rank obtained results.
First of all we checked instrumental variability by comparing measured peptide
intensity ratios among technical replicates Fig. 4.m. Based on estimated
instrumental variability we then choose to set threshold for under/over represented
proteins at ± 40%. Based on such threshold we were able to reliably quantify out
of 331 identified proteins: 17 proteins over expressed into M2T over M2 samples
and 29 under expressed proteins with respect to the same ratio. Other 45 proteins
resulted otherwise not differential between M2T over M2 sample.

66
Fig. 4.l Analysis of benchmark dataset The boxplot reports actual and measured quantitative ratios for proteins in the benchmark dataset.
Horizontal lines represent the threshold of under/over expression (we considered at least ± 50%
variation) and the boxes represent the interquartile estimates for the proteins. Red dots are the true
quantities which lie often within measured values boxes. 13/13 proteins boxes obtained with our
analytical workflow are good estimate of real under/over expression. Protein mix has been
obtained from the work of Jaffe et al. [Jaffe et al., 2006] and is made of two samples (α andβ)
containing different quantities of the same proteins. Values estimated by our analytical workflow
(boxes in the plot) are given as β:α ratios. Proteins and respective α:β ratio are: BPT1_BOVIN =
100:5; RNAS1_BOVIN = 100:100; MYG_HORSE = 100:100; LACB_BOVIN = 50:1;
CASA2_BOVIN = 100:10; CASA1_BOVIN = 100:10; CAH2_BOVIN = 100:100;
OVAL_CHICK = 5:10; FIBB_BOVIN = 25:25; ALBU_BOVIN = 10:200; TRFE_HUMAN =
2.5:5; BGAL_ECOLI = 1:10. We also correctly identified trypsin used for sample digestion, which
correctly resulted non-differential among the two samples.
Nevertheless once we obtained aforementioned lists of proteins we needed to rank
them too in order to evaluate the robustness of each result. We then choose to rely
on the number of peptides used to identify a protein and on the percentage of
biological replicates in which the protein was correctly identified. To combine
those two criteria we adopted the harmonic mean function (from now on called “f-
measure”) modified with a “step” parameter as reported at § 3.7.4. This was
intended to award proteins identified with more than 2 peptides or reproducibly
identified in more than half of the biological replicates. Modification of f-measure
scoring of the results reported hereafter is plotted for clarity in Fig. 4.n

67
Fig. 4.m Peptides intensity ratios among technical replicates Scatter plot reports correspondence of measured intensity ratio of identified peptides between
couples of technical replicates. Tech 1 vs Tech 2 = dark blue, Tech 2 vs Tech 3 = blue, Tech 2 vs
Tech 2 = light blue. Green line indicates ratio = 1 that is to say no instrumental variability at all
while red lines represents +/- 40% with respect to measured ratio among technical couples.
Between 86 and 90 % of measured peptides lie inside the two red lines and so we choose to set an
arbitrary threshold for differentially expressed proteins of at least +/- 40% variability.
Data reported here were obtained from a single biological replicate and are exemplificative of the
whole experiment.
4.2 Differences in M2 and M2T redoxome
We fished out of M2T and M2 sample proteins containing reversibly oxidatively
modified cysteines and we identified and quantified them. We also determined
M2T/M2 quantity ratio for each of those proteins. In this context the term “over-
expressed” means that a protein was found as more oxidized into M2T with
respect to M2 sample. On the other hand “under-expressed” means that a protein
was more reduced into M2T with respect to M2 sample. Of course “non-
differential” means that we found the same quantity for a specific protein in both
samples to be compared. Remaining identified proteins were instead classified as
neither under/over-expressed nor non-differential because we detected such
variability among biological replicates that we couldn’t give reasonable estimate
for their abundance ratio. Identifying and quantifying are indeed actually different
tasks to achieve. Nevertheless by this approach we were able to stress some
reproducible differences of the oxidation status of relevant proteins into MCF10A
0
1
2
3
4
5
6
7
0 1 2 3 4 5 6 7
Tech 1 vs Tech 2 & Tech 2 vs Tech 3 & Tech 1 vs Tech 3

68
M2T and M2 cell lines. Such differences are also sustained by experimental data
on free thiol concentration on both cell lines.
Fig. 4.n Criteria for ranking differentially oxidized protein lists Surface plot reports trend of a canonical harmonic function (A) and of our modified f-measure (B).
Steps are intended to award proteins identified with more than 2 peptides or identified
reproducibly into more than 50% of the biological replicates.
4.2.1 Differential protein list
Hereafter are reported tables containing identified and quantified proteins Tab.
4.b/c/d. All “ratio” values are given as means of absolute intensity ratio for each
protein over all the considered biological replicates.
0.10.20.30.40.50.60.70.80.91
0
0.2
0.4
0.6
0.8
1
0.166666667
0.666666667
n. peptides
f-m
eas
ure
n. bio
0.10.20.30.40.50.60.70.80.91
0
0.2
0.4
0.6
0.8
1
0.166666667
0.5
0.833333333
n. peptides
f-m
eas
ure
n. bio
0.8-1
0.6-0.8
0.4-0.6
0.2-0.4
0-0.2
A
B

69
Tab. 4.b Proteins more oxidized into M2T over M2 sample
Description Ratio f-measure
Mucin-16 1.8 4.1
Glucose-6-phosphate 1-dehydrogenase 15.2 2.2
S-adenosylmethionine synthase isoform type-2 1.8 0.1
Serine/threonine-protein kinase LMTK3 25.0 0.1
Hemicentin-2 1.8 0.1
Trophinin 1.6 0.1
Uncharacterizedprotein KIAA1109 4.8 0.1
Dyneinheavychain7, axonemal 3.0 0.1
Chondroitinsulfateproteoglycan4 1.6 0.1
Short transient receptorpotential channel 6 1.7 0.1
Usherin 27.4 0.1
Fibroussheath-interactingprotein2 27.4 0.1
Unconventionalmyosin-XV 27.4 0.1
Short transient receptor potential channel 6 27.4 0.1
PHD finger protein3 4.0 0.1
Spermatogenesis-associatedprotein25 5.5 0.1
NudC domain-containingprotein2 27.4 0.1
Tab. 4.c Proteins more reduced into M2T over M2 sample
Description Ratio f-measure
Glutathione S-transferase P 0.5 4.3
Peroxiredoxin-1 0.5 4.3
Transcriptionintermediaryfactor 1-beta 0.5 4.2
Heat shock cognate 71 kDa protein 0.6 4.2
GTP-binding nuclear protein Ran 0.5 4.2
Heat shock protein 75 kDa, mitochondrial 0.5 4.1
Probable E3 ubiquitin-proteinligase C12orf51 0.1 4.1
Thioredoxin 0.1 0.1
Low-density lipoprotein receptor-related protein 2 0.5 0.1
Mucin-19 0.3 0.1
Prolow-density lipoprotein receptor-related protein 1 0.5 0.1
E3 ubiquitin-proteinligase HERC2 0.2 0.1
Proteinbassoon 0.1 0.1
Mucin-17 0.3 0.1
Tubulin beta-4B chain 0.5 0.1
ProbableXaa-Pro aminopeptidase3 0.5 0.1
Protein FAM75D1 0.4 0.1
Peroxisome proliferator-activated receptor gamma coactivator-related protein 1 0.4 0.1
Vinculin 0.1 0.1
Probablemethyltransferase TARBP1 0.1 0.1
E3 ubiquitin-proteinligase SHPRH 0.1 0.1
Kinesin-likeprotein KIF16B 0.1 0.1
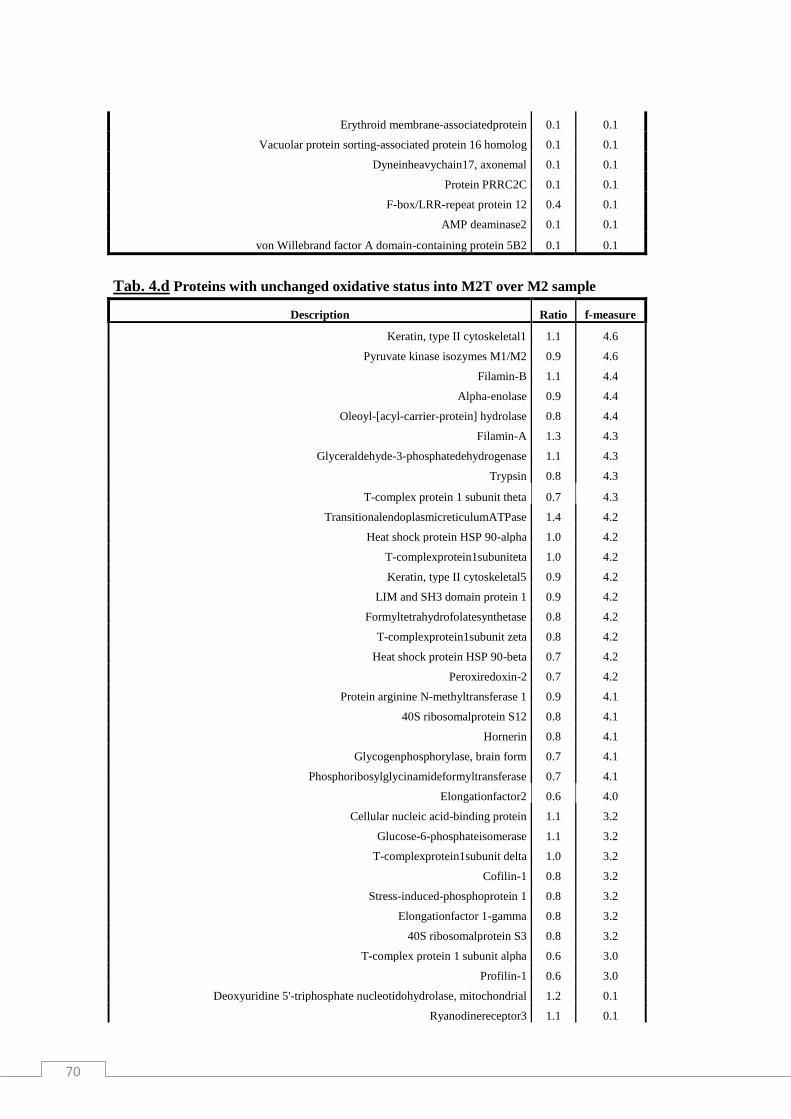
70
Erythroid membrane-associatedprotein 0.1 0.1
Vacuolar protein sorting-associated protein 16 homolog 0.1 0.1
Dyneinheavychain17, axonemal 0.1 0.1
Protein PRRC2C 0.1 0.1
F-box/LRR-repeat protein 12 0.4 0.1
AMP deaminase2 0.1 0.1
von Willebrand factor A domain-containing protein 5B2 0.1 0.1
Tab. 4.d Proteins with unchanged oxidative status into M2T over M2 sample
Description Ratio f-measure
Keratin, type II cytoskeletal1 1.1 4.6
Pyruvate kinase isozymes M1/M2 0.9 4.6
Filamin-B 1.1 4.4
Alpha-enolase 0.9 4.4
Oleoyl-[acyl-carrier-protein] hydrolase 0.8 4.4
Filamin-A 1.3 4.3
Glyceraldehyde-3-phosphatedehydrogenase 1.1 4.3
Trypsin 0.8 4.3
T-complex protein 1 subunit theta 0.7 4.3
TransitionalendoplasmicreticulumATPase 1.4 4.2
Heat shock protein HSP 90-alpha 1.0 4.2
T-complexprotein1subuniteta 1.0 4.2
Keratin, type II cytoskeletal5 0.9 4.2
LIM and SH3 domain protein 1 0.9 4.2
Formyltetrahydrofolatesynthetase 0.8 4.2
T-complexprotein1subunit zeta 0.8 4.2
Heat shock protein HSP 90-beta 0.7 4.2
Peroxiredoxin-2 0.7 4.2
Protein arginine N-methyltransferase 1 0.9 4.1
40S ribosomalprotein S12 0.8 4.1
Hornerin 0.8 4.1
Glycogenphosphorylase, brain form 0.7 4.1
Phosphoribosylglycinamideformyltransferase 0.7 4.1
Elongationfactor2 0.6 4.0
Cellular nucleic acid-binding protein 1.1 3.2
Glucose-6-phosphateisomerase 1.1 3.2
T-complexprotein1subunit delta 1.0 3.2
Cofilin-1 0.8 3.2
Stress-induced-phosphoprotein 1 0.8 3.2
Elongationfactor 1-gamma 0.8 3.2
40S ribosomalprotein S3 0.8 3.2
T-complex protein 1 subunit alpha 0.6 3.0
Profilin-1 0.6 3.0
Deoxyuridine 5'-triphosphate nucleotidohydrolase, mitochondrial 1.2 0.1
Ryanodinereceptor3 1.1 0.1

71
T-complex protein 1 subunit beta 1.0 0.1
Nucleophosmin 1.0 0.1
Voltage-dependent L-type calcium channel subunit alpha-1C 0.9 0.1
Isocitratedehydrogenase [NADP] cytoplasmic 0.9 0.1
Toll-likereceptor9 0.9 0.1
FH1/FH2 domain-containing protein 1 0.9 0.1
Proliferatingcellnuclearantigen 0.8 0.1
Carbonylreductase [NADPH] 1 0.8 0.1
26S proteaseregulatorysubunit4 0.8 0.1
Cysteine and glycine-rich protein 1 0.7 0.1
4.2.2 Differential proteins characterization
Given the limited number of differentially oxidized proteins we identified it has
been impossible to apply significant function enrichment analysis. So we
manually retrieved function information from the Uniprot protein-databank for
each protein: this way we were able to cluster some of them into functional
groups. Among redox sensitive unchanged proteins Transitional endoplasmic
reticulum ATPase (valosin containing protein, VCP), Heat shock protein HSP 90-
alpha, Stress-induced-phosphoprotein 1, Heat shock protein HSP 90-beta, Heat
shock cognate 71 kDa and six subunits of the T-complex protein 1 belong to the
unfolded-protein response branch of the Nrf2/Keap1 pathway, while Glucose-6-
phosphate isomerase, Glyceraldheyde-3-phosphate dehydrogenase, Isocitrate
dehydrogenase [NADP cytoplasmic], Alpha-nolase and Pyruvate kinase isozymes
M1/M2 share their role into cellular energy metabolism (both glycolysis and
citric-acid cycle). Among proteins more reduced into M2T in respect to M2 cells
we then have: Peroxiredoxin-1, Glutathione S-transferase P and Thioredoxin
which belong to the antioxidant response branch of the same Nrf2/Keap1
pathway; while GTP-binding nuclear protein Ran, Tubulin beta-4B chain,
Vinculin, Kinesin-like protein KIF16B, Vacuolar protein sorting-associated
protein 1 and Dynein heavy chain 17 axonemal protein share a common role as
components of the cytoskeleton and movement proteins. Another group of
proteins more reduced into M2T in respect to M2 cells is that encompassing three
members of the ubiquitinilation complex: F-box/LRR-repeat protein 12, E3
ubiquitin-protein ligase SHPRH and the probable E3 ubiquitin-protein ligase
HECTD4. Finally, among proteins identified as more oxidized into the more
malignant M2T cells in respect to their M2 counterpart, we were able to group up
Usherin, Mucin-16, Chondroitin sulphate proteoglycan, Hemicentin and
Trophinin as proteins involved at various levels into cellular adhesion and extra-
cellular matrix (ECM) interaction. Particular interest was attracted by the pentose
phosphate pathway rate limiting enzyme glucose-6-phosphate dehydrogenase, the
main source of reducing equivalents in the form of NADPH (see after herein).
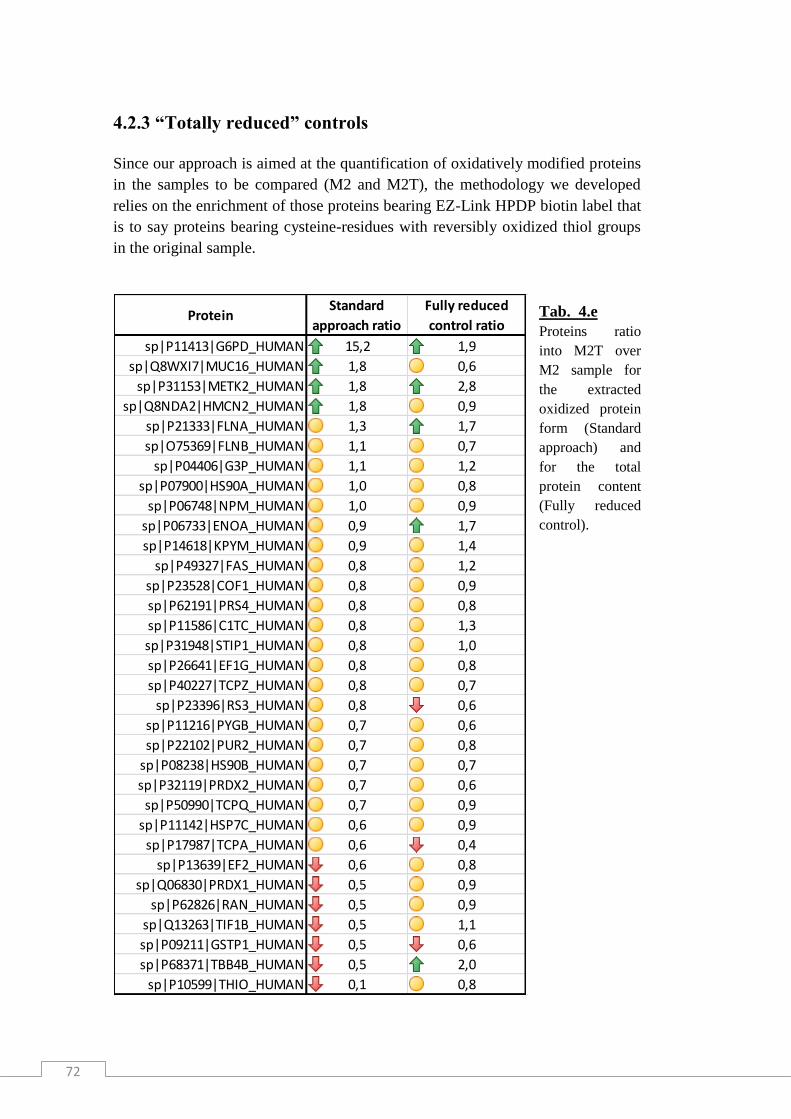
72
4.2.3 “Totally reduced” controls
Since our approach is aimed at the quantification of oxidatively modified proteins
in the samples to be compared (M2 and M2T), the methodology we developed
relies on the enrichment of those proteins bearing EZ-Link HPDP biotin label that
is to say proteins bearing cysteine-residues with reversibly oxidized thiol groups
in the original sample.
Tab. 4.esssssss
Proteins ratio
into M2T over
M2 sample for
the extracted
oxidized protein
form (Standard
approach) and
for the total
protein content
(Fully reduced
control).
sp|P11413|G6PD_HUMAN 15,2 1,9
sp|Q8WXI7|MUC16_HUMAN 1,8 0,6
sp|P31153|METK2_HUMAN 1,8 2,8
sp|Q8NDA2|HMCN2_HUMAN 1,8 0,9
sp|P21333|FLNA_HUMAN 1,3 1,7
sp|O75369|FLNB_HUMAN 1,1 0,7
sp|P04406|G3P_HUMAN 1,1 1,2
sp|P07900|HS90A_HUMAN 1,0 0,8
sp|P06748|NPM_HUMAN 1,0 0,9
sp|P06733|ENOA_HUMAN 0,9 1,7
sp|P14618|KPYM_HUMAN 0,9 1,4
sp|P49327|FAS_HUMAN 0,8 1,2
sp|P23528|COF1_HUMAN 0,8 0,9
sp|P62191|PRS4_HUMAN 0,8 0,8
sp|P11586|C1TC_HUMAN 0,8 1,3
sp|P31948|STIP1_HUMAN 0,8 1,0
sp|P26641|EF1G_HUMAN 0,8 0,8
sp|P40227|TCPZ_HUMAN 0,8 0,7
sp|P23396|RS3_HUMAN 0,8 0,6
sp|P11216|PYGB_HUMAN 0,7 0,6
sp|P22102|PUR2_HUMAN 0,7 0,8
sp|P08238|HS90B_HUMAN 0,7 0,7
sp|P32119|PRDX2_HUMAN 0,7 0,6
sp|P50990|TCPQ_HUMAN 0,7 0,9
sp|P11142|HSP7C_HUMAN 0,6 0,9
sp|P17987|TCPA_HUMAN 0,6 0,4
sp|P13639|EF2_HUMAN 0,6 0,8
sp|Q06830|PRDX1_HUMAN 0,5 0,9
sp|P62826|RAN_HUMAN 0,5 0,9
sp|Q13263|TIF1B_HUMAN 0,5 1,1
sp|P09211|GSTP1_HUMAN 0,5 0,6
sp|P68371|TBB4B_HUMAN 0,5 2,0
sp|P10599|THIO_HUMAN 0,1 0,8
ProteinStandard
approach ratio
Fully reduced
control ratio
73
Thus, in order to extent the quantification approach to both the initially reduced
and oxidized forms of specific proteins in both samples (M2 and M2T), for three
biological replicates we tried parallel experiments in which both samples have not
been treated with NEM (i.e. no free thiol blocking), but, directly reduced and
labelled with EZ-Link HPDP biotin. This approach was aimed at quantifying
ideally all the accessible-cysteine-containing proteins in the sample in order to
give some information on total protein quantity for those proteins already being
quantified in respect to their redox status.
It has not been possible to obtain information for all of the proteins reported at §
4.2.1, mainly because in the “totally reduced” controls the sample contains much
more proteins than in the standard approach so that protein-protein interactions
may have partially altered sample behaviour during purification and because data
in this case are gathered from only three biological replicates in respect to the full
six experiments set of the standard approach. Anyway preliminary results from
this approach are reported in Tab. 4.e.
4.2.4 Mapping of specific modifications
The issue of quantifying oxidized proteins in a complex sample and to precisely
map the amino-acidic residues involved into such modification are usually two
different tasks and different approaches are required to pursue them. Indeed
mapping of specific modifications along protein sequence requires a complex and
not computer-assisted analysis of thousands of mass data from MS/MS spectra:
moreover such analysis often requires highly purified and abundant sample in
order to get better results. Nevertheless, in our experimental approach, the use of
different labels in sequence made us able to distinguish cysteine-residue thiols
which were in the reduced or oxidized status in the original sample: thus by
considering Cys residue monoisotopic mass (103.00919) and possible delta-mass
for this residue from NEM-adduct (+125.047679) or IAM-adduct (+57.021464)
we could highlight formerly reduced or oxidized Cysteine residues in identified
proteins. Of course the “ideal” situation would require considering the possible
concomitant presence of other modifications on different residues along Cys-
containing identified peptides, like Methionine or Proline oxidation, NEM
hydrolysis products, and many others. But it is not so feasible to simultaneously
search thousands of fragmentation mass data in a combinatorial manner for
multiple modifications since this would both incredibly raise the computational
load and lower the statistical significance of matched values. Thus we choose to
limit the number of considered modifications to those introduced by us
(NEM/IAM) plus the known and frequent oxidation of methionine (reference to
www.unimod.org: accession #108, #4 and #35 specificity definition 8). Moreover
we pursued an approach in which a complex sample has been digested without
pre-emptive denaturation, thus it is understandable that we could not reach
extensive modification coverage for all of the identified proteins.

74
Mapped modifications for the enzyme glucose-6-phosphate dehydrogenase are
reported as an example in Tab. 4.f. We also identified oxidized cysteine-residues
(C22114 and C22117) in the big protein Mucin-16 and mapped them next to the small
intracellular domain spanning from residue 22118 to residue 22152: the
intracellular domain enclose also the C-terminus of MUC16 which is known to be
phosphorylated in order to induce proteolytic cleavage and liberation of the
extracellular domain. Many reversible oxidations have also been mapped to the
extracellular domain of the protein Usherin: C572 C574 C576 C694 C696 C708 C715 C717
C726 C729 C844 C847 C849 C1050. Usherin is known to contain many laminin EGF-
like domains in this region, required for interaction with collagen IV and
fibronectin (information have been retrieved from protein database Uniprot a
twww.uniprot.org).
Tab. 4.f Sequence of glucose-6-phosphate dehydrogenase is reported in (A): peptides identified
by MS/MS are reported in red and two peptides containing cysteine-residues with thiol group
oxidized in M2T sample are highlighted in yellow. Table with all identified peptides, retention
time (Rt) in seconds, mass to charge ratio (m/z) and charges (z) characteristics is reported in (B).
(A)
(B)
Peptide Rt m/z Z
LQFHDVAGDIFHQQC(Carbamidomethyl)K 1994,52 486,488 4
LKLEDFFAR 2294,46 380,211 3
KPGMFFNPEESELDLTYGNR 2286,24 782,036 3
GYLDDPTVPR 1602,36 566,787 2
DNIAC(Carbamidomethyl)VILTFK 2679,6 647,344 2
LFYLALPPTVYEAVTK 2977,02 913,012 2
DGLLPENTFIVGYAR 2412,9 832,939 2
(Acetyl)AEQVALSR 1697,82 458,246 2
GGYFDEFGIIR 2467,8 637,316 2
LPDAYER 1223,4 432,217 2
VQPNEAVYTK 1440,6 574,8 2
GPTEADELMK 1421,88 545,76 2
LSNHISSLFR 1869,42 391,884 3
EMVQNLMVLR 2273,88 616,828 2
MAEQVALSRT QVCGILREEL FQGDAFHQSD THIFIIMGAS GDLAKKKIYP TIWWLFRDGL
LPENTFIVGY ARSRLTVADI RKQSEPFFKA TPEEKLKLED FFARNSYVAG QYDDAASYQR
LNSHMNALHL GSQANRLFYL ALPPTVYEAV TKNIHESCMS QIGWNRIIVE KPFGRDLQSS
DRLSNHISSL FREDQIYRID HYLGKEMVQN LMVLRFANRI FGPIWNRDNI ACVILTFKEP
FGTEGRGGYF DEFGIIRDVM QNHLLQMLCL VAMEKPASTN SDDVRDEKVK VLKCISEVQA
NNVVLGQYVG NPDGEGEATK GYLDDPTVPR GSTTATFAAV VLYVENERWD GVPFILRCGK
ALNERKAEVR LQFHDVAGDI FHQQCKRNEL VIRVQPNEAV YTKMMTKKPG MFFNPEESEL
DLTYGNRYKN VKLPDAYERL ILDVFCGSQM HFVRSDELRE AWRIFTPLLH QIELEKPKPI
PYIYGSRGPT EADELMKRVG FQYEGTYKWV NPHKL

75
IIVEKPFGR 1559,04 529,823 2
QSEPFFK 1595,7 441,722 2
KRNELVIRVQPN 2654,58 367,222 4
LNSHMNALHLGSQANR 1436,28 441,476 4
4.3 Redox environment of M2 and M2T cell lines
Beside the quantification of differentially modified proteins we also measured the
global redox environment of M2 and M2T sample: DTNB assay on total lysate
samples allow to measure total SH content, that is to say free thiol-groups from
both proteins and soluble molecules like glutathione. Reduced thiol content has
been measured on six independent samples set obtaining 212.38 ± 9.38 nmol
[SH]/mGr [proteins] and 232.21 ± 10.21 nmol [SH]/mGr [proteins] respectively
for M2 and M2T total thiol content. Similarly we obtained 106.56 ± 13.78 nmol
[SH]/mGr [proteins] and 138.42 ± 13.41 nmol [SH]/mGr [proteins] respectively
for M2 and M2T protein-thiol content. Those data describe a redox environment
slightly more reduced into the more malignant M2T cell line in respect to M2
counterpart (Fig. 4.o).
4.4 G6PDH activity
After identification of glucose-6-phosphate dehydrogenase between the group of
proteins more oxidized into M2T over M2 cells and given its known role as main
intracellular source of reducing equivalents in the form of NADPH, we evaluated
its enzymatic activity in our samples (Fig. 4.p). Mean specific activity for M2 is
126.13 ± 23.79 and M2T mean specific activity is 352.27 ± 83.13. So a near three-
fold difference is appreciable in favour of the more malignant cells. Anyway
specific activity doesn’t tells us if the enzyme is more active or just more
expressed into M2T cells, but looking at both “totally reduced controls” (§ 4.2.3)
and western blot results hereafter (§ 4.4.2) it is reasonable to consider that there is
a contribution to the higher activity from both oxidized status and enzyme
abundance.
4.4.1 G6PDH activity is affected by redox status
Since we found a ratio (M2T/M2) for oxidized G6PDH highly favourable to M2T
cells and a corresponding higher activity in the same cells, we tested the effect of
reduction on enzymatic activity (Fig. 4.q): at a concentration of 1mM DTT is able
to reduce G6PDH specific activity to nearly 50-60% of the original activity in
both M2 and M2T samples.
Moreover, to evaluate if this inhibitory effect was due to reversible reduction of
protein thiol groups switching from oxidized to reduced status, we reduced the
enzyme with 1mM DTT and then removed the reducing agent before measuring

76
activity: G6PDH activity was restored to nearly 65-70% of its original value. So it
turns out that keeping G6PDH reduced lower its activity more than reducing the
enzyme and leaving it without reducing agent (less than 3 minutes). This could
means that involved thiol groups are quite reactive and re-oxidize very fast, so
good candidates as redox switches (Fig. 4.r).
Finally, given the above hypothesis, we also reduced the enzyme and blocked it
with 1mM NEM right after reduction. Measured activity in this case drop to as
low as 25-30% of original activity, despite DTT and NEM removal from the
sample. Clearly this is suggestive of the fact that preventing the re-oxidation of
specific cysteine residues in G6PDH decreases enzymatic activity (Fig. 4.r).
Fig. 4.o Soluble and protein free thiol content of M2T and M2 cells Histograms summarizing measured total (protein + soluble): upper plot and protein: lower plot,
thiol content of cellular lysates from M2 and M2T samples. Observed difference is more marked
looking at the protein-thiol content and even if not so big it stress a slightly more reduced
intracellular environment for the more malignant M2T cell line.
0
50
100
150
200
250
nm
ol/
mgr
Total [SH]
M2 M2T
0
50
100
150
200
250
nm
ol/
mgr
Protein [SH]
M2 M2T
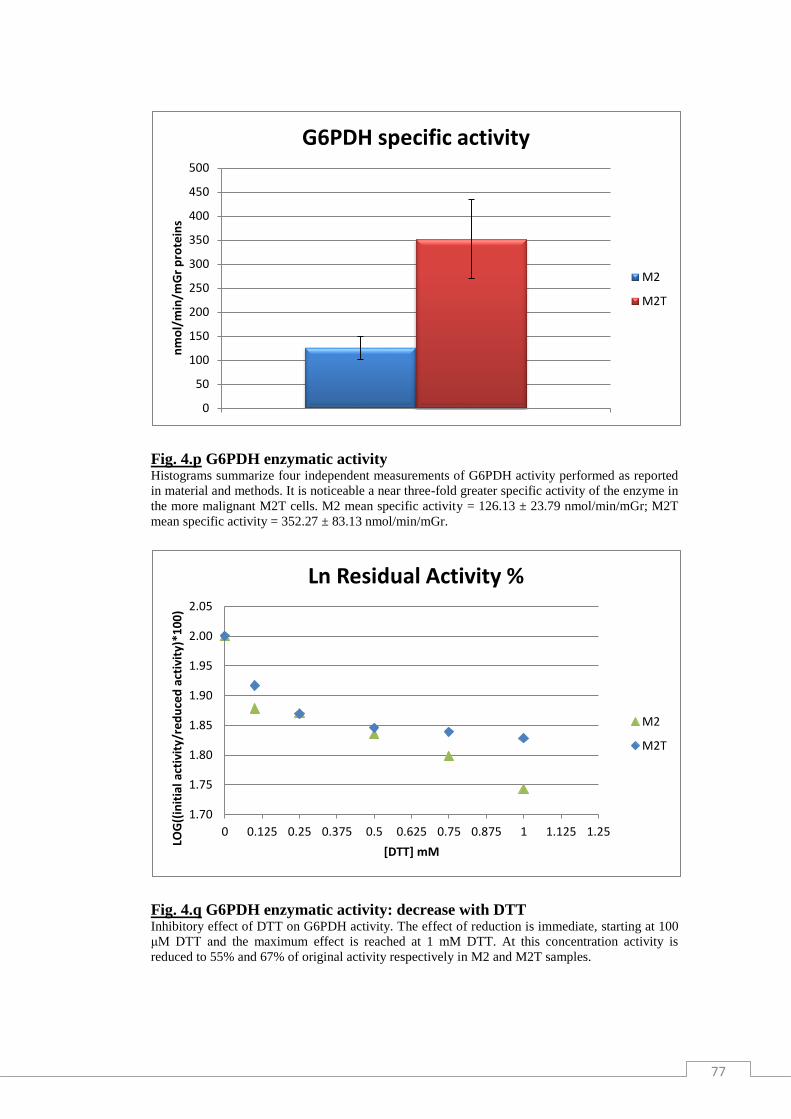
77
Fig. 4.p G6PDH enzymatic activity Histograms summarize four independent measurements of G6PDH activity performed as reported
in material and methods. It is noticeable a near three-fold greater specific activity of the enzyme in
the more malignant M2T cells. M2 mean specific activity = 126.13 ± 23.79 nmol/min/mGr; M2T
mean specific activity = 352.27 ± 83.13 nmol/min/mGr.
Fig. 4.q G6PDH enzymatic activity: decrease with DTT Inhibitory effect of DTT on G6PDH activity. The effect of reduction is immediate, starting at 100
μM DTT and the maximum effect is reached at 1 mM DTT. At this concentration activity is
reduced to 55% and 67% of original activity respectively in M2 and M2T samples.
0
50
100
150
200
250
300
350
400
450
500n
mo
l/m
in/m
Gr
pro
tein
s
G6PDH specific activity
M2
M2T
1.70
1.75
1.80
1.85
1.90
1.95
2.00
2.05
0 0.125 0.25 0.375 0.5 0.625 0.75 0.875 1 1.125 1.25
LOG
((in
itia
l act
ivit
y/re
du
ced
act
ivit
y)*1
00
)
[DTT] mM
Ln Residual Activity %
M2
M2T

78
Fig. 4.r G6PDH enzymatic activity: decrease with DTT and NEM Histograms summarize the effects of inhibition with 1mM DTT on G6PDH activity. All specific
activities have beennormalized to their own starting activity as percent values (M2 = 87.43
nmol/min/mGr proteins and M2T = 285.70 nmol/min/mGr proteins). In “DTT 1mM removed” the
reducing agent has been removed immediately before measuring activity giving 74% and 65%
residual activity respectively for M2 and M2T. In “DTT 1mM left” the sample has been kept
reduced throughout the test, giving 42% and 54% residual activity for M2 and M2T samples
respectively. Finally, in “DTT 1mM NEM 1mM” samples have been blocked with NEM right
after reduction with DTT and after removal of residual DTT and NEM activity assay demonstrated
as low as 33% and 28% residual activity for M2 and M2T samples respectively.
4.4.2 G6PDH reduced and oxidized forms
Given the observations on the different degree of oxidized G6PDH between M2T
and M2 samples and the effect of reduction and reduction/alkylation on enzymatic
activity, we then evaluated the presence of different forms of the enzyme by
means of western blot in reducing and non-reducing conditions (Fig. 4.s).
Fig. 4.s G6PDH oxidized/reduced isoforms
0%5%
10%15%20%25%30%35%40%45%50%55%60%65%70%75%80%85%90%95%
100%105%
control DTT 1mMremoved
DTT 1mM left DTT 1mMNEM 1mM
Residual activity %
Specific activity % M2
Specific activity % M2T
Anti-G6PDH
+red.
M2 M2T
-red.
M2 M2T
reduction
Anti-GAPDH
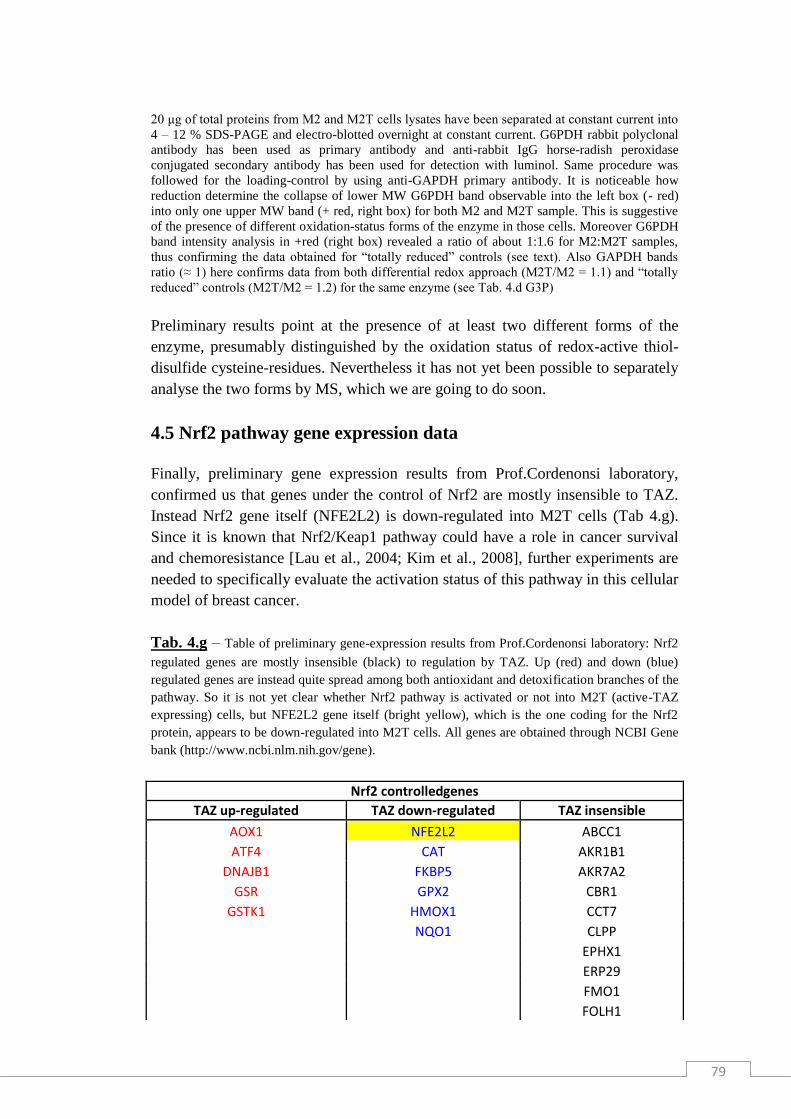
79
20 μg of total proteins from M2 and M2T cells lysates have been separated at constant current into
4 – 12 % SDS-PAGE and electro-blotted overnight at constant current. G6PDH rabbit polyclonal
antibody has been used as primary antibody and anti-rabbit IgG horse-radish peroxidase
conjugated secondary antibody has been used for detection with luminol. Same procedure was
followed for the loading-control by using anti-GAPDH primary antibody. It is noticeable how
reduction determine the collapse of lower MW G6PDH band observable into the left box (- red)
into only one upper MW band (+ red, right box) for both M2 and M2T sample. This is suggestive
of the presence of different oxidation-status forms of the enzyme in those cells. Moreover G6PDH
band intensity analysis in +red (right box) revealed a ratio of about 1:1.6 for M2:M2T samples,
thus confirming the data obtained for “totally reduced” controls (see text). Also GAPDH bands
ratio (≈ 1) here confirms data from both differential redox approach (M2T/M2 = 1.1) and “totally
reduced” controls (M2T/M2 = 1.2) for the same enzyme (see Tab. 4.d G3P)
Preliminary results point at the presence of at least two different forms of the
enzyme, presumably distinguished by the oxidation status of redox-active thiol-
disulfide cysteine-residues. Nevertheless it has not yet been possible to separately
analyse the two forms by MS, which we are going to do soon.
4.5 Nrf2 pathway gene expression data
Finally, preliminary gene expression results from Prof.Cordenonsi laboratory,
confirmed us that genes under the control of Nrf2 are mostly insensible to TAZ.
Instead Nrf2 gene itself (NFE2L2) is down-regulated into M2T cells (Tab 4.g).
Since it is known that Nrf2/Keap1 pathway could have a role in cancer survival
and chemoresistance [Lau et al., 2004; Kim et al., 2008], further experiments are
needed to specifically evaluate the activation status of this pathway in this cellular
model of breast cancer.
Tab. 4.g – Table of preliminary gene-expression results from Prof.Cordenonsi laboratory: Nrf2
regulated genes are mostly insensible (black) to regulation by TAZ. Up (red) and down (blue)
regulated genes are instead quite spread among both antioxidant and detoxification branches of the
pathway. So it is not yet clear whether Nrf2 pathway is activated or not into M2T (active-TAZ
expressing) cells, but NFE2L2 gene itself (bright yellow), which is the one coding for the Nrf2
protein, appears to be down-regulated into M2T cells. All genes are obtained through NCBI Gene
bank (http://www.ncbi.nlm.nih.gov/gene).
Nrf2 controlledgenes
TAZ up-regulated TAZ down-regulated TAZ insensible
AOX1 NFE2L2 ABCC1
ATF4 CAT AKR1B1
DNAJB1 FKBP5 AKR7A2
GSR GPX2 CBR1
GSTK1 HMOX1 CCT7
NQO1 CLPP
EPHX1
ERP29
FMO1
FOLH1

80
FOLH1B
FTH1
FTL
GCLC
HERPUD1
HIP2
HSP90AA1
HSPB8
HSPB8
PPIB
PPIG
PRDX1
PTPLAD1
SCARB1
SH2B1
SLC35A2
SOD1
SQSTM1
STIP1
TXN
TXNRD1
UBB
USP14 VCP

81
5. DISCUSSION
5.1 Redox proteomics: a technical challenge
Modification of cysteine residues has emerged as a significant mechanism for
alteration of the structure and function of many proteins: indeed a broad range of
reactions that occur to the protein cysteine thiol groups plays key signalling roles
in a range of physiological and pathological processes (see chapter 1 for some
examples). Additionally, some of these cysteine modifications are reversible
through thioredoxin and glutathione systems [Bindoli et al., 2008]. Reversible
thiol modifications include glutathionylation, mixed disulfide formation with low
molecular weight thiols, sulfenic acid formation, S-nitrosation/nitrosylation, S-
acylation, sulfenylamide formation and the generation of intra/inter-protein
disulfides [Chouchani et al., 2011 and references therein]. Moreover, proteins
affected by such modifications in a signalling context are reasonably only a small
fraction of the whole cellular proteome, thus rising concentration dynamic-range
issues.
During the last decade technological development bolstered the efforts in the field
of redox proteomics, that is to say, in the search for reliable methods to identify
both the proteins and residues affected by redox modifications, to determine the
nature of the modification to the cysteine residue and to quantify the extent of the
modification during redox signalling.
5.1.1 General strategies to screen for protein thiol modifications
Many thiol modifications on cysteine residues are relatively labile and thiols
themselves are prone to artifactual modification during protein isolation and
handling. Therefore and essential prerequisite for reliable screening for protein
thiol modifications in biological samples is the efficient trapping of the native
redox status of the thiol proteome. There are three general approaches used for the
labelling of cysteine residues for proteomic studies (Fig. 5.a).
Loss of selective labelling due to thiol modification
Protein thiols are alkylated with a thiol specific probe that contains a reporting
group that enables the labelled thiols to be detected: the loss of this signal is
assessed as an indication of protein thiol modification. Control labelled protein
samples can be separated by electrophoresis, or derived peptides are separated by
LC-MS, and compared with related samples prepared under stressed or oxidant
conditions: probe signal loss between conditions is indicative of both reversibly
and irreversibly modified protein thiols [Couchani et al., 2011]. This is a simple
but limited strategy relying on measuring signal loss, instead of signal increase

82
over baseline and a significant limitation to the sensitivity of this approach came
from the fact that most intracellular protein thiols are maintained in a reduced
status by glutathione and thioredoxin systems. Nevertheless, this method can be
adapted to detect only irreversible protein thiol modifications by the treatment of
samples with a thiol-reductant before labelling: in this case any signal loss would
be attributable to irreversibly oxidized thiols.
Fig. 5.a General strategies to screen for protein thiol modifications General strategies for the identification of redox active cysteine residues. (a) The proteome can be
assessed from the entire cell, or a particular subcellular fraction enriched before cysteine labeling.
Alternatively, organelle-targeted compounds can be used to elicit an organelle specific effect. (b)
Three general strategies are employed for the labeling of redox active cysteines (orange protein
thiol): (Top) Unmodified cysteine residues are labeled with a detectable probe (red probe) while
modified cysteines are not labeled. The decrease of labeling indicates the extent of modification.
(Middle) To label reversibly modified cysteine residues, all unmodified cysteines are first blocked
by reaction with a thiol reagent such as NEM. Then reversibly modified cysteines are selectively
reduced and labeled with a detectable probe (red probe). (Bottom) To label a particular type of
cysteine modification, such as a sulfenic acid, a chemoselective probe that reacts only with the
modified cysteine is used (red probe). (c) Subsequent separation and identification of the proteins
containing selectively labeled cysteine residues. (Top) LC/MS or LC/MS/MS methods to separate
and identify labeled peptides. (Middle) Gel-based separation of proteins, often followed by LC/MS
or LC/MS/MS methods to separate and identify labeled peptides. (Bottom) Methods to detect a
chemo-specific probe. [From Chouchani et al., 2011]
Selective reduction of reversible protein thiol modifications
By this strategy, all unmodified thiols are derivatized with a thiol reagent such as
NEM. This is followed by the selective reduction and labelling of all reversibly
modified cysteine residues with a thiol probe: all redox-sensitive cysteine residues
will be labelled and screened for, regardless of the nature of the reversible
modification. Anyway, given the considerable interest in differentiating between
different types of reversible cysteine modifications, some variations of this
approach have been developed over time: the main differences in redox-
modifications “selection” rely on the reduction step, right after blocking of
natively unmodified thiols. As an example, the strategy for identification of S-
nitrosated protein thiols involves the selective reduction of protein S-nitrosothiols
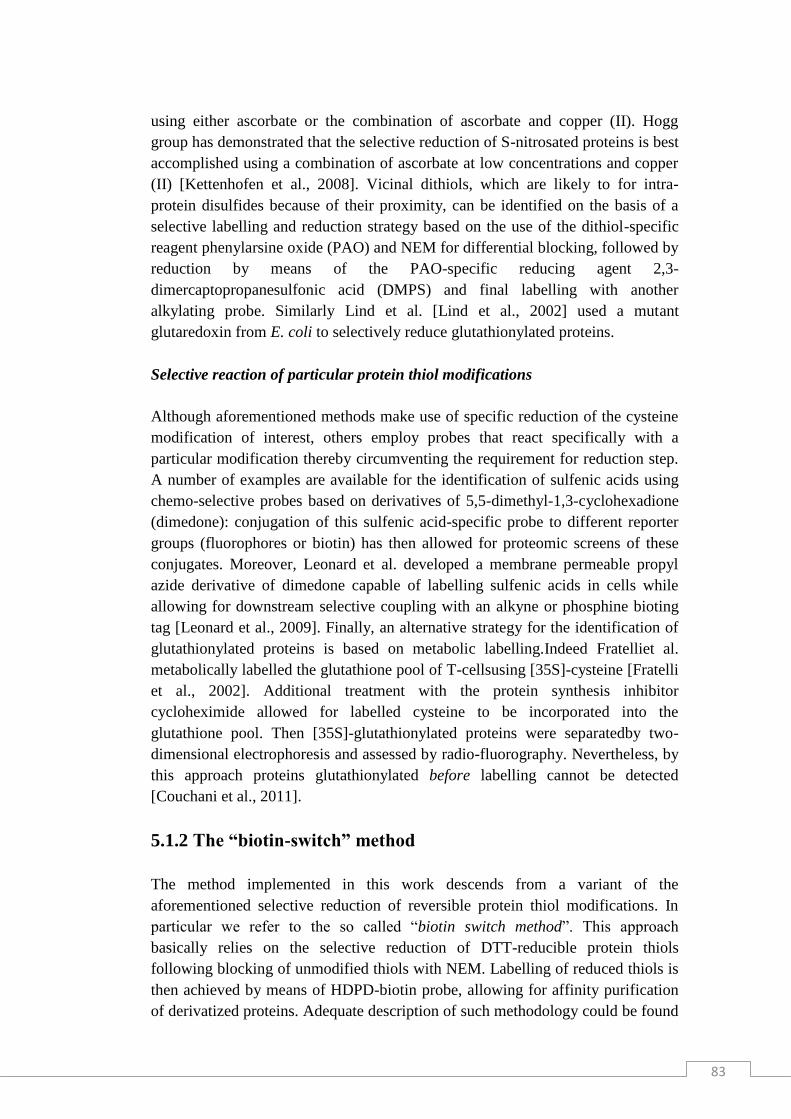
83
using either ascorbate or the combination of ascorbate and copper (II). Hogg
group has demonstrated that the selective reduction of S-nitrosated proteins is best
accomplished using a combination of ascorbate at low concentrations and copper
(II) [Kettenhofen et al., 2008]. Vicinal dithiols, which are likely to for intra-
protein disulfides because of their proximity, can be identified on the basis of a
selective labelling and reduction strategy based on the use of the dithiol-specific
reagent phenylarsine oxide (PAO) and NEM for differential blocking, followed by
reduction by means of the PAO-specific reducing agent 2,3-
dimercaptopropanesulfonic acid (DMPS) and final labelling with another
alkylating probe. Similarly Lind et al. [Lind et al., 2002] used a mutant
glutaredoxin from E. coli to selectively reduce glutathionylated proteins.
Selective reaction of particular protein thiol modifications
Although aforementioned methods make use of specific reduction of the cysteine
modification of interest, others employ probes that react specifically with a
particular modification thereby circumventing the requirement for reduction step.
A number of examples are available for the identification of sulfenic acids using
chemo-selective probes based on derivatives of 5,5-dimethyl-1,3-cyclohexadione
(dimedone): conjugation of this sulfenic acid-specific probe to different reporter
groups (fluorophores or biotin) has then allowed for proteomic screens of these
conjugates. Moreover, Leonard et al. developed a membrane permeable propyl
azide derivative of dimedone capable of labelling sulfenic acids in cells while
allowing for downstream selective coupling with an alkyne or phosphine bioting
tag [Leonard et al., 2009]. Finally, an alternative strategy for the identification of
glutathionylated proteins is based on metabolic labelling.Indeed Fratelliet al.
metabolically labelled the glutathione pool of T-cellsusing [35S]-cysteine [Fratelli
et al., 2002]. Additional treatment with the protein synthesis inhibitor
cycloheximide allowed for labelled cysteine to be incorporated into the
glutathione pool. Then [35S]-glutathionylated proteins were separatedby two-
dimensional electrophoresis and assessed by radio-fluorography. Nevertheless, by
this approach proteins glutathionylated before labelling cannot be detected
[Couchani et al., 2011].
5.1.2 The “biotin-switch” method
The method implemented in this work descends from a variant of the
aforementioned selective reduction of reversible protein thiol modifications. In
particular we refer to the so called “biotin switch method”. This approach
basically relies on the selective reduction of DTT-reducible protein thiols
following blocking of unmodified thiols with NEM. Labelling of reduced thiols is
then achieved by means of HDPD-biotin probe, allowing for affinity purification
of derivatized proteins. Adequate description of such methodology could be found

84
in the works on the yeast Saccharomyces cerevisiaeredoxome by McDonagh et al.
and LeMoan et al. [McDonagh et al., 2010; McDonagh et al., 2009, Le Moan et
al., 2005] (Fig. 5.b).
Fig. 5.b Schematic representation of the “biotin-switch” method Figure is adapted from McDonagh et al. [McDonagh et al., 2011] and summarize the main steps of
the biotin-switch method for redox proteome analysis. The crucial difference in respect our
method rely on both the affinity chromatography performed on peptides rather than on intact
proteins and on the denaturing conditions adopted through the whole procedure.
5.2 Innovative procedure for redox proteomics
In respect to other mentioned “fractional-reduction” / differential-labelling
methods reported, our approach shares with the biotin-switch method the
advantage of affinity-purification of modified-proteins of interest. Indeed, LC-MS
analysis of complex samples would otherwise contain a significant background
from non-cysteine and unlabelled cysteine containing proteins. Moreover the
chemical labelling adopted here is undoubtedly cost-effective in respect to
isotope-based labelling methods.

85
So the main differences in respect to “traditional” biotin-switch method reside in
(1) differential labelling of the proteins is performed in non-denaturing conditions
and (2) affinity purification by means of HPDP-biotin/Neutravidin interaction is
done on intact proteins and not on peptides (i.e. tryptic digestion is performed
after sample purification) (3) HPDP-labelled thiols are labelled after reductive-
elution from neutravidin by means of IAM. Basically the use of non-denaturing
conditions should allow for specific reduction of solvent accessible oxidized
thiols: indeed it is commonly accepted that whether a modification takes place
depends on a number of factors including the local environment of the cysteine
residue, it proximity to the relevant reactive species, its pKa, subcellular
localization and solvent exposure [Chouchani et al., 2011 and references therein].
Moreover, the choice to purify modified thiols-containing proteins rather than
redox-modified peptides is intended to allow further application of MS and
MS/MS analysis in order to identify and quantify the extent of modification across
samples to be compared. Instead the chromatographically less burdensome
approach of redox “peptidome” [McDonagh et al., 2011] analysis is not
compatible with our choice to implement further label-free computational
analysis. Finally, the “double-labelling” step HDPD-IAM on redox-modified
thiols proven valuable in order both to avoid further thiols artifactual (re)oxidation
and to precisely map modified (IAM-labelled) and unmodified (NEM-labelled)
thiols by MS/MS.
Unmodified thiols blocking
The status of protein thiols, as well as that of other redox pairs involved in their
equilibrium, may be very different in distinct cellular compartments. Thus it is
important to block the thiols status to try to detect the actual status of specific
protein thiols, avoiding reactions that could affect them during extraction, either
those due to the cross-contamination of different compartments or those involving
oxidation due to sample handling (metal catalysed oxidation, contact with ambient
air). One way of “freezing” the original status of thiols is by using TCA during the
extraction to precipitate the protein samples [Izquierdo-Álvarez et al., 2011],
alternatively, the blocking reagent can be added to the lysis buffer. This latter is
the way we choose in reason of the required characterization of modified protein-
thiols: indeed NEM-modified thiols (+125.047679) can be distinguished from
IAM modified (+57.021464) (see above). Among the possible blocking agents,
NEM is more efficient than IAM or IAA because it completely blocks free thiols
at a lower concentration, in less time and is effective at pH values lower than 8
[Rogers et al., 2006]. Since we performed the lysis of our samples in pH 7.4
buffer, blocking of native-unmodified thiols with a [SH]:[NEM] ratio of 2 for 90’
proved to be valuable to protect solvent-accessible free thiols in the sample.
Moreover lower pH value and shorter reaction times helped in avoiding NEM
reaction with lysine residues. Finally, analysis of NEM-blocked and HPDP treated

86
samples without pre-emptive DTT reduction shown low false-positive and
confirmed effective blocking step (data not shown).
Selective reduction
When indirect or double labelling is performed, oxidised thiols are reduced to free
thiols before the second labelling step (with HPDP). Generally two groups of
chemical reagents are used for this: reduced thiols, especially DTT, the reaction of
which is thermodynamically favoured by the formation of its cyclic intra-
molecular disulfide bond; and trialkylphosphines (TCEP). Since the presence of
both of them in the labelling process impairs the attachment of the second probe
to the thiols groups released, we need to remove the reducing agent before
performing the labelling reaction with HPDP. This is why we preferred DTT
instead of TCEP, despite higher reducing power and broader pH range-action:
indeed we assessed the efficacy of reagent removal through desalting columns and
TCEP demonstrated to be harder to remove, compromising HPDP further
labelling. Thus we optimized DTT concentration by evaluating (by fluorescent-
labelling of reduced thiols) the minimal amount (data not shown) and time
required to fully reduce NEM-unreacted protein-thiols in the sample. DTT
removal by means of buffer exchange was then confirmed with DTNB assay.
Affinity purification
Given the need for subsequent relative-quantification analysis by MS on extracted
proteins, we choose to perform neutravidin-biotin HPDP affinity purification on
intact proteins rather than on peptides (see above). Moreover we kept non-
denaturing conditions throughout the reductive-elution step and subsequent IAM
labelling so to avoid misleading reduction and labelling of potentially buried
oxidised-thiols, which are not expected to be subject to functional redox
switching. Thus elution volumes and time have been carefully evaluated to
minimize samples variability: 5 mL along 10’ proved sufficient to collect
specifically bound proteins. Moreover further analysis confirmed that all proteins
identified by this approach bear at least one cysteine residue in their sequence
(even though not always the exact IAM-modified cys-containing peptide has been
detected by MS/MS analysis – see after herein).
5.2.1 Label-free approach: computational analysis
It is nowadays clear the compelling need in the life sciences for studying of
biological entities at the system level. In turn this requires analytical tools capable
of identifying the component parts of the system and of measuring their responses
to a changing environment. To this aim many classical proteomics quantification
methods utilizing dyes, fluorophores, or radioactivity have provided very good

87
sensitivity, linearity and dynamic range, but they suffer from two important
shortcomings: first, they require high-resolution protein separation typically
provided by 2D gels, which limits their applicability to abundant and soluble
proteins; and second, they do not reveal the identity of the underlying protein
[Bantscheff et al., 2007]. Both of these problems are overcome by modern LC-
MS/MS techniques and three main methods have been made available to perform
quantitative LC-MS analysis: (1) quantification by spectral counting, (2)
quantification via differential stable isotopic labelling, and (3) quantification by
using the ion current in label-free measurements.
An obvious reason for choosing label-free approach over isotopic labelling is its
cost-effectiveness. Among label-free quantification strategies, two widely used
and fundamentally different approaches can be outlined: (a) measuring and
comparing the mass spectrometric signal intensity of peptide precursor ions
belonging to a particular protein and (b) counting and comparing the number of
fragment spectra identifying peptides of a given protein. We will name the former
“features quantification” and the latter “spectral counting”. In-depth analysis of
both methodologies is beyond the topic of this discussion and exhaustive reviews
can be found in Bantscheff and Mueller [Bantscheff et al., 2007, Mueller et al.,
2008].
The choice of the features quantification approach
Briefly, the spectral counting approach is based on the empirical observation that
the more of a particular protein is present in a sample, the more MS/MS spectra
are collected for peptides of that protein. Thus, in contrast to quantification by
peptide ion intensities, spectral counting benefits from extensive MS/MS data
acquisition across the chromatographic time scale both for protein identification
as well as protein quantification. Nevertheless, this represents also an intrinsic
limit for this methodology, since the only peptides which will be quantified are
the ones selected for fragmentation. Even at the scan rate of 3 spectra/second for
MS/MS we adopted, and given the removal of noisy non-cys containing proteins
from the sample prior to digestion (see above), spectral counting approach would
result in poor sampling for accurate quantification. Indeed, such methodology is
often coupled to hardware-burdensome 2D-LC pre-emptive to injection into the
mass spectrometer. Moreover, to improve sampling (fragmentation) of lower
abundant peptides, we took advantage of MS/MS dynamic exclusion after 2
spectra for 30’’, thus increasing the number of peptides and proteins identified.
Nevertheless dynamic exclusion violates in principle the random sampling
approach required for spectral counting and its impact on quantification is still
controversial. Indeed some authors state it is detrimental for accurate
quantification [Old et al., 2005] while other show that it can be generally useful
[Zhang et al., 2006, Zhang et al., 2009]. Our feature quantification approach does
not suffer from the application of dynamic exclusion. In our approach peptide
88
signals are detected at the MS level and distinguished from chemical noise
through their characteristic isotopic pattern. These patterns are then tracked across
the retention time dimension and used to reconstruct a chromatographic elution
profile of the peptide mass. It is worth to note that in this case the signal area
integration within the mass spectrum utilize the sum of the areasof all the
isotopomers of a peptide. This methodology despite being harder to implement
computationally, is more sensitive and accurate in respect to the use of just the
mono-isotopic peak area. The total ion current of the peptide mass, from now on
called featureis then integrated and used as a quantitative measurement of the
original peptide concentration. The extracted features are then mapped across
multiple LC-MS measurements using their coordinates on the m/z and Rt
dimension. All the workflow has been set-up to a good configurability and
automation level based on OpenMS open source tools as reported in chapter 3,
and we are looking forward to implement user-friendly graphical interface for
larger usability too.
Reproducibility and relative-quantification criteria
Basically, the approach outlined here relies on reproducible LC separation of
peptides across samples to be compared and gathering of high resolution MS data
in order to generate (m/z;Rt;intensity) three dimensional raw maps from which
features are extracted, aligned and quantified. Good accuracy of the steps involved
is demonstrated in Fig. 4.i, giving < 5 seconds and < 0.014 Da differences among
pairwise aligned features across samples to be compared. Multiple search engine
of MS/MS data against a protein database enriched with commonly known
crap/contaminant proteins and decoy strings is then used to obtain identification
data (peptide-spectrum matches PSM) for peptides in the sample. False discovery
rate and in turn posterior error probability are calculated for each result and used
to filter unreliable matches. Peptide identification information are then merged to
features intensities (relative-quantitative information) and multiple peptides (three
most intense) are used to compute the relative-quantification of a protein in M2T
over M2 pairwise comparison. Moreover we took advantage of three technical
replicates for each biological replicate and multiply cross-aligned each M2T and
M2 run in order to strengthen our data: only peptides reproducibly identified in
both or in just one (i.e. presence/absence criteria) of the two samples have been
used for quantification. Thus we were able to quantify about 27% of the identified
proteins: indeed to identify and quantify a protein is a more complex task to
achieve compared to identification only. Despite the fact that missing features (i.e.
peptides missing in the quantification process) is a commonly known issue to face
with in this kind of approach, we evaluated different missing features-imputation
approaches (data not shown) and concluded that this would instead raise the
number of false positives. Finally the good linearity of peak-area based
quantification for a standard protein digest from 5 to 100 fmoles has been

89
demonstrated (Fig. 4.e) and good reproducibility of peptides relative-
quantification between pairwise samples across technical replicates was
demonstrated in the range of ± 40% variability (Fig. 4.m). Finally, we put an
effort against reduction of systematic and non-systematic variations between
experiments by raising the number of biological replicates to five, while it is not
uncommon that publications reporting results of proteomic experiments using
quantitative MS base conclusions on measurements generated in one or two
experiments [Bantscheff et al., 2007]. Higher number of replicates also helped us
to relatively-quantify lower abundant peptides: since variation of change
determination is a function of signal intensity [Bantscheff et al., 2007], we
managed to avoid harsh signal-intensity threshold and rather strengthened
measured relative-differences by virtue of their reproducibility. Paragraph 3.7.4
describes the criteria adopted through the procedure, which are in principle simply
based on averaging of ratios to aggregate multiple measurements (indeed a
criterion extensively applied and accepted in literature [Saito et al., 2007]). We
also did not introduced inter-samples intensity normalization at the computational
level: indeed after evaluation of different normalization approaches (not reported
here) we managed to obtain 100% correct under/over-expression estimates on a
benchmark sample (Fig. 4.l) without any data normalization. Moreover we took
care of rigorous pre-digestion protein-quantity normalization between samples to
be compared.
5.2.2 Limits and improvements of the approach
One of the consciously assumed limitations of this approach is that it cannot
distinguish between the specific kinds of reversible oxidation borne by the
selected cysteine residues: it could be a disulfide, rather than a glutathionylation,
oxidation to sulfenic acid or sulfhydration. Operatively speaking, we catch by this
methodology all those modification which can be reverted by DTT treatment.
Nevertheless this method could be in principle easily adapted to the study of more
or more specific oxidative modification like S-nitrosilation, by means of a
different reduction step: for example including a pre-treatment with ascorbate and
copper (see above).
Another assumed limit of the procedure we developed is that it does not allow
direct evaluation of the oxidized/reduced ratio for a given protein intra-samples.
This is due to the fact that affinity purification of oxidatively-modified cys-
containing proteins hampers quantitative evaluation of the total protein content for
given specie, which is instead prerogative of more classical MS-based quantitative
approaches. Briefly, in a single experiment we are able to state if there is more of
the oxidized form of a protein “x” in M2T sample in respect to M2 sample, but we
cannot gather information on the total content of protein “x” in each of those
samples. Nevertheless this information could be retrieved by different ways. First
we developed the so called “totally reduced” control samples (§ 4.2.3) which

90
allow us to extract all of a specific cys-containing protein from the sample by
simply avoiding the first blocking of available thiols with NEM: this provides
information on the total protein “x” content independently from its oxidation
status. Preliminary western blot (wb) data confirmed the results of this approach
for glucose-6-phosphate dehydrogenase (see results), glyceraldehyde 3-phosphate
dehydrogenase (see results) and peroxiredoxin-1 (not shown). Definitely
information on the quantity for proteins of interest could be obtained as well by
means of classical immunological approaches, thus validating results obtained by
the methodology described here.
5.3 G6PDH as putative master regulator of redox equilibrium
We applied the methodology described above to the study of a cellular model of
breast cancer derived from the breast cancer epithelial cell line MCF10A.
Particularly M2 and M2T cells have been provided us by Prof. S. Piccolo
laboratory and reproduce different grades of aggressiveness and malignancy of the
tumour. Indeed M2T cells are engineered to express a constitutive active mutant
of the transcription co-activator TAZ and reproduce higher grade malignancy and
bear higher metastasizing potential in respect to their M2 counterpart. From our
analysis 17 proteins were more oxidized into M2T cells, while 29 were more
reduced in the same cell line in respect to M2 counterpart. Moreover we were able
to quantify also other 45 redox sensitive proteins with unchanged oxidative status
between the two samples. Numerous proteins known to be transcriptionally
regulated by Nrf2 (see results) were mapped among both oxidatively unchanged
and more reduced protein groups: specifically members of the unfolded protein
response were unchanged while members of the antioxidant response were more
reduced. On the other hand, among more oxidized proteins Hemicentin,
Trophinin, Mucin-16, Usherin, and chondroitin sulphate proteoglycan share at
different levels their function into cell adhesion and interaction with the ECM. We
also mapped numerous oxidatively-modified cysteine-residues along those
proteins sequence, both into cytoplasmic phosphorylative-regulatory domain
(Mucin-16) and into EGF-like domain for the interaction with collagen (Usherin).
Another interesting protein that we found to be more oxidized into more
malignant cells was the enzyme glucose 6-phosphate dehydrogenase.
5.3.1 Cancer metabolism and ECM detachment
The initial recognition that cancer cells exhibit atypical metabolic characteristics
can be traced to the work of Otto Warburg over the first half of the twentieth
century [Koppenol et al., 2011]. Indeed, in the presence of oxygen, cells from
most normal tissues use glucose through glycolysis producing pyruvate, and this
is in turn mostly oxidized as Acetyl-CoA in mitochondria through the respiratory
chain. On the other hand, in anaerobic conditions, normal tissues reduce pyruvate
91
from glycolysis to lactate, driving it away from mitochondrial oxidative
phosphorylation. Then, in contrast to normal cells, rapidly proliferating ascites
tumours metabolize pyruvate to lactate even in the presence of oxygen, despite the
fact that this is energetically less “convenient” for the cell with respect to
mitochondrial oxidation (almost 18-fold less ATP net production). It is still quite
controversial if such metabolic switch is driven by impaired mitochondrial
function in tumour cells, since it has been demonstrated that this organelle is still
viable and functional even in cancer cells [de Oliveira et al., 2012]. Indeed
neoplastic cells fermentative metabolism of glucose in the presence of oxygen has
been proposed to serve more predominantly toward supporting biomass
accumulation and redox maintenance in proliferating cells rather than to energetic
functions [Cantor et al., 2012]. In this view glycolysis is interconnected with other
metabolic pathways for synthesis of cellular building blocks: for example
fructose-6-phosphate and glyceraldehyde-3-phosphate may be shunted into the
non-oxidative arm of the pentose phosphate pathway (PPP) to generate ribose-5-
phosphate (precursor in nucleotide biosynthesis). Alternatively glucose-6-
phosphate can feed into the oxidative arm of the PPP to generate both ribose-5-
phospahte and NADPH, which contributes to the cellular defence against
oxidative stress. Oxidative stress is the rather generic term often used to describe
an unbalance in cellular redox-homeostasis toward more oxidizing conditions.
Even the role of this redox unbalance is not completely understood in reference to
tumour etiology and progression: while oxidative DNA damage (see introduction
too) could be culprit of the onset of genetic changes leading to neoplastic
transformation, it seems that tumour cells need to raise some sort of defences
against such oxidative stress in order to survive. Hence we can find a role for PPP
activation in cancer. Nevertheless, focusing on the metabolic switch hallmark of
tumour cells, it has been reported that also tumours developed in hypoxic
environments have high glycolytic activity: in this case hypoxia can induce
glycolysis and repress mitochondrial respiration to reduce oxygen consumption
through hypoxia-inducible factor 1 (HIF-1). Moreover in hypoxic conditions
mitochondria are reported to increase the production of superoxide (i.e. to favour
mentioned oxidative stress) [Enns et al., 2012].
Tumour cells metabolic switch to aerobic glycolysis is also associated to
increased glucose uptake. In relationship to this aspect, it has been demonstrated
that ECM detachment could lead to anoikis (i.e. programmed cell death arising
from loss of contact with the ECM) precisely via decreased glucose uptake
[Schafer et al., 2009]. Indeed a model of ECM detachment developed with
MCF10A cells demonstrated that breast cancer cells lacking ECM contact are
selectively induced to anoikis [Fung et al., 2008] and Erb2 overexpression could
confer anoikis-resistance by restoring glucose uptake through EGF receptor
stabilization and PI3K activation [Kim et al., 2012]. In the mechanism proposed
by Kim et al. anoikis resistance is basically obtained through the re-establishment
of ATP production via restored glucose-uptake: in the proposed context this
92
involves the aerobic glycolytic pathway activated in tumour cells. Moreover, the
same author demonstrates that anoikis resistance could be achieved also through
antioxidant treatments of MCF10A cells in the above-mentioned model from
Fung et al.: in this case resistance is obtained through re-establishment of ATP
production via activation of the fatty acid oxidation, which is inhibited by high
oxidant levels. Nevertheless, joining these data with the observations from de
Oliveira and Cantor on mitochondrial activity in tumour cells (i.e. mitochondria
are still the major source of intracellular ATP even in cancer cells), and the
antioxidant function of the PPP shunted glucose-6-phosphate, it seems reasonable
that the re-established glucose uptake could drive anoikis resistance through
augmented NADPH production via oxidative PPP.
5.3.2 G6PDH redox regulation
Given a possible role for PPP in conferring resistance to anoikis in ECM detached
tumour cells, it remains unclear the way by which this pathway could be
activated. Mitsuishi et al. propose the direct activation of G6PD (the rate limiting
enzyme of the PPP) by Nrf2 through the well conserved antioxidant response
element (ARE) on its gene [Mitsuishi et al., 2012]. As already seen Nrf2
constitutive activation has indeed been associated with many tumours. But in our
model NFE2L2 gene (i.e. Nrf2 gene) is even apparently down-regulated in M2T
in respect to M2 cells. As NFE2L2 is regulated itself by the same Nrf2, it seems
unlikely that this pathway is activated in our model. Moreover peroxiredoxin-1
western blotting showed that also this protein, known to be ARE regulated by
Nrf2, is expressed at the same level in both M2T and M2 cells. Nevertheless we
confirmed a globally even if slightly, more reduced status for M2T cells in respect
to their M2 counterpart and we highlighted as well a pronounced unbalance
toward a more oxidized status for the G6PD protein in the more malignant
cells.The presence of different conformers of this enzyme is sustained also by
reducing and non–reducing western blotting. However it cannot be stated at this
point which are the causes for maintained G6PD oxidized status in M2T cells, but
our experiments on the effect of redox status on this enzyme activity demonstrated
that G6PD activity decrease in reducing conditions and that it re-oxidize itself
quite rapidly (DTT removal, see results). Moreover, reduction and alkylation
(with NEM) of G6PD further reduced its activity, thus showing that there is
probably a less-active form of this enzyme lacking some required oxidation.
Redox regulation of G6PD in organisms different from this human cell line has
been extensively reported in the past [Udvardy et al., 1984, Gleason et al., 1996,
Au et al., 2000, Née et al., 2009] and all agree on the reduction of activity
consequent to enzyme reduction by DTT and thioredoxin. Finally, preliminary
results from expression analysis don’t detect any G6PD augmented transcription
and western blotting, together with totally reduced controls confirmed nearly a
twofold difference in protein quantity: probably the augmented activity of G6PD

93
in M2T cells could be ascribed to both its quantity and redox regulation. In a
recent work from Halim et al., it has been demonstrated that prolonged H2O2
treatment (up to 10M for 14 days) is able to rescue anoikis in non-small cell lung
cancer and melanoma cells via over-expression of caveolin-1 [Halim et al., 2012]:
even if not directly correlated with our observations, this study sustain once again
a role for endogenous or exogenous produced electrophiles in conferring tumour
cells an advantage toward survival, thus enriching the concept of “oxidative
stress” mentioned above. Finally, another interesting observation arise from a less
recent work on erythrocyte model system, where Scott et al. demonstrated that
only G6PD-produced NADPH is able to decrease the oxidant sensitivity of those
cells and not GSH [Scott et al., 1991], by correlating haemoglobin oxidant
sensitivity to NADPH,but not to GSH. This is intriguing since it is known that
Nrf2 pathway activation lead to increased GSH synthesis, while G6PD activation
lead to increased NADPH synthesis, which is likely to be an interesting
hypothesis in our model.
Finally, as for the outlined adhesion and ECM interaction molecules we found
more oxidized into M2T cells, little could be said without further research. It is
known indeed that oxidants could have a role into the induction of expression of
adhesion molecules in mammalian vascular endothelial cells [Hurd et al., 2012]
and that oxidants production to this aim could be localized by virtue of receptor
mediated stimulation of membrane-NOX. Nevertheless there is no clear clue on
the direct involvement of adhesion molecules oxidation into ECM-interaction
processes. On the other hand, invasive cells could travel through various ECMs to
extravasate, intravasate, and colonize target organs, but there is no unifying
hypothesis to explain the mechanism used by cancer cells to cross these barriers
[Díaz et al., 2012].
5.4 Concluding remarks
The work described here encompasses both the setting up of a complex analytical
workflow and its application to the study of a cellular model. Thus, we were able
to identify redox-sensible proteins which are differentially oxidized between M2T
and M2 cells. M2T cells represent a more malignant breast cancer cellular model
with higher metastasizing potential in respect to its M2 counterpart. M2T cells
were demonstrated to contain more free thiols than M2 cells and so to be globally
more reduced. Nevertheless, we identified proteins both more reduced and more
oxidized into M2T cells, thus demonstrating a rather complex redox scenario in
those cells. Particularly, among proteins more oxidized into M2T cells, we could
identify proteins involved into ECM interaction and cell-adhesion processes and
the PPP enzyme G6PD. While we are still looking to elucidate the significance of
the formers, this latter enzyme is known to be a key player in redox homeostasis.
Its oxidative activation together with increased expression could be culprit of

94
tumour cell response to ECM detachment induced oxidative stress, thus
conferring aggressive cells survival advantage.
This work definitely lead to the generation of this hypothesis starting from the
very development of a methodology and identified further research targets
through a wider “omic” approach. Deeper studies on G6PD kinetic and redox-
regulation and characterization of NADPH levels together with elucidation of
Nrf2-pathway activation in this model, will provide further insights to the study.

95
6. REFERENCES
Allison WS. Formation and reactions of sulfenic acids in proteins. Acc Chem Res
1976;9(8):293-299
Au SWN, Gover S, Lam VMS, Adams MJ. Human gluocose-6-phosphate
dehydrogenase: the crystal structure reveals a structural NADP+ molecule and
provides insights into enzyme deficiency. Structure 2000;8(3):293-303
Bantscheff M, Schirle M, Sweetman G, Rick J, Kuster B. Quantitative mass
spectrometry in proteomics: a critical review. Anal Bioanal Chem
2007;389:1017-1031
Barrett WC, DeGnore JP, Konig S, Fales HM, Keng YF, Zhang ZY, Yim MB,
Chock PB. Regulation of PTP1B via glutathionylation of the active site
cysteine 215. Biochemistry 1999;38:6699-6705
Barthel A, Ostrakhovitch EA, Walter PL, Kampkotter A, Klotz LO. Stimulation
of phopshoinositide 3-kinase/Akt signaling by copper and zinc ions:
Mechanisms and consequences. Arch Biochem Biophys 2007;463:175-182
Beckman KB, Ames BN. Oxidative decay of DNA. J Biol Chem
1997;272(32):19633-19636
Begg GE, Carrington L, Stokes PH, Matthews JM, Wouters MA, Husain A.
Mechanism of allosteric regulation of transglutaminase 2 by GTP. Proc Natl
Acad Sci USA 2006;103(52):19683-8
Bensadoun A, Weinstein D. Assay of proteins in the presence of interfering
materials. Anal Biochem 1976;70(1):241-250
Bindoli A, Fukuto JM, Forman HJ. Thiol chemistry in peroxidase catalysis and
redox signalling. Antiox Redox Signal 2008;10(9):1549-1564
Brandes N, Schmitt S, Jakob U. Thiol-based redox switches in eukariotyc
proteins. Antiox Redox Signal 2009;11(5)997-1014
Brennan JP, Wait R, Begum S, Bell JR, Dunn MJ, Eaton P. Detection and
mapping of widespread intermolecular protein disulfide formation during
cardiac oxidative stress using proteomics with diagonal electrophoresis.
Journal of Biological Chemistry 2004;279(40):41352-41360
Cantor JR, Sabatini DM. Cancer cell metabolism: one hallmark, many faces.
Cancer Discov 2012;2(10):881-98
Chang F, Lee JT, Navolanic PM, Steelman LS, Shelton JG, Blalock WL, Franklin
RA, McCubrey JA. Involvement of PI3K/Akt pathway in cell cycle progression,

96
apoptosis, and neoplastic transformation: a target for cancer chemotherapy.
Leukemia 2003;17:590-603
Chouchani ET, James AM, Fearnley IM, Lilley KS, Murphy MP. Proteomic
approaches to the characterization of protein thiol modification. Curr Op
Chem Bio 2011;15:120-128
Cordenonsi M, Zanconato F, Azzolin L, Forcato M, Rosato A, Frasson C, Inui
M, Montagner M, Parenti AR, Poletti A, Daidone MG, Dupont S, Basso G,
Bicciato S, Piccolo S. The Hippo transducer TAZ confers cancer stem cell-
related traits on breast cancer cells. Cell 2011;147:759-772
Cumming RC, Andon NL, Haynes PA, Park M, Fischer WH, Schubert D. Protein
disulfide bond formation in the cytoplasm during oxidative stress. Journal of
Biological Chemistry 2004;279(21):21749-21758
Cuozzo JW, Kaiser CA. Competition between glutathione and protein thiols for
disulphide-bond formation. Nat Cell Biol 1999;1:130-135
Denning TL, Takaishi H, Crowe SE, Boldogh I, Jevnikar A, Ernst PB. Oxidative
stress unduces the expression of Fas and Fas ligand and apoptosis in murine
intestinal epithelial cells. Free Radic Biol Med 1992;33(12):1641-1650
Di Simplicio P, Cacace MG, Lusini L, Giannerini F, Giustarini D, Rossi R. Role
of protein –SH groups in redox homeostasis – The erythrocyte as a model
system. Archiv. Of Biochem Biophys 1998;355(2):145-152
Díaz B, Courtneidge SA. Redox signaling at invasive microdomains in cancer
cells. Free Rad Biol Med 2012;52(2):247-256
DickinsonDA, Forman HJ. Cellular glutathione and thiols metabolism.
Biochemical Pharmacology 2002;64(5-6):1019-1026
Enns L, Ladiges W. Mitochondrial redox signaling and cancer invasiveness. J
Bioenerg Biomembr 2012;44(6):635-8
Esposito F, Chirico G, Gesualdi NM, Posadas I, Ammendola R, Russo T, Cirino
G, Cimino F. Protein kinase B activation by reactive oxygen species is
independent of tyrosine kinase receptor phosphorylation and requires Src
activity. J Biol Chem 2003;278(23):20828-20834
Foster FM, Traer CJ, Abraham MJ, Fry J. The phosphoinositide (PI) 3-kinase
family. J Cell Sci 2003;116:3037-3040
Franke TF, Cantley LC. A Bad kinase makes good. Nature 1997;390:116-117

97
Fung C, Lock R, Gao S, Salas E, Debnath J. Induction of autophagy during
extracellular matrix detachment promotes cell survival. Mol Biol of the Cell
2008;19(3):797-806
Gao X, Xing Da. Molecular mechanisms of cell proliferation induced by low
power laser irradiation. J Biomed Sc 2009;16(4):1-16
Ghezzi P. Oxidoreduction of protein thiols in redox regulation. Biochem Society
Transactions 2005;33(6):1378-1381
Giannoni E, Buricchi F, Grimaldi G, Parri M, Cialdai F, Taddei ML, Raugei G,
Ramponi G, Chiarugi. Redox regulation of anoikis: reactive oxygen species as
essential mediators of cell survival. Cell death differentiation 2008;15:867-878
Giles GI, Tasker KM, Jacob C. Hypothesis: The role of reactive sulfur species in
oxidative stress. Free Radic Biol Med 2001;31:1279-1283
Gleason FK. Glucose-6-phosphate dehydrogenase from the cyanobacterium,
Anabaena sp. PCC 7120: purification and kinetics of redox modulation. Archiv
of Biochem and Biophys 1996;334(2):277-283
Go YM, Jones DP. Redox compartimentalization in eukaryotic cells. Biochim
Biophys Act 2008;1789:1273-1290
Gorman JJ, Wallis TP, Pitt JJ. Protein disulfide bond determination by mass
spectrometry. Mass Spectrometry Reviews 2002;21(3):183-216
Gupta SC, Hevia D, Patchva S, Park B, Koh W, Aggarwal BB. Upsides and
downsides of reactive oxygen species for cancer: the roles of reactive oxygen
species in tumorigenesis, prevention and therapy. Antioxid Redox Signal
2012;16(11):12951322
Halim H, Chanvorachote P. Long-term hydrogen peroxide exposure potentiates
anoikis resistance and anchorage-independent growth in lung carcinoma cells.
Cell Biol Int 2012;36(11):1055-66
Halvey PJ, Watson WH, Hansen JM, Go YM, Samali A, Jones DP.
Compartmental oxidation of thiol-disulphide redox couples during epidermal
growth factor signaling. Biochem J 2005;386:215-219
Higdon A, Diers AR, OH JY, Landar A, Darley-Usmar VM. Cell signalling by
reactive lipid species: new concepts and molecular mechanisms. Biochem J
2012;442:453-464
Hurd TR, DeGennaro M, Lehmann R. Redox regulation of cell migration and
adhesion. Trends Cell Bio 2012;22(2):107-115

98
Hurd TR, DeGennaro M, Lehmann R. Redox regulation of cell migration and
adhesion. Trends in Cell Biology 2012;22(2):107-115
Hwang C, Sinskey AJ, Lodish HF. Oxidized redox state of glutathione in the
endoplasmic reticulum. Science 1992;257(5076):1496-14502
Ikeda H, Nichi S, Sajai M. Transcription factor Nrf2/MafK regulates rat
placental glutathione S-transferase gene during hepatocarcinogenesis.
Biochem J 2004;380:515-521
Izquierdo-Álvarez A, Martínez-Ruiz A. Thiols redox proteomics seen with
fluorescente yes: the detection of cysteine oxidative modifications by
fluorescence derivatization and 2-DE. J Proteomics 2011;75:329-338
Kamata H, Hirata H. Redox regulation of cellular signaling. Cell Signal
1999;11(1)1-14
Kettenhofen NJ, Wang X, Gladwin MT, Hogg N. In-gel detection of S-nitrosated
proteins using fluorescence methods. Methods Enzymol 2008;441:53-71.
Kim SK, Yang JW, Kim MR, Roh SH, Kim HG, Lee KY. Increased expression
of Nrf2/ARE-dependent anti-oxidant proteins in tamoxifen-resistant breast
cancer cells. Free Radic Biol Med 2008;45:537-546
Kim YN, Koo KH, Sung JY, Yun UJ, Kim H. Anoikis resistance: an essential
prerequisite for tumor metastasis. Int J Cell Biol 2012;2012:306879
Kobayashi CI, Suda T. Regulation of reactive oxygen species in stem cells and
cancer stem cells. J Cell Physiol 2012;227:421-430.
Koppenol WH, Bounds PL, Dang CV. Otto Warburg’s contributions to current
concepts of cancer metabolism. Nat Rev Cancer 2011;11(5)325-37
Kӓll L, Storey JD, MacCoss MJ, Noble WS. Posterior error probabilities and
false discovery rates: two sides of the same coin. J Proteome Res 2008;4:40-44
Lambeth JD. NOX enzymes and the biology of reactive oxygen. Nat Rev
Immunol 2004;4:181-189
Lau A, Villeneuve NF, Sun Z, Wong PK, Zhank DD. Dual roles of Nrf2 in
cancer. Pharmacol Res 2008;58(5-6):262-270.
Le Moan N, Clement G, Le Maout S, Tacnet F, Toledano MB. The
Saccharomyces cerevisiae proteome of oxidized protein thiols. J Biol Chem
2006;281(15):10420-10430
Leichert LI, Jakob U. Protein thiol modifications visualized in vivo. PLoS Biol
2004;2(11):e333
99
Leonard SE, Reddie KG, Carroll KS. Mining the thiol proteome for sulfenic acid
modifications reveals new pargets for oxidation in cells. ACS Chem Biol
2009;4(9):783-799
Lewis SD, Misra DC, Schafer JA. Determination of interactive thiol ionizations in
bovine serum albumin, glutathione, and other thiols by potentiometric
difference titration. Biochemistry 1980;19(26):6129-6137
Lind C, Gerdes R, Hamnell Y, Schuppe-Koistinen I, von Lowenhielm HB,
Holmgren A, Cotgreave IA. Identification of S-glutathionylated cellular
proteins during oxidative stress and constitutive metabolism by affinity
purification and proteomic analysis. Arch Biochem Biophys 2002;406:229-240
Little C, O’Brien PJ. Mechanism of peroxide-inactivation of the sulphydryl
enzyme glyceraldehyde-3-phosphate dehydrogenase. Eur J Biochem
1969;10(3):533-538
Maiorino M, Ursini F, Bosello V, Toppo S, Tosatto SC, Mauri P, Becker K,
Roveri A, Bulato C, Benazzi L, De Palma A, Flohé L. The thioredoxin
specificity of Drosophila GPx: a paradigm for a peroxiredoxin-like mechanism
of many glutathione peroxidases. Journal of Molecular Biology
2007;365(4):1033-1046
Martindale JL, Holbrook NJ. Cellular response to oxidative stress: signaling for
suicide and survival. J Cell Physiol 2002;192:1-15
Mauri P, Toppo S, De Palma A, Benazzi L, Maiorino M, Ursini F. Identification
by MS/MS of disulfides produced by a functional redox transition. Methods in
Enzymology 2010;473:217-225
McCubrey JA, Steelman LS, Chappell WH, Abrams SL, Wong EWT, Chang F,
Lehmann B, Terrian DM, Milella M, Tafuri A, Stivala F, Libra M, Basecke J,
Evangelisti C, Martelli AM, Franklin RA. Roles of the Raf/MEK/ERK pathway
in cell growth, malignant transformation and drug resistance. Biochim
Biophys Acta 2007;1773(8):1263-1284
McDonagh B, Ogueta S, Lasarte G, Padilla CA, Bárcena JA. Shotgun redox
proteomics identifies specifically modified cysteines in key metabolic enzymes
under oxidative stress in Saccharomyces cerevisiae. J Proteomics 2009;72:677-
689
McDonagh B, Requejo R, Fuentes-Almagro CA, Ogueta S, Bárcena JA, Padilla
CA. Thiol redox proteomics identifies differential targets of cytosolic and
mitochondrial glutaredoxin-2 isoforms in Saccharomyces cerevisiae.
Reversible S-glutathionylation of DHBP synthase (RIB3). J Proteomics
2011;74:2487-2497
100
Mitsuishi Y, Taguchi K, Kawatani Y, Shibata T, Nukiwa T, Aburatani H,
Yamamoto M, Motohashi H. Nrf2 redirects glucose and glutamine into
anabolic pathways in metabolic reprogramming. Cancer Cell 2012;22(1)66-79
Mottley C, Mason RP. Sulfur-centered radical formation from the antioxidant
dihydrolipoic acid. Journal of Biological Chemistry 2001;276(46):42677-
42683
Mueller L, Brusniak MY, Mani DR, Aebersold R. An assessment of software
solutions for the analysis of mass spectrometry based quantitative proteomics
data. J Proteome Res 2008;7:51-61
Murphy MP. How mitochondria produce reactive oxygen species. Biochem J
2009;417:1-13
Murphy MP. Mitochondrial thiols in antioxidant protection and redox signalling:
distinct roles for glutathionylation and other thiol modifications. Antioxd
Redox Signaling 2012;16(6):476-95
Nagahara N, Matsumura T, Okamoto R, Kajihara Y. Protein cysteine
modifications: (1) medicinal chemistry for proteomics. Curr Med Chem
2009;16(33):4419-44
Née G, Zaffagnini M, Trost P, Issakidis-Bourguet E. Redox regulation of
chloroplastic glucose-6-phosphate dehydrogenase: a new role for f-type
thioredoxin. FEBS Letters 2009;583(17):2827-2832
Nishikawa M. Reactive oxygen species in tumor metastasis. Cancer Lett
2008;266:53-59
Old WM, Meyer-Arendt K, Veline-Wolf L, Pierce KG, Mendoza A, Sevinsky JR,
Resing KA, Ahn NG. Comparison of label-free methods for quantifying human
proteins by shotgun proteomics. Mol Cell Proteomics 2005;4:1487-1502
Ozben T. Oxidative stress and apoptosis: impact on cancer therapy. J Pharm Sci
2007;96(9):2181-2196
Patel KD, Zimmerman GA, Prescott SM, McEver R, McIntyre TM. Oxygen
radicals induce human endothelial cells to express GMP-140 and bind
neutrophils. J Cell Biol 1991;112(4):749-759
Ralph SJ, Enriquez SR, Neuzil J, Saavedra E, Sanchez RM. The causes of cancer
revisited: “Mitochondrial malignancy” and ROS-induced oncogenic
transformation – Why mitochondria are targets for cancer therapy. Molecular
Aspects of Medicine 2010;31:145-170
101
Requejo R, Chouchani ET, James AM, Prime TA, Lilley KS, Fearnley IM,
Murphy MP. Quantification and identification of mitochondrial proteins
containing vicinal dithiols. Arch Biochem Biophys 2010;504(2):228-235
Riederer BM. Oxidation proteomics: the role of thiol modifications. Curr
Proteomics 2009;6:51-62
Rogers LK, Leinweber BL, Smith CV. Detection of reversible protein thiol
modifications in tissues. Anal Biochem 2006;358:171-184
Romashkova JA, Makarov SS. NF-kB is a target of AKT in anti-apoptotic PDGF
signaling. Nature 1999;401:86-90
Saito A, Nagasaki M, Oyama M, Kozuka-Hata H, Semba K, Sugano S,
Yamamoto T, Miyano S. AYUMS; an algorithm for completely automatic
quantitation based on LC-MS/MS proteome data and its application to the
analysis of signal transduction. BMC Bioinformatics 2007;8:15
Saitoh M, Nishitoh H, Fujii M, Takeda K, Tobiume K, Sawada Y, Kawabata M,
Miyazono K, Ichijo H. Mammalian thioredoxin is a direct inhibitor of
apoptosis signal-regulating kinase (AKS) 1. The EMBO Journal
1998;17(9):2596-2606.
Salmeen A, Andersen JN, Myers MP, Meng TC, Hinks JA, Tonks NK, Barford
D. Redox regulation of protein tyrosine phosphatase 1B involves a sulphenyl-
amide intermediate. Nature 2003;423(6941):769-773
Schafer ZT, Grassian AR, Song L, Jiang Z, Gerhart-Hines Z, Irie HY, Gao S,
Puigserver P, Brugge JS. Antioxidant and oncogene rescue of metabolic defects
caused by loss of matrix attachment. Naure 2009;461(7260):109-113
Scott MD, Zuo L, Lubin BH, Chiu DT. NADPH, not glutathione, status
modulates oxidant sensitivity in normal and glucose-6-phosphate
dehydrogenase-deficient erythrocytes. Blood 2012;1991(77):2059-2064
Scott WA. Physical properties of glucose 6-phosphate dehydrogenase from
Neurospora crassa. J Biol Chem 1971;246(20):6353-6359
Shigenaga MK, Gimeno CJ, Ames BN. Urinary 8-hydroxy-2’-deoxyguanosine as
a biological marker of in vivo oxidative DNA damage. Proc Natl Acad Sci
USA 1989;86(24):9697-9701
Singh A, Misra V, Thimmulappa RK, Lee H, Ames S, Hoque MO. Dysfunctional
KEAP1-NRF2 interaction in non-small-cell lung cancer. PLoS Med
2006;3(10)e420

102
Stone JR. An assessment of proposed mechanisms for sensing hydrogen peroxide
in mammalian systems. Arch Biochem Biophys 2004;422(2):119-124
Tosatto SCE, Bosello V, Fogolari F, Mauri P, Roveri A, Toppo S, Flohé L, Ursini
F, Maiorino M. The catalytic site of glutathione peroxidases. Antioxid Redox
Signal 2008;10(9):1515-26
Trotter EW, Grant CM. Non-reciprocal regulation of the redox state of the
glutathione-glutaredoxin and thioredoxin systems. EMBO 2003;Rep4:184-188
Udvardy J, Borbėly G, Juhasz A, Farkas G. Thioredoxins and the redox
modulation of gluocose-6-phosphate dehydrogenase in Anabaena sp. strain
PCC 7120 vegetative cells and heterocysts. J Bacteriol 1984;157(2):681-683
Ushio-Fukai M. Redox signalling in angiogenesis: role of NADPH oxidase.
Cardiovasc Res 2006;71:226-235
Ushio-Fukai M., Nakamura Y. Reactive oxygen species and angiogenesis:
NADPH oxidase as target for cancer therapy. Cancer Lett 2008;266:37-52
Valko M, Rhodes CJ, Moncol J, Izakovic M, Mazur M. Free radicals metals and
antioxidants in oxidative stress-induced cancer. Chem Biol Interact
2006;160(1):1-40
Wardman P. Evaluation of the “radical sink” hypothesis from a chemical-kinetic
viewpoint. J Radioanal Nucl Chem 1998;232(1-2):23-27
Watson WH, Pohl J, Montfort WR, Stuchlik O, Reed MS, Powis G, Jones DP.
Redox potential of human thioredoxin 1 and identification of a second
dithiol/disulfide motif. J Biol Chem 2003;278(35):33408-33415
Winterbourn CC, Metodiewa D. Reactivity of biologically important thiol
compounds with superoxide and hydrogen peroxide. Free Rad Biol Med
1999;27(3-4):322-328
Woo HA, Yim SH, Shin DH, Kang D, Yu DY, Rhee SG. Inactivation of
peroxiredoxin I by phosphorylation allows localized H2O2 accumulation for
cell signaling. Cell 2010;140:517-528
Wouters MA, Fan SW, Haworth NL. Disulfides as redox switches: from
molecular mechanisms to functional significance. Antiox Redox Signal
2010;12(1):53-91
Wouters MA, Iismaa S, Fan WS, Haworth NL. Thiol-based redox signalling:
Rust never sleeps. Int Journal of Biochem & Cell Biol 2011;43(8):1079-1085
103
Zhang B, VerBerkmoes NC, Langston MA, Uberbacher E, Hettich RL,
Samantova NF. Detecting differential and correlated protein expression in
label-free shotgun proteomics. J Proteome Res 2006;5:2909-2918
Zhang H, Liu H, Borok Z, Davies KJA, Ursini F, Forman HJ. Cigarette smoke
extract stimulates epithelial-mesenchymal transition through Src activation.
Free Rad Biol Med 2012;52:1437-1442
Zhang Y, Wen Z, Washburn MP, Florens L. Effect of dynamic exclusion duration
on spectral count based quantitative proteomics. Anal Chem 2009;81:6317-
6326
Jaffe JD, Mani DR, Leptos KC, Church GM, Gillette MA, Carr SA. PEPPeR, a
platform for experimental proteomic pattern recognition. Mol Cell Proteomics
2006;5(10):1927-41
Fratelli M, Demol H, Puype M, Casagrande S, Eberini I, Salmona M, Bonetto V,
Mengozzi M, Duffleux F, Miclet E, Bachi A, Vandekerckhove J, Gianazza E,
Ghezzi P. Identification by redox proteomics of glutathionylated proteins in
oxidatively stressed human T lymphocytes. PNAS 2002;99(6):3505-10

104
Other studies carried out during PhD Program
During my PhD I also collaborated to projects encompassing the application of
proteomics techniques to the study of Cisplatin resistance in cellular models and
to the analysis of red blood cell membrane proteins. These works, not belonging
to the thesis, have been published in: the Journal of proteome research (v.10;
p.416-428, 2011) with the title “New insights into Neuroblastoma Cisplatin
Resistance: A comparative proteomic and meta-mining investigation” and in the
Journal of chromatography A, (v.1217; p.5328–5336, 2010) with the title
“Extraction methods of red blood cell membrane proteins for multidimensional
protein identification technology (MudPIT) analysis”. Finally, during the last year
of my PhD I also gave my contribution to the MS-characterization of the redox-
status of glutathione peroxidase 7 in the work recently submitted to “Biochimica
et Biophysica Acta” with the title “Protein Disulfide Isomerase and Glutathione
are alternative substrates in the one Cys catalytic cycle of Glutathione Peroxidase
7 within the endoplasmic reticulum”.

105
AKNWOLEDGMENTS
This thesis is the conclusion of three rich and compelling years dedicated to my
PhD experience, and I hope this would represent the starting point for an even
brighter and exciting future in research. Nevertheless, I would not have done
much without the support that many people gave me, both in the working field
and in private life.
First of all I would like to thank my tutor Professor Fulvio Ursini that gave me the
opportunity to achieve this PhD and investigate the fascinating world of redox
biochemistry, and Dr. Antonella Roveri for her irreplaceable help with
experiments and wise suggestions in many fields. A special thank goes then to Dr.
Marco Falda, member of the bioinformatics group of our lab, for his fundamental
contribution to the data analysis workflow.
Then I would like to thank Prof. Stefano Piccolo for providing us the precious
cellular model subject of this study, and Dr. Elena Tibaldi and Dr. Rina
Venerando for their collaboration to the project.
I also want to thank the other members of the workgroup for the help they gave
me both with experiments and fruitful discussions day after day: Prof. Matilde
Maiorino and Dr. Valentina Bosello from the lab, and Dr. Stefano Toppo from the
bioinformatics group.
Special thanks go to all the people from the Proteomics lab, where I met new
friends and expert colleagues: first of all Dr. Giorgio Arrigoni, who shared his
knowledge and prompted me through the engaging field of mass spectrometry. I
would also like to thank Cinzia, Serena, Renato, and Lucia for all the funny
moments we shared both in front of the instruments and tasting ethnic foods
during lunchtime. A notice of gratitude goes then to Dr. Giovanni Miotto for his
help with the often fickles mass spectrometers, and to Prof. Oriano Marin for his
availability.
As I promised, I would like to thank also Massimo Guida for the availability and
precious help in fixing my idiosyncrasy against bureaucracy.
Last, but not least, a special thank goes to my family and my friends for the
constant support they gave me in these three years: Anna, Franco, Lorenzo,
Francesco, and Michele.