setting the stage for marine spatial planning ecological - bcmca
TRANSCRIPT
Marine Policy 39 (2013) 11–20
Contents lists available at SciVerse ScienceDirect
Marine Policy
0308-59
http://d
n Corr
E-m
KBodtke
krista.ro
journal homepage: www.elsevier.com/locate/marpol
Setting the stage for marine spatial planning: Ecological and social datacollation and analyses in Canada’s Pacific waters
Natalie C. Ban a,n, Karin M. Bodtker b, David Nicolson c, Carolyn K. Robb b, Krista Royle d, Charlie Short e
a Australian Research Council Centre of Excellence for Coral Reef Studies, James Cook University, Townsville, Queensland, Australia, 4811b Living Oceans Society, PO Box 320, Sointula, British Columbia, Canada V0N 3E0c British Columbia Marine Conservation Analysis, 4469 Annette Pl, Victoria, British Columbia, Canada V8N 3J6d Parks Canada, 300-300 West Georgia St. Vancouver, BC, Canada V6B 6B4e Province of British Columbia, Ministry of Forests, Lands and Natural Resource Operations, PO Box 9525 STN PROV GOV, Victoria BC, Canada V8W 9C3
a r t i c l e i n f o
Article history:
Received 29 May 2012
Received in revised form
6 October 2012
Accepted 14 October 2012
Keywords:
Marine spatial planning
Marine conservation
Stakeholders
Marxan
Decision-support tools
Marine use planning
7X/$ - see front matter & 2012 Elsevier Ltd. A
x.doi.org/10.1016/j.marpol.2012.10.017
esponding author. Tel.: þ61 7 4781 6067; fax
ail addresses: [email protected] (N.C. Ba
[email protected] (K.M. Bodtker), b.coffee@
[email protected] (K. Royle), [email protected]
a b s t r a c t
Canada’s Pacific coast is one region where there is a renewed commitment to pursue marine spatial
planning (MSP). The British Columbia Marine Conservation Analysis (BCMCA) project aimed to set the
stage for MSP, and was designed to provide resource managers, scientists, decision-makers, and
stakeholders with a new set of resources to inform coast-wide integrated marine planning and
management initiatives. Geographic Information Systems and the decision support tool Marxan were
used to develop two main products: (1) an atlas of known marine ecological values and human uses;
and (2) analyses of areas of conservation value and human use value. 110 biophysical datasets and 78
human use datasets were collated and refined where applicable, as identified through five ecological
expert workshops, one expert review of physical marine classification and representation, and guidance
from the human use data working group. Ecological data richness maps and Marxan results show the
importance of nearshore and continental shelf regions. Data richness maps for the six categories of
human uses show that all, except shipping and transport, are also closely linked to the shoreline and
continental shelf. An example ecological Marxan solution identifying areas of conservation value
overlapped human use sector footprints by percentages ranging from 92% (i.e., 92% of planning units
selected by Marxan also contain commercial fisheries) to 3%. The experience of the BCMCA project has
the potential to provide valuable guidance to regions seeking to jump-start planning processes by
collating spatial information and carrying out exploratory analyses.
& 2012 Elsevier Ltd. All rights reserved.
1. Introduction
Declining marine resources and ecosystem services [1], andevidence that sector-based approaches to management have beeninadequate at achieving sustainability [2], have led to increased globalinterest in marine spatial planning (MSP) [2,3]. MSP is a frameworkthat informs the spatial distribution of marine activities to supportcurrent and future uses, and maintain delivery of ecosystem servicesto meet ecological, economic and social objectives [2]. Complemen-tary literature on systematic conservation planning emphasises theimportance of rigorous process, transparency and efficiency (e.g.,through setting quantitative targets) throughout the planning process[4,5]. One example of combined systematic conservation planningand MSP is the rezoning of the Great Barrier Reef in Australia, whichassigned six different zones, allowing a range of uses, in a region
ll rights reserved.
: þ61 7 4781 6722.
n),
telus.net (D. Nicolson),
.ca (C. Short).
about 350,000 km2 [6]. Many regions are following suit, instigatingsystematic MSP processes [e.g., Belgium, 7, California, 8, Australia, 9].
As illustrated in MSP exercises worldwide, a critical componentto its efficacy is comprehensive ecological and social data to supportthe process [2]. Ecological data are necessary to identify areas ofimportance for biodiversity conservation and delivery of ecosystemservices. Data on human activities are useful for identifying areas ofimportance to marine industries and other uses. The combination ofecological and human use data is particularly valuable in explicitlyidentifying overlapping interest to multiple users and/or biodiversityconservation, and investigating tradeoffs [8]. Spatial data are alsonecessary to use decision-support tools, such as Marxan [10,11] orMarxan with Zones [12]. Such decision-support tools can aid MSP byidentifying options for areas requiring special management [e.g.,marine protected areas, 6], or human use areas [e.g., designatedfishing areas, 13].
Canada’s Pacific coast (province of British Columbia, BC) isone region where there is a renewed commitment to carry outMSP, also referred to as ‘‘Integrated Management’’ in Canada [14].In particular, the provincial government is partnering with some

N.C. Ban et al. / Marine Policy 39 (2013) 11–2012
coastal First Nations to create marine plans, through what iscalled the Marine Planning Partnership for the North Pacific Coast(www.mappocean.org), and the federal government is working ona planning process called the Pacific North Coast IntegratedManagement Area. In other areas, such as the west coast ofVancouver Island, MSP has been taking place via local community,First Nations and government partnerships (i.e., West CoastAquatic, http://westcoastaquatic.ca/plans/). While these initia-tives are promising, previous discussions about MSP have beenslow to get started, which has significantly impeded progress todate [15–17].
The British Columbia Marine Conservation Analysis (BCMCA)project emerged from the interest of a multitude of stakeholdersto set the stage for MSP in British Columbia. The BCMCA (www.bcmca.ca) is a collaborative project designed to provide resourcemanagers, scientists, decision-makers, and those with a vestedinterest in the marine environment with a new set of resources toinform coast-wide integrated marine planning and managementinitiatives. Furthermore, the BCMCA project set out to spatiallyidentify marine areas of high conservation value and areasimportant to human use in Canada’s Pacific Ocean. The BCMCAis not a planning process as it does not have the ability ormandate to implement management actions, and it does not seekto replace planning initiatives that are underway or in prepara-tion. Rather, the results are intended to inform and help advancemarine planning initiatives in BC by providing collaborativeanalyses based on the best available ecological and human usespatial data at scales relevant to a BC coast-wide analysis. TheBCMCA project is coordinated by a Project Team, comprised ofrepresentatives from the Canadian government, BC government,First Nations (self-defined as observers), academia, marine usersand environmental organisations, which is responsible for coor-dinating, organising and implementing the project. The BCMCAproject’s ecological objectives were to represent the diversity ofBC’s marine ecosystems across their natural range of variation,maintain viable populations of native species, sustain ecologicaland evolutionary processes within an acceptable range of varia-bility, and build a conservation network that is resilient toenvironmental change. The history and approach of the projecthas been described by Ban et al. [18], and supporting documentscan be found online (www.bcmca.ca).
The purpose of this paper is to report the process and results ofthe multi-year BCMCA effort, and discuss its relevance to BC andbeyond. With increasing global popularity of MSP, the impetus forthe BCMCA project, an interest by a diversity of stakeholders toset the stage for MSP is likely emerging in many regions of theworld. The experience of the BCMCA project has the potential toprovide valuable guidance to those regions seeking to jump-startplanning processes by collating spatial information and carryingout exploratory analyses.
2. Methods
Geographic Information Systems (GIS) and the decision sup-port tool Marxan were used to develop two main products: (1) anatlas of known marine ecological values and human uses; and(2) analyses to identify areas of high conservation value and areasimportant to human use. The BCMCA Project Team guided andimplemented the methods, informed by ecological and humanuse experts who provided overarching direction and advice aboutthe collation, use and analyses of data. All data layers were stored,mapped and documented using ArcGIS (versions 9.0–10). Keysteps of the Marxan analyses, after data were collated, were tocreate planning units, develop targets, carry out calibration, runanalyses, and draft reports explaining results.
2.1. Collation of existing data
Differing approaches were used to identify ecological and humanuse data to incorporate in the BCMCA project. Ecological featuresand datasets recommended by experts via workshops were collatedand prepared for use in Marxan. Individual workshops were held forseabirds, marine plants, marine mammals, marine and anadromousfish, and marine invertebrates. Approaches used, and other details ofthe workshops, are described in Ban et al. [18]. A list of features anddatasets to represent the physical marine environment was firstproposed by the BCMCA Project Team based on a review of similarprojects, then revised following expert review. Once all availabledatasets for a given feature were obtained, data were collated usingGIS and prepared following advice given at the workshops or givenby data providers. Checkplots of mapped features and supportingmetadata, which documented collation and preparation methods,were reviewed by workshop participants and/or data providersin a comprehensive review process. Review questionnaires askedreviewers to (1) confirm existing target ranges or recommend newvalues, (2) comment on data collation and preparation methods, (3)comment on the appropriateness of older data, (4) recommenddates of expiry for use of these data in a marine planning context,and (5) make the project aware of additional data sources.
Human use datasets were first sourced by BCMCA ProjectTeam members within each of their organisations (e.g., federallyheld fisheries data, provincially held recreation data). Examplemaps were drafted and a review of these data was sought througha two-pronged strategy of group-by-group engagement and theformation of a human use data working group to advise on thecollation, mapping and analysis of human use data. Six sectors orcategories of human use were identified (i.e., commercial fish-eries, recreational fisheries, ocean energy, shipping and transpor-tation, tenures, and recreation and tourism), and a nominationprocess was held for each sector to self-identify two representa-tives to participate in the working group. The working group waslead by a neutral facilitator and was designed to be broadlyrepresentative of user groups, but participants were not expectedto represent a constituency in any formal capacity. The workinggroup held thirteen meetings over almost 2 years. Two of theworking group representatives – with the support of the rest ofthe working group – also participated on the Project Team.
Due to data limitations, it was not possible to create spatialdata for some recommended features, while other datasets notspecifically mentioned at workshops were developed from avail-able data (e.g., general kelp). While the focus of the BCMCAproject was to collate existing data, opportunities arose to createor update some ecological and human use datasets. Known gapsin digital datasets for four ecological features were filled bydigitising data (e.g., central coast Marbled Murrelet surveys). Forthe purposes of the BCMCA, the existing provincial benthicclassification scheme was replaced by a new benthic classificationdeveloped by Parks Canada using methods published by theNature Conservancy (TNC) [19]. The benthic classification com-bined three parameters: (i) landscape features, (ii) depth, and (iii)substrate in order to identify areas of similar benthic character-istics. Human use datasets were reviewed by the appropriatesector and some were deemed outdated or inadequate for marineplanning. A comprehensive local knowledge collection project,funded and overseen by the BCMCA, was undertaken throughconsultation with members of the Sport Fishing Advisory Board toupdate sport fishing data. BCMCA also undertook work whichenabled access to spatial data describing commercial fisheriesincluding Roe Herring, Sardine, and Salmon fisheries. In addition,oil and gas prospectivity data were updated, cruise ship and ferryroute data were corrected, and multiple datasets were mergedand/or verified with knowledgeable users to develop updated and
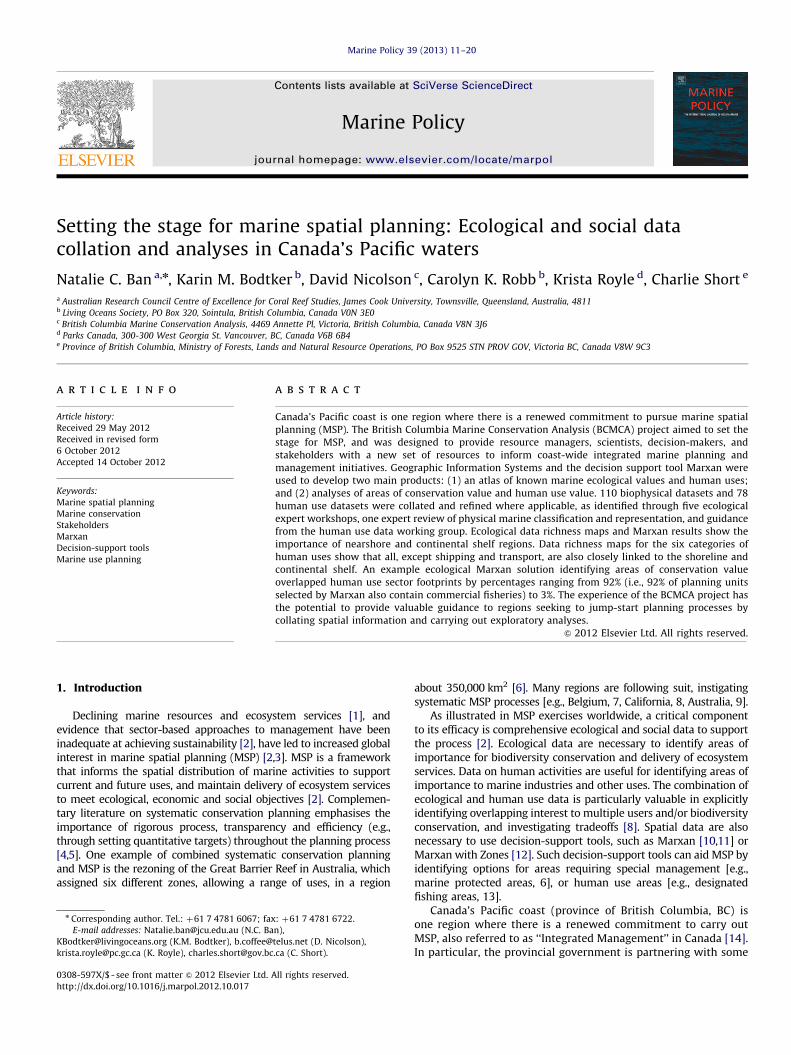
Fig. 1. Criteria used by Project Team to set ecological targets. The flowchart
indicates the process used for assigning targets to ecological features (i.e., whether
features are special or representational), and the corresponding percentage targets
used in the three scenarios.
N.C. Ban et al. / Marine Policy 39 (2013) 11–20 13
corrected, coast wide scuba diving, campsite and marine facilities(marinas and other tourism facilities with docks) data. TheBCMCA also developed a dataset illustrating areas of interest forocean energy (wave and tidal) through a participatory exercise ata mapping workshop.
Once all features were compiled and reviewed, maps anddescriptive information were combined into atlas pages, availableonline (www.bcmca.ca). Maps showing the number of featuresfound in each planning unit (i.e., data richness maps) werecreated for each ecological group and human use sector, countingonly datasets designated for use in Marxan.
2.2. Marxan analyses
Marxan (version 2.1.1) was used to identify areas of highconservation value and areas important to human use. Marxan isa free decision support tool that finds efficient solutions to theproblem of selecting a set of areas that meet a suite of conserva-tion [10,20] or human use targets [e.g., 13]. Explanations of howMarxan works have been provided in detail elsewhere and are notrepeated here (e.g., see the Marxan website http://www.uq.edu.au/marxan/). An expert workshop was held in May 2009, bringingtogether Marxan practitioners to advise the BCMCA on its properand robust use and make recommendations related to specificquestions posed by the BCMCA (proceedings from the workshopcan be found at http://www.bcmca.ca/document-library/). Duringthe Marxan experts workshop, a new tool called Marxan withZones [12] was recommended for running analyses incorporatinghuman use data. At that time BCMCA decided it was not feasibleto use Marxan with Zones due to the learning curve, timeconstraints and the unproven nature of the new tool. Instead, allthe human use scenarios were designed to use Marxan to identifyareas important to human use by exploring what happens to thefootprint if uses were reduced.
2.2.1. Defining targets
Targets for ecological features are intended to quantify theamount required to meet ecological objectives. At the ecologicalworkshops, experts were requested to recommend a range of targetsfor each feature, spanning a minimum to preferred amount (see Banet al. [18] for details). Workshops were attended by regional speciesexperts who drew upon their own experience and knowledge torecommend targets. Targets for physical classification and repre-sentation features were proposed by the Project Team and reviewedby experts. During data review, workshop experts and data provi-ders were given a chance to view the collated spatial data, and wereasked to review target recommendations and provide targets for anyfeatures lacking an established target range. Any targets still missingafter the review were systematically assigned by the Project Team.An unanticipated result of asking experts to recommend targetsthrough separate workshops was that values differed greatly amongecological themes (e.g., recommended seabirds targets differed frommarine plant targets and invertebrate targets, etc). The BCMCAProject Team decided to illustrate solutions for three added ‘‘What
ify?’’ scenarios using consistent targets for features in all ecologicalthemes. Target ranges for these scenarios were collaboratively set bythe BCMCA Project Team after consulting best practices, peer-reviewed scientific literature and the advice of the ecological experts(Fig. 1). Marxan scenarios were run using low, medium and hightarget values for both the expert-recommended and Project Teamtarget ranges in order to visually display the impact that targetshave on the footprint of the Marxan solutions.
To incorporate human use features, the Project Team initiallysuggested running Marxan for ecological features, using humanuses as a ‘cost’, as is commonly done in Marxan analyses [21].
Alternately, an option was to set targets for human use features,which tells Marxan how much of each feature to include in thesolution (i.e., to identify areas of important for all human uses, asper [13]). The human use data working group was introduced toMarxan and ultimately recommended using a range of targets,run through separate Marxan analyses for the six human usesectors: (1) commercial fisheries, (2) sport fishing, (3) oceanenergy, (4) tourism and recreation, (5) tenures, and (6) shippingand transportation. The idea of running one combined analysis forall human uses did not receive support from the human use dataworking group, primarily because of the variation in metrics andquality among human use datasets (i.e. data varied from quanti-fied use, to presence/absence to potential future areas of use), andfor this reason was not performed.
2.2.2. Calibration
Calibration was conducted to ensure that Marxan was behavingin a robust and logical manner, following guidance from the BCMCAMarxan expert workshop and Marxan Good Practices handbook[22]. First, the influence of the boundary cost was tested in order toalleviate bias for or against external edges. This test highlightedproblems inherent in using two different-sized planning units(nearshore and offshore) in the same analysis and a decision wasmade to use consistent 2 km by 2 km planning units throughout thestudy area (for a total of 120,499 planning units). The number ofiterations was tested to determine how many were sufficient, suchthat Marxan consistently produced near optimal solutions. TheBoundary Length Modifier (BLM) controls the importance of mini-mising the overall boundary length relative to minimising the totalarea of the selected planning units. Increasing the BLM encouragesMarxan to select fewer, larger contiguous areas to meet its targets.This parameter was tested in order to fine-tune the degree ofclumping present in the Marxan solutions. The Feature PenaltyFactor parameter is a user-defined weighting which controls howmuch emphasis is placed on fully representing a particular inputfeature in the solution. This parameter was calibrated to ensure thatMarxan was adequately reaching its targets for each input feature.
2.2.3. Ecological Marxan analyses
Once Marxan parameters were finalised through calibration,the BCMCA explored a range of ‘‘What ify?’’ scenarios designedto identify areas of high conservation value. Eighteen ecologicalscenarios were used: High, medium and low target scenarios forthe targets set by experts during the workshops as well as thoseidentified by the Project Team. Each of these six scenarios had

N.C. Ban et al. / Marine Policy 39 (2013) 11–2014
three sub-scenarios with different BLMs. The best and summedsolutions were mapped for all scenarios.
2.2.4. Human use Marxan analyses
Marxan was used to produce a range of solutions for thehuman use scenarios. In this case, the scenarios were designed toexplore the most efficient reduction of footprint for each humanuse sector. For each of the six human use sectors, five separatescenarios were performed to explore how a range of reductions ineach sector’s use would affect that sector’s footprint. Reductionvalues of 5%, 10%, 15%, 20%, and 25% were applied resulting in arange of corresponding Marxan targets (95%, 90%, 85%, 80%, and75%) and a total of 30 unique scenarios. Various metrics wereused in Marxan for characterising the human use data. Marxanruns for commercial fishing targeted total catch; ocean energyused a combination of area and relative importance; shipping andtransport, and tourism and recreation, used relative intensity; andsport fishing and tenures used area. The best and summedsolutions for all scenarios were mapped but are not shown here.
2.2.5. Overlap analyses
ArcGIS was used to identify the per cent of overlap betweenthe six human use sectors and one example solution from anecological Marxan scenario. The scenario with the Project Teammedium targets and medium clump size was chosen for thisoverlap analysis because it illustrates a middle-of-the-road sce-nario. For each of the human use sectors, the combined footprintof all uses within each sector was used. Some caveats regardingthe footprint data are that they only reflect the mapped footprint(which may or may not represent the most current footprint), andnot the relative importance for any particular human use.
Fig. 2. Illustration of the problem of using two sizes of planning units. The effect
was tested with one feature that was distributed across all planning units, with
cost reflecting the size of planning units. The smaller planning units located
inshore of the continental shelf, 2 km by 2 km, were selected more frequently
(redder, darker colours) than the larger 4 km by 4 km planning units located
offshore (yellow, lighter colours).
3. Results
3.1. Collation of existing data
110 biophysical datasets were collated and refined, whereapplicable, to create 200 features, many of which were targeted byclass or region in the Marxan analyses (see Supplementary Table 1).Reports from each of the workshops were posted online (http://www.bcmca.ca/document-library/). Once the datasets were collatedinto the recommended features, the features were reviewed byexperts. Features, and reviewer comments for each feature, can befound in the online data library (http://www.bcmca.ca/data/).
Seventy-eight human use datasets were collated and refinedwhere applicable (see Supplementary Table 2). These datasetswere identified through the process described in Section 2.1above. Once the datasets were collated into features for eachhuman use sector, members of the human use data workinggroup were provided an opportunity to review relevant features.The purpose of the review was threefold; to identify deficienciesin the data, to identify missing or proprietary data, and to recordconcerns about use of the data. In some cases features anddescriptions drafted for atlas facing pages were circulated toother experts (i.e. people who partake in those uses) for furtherreview; in others (i.e. tenures) no review was undertaken as thedata were generally considered accurate. Features, and reviewercomments for each feature or human use, can be found in theonline data library (http://www.bcmca.ca/data/).
3.2. Marxan analyses
3.2.1. Targets
Low, medium and high values for ecological targets wereidentified from the ranges recommended at expert workshops (as
described in Section 2.2.1) (see Supplementary Table 1). For theProject Team scenarios, features were split into two categories:representational (i.e., whether the feature represents an ecosystemor species) or special (i.e., higher target warranted if a species hasbeen listed as endangered or threatened, for example, Fig. 1).Representational features were assigned low, medium and hightargets of 10, 20 and 30% while special features were assignedtargets of 20, 40 and 60%. The Project Team also considered usingthe footprint – spatial extent – of a feature to determine targets(i.e., so that features covering a large portion of the coast havesmaller targets than those with small footprints), but decided notto pursue this criteria because no feature covered more than 14 percent of the coast, and it would have raised too many additionalquestions (e.g., Should the % of shoreline linear features becalculated for each ecoregion? Or for the coast overall? Whathappens if % is high in just one region? How high is too high?).
Human use targets were set based on the human use workinggroup recommendation of conducting analyses where the usedeclines by 5% for each scenario, and the metric for that usedepends upon the sector. Therefore scenarios consisting of thesefive target values: 95%, 90%, 85%, 80% and 75% were run for eachof the six human use sectors.
3.2.2. Calibration
Sensitivity tests uncovered a problem with the initial plan ofusing two different-sized planning units (smaller nearshore andlarger offshore) in the same Marxan analysis. Marxan solutions forruns using a BLM equal to zero, area as cost, and a single featurefilling all planning units equally but targeted at 30%, significantlyfavoured the smaller planning units (Fig. 2). The problem wasresolved by using only one size of planning units, although thetrade-off was increased computing time. Additional details of howthe problem was discovered and solved are provided in the MarxanGood Practices Handbook, Version 2 (Box 8.1) [22].
Other calibration tests included number of iterations, boundarylength modifier, and feature penalty. We determined that 750million or 1 billion iterations effectively and efficiently producedsolutions that adequately considered the solution space (Fig. 3A).The ecological runs used 1 billion iterations while the human useruns used 750 million iterations because there were more ecologicalfeatures than human use features, thus warranting more iterations.The BLM for the ecological analyses was determined by calibrationand visual inspection of several options and consensus decision bythe Project Team (Fig. 3B). BLMs of 0, 750, and 2500 were chosen to

Fig. 3. Calibration used in Marxan. (A) Calibration of the number of iterations needed in Marxan to obtain efficient solutions that meet targets. Results shown are from
runs using physical data only (more than 75% of the final features). (B) Calibration of the boundary length modifier (BLM).
Fig. 4. Overview map and number of ecological features found in each planning
unit. Blue colours indicate few ecological features, red colours many features.
N.C. Ban et al. / Marine Policy 39 (2013) 11–20 15
illustrate results with no BLM and possible solutions to the range of‘‘What ify?’’ scenarios that might be recommended by planners.The human use runs used a BLM of 1000, accepted by the humanuse data working group as the most appropriate BLM suitable foruse across all six sectors. A consistent feature penalty factor of 8 wasused for ecological features, and 500 for human use features.
3.2.3. Ecological Marxan analyses
Ecological data and Marxan results show the importance ofnearshore and continental shelf regions. Overlaying all ecologicaldatasets (i.e., displaying data richness, Fig. 4) shows that much of theavailable data hugs the shoreline, likely the result of a combination ofsurvey effort and actual elevated biodiversity along the nearshore andon the continental shelf. The various ecological Marxan results – low,medium, and high targets (expert [Fig. 5] and Project Team derived[Fig. 6]) using medium and large clumps – highlight similar areas asbeing of high conservation value. The results are intuitive: lowertargets depict fewer areas as being of high importance compared to

Fig. 5. Selection frequency of Marxan results from ecological runs using target ranges recommended by experts. Blue colours indicate areas selected less frequently in
Marxan runs, green colours those with intermediate selection, and orange colours those selected most frequently. The panels show results for the scenarios that used: (A)
Low targets, medium clump size. (B) Low targets, large clump size. (C) Medium targets, medium clump size. (D) Medium targets, large clump size. (E) High targets, medium
clump size. (F) High targets, large clump size.
N.C. Ban et al. / Marine Policy 39 (2013) 11–2016
high targets, and medium clump size solutions shows smaller areashighlighted than those with large clump size (Figs. 5 and 6). Despitehaving different target ranges, the expert-set and Project Team-settarget ranges (medium, high) show similar patterns and areas asbeing important for conservation. Targets were met 95% of the timeor better. The expert recommended targets ranged up to 100%, andfeatures targeted at this level were underrepresented more often thanothers.
3.2.4. Human use Marxan analyses
Data richness layers for the six categories of human uses showthat all, except for shipping and transport, are closely linked tothe shoreline and continental shelf (Fig. 7). As expected, theMarxan results closely mirror the data richness layers, with areasof higher data richness selected more frequently in Marxan. Thehuman use sectors had concerns about the limitations of theinput data (see discussion), and did not want the results pub-lished; hence the maps are not included.
3.2.5. Overlap analyses
Overlapping the footprint of one example solution of anecological Marxan scenario with the footprint of each of the sixhuman use sectors showed that all sectors utilise areas thatappear in the Marxan solution as areas of high conservationvalue. The percentage of the Marxan solution that overlappedthe sector use footprints ranged from 92% (i.e., 92% of planningunits selected by Marxan also contain commercial fisheries) to 3%.Conversely, the area of each sector footprint that overlapped withthe example Marxan solution ranged from 18% to 23% (Table 1).
4. Discussion
The BCMCA project’s multi-year effort to collate existingdata, augment existing datasets by making additional and newdata available, and provide examples of Marxan analyses, hasmade available an impressive resource for marine planners and

Fig. 6. Selection frequency of Marxan results from ecological runs using target ranges recommended by Project Team (see Fig. 1). Blue colours indicate areas selected less
frequently in Marxan runs, green colours those with intermediate selection, and orange colours those selected most frequently. The panels show results for the scenarios
that used: (A) Low targets, medium clump size. (B) Low targets, large clump size. (C) Medium targets, medium clump size. (D) Medium targets, large clump size. (E) High
targets, medium clump size. (F) High targets, large clump size.
N.C. Ban et al. / Marine Policy 39 (2013) 11–20 17
stakeholders in British Columbia and elsewhere. The projectattempted to follow best practices for data analysis [22] for notonly ecological conservation scenarios, but also for involvingstakeholder groups and integrating human use data into analyses[23,24]. These data and supporting Marxan analyses may alsohave utility for habitat mangers, marine ecologists, oil spillresponse teams, coarse scale environmental assessments andmarine protected area design—all applications beyond the pro-ject’s intent to support MSP efforts. It provides a successfulexample of a collaborative effort to move ahead with preparatorywork for marine planning without requiring the mandate to carryout the planning, a situation that likely applies to many otherregions where marine planning has not been initiated.
While data collation is time-intensive, although relativelystraightforward, the experience of the BCMCA project withMarxan analyses highlights several lessons that may be of interestto similar endeavours elsewhere. First, setting conservation
targets is notoriously difficult [25,26] and although the BCMCAproject’s approach of using workshops, organised by ecologicaltheme, provided some good input and advice, it also createdseveral challenges. It proved difficult to get experts to recom-mend percentage targets for features and, for those that wereprovided either as specific numbers or as ranges, values differedgreatly among ecological themes (e.g., recommended seabirdstargets differed from marine plant targets and invertebratetargets, etc). Also, experts tended to recommend very highpercentage targets, often 100% for some features, which can skewthe results for features with a large spatial footprint and resultedin some feature targets not being achieved in scenario results.Follow-up sensitivity analyses with several increases to thenumber of iterations did not solve this problem, confirmingrecommendations not to use 100% target values [22]. As a wayaround these issues related to expert recommended targets, theBCMCA Project Team decided to illustrate solutions for three
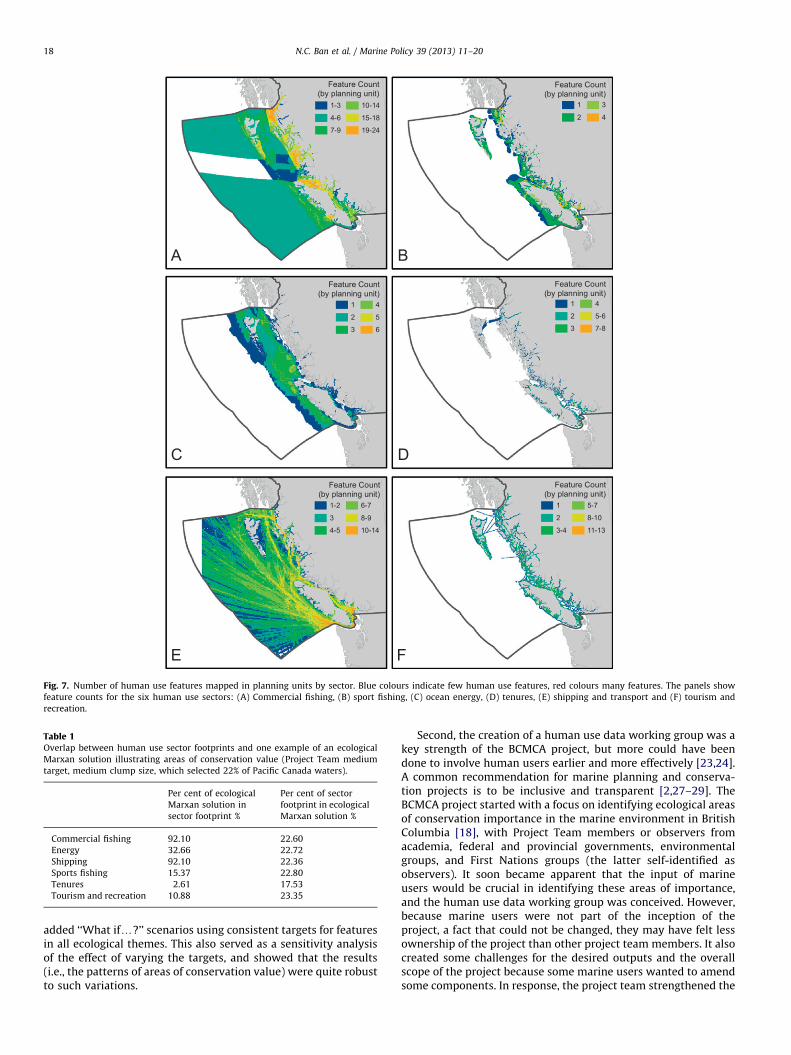
Fig. 7. Number of human use features mapped in planning units by sector. Blue colours indicate few human use features, red colours many features. The panels show
feature counts for the six human use sectors: (A) Commercial fishing, (B) sport fishing, (C) ocean energy, (D) tenures, (E) shipping and transport and (F) tourism and
recreation.
Table 1Overlap between human use sector footprints and one example of an ecological
Marxan solution illustrating areas of conservation value (Project Team medium
target, medium clump size, which selected 22% of Pacific Canada waters).
Per cent of ecological
Marxan solution in
sector footprint %
Per cent of sector
footprint in ecological
Marxan solution %
Commercial fishing 92.10 22.60
Energy 32.66 22.72
Shipping 92.10 22.36
Sports fishing 15.37 22.80
Tenures 2.61 17.53
Tourism and recreation 10.88 23.35
N.C. Ban et al. / Marine Policy 39 (2013) 11–2018
added ‘‘What ify?’’ scenarios using consistent targets for featuresin all ecological themes. This also served as a sensitivity analysisof the effect of varying the targets, and showed that the results(i.e., the patterns of areas of conservation value) were quite robustto such variations.
Second, the creation of a human use data working group was akey strength of the BCMCA project, but more could have beendone to involve human users earlier and more effectively [23,24].A common recommendation for marine planning and conserva-tion projects is to be inclusive and transparent [2,27–29]. TheBCMCA project started with a focus on identifying ecological areasof conservation importance in the marine environment in BritishColumbia [18], with Project Team members or observers fromacademia, federal and provincial governments, environmentalgroups, and First Nations groups (the latter self-identified asobservers). It soon became apparent that the input of marineusers would be crucial in identifying these areas of importance,and the human use data working group was conceived. However,because marine users were not part of the inception of theproject, a fact that could not be changed, they may have felt lessownership of the project than other project team members. It alsocreated some challenges for the desired outputs and the overallscope of the project because some marine users wanted to amendsome components. In response, the project team strengthened the
N.C. Ban et al. / Marine Policy 39 (2013) 11–20 19
terms of reference and clarified terminology based on commentsfrom marine users. Additional time was needed to build the newrelationships with marine users within the Project Team. Further-more, members of the working group had a different backgroundthan most of the Project Team, and for this reason a concertedeffort was made to introduce Marxan and systematic conserva-tion planning concepts to them. Terminology used in conserva-tion planning did not always directly translate to the day-to-daylexicon of members of the working group, highlighting theimportance of regular, two-way communication. A facilitator,independent of the process, was hired to ensure the workinggroup process was meaningful to participants, that all partici-pants’ input was obtained, concerns recognised, addressed wherepossible, and documented where they could not be addressed.
Third, experts, including human use sector representatives,were crucial to identifying the limitations of existing human usedata for use in Marxan, and data gaps. Challenges are similar forecological and human use data. For example, some species dis-tributions and human uses are seasonal, and where spatiallyexplicit seasonality data are missing, Marxan results do not capturesuch nuanced information. Similarly, some areas may be particu-larly important for some species or human uses (e.g., spawninggrounds, shipping traffic to small communities, fishing areas closeto communities), but this level of detail may not be represented inavailable data. Thus, although analyses were designed to identifyareas important to ecosystems and human users, with little or norelative value information in the data sets, Marxan uses datadensity to determine areas of importance. Another data limitationis that the time period over which data were originally collectedwas not consistent. Some data are older, even though they may bethe best-available data, and data sets for different features used ina single analysis may have been compiled for different timeperiods. Furthermore, data illustrated for some features may notreflect current or future reality in terms of the various measures ofrelative importance. Both ecological and human use features shiftspatially over time due to ongoing changes in the environment andmanagement. Thus feedback from the human use sectors was thatthe Marxan results for human uses were of limited value, and maynot represent actual areas of importance.
Fourth, as highlighted in the Marxan Good Practices Handbook[22], the BCMCA project found that calibrating parameters inMarxan and documenting and communicating data limitationswas crucial. Calibration uncovered problems with the external edgesand the use of two sizes of planning units. Without carefulcalibration, the analyses would not be robust, and the results mightnot have represented areas of conservation value. Similarly, becausesuch a project involves a vast amount of data and numerous dataproviders, clear and transparent documentation of the limitations ofeach dataset is very important. Without this, the integrity of theproject and its results could be compromised. One of the particularstrengths of the BCMCA project’s atlas is that it pairs each map witha facing page that documents details of the data sources, limitations,and any other comments noted as important by peer reviewers ofthe dataset(s) illustrated on the map.
Fifth, unfamiliarity with Marxan was an obstacle, but asurmountable one. Education about Marxan, how it works, whatit does, and what it is used for, was necessary with mostparticipants—e.g., ecological experts, data providers, governmentemployees, non-profit groups and marine users. Much effort wasput into educating participants about this tool and its potentialuses and limitations. An ancillary benefit to the marine basedcommunity in British Columbia is a better understanding ofMarxan, both its strengths and limitations. This may prove usefulfor marine planning processes in the future.
Finally, while the BCMCA project was made possible in partbecause of the commitment and dedication of many people who
volunteered their time, having adequate funding ultimately madethe project possible. Some groups needed funding to participate,workshops cost money, GIS contractors were needed for prepara-tion of the many datasets, and so on. Thus, while volunteer effortscan go a long way to instigating a data collation and analysisproject, to realise its full potential, the BCMCA required financialresources to be completed.
Ultimately, one of the most important benefits of a projectsuch as the BCMCA is the development and maintenance ofworking relationships among stakeholder groups. As shown bythe exploratory overlap analyses, marine areas of conservationvalue in the Canadian Pacific are also important to a variety ofstakeholders. The process that the BCMCA project developed –including development of a Project Team, human use workinggroup, user group outreach, presentations to planners – served toget parties to work together, strengthen relationships, raiseawareness about the need for data collation and analysis, andeducate marine users and others on the value of quality data andMarxan analyses. Communication with collaborators was a part ofthe project throughout. Such benefits are difficult to substantiate,yet anecdotal feedback from participants indicates that commu-nication and collaboration among stakeholders has improvedbecause of the project, and that the BCMCA’s data products arein high demand.
This project affirmed the importance of several issues dis-cussed in the marine spatial planning and conservation planningliteratures. Involving stakeholders early in the process is impor-tant for their support for the project [23,24], but it is also difficultto conceive a project with all stakeholders involved—a conun-drum that most planning processes are faced with [7,9,15,30].Having good data is important for achieving quality analyses, butmuch more emphasis exists in the literature on how to incorpo-rate ecological than social data [2,3,23]. Ultimately, the accep-tance of any project’s analyses – and the BCMCA’s in particularbecause the project itself does not have an implementationmandate – depends upon acceptance by stakeholders, which ispartly influenced by the process followed and the quality of thedata and analyses.
5. Conclusion
The BCMCA project has been invaluable in supporting MSPinitiatives in British Columbia. The BCMCA project has receivedadditional funding for a period ending May 2013 for productsupport, updates to select datasets, and support (if requested) tomarine planning processes that are now underway. Additionalcommunication and outreach are also planned to help peopleunderstand and build trust in the data products and supportinganalyses. Furthermore, the Project Team is interested in exploringtradeoffs and win-win solutions for human uses and conservation.The simple overlap analyses reported here were illustrative only;more sophisticated and informative analyses would be useful. Forexample, possible use of a sister tool of Marxan, Marxan with Zones[12], to develop trade-off curves between different human uses andecological features, is under discussion. This is one way to exploreanalysing and visualising overlap amongst users and betweenhuman uses and biodiversity hotspots.
Acknowledgements
We recognise and thank all the BCMCA Project Team partici-pants and representatives on the Human Use Data Working Groupfor their thoughtful collaboration in steering the project (http://www.bcmca.net/data/atlas/). The BCMCA Project Team is grateful

N.C. Ban et al. / Marine Policy 39 (2013) 11–2020
to the many people who participated in workshops, contributeddata and knowledge and helped to steer this work to completion.We also wish to thank the human use sectors for feedback on adraft version of this manuscript, especially Douglas Daugert andMichelle James. The BCMCA is a project of Tides Canada Initiativesand this work would not have been possible without the fundingsupport of the Gordon and Betty Moore Foundation (GBMF)Marine Conservation Initiative and the David and Lucile PackardFoundation. Other organisations who contributed funding includethe David Suzuki Foundation, Fisheries and Oceans Canada, LivingOceans Society and the Royal Caribbean Oceans Fund. We alsothank the Pacific Marine Analysis and Research Association(PacMARA) for jointly hosting and funding the PacMARA/BCMCAinternational Marxan workshop.
Appendix A. Supplementary Information
Supplementary data associated with this article can be foundin the online version at http://dx.doi.org/10.1016/j.marpol.2012.10.017.
References
[1] Worm B, Hilborn R, Baum JK, Branch TA, Collie JS, Costello C, et al. Rebuildingglobal fisheries. Science 2009;325:578–85.
[2] Foley MM, Halpern BS, Micheli F, Armsby MH, Caldwell MR, Crain CM, et al.Guiding ecological principles for marine spatial planning. Mar Policy2010;34:955–66.
[3] Douvere F. The importance of marine spatial planning in advancingecosystem-based sea use management. Mar Policy 2008;32:762–71.
[4] Margules CR, Pressey RL. Systematic conservation planning. Nature 2000;405:243–53.
[5] Pressey RL, Bottrill MC. Approaches to landscape- and seascape-scale con-servation planning: convergence, contrasts and challenges. Oryx 2009;43:464–75.
[6] Fernandes L, Day J, Lewis A, Slegers S, Kerrigan B, Breen D, et al. Establishingrepresentative no-take areas in the Great Barrier Reef: large-scale imple-mentation of theory on marine protected areas. Conserv Biol 2005;19:1733–44.
[7] Douvere F, Maes F, Vanhulle A, Schrijvers J. The role of marine spatialplanning in sea use management: the Belgian case. Mar Policy 2007;31:182–91.
[8] Klein CJ, Steinback C, Watts M, Scholz AJ, Possingham HP. Spatial marinezoning for fisheries and conservation. Front Ecol Environ 2010;8:349–53.
[9] Day V, Paxinos R, Emmett J, Wright A, Goecker M. The Marine PlanningFramework for South Australia: a new ecosystem-based zoning policy formarine management. Mar Policy 2008;32:535–43.
[10] Possingham HP, Ball IR, Andelman S. Mathematical methods for identifyingrepresentative reserve networks. In: Ferson S, Burgman M, editors. Quanti-tative methods for conservation biology. New York: Springer-Verlag; 2000.p. 291–305.
[11] Ball IR, Possingham HP, Watts M. Marxan and relatives: software for spatialconservation prioritisation. In: Moilanen A, Wilson KA, Possingham HP,editors. Spatial conservation prioritisation: quantitative methods and com-putational tools. Oxford, United Kingdom: Oxford University Press; 2009.p. 185–95.
[12] Watts ME, Ball IR, Stewart RS, Klein CJ, Wilson K, Steinback C, et al. Marxanwith zones: software for optimal conservation based land- and sea-usezoning. Environ Model Software 2009;24:1513–21.
[13] Ban NC, Vincent ACJ. Beyond marine reserves: exploring the approach ofselecting areas where fishing is permitted, rather than prohibited. PLoS One2009;4:e6258.
[14] Government of Canada. Canada’s oceans strategy. Ottawa, Ontario. Fisheriesand Oceans Canada, Oceans Directorate; 2002. p. 1–32.
[15] Guenette S, Alder J. Lessons from marine protected areas and integratedocean management initiatives in Canada. Coastal Manage 2007;35:51–78.
[16] Jessen S, Ban N. Establishing marine protected areas in British Columbia: anNGO perspective. In: Beumer JP, Grant A, Smith DC, editors. Aquaticprotected areas: what works best and how do we know? Cairns, Australia:Australian Society for Fish Biology; 2002. p. 377–87.
[17] Peterson DL, Wood A, Gardner J. As assessment of Fisheries and OceansCanada Pacific Region’s effectiveness in meeting its conservation mandate.Vancouver, BC. David Suzuki Foundation; 2005. p. 1–137.
[18] Ban N, Royle K, Short C, Davis N, Bodtker K, Bryan T, et al. Identifyingpriority areas for marine conservation in BC: a collaborative approach. In:Bondrup-Nielsen S, Beazley K, Bissix G, Colville D, Flemming S, Herman T,et al., editors. Ecosystem based management: beyond boundaries proceed-ings of the sixth international conference of science and the management ofprotected areas, 21–26 May 2007. Acadia University, Wolfville, Nova Scotia:Science and Management of Protected Areas Association, Wolfville, NS.;2010. p. 251–62.
[19] Ferdana Z. Case Study: Pacific Northwest Coast (PNWC) Ecoregion OffshoreClassification Methodology. Ecoregional Assessment Toolkit; 2006. /http://science.natureconservancy.ca/centralinterior/docs/ERAtoolbox/7/Standard7_casestudy_PNWC.pdfS.
[20] Ball IR, Possingham H. Marxan (V1.8.2): marine reserve design using spatiallyexplicit annealing. A manual. 1.8.2 ed; 2000.
[21] Ban NC, Klein CJ. Spatial socio-economic data as a cost in systematic marineconservation planning. Conserv Lett 2009;2:206–15.
[22] Ardron JA, Possingham HP, Klein CJ. Marxan good practices handbook.Version 2 Pacific Marine Analysis and Research Association, Vancouver, BC,Canada; 2010.
[23] Ban NC, Mills M, Tam J, Hicks C, Klain S, Stoeckl N, et al. Towards a social–ecological approach for conservation planning: embedding social considera-tions. Frontiers in Ecology and the Environment; http://dx.doi.org/10.1890/110205, in press.
[24] Pomeroy R, Douvere F. The engagement of stakeholders in the marine spatialplanning process. Mar Policy 2008;32:816–22.
[25] Salafsky N, Margoluis R, Redford KH, Robinson JG. Improving the practice ofconservation: a conceptual framework and research agenda for conservationscience. Conserv Biol 2002;16:1469–79.
[26] Groves CR, Jensen DB, Valutis LL, Redford KH, Shaffer ML, Scott JM, et al.Planning for biodiversity conservation: putting conservation science intopractice. Bioscience 2002;52:499–512.
[27] Knight AT, Cowling RM, Campbell BM. An operational model for implement-ing conservation action. Conserv Biol 2006;20:739–50.
[28] Gilliland PM, Laffoley D. Key elements and steps in the process of developingecosystem-based marine spatial planning. Mar Policy 2008;32:787–96.
[29] Plasman IC. Implementing marine spatial planning: a policy perspective. MarPolicy 2008;32:811–5.
[30] Ehler C. Conclusions: benefits, lessons learned, and future challenges ofmarine spatial planning. Mar Policy 2008;32:840–3.