setting benchmarks for early grade reading october 1, … benchmarks for early... · setting...
TRANSCRIPT

Setting Benchmarks for Early Grade Reading
October 1, 2015
Agenda
8:30 a.m. – 9:00 a.m. Registration and Coffee
9:00 a.m. – 9:10 a.m. Welcome
Barbara N. Turner, URC, President
Penelope Bender, USAID, Goal 1 Lead/ Senior Education Advisor
Facilitators Simon King, RTI, Research Statistician
Joe DeStefano, RTI, Director of the Policy, Systems, and Governance Program
9:10 a.m. – 9:30 a.m. Introduction: Importance of Reading in the Early Grades
Defining and Discussing Benchmarks
9:30 a.m. – 10:15 a.m. Evidence and Process: The Science and Common Sense
of Setting Benchmarks
10:15 a.m. – 11:00 a.m. Guidelines for and Examples of Benchmarking Work
11:00 a.m. – 11:30 a.m. Break
11:30 a.m. – 1:15 p.m. Applying Benchmarking and Target Setting
Working Lunch: Case Study Exercises
1:15 p.m. – 2:00 p.m.
Conclusion, Questions and Answers

1
Meet the Facilitators
Simon King is a research statistician with interests in survey methodology and
analysis. Mr. King has assisted with survey design and analysis on many of RTI’s
international education projects. Mr. King has developed data visualization,
analysis, and monitoring capabilities for international education projects using
geographical information systems (GIS). Mr. King oversees the data management
and analysis for all of RTI’s EdData II task orders and other projects involving
EGRA/EGMA data collection. Prior to working for RTI, Mr. King was involved in
K–12 education, notably as a principal of a charter school and as a volunteer
teacher working for the British Department for International Development (DFID)
in rural Zambia.
Joe DeStefano is the Director of the Policy, Systems, and Governance Program
in the International Education Division of RTI International. His 30 years of
experience includes a full range of K–12 education issues—from teaching and
learning, to teacher professional development, to school-community relations,
finance, and policy and system reform. He has provided technical assistance
and support to urban school districts in the United States and to ministries of
education throughout the developing world. Mr. DeStefano has also conducted
extensive research on the topics of early grade reading and math; school
effectiveness; community-based approaches to education; education reform;
teacher supply and demand; and education finance, governance and
management. He grew up in the Bronx, New York, and received an EdM from
the Harvard Graduate School of Education.

Supporting the Development of
Reading Performance
Benchmarks
October 1, 2015
EdData II Education Data for Decision Making
Prepared by Joseph DeStefano and Simon King
RTI International, Research Triangle Park, North Carolina, USA 1

2
About the Presentation
• This presentation was prepared for the Early Grade Reading
Professional Development Series in Chevy Chase, Maryland, on
October 1, 2015. The webinar and workshop were organized by
RTI International and URC, LLC, for participants in the Global
Reading Network.
• The USAID EdData II project is led by RTI International.
“Measurement and Research Support to Education Strategy
Goal 1” is EdData II RTI Task Order Number 20, Activity 7, AID-
OAA-12-BC-00003.
• The process for developing benchmarks is based on the
experience of the EdData II project, Task Order 20, supporting the
establishment of benchmarks in Egypt, Ghana, Jordan, Liberia,
Malawi, Pakistan, the Philippines, Tanzania, and Zambia.

Overview of Workshop Objectives
By the end of today’s workshop, participants will have:
A sound understanding of what data and processes are
needed to work with a country to set benchmarks
Guidelines for conducting benchmarking work
Recommendations for conducting benchmarking based on
lessons learned and current best practice

This
is
how
most
grade 3 kids
in
Africa
read.
This
is
how
most
grade 3 kids
in
rich countries (OECD)
read.
Why is reading important in early grades?
Without learning to read well, students cannot easily read to learn.

UNDERSTANDING
BENCHMARKS
6

What are benchmarks?
A benchmark is a standard or point of reference
against which things may be compared or assessed.
7
• Benchmark errors in a factory:
not more than 1 defect per
1,000 items
• Benchmark performance of athletes:
11 seconds to run 100 meters
• Benchmark skills (e.g., reading) to
evaluate student progress:
80% comprehension of text
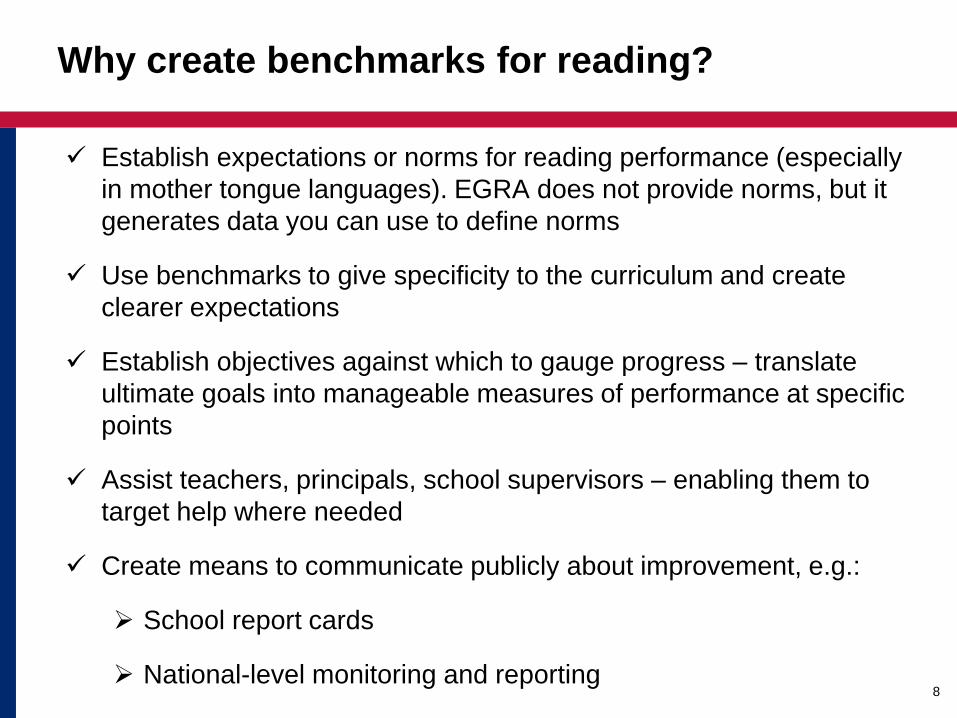
Why create benchmarks for reading?
Establish expectations or norms for reading performance (especially
in mother tongue languages). EGRA does not provide norms, but it
generates data you can use to define norms
Use benchmarks to give specificity to the curriculum and create
clearer expectations
Establish objectives against which to gauge progress – translate
ultimate goals into manageable measures of performance at specific
points
Assist teachers, principals, school supervisors – enabling them to
target help where needed
Create means to communicate publicly about improvement, e.g.:
School report cards
National-level monitoring and reporting
8
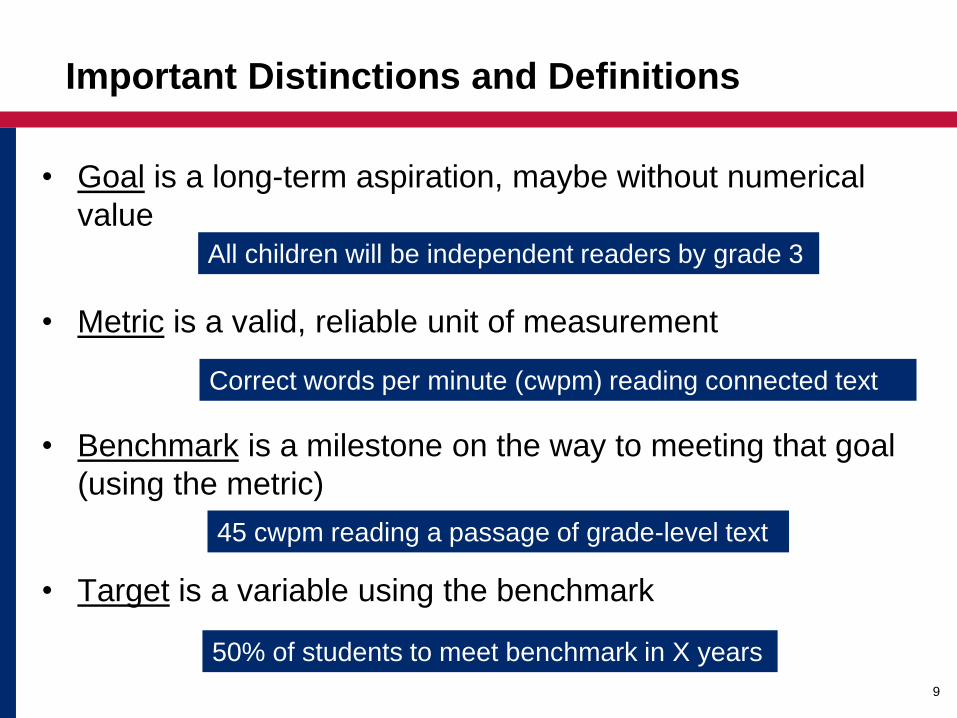
• Goal is a long-term aspiration, maybe without numerical
value
• Metric is a valid, reliable unit of measurement
• Benchmark is a milestone on the way to meeting that goal
(using the metric)
• Target is a variable using the benchmark
9
Important Distinctions and Definitions
All children will be independent readers by grade 3
Correct words per minute (cwpm) reading connected text
45 cwpm reading a passage of grade-level text
50% of students to meet benchmark in X years

PROCESS FOR SETTING
BENCHMARKS
10

Process for Setting Benchmarks: Science or Art?
• Both
• Common sense / science + statistics + wisdom
Curriculum objectives Data on early grade
reading performance
Insights from
science
Experience in other
places
On-the-ground knowledge
of what’s happening
11

Setting Benchmarks: Reading Science
• What is fluency?
Fluency is the ability to read text accurately, quickly, and with
smoothness and expression (NICHD, 2000).
• Dimensions of fluency:
• Accuracy in word decoding
• Automaticity (automatic processing)
• Prosody (reading with smoothness,
phrasing, and expression)
12

Fluency is the bridge that connects word decoding to
comprehension (Rasinski, 2004).
The Importance of Reading Fluency
• Fluency begins before students can read continuous text
• Automaticity of letters, letters and sounds, segmentation of
phonemes, and decoding are initial steps
• For pupils to attain fluency, their word recognition needs to
be accurate and needs to occur at a reasonable rate 13

Fluent vs. Non-Fluent Readers
Readers who are fluent: Readers who have not yet
developed fluency:
Recognize words
automatically
Group words quickly to help
them gain meaning from
what they read
Read aloud effortlessly and
with expression
Sound natural as they read,
as if speaking
Read slowly
May read word by word
Have choppy phrasing
Focus their attention on
figuring out (decoding)
words
Focus little attention on
comprehension
14

The message must pass fast through a very narrow opening
7 items in 12 seconds
Short-term memory
Insights from Cognitive Science
Long-term memory
15

Reading Skills Development and EGRA Subtasks
16
Reading text well enough to understand it
Being able to read familiar words
Being able to decode unfamiliar words
Knowing letters and letter sounds
Knowing enough language to be able to understand things
What being a good reader requires
Some of what EGRA measures
Reading comprehension
Oral reading fluency
Familiar-word fluency
Nonword reading/decoding
Phonological/phonemic awareness― Letter sounds, syllable reading, dictation
Letter names
Listening comprehension

Insights from Cognitive Science
• A sentence of about 7 words read in
about 12 seconds gives roughly:
• One word per 1 – 1.5 second
• 40‒60 words per minute
• And must be done automatically, without
effort
17

Experience from Other Countries: Oral Reading Fluency
18
Oral Reading Fluency Reading Comprehension
Benchmark (cwpm)
% Meeting Benchmark
Benchmark (% correct)
% Meeting Benchmark
Tanzania Gr. 2, Kiswahili 50 12% 80% 8%
Philippines Gr. 2, Ilokano 40 29% 80% 35%
Malawi Gr. 3, Chichewa 50 6% 80% 6%
Egypt Gr. 3, Arabic 60 4% 80% 9%
Measured actual levels at end of grade 1:
Germany 58 cwpm; Spain 43; Holland 38

Examples from USA
End-of-Year Benchmarks from Widely Used US Approach1
(benchmarks for medium-risk students; low-risk benchmarks are much higher)
Gr. 1 Gr. 2 Gr. 3 Notes
Letter or syllable
sound fluency (clspm)
40–45 Often not measured later than
grade 1; assumed to be
mastered
Nonword fluency (cnwpm)
40 50 Assumed mastered at approx.
50 in grade 2; not checked
later
Oral reading fluency
(ORF) 30 80 95
This keeps increasing for all
grades
19
1 Summarized/adapted from various sources, such as: University of Oregon Center on Teaching and Learning, DIBELS 6th edition
benchmark goals; AIMSweb® Growth Tables; and EasyCBM progress monitoring test results.
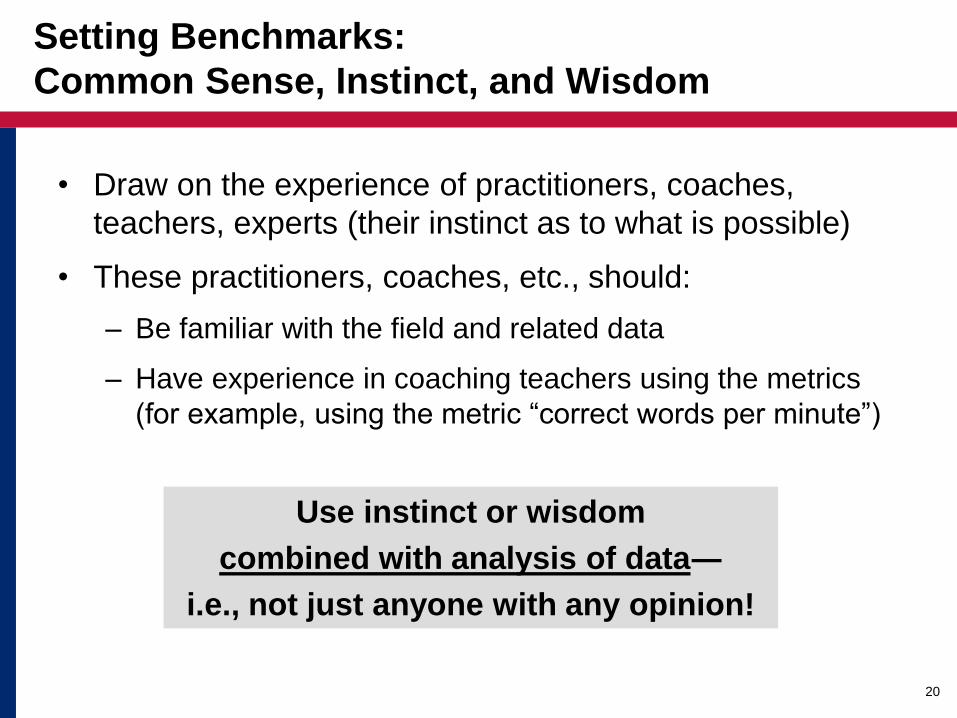
Setting Benchmarks:
Common Sense, Instinct, and Wisdom
• Draw on the experience of practitioners, coaches,
teachers, experts (their instinct as to what is possible)
• These practitioners, coaches, etc., should:
– Be familiar with the field and related data
– Have experience in coaching teachers using the metrics
(for example, using the metric “correct words per minute”)
20
Use instinct or wisdom
combined with analysis of data―
i.e., not just anyone with any opinion!

Summary of the Benchmarking Process
21
Comprehension (% correct)
Oral reading fluency (cwpm)
Decoding (cnwpm)
Letter or syllable sounds (clspm)
0% 50% 100%
0 50 100
0 50 100
0 50 100

QUICK REFRESHER ON
SCATTER PLOTS
22

23
0
1
2
3
4
5
6
0 20 40 60 80Co
mp
reh
en
sio
n Q
ue
sti
on
s A
nsw
ere
d
Oral Reading Fluency (Correct Words Per Minute)
Quick Refresher: How Do Scatter Plots Work?
• Used to denote a “relationship” or
“association”
• Each dot is a student (or school or any
“unit”)
• The dot tells you: For a given level of
fluency, what was the comprehension?
• The line tells you the overall trend,
determined by looking at the dots all
together and seeing how “most students”
trend
• If dots are close to the line, trend is
“stronger”; if they are further from the line
(more spread out), the trend is weaker
• Indicator: Correlation coefficient, or “r,”
which can range from -1 to 0 to 1
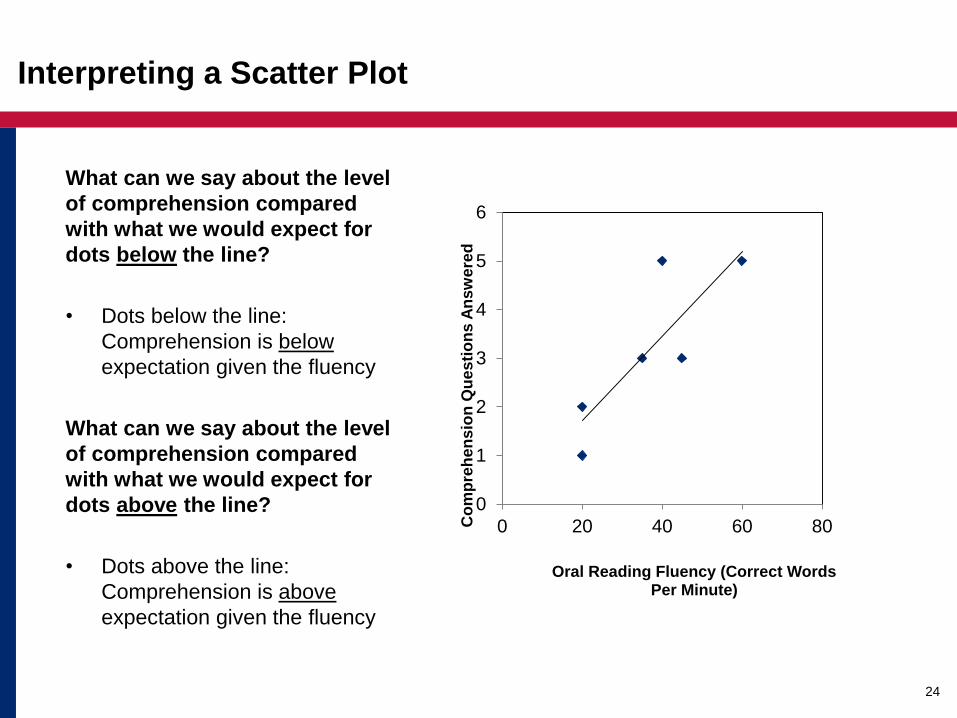
Interpreting a Scatter Plot
What can we say about the level
of comprehension compared
with what we would expect for
dots below the line?
• Dots below the line:
Comprehension is below
expectation given the fluency
What can we say about the level
of comprehension compared
with what we would expect for
dots above the line?
• Dots above the line:
Comprehension is above
expectation given the fluency
24
0
1
2
3
4
5
6
0 20 40 60 80Co
mp
reh
en
sio
n Q
ue
sti
on
s A
nsw
ere
d
Oral Reading Fluency (Correct Words Per Minute)

Scatter Plots and Weighted Data
Question: Which one of the graphs below contains “weighted”
data?
• The majority of EGRA survey designs use “weighted” data.
• In other words, each pupil in the sample has an associated weight― i.e., the
number of pupils in the population that one pupil in the sample represents.
Obviously!?

There’s actually no easy way to show weighted data in a scatter plot!
Tip: Use a bubble
plot, where size of
the bubble
indicates the pupil
level weight.

Histogram Borders
27
These graphs are statistically more accurate.
But, which scatter plot
best demonstrates the
associations and weights
for benchmarking
workshop participants?
ESTABLISHING A BENCHMARK
AND SETTING A TARGET
28

Step-by-Step Instructions
Step 1. Start with reading comprehension.
Step 2. Determine what you think is the appropriate level of comprehension
students should be achieving (100%, 80%, 60%, … of correct responses).
Step 3. Consider the present levels of average performance―for example:
national data, intervention data, means with and without zeroes.
Step 4. When you have agreed on a benchmark value for reading
comprehension (% correct), use the distribution table to see how many students
from your data set were meeting that benchmark level of performance.
Step 5. Discuss what you think is an appropriate near-term target for the
percentage of students who should be meeting the comprehension benchmark
in five years.

Step-by-Step Instructions – continued
Step 6. After completing the exercise for reading comprehension, move on
to oral reading fluency (ORF).
Step 7. Start by examining the relationship between oral reading fluency
and comprehension and identify the range of ORF scores that correspond to
the benchmark for comprehension that you chose.
Step 8. Decide where in that range the ORF benchmark should fall (in other
words, choose a specific value that is within the range).
Step 9. Use the cumulative distribution graph to see how many students
met the ORF benchmark.

USAID Partnership for Education: Ghana Testing, task order under Education Data for
Decision Making (EdData II), 2012–2016, baseline assessment
Benchmarking Example: Ghana 2013, Grade 2 (English)
OBJECTIVES:
• Set a benchmark for ORF and reading comprehension.
• Find the percentage of pupils achieving this
benchmark.
• Project the target percentage of pupils achieving this
benchmark in 5 years.

Box Plot for ORF by Reading Comprehension,
Ghana 2013, Grade 2 (English)

Oral reading fluency: Number summary and mean
Percent correct,
reading
comprehension
Mean Minimum 25th
percentile
50th
percentile
75th
percentile Maximum
Sample
count
0% 5 0 0 3 6 92 7060
20% 29 2 14 25 41 97 339
40% 45 4 33 42 53 124 232
60% 55 3 41 53 67 120 148
80% 73 29 57 69 88 138 89
100% 80 33 63 74 101 138 47
Table Corresponding to Box Plot for ORF by
Reading Comprehension, Ghana 2013, Grade 2

Reading
comprehension
(% correct) Percent Count (no. of pupils)
Zero 89% 7,068
20% 4% 339
40% 3% 232
60% 2% 148
80% 1% 89
100% 1% 47
Distribution of Reading Comprehension
Ghana 2013, Grade 2

Levels of ORF Corresponding to 80% Reading Comprehension
Ghana 2013, Grade 2
% (wt) Sample n
Zero 51% 4148
1-<10 25% 1918
10-<20 10% 777
20-<30 4% 317
30-<40 2% 202
40-<50 2% 173
50-<60 2% 147
60-<70 1% 76
70-<80 1% 50
80-<90 1% 45
90-<100 0% 26
100-<110 0% 20
110-<120 0% 9
120-<130 0% 4
130-<140 0% 3
25th percentile
50th percentile
75th percentile
98%
98% of pupils scored
less than the
benchmark of 70
cwpm.
In 2013, 100%-98%=
2% of pupils met the
target of 70 cwpm.
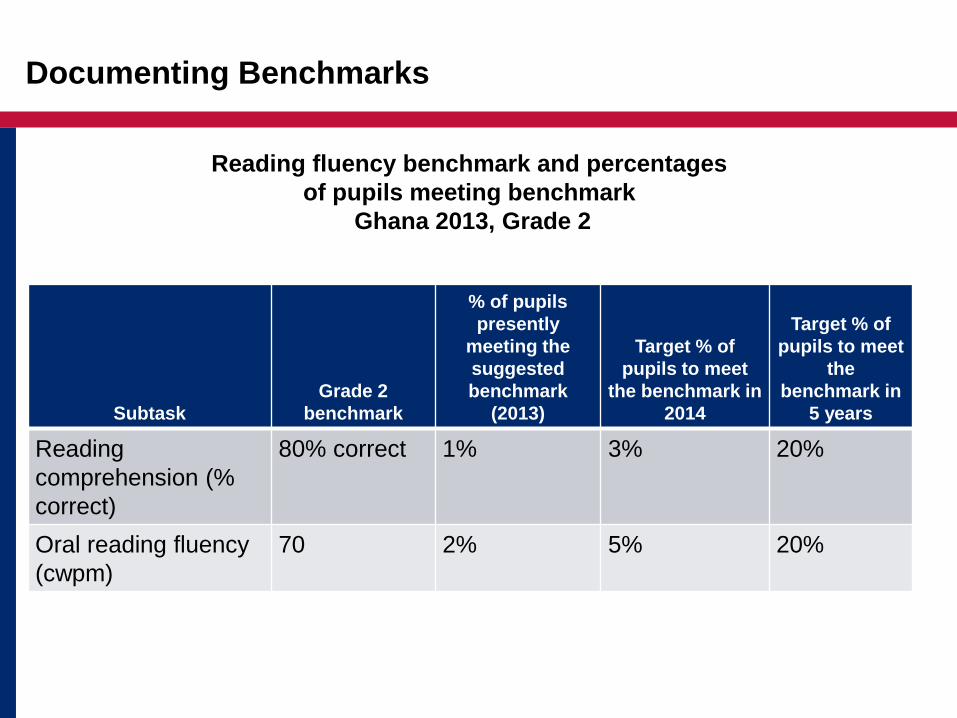
Documenting Benchmarks
Subtask
Grade 2
benchmark
% of pupils
presently
meeting the
suggested
benchmark
(2013)
Target % of
pupils to meet
the benchmark in
2014
Target % of
pupils to meet
the
benchmark in
5 years
Reading
comprehension (%
correct)
80% correct 1% 3% 20%
Oral reading fluency
(cwpm)
70 2% 5% 20%
Reading fluency benchmark and percentages
of pupils meeting benchmark
Ghana 2013, Grade 2

• Setting the target of the percentage of
students meeting the benchmark can be
challenging when we lack data to work
with.
• We can use intervention data, or data
from multiple grades,to set better
targets.
When more data are available:

Practice:
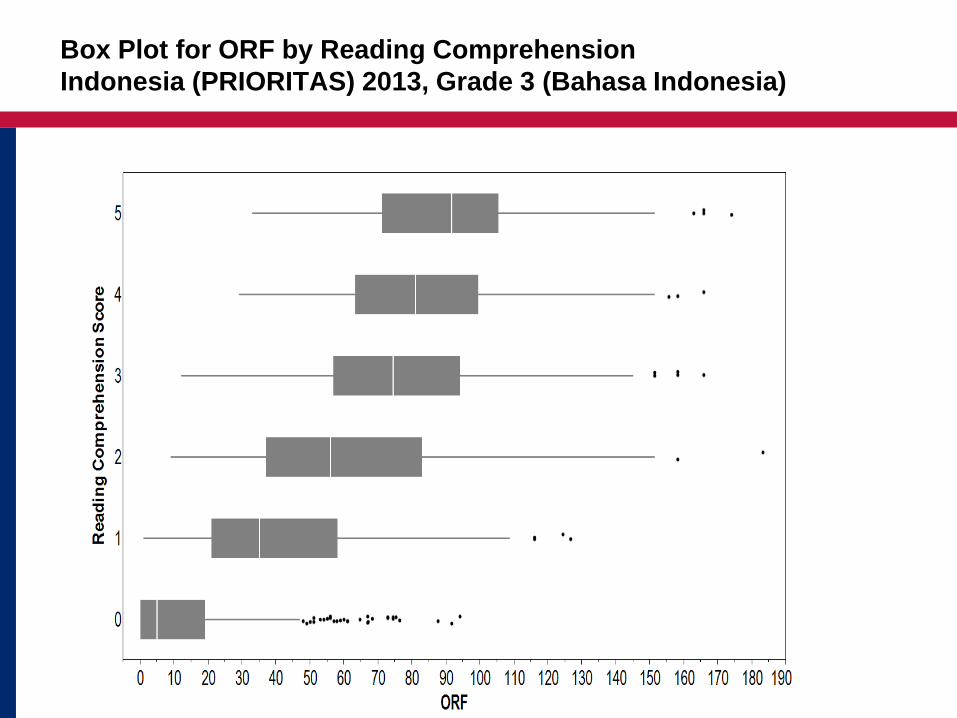
Indonesia (PRIORITAS) 2013, Grade 3 (Bahasa Indonesia)
Prioritizing Reform, Innovation, and Opportunities for Reaching Indonesia's Teachers,
Administrators, and Students (PRIORITAS), 2012–2017, baseline assessment
OBJECTIVES:
• Set a benchmark for ORF.
• Find the percentage of pupils achieving
this benchmark.
• Project the target percentage of pupils
achieving this benchmark over the
next 5 years.

Box Plot for ORF by Reading Comprehension,
Indonesia (PRIORITAS) 2013, Grade 3 (Bahasa Indonesia)

Table Corresponding to Box Plot for ORF by
Reading Comprehension, Indonesia 2013, Grade 3
Oral Reading Fluency: Number summary and mean
% Correct,
Reading
Comprehension
Mean Minimum 25th
percentile
50th
percentile
75th
percentile Maximum
Sample
Count
0% 13.9 0 0 5 19 94 315
20% 41.4 1 21 35 58 127 288
40% 61.4 9 37 56 83 183 382
60% 76.3 12 57 74 94 166 771
80% 81.9 29 63 81 99 166 992
100% 89.3 33 71 92 105 174 823

Cumulative Percent ORF
Indonesia (PRIORITAS), 2013, Grade 3

Documenting Benchmarks
Subtask
Suggested
benchmark
% of pupils
meeting the
benchmark
in 2013
Oral reading
fluency (cwpm)
Reading fluency benchmark and percentages of
pupils meeting benchmark, Indonesia 2013, grade 3

Adding Data from an Intervention Research Study
• Find the percentage of pupils who achieved the
benchmark for the control and intervention schools.
• Find the difference between these two percent
values―This becomes your potential increase in
percentage of pupils achieving the proposed
benchmark.
• Use this difference to project the percentage of pupils
meeting the benchmark for the next 5 years.
Note: Be aware of how many years the intervention has been in
place. Measurement usually takes place after 1 or 2 years; the
potential growth is over that period of time (Indonesia PRIORITAS
was evaluated after 1 year)

Cumulative Percent, ORF
Indonesia (PRIORITAS), 2013, Grade 3
Blue = Intervention
Schools
Red = Control Schools
For example: using 85 cwpm
as a benchmark:
In 2013, 100-60% = 40% of
Intervention schools met the
benchmark, and
100%-66% = 34% of Control
schools met the benchmark of
85 wpm.
We could therefore expect a
40% - 34% = 6 percentage
point increase in the percent of
pupils meeting the benchmark.

Targets: Projected percentage of
pupils meeting benchmark
Subtask
Suggested
Benchmark
% of pupils
meeting the
benchmark in
2013 2014 2015 2016 2017 2018
Oral
Reading
Fluency
(cwpm)
Documenting Benchmarks
Benchmark and targets for ORF
Indonesia (PRIORITAS), Grade 3

In this case:
• The goal could be “reducing the percentage of
students who are struggling the most to develop
reading skills.”
• The objective would be the % of students scoring zero
that you would try to “move down to” from the present
level…
• …Or, what you consider an acceptable level of “zero
scores” for the grade (standard) and skill area under
consideration.
Another Potentially Useful Benchmark:
Improvement at the Low End of the Distribution

Example:
Ghana 2013, Grade 2 (English)
OBJECTIVES:
• Find the percentage of pupils scoring
zero (or similar) in 2013.
• Find the percentage of pupils achieving
this level.
• Project the target percentage of pupils
achieving this level over the next 5
years.

Cumulative Distribution for ORF
Ghana 2013, Grade 2
% (wt) Sample n
Zero 51% 4148
1-<10 25% 1918
10-<20 10% 777
20-<30 4% 317
30-<40 2% 202
40-<50 2% 173
50-<60 2% 147
60-<70 1% 76
70-<80 1% 50
80-<90 1% 45
90-<100 0% 26
100-<110 0% 20
110-<120 0% 9
120-<130 0% 4
130-<140 0% 3
25th percentile
50th percentile
75th percentile

Documenting Benchmarks
Subtask
Grade 2 %
scoring zero
Target % of
pupils scoring
zero in 2014
Target % of
pupils scoring
zero in 5 years
Oral reading fluency
– zero scores 51%
Reading fluency zero scores (or similar)
and percentage of pupils meeting level,
Ghana 2013, Grade 2
Practice:
Liberia 2013, Grade 2 (English)
OBJECTIVES:
• Find the percentage of pupils scoring zero
(or similar) in 2013.
• Find the percentage of pupils achieving
this level.
• Project the target percentage of pupils
achieving this level over the next 5 years.
Liberia Teacher Training Program (LTTP), 2010–2015, midterm assessment

Cumulative Percent, ORF, Liberia 2013, Grade 2

Documenting Benchmarks
Targets % of pupils scoring zero in 5 years
Subtask
Grade 2 %
scoring
zero 1 year 2 years 3 years 4 years 5 years
Oral
reading
fluency –
zero
scores
Reading fluency zero scores (or similar) and
percentage of pupils meeting level
Liberia 2013, Grade 2

Intermediate Benchmarks
Adding an intermediate benchmark is
useful if you want to separate the pupils
who are not proficient and the pupils who
are nonreaders into two separate
categories or classifications.

1. Graph for setting intermediate levels of
reading performance showing ranges of
oral reading scores organized by level of
reading comprehension score
2. Data—Cumulative distribution of
“percentages of students scoring at
different levels” of performance
3. Table to record your results
4. Worksheet to record the justifications for
your benchmarks
Tools for Setting Intermediate Benchmarks

Defining Four Levels of Reading Proficiency
In step 1, you just defined the
benchmark for reading fluently
with full comprehension.
Fluently with
full
comprehension
With increasing
fluency
and
comprehension
Slowly with
limited
comprehension
Nonreader
Nonreaders are children
scoring zero on the oral reading
subtask.
In step 2, you will define these
other levels of reading ability.

Think of the Levels of Reading Proficiency Like a Scale
Fluently with full
comprehension
With increasing
fluency
and
comprehension Slowly with
limited
comprehension
Nonreader
0 5 10 15 20 25 30 35 40 45 50 55
By setting the intermediate benchmark,
we are defining ranges for each level of performance.
Example:
Example:
Ghana 2013, Grade 2 (English)
OBJECTIVES:
• Set benchmark for ORF
• Set a nonreader benchmark for ORF (zero
or similar).
• Set an intermediate benchmark for ORF.
• Find the percentage of pupils achieving
these individual categories.

Box Plot for ORF by Reading Comprehension
Ghana 2013, Grade 2 (English)
We set the
benchmark at
70 cwpm

Box Plot for ORF by Reading Comprehension
Ghana 2013, Grade 2 (English)
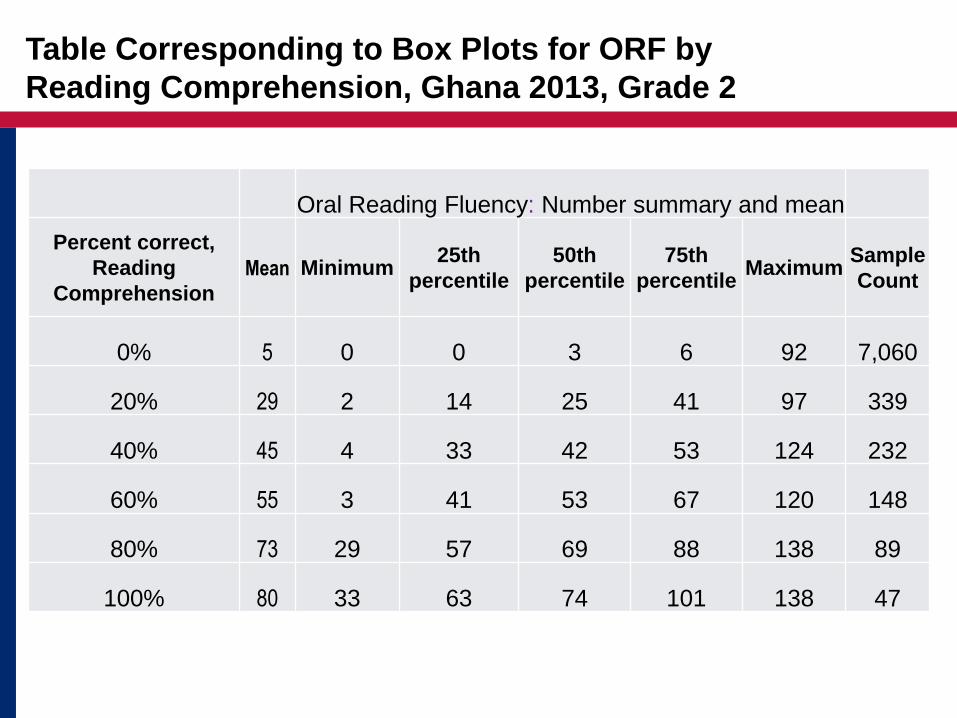
Table Corresponding to Box Plots for ORF by
Reading Comprehension, Ghana 2013, Grade 2
Oral Reading Fluency: Number summary and mean
Percent correct,
Reading
Comprehension
Mean Minimum 25th
percentile
50th
percentile
75th
percentile Maximum
Sample
Count
0% 5 0 0 3 6 92 7,060
20% 29 2 14 25 41 97 339
40% 45 4 33 42 53 124 232
60% 55 3 41 53 67 120 148
80% 73 29 57 69 88 138 89
100% 80 33 63 74 101 138 47
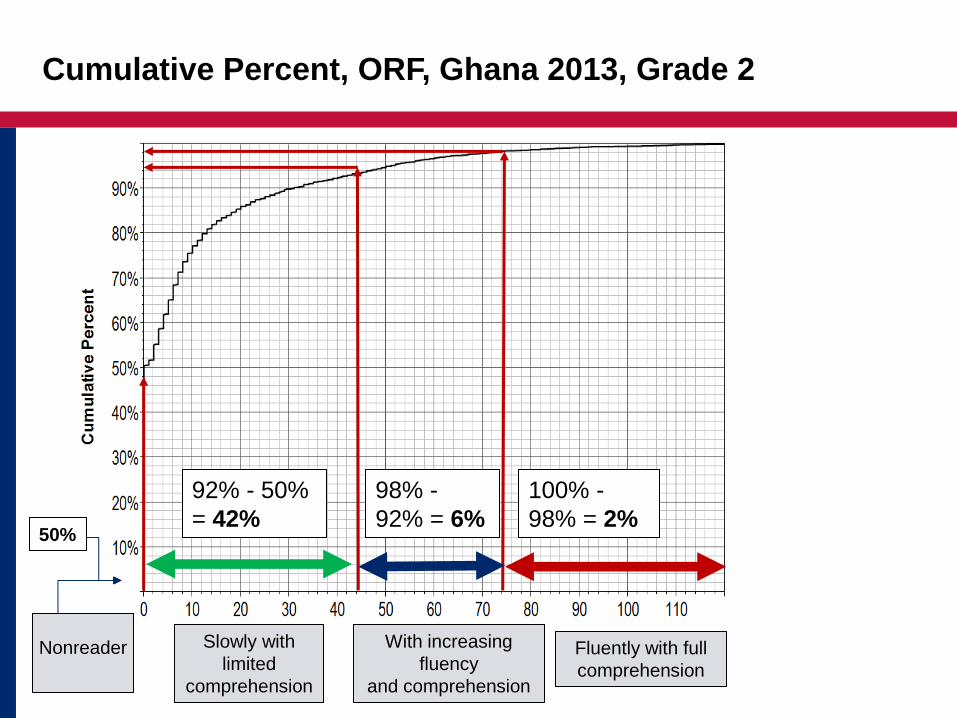
Cumulative Percent, ORF, Ghana 2013, Grade 2
Fluently with full
comprehension
With increasing
fluency
and comprehension
Slowly with
limited
comprehension
Nonreader
92% - 50%
= 42%
98% -
92% = 6%
100% -
98% = 2% 50%
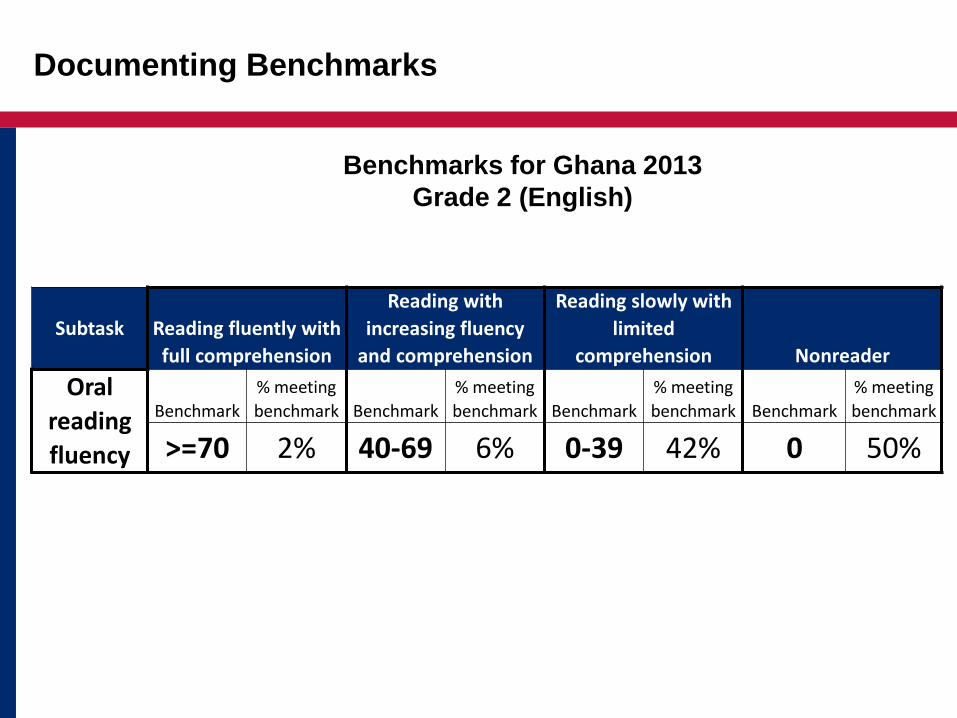
Subtask
Reading fluently with
full comprehension
Reading with
increasing fluency
and comprehension
Reading slowly with
limited
comprehension Nonreader
Oral
reading
fluency
Benchmark
% meeting
benchmark Benchmark
% meeting
benchmark Benchmark
% meeting
benchmark Benchmark
% meeting
benchmark
>=70 2% 40-69 6% 0-39 42% 0 50%
Documenting Benchmarks
Benchmarks for Ghana 2013
Grade 2 (English)
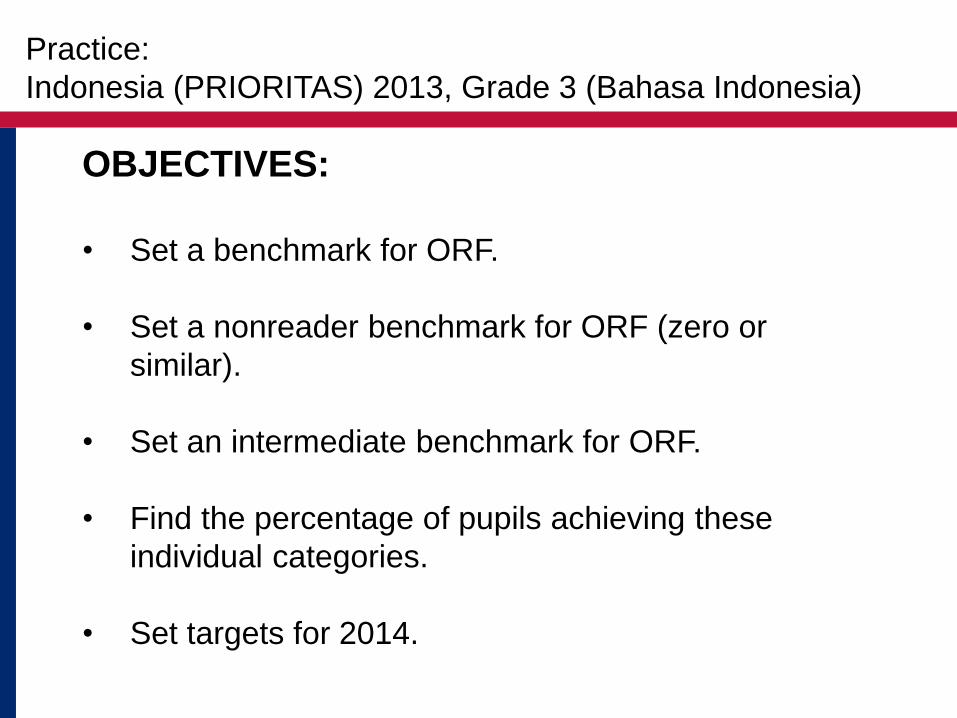
Practice:
Indonesia (PRIORITAS) 2013, Grade 3 (Bahasa Indonesia)
OBJECTIVES:
• Set a benchmark for ORF.
• Set a nonreader benchmark for ORF (zero or
similar).
• Set an intermediate benchmark for ORF.
• Find the percentage of pupils achieving these
individual categories.
• Set targets for 2014.
Box Plot for ORF by Reading Comprehension
Indonesia (PRIORITAS) 2013, Grade 3 (Bahasa Indonesia)

Table Corresponding to Box Plot for ORF by Reading
Comprehension, Indonesia 2013, Grade 3
Oral reading fluency: Number summary and mean
% correct,
Reading
Comprehension
Mean Minimum 25th
percentile
50th
percentile
75th
percentile Maximum Sample Count
0% 13.9 0 0 5 19 94 315
20% 41.4 1 21 35 58 127 288
40% 61.4 9 37 56 83 183 382
60% 76.3 12 57 74 94 166 771
80% 81.9 29 63 81 99 166 992
100% 89.3 33 71 92 105 174 823

Red = Control
Schools
Blue = Treatment
Schools
Cumulative Percent, ORF
Indonesia 2013, Grade

Subtask
Reading fluently with
comprehension
Reading with
increasing fluency and
comprehension
Reading slowly with
limited comprehension Nonreader
Oral
Reading
Fluency
Bench
mark
Range
%
meeting
bench
mark
Target
%
2014
Bench
mark
Range
%
meeting
bench
mark
Target
%
2014
Bench
mark
Range
%
meeting
bench
mark
Target
%
2014
Bench
mark
Range
%
Meeting
Bench
mark
Target
%
2014
Documenting Benchmarks

Benchmarking Case Studies
Instructions:
1) In your packet of materials, find the case study your
group has been assigned.
2) Read the objectives for your case study.
3) Complete the “Desired Outcome” table using the tables
and graphs you have been provided.

References
National Institute of Child Health and Human Development (NICHD) [US]. (2000). Report of the
National Reading Panel. Teaching children to read: An evidence-based assessment of the
scientific research literature on reading and its implications for reading instruction: Reports of
the subgroups (NIH Publication No. 00-4754). Washington, DC: NICHD.
http://www.nichd.nih.gov/publications/pubs/nrp/documents/report.pdf
Rasinski, T. V. (2004). Assessing reading fluency. Prepared for the U.S. Department of Education
under the Regional Educational Laboratory program, Award No. ED01CO0014. Honolulu, HI:
Pacific Resources for Education and Learning. http://files.eric.ed.gov/fulltext/ED483166.pdf
USAID Partnership for Education: Ghana Testing, task order under Education Data for Decision
Making (EdData II), 2012–2016, baseline assessment
Prioritizing Reform, Innovation, and Opportunities for Reaching Indonesia's Teachers,
Administrators, and Students (PRIORITAS), 2012–2017, baseline assessment
69
October 1, 2015 Benchmarking Webinar and Workshop Page 1
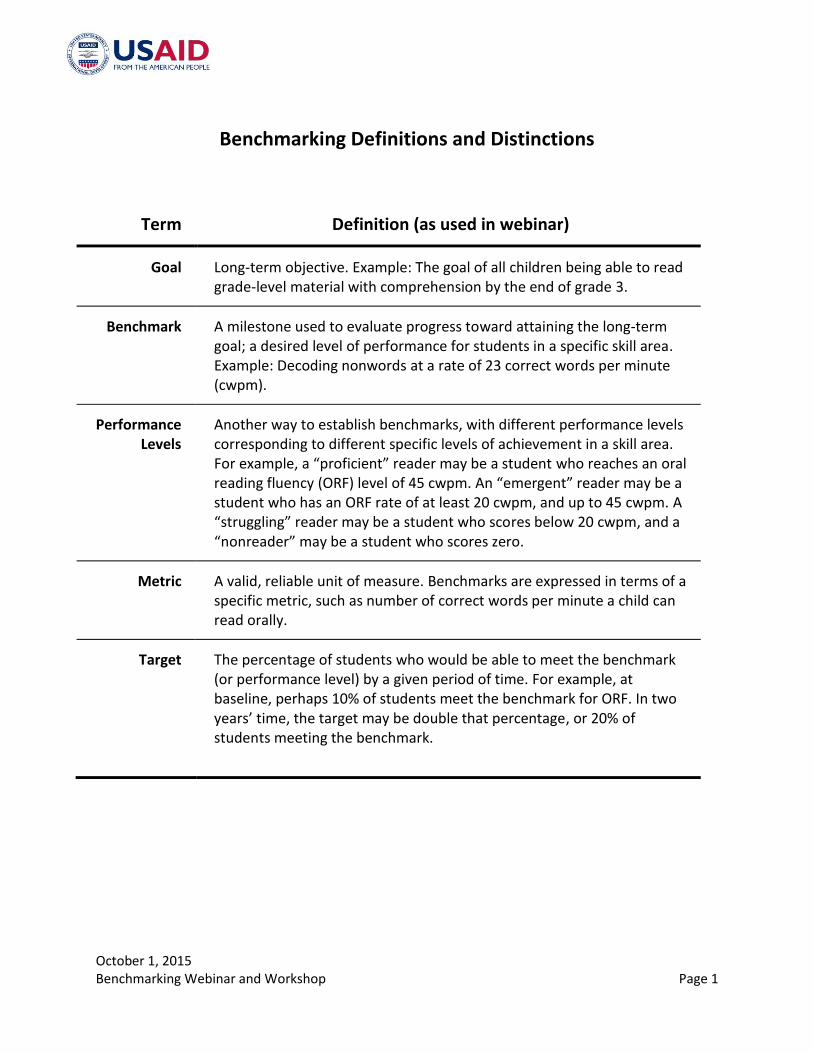
Benchmarking Definitions and Distinctions
Term Definition (as used in webinar)
Goal Long-term objective. Example: The goal of all children being able to read grade-level material with comprehension by the end of grade 3.
Benchmark A milestone used to evaluate progress toward attaining the long-term goal; a desired level of performance for students in a specific skill area. Example: Decoding nonwords at a rate of 23 correct words per minute (cwpm).
Performance Levels
Another way to establish benchmarks, with different performance levels corresponding to different specific levels of achievement in a skill area. For example, a “proficient” reader may be a student who reaches an oral reading fluency (ORF) level of 45 cwpm. An “emergent” reader may be a student who has an ORF rate of at least 20 cwpm, and up to 45 cwpm. A “struggling” reader may be a student who scores below 20 cwpm, and a “nonreader” may be a student who scores zero.
Metric A valid, reliable unit of measure. Benchmarks are expressed in terms of a specific metric, such as number of correct words per minute a child can read orally.
Target The percentage of students who would be able to meet the benchmark (or performance level) by a given period of time. For example, at baseline, perhaps 10% of students meet the benchmark for ORF. In two years’ time, the target may be double that percentage, or 20% of students meeting the benchmark.

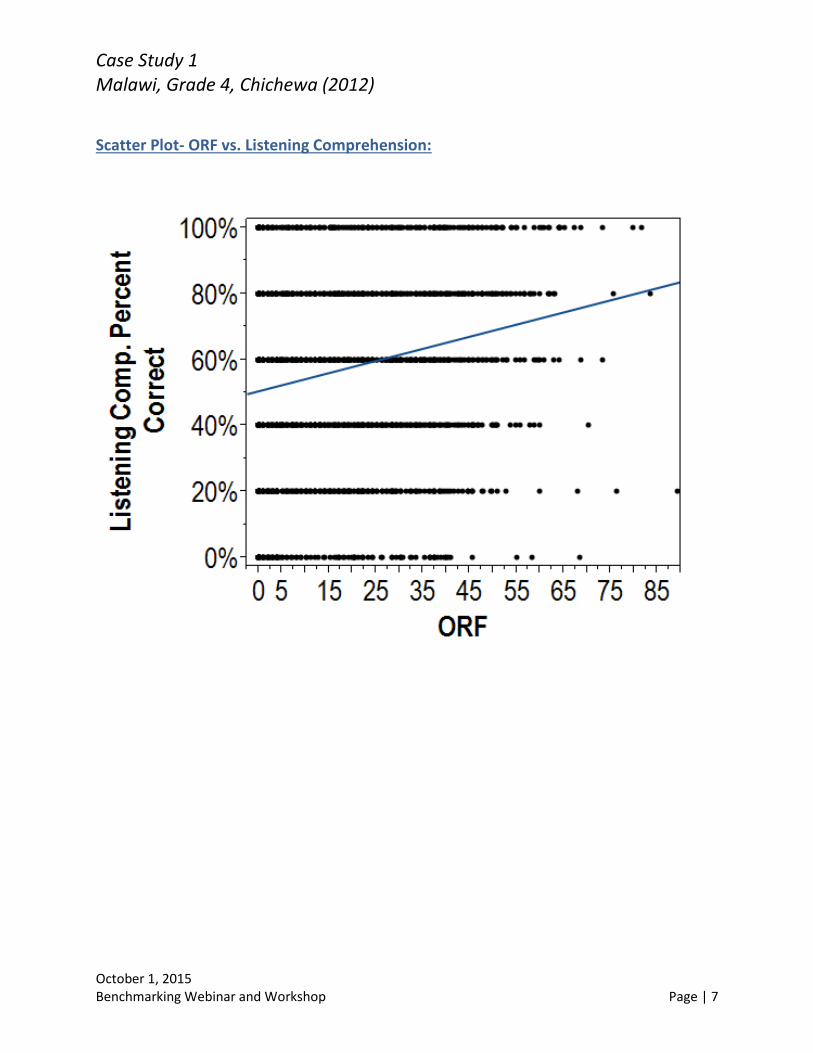
Case Study 1 Malawi, Grade 4, Chichewa (2012)
October 1, 2015 Benchmarking Webinar and Workshop Page | 1
Objective:
Desired Outcomes- Grade 4 Benchmarks by Subtask:
Subtask
Benchmark
Reading Comprehension (% correct)
ORF (cwpm)
Non-Words (cnonwpm)
Familiar Words (cwpm)
Syllable Sounds (csspm)
Letter Names (clpm)
Listening Comprehension (% correct)
Set benchmarks in the following skill areas:
• Reading comprehension
• ORF
• Non-Words
• Familiar Words
• Syllable Sounds
• Letter Names
• Listening Comprehension

Case Study 1 Malawi, Grade 4, Chichewa (2012)
October 1, 2015 Benchmarking Webinar and Workshop Page | 2
Box Plots- ORF by Reading Comprehension:
Table- ORF by Reading Comprehension:

Case Study 1 Malawi, Grade 4, Chichewa (2012)
October 1, 2015 Benchmarking Webinar and Workshop Page | 3
Cumulative Percentiles by ORF:
Correlations between Subtasks:
Reading
Comp.
(% correct)
ORF Non-
Words
Familiar
Words
Syllable
Sounds
Letter
Names
Listening Comp.
(% Correct)
Reading Comp. (% correct)
1
ORF 0.867 1
Non-Words 0.805 0.908 1
Familiar
Words
0.833 0.948 0.941 1
Syllable
Sounds
0.815 0.906 0.915 0.926 1
Letter
Names
0.706 0.769 0.765 0.794 0.816 1
Listening Comp. (% Correct)
0.321 0.313 0.311 0.317 0.321 0.360 1

Case Study 1 Malawi, Grade 4, Chichewa (2012)
October 1, 2015 Benchmarking Webinar and Workshop Page | 4
Scatter Plot- Matrix of Subtasks:

Case Study 1 Malawi, Grade 4, Chichewa (2012)
October 1, 2015 Benchmarking Webinar and Workshop Page | 5
Scatter Plot- ORF vs. Non- Words:
Scatter Plot- ORF vs. Familiar Words:

Case Study 1 Malawi, Grade 4, Chichewa (2012)
October 1, 2015 Benchmarking Webinar and Workshop Page | 6
Scatter Plot- ORF vs. Letter Sounds:
Scatter Plot- ORF vs. Letter Names:
Case Study 1 Malawi, Grade 4, Chichewa (2012)
October 1, 2015 Benchmarking Webinar and Workshop Page | 7
Scatter Plot- ORF vs. Listening Comprehension:

Case Study 1 Malawi, Grade 4, Chichewa (2012)
October 1, 2015 Benchmarking Webinar and Workshop Page | 8
ORF Non-Words
Familiar
Words
Syllable
Sounds
Letter
Names
Listening
Comp.
# of pupils
in sample
Zero 0.7 1.3 4.3 9.8 2.0 534
1<5 3.4 5.1 10.8 19.5 2.2 81
5<10 8.1 10.6 19.5 23.8 2.9 113
10<15 10.3 15.3 23.4 29.3 2.6 81
15<20 12.8 20.6 33.9 32.7 2.7 123
20<25 15.8 25.2 38.6 34.2 2.7 182
25<30 19.4 29.6 44.8 41.6 3.0 198
30<35 26.8 35.9 51.3 40.9 2.9 110

Case Study 1 Malawi, Grade 4, Chichewa (2012)
October 1, 2015 Benchmarking Webinar and Workshop Page | 9
Average
Fluency
Scores-
Subtasks that
correspond to
given ranges
of ORF:
35<40 25.9 38.5 58.2 51.8 3.0 154
40<45 26.7 40.8 57.5 52.3 3.1 113
45<50 31.9 48.9 65.9 57.6 3.3 32
50<55 44.5 50.8 75.6 50.0 3.6 21
55<60 33.5 47.3 68.0 55.8 3.2 35
60<65 37.2 53.1 86.2 65.9 4.6 16
65<70 32.0 47.7 61.0 59.6 1.4 2
70<75 33.9 62.9 69.0 39.6 3.3 2
75<80 41.4 72.2 73.1 40.0 1.4 2
80<85 45.5 70.0 85.0 63.5 4.5 2
85<90 68.0 110.8 46.0 29.0 1.0 1
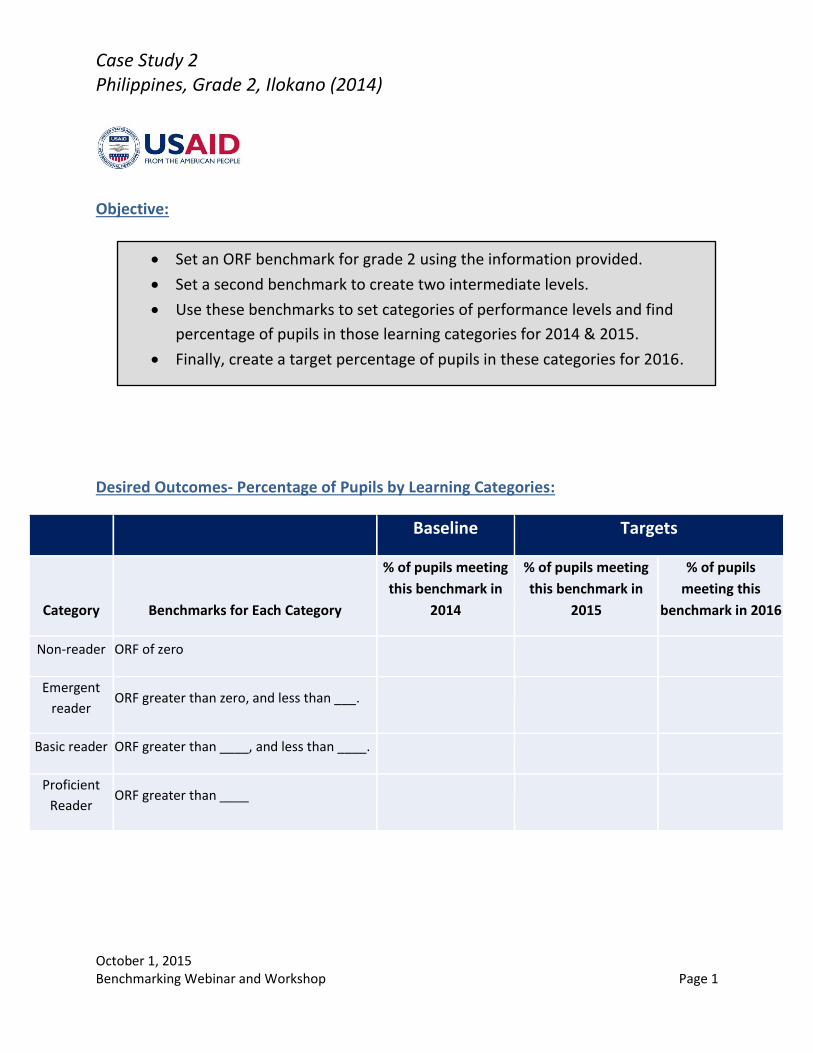
Case Study 2 Philippines, Grade 2, Ilokano (2014)
October 1, 2015 Benchmarking Webinar and Workshop Page 1
Objective:
Desired Outcomes- Percentage of Pupils by Learning Categories:
Baseline Targets
Category Benchmarks for Each Category
% of pupils meeting
this benchmark in
2014
% of pupils meeting
this benchmark in
2015
% of pupils
meeting this
benchmark in 2016
Non-reader ORF of zero
Emergent
reader ORF greater than zero, and less than ___.
Basic reader ORF greater than ____, and less than ____.
Proficient
Reader ORF greater than ____
Set an ORF benchmark for grade 2 using the information provided.
Set a second benchmark to create two intermediate levels.
Use these benchmarks to set categories of performance levels and find
percentage of pupils in those learning categories for 2014 & 2015.
Finally, create a target percentage of pupils in these categories for 2016.
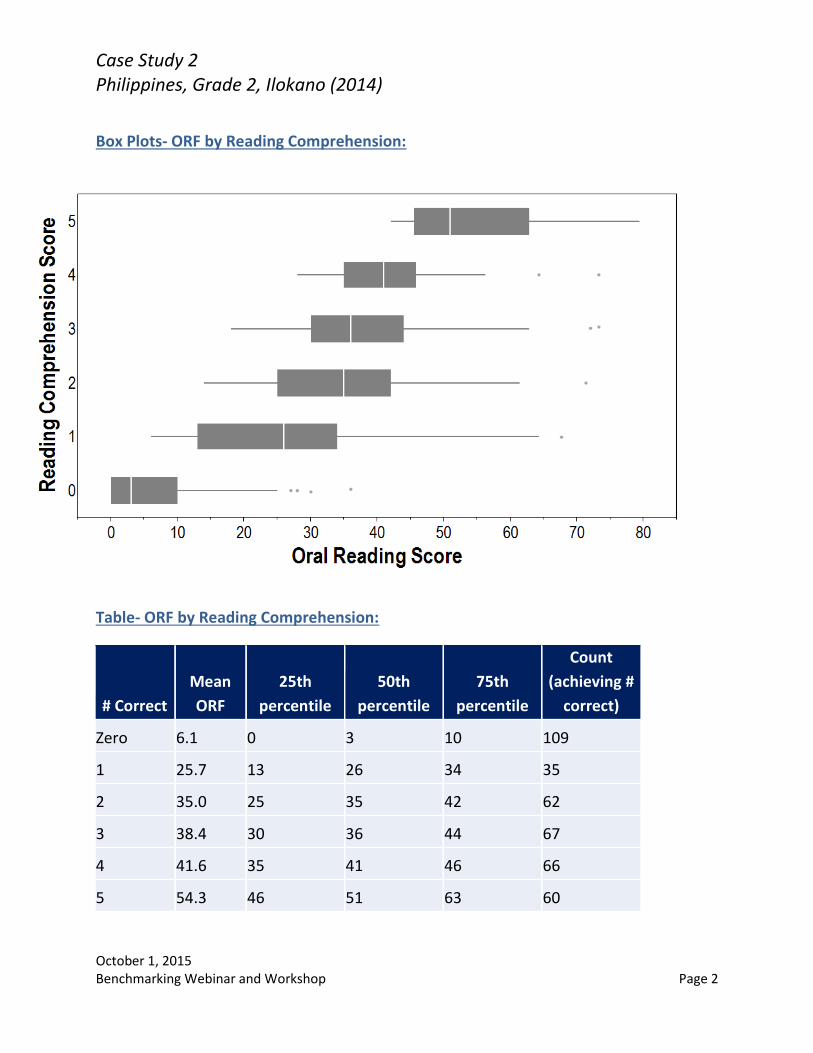
Case Study 2 Philippines, Grade 2, Ilokano (2014)
October 1, 2015 Benchmarking Webinar and Workshop Page 2
Box Plots- ORF by Reading Comprehension:
Table- ORF by Reading Comprehension:
# Correct
Mean
ORF
25th
percentile
50th
percentile
75th
percentile
Count
(achieving #
correct)
Zero 6.1 0 3 10 109
1 25.7 13 26 34 35
2 35.0 25 35 42 62
3 38.4 30 36 44 67
4 41.6 35 41 46 66
5 54.3 46 51 63 60

Case Study 2 Philippines, Grade 2, Ilokano (2014)
October 1, 2015 Benchmarking Webinar and Workshop Page 3
Cumulative Percentile by ORF:
Red = 2014
Blue = 2015
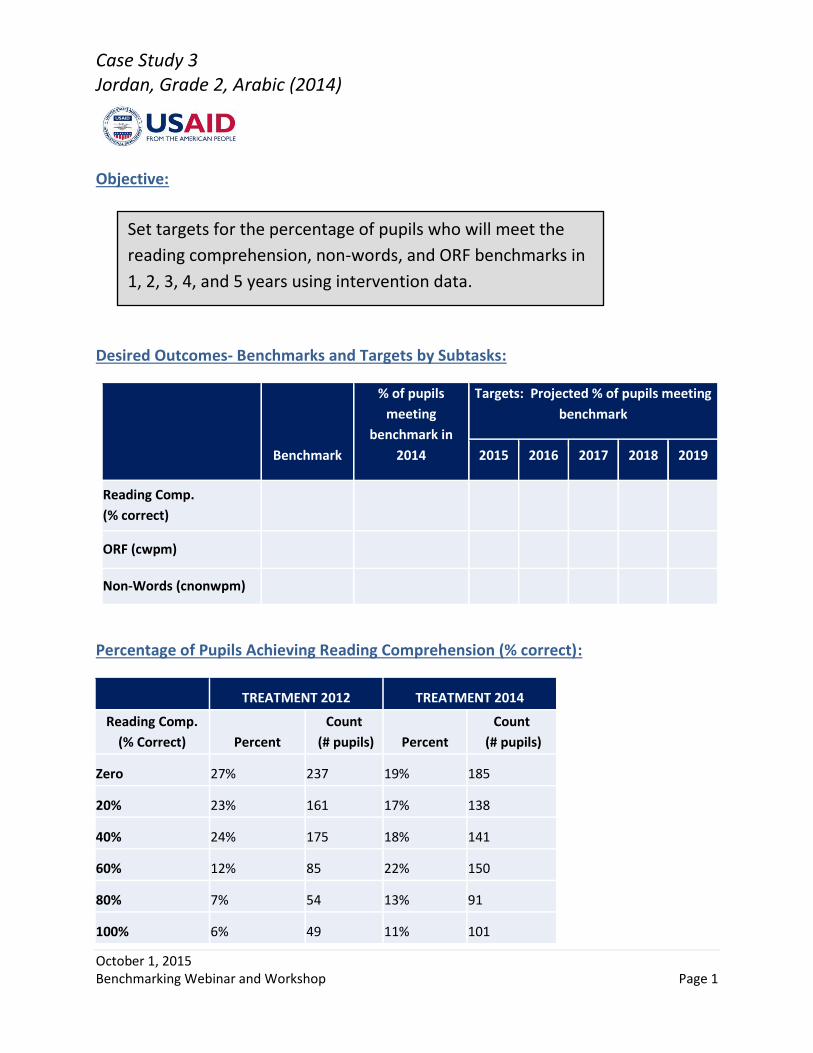
Case Study 3 Jordan, Grade 2, Arabic (2014)
October 1, 2015 Benchmarking Webinar and Workshop Page 1
Objective:
Desired Outcomes- Benchmarks and Targets by Subtasks:
Benchmark
% of pupils
meeting
benchmark in
2014
Targets: Projected % of pupils meeting
benchmark
2015 2016 2017 2018 2019
Reading Comp.
(% correct)
ORF (cwpm)
Non-Words (cnonwpm)
Percentage of Pupils Achieving Reading Comprehension (% correct):
TREATMENT 2012 TREATMENT 2014
Reading Comp.
(% Correct) Percent
Count
(# pupils) Percent
Count
(# pupils)
Zero 27% 237 19% 185
20% 23% 161 17% 138
40% 24% 175 18% 141
60% 12% 85 22% 150
80% 7% 54 13% 91
100% 6% 49 11% 101
Set targets for the percentage of pupils who will meet the
reading comprehension, non-words, and ORF benchmarks in
1, 2, 3, 4, and 5 years using intervention data.

Case Study 3 Jordan, Grade 2, Arabic (2014)
October 1, 2015 Benchmarking Webinar and Workshop Page 2
Box Plots- ORF by Reading Comprehension:
Table- ORF by Reading Comprehension:
% Correct Reading
Comprehension
Mean 25th
percentile
50th percentile
75th percentile
Sample Count
0% 5.9 0 2 9 1163
20% 18.2 11 17 23 614
40% 23.7 17 22 27 552
60% 37.1 27 33 43 246
80% 46.3 37 45 56 114
100% 50.3 45 48 54 88

Case Study 3 Jordan, Grade 2, Arabic (2014)
October 1, 2015 Benchmarking Webinar and Workshop Page 3
Cumulative Percentile by ORF for Intervention:
Scatter Plot- ORF vs. Non- Words:
-20
0
20
40
60
80
100
120
-10 0 10 20 30 40 50 60
Ora
l Rea
din
g Fl
uen
cy
Correct Non-words per Minute
Red = 2012
Blue = 2014

Case Study 3 Jordan, Grade 2, Arabic (2014)
October 1, 2015 Benchmarking Webinar and Workshop Page 4
Cumulative Distribution of ORF vs. Non-words for Intervention Schools:
Red = 2012 Intervention Schools
Blue = 2014 Intervention Schools

Case Study 4 Malawi, Grade 3, Chichewa (2012)
October 1, 2015 Benchmarking Webinar and Workshop Page 1
Objective:
Desired Outcomes- Benchmarks and Targets by Subtasks:
Percentage of Pupils Achieving Reading Comprehension (% correct):
Grade 2 Grade 4
Reading Comp.
(% Correct) Percent
Count (#
pupils) Percent
Count
(# pupils)
Zero 94.4% 2926 50.5% 712
20% 3.4% 187 13.7% 267
40% 1.6% 143 17.3% 355
60% 0.5% 79 12.4% 309
80% 0.1% 23 5.4% 170
100% 0.0% 2 0.7% 26
Benchmark
% of pupils
meeting
benchmark in
2012
Targets: Projected % of pupils meeting
benchmark
2013 2014 2015 2016 2017
Reading Comprehension
(% correct)
ORF
Use the results from grade 2 and grade 4 reading
comprehension and ORF.
Set Reading Comprehension and ORF benchmarks and
targets in grade 3 for the next 1, 2, 3, 4, and 5 years.

Case Study 4 Malawi, Grade 3, Chichewa (2012)
October 1, 2015 Benchmarking Webinar and Workshop Page 2
Box Plots- Reading Comprehension and Grade:
Tables- ORF by Reading Comprehension and Grade:

Case Study 4 Malawi, Grade 3, Chichewa (2012)
October 1, 2015 Benchmarking Webinar and Workshop Page 3
Cumulative Percentile of ORF for Grade 2:
Red = 2012 Intervention Schools
Blue = 2014 Intervention Schools
Red = 2010
Green = 2011
Blue = 2012
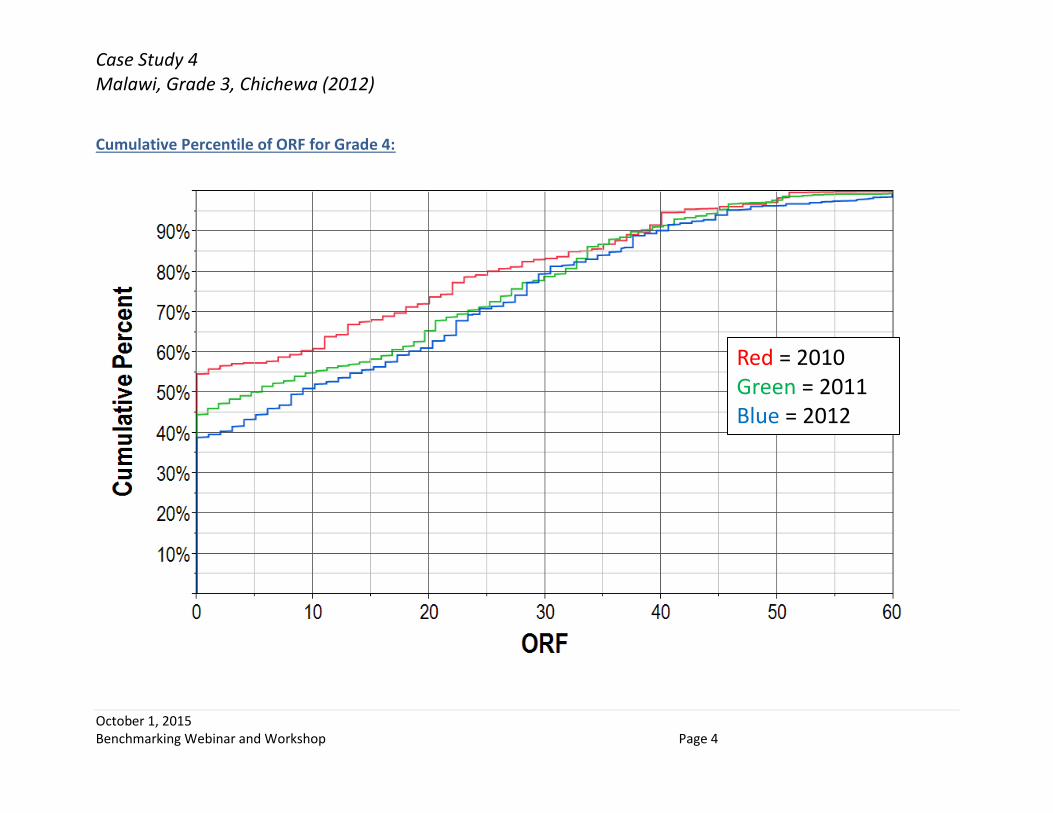
Case Study 4 Malawi, Grade 3, Chichewa (2012)
October 1, 2015 Benchmarking Webinar and Workshop Page 4
Cumulative Percentile of ORF for Grade 4:
Red = 2010
Green = 2011
Blue = 2012

Benchmarking Webinar and Workshop
October 1, 2015 Page 1
Some Basics for Leading Benchmarking Work Using Data
from the Early Grade Reading Assessment
1. The Process
Benchmarking should rely on actual data on student performance in specific reading skill areas. The
underlying relationships between the reading skill areas—in terms of both the research on how students
learn to read in alphabetic languages, and the statistical relationships that have consistently been
demonstrated across scores of EGRA applications—are what make it possible to use EGRA data to set
benchmarks.
Step 1: Begin by discussing the level of reading
comprehension that is acceptable as demonstrating full
understanding of a given text. Most countries have
settled on 80% or higher (4 or more correct responses
out of 5 questions) as the desirable level of
comprehension.
Step 2: Given a reading comprehension benchmark,
EGRA data are used to show the range of oral reading
fluency (ORF) scores—measured in correct words per
minute (cwpm)—obtained by students able to achieve
the desired level of comprehension. Discussion then is
needed to determine the value within that range that
should be put forward as the benchmark. Alternatively,
a range can indicate the levels of skill development that
are acceptable as “proficient” or meeting a grade-level
standard (for example, 40 to 50 cwpm).
Step 3: With an ORF benchmark defined, the
relationship between ORF and decoding (nonword reading) makes it possible to identify the average
rate of nonword reading that corresponds to the given level of ORF.
Step 4: The process then proceeds in the same manner for each subsequent skill area.
Some tips regarding this process:
A minimum, yet still adequate, approach to benchmarking would include two skill areas: reading
comprehension and oral reading fluency.
Going beyond those two to develop benchmarks for other skill areas can be useful, especially in
countries where all of the EGRA-measured skills are poorly developed (so that progress can be
detected in students’ development of more basic skills).
Syllable reading (especially when syllables are important components of words, such as in Bantu
languages) is a good skill area to include.
If syllable reading was not tested, letter sound recognition, not letter naming, should be used.
An exception would be in a language like Bahasa Indonesia which is totally transparent, and
therefore in which letter names and sounds are essentially the same.
20% 40% 60% 80% 100%
Comprehension
Oral reading fluency
35 to 50
45 cwpm
Decoding
30 cnonwpm
Syllable reading
50 csspm

Benchmarking Webinar and Workshop
October 1, 2015 Page 2
2. The Data
A good benchmarking exercise is quite data intensive. In fact, one of the added benefits of doing this
exercise in a country is that the participants get to engage the EGRA results in a much deeper way than
they normally would, leading to a richer understanding of what is happening in the country in terms of
skill development.
The data needed to do benchmarking include:
A table (like the one to the right) showing the range of
reading fluency scores obtained by students achieving each
level of reading comprehension. This makes it possible for
participants to complete steps 1 and 2 in the benchmarking
process.
A graphic way to depict this same information is a set of
“box and whisker” plots showing the distribution of ORF
scores for each level or reading comprehension.
A table that shows the average scores on each other
subtask that correspond to different levels of oral
reading fluency (as shown here) is what enables
participants to connect the ORF benchmark to desirable
levels of performance in other skill areas.
A graphic way to show this same information is to use a
scatter plot (below)—for example, of ORF x nonword
decoding, with the best fit line drawn in so that
workshop participants can match a given level of ORF to
the average corresponding level of nonword decoding.

Benchmarking Webinar and Workshop
October 1, 2015 Page 3
For determining the percentage of students meeting the benchmark (in the year for which the
EGRA data are available), a cumulative distribution graph or table makes it possible for
participants to “look up” the percentage of students, for example, achieving 45 cwpm or higher.
3. Performance Levels
Some countries are interested in establishing performance points that capture stages of skill develop-
ment that are below the desired level of achievement defined by the benchmark. For example, the
benchmark for reading fluency may be defined as 50 cwpm, representing students who are reading
fluently and with full (or almost full) comprehension. Students who score zero are those who are not
reading. In between zero and 50 cwpm exist different levels of reading ability that in fact may
correspond to stages of literacy acquisition. Setting multiple performance levels makes it possible to
determine what percentages of children are at each of those stages of development of their reading skill.
As illustrated above, it is possible to create two other performance levels below the benchmark for
reading fluently with full comprehension set at 50 cwpm. Data describing how reading fluency and
comprehension scores are distributed (e.g., using a two-way distribution table) inform where to place
another level of reading achievement in between zero and 50 cwpm. Thus, two other performance
levels are created: students who score above zero and up to 20 cwpm are said to be reading slowly with
limited comprehension, and those scoring above 20 and up to 50 cwpm can be said to be reading with
increasing fluency and comprehension. The performance levels in this example are from the
benchmarking work done in Ethiopia in early 2015. Such intermediate performance levels in other
contexts could, of course, be given other labels.
An alternative approach to setting performance levels (as was the case in Pakistan) would be to establish
a range of ORF scores that are defined as “meeting expectations”: 60 to 90 cwpm. Students scoring
above 90 cwpm would be considered to be “exceeding expectations.” Those scoring below 60 would be
“not meeting expectations.”
4. Moving Beyond Benchmarks to Targets
One of the main purposes of setting benchmarks is to establish the means to evaluate and measure
progress in improving reading outcomes. In fact, one of the more interesting challenges in working with
ministry colleagues to set benchmarks arises during discussions of the prospects for future improvement
in student performance relative to those benchmarks. To set targets for future improvement,
benchmarks can be used in the following way.
Fluently with full comprehension
With increasing fluency and comprehension
Slowly with limited comprehension
Nonreader
0 50 20

Benchmarking Webinar and Workshop
October 1, 2015 Page 4
Once a benchmark has been set, say for oral reading fluency, it is useful to employ the existing data to
determine the percentage of students presently meeting that benchmark. The challenge arises when
assumptions have to be made about how
things will improve—that is, to estimate
the percentages of students who will
meet the benchmark in future years (as
illustrated here).
If data are available from a reading
intervention in the country, then the
amount of improvement achieved by that
program provides a useful starting point
for estimating future targets.
If data from an intervention are not
available, but EGRA results from more
than one year are, then the prevailing pattern of change over time can be used to begin discussing how
that pattern may evolve in future years.
If only one year of reading results is available, then the task is less data-driven and more a dialogue about
how much improvement can be expected. Data from other countries’ programs that have had
demonstrated impact could inform that dialogue. Additionally, if EGRA data from a given year are
available for two successive grades (say, grades 1 and 2), then the “intergrade” difference is a good
means for estimating how much improvement to expect.
The intergrade difference represents the amount of progress students make given an additional year in
school (under preexisting conditions). For example, a successful intervention could aim to improve
performance in grade 1 by as much as the intergrade difference between grades 1 and 2; or put
differently, to increase student performance by as much as an additional year of schooling.
The value of setting targets is that if performance is initially low—say, very few students meeting the
benchmark—there often emerges a tendency to want to lower the benchmark (so performance does
not look as bad). It is better to have a benchmark that is genuinely meaningful in terms of the skill level
achieved (e.g., oral reading that is fluent enough to enable students to comprehend what they are
reading). Therefore, instead of lowering the benchmark, a compromise is to have modest targets for the
percentage of children expected to meet the benchmark moving forward. Examples of benchmarks and
targets from Jordan are shown in the table below.
Oral Reading Fluency Nonword Decoding
Benchmark 46 cwpm 23 cnonwpm
% of students meeting
the benchmark
2014 actual 7.5% 5.3%
5-year target 35% 31%
Participants estimated that the percentage of students meeting the benchmarks for these two skill areas
would increase from 7.5% to 35% and from 5.3% to 31% over the course of the next five years.
Baseline Yr 1 Yr 2 Yr 3
ORF Benchmark = 45 cwpm
10%
Which line describes the path of improvement?
What % of students will meet the benchmark in Yr 1, Yr 2, …?

Benchmarking Webinar and Workshop
October 1, 2015 Page 5
5. Some Things to Remember
Having facilitated benchmarking exercises in nine countries, the Education Data for Decision Making
(EdData II) project team has learned some useful lessons, which are summarized here.
Supply the data. The process requires a fair amount of data. Preparing the right data tools—
graphs, tables, forms to be filled out—and carefully labeling those tools to correspond to the
different steps in the process help greatly with facilitating the running of a benchmarking
workshop.
Match the data to the task. A balance needs to be struck between too much and too little
data. When a lot of data are available (from more than one year of EGRA, for multiple grades,
for an intervention as well as from national surveys), be sure to have participants working only
with the sets of data that correspond to the task at hand. Do not dump everything on them at
once.
Work across grade levels. For working with more than one grade—e.g., for grades 1
through 3—it is best to work in each skill area across grades. For example, when setting a
benchmark for ORF, set it for the highest grade for which data are available and then work to
set the benchmarks for the other two grades based on that. Then move on to do the same in
another skill area.
Have multiple small groups work simultaneously. It is useful to have more than one
group working in parallel with the data to set a benchmark. When groups arrive at different
suggested benchmarks, the facilitated dialogue that ensues is usually quite fruitful. And that
dialogue illustrates that even when everyone is using data, there is room for interpretation and
negotiation about what constitutes a reasonable benchmark for a given country and language.
Encourage discussion. Similarly, the discussion, and often debate, about what targets should
be set for future improvement brings to the surface everyone’s assumptions about how the
system is going to improve over time. For example, when looking at the results of a pilot
interventions in Malawi and Liberia as the bases for determining future targets, participants had a
lively discussion about whether one could assume that the conditions created in a pilot (which
led to the results) could be expected to be implemented on a national scale (and what it would
take for the ministry and its partners to achieve that).
Limit the number of benchmarks. There is often a tendency to want to set benchmarks for
every skill area. Limiting the number of skill areas to no more than four is highly recommended:
reading comprehension, oral reading fluency, and two others (nonword decoding and syllable
reading or letter sound identification).
Consider how to institutionalize the decisions. It is necessary to engage participants in
determining how benchmarks they develop could become official. Even if the benchmarks are
not made official, they should be used to summarize reading performance the next time early
grade reading is assessed. This was the case most recently in the Philippines where, even though
the benchmarks were not officially adopted, comparison of the percentages of students meeting
benchmarks in 2014 and 2015 helped the Department of Education evaluate the extent to which
progress was being made.