setting a common performance standard for two...
TRANSCRIPT

Setting a Common Performance Standard for Two Candidate Groups across Different
Medical Licensing Examination Forms: A Comparison of Methods
Andrea Gotzmann, Medical Council of Canada
André De Champlain, Medical Council of Canada
Marguerite Roy, Medical Council of Canada
Carlos Brailovsky, College of Family Physicians of Canada
Sydney Smee, Medical Council of Canada
Ingrid de Vries, Medical Council of Canada
Technical Report: 2014
Correspondent to:
Andrea Gotzmann
Medical Council of Canada
2283 St. Laurent Blvd. Suite 100
Ottawa, ON, Canada K1G 5A2
(613) 521-6012ext 2536
(613) 521-8059 FAX

COMMON PERFORMANCE STANDARD 2 2
Abstract
Two assessment organizations in Canada, running two separate clinical skills
examinations combined components of each examination to provide family medicine candidates
with one clinical skills examination that leads to licensure and certification credentials.
Concurrently, the Medical Council of Canada (MCC) had to ensure that the licensure decision
for other specialty candidates was equitable to the licensure decision for family medicine
candidates. This new testing model created the challenge of how to make comparable pass-fail
classification decisions for both candidate cohorts. To answer this question, 1000 bootstrap
replications using data from multiple administrations of both examinations were conducted to
compare two standard setting approaches (modified borderline group and Hofstee) across two
test forms and two candidate groups (family medicine and other specialty). Pass rates, decision
consistency, and decision accuracy were calculated across all replications. The study results
showed that the pass rates, decision consistency, and decision accuracy values were consistent
across both standard setting procedures, with some differences found for the other specialty
group. Additionally, the results indicated that implementing the new testing model did not
adversely affect the two candidate cohorts and comparable classification decisions could be
made for the licensure decision. The results contributed significantly to the decision to
implement the new testing model.
Keywords: standard setting; scaling; high-stakes testing; performance assessment

COMMON PERFORMANCE STANDARD 3 3
Setting a Common Performance Standard for Two Candidate Groups across Different
Medical Licensing Examination Forms: A Comparison of Methods
The reliability and validity of professional licensure and certification examination
decisions are important to ensure the protection of the public. In medicine, physicians must pass
a series of high-stakes examinations given at different points in their medical training. In
Canada, physicians must pass both of the Medical Council of Canada’s (MCC) Qualifying
Examinations Part I and Part II to receive their Licentiate of the Medical Council of Canada
(LMCC). In addition, they must achieve certification from either the College of Family
Physicians of Canada (CFPC) for family medicine or the Royal College of Physicians and
Surgeons of Canada (RCPSC) for other specialties.
Prior to 2013, family medicine physicians in Canada had to pass separate licensure and
certification performance assessments. Specifically, they needed to pass the Medical Council of
Canada’s Qualifying Examination (MCCQE Part II) and the CFPC certifying examination, both
of which had written and clinical components. Candidates in any other specialty needed to pass
the MCCQE Part II as one part of several requirements to receive the LMCC and subsequently
completed the certifying examinations of the RCPSC.
The MCCQE Part II is an objective structured clinical Skills examination (OSCE) that
consists of multiple case-based patient encounters or stations. The CFPC certifying examination
consisted of a performance component, the simulated office orals (SOOs), and a written
component comprised of short answer management problems (SAMPs). After many years of
discussions, MCC and CFPC reached an agreement to harmonize the clinical assessment
components of their respective examinations to improve both, to minimize the burden of two
examinations for family medicine candidates and to seek efficiencies through collaboration.

COMMON PERFORMANCE STANDARD 4 4
The agreement was announced in spring 2011 with implementation to begin spring 2013.
Starting spring 2013, family medicine candidates completed a single examination to meet the
requirements for the MCCQE Part II and the clinical skills component of the CFPC Clinical
Skills Examination (CFPC CSE; see Figure 1). To pilot a new model with a sufficiently large
and appropriate pool of participants for meaningful statistical analyses would have been an
overwhelmingly expensive and impossibly time-consuming endeavor. However, to implement a
new model without consideration for its impact on scores and pass-fail decisions would have
been irresponsible. The challenge was to design and then evaluate the impact of a new model
without a pilot, a common issue with performance assessments. The classification decision for
all candidates is vitally important and psychometric evidence to inform the decision to
implement a new model is essential.
Examination Formats
Prior to 2013. The MCCQE Part II consisted of 12 OSCE stations with seven 10-minute
stations and five couplet stations. The 10-minute stations consist of a 10 minute patient
encounter portrayed by a standardized patient. A physician examiner observed and scored the
candidate’s performance based on a predefined checklist and up to seven behavioural rating
items. In addition, the examiner rated each candidate on a six-point global scale for the checklist
and the rating scale components of the station. The couplet stations consist of a 5 minute patient
encounter portrayed by a standardized patient followed by a post-encounter probe of 5 minutes
that consists of several short answer questions that are completed by the candidate in a 5 minute
time block. As with the 10 minute encounters, a physician examiner scored each candidate’s
performance according to a checklist and one to three rating scale items, plus rated each
candidate using a six-point global scale. Following the examination, a team of physicians scored

COMMON PERFORMANCE STANDARD 5 5
the short answer questions for all candidates in one separate scoring session. Like the patient-
based station examiners, these examiners also rated each written component of a couplet station
with a six-point global scale.
The CFPC certification examination consisted of SAMPs and five SOO stations. The
SAMPs (written examination) measure a candidate’s problem-solving skills and knowledge in
the context of a clinical situation (CFPC, 2012a). The SOO stations duplicate the actual setting
in which a family physician conducts a practice (CFPC, 2012b). The five SOO stations are 15
minutes in length with an additional 10 minutes for scoring. For the SOO stations, the physician
examiner presented the scenario as the patient and then scored the candidate following the
encounter. The areas to be scored are described in a rubric for each SOO station with three
rating categories: Superior Certificant, Certificant, and Non-certificant.
Spring 2013 to present. The two examinations were “harmonized” for family medicine
candidates. Two test forms for different candidate groups (other specialty and family medicine)
are used to make a joint licensing decision and a clinical component decision for certification.
Other specialty candidates take the MCCQE Part II test form for the licensing decision. Family
medicine candidates take the CFPC CSE test form for both the licensing and certification
decision, that is, there are two cut-scores from which family medicine candidate performance is
evaluated.
This new format affected both candidate groups as the other specialty candidates take
eight 10-minute and four couplet stations for the MCCQE Part II while family medicine
candidates take eight 10-minute and four SOO stations for the new CFPC CSE. As shown in
Figure 2, other specialty candidates are evaluated on eight 10-minute stations and four couplet
stations. Family medicine candidates are evaluated on the same eight 10-minute stations and
COMMON PERFORMANCE STANDARD 6 6
four SOO stations. Other specialty candidates are judged to have met the licensing performance
standard for the MCCQE Part II based on their total score. Family medicine candidates are
judged to have met the licensing performance standard for the MCCQE Part II based on their
scaled total score from the CFPC CSE. In addition, the family medicine candidates’ scaled total
scores are used to determine if they meet the pass standard for the clinical component of the
CFPC certification examination. The focus of this paper is on the licensing decision and not the
evaluation of the pass standard for the clinical component of the CFPC certification examination.
Scaling
The new testing model created two candidate groups presented with different sets of
stations that require a licensure decision to be made across the two test forms. Candidates’
pass/fail status is based on their total score for twelve stations (i.e., either eight 10-minute and
four couplet stations for MCCQE Part II or eight 10-minute and four SOO stations for CFPC
CSE). Ensuring a fair decision, regardless of test form is the challenge. If the complete set of
stations for the MCCQE Part II are not as difficult as the complete set of stations for the CFPC
CSE then some candidates might pass or fail due only to the difficulty of the test form and family
medicine candidates would be disadvantaged. To address this issue, statistical scaling of the
scores across the two different test forms is needed so that the scores are comparable and fair
decisions can be made.
Scaling aligns or transforms scores from two different test forms onto a common scale to
create comparable scores (Holland & Dorans, 2006; Kolen, 2006; Linn, 1993; Mislevy, 1992).
Scaling can be used to align different test forms and different populations of candidates (Holland
& Dorans, 2006) by taking into account the difficulty of the test forms and ability level of the
candidate groups. To implement scaling one can either a) randomly assign candidates to test

COMMON PERFORMANCE STANDARD 7 7
forms to ensure equal distribution of ability across test forms and subsequently adjust for any
differences in test form difficulty, which was not possible in this context, or b) present common
items (or stations) to both candidate groups to estimate and subsequently compensate for ability
differences as assessed on the common component. Because both candidate groups are given the
same eight 10-minute stations the scaling can be conducted in this new testing model. In this
case, total scores for family medicine candidates are statistically adjusted to the distribution for
other specialty candidates using information on the scores from the common stations. Given the
available sample sizes across 2009 and 2010 (~300 to ~2000) and scoring methods used in the
existing examinations, linear scaling methods were deemed to be most appropriate. The Levine
Observed score scaling procedure (Kolen & Brennan, 2004) is a common linear scaling method
and was selected for the current study. This method estimates the relationship between the
observed scores on the two test forms for the candidate groups and linearly transforms the total
scores.
Standard Setting Procedures
There are many methods of determining a performance standard or cut-score (Cizek,
2007; 2012). The assumptions of each standard setting procedure are the criteria for determining
the appropriate context for its use. Detailed descriptions of the array of procedures available
have been described by De Champlain (2004) and Downing and Tekian, and Yudkowsky (2006).
Both sets of authors indicate there is no “gold standard” procedure and that each examination
context needs to be evaluated to ensure best practices are applied, especially for high-stakes
examinations. Several researchers have described standard setting procedures for OSCEs
(Boulet, De Champlain, & McKinley 2003; Boulet, Murray, Kras, & Woodhouse 2008;
McKinley, Boulet, & Hambleton, 2005). However, research to date has not provided a

COMMON PERFORMANCE STANDARD 8 8
methodology to evaluate classification decisions when a testing model is undergoing change or
to assess whether the change could have a potential negative impact on scores and/or
classification decisions.
For the purpose of this study, two different standard setting procedures that could be
applied to data previously collected (i.e., MCCQE Part II and CFPC CSE) were considered. The
methods had to be appropriate for a performance assessment, specifically an OSCE, and be
applicable after scaling of family medicine candidate scores. The two standard setting methods
were the modified borderline group procedure, as used by the MCCQE Part II (Dauphinee,
Blackmore, Smee, Rothman & Reznick, 1997) until fall of 2012, and the Hofstee (1983)
procedure. Detailed descriptions of these two methods are discussed in the methods section.
Briefly, a borderline group method (Zieky & Livingston, 1977) is candidate centered and
uses expert judgments of both the content of the examination and the population of candidates to
set the standard. Candidate performance is placed into three categories: mastery, nonmastery,
and borderline. The average or median score of the borderline group becomes the cut-score.
The Hofstee (1983) method is a compromise between a norm-referenced and a criterion-
referenced approach to standard setting. A standard setting panel of experts: answers four
questions:
(1) What is the highest percent correct cut-score that would be acceptable, even if every
candidate attains that score?
(2) What is the lowest percent correct cut-score that would be acceptable, even if no
candidate attains that score?
(3) What is the maximum acceptable failure rate?

COMMON PERFORMANCE STANDARD 9 9
(4) What is the minimum acceptable failure rate? These four questions are used to draw a
line that intersects the cumulative distribution of scores that in turn determines the cut-score at
the total score level.
Purpose
This study evaluated and compared scaling for family medicine candidates and two
standard setting procedures. The goal was to identify one common and fair performance
licensing standard for candidate cohorts taking two different test forms (MCCQE Part II and
CFPC CSE). Modified borderline group and Hofstee standard setting procedures were evaluated
across two examination administrations (spring and fall) for MCCQE Part II and CFPC CSE test
forms. The study’s focus was evaluating the common performance standard for the licensure
decision (MCCQE Part II) rather than the certification decision. A full pilot of the new testing
model was not feasible, so a simulation technique called bootstrapping was used to evaluate the
standard setting outcomes for the two new test forms. Bootstrapping provides an estimate to
evaluate a new testing model based on existing data, thereby informing implementation
decisions.
Methods
Identifying a methodology that estimates the potential impact of different standard setting
procedures and testing conditions (e.g., spring and fall administrations) in our context was
important. One method commonly used in evaluating conditions without adversely effecting
candidates is a Monte Carlo simulation design, where the data is simulated based on known
population parameters and conditions. The complexity of the data collected for both the
MCCQE Part II and the CFPC CSE made this method impractical and risked a data simulation
that would not be well aligned with the new testing model. Therefore, bootstrapping

COMMON PERFORMANCE STANDARD 10 10
methodology was chosen because source data from past examinations could be used to better
simulate conditions that were important to the new testing model.
Bootstrapping is a method for assigning measures of accuracy to sample estimates. In
implementing a bootstrap procedure, samples of source data are selected, statistical analyses
applied and then averaged across the repeated samples (Efron, 1979; Efron & Tibshirani, 1993).
The method provides statistical estimates for a large number of samples and can also provide
measurement outcomes important to the research questions being investigated. The sampling
occurs with replacement, where all candidate responses have equal probability of being sampled
for each bootstrap sample. Typically 1000 replications of the sample are conducted, as this
closely mimics sampling for population statistical parameters. One thousand replications were
conducted for this study.
Sample
Three sources of data were sampled and used to create the bootstrap replications. The
first source of data was the spring and fall results of the 2009 MCCQE Part II for the other
specialty candidates. This data was comprised of station scores; four couplet stations and seven
10-minute stations (spring; n = 784) and two couplet stations and six 10-minute stations (fall; n =
1914). The second source of data was the spring and fall results of the 2009 MCCQE Part II for
the family medicine candidates. This data consisted of station scores; seven 10-minute stations
(spring; n = 213) and six 10-minute stations (fall; n = 671). The third source of data was the
spring and fall CFPC SOO station scores for the family medicine candidates, matched to the
MCCQE Part II data sets. That is, the candidates’ station scores from the MCCQE Part II were
matched to their station scores on the CFPC clinical component of the certifying examination,
COMMON PERFORMANCE STANDARD 11 11
where the CFPC data was matched from the spring and fall 2009 and 2010 administrations
depending on when the candidate completed their CFPC examination.
Procedures
Data simulation. Using a bootstrap technique, 1000 samples were created by sampling
with replacement. Each of the 1000 samples was created in two steps: (1) the first bootstrap was
to create the number of stations for the new examination format (e.g., eight 10-minute and four
couplet stations for other specialty), and (2) the second bootstrap was to create the approximate
number of candidates typically found in the spring and fall administrations.
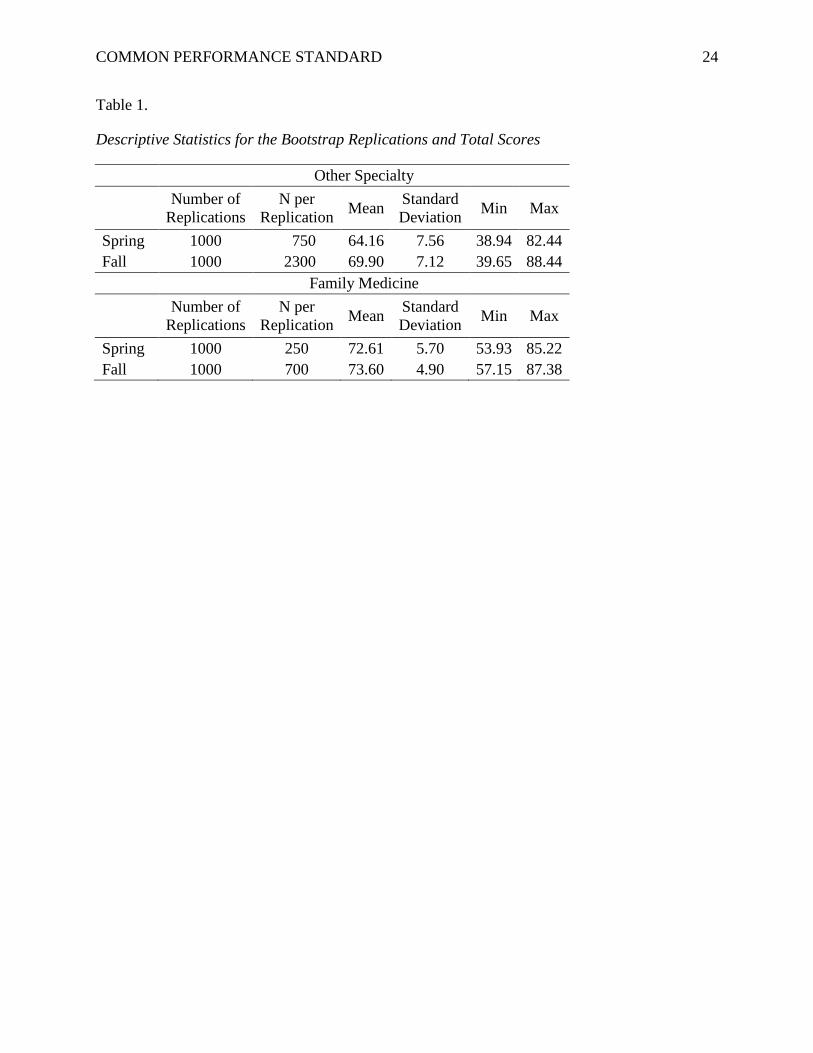
Scaling. The family medicine candidate total scores were scaled onto the metric of the
total scores for the other specialty candidates based on the eight common 10-minute stations and
applying the Levine Observed Score method (Kolen & Brennan, 2004). Descriptive statistics on
the replications for the bootstrap and bootstrap statistics for total scores are provided in Table 1.
The family medicine total scores, scaled with the Levine Observed Score method, bootstrap
statistics are shown in Table 1.
Standard setting procedures. Two standard setting procedures were applied to each of
the 1000 data sets using the other specialty candidates’ responses. That is, the other specialty
candidate responses were used to calculate all cut-scores, where cut-scores were calculated for
each replication and applied to all candidates (other specialty and family medicine after scaling).
For each of the 1000 replications we recalculated the cut-score and associated outcome
measures.
The first standard setting procedure was a modified borderline group method. This
method uses average scores from a borderline group to set a cut-score (Dauphinee et al., 1997;
Cizek & Bunch, 2007; Cizek, 2012). For the MCCQE Part II, the borderline candidates were

COMMON PERFORMANCE STANDARD 12 12
identified by physicians’ global rating scores of 3 or 4 on a six-point scale by component within
station. The weighted average of the component cut-scores within station was the cut-score for
that particular station. The average of the twelve station cut-scores was the total OSCE cut-score
with the addition of the standard error of measurement of the total score for all candidates.
The cut-score was then applied to the other specialty total scores and scaled scores for
family medicine candidates to determine their pass/fail status. Since different stations were
presented to the two candidate cohorts, scores from one group had to be the basis for setting the
cut-score. Since the cut-score was for the MCCQE Part II, the base form from the other
specialty candidates was used for scaling.
Prior to 2013, each candidate was required to pass both by total score and by passing
eight or more stations to pass the MCCQ Part II. Given the two test forms in this testing model,
the requirement of passing eight stations was excluded. With different sets of station types (i.e.,
10-minute and couplet), this requirement would have been problematic. The average modified
borderline group cut-score across the 1000 replications was 59.43 for spring and 61.92 for fall.
The second standard setting method was the Hofstee procedure (Hofstee, 1983). Four
questions were asked of a panel of experts: (1) What is the highest percent correct cut-score that
would be acceptable, even if even candidate attains that score? (2) What is the lowest percent
correct cut-score that would be acceptable, even if no candidate attains that score? (3) What is
the maximum acceptable failure rate? (4) What is the minimum acceptable failure rate? For this
study the cut-score was set with the total score distribution from the other specialty candidates
and then applied to the family medicine scaled scores, as was done with the modified borderline
group method. A medical expert panel familiar with the content and candidate groups provided
the data for these four questions and the results of their judgments were used to create the
COMMON PERFORMANCE STANDARD 13 13
intersections with the cumulative total score distribution for the other specialty candidates,
creating the cut-score for each replicate. The average Hofstee method cut-score across the 1000
replications was 59.82 for spring and 64.37 for fall.
Outcome Measures. There were three sets of statistical analyses conducted on the spring
and fall for each standard setting outcome. The first measure was percentage pass rates as
calculated for each replication, candidate group (other specialty and family medicine) and
standard setting procedure. The pass rates were the percentage of candidates at or above the cut-
score for each condition. The second measure was decision consistency, false positive and false
negative rates as calculated for each replication and condition. More specifically, decision
consistency is a statistical estimate of the agreement between the classifications based on two
non-overlapping, equally difficult forms of the test (Livingston & Lewis, 1995). The third
evaluation measure was decision accuracy, false positive and false negative rates as calculated
for each replication and condition. More specifically, decision accuracy is a statistical estimate
of the extent to which the actual classifications of candidates (on the basis of their single form
score) agrees with the classifications that would be made on the basis of their true scores, if true
scores could somehow be known (Livingston & Lewis, 1995). Both the decision consistency
and accuracy estimates were based on the Livingston and Lewis procedure as estimated in the
program BB-CLASS version 1.1 (Brennan, 2004).
Results
The results are organized by the different outcome measures. The pass rate results are
presented first, followed by decision consistency and decision accuracy.
COMMON PERFORMANCE STANDARD 14 14
Pass rates. The pass rates are shown in Figure 3 across spring and fall for the two
candidate groups (family medicine and other specialty) and standard setting procedures
(modified borderline group and Hofstee).
For the other specialty candidates, the pass rates ranged from 75% to 89% across spring
and fall. For this group, lower pass rates were found for the Hofstee method compared to the
modified borderline group method with a larger difference found for fall (6.9%) as opposed to
spring (1.3%). While some differences were found between the two methods for the fall
examination, the pass rate for the Hofstee method was similar to the actual pass rates from 2009
(spring = 67% and fall = 83%; when the cut-score was conjunctive requiring eight stations to
pass).
The pass rates for the family medicine candidates ranged from 97% to 99% across spring
and fall. A slightly lower pass rate was found for the fall with the Hofstee method as compared
to the borderline group method, however the resulting difference was very small (1.9%). For the
family medicine candidate group, there were few differences regardless of standard setting
method or which examination (i.e., spring or fall). And again, the Hofstee method produced
similar pass rates to the pass rates from 2009 (spring = 93% and fall = 96%; when the cut-score
was conjunctive with 8 stations passed).
Decision consistency.
Decision consistency is a statistical estimate of how consistently the candidates are being
classified for a particular examination. Decision consistency greater than 0.8 is desired as this
indicates at least 80% of the classification decisions (pass or fail) are correctly classified.
Decision consistency can be affected by the number of candidates around the cut-score. The
chances of making correct classification decisions increases if there are fewer candidates at or

COMMON PERFORMANCE STANDARD 15 15
around the cut-score, and conversely decreases if there are more candidates at or around the cut-
score. Of the remaining 20% (or less), incorrect classifications are estimated to be in one of two
categories, false positives and false negatives. False positive rates are estimates of the
percentage of candidates that might be classified as “pass” that should have been classified as a
“fail” based on the estimated true score. False negative rates are estimates of the percentage of
candidates that might be classified as “fail” that should have been classified as a “pass” based on
the estimated true score.
On a high-stakes examination where public safety is a concern, minimizing false
positives as much as possible is important. The results of the decision consistency, false positive
and false negative results, are shown in Table 2 for spring and fall for the two candidate groups
and for both standard setting procedures.
The decision consistency rates for the other specialty candidates ranged from 0.84 to 0.91
across the spring and fall and both standard setting procedures. All of the decision consistency
values were above 0.8 which indicates a high percentage of classifications were correct and that
the cut-score could be applied fairly and consistently across different test forms. Decision
consistency across standard setting procedures was very similar for the spring administration but
differed slightly for the fall administration where slightly lower values were found for the
Hofstee method. The false positive and false negative rates were generally even with false
positive rates being 0.01 higher than false negative rates. In addition, the false positive and false
negative values were higher for the Hofstee method as compared to the modified borderline
group method.
The decision consistency rates for the family medicine candidates ranged from 0.95 to
0.98 across the spring and fall administrations and both standard setting procedures. All of the
COMMON PERFORMANCE STANDARD 16 16
decision consistency values were above 0.95 which indicates a very high percentage of
classifications were correct and could be applied consistently across different examination forms.
There were small to no differences found across the spring and fall administrations and across
the modified borderline group and Hofstee standard setting methods. The false positive and
negative rates were generally even with less than a 0.01 difference between false positive and
false negative rates as found with the other specialty candidate results.
In summary, the decision consistency results were good to very good with both the
modified borderline group and the Hofstee method across both candidate groups. The decision
consistency results indicate that the new testing model should not have a negative impact on
either the other specialty candidates or family medicine candidates.
Decision Accuracy
Decision accuracy is a statistical estimate of how accurately the candidates are being
classified for a particular examination. Decision accuracy greater than 0.8 is desired as this
indicates at least 80% of the classification decisions (pass or fail) are correctly being classified.
Decision accuracy can be affected by the reliability of the examination scores and the number of
candidates around the cut-score. For example, a low reliability estimate in concert with a higher
number of candidates around the cut-score will decrease the decision accuracy estimate.
Conversely, having a higher reliability estimate and a lower number of candidates around the
cut-score can increase the decision accuracy estimate. Of the remaining 20% (or less), incorrect
classifications are estimated to be in one of two categories, false positive and false negative rates.
The results of the decision accuracy, false positive and false negative, are shown in Table 3 for
spring and fall for the two candidate groups and for both standard setting procedures.

COMMON PERFORMANCE STANDARD 17 17
The decision accuracy rates for the other specialty candidates ranged from 0.75 to 0.89
across the spring and fall administrations and both standard setting procedures. The decision
accuracy rates were above 0.8 for the fall administration and lower, at about 0.75, for the spring
administration. Many of the other specialty candidates taking the spring administration are
repeat test takers. Therefore, it is likely that there were more candidates around the cut-score in
spring, thus lowering the decision accuracy rates. This result was also reflective of the lower
decision consistency results for the other specialty candidates in the spring.
Decision accuracy across standard setting methods was similar for the spring
administration but there were larger differences for the fall administration with lower values
found for the Hofstee method. The false positive and false negative rates were not even, as was
found with the decision consistency results. False positive rates were 0.00 for both
administrations and standard setting procedures. However, false negative rates ranged from 0.11
to 0.25 across administrations and standard setting procedures.
The decision accuracy rates for the family medicine candidates ranged from 0.97 to 0.99
across the spring and fall administrations and both standard setting procedures. All of the
decision consistency values were above 0.97 which indicates a very high percentage of
classifications are correct and cut-scores could be applied accurately across different test forms.
There were small to no differences found across the spring and fall administrations or across the
modified borderline group and Hofstee methods. The false positive and false negative rates were
not similar with false positive rates being 0.00 and false negative rates ranging between 0.01 and
0.03.
Generally the decision accuracy results were lower than the decision consistency results,
especially for the spring examination. The results did not indicate any issues with using either

COMMON PERFORMANCE STANDARD 18 18
the modified borderline group or Hofstee method across both candidate groups. The decision
accuracy results support the use of the new testing model and indicated that there should not be a
negative impact on either the other specialty or family medicine candidates.
Discussion
The policy decision to implement a new testing model presented challenges, not least of
which was being able to demonstrate that the proposed changes would not adversely affect
candidates and to provide evidence of valid score interpretation. In this new model, family
medicine candidates take one examination that would meet the criteria for the MCCQE Part II
and allow candidates to receive their LMCC and support CFPC making pass-fail decisions on the
clinical skills component of their certifying examination. Concurrently, other specialty
candidates would take the MCCQE Part II to meet the criteria for their LMCC, with a somewhat
different set of stations.
Evaluating the potential negative impacts or improvements to this testing model prior to
implementation was critical. In this study two standard setting procedures used to set a common
performance standard across two test forms (MCCQE Part II and CFPC CSE) were evaluated.
Two different test forms were simulated to represent the new testing model of eight 10-minute
stations and four couplet stations for the other specialty candidates and the same eight 10-minute
stations and four SOO stations for the family medicine candidates. A bootstrap methodology
was implemented to evaluate the two standard setting procedures to set a common performance
standard so that the same valid and reliable classification decisions are made for both candidate
groups. The bootstrap study results indicated that the pass rates, decision consistency and
accuracy values are within acceptable ranges.

COMMON PERFORMANCE STANDARD 19 19
This study also provided an opportunity to assess how to implement scaling (Levine
Observed Score) and indicated possible limitations to how the performance standards should be
set. For example, because the candidates were not taking all of the same stations, the
requirement of passing eight of twelve stations was judged as no longer feasible. To apply a
common standard, a reference group (i.e., other specialty) was needed to calculate the total cut-
score. This standard could then be applied to the family medicine candidates’ scaled scores. The
need for the reference group was driven by how the modified borderline group method
aggregates station cut-scores to calculate the total cut-score. However, with a standard setting
method that determines the cut-score at the total score level using all candidates might be viable.
There were some limitations to this study that could be addressed in subsequent research
studies. The data used to simulate the bootstrap samples had to be based on matched data
between the MCCQE Part II and the CFPC SOO stations. In this case, going back to 2009 data
was necessary to generate adequately large samples from which to randomly select for the
replications. Since this data is four years from the 2013 implementation date, differences in
cohort effects, content specifications, and in stations since 2009 may mean that base data may
not accurately reflect 2013 data and the accuracy of the simulations will be less as a result. In
addition, data had to be drawn from two examination administrations (fall and spring) in order to
build a large enough sample. The difficulty was a result of drawing data for each family
medicine candidate from two examinations so each candidate had to have passed the MCCQE
Part II and at least attempted the CFPC certification examination to be included in the sample.
Accurately matching the source data to the new model was important. If the source data is not
reflective of future changes the results may not be useful with the bootstrap methodology.

COMMON PERFORMANCE STANDARD 20 20
However, the bootstrap result provided estimates of what might be found given the data
limitations.
The bootstrap methodology was deemed to be useful in evaluating changing conditions in
this context and this study demonstrates how this methodology can be used to evaluate any
number of changing conditions to assist with assessing risk.

COMMON PERFORMANCE STANDARD 21 21
References
Boulet, J. R., De Champlain, A. F., & McKinley, D. W. (2003). Setting defensible
performance standards on OSCEs and standardized patient examinations. Medical
Teacher, 25(3), 245-249. doi: 10.1080/0142159031000100274
Boulet, J. R., Murray, D., Kras, J., & Woodhouse, J. (2008). Setting performance standards for
mannequin-based acute-care scenarios. Simulation in Healthcare, 3(2), 72-81. doi:
10.1097/SIH.0b013e31816e39e2
Brennan, R. L. (2004). Manual for BB-Class: A computer program that uses the Beta-binomial
model for classification consistency and accuracy. [Computer software] Version 1.1.
Cizek, G. J. (Ed.). (2012). Setting performance standards: Foundations, methods, and
innovations. (2nd ed.) New York, NY: Routledge.
Cizek, G. J., & Bunch, M. B. (2007). Standard setting: A guide to establishing and evaluating
performance standards on tests. Thousand Oaks, CA: Sage Publications Inc.
College of Family Physicians of Canada (2012A). Short Answer Management Problems
(SAMPs). Retrieved from: http://www.cfpc.ca/SAMPs/ January 18, 2012.
College of Family Physicians of Canada (2012B). Simulated Office Orals (SOOs). Retrieved
from: http://www.cfpc.ca/SOOs/ January 18, 2012.
Dauphinee, W. D., Blackmore, D. E., Smee, S., Rothman, A. I., & Reznick, R. (1997). Using
the judgments of physician examiners in setting the standards for a national multi-center
high stakes OSCE. Advances in Health Sciences Education, 2(3), 201-211.
De Champlain, A. F. (2004). Ensuring that the competent are truly competent: An overview of
common methods and procedures used to set standards on high-stakes examinations.
Journal of Veterinary Medical Education, 31(1), 62-66.

COMMON PERFORMANCE STANDARD 22 22
Downing, S. M., Tekian, A., & Yudowsky, R. (2006). Procedures for establishing defensible
absolute passing scores on performance examinations in health professions education.
Teaching and Learning in Medicine, 18(1), 50-57. doi: 10.1207/s15328015tlm1801_11
Efron, B. (1979). Bootstrap methods: Another look at the jackknife. The Annals of Statistics,
7(1), 1-26.
Efron B., & Tibshirani, R. J. (1993). Introduction to the bootstrap. Boca Raton, FL: CRC
Press LLC.
Hofstee, W. K. B. (1983). The case for compromise in educational selection and grading. In
S. B. Anderson & J. S. Helmick (Eds.), On educational testing (pp. 109-127).
Holland, P. W., & Dorans, N. J. (2006). Linking and equating. In R. L. Brennan (Ed.),
Educational measurement (4th ed., pp. 155-186). Westport, CT: Praeger Publishers.
Kolen, M. J. (2006). Scaling and norming. In R. L. Brennan (Ed.), Educational measurement
(4th ed., pp. 155-186). Westport, CT: Praeger Publishers.
Kolen, M. J., & Brennan, R. L. (2004). Test equating, scaling, and linking: Methods and
practices (2nd ed.). New York, NY: Springer Science + Business Media, LLC.
Linn, R. L. (1993). Linking results of distinct assessments. Applied Measurement in
Education, 6(1), 83-102. doi: 10.1207/s15324818ame0601_5
Livingston, S. A., & Lewis, C. (1995). Estimating the consistency and accuracy of
classifications based on test scores. Journal of Educational Measurement, 32(2), 179-
197.
McKinley, D. W., Boulet, J. R., & Hambleton, R. K. (2005). A work-centered approach for
setting passing scores on performance-based assessments. Evaluation & the Health
Professions, 28(3), 349-369. doi: 10.1177/0163278705278282

COMMON PERFORMANCE STANDARD 23 23
Mislevy, R. J. (1992). Linking educational assessments: Concepts, issues, methods, and
prospects. Princeton, NJ: Educational Testing Service.
Zieky, M. J., & Livingston, S. A. (1977). Manual for setting standards on the Basic Skills
Assessment Tests. Princeton, NJ: Educational Testing Service.
COMMON PERFORMANCE STANDARD 24 24
Table 1.
Descriptive Statistics for the Bootstrap Replications and Total Scores
Other Specialty
Number of
Replications
N per
Replication Mean
Standard
Deviation Min Max
Spring 1000 750 64.16 7.56 38.94 82.44
Fall 1000 2300 69.90 7.12 39.65 88.44
Family Medicine
Number of
Replications
N per
Replication Mean
Standard
Deviation Min Max
Spring 1000 250 72.61 5.70 53.93 85.22
Fall 1000 700 73.60 4.90 57.15 87.38

COMMON PERFORMANCE STANDARD 25 25
Table 2.
Decision Consistency, False Positive and False Negative Rates by Candidate Group and
Standard Setting Procedure
Spring Fall
DC2 False
Positive
False
Negative DC
2 False
Positive
False
Negative
Other specialty – MBG1
0.84 0.08 0.07 0.91 0.05 0.04
Other specialty - Hofstee 0.84 0.09 0.08 0.87 0.07 0.06
Family Medicine –MBG1
0.97 0.01 0.01 0.98 0.01 0.01
Family Medicine -Hofstee 0.97 0.02 0.01 0.95 0.03 0.02
1 MBG – modified borderline group method
2 DC – Decision Consistency
Note. The values of decision consistency, false positive and false negative do not always equal
1.0 due to rounding.

COMMON PERFORMANCE STANDARD 26 26
Table 3.
Decision Accuracy, False Positive and False Negative Rates by Candidate Group and Standard
Setting Procedure
Spring Fall
DA2 False
Positive
False
Negative DA
2 False
Positive
False
Negative
Other Specialty – MBG1
0.76 0.00 0.24 0.89 0.00 0.11
Other Specialty -Hofstee 0.75 0.00 0.25 0.82 0.00 0.18
Family Medicine –MBG1
0.98 0.00 0.02 0.99 0.00 0.01
Family Medicine -Hofstee 0.98 0.00 0.02 0.97 0.00 0.03
1 MBG – modified borderline group method
2 DA – Decision Accuracy
Note. The values of decision accuracy, false positive and false negative do not always equal 1.0
due to rounding.

COMMON PERFORMANCE STANDARD 27
Figure 1. Pathway to medical licensure and certification for family medicine candidates.
Medical School
Family Medicine PGT: 24 Months
License and Specialty Certificate - Eligible for
full licensure
Past Part I Part II Certification Exam (performance exam + written exam)
New Part I Clinical Skills Exam (OSCE + performance exam) + written exam
License
License
Certification
Certification
Part I Clinical Skills Exam (OSCE + performance exam)

COMMON PERFORMANCE STANDARD 28
Figure 2. Spring 2013 pathway to medical licensing decision.
8 common 10-minute stations
Licensing decision for other specialty
and family medicine
family medicine
4 SOOstations
other specialty
4 coupletstations
Total score for CFPC CSE
for family medicine
Total score for MCCQE
Part II for other specialty

COMMON PERFORMANCE STANDARD 29
Figure 3. Pass rate for two candidate groups by standard setting procedure and administration.
0
10
20
30
40
50
60
70
80
90
100
Spring Fall
Pa
ss r
ate
family medicine border family medicine Hofstee other specialty border other specialty Hofstee