session&12:&loose&ends&in& …adamodar/pdfiles/valonlineslides/...adris grupa...
TRANSCRIPT

SESSION 12: LOOSE ENDS IN VALUATION – II ACQUISITION ORNAMENTS – SYNERGY, CONTROL AND COMPLEXITY
Aswath Damodaran
Aswath Damodaran! 1!

2!
1. The Value of Synergy
Synergy is created when two firms are combined and can be either financial or operating
Operating Synergy accrues to the combined firm as Financial Synergy
Higher returns on new investments
More newInvestments
Cost Savings in current operations
Tax BenefitsAdded Debt Capacity Diversification?
Higher ROC
Higher Growth Rate
Higher Reinvestment
Higher Growth RateHigher Margin
Higher Base-year EBIT
Strategic Advantages Economies of Scale
Longer GrowthPeriod
More sustainableexcess returns
Lower taxes on earnings due to - higher depreciaiton- operating loss carryforwards
Higher debt raito and lower cost of capital
May reducecost of equity for private or closely heldfirm
Aswath Damodaran!
2!

3!
Valuing Synergy
1. The firms involved in the merger are valued independently, by discounQng expected cash flows to each firm at the weighted average cost of capital for that firm.
2. The value of the combined firm, with no synergy, is obtained by adding the values obtained for each firm in the first step.
3. The effects of synergy are built into expected growth rates and cashflows, and the combined firm is re-‐valued with synergy. Value of Synergy = Value of the combined firm, with
synergy -‐ Value of the combined firm, without synergy
Aswath Damodaran!
3!

4!
Valuing Synergy: P&G + GilleZe
P&G Gillette Combined:/No/Synergy Combined:/SynergyFree/Cashflow/to/Equity $5,864.74 $1,547.50 $7,412.24 $7,569.73 Annual/operating/expenses/reduced/by/$250/millionGrowth/rate/for/first/5/years 12% 10% 11.58% 12.50% Slighly/higher/growth/rateGrowth/rate/after/five/years 4% 4% 4.00% 4.00%Beta 0.90 0.80 0.88 0.88Cost/of/Equity 7.90% 7.50% 7.81% 7.81% Value/of/synergyValue/of/Equity $221,292 $59,878 $281,170 $298,355 $17,185
Aswath Damodaran!
4!

5!
2. The Value of Control
¨ The value of the control premium that will be paid to acquire a block of equity will depend upon two factors -‐ ¤ Probability that control of firm will change: This refers to the probability that incumbent management will be replaced. this can be either through acquisiQon or through exisQng stockholders exercising their muscle.
¤ Value of Gaining Control of the Company: The value of gaining control of a company arises from two sources -‐ the increase in value that can be wrought by changes in the way the company is managed and run, and the side benefits and perquisites of being in control
¤ Value of Gaining Control = Present Value (Value of Company with change in control -‐ Value of company without change in control) + Side Benefits of Control
Aswath Damodaran!
5!

Aswath Damodaran!6!
Current Cashflow to FirmEBIT(1-t) : 436 HRK- Nt CpX 3 HRK - Chg WC -118 HRK= FCFF 551 HRKReinv Rate = (3-118)/436= -26.35%; Tax rate = 17.35%Return on capital = 8.72%
Expected Growth from new inv..7083*.0969 =0.0686or 6.86%
Stable Growthg = 4%; Beta = 0.80Country Premium= 2%Cost of capital = 9.92%Tax rate = 20.00% ROC=9.92%; Reinvestment Rate=g/ROC =4/9.92= 40.32%
Terminal Value5= 365/(.0992-.04) =6170 HRK
Cost of Equity10.70%
Cost of Debt(4.25%+ 0.5%+2%)(1-.20)= 5.40 %
WeightsE = 97.4% D = 2.6%
Discount at $ Cost of Capital (WACC) = 10.7% (.974) + 5.40% (0.026) = 10.55%
Op. Assets 4312+ Cash: 1787- Debt 141 - Minority int 465=Equity 5,484/ (Common + Preferred shares) Value non-voting share335 HRK/share
Riskfree Rate:HRK Riskfree Rate= 4.25% +
Beta 0.70 X
Mature market premium 4.5%
Unlevered Beta for Sectors: 0.68
Firmʼs D/ERatio: 2.70%
Adris Grupa (Status Quo): 4/2010
Reinvestment Rate 70.83%
Return on Capital 9.69%
612246365
+
Country Default Spread2%
XRel Equity Mkt Vol
1.50
On May 1, 2010AG Pfd price = 279 HRKAG Common = 345 HRK
HKR Cashflows
Lambda0.68 X
CRP for Croatia (3%)
XLambda0.42
CRP for Central Europe (3%)
Average from 2004-0970.83%
Average from 2004-099.69%
Year 1 2 3 4 5EBIT (1-t) HRK 466 HRK 498 HRK 532 HRK 569 HRK 608 - Reinvestment HRK 330 HRK 353 HRK 377 HRK 403 HRK 431FCFF HRK 136 HRK 145 HRK 155 HRK 166 HRK 177

Current Cashflow to FirmEBIT(1-t) : 436 HRK- Nt CpX 3 HRK - Chg WC -118 HRK= FCFF 551 HRKReinv Rate = (3-118)/436= -26.35%; Tax rate = 17.35%Return on capital = 8.72%
Expected Growth from new inv..7083*.01054=0.or 6.86%
Stable Growthg = 4%; Beta = 0.80Country Premium= 2%Cost of capital = 9.65%Tax rate = 20.00% ROC=9.94%; Reinvestment Rate=g/ROC =4/9.65= 41/47%
Terminal Value5= 367/(.0965-.04) =6508 HRK
Cost of Equity11.12%
Cost of Debt(4.25%+ 4%+2%)(1-.20)= 8.20%
WeightsE = 90 % D = 10 %
Discount at $ Cost of Capital (WACC) = 11.12% (.90) + 8.20% (0.10) = 10.55%
Op. Assets 4545+ Cash: 1787- Debt 141 - Minority int 465=Equity 5,735
Value/non-voting 334Value/voting 362
Riskfree Rate:HRK Riskfree Rate= 4.25% +
Beta 0.75 X
Mature market premium 4.5%
Unlevered Beta for Sectors: 0.68
Firmʼs D/ERatio: 11.1%
Adris Grupa: 4/2010 (Restructured)
Reinvestment Rate 70.83%
Return on Capital 10.54%
628246367
+
Country Default Spread2%
XRel Equity Mkt Vol
1.50
On May 1, 2010AG Pfd price = 279 HRKAG Common = 345 HRK
HKR Cashflows
Lambda0.68 X
CRP for Croatia (3%)
XLambda0.42
CRP for Central Europe (3%)
Average from 2004-0970.83%
e
Year 1 2 3 4 5EBIT (1-t) HRK 469 HRK 503 HRK 541 HRK 581 HRK 623 - Reinvestment HRK 332 HRK 356 HRK 383 HRK 411 HRK 442FCFF HRK 137 HRK 147 HRK 158 HRK 169 HRK 182
Increased ROIC to cost of capital
Changed mix of debt and equity tooptimal
Aswath Damodaran!7!

8!
Value of Control and the Value of VoQng Rights
¨ The value of control at Adris Grupa can be computed as the difference between the status quo value (5469) and the opQmal value (5735).
¨ In this case, we have two values for Adris Grupa’s Equity.
Status Quo Value of Equity = 5,469 million HKR
¨ All shareholders, common and preferred, get an equal share of the status quo value.
Value for a non-‐voQng share = 5469/(9.616+6.748) = 334 HKR/share
¨ The value of the voQng shares derives from the capacity to change the way the firm is run
OpQmal value of Equity = 5,735 million HKR
Value of control at Adris Grupa = 5,735 – 5469 = 266 million HKR
Only voQng shares get a share of this value of control
Value per voQng share =334 HKR + 266/9.616 = 362 HKR
Aswath Damodaran!
8!

9!
3. A Discount for Complexity: An Experiment
Company A Company B OperaQng Income $ 1 billion $ 1 billion Tax rate 40% 40% ROIC 10% 10% Expected Growth 5% 5% Cost of capital 8% 8% Business Mix Single Business MulQple Businesses Holdings Simple Complex AccounQng Transparent Opaque ¨ Which firm would you value more highly?
Aswath Damodaran!
9!

10!
Measuring Complexity: Volume of Data in Financial Statements
Company Number of pages in last 10Q Number of pages in last 10K
General Electric 65 410
Microsoft 63 218
Wal-mart 38 244
Exxon Mobil 86 332
Pfizer 171 460
Citigroup 252 1026
Intel 69 215
AIG 164 720
Johnson & Johnson 63 218
IBM 85 353
Aswath Damodaran!
10!

11!
Measuring Complexity: A Complexity Score 11!
12!
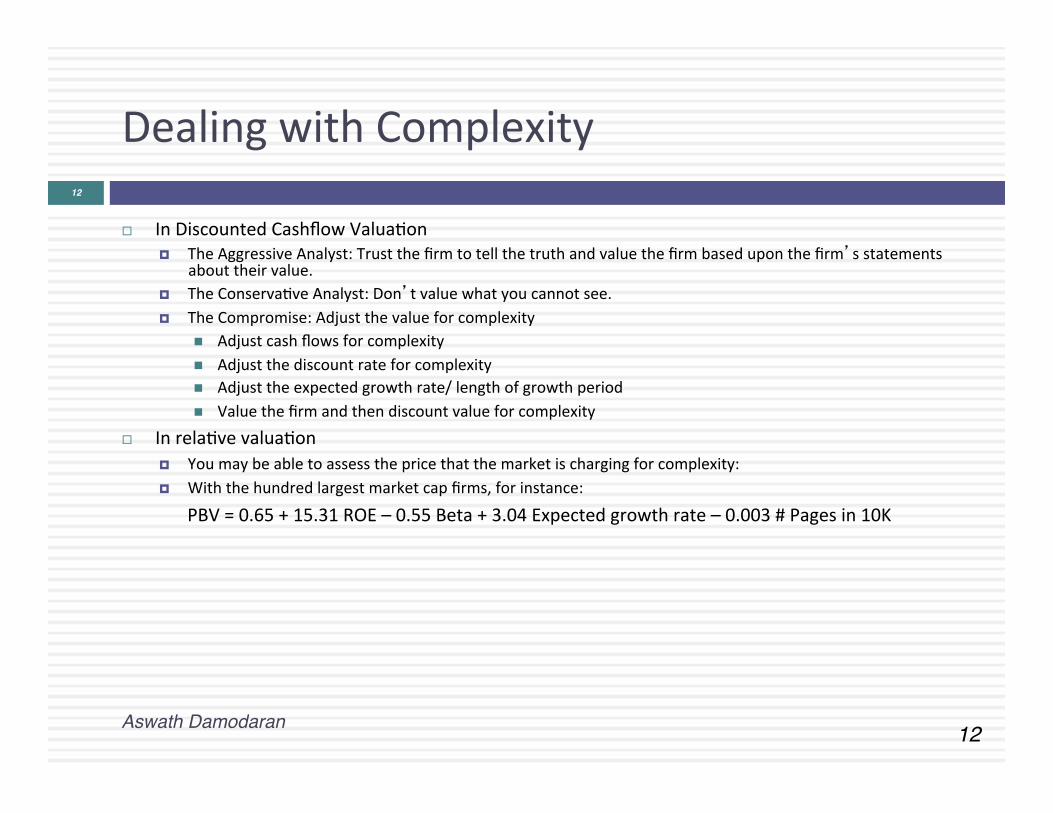
Dealing with Complexity
¨ In Discounted Cashflow ValuaQon ¤ The Aggressive Analyst: Trust the firm to tell the truth and value the firm based upon the firm’s statements
about their value. ¤ The ConservaQve Analyst: Don’t value what you cannot see. ¤ The Compromise: Adjust the value for complexity
n Adjust cash flows for complexity n Adjust the discount rate for complexity n Adjust the expected growth rate/ length of growth period n Value the firm and then discount value for complexity
¨ In relaQve valuaQon ¤ You may be able to assess the price that the market is charging for complexity: ¤ With the hundred largest market cap firms, for instance:
PBV = 0.65 + 15.31 ROE – 0.55 Beta + 3.04 Expected growth rate – 0.003 # Pages in 10K
Aswath Damodaran!
12!