session: assessing english learner progress and the
TRANSCRIPT
1Participant Introductions
Session: Assessing English Learner Progress and the Quality of English Language Programs
Presenters:
• Sharon Prestridge, EL Program Coordinator, Mississippi Department of Education
• Mark Hansen, Assistant Professor, UCLA-CRESST
• Maria Santos, Education Consultant
• Pete Goldschmidt, Professor, California State University Northridge
Discussant:
• Kenji Hakuta, Professor Emeritus, Stanford University
mdek12.org
June 21, 2021
EL Program Coordinator / Accommodations Coordinator
Sharon Prestridge
Overview of Project - Evaluating English
Language Progress Models: The Sensitivity of
Claims about Progress across State Models
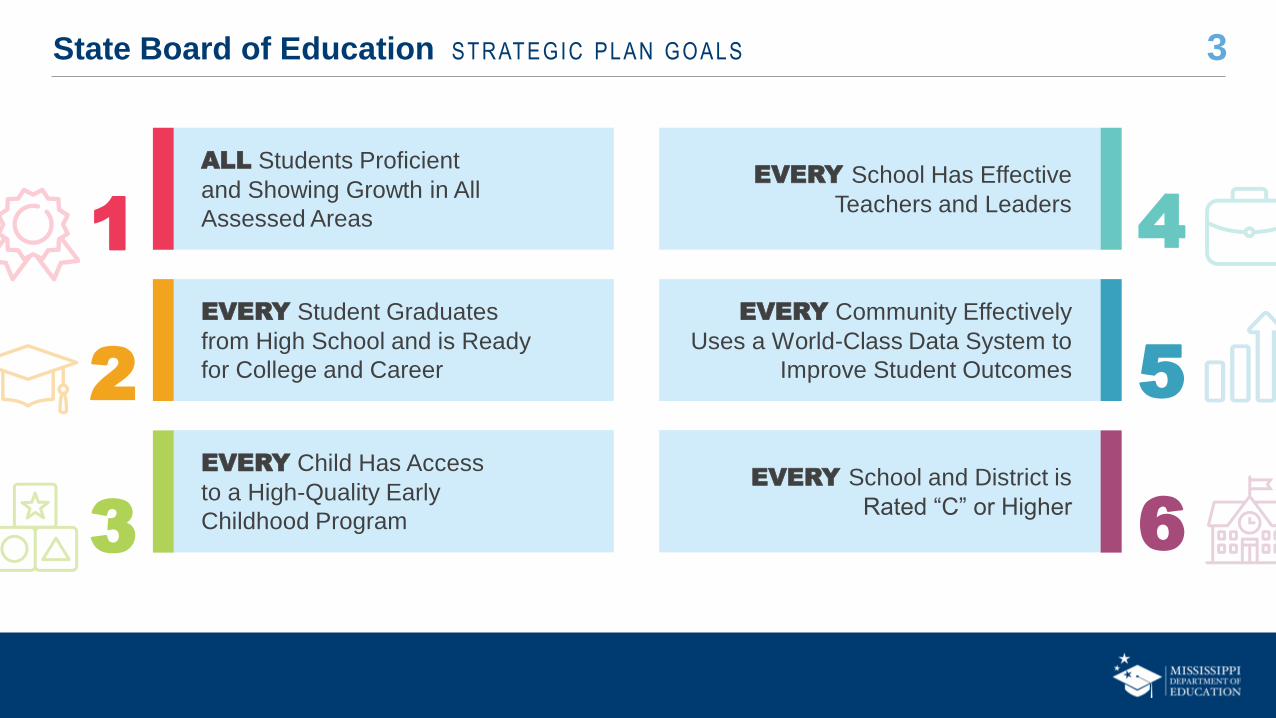
ALL Students Proficient
and Showing Growth in All
Assessed Areas
EVERY Student Graduates
from High School and is Ready
for College and Career
EVERY Child Has Access
to a High-Quality Early
Childhood Program
EVERY School Has Effective
Teachers and Leaders
EVERY Community Effectively
Uses a World-Class Data System to
Improve Student Outcomes
EVERY School and District is
Rated “C” or Higher
1
2
3
4
5
6
3State Board of Education STRATEGIC PLAN GOALS
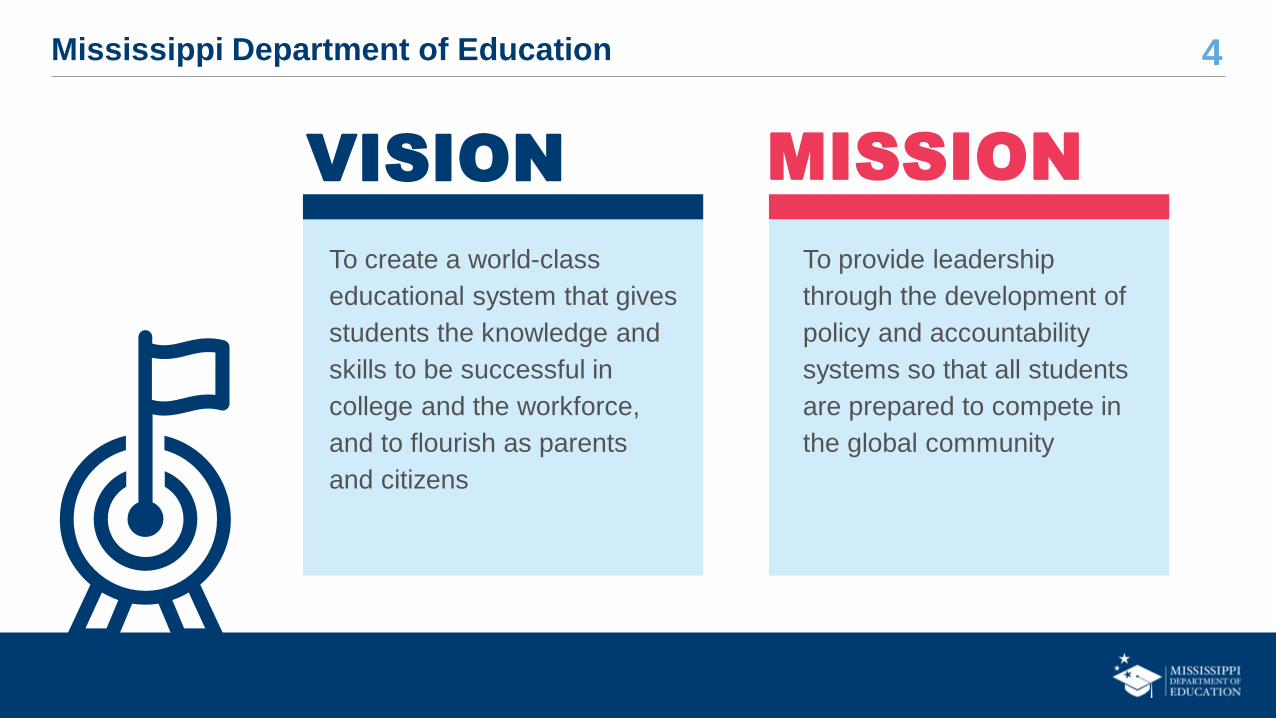
To create a world-class
educational system that gives
students the knowledge and
skills to be successful in
college and the workforce,
and to flourish as parents
and citizens
VISION
To provide leadership
through the development of
policy and accountability
systems so that all students
are prepared to compete in
the global community
MISSION
Mississippi Department of Education 4

5Project Purpose
The project evaluates English language progress models among
seven participating states to examine the sensitivity of claims
about progress toward English language proficiency and examine
the relationship between model results and the quality of EL
program implementation.
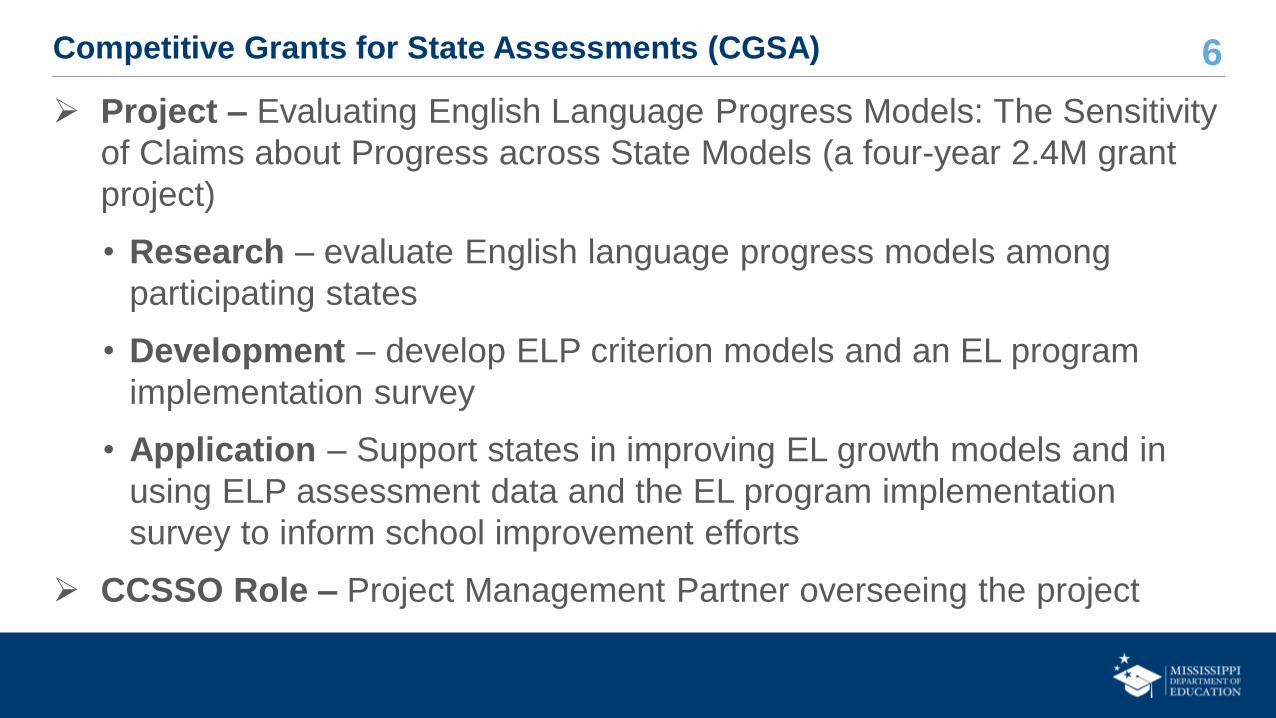
6Competitive Grants for State Assessments (CGSA)
➢ Project – Evaluating English Language Progress Models: The Sensitivity
of Claims about Progress across State Models (a four-year 2.4M grant
project)
• Research – evaluate English language progress models among
participating states
• Development – develop ELP criterion models and an EL program
implementation survey
• Application – Support states in improving EL growth models and in
using ELP assessment data and the EL program implementation
survey to inform school improvement efforts
➢ CCSSO Role – Project Management Partner overseeing the project
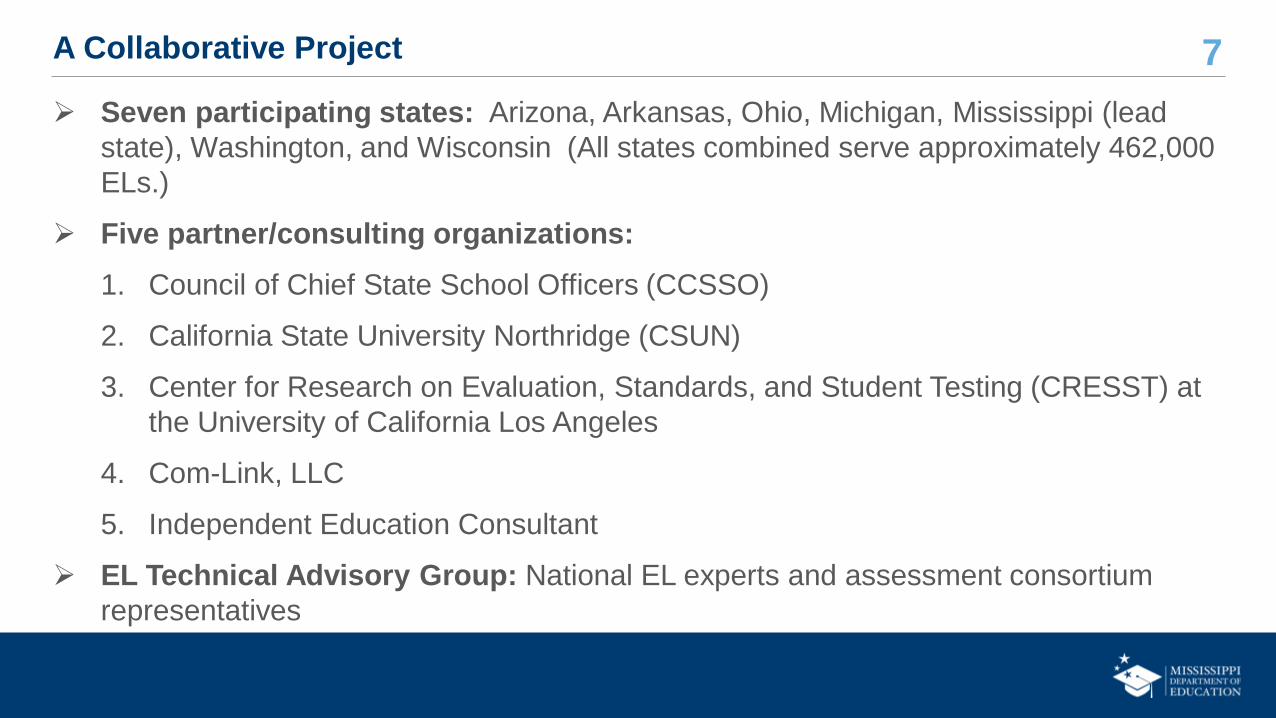
7A Collaborative Project
➢ Seven participating states: Arizona, Arkansas, Ohio, Michigan, Mississippi (lead
state), Washington, and Wisconsin (All states combined serve approximately 462,000
ELs.)
➢ Five partner/consulting organizations:
1. Council of Chief State School Officers (CCSSO)
2. California State University Northridge (CSUN)
3. Center for Research on Evaluation, Standards, and Student Testing (CRESST) at
the University of California Los Angeles
4. Com-Link, LLC
5. Independent Education Consultant
➢ EL Technical Advisory Group: National EL experts and assessment consortium
representatives
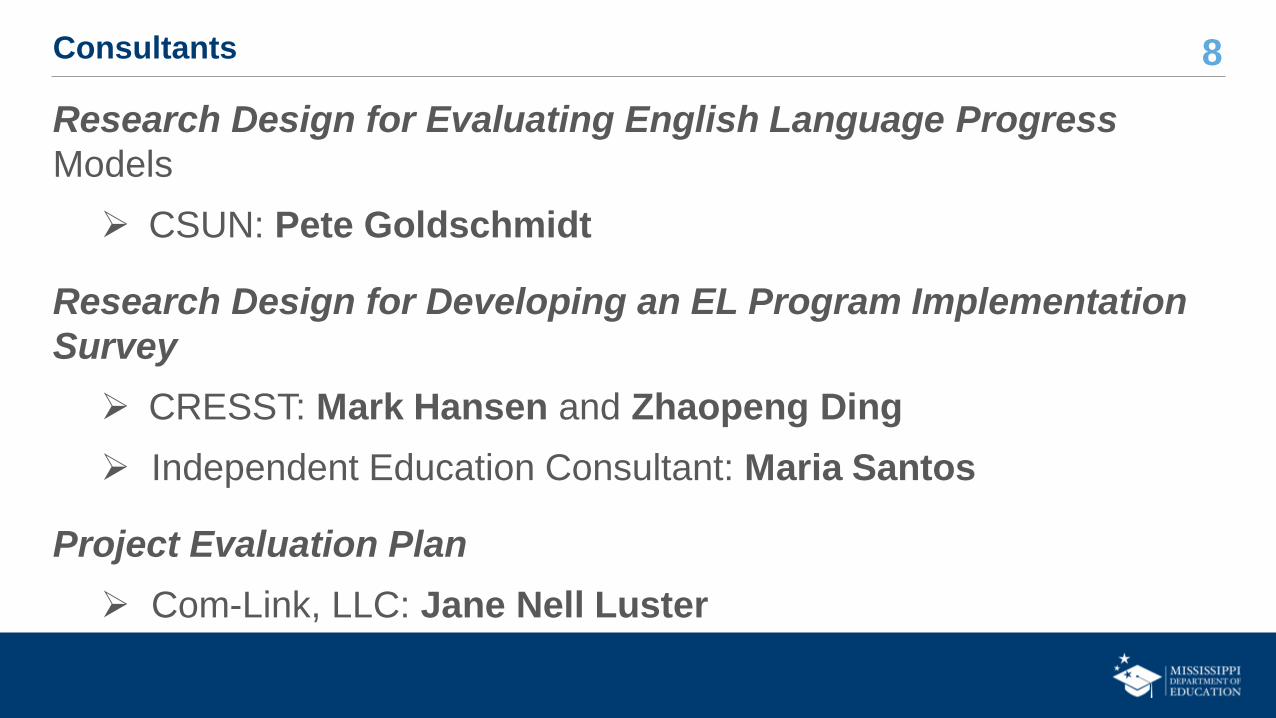
8Consultants
Research Design for Evaluating English Language Progress
Models
➢ CSUN: Pete Goldschmidt
Research Design for Developing an EL Program Implementation
Survey
➢ CRESST: Mark Hansen and Zhaopeng Ding
➢ Independent Education Consultant: Maria Santos
Project Evaluation Plan
➢ Com-Link, LLC: Jane Nell Luster
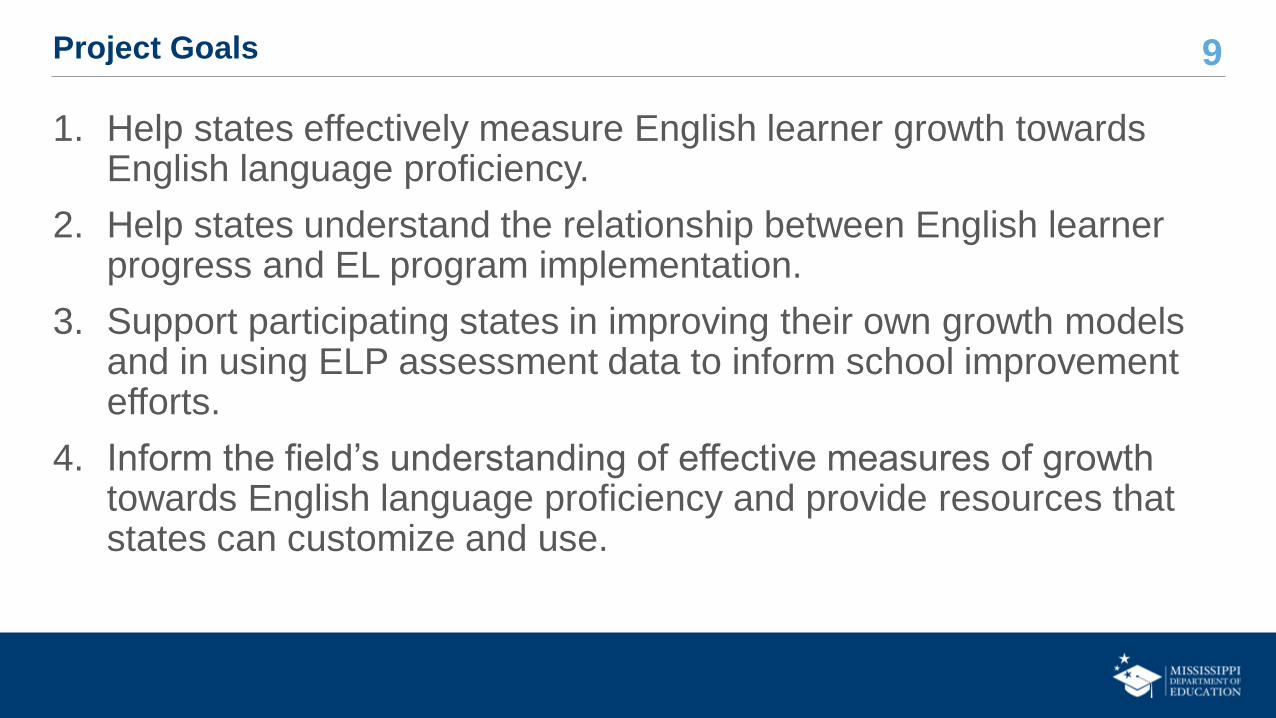
9Project Goals
1. Help states effectively measure English learner growth towards English language proficiency.
2. Help states understand the relationship between English learner progress and EL program implementation.
3. Support participating states in improving their own growth models and in using ELP assessment data to inform school improvement efforts.
4. Inform the field’s understanding of effective measures of growth towards English language proficiency and provide resources that states can customize and use.

10Project Outcomes
1. Disseminate research findings on existing models of measuring and assessing
ELP.
2. Develop new criterion growth models that can improve and broaden the array of
accountability modeling options.
3. Produce recommendations on using growth and ELP indicator results effectively
to monitor programs for ELs.
4. Disseminate the EL Program Implementation Survey and findings to help states
understand how ELP indicator and growth results relate to the EL program
implementation that student receive.
5. Produce a technical report that documents the research design, processes,
analysis procedures, findings, and lessons learned.
mdek12.org
11
EL Program Coordinator
Accommodations Coordinator
Sharon Prestridge
An EL Program Implementation Survey
© 2020 THE REGENTS OF THE UNIVERSITY OF CALIFORNIA
National Conference on Student AssessmentJune 21, 2021
Mark Hansen, UCLA/CRESSTMaría Santos, Independent Consultant
• Fen Chou, CCSSO, [email protected]
• Kathleen Lyons, CCSSO, [email protected]
• María Santos, Consultant, [email protected]
• Mark Hansen, UCLA/CRESST, [email protected]
• Zhaopeng Ding, UCLA/CRESST, [email protected]
Implementation Survey Team
© 2021 THE REGENTS OF THE UNIVERSITY OF CALIFORNIA
• Project Background
• Development of Implementation Survey Tools
• Results from Initial Pilot
Outline
© 2021 THE REGENTS OF THE UNIVERSITY OF CALIFORNIA
1. Help states effectively measure English learner growth towards English language proficiency
2. Help states understand the relationship between English learner progress and EL program implementation
3. Support participating states in refining their own growth models and using ELP assessment data to inform school improvement efforts
4. Inform the field’s understanding of effective measures of growth towards English language proficiency and provide resources that states can customize and use
Overall Project Goals
© 2021 THE REGENTS OF THE UNIVERSITY OF CALIFORNIA
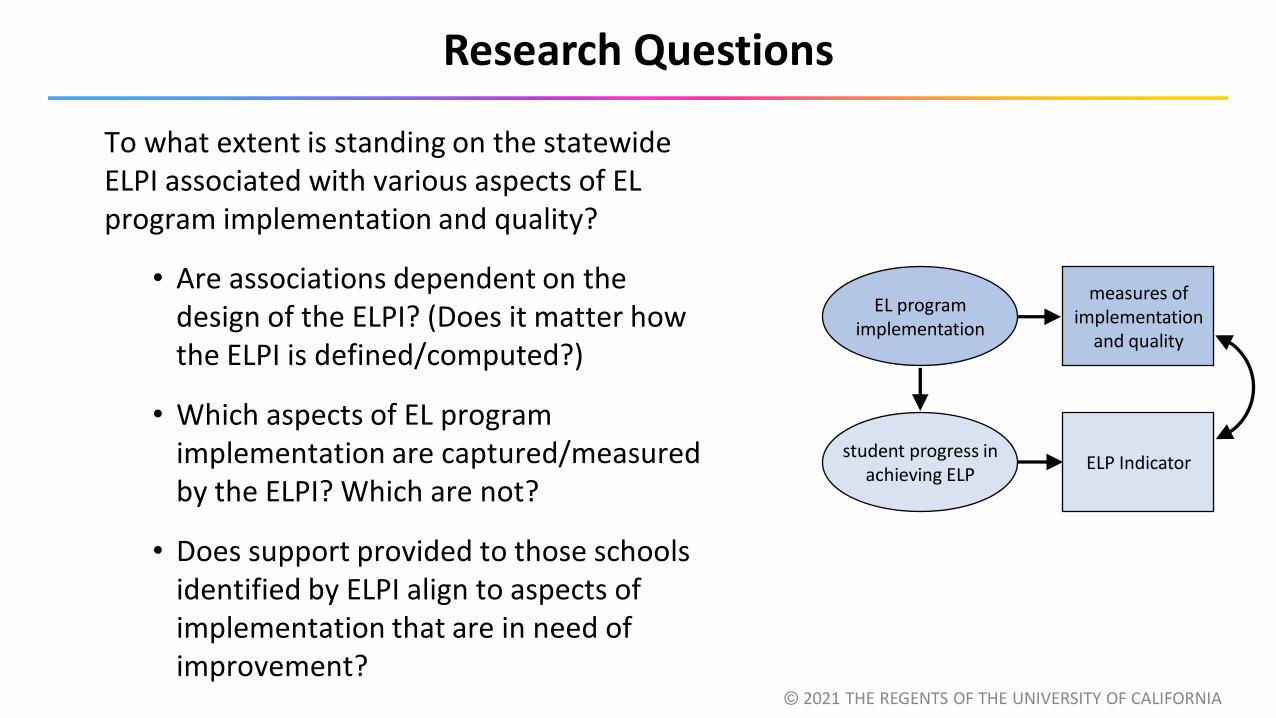
To what extent is standing on the statewide ELPI associated with various aspects of EL program implementation and quality?
• Are associations dependent on the design of the ELPI? (Does it matter how the ELPI is defined/computed?)
• Which aspects of EL program implementation are captured/measured by the ELPI? Which are not?
• Does support provided to those schools identified by ELPI align to aspects of implementation that are in need of improvement?
Research Questions
© 2021 THE REGENTS OF THE UNIVERSITY OF CALIFORNIA
student progress in achieving ELP
EL program implementation
ELP Indicator
measures of implementation
and quality
1. Identify important aspects of EL program implementation andquality
2. Develop tools for assessing these aspects of programimplementation and quality
3. Use the tools to assess program implementation and quality
4. Examine relationships between the aspects of implementationand quality and EL progress
Approach
© 2021 THE REGENTS OF THE UNIVERSITY OF CALIFORNIA

• What are the ways in which schools can influence the development of Englishlanguage proficiency? What aspects of the school context are relevant toEnglish learners' progress in attaining English language proficiency?
• How can (or how have) these aspects be measured?
Literature Review: Primary Questions
© 2021 THE REGENTS OF THE UNIVERSITY OF CALIFORNIA
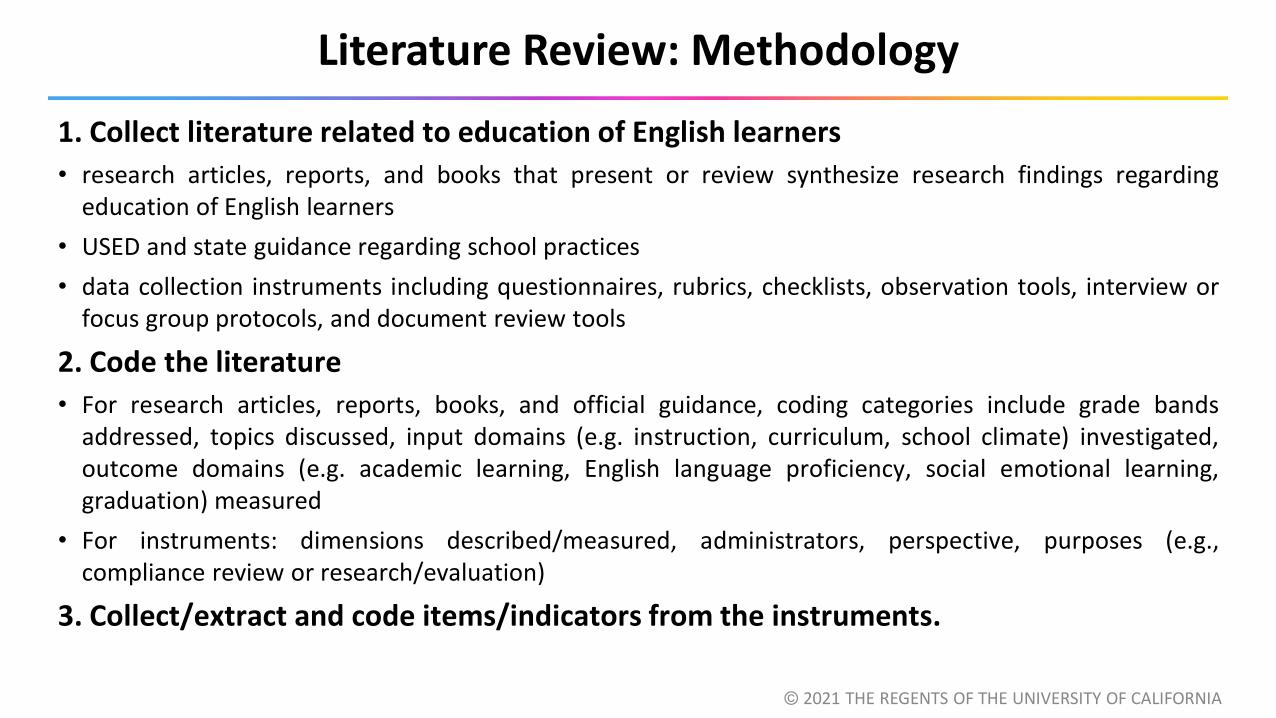
1. Collect literature related to education of English learners
• research articles, reports, and books that present or review synthesize research findings regardingeducation of English learners
• USED and state guidance regarding school practices
• data collection instruments including questionnaires, rubrics, checklists, observation tools, interview orfocus group protocols, and document review tools
2. Code the literature
• For research articles, reports, books, and official guidance, coding categories include grade bandsaddressed, topics discussed, input domains (e.g. instruction, curriculum, school climate) investigated,outcome domains (e.g. academic learning, English language proficiency, social emotional learning,graduation) measured
• For instruments: dimensions described/measured, administrators, perspective, purposes (e.g.,compliance review or research/evaluation)
3. Collect/extract and code items/indicators from the instruments.
Literature Review: Methodology
© 2021 THE REGENTS OF THE UNIVERSITY OF CALIFORNIA
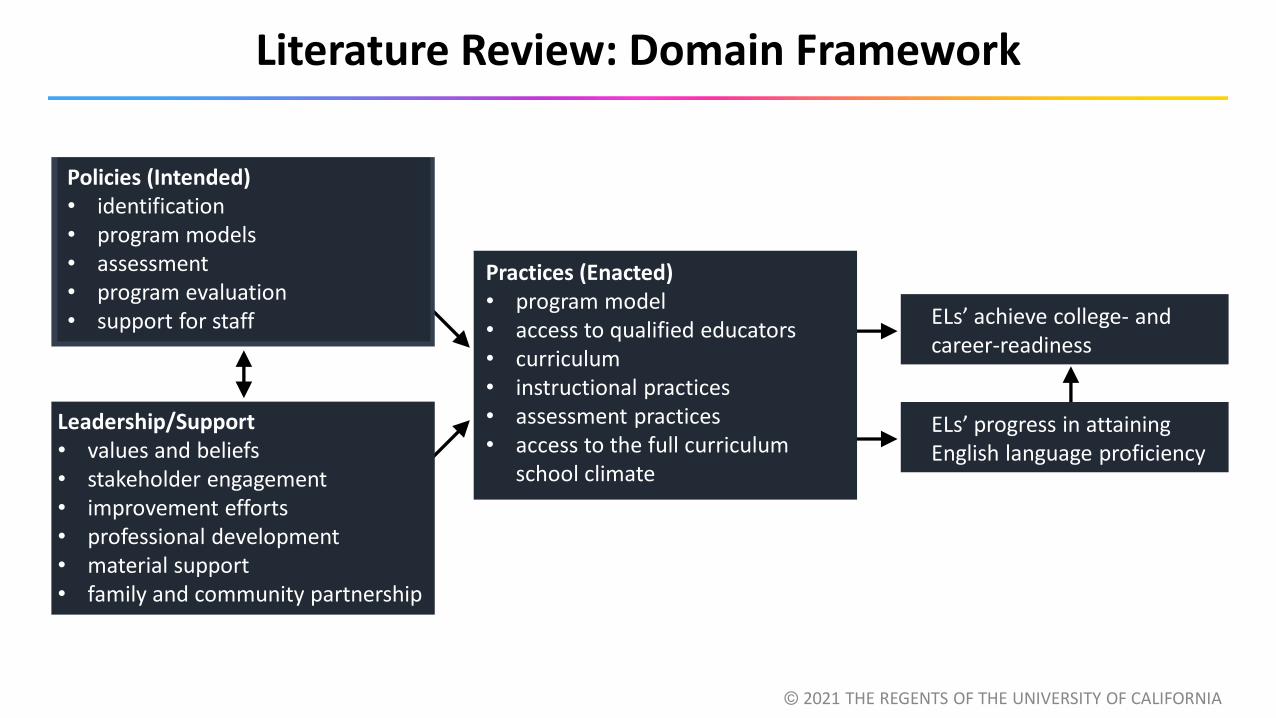
Literature Review: Domain Framework
Policies (Intended)• identification• program models• assessment• program evaluation• support for staff
Leadership/Support• values and beliefs• stakeholder engagement• improvement efforts• professional development• material support• family and community partnership
ELs’ achieve college- and career-readiness
ELs’ progress in attaining English language proficiency
Practices (Enacted)• program model• access to qualified educators• curriculum• instructional practices• assessment practices• access to the full curriculum
school climate
© 2021 THE REGENTS OF THE UNIVERSITY OF CALIFORNIA
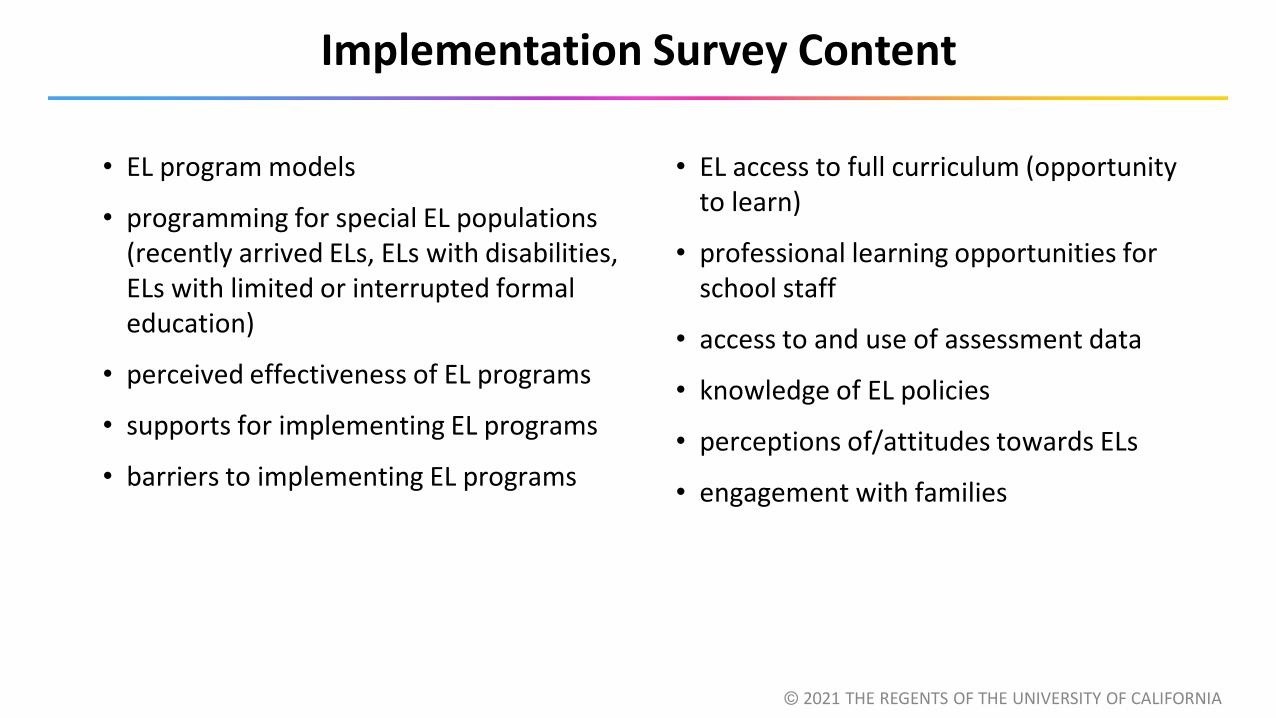
• EL program models
• programming for special EL populations (recently arrived ELs, ELs with disabilities, ELs with limited or interrupted formal education)
• perceived effectiveness of EL programs
• supports for implementing EL programs
• barriers to implementing EL programs
• EL access to full curriculum (opportunity to learn)
• professional learning opportunities for school staff
• access to and use of assessment data
• knowledge of EL policies
• perceptions of/attitudes towards ELs
• engagement with families
Implementation Survey Content
© 2021 THE REGENTS OF THE UNIVERSITY OF CALIFORNIA
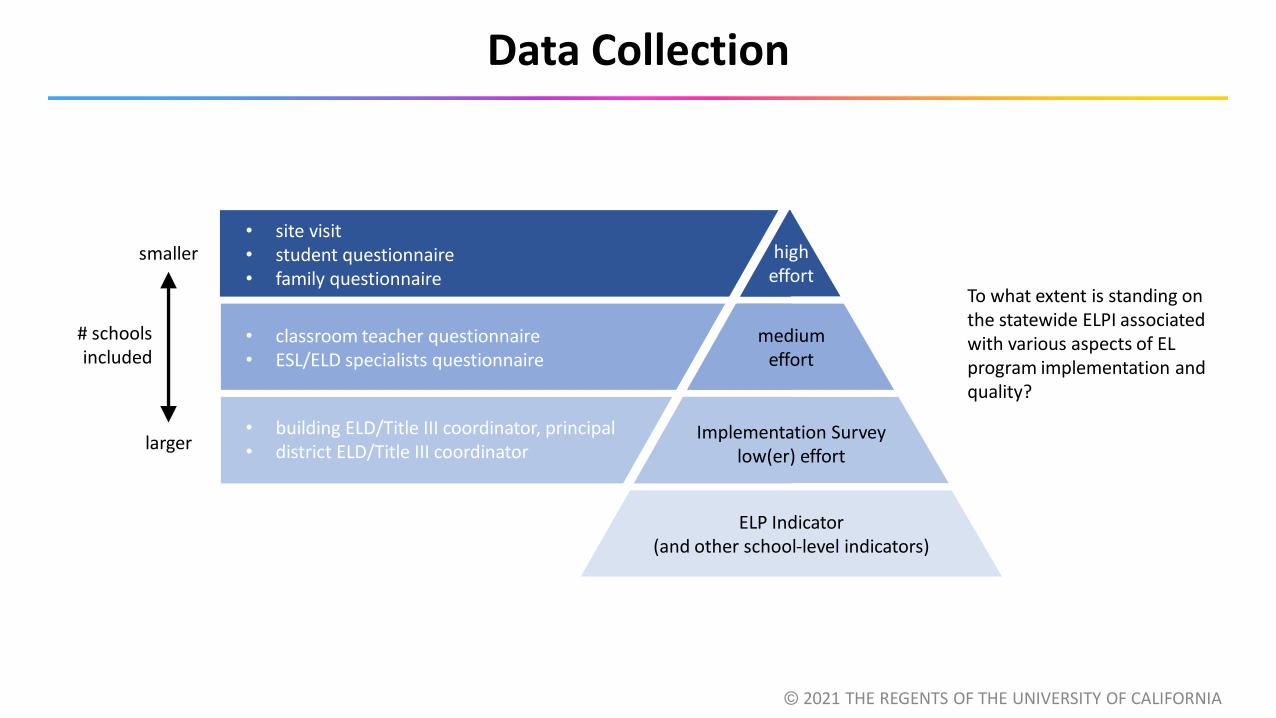
ELP Indicator(and other school-level indicators)
To what extent is standing on the statewide ELPI associated with various aspects of EL program implementation and quality?
• site visit• student questionnaire• family questionnaire
• classroom teacher questionnaire • ESL/ELD specialists questionnaire
• building ELD/Title III coordinator, principal• district ELD/Title III coordinator
higheffort
mediumeffort
Implementation Surveylow(er) effort
smaller
larger
# schools included
Data Collection
© 2021 THE REGENTS OF THE UNIVERSITY OF CALIFORNIA
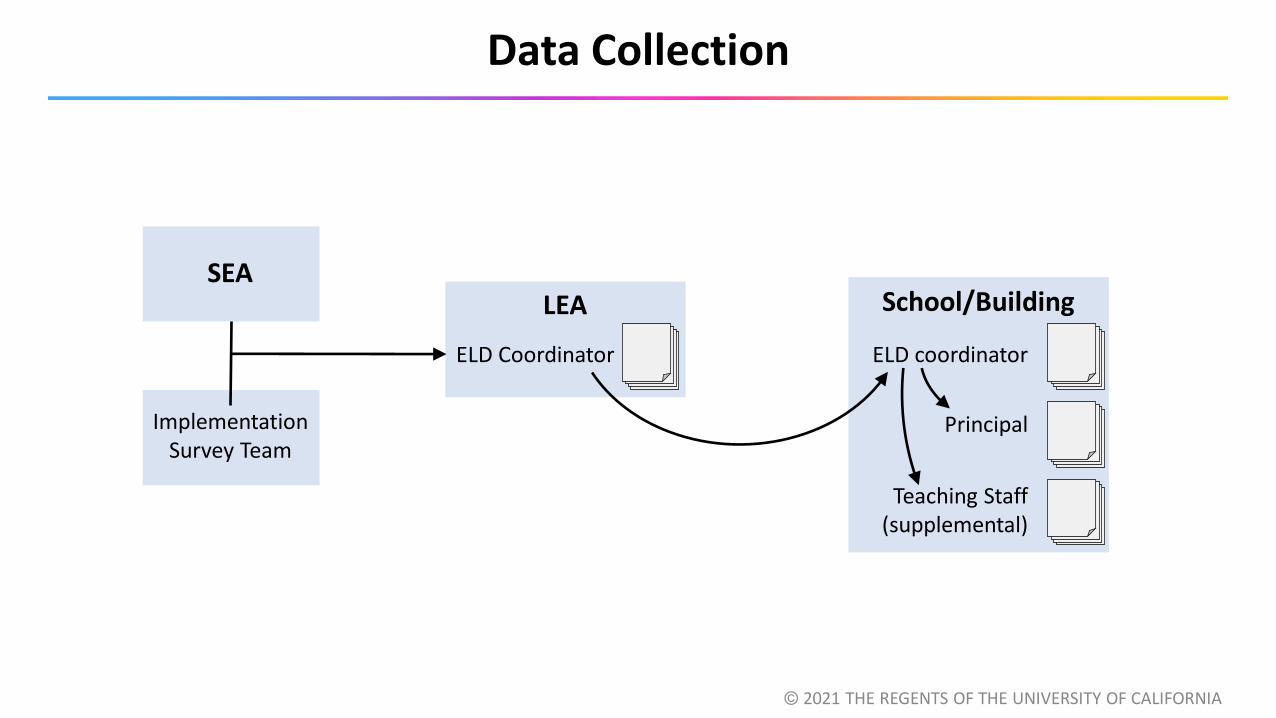
Data Collection
© 2021 THE REGENTS OF THE UNIVERSITY OF CALIFORNIA
Implementation Survey Team
SEALEA
ELD Coordinator ELD coordinator
School/Building
Teaching Staff(supplemental)
Principal
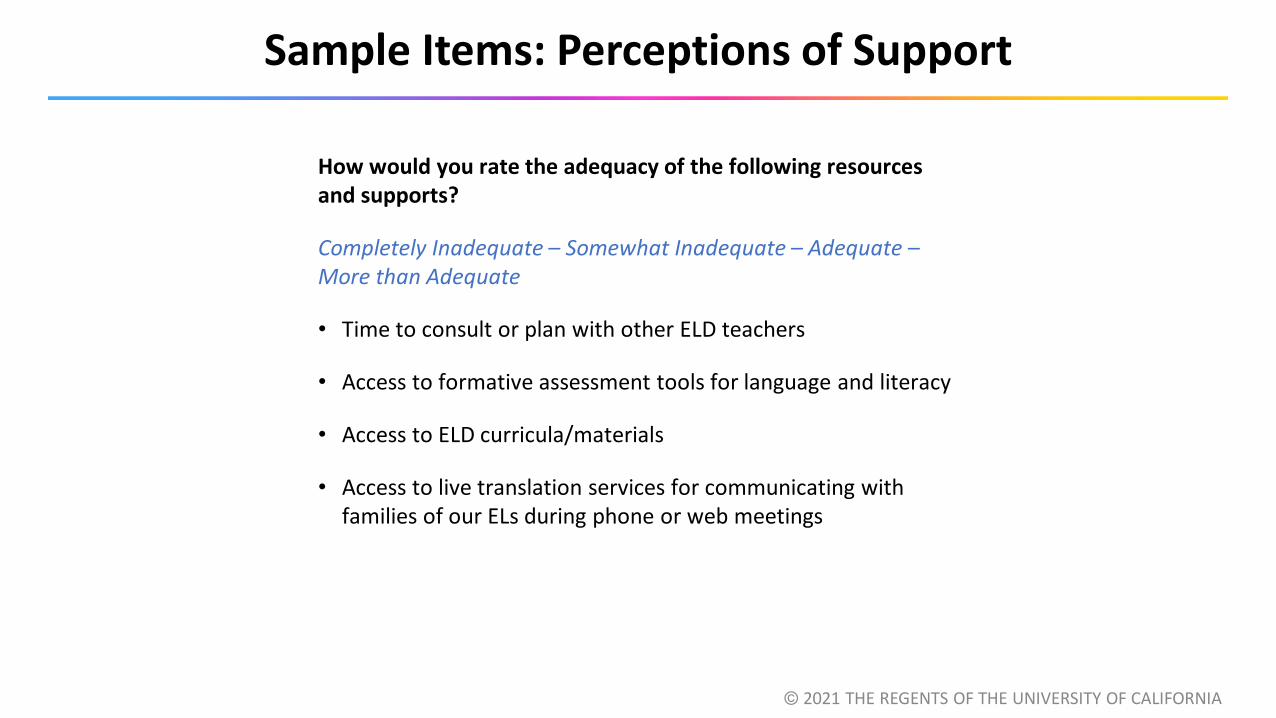
How would you rate the adequacy of the following resources and supports?
Completely Inadequate – Somewhat Inadequate – Adequate –More than Adequate
• Time to consult or plan with other ELD teachers
• Access to formative assessment tools for language and literacy
• Access to ELD curricula/materials
• Access to live translation services for communicating with families of our ELs during phone or web meetings
Sample Items: Perceptions of Support
© 2021 THE REGENTS OF THE UNIVERSITY OF CALIFORNIA
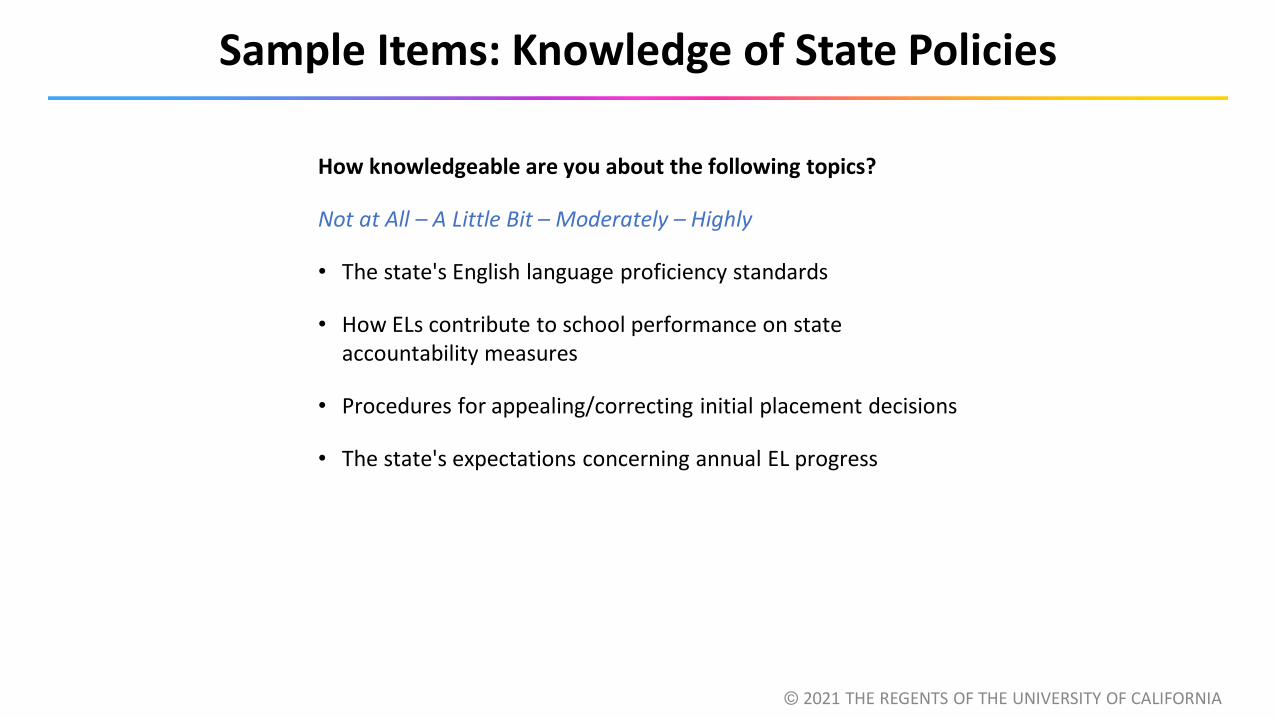
How knowledgeable are you about the following topics?
Not at All – A Little Bit – Moderately – Highly
• The state's English language proficiency standards
• How ELs contribute to school performance on state accountability measures
• Procedures for appealing/correcting initial placement decisions
• The state's expectations concerning annual EL progress
Sample Items: Knowledge of State Policies
© 2021 THE REGENTS OF THE UNIVERSITY OF CALIFORNIA
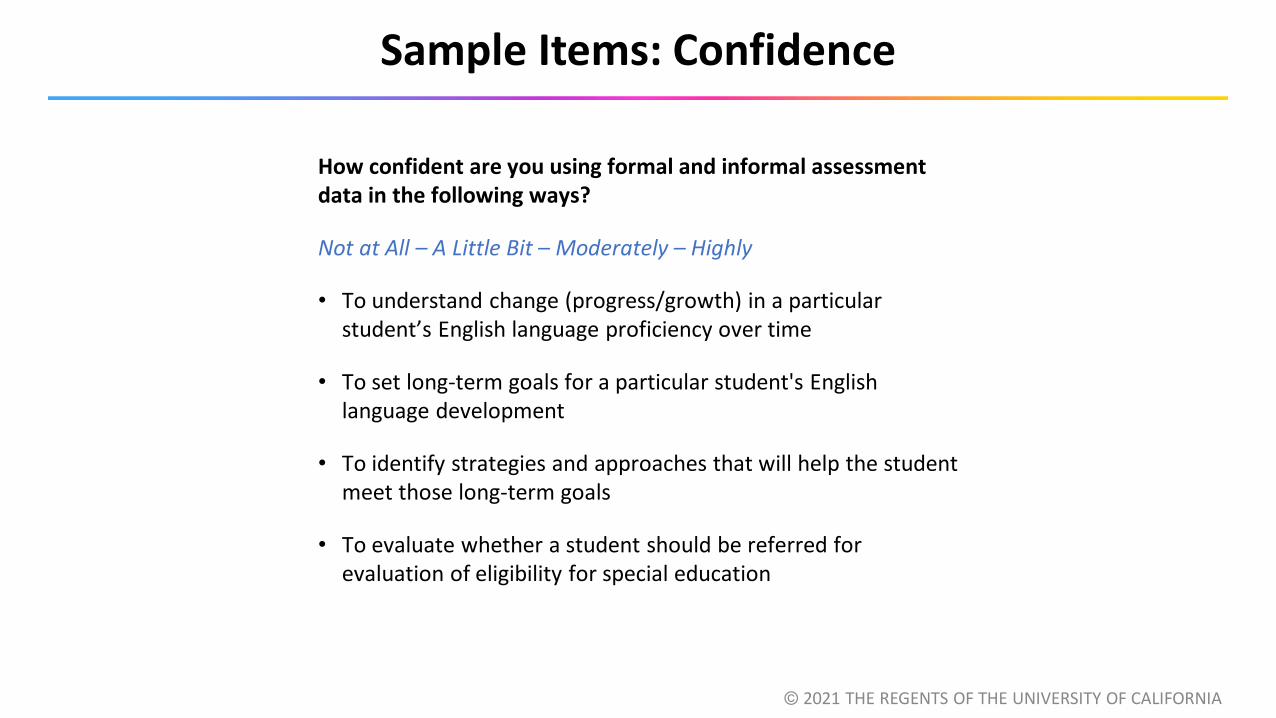
How confident are you using formal and informal assessment data in the following ways?
Not at All – A Little Bit – Moderately – Highly
• To understand change (progress/growth) in a particular student’s English language proficiency over time
• To set long-term goals for a particular student's English language development
• To identify strategies and approaches that will help the student meet those long-term goals
• To evaluate whether a student should be referred for evaluation of eligibility for special education
Sample Items: Confidence
© 2021 THE REGENTS OF THE UNIVERSITY OF CALIFORNIA
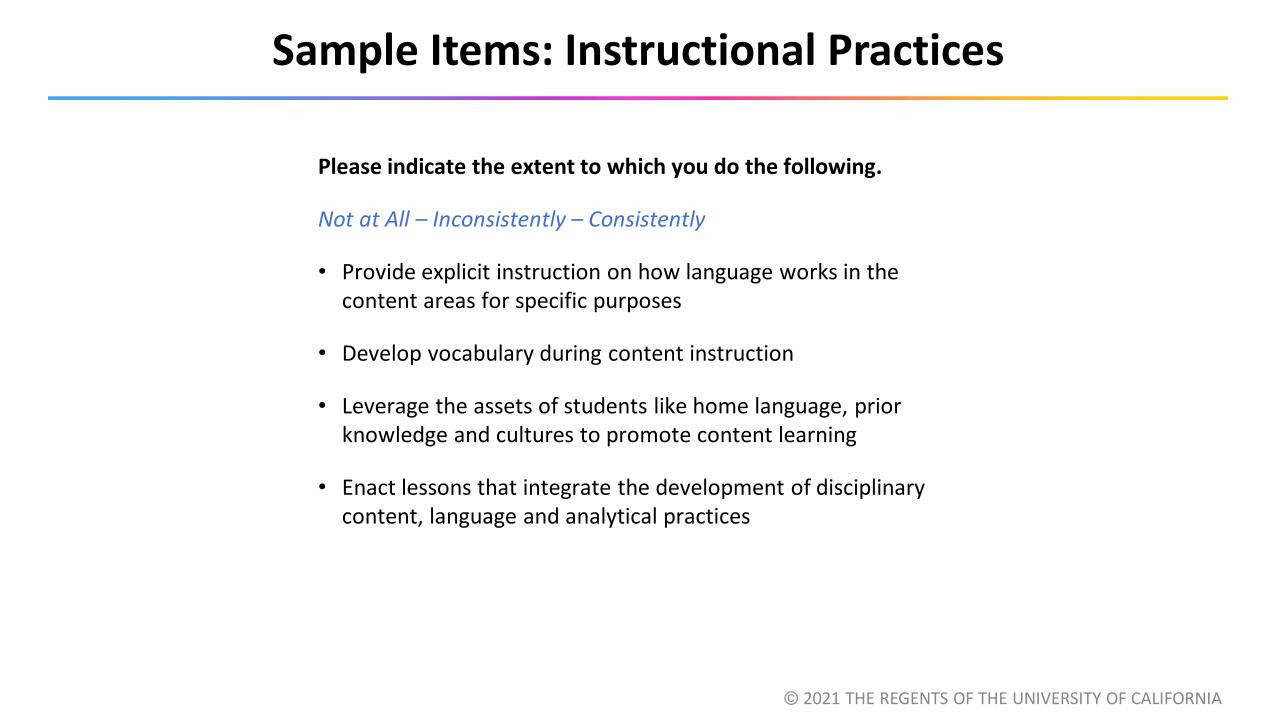
Please indicate the extent to which you do the following.
Not at All – Inconsistently – Consistently
• Provide explicit instruction on how language works in the content areas for specific purposes
• Develop vocabulary during content instruction
• Leverage the assets of students like home language, prior knowledge and cultures to promote content learning
• Enact lessons that integrate the development of disciplinary content, language and analytical practices
Sample Items: Instructional Practices
© 2021 THE REGENTS OF THE UNIVERSITY OF CALIFORNIA
Please rate your level of agreement with the following statements.
Strongly Disagree – Moderately Disagree – Slightly Disagree –Slightly Agree – Moderately Agree – Strongly Agree
• Our school is effective in serving newcomer (recently arrived) ELs.
• Our school is effective in serving students who (before enrolling here) had limited or interrupted formal education.
• Our school is effective in serving ELs who have an IEP or 504 plan.
• ELD teachers and bilingual aides in this school view themselves as responsible for helping ELs develop English proficiency.
• General education teachers in this school view themselves as responsible for helping ELs develop English proficiency.
Sample Items: Perceptions of Program Effectiveness
© 2021 THE REGENTS OF THE UNIVERSITY OF CALIFORNIA
Take the poll:
https://tinyurl.com/ncsa-el-poll
View the Responses:
https://tinyurl.com/ncsa-el-report
Poll
© 2021 THE REGENTS OF THE UNIVERSITY OF CALIFORNIA
© 2021 THE REGENTS OF THE UNIVERSITY OF CALIFORNIA
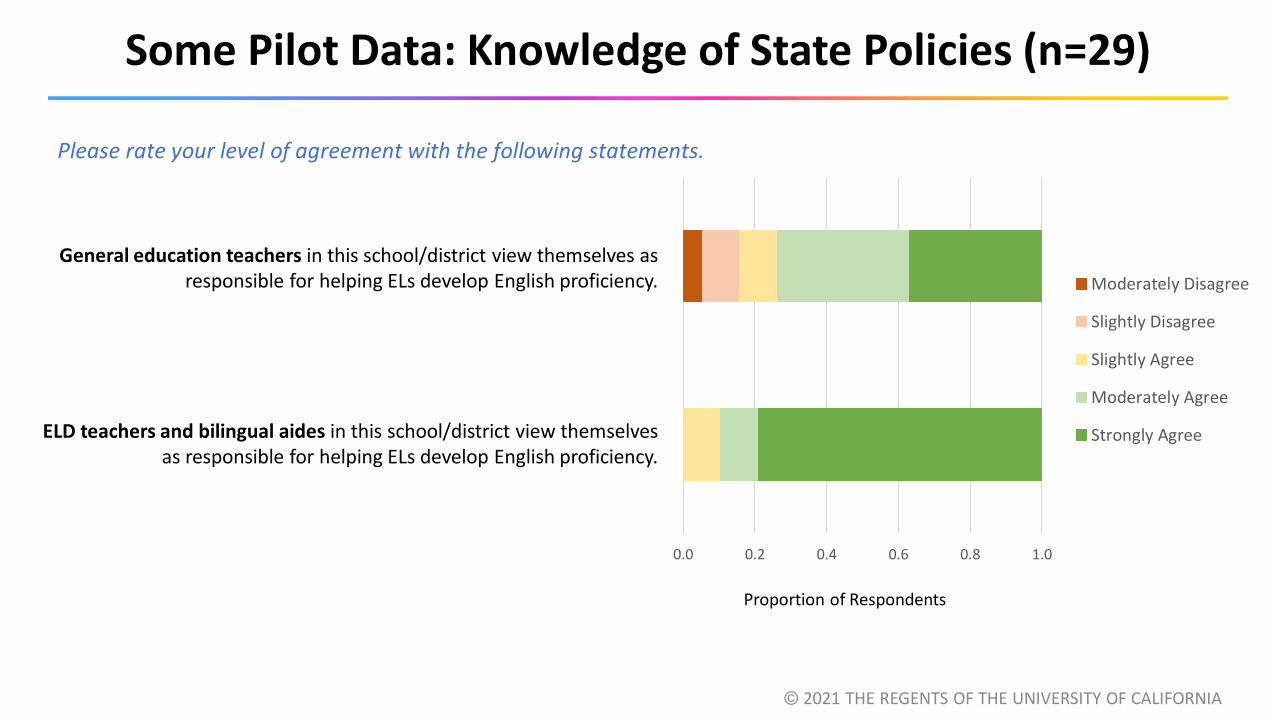
General education teachers in this school/district view themselves as responsible for helping ELs develop English proficiency.
ELD teachers and bilingual aides in this school/district view themselvesas responsible for helping ELs develop English proficiency.
Some Pilot Data: Knowledge of State Policies (n=29)
Proportion of Respondents
0.0 0.2 0.4 0.6 0.8 1.0
Moderately Disagree
Slightly Disagree
Slightly Agree
Moderately Agree
Strongly Agree
Please rate your level of agreement with the following statements.
© 2021 THE REGENTS OF THE UNIVERSITY OF CALIFORNIA
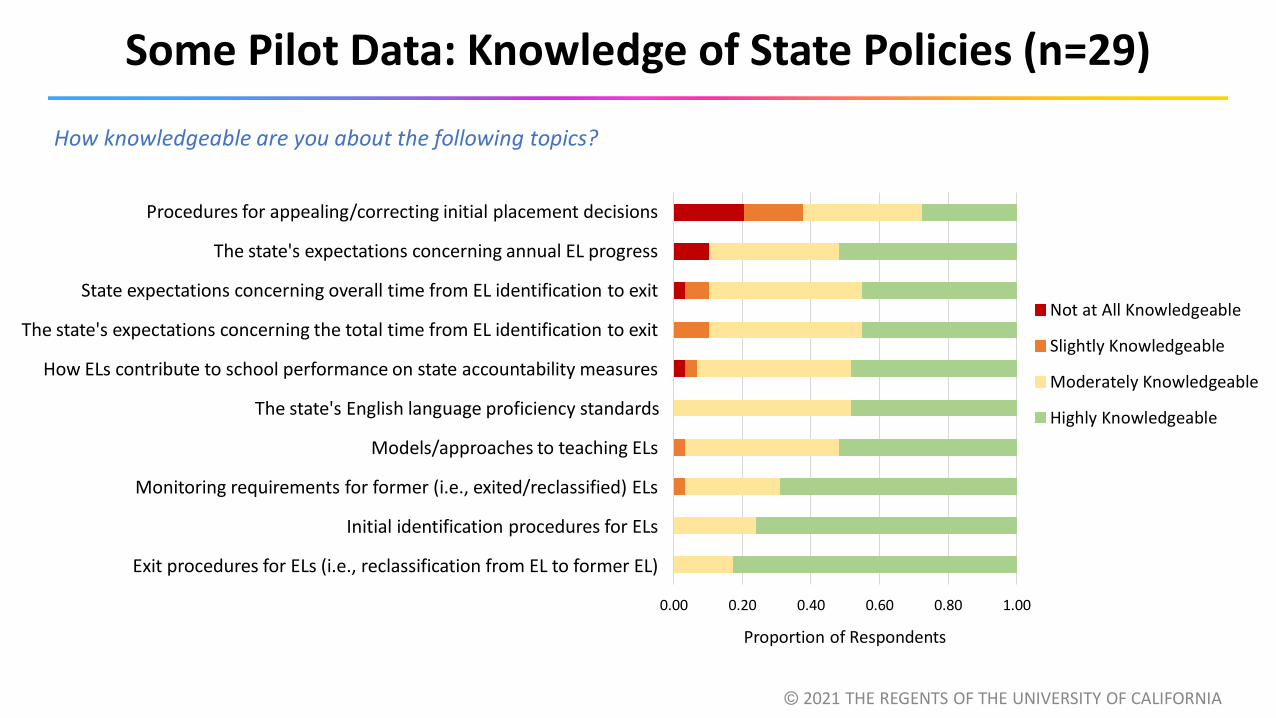
Procedures for appealing/correcting initial placement decisions
The state's expectations concerning annual EL progress
State expectations concerning overall time from EL identification to exit
The state's expectations concerning the total time from EL identification to exit
How ELs contribute to school performance on state accountability measures
The state's English language proficiency standards
Models/approaches to teaching ELs
Monitoring requirements for former (i.e., exited/reclassified) ELs
Initial identification procedures for ELs
Exit procedures for ELs (i.e., reclassification from EL to former EL)
Some Pilot Data: Knowledge of State Policies (n=29)
0.00 0.20 0.40 0.60 0.80 1.00
Not at All Knowledgeable
Slightly Knowledgeable
Moderately Knowledgeable
Highly Knowledgeable
Proportion of Respondents
How knowledgeable are you about the following topics?
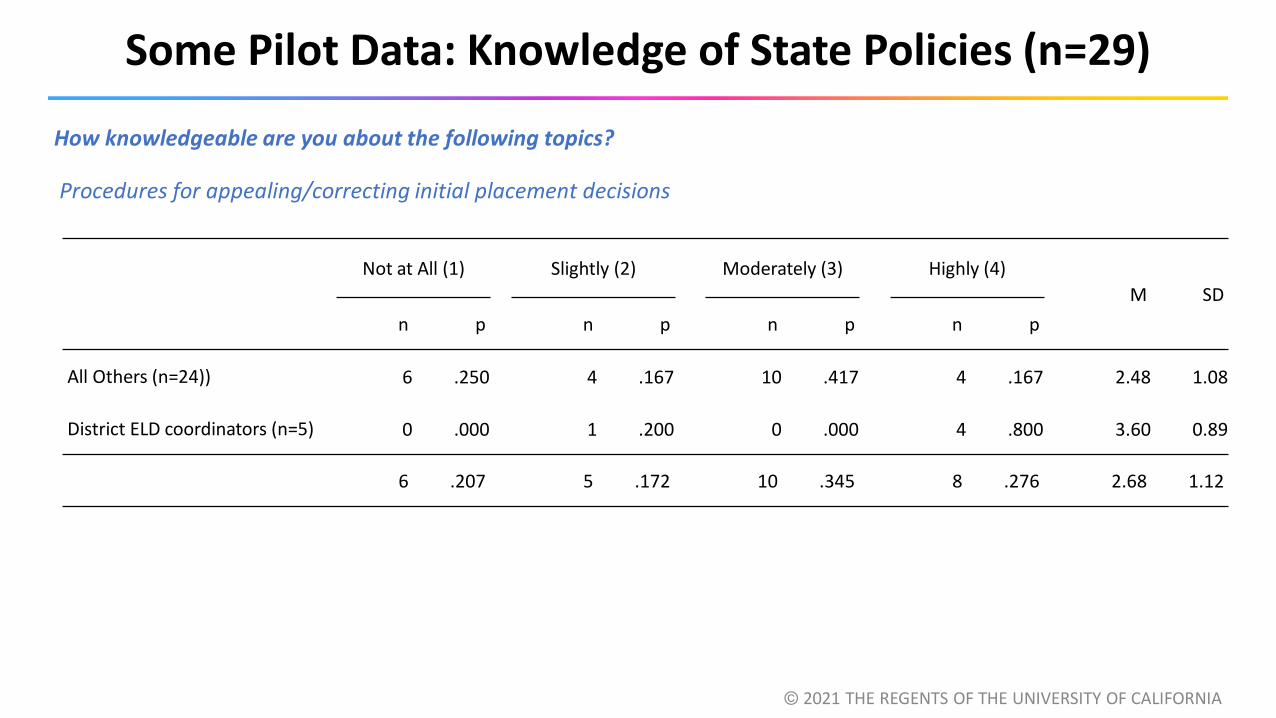
Some Pilot Data: Knowledge of State Policies (n=29)
© 2021 THE REGENTS OF THE UNIVERSITY OF CALIFORNIA
Not at All (1) Slightly (2) Moderately (3) Highly (4)
M SD
n p n p n p n p
All Others (n=24)) 6 .250 4 .167 10 .417 4 .167 2.48 1.08
District ELD coordinators (n=5) 0 .000 1 .200 0 .000 4 .800 3.60 0.89
6 .207 5 .172 10 .345 8 .276 2.68 1.12
How knowledgeable are you about the following topics?
Procedures for appealing/correcting initial placement decisions
• Who (in a state, district, school) might use this information?
• How could this information be used?
• When could this information be used?
Discussion
© 2021 THE REGENTS OF THE UNIVERSITY OF CALIFORNIA
• Fall 2021 – Pilot implementation survey instruments in seven states
• Spring 2022 – Scale up
• Summer 2022 – Link implementation survey data to EL progress/growth measures
Next Steps
© 2021 THE REGENTS OF THE UNIVERSITY OF CALIFORNIA
Thank You
Mark Hansen, UCLA/CRESSTMaría Santos, Independent Consultant
© 2021 THE REGENTS OF THE UNIVERSITY OF CALIFORNIA

COMPETITIVE GRANT FOR STATE ASSESSMENTS:
INITIAL FINDINGS ON ENGLISH LEARNER PROGRESS AND
IMPLICATIONS FOR PRACTICE
National Conference on Student Assessment
June 2021
Pete Goldschmidt, Ph.D.
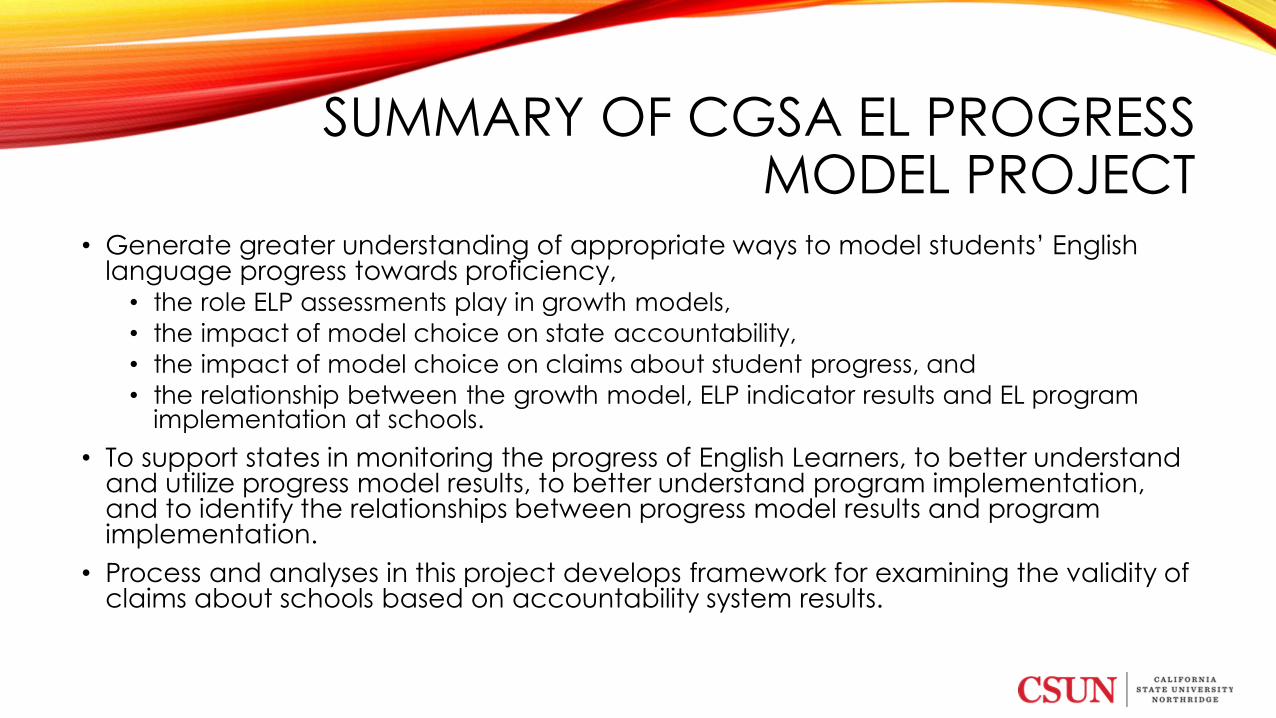
SUMMARY OF CGSA EL PROGRESS MODEL PROJECT
• Generate greater understanding of appropriate ways to model students’ English language progress towards proficiency,
• the role ELP assessments play in growth models,
• the impact of model choice on state accountability,
• the impact of model choice on claims about student progress, and
• the relationship between the growth model, ELP indicator results and EL program implementation at schools.
• To support states in monitoring the progress of English Learners, to better understand and utilize progress model results, to better understand program implementation, and to identify the relationships between progress model results and program implementation.
• Process and analyses in this project develops framework for examining the validity of claims about schools based on accountability system results.
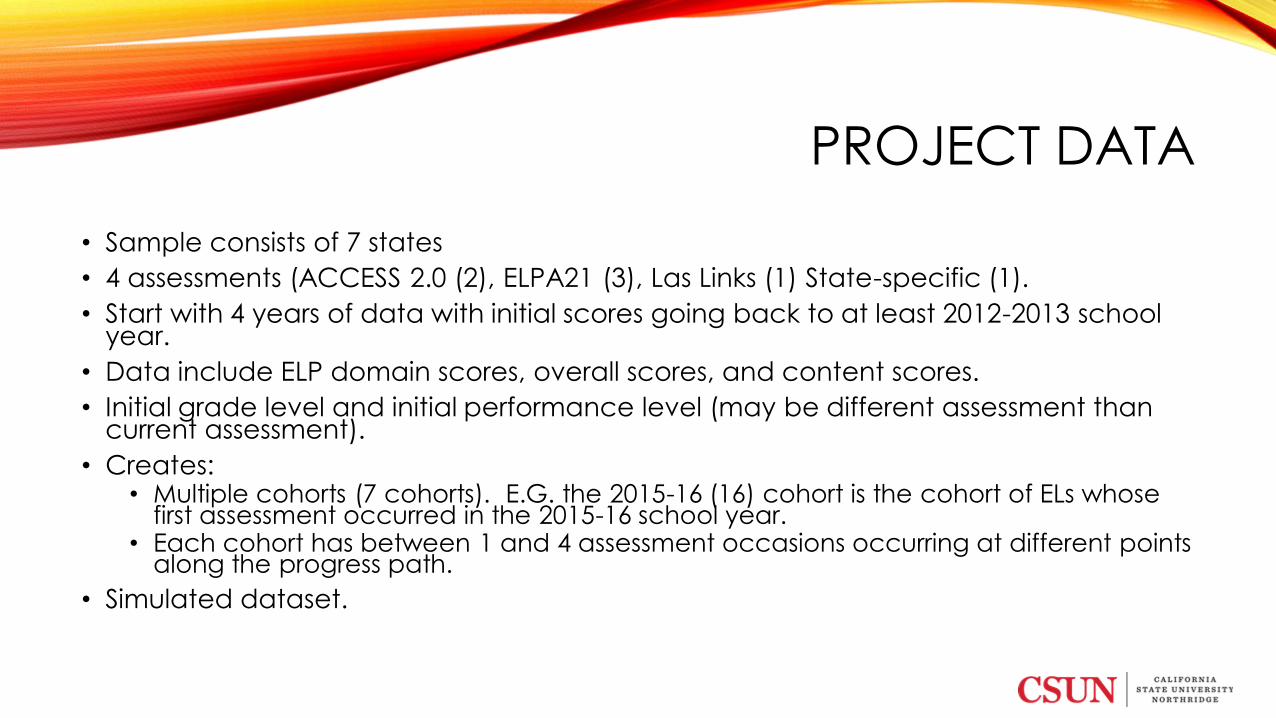
PROJECT DATA
• Sample consists of 7 states
• 4 assessments (ACCESS 2.0 (2), ELPA21 (3), Las Links (1) State-specific (1).
• Start with 4 years of data with initial scores going back to at least 2012-2013 school year.
• Data include ELP domain scores, overall scores, and content scores.
• Initial grade level and initial performance level (may be different assessment than current assessment).
• Creates:• Multiple cohorts (7 cohorts). E.G. the 2015-16 (16) cohort is the cohort of ELs whose
first assessment occurred in the 2015-16 school year.• Each cohort has between 1 and 4 assessment occasions occurring at different points
along the progress path.
• Simulated dataset.
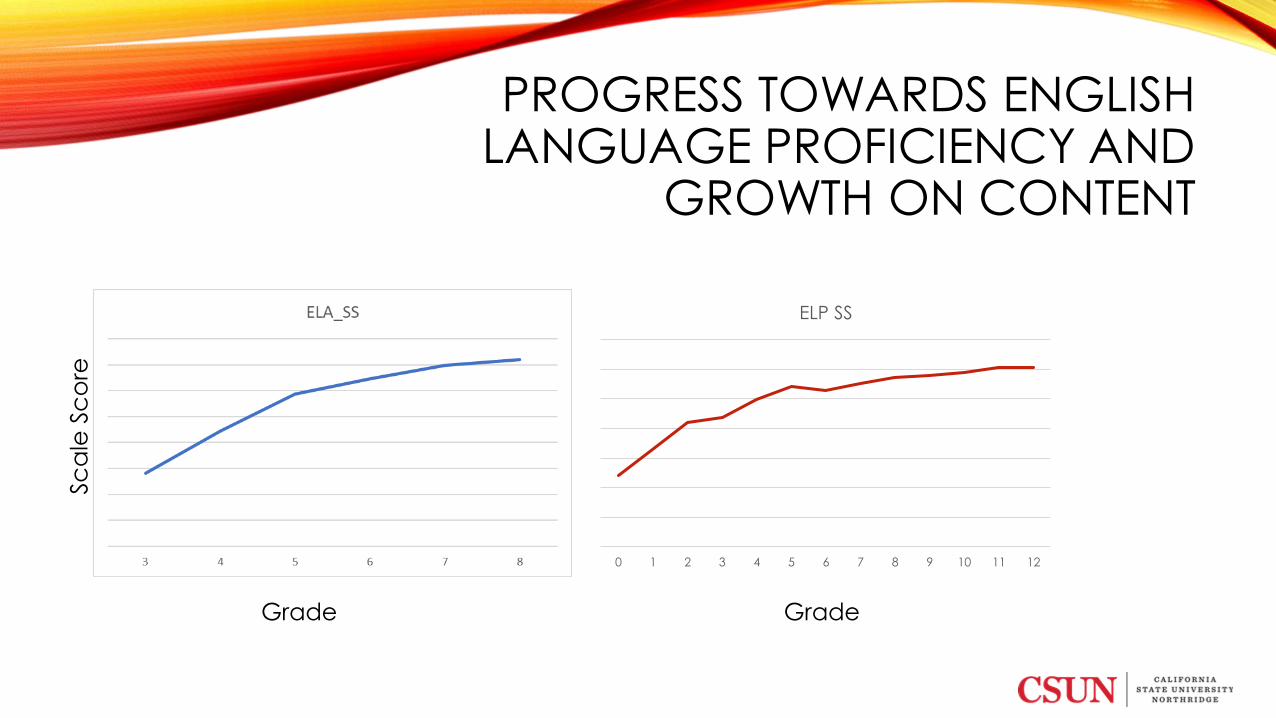
PROGRESS TOWARDS ENGLISH LANGUAGE PROFICIENCY AND
GROWTH ON CONTENT
0 1 2 3 4 5 6 7 8 9 10 11 12
ELP SS
Sc
ale
Sc
ore
Grade Grade
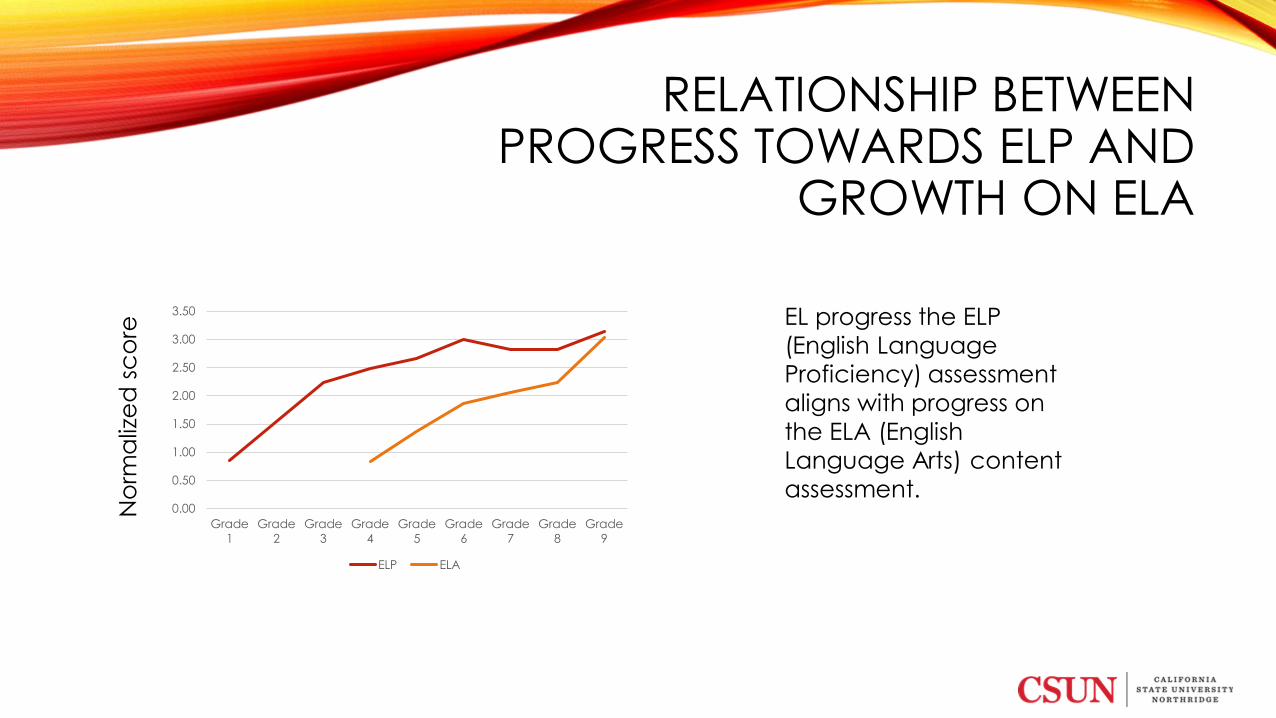
RELATIONSHIP BETWEEN PROGRESS TOWARDS ELP AND
GROWTH ON ELA
0.00
0.50
1.00
1.50
2.00
2.50
3.00
3.50
Grade
1
Grade
2
Grade
3
Grade
4
Grade
5
Grade
6
Grade
7
Grade
8
Grade
9
ELP ELA
No
rma
lize
d s
co
re
EL progress the ELP
(English Language
Proficiency) assessment
aligns with progress on
the ELA (English
Language Arts) content
assessment.
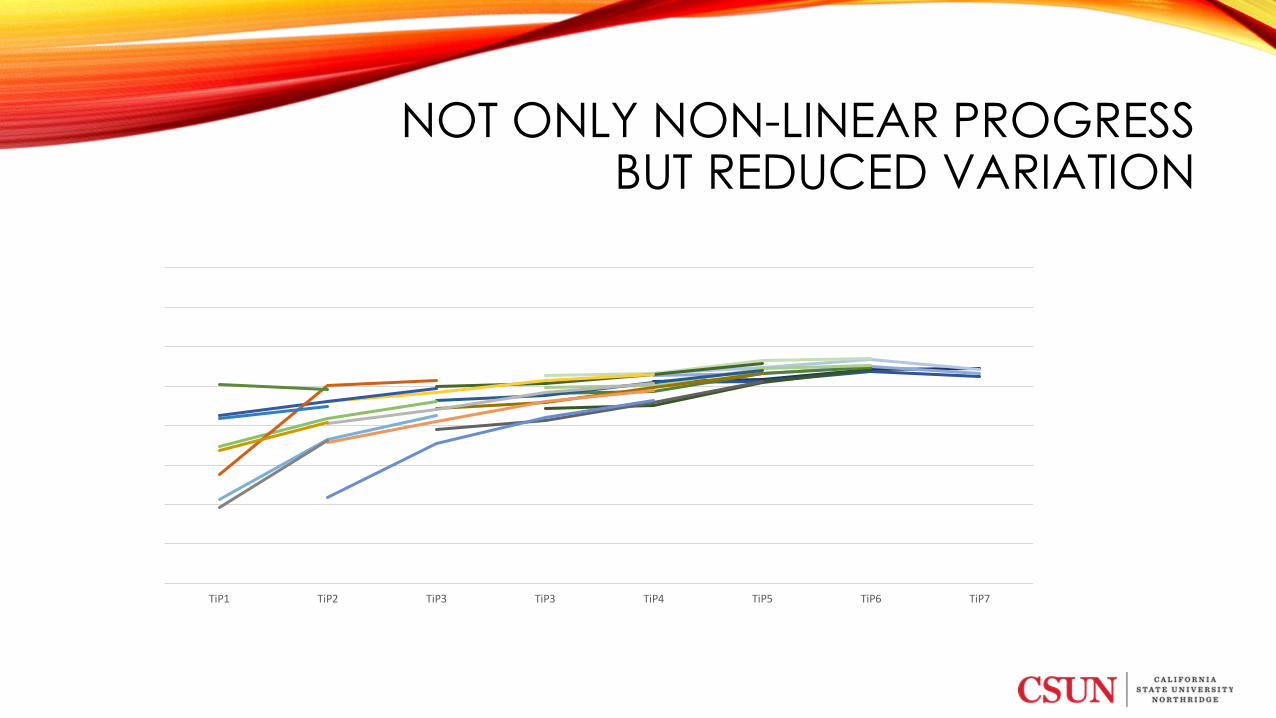
NOT ONLY NON-LINEAR PROGRESS BUT REDUCED VARIATION
TiP1 TiP2 TiP3 TiP3 TiP4 TiP5 TiP6 TiP7

RESULTING PROGRESS ESTIMATES BY STATES
0.0
0.2
0.4
0.6
0.8
1.0
1.2
1.4
1.6
1.8
E M L
State A State B State C State D State E State F State G
Sta
nd
ard
ize
d P
rog
ress
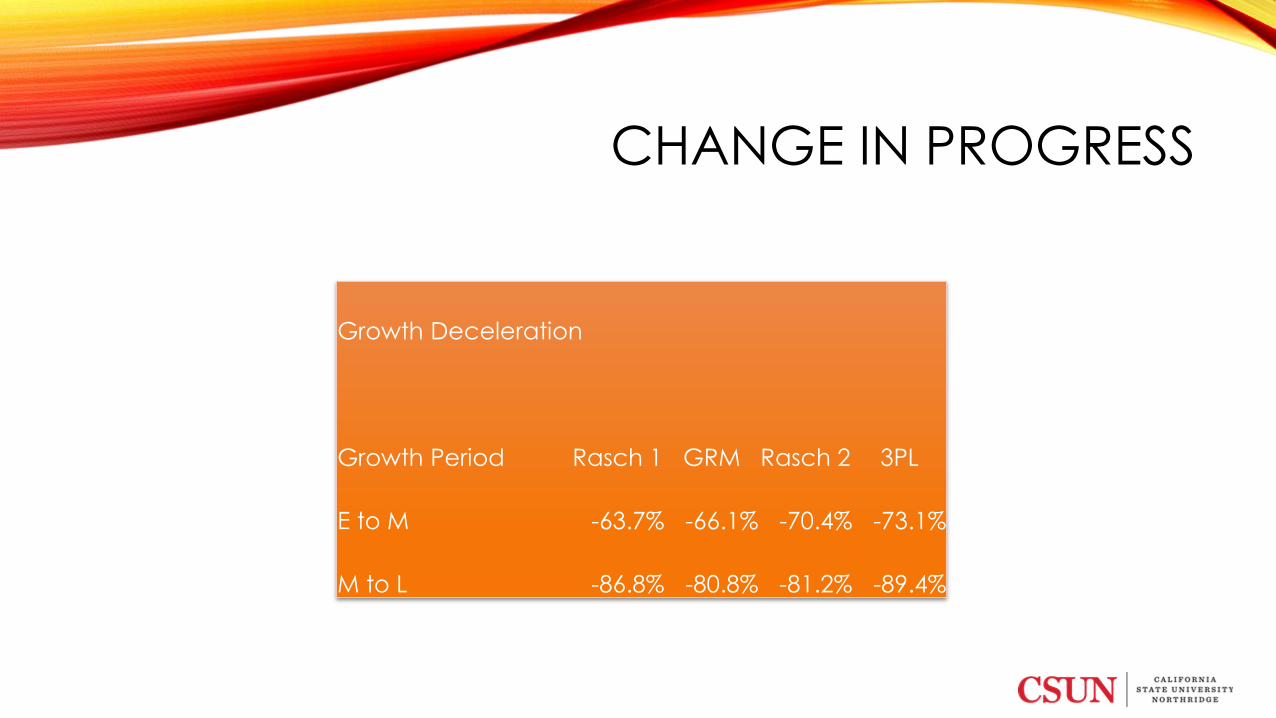
CHANGE IN PROGRESS
Growth Deceleration
Growth Period Rasch 1 GRM Rasch 2 3PL
E to M -63.7% -66.1% -70.4% -73.1%
M to L -86.8% -80.8% -81.2% -89.4%
CONSIDERATIONS IMPACTING MONITORING EL PROGRESS
• The rigor of the proficiency cut (based on standard setting).
• The rigor of the proficiency in terms of the EL – Non-EL ELA and math content performance gap at the ELPA proficiency cut.
• The impact of assessment rigor on percent reaching proficiency.
• The impact of assessment rigor on observed progress.
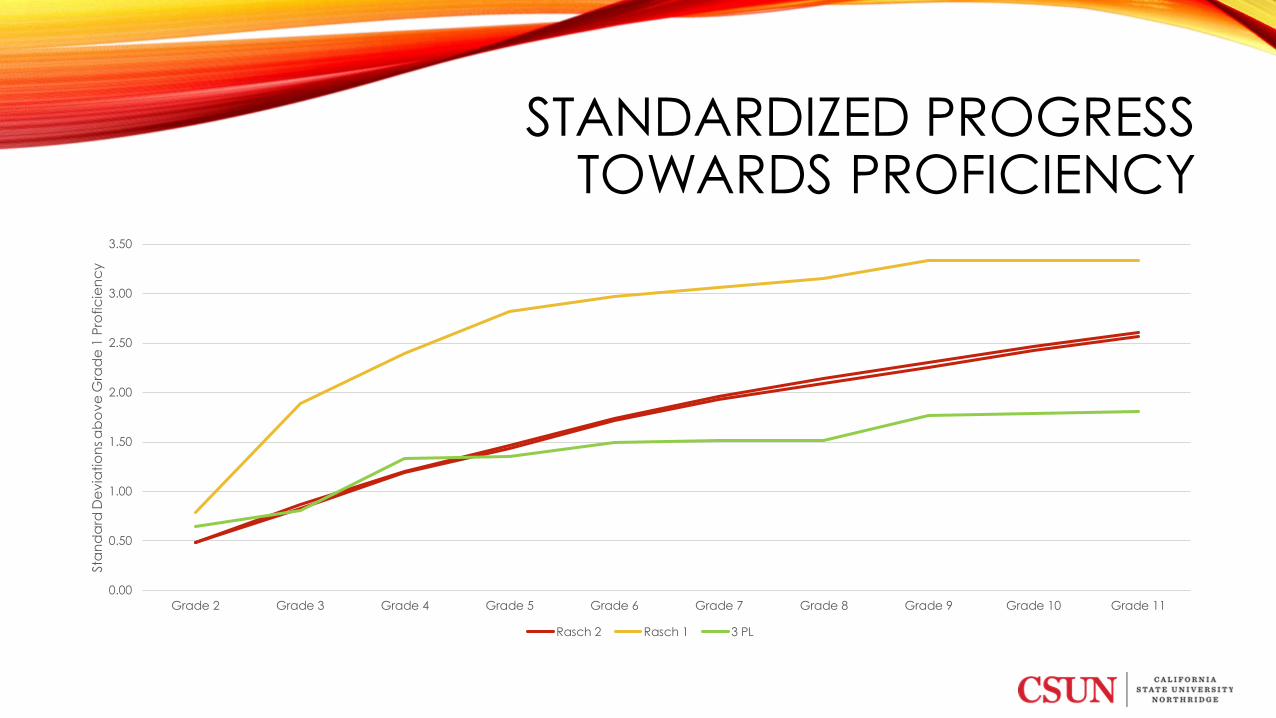
STANDARDIZED PROGRESS TOWARDS PROFICIENCY
0.00
0.50
1.00
1.50
2.00
2.50
3.00
3.50
Grade 2 Grade 3 Grade 4 Grade 5 Grade 6 Grade 7 Grade 8 Grade 9 Grade 10 Grade 11
Sta
nd
ard
De
via
tio
ns
ab
ov
e G
rad
e 1
Pro
fic
ien
cy
Rasch 2 Rasch 1 3 PL
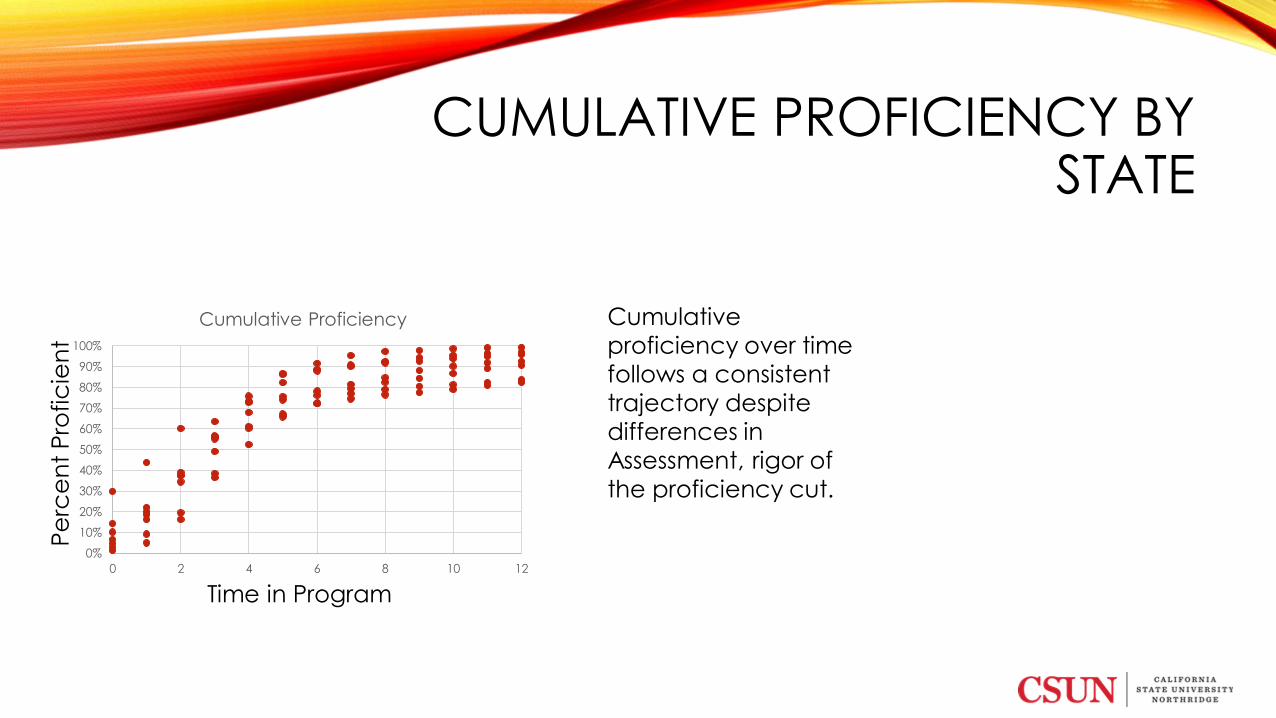
CUMULATIVE PROFICIENCY BY STATE
0%
10%
20%
30%
40%
50%
60%
70%
80%
90%
100%
0 2 4 6 8 10 12
Cumulative Proficiency Cumulative
proficiency over time
follows a consistent
trajectory despite
differences in
Assessment, rigor of
the proficiency cut.
Time in Program
Pe
rce
nt
Pro
fic
ien
t

EFFECT OF TIMING ON CONTENT PERFORMANCE GAP
-1.00
-0.80
-0.60
-0.40
-0.20
0.00
0.20
0.40
0.60
0.80
1.00
-1.00 -0.80 -0.60 -0.40 -0.20 0.00 0.20 0.40 0.60 0.80 1.00
EL
Pe
rfo
rma
nc
e G
ap
at
Cu
t, G
rad
e 6
EL Performance Gap at Cut, Grade 3
The effectiveness of the
proficiency cut varies
by state and by grade.
The EL- Non-EL
performance is always
larger in 6th grade than
3rd grade.
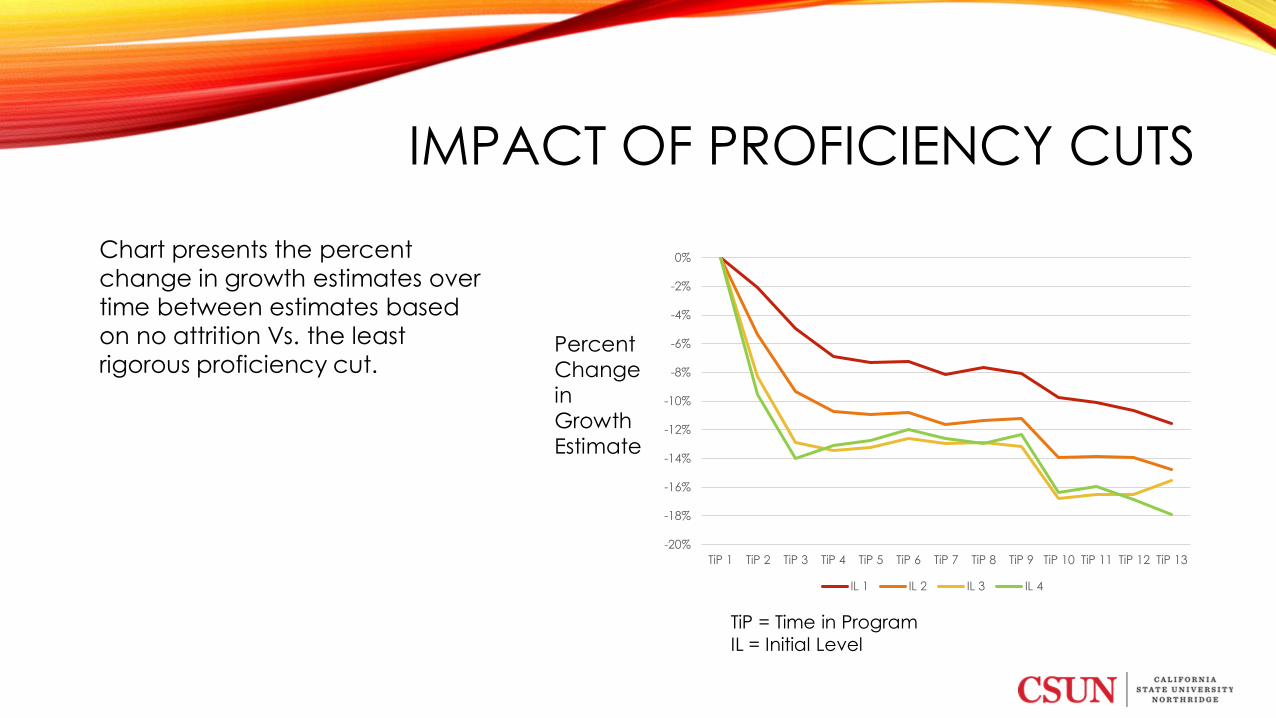
IMPACT OF PROFICIENCY CUTS
PercentChange in Growth Estimate
Chart presents the percent
change in growth estimates over
time between estimates based
on no attrition Vs. the least
rigorous proficiency cut.
-20%
-18%
-16%
-14%
-12%
-10%
-8%
-6%
-4%
-2%
0%
TiP 1 TiP 2 TiP 3 TiP 4 TiP 5 TiP 6 TiP 7 TiP 8 TiP 9 TiP 10 TiP 11 TiP 12 TiP 13
IL 1 IL 2 IL 3 IL 4
TiP = Time in Program
IL = Initial Level
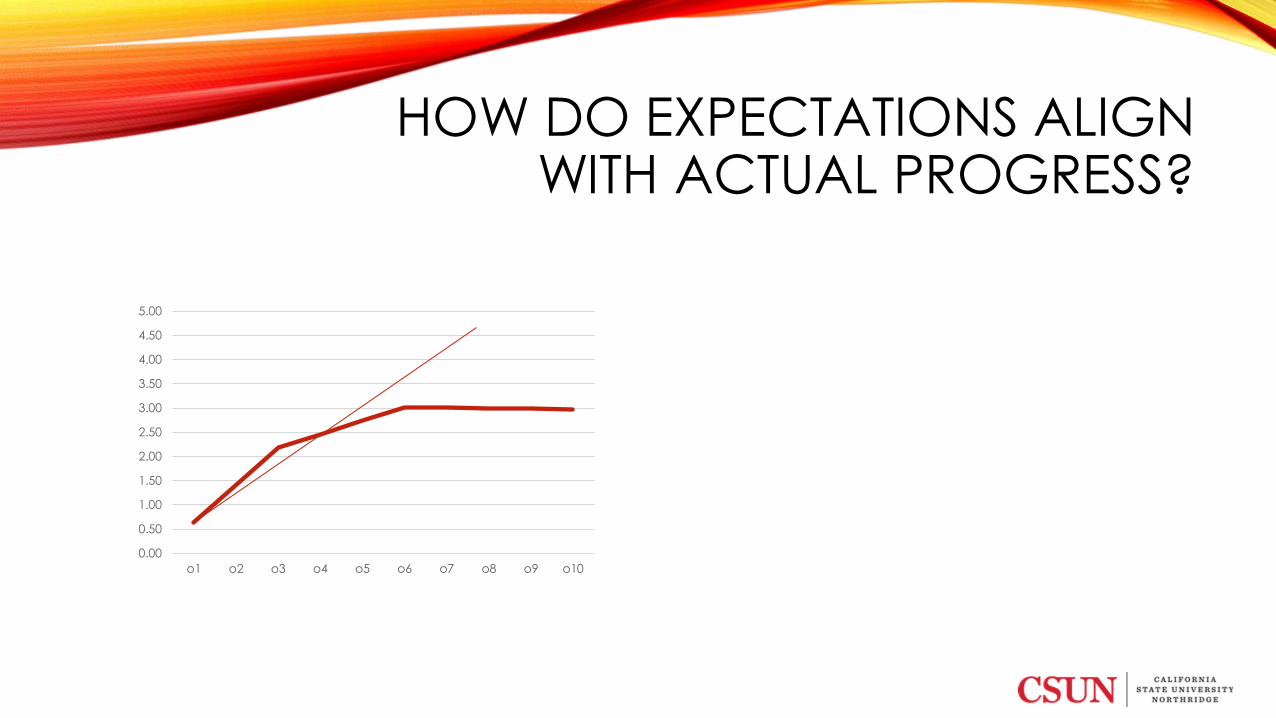
HOW DO EXPECTATIONS ALIGN WITH ACTUAL PROGRESS?
0.00
0.50
1.00
1.50
2.00
2.50
3.00
3.50
4.00
4.50
5.00
o1 o2 o3 o4 o5 o6 o7 o8 o9 o10
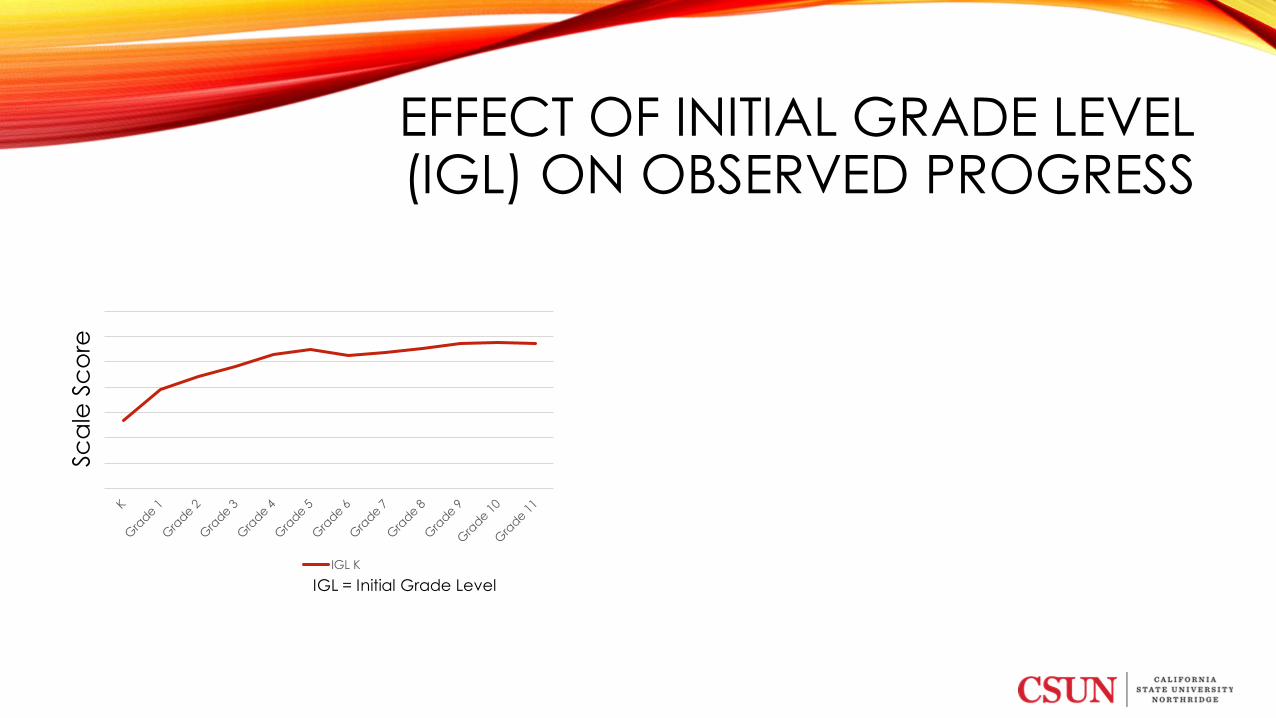
EFFECT OF INITIAL GRADE LEVEL (IGL) ON OBSERVED PROGRESS
IGL K
Sc
ale
Sc
ore
IGL = Initial Grade Level
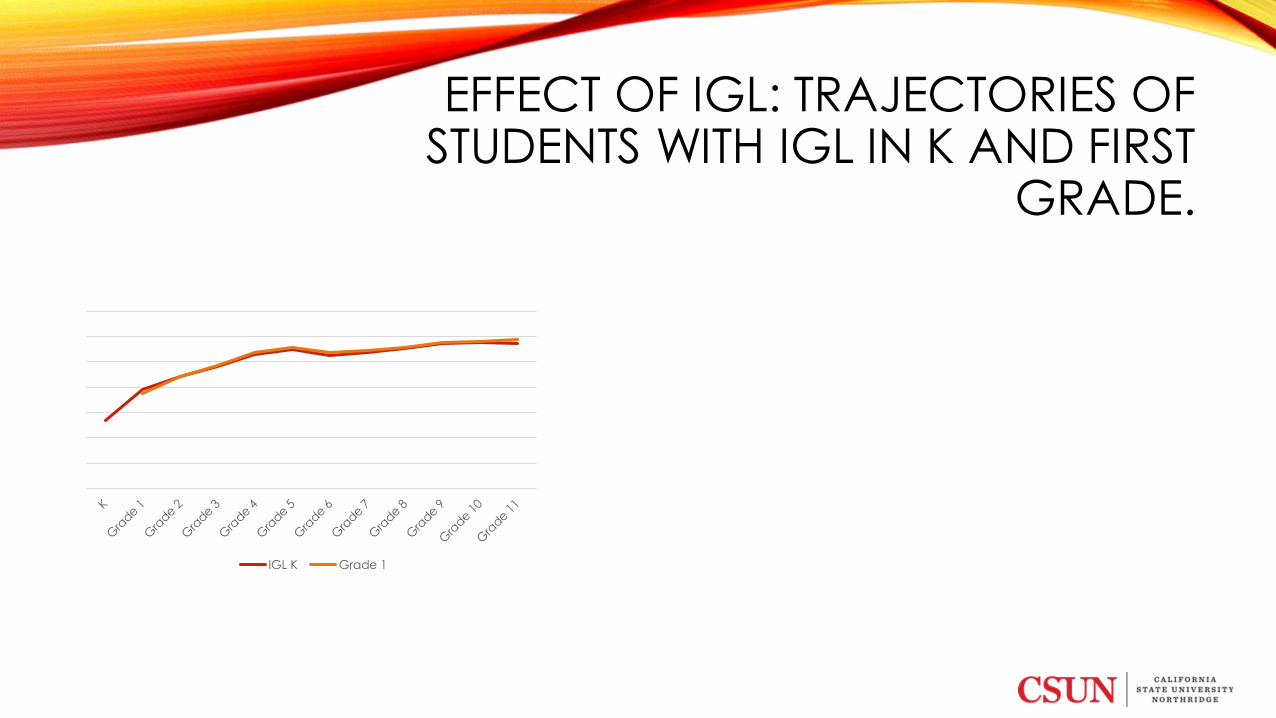
EFFECT OF IGL: TRAJECTORIES OF STUDENTS WITH IGL IN K AND FIRST
GRADE.
IGL K Grade 1
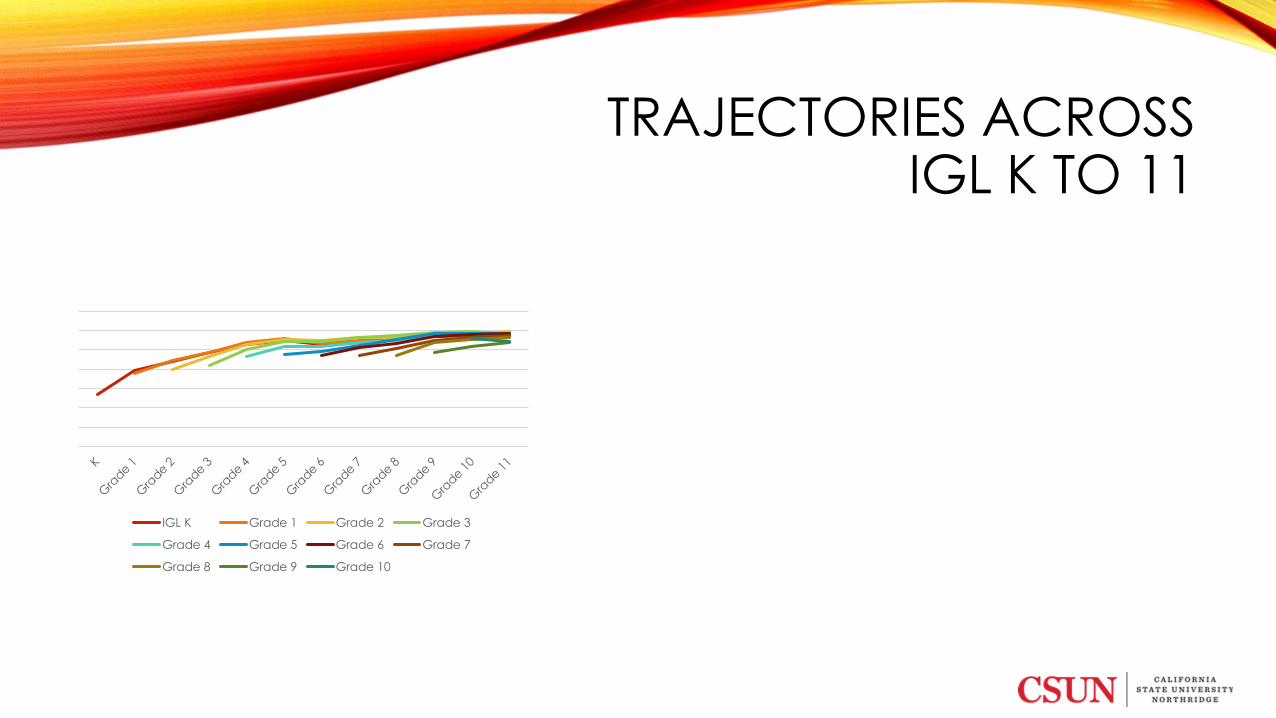
TRAJECTORIES ACROSS IGL K TO 11
IGL K Grade 1 Grade 2 Grade 3
Grade 4 Grade 5 Grade 6 Grade 7
Grade 8 Grade 9 Grade 10

EFFECT OF GRADE: TWO ADDITIONAL STATES
K Grade
1
Grade
2
Grade
3
Grade
4
Grade
5
Grade
6
Grade
7
Grade
8
Grade
9
Grade
10
Grade
11
IGL K Grade 1 Grade 2 Grade 3
Grade 4 Grade 5 Grade 6 Grade 7
Grade 8 Grade 9 Grade 10
K Grade
1
Grade
2
Grade
3
Grade
4
Grade
5
Grade
6
Grade
7
Grade
8
Grade
9
Grade
10
Grade
11
IGL K Grade 1 Grade 2 Grade 3 Grade 4 Grade 5
Grade 6 Grade 7 Grade 8 Grade 9 Grade 10
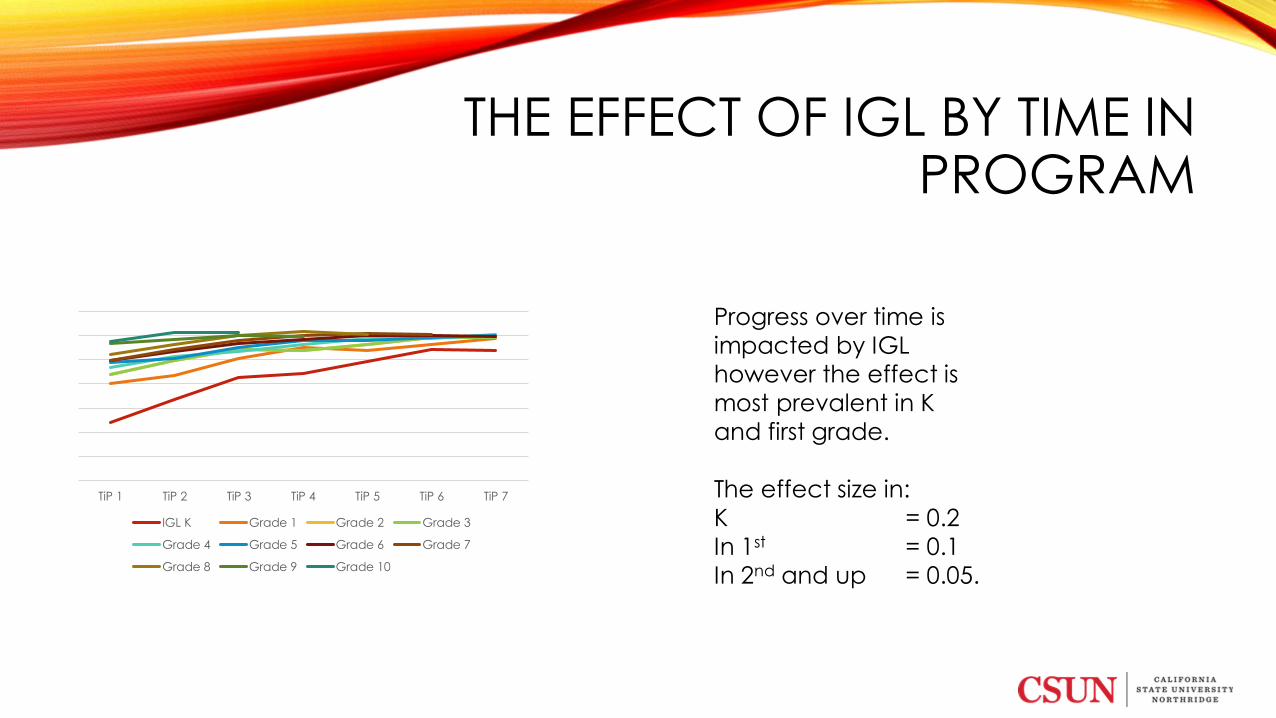
THE EFFECT OF IGL BY TIME IN PROGRAM
TiP 1 TiP 2 TiP 3 TiP 4 TiP 5 TiP 6 TiP 7
IGL K Grade 1 Grade 2 Grade 3
Grade 4 Grade 5 Grade 6 Grade 7
Grade 8 Grade 9 Grade 10
Progress over time is
impacted by IGL
however the effect is
most prevalent in K
and first grade.
The effect size in:
K = 0.2
In 1st = 0.1
In 2nd and up = 0.05.
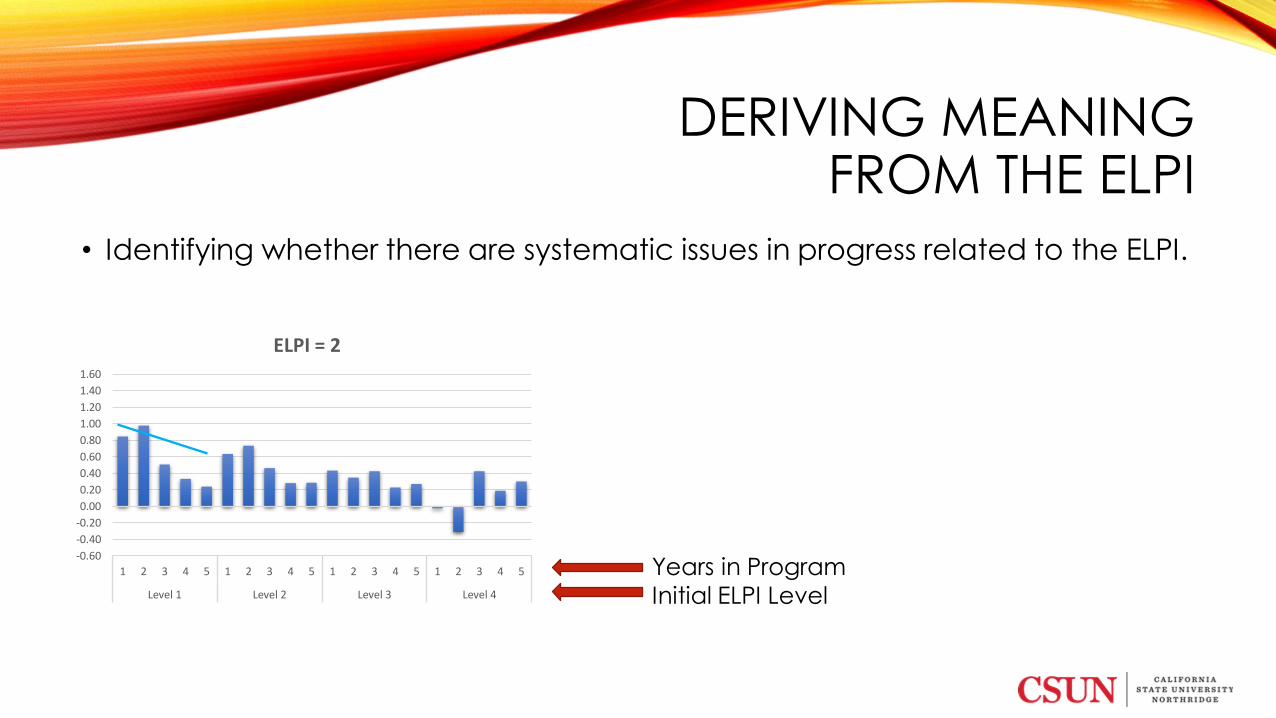
DERIVING MEANING FROM THE ELPI
• Identifying whether there are systematic issues in progress related to the ELPI.
-0.60
-0.40
-0.20
0.00
0.20
0.40
0.60
0.80
1.00
1.20
1.40
1.60
1 2 3 4 5 1 2 3 4 5 1 2 3 4 5 1 2 3 4 5
Level 1 Level 2 Level 3 Level 4
ELPI = 2
Years in Program
Initial ELPI Level
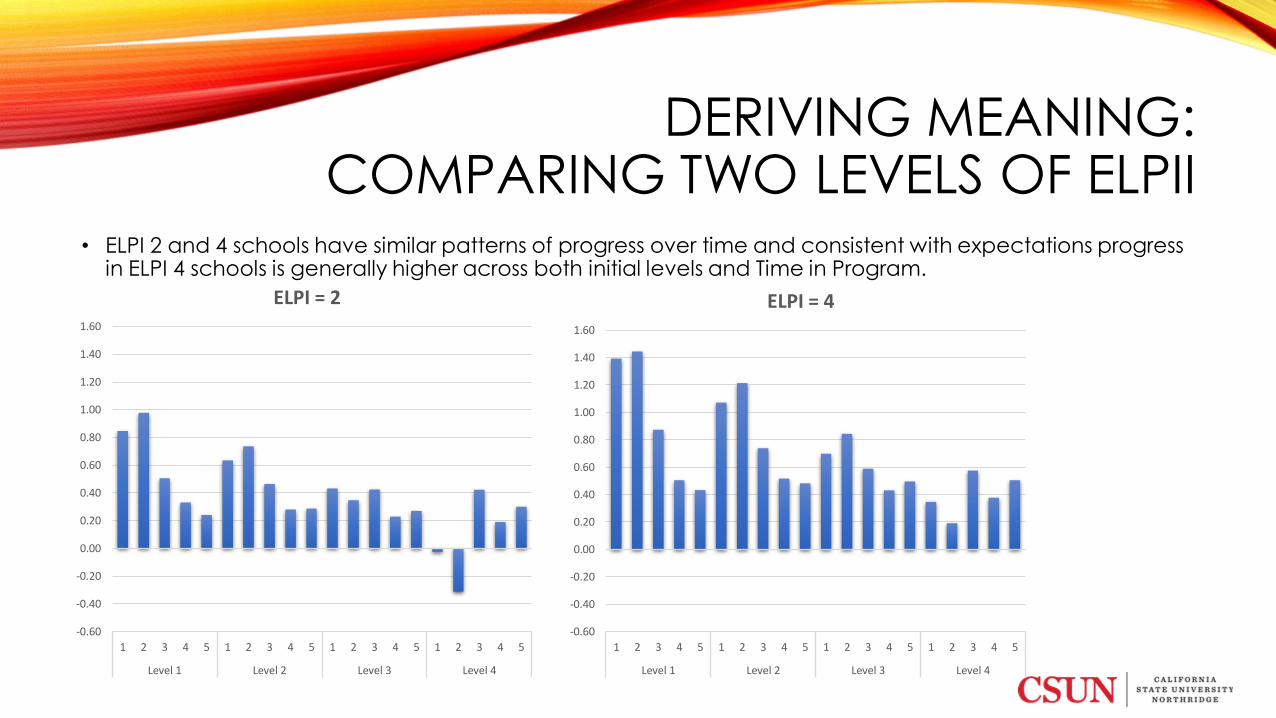
DERIVING MEANING: COMPARING TWO LEVELS OF ELPII
• ELPI 2 and 4 schools have similar patterns of progress over time and consistent with expectations progress in ELPI 4 schools is generally higher across both initial levels and Time in Program.
-0.60
-0.40
-0.20
0.00
0.20
0.40
0.60
0.80
1.00
1.20
1.40
1.60
1 2 3 4 5 1 2 3 4 5 1 2 3 4 5 1 2 3 4 5
Level 1 Level 2 Level 3 Level 4
ELPI = 2
-0.60
-0.40
-0.20
0.00
0.20
0.40
0.60
0.80
1.00
1.20
1.40
1.60
1 2 3 4 5 1 2 3 4 5 1 2 3 4 5 1 2 3 4 5
Level 1 Level 2 Level 3 Level 4
ELPI = 4

DERIVING MEANING: ARE LOW PERFORMING SCHOOLS SIMPLY
LOWER?• ELPI 1 school is not simply lower progress, but also idiosyncratic patterns of progress.
-0.60
-0.40
-0.20
0.00
0.20
0.40
0.60
0.80
1.00
1.20
1.40
1.60
1 2 3 4 5 1 2 3 4 5 1 2 3 4 5 1 2 3 4 5
Level 1 Level 2 Level 3 Level 4
ELPI = 4
-0.60
-0.40
-0.20
0.00
0.20
0.40
0.60
0.80
1.00
1.20
1.40
1.60
1 2 3 4 5 1 2 3 4 5 1 2 3 4 5 1 2 3 4 5
Level 1 Level 2 Level 3 Level 4
ELPI = 1
Discussion and Q&A
Kenji Hakuta, Professor Emeritus, Stanford University
Sharon Prestridge, Mississippi Dept. of Education
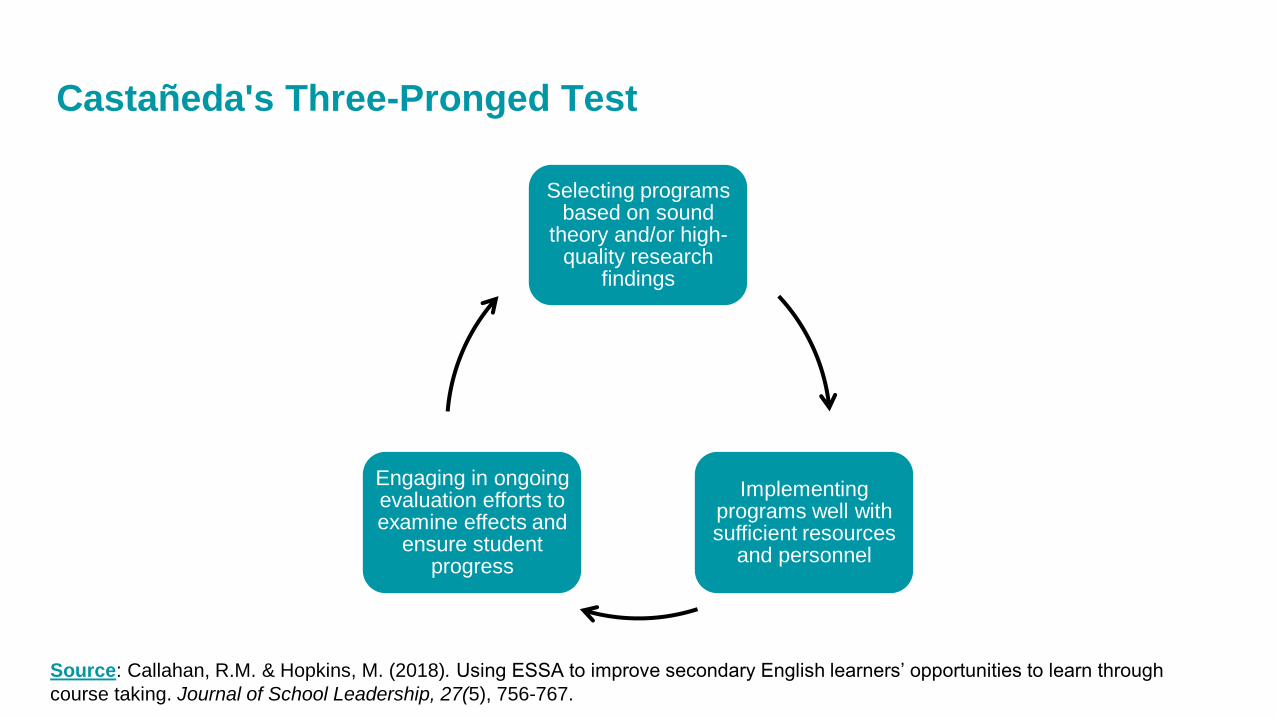
Castañeda's Three-Pronged Test
Source: Callahan, R.M. & Hopkins, M. (2018). Using ESSA to improve secondary English learners’ opportunities to learn through
course taking. Journal of School Leadership, 27(5), 756-767.
Selecting programs based on sound
theory and/or high-quality research
findings
Implementing programs well with sufficient resources
and personnel
Engaging in ongoing evaluation efforts to examine effects and
ensure student progress

Principles and Strategies for State Leaders
Selecting programs based on sound
theory and/or high-quality research
findings
Implementing programs well with sufficient resources
and personnel
Engaging in ongoing evaluation efforts to examine effects and ensure student progress
Principle 1: Elevate support for EL students
and families as an urgent priority and
establish an asset-based foundation for
continuous improvement efforts.
Principle 2: Partner with stakeholders to
ensure continuous improvement efforts are
targeted to address EL students, families,
and community needs.
Principle 3: Develop tools and processes
that facilitate the use of data to inform
continuous improvement of EL programs and
services.