session #5 e.2.1.2 decide/choose which measure of central tendency would be most appropriate for a...
TRANSCRIPT

Lesson 28 Which Measure is Best?
Session #5E.2.1.2 Decide/Choose which measure of central tendency
would be most appropriate for a given situation.

Three measures of central tendency you should know are:
Mean- average. Add up all of the numbers and divide by the how many numbers appear
Median- the middle of an ordered set of numbers
Mode- the number that appears most often Range- largest number minus the smallest
number. This explains the amount of increase of a set of numbers.
Measures of Central Tendency

Doug brought seven packages at the post office. These are the weights, in pounds, of the packages: 2, 17, 4, 2, 3, 5, 2
Which measure best describes the weight of a typical package?
Mean= 2 + 17 + 4 + 2 + 3 + 5 + 2 = 35 =5
7 7The mean is greater than five of the seven weights, so it is not the best measure.
Example 1:

Median: Arrange the data in numerical order: 2,2,2,3,4,5,17
The median is the middle number, 3.The median is close to many of
the numbers in the set. Mode: The number that appears most often
is 2. This is the least of the numbers in the set. It is close to many of the numbers in the set, but not as close as the
median.
Example 1 (cont):
Range- Subtract the least number from the greatest number: 17 – 2 = 15
This number is not closest to most of the numbers. This is not the best measure.
Solution: The median is the best measure to describe the weight of a typical package that Doug brought to the post office.
Example 1(cont.)

These are the prices, in cents, of 9 newspapers at a newstand:◦ 25, 50,50, 100, 75, 50, 50, 45, 50◦ Which measure best describes the typical price of
a newspaper at this newsstand?
Find the mean, median, mode, and range.
Example 2:

Mean= 25+50+50+100+75+50+50+45+50 = 495 = 559 9
The mean is close to many of the numbers of the data set.
Median= 25,45,50,50,50,50,50,75,100 = 50 The median is close to many of the numbers
of the data set. Mode= The mode is 50, which is close to
many of the numbers of the data set. Range= 100 – 25 = 75 This is not close to
many of the numbers of the data set.
Example 2(cont.)

The mean, median, and mode all give a good description of the typical price of a newspaper at this stand.
Therefore, the answer is the mean, median, or mode.
Example 2 (cont.)

These data are local bus fares (in cents) in a town over the past 20 years.10,15,15,20,35,50,75,75,80,85, 90
Which measure is best for showing the overall increase in bus fare? Let’s Check It Out!!!
To find the amount of increase, subtract the _________________________ fare from the _________________________ fare.
Check It Out with the COACH!

When you do this kind of subtraction, you are finding the ___________________________ of the data.
The measure that is best for showing the overall increase in bus fare is the ______________________________________.
Check It Out with the COACH!!

For Questions 1-4, name the measure that best describes the data.
1. 57, 32, 23, 38, 37, 36, 57 A. The mode only B. The mode and the median C. The mean and the mode D. The median only
(Hint: Look for numbers that are closest to the data set.)
Sample Test Questions:

D. The median only
All of the other answers included the mode. The mode of the set of numbers is 57. This number is not a good description of the entire data set.
Answer 1.
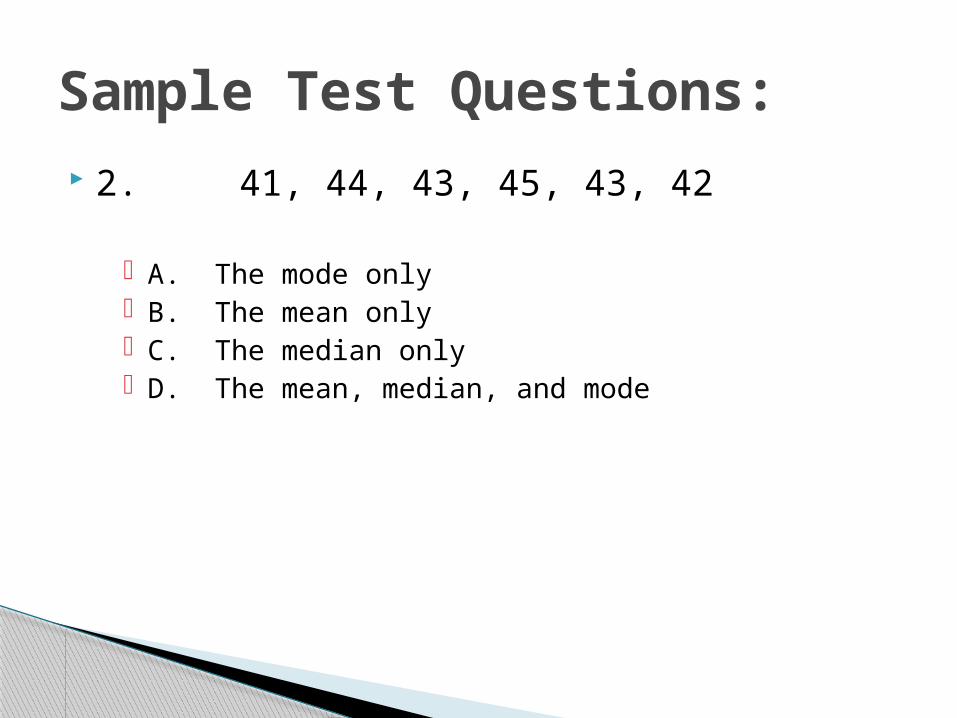
2. 41, 44, 43, 45, 43, 42
A. The mode only B. The mean only C. The median only D. The mean, median, and mode
Sample Test Questions:
D. The mean, median, and mode
All three measures closely relate to the data set.
Answer 2:

3. 10, 3, 48, 5, 8, 15, 3, 7, 9
A. The mode only B. The median only C. The mean only D. The mode and mean
Sample Test Questions:
B. The median only
The median is the measure that is closest to the data set.
Answer 3:

4. 16, 1, 4, 2, 5, 16, 28, 42, 3
A. The median and range B. The mode and median C. The mode and mean D. The range and mean
Sample Test Questions:

C. The mean and mode
The mean and the mode are the closest measures to the data set.
Answer 4:
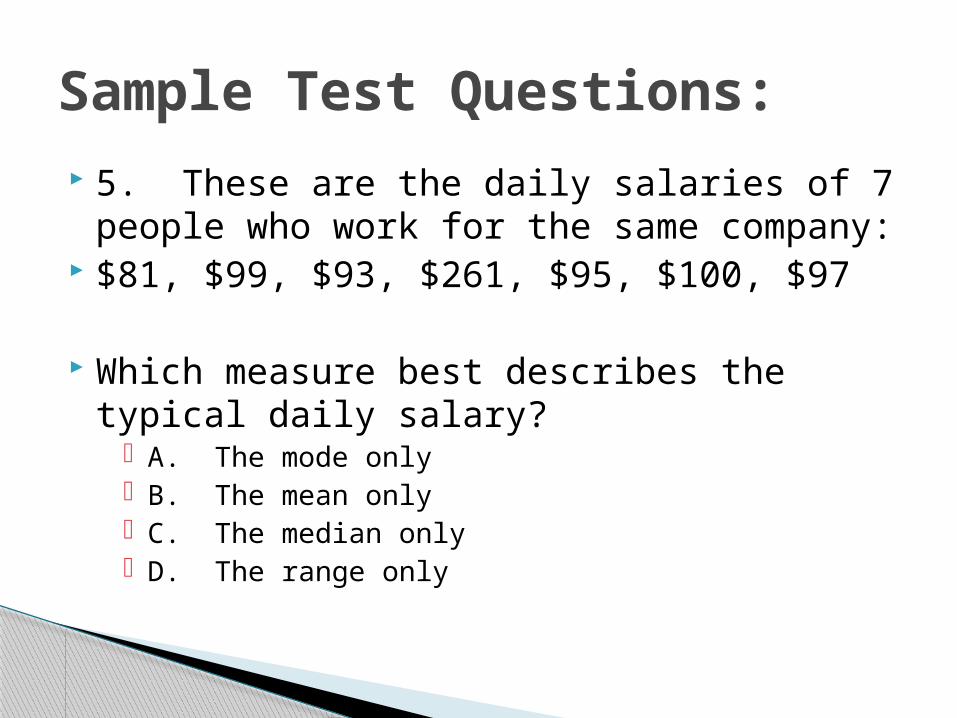
5. These are the daily salaries of 7 people who work for the same company:
$81, $99, $93, $261, $95, $100, $97
Which measure best describes the typical daily salary?
A. The mode only B. The mean only C. The median only D. The range only
Sample Test Questions:

C. The median only
The median is the only closest to the numbers in the data set.
Answer 5:
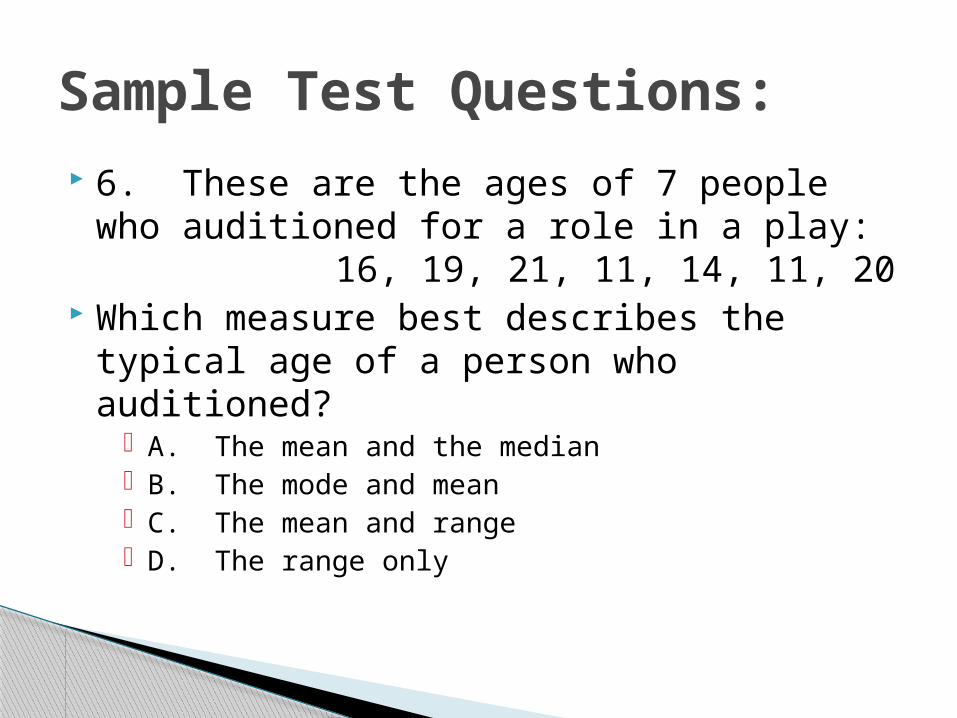
6. These are the ages of 7 people who auditioned for a role in a play:
16, 19, 21, 11, 14, 11, 20 Which measure best describes the typical
age of a person who auditioned? A. The mean and the median B. The mode and mean C. The mean and range D. The range only
Sample Test Questions:
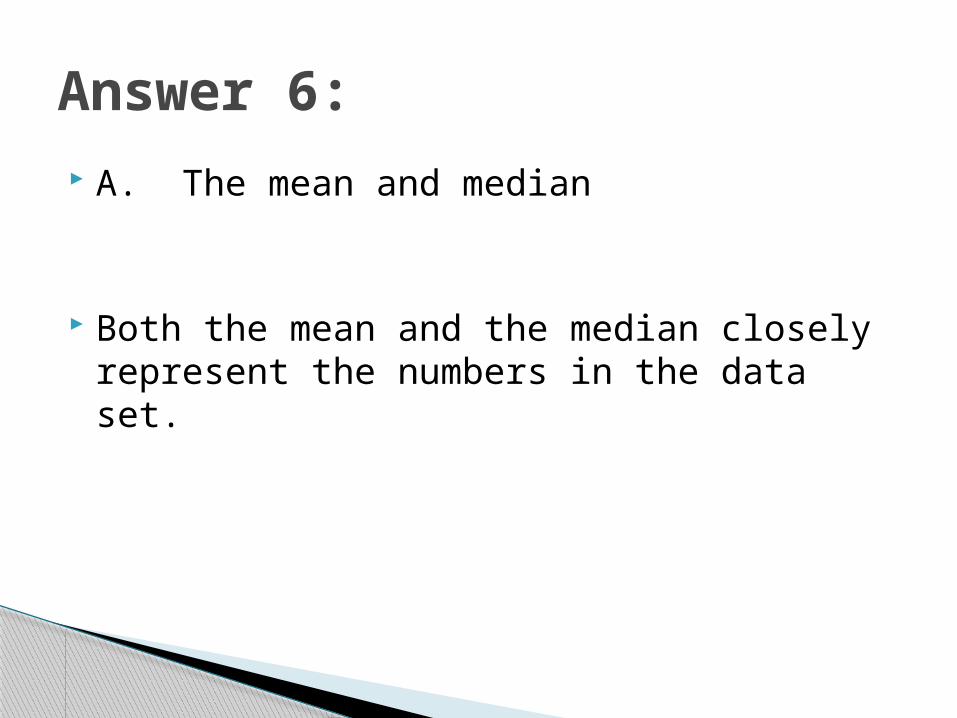
A. The mean and median
Both the mean and the median closely represent the numbers in the data set.
Answer 6:
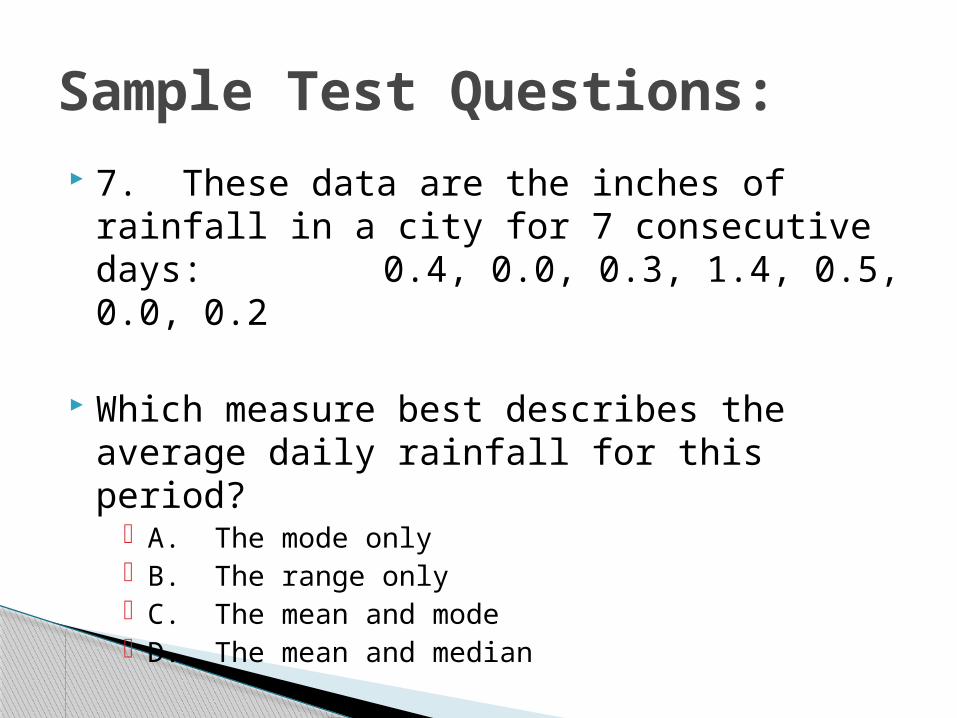
7. These data are the inches of rainfall in a city for 7 consecutive days:
0.4, 0.0, 0.3, 1.4, 0.5, 0.0, 0.2
Which measure best describes the average daily rainfall for this period?
A. The mode only B. The range only C. The mean and mode D. The mean and median
Sample Test Questions:

D. The mean and median
Both the mean and the median closely represent the data set.
Answer 7:

8. These are the numbers of books sold each hour at a booth at a book fair:
12, 15, 60, 12, 11, 10
Which measure best describes the number of books sold each hour?
A. The median only B. The mode only C. The median and mode D. The range and mean
Sample Test Questions:

8. C
The median and mode closely represent the data set.
Answer 8:

9. These data show how the price of a certain model of SUV has increased.
$29,900 $32,600 $33,100 $33,200 $33,300
Which measure best describes the overall increase in the price of the SUV?
A. The range B. The mean C. The median D. The mode
Sample Test Questions:

9. A: The Range
Since you are looking for the overall increase, the only answer could be the range.
Answer 9:

10. These numbers represent the amounts of money made by five students on a charity walk.
$90.50, $94, $19.50, $96.75, $89.25
A. Name the measure that best describes these data. Explain your choice of answer.
B. Explain your answer to part A.
Sample Test Questions: Open-Ended

The mean of the data set is 78. This is the measure that most closely represents the data set.
Answer 10