session 26 ts, predictive analytics: moving out of · pdf filesession 26 ts, predictive...
TRANSCRIPT

Session 26 TS, Predictive Analytics: Moving Out of Square One
Moderator:
Jean-Marc Fix, FSA, MAAA
Presenters: Jean-Marc Fix, FSA, MAAA
Jeffery Robert Huddleston, ASA, CERA, MAAA

Predictive Modeling:
Getting out of
Jean-Marc Fix, FSA, MAAA Jeff Huddleston, ASA, MAAA, CERA
Vice President, R&D Senior ConsultantOptimum Re Insurance Deloitte Consulting LLP
Life and Annuity SymposiumNashville, May 2016
On to Square 2 Today’s goal Things to have before you start Things to know before you start Starting The view from square 2
2

Today’s Goal You have heard a lot about predictive modeling Time to get your feet wet Moving to square 2
3
Things to Have R (free!) Basic understanding of key concepts Data A question (for this lesson we reverse the logical order!) PatienceWillingness to ask questions
4
Things to Know Basic R concepts Basic linear modeling concepts Basic statistical concepts
5
Starting Relevant ASOPs Document Use script Comments line start with # Keep script clean
6
What is R? For oldies: similarities to APL Don’t think of it as a programming language – to start Collection of functions extracted from useful packages Easy to dabble Lots of online resources (www.rseek.org, Coursera)
7
Useful Packages and Functions Get R Finding functions: word of the net R-seek Quick-R R-blogger Loading package that has the functions you wantinstall.package(packIreallywant)library(packIreallywant)
8
R Concepts Dataframe Categorical variables: factors Tidy data
9
Concept of Tidy Data Hadley Wickham tidyr package Tidy data row=observation, column=variable
10
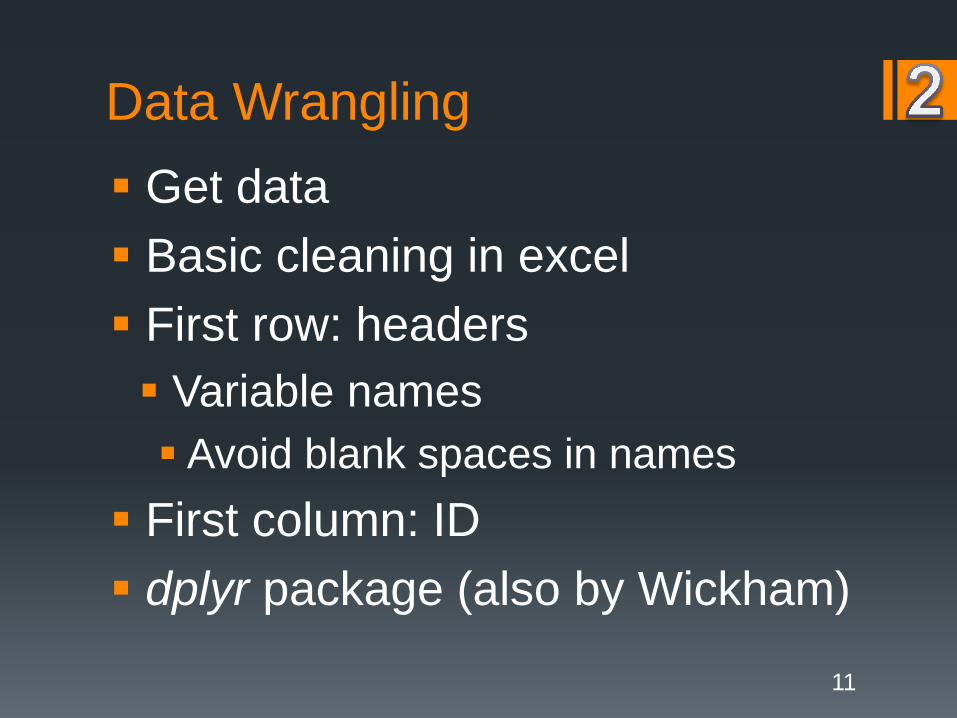
Data Wrangling Get data Basic cleaning in excel First row: headers Variable names Avoid blank spaces in names
First column: ID dplyr package (also by Wickham)
11

Clean Data Does data look as expected Remove quotation marks Consistent date format Clean trailing spaces Fill blank values or NA values with NA Save as CSV file Check CSV file in Notepad
12
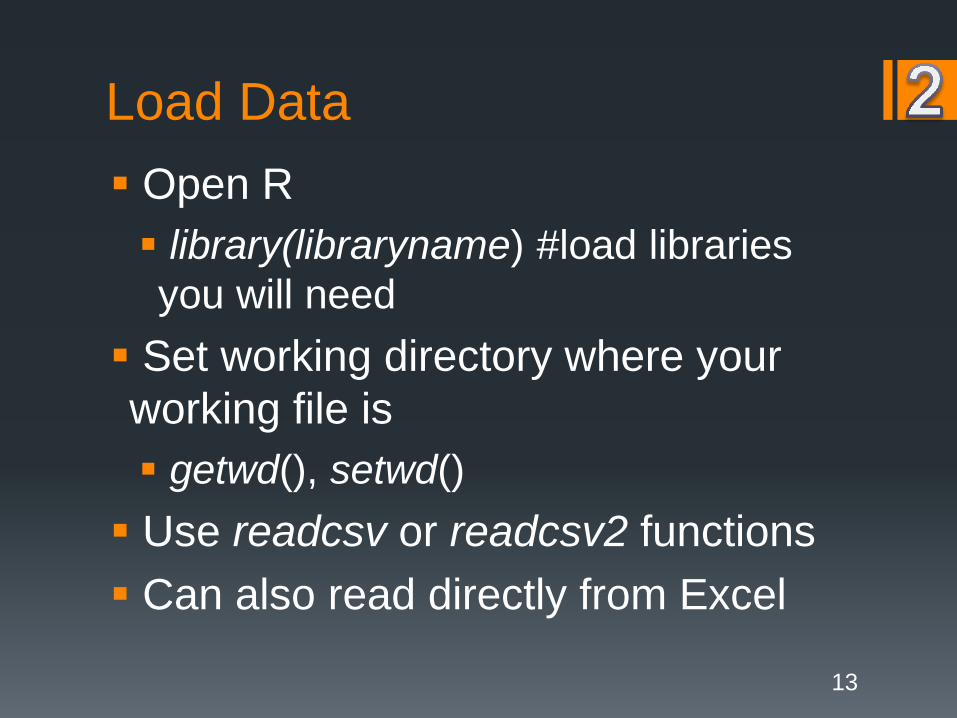
Load Data Open R library(libraryname) #load libraries you will need
Set working directory where your working file is getwd(), setwd() Use readcsv or readcsv2 functions Can also read directly from Excel
13

Useful Basic R Commands c(v1,v2,v3) concatenate x:y seq(min, max, by=5) sequence ?fn() ??fn() x<-5
14
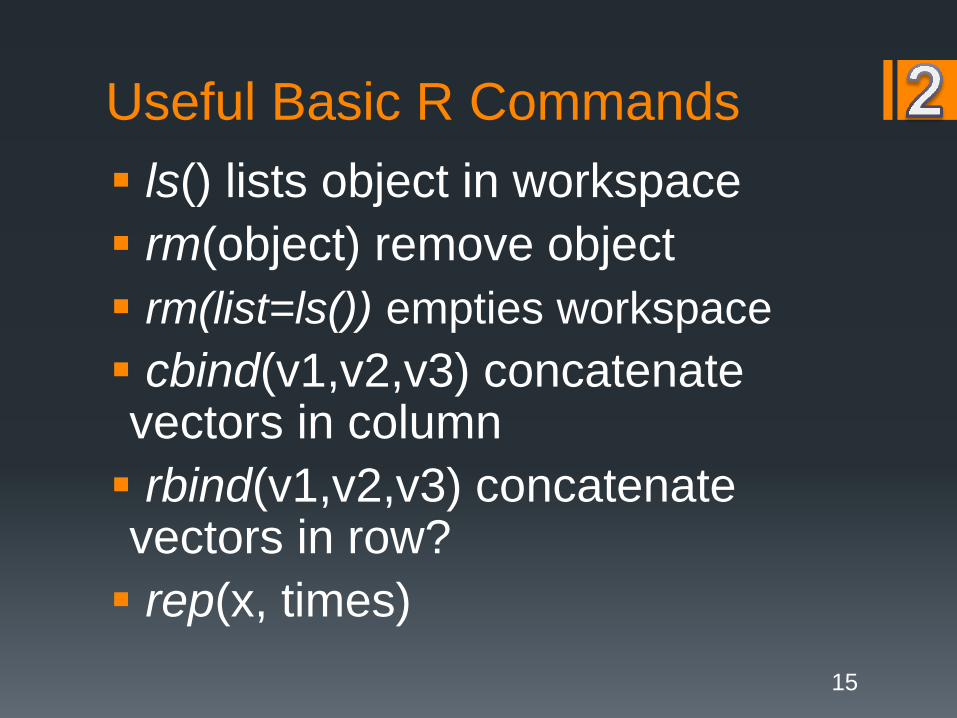
Useful Basic R Commands ls() lists object in workspace rm(object) remove object rm(list=ls()) empties workspace cbind(v1,v2,v3) concatenate vectors in column rbind(v1,v2,v3) concatenate vectors in row? rep(x, times)
15
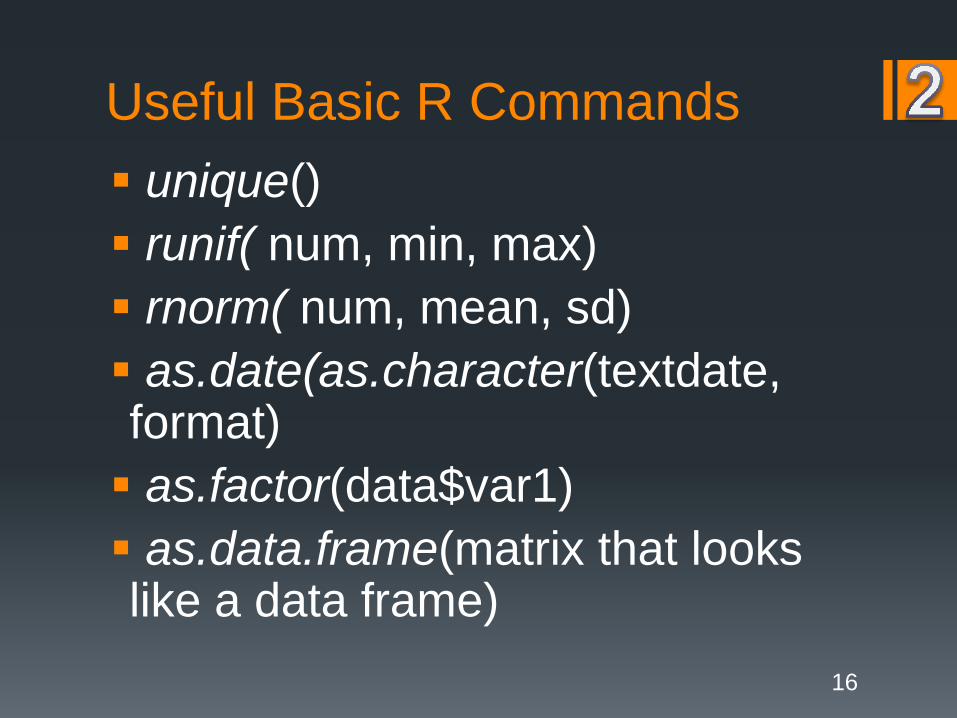
Useful Basic R Commands unique() runif( num, min, max) rnorm( num, mean, sd) as.date(as.character(textdate, format) as.factor(data$var1) as.data.frame(matrix that looks like a data frame)
16
Scripts ~ Programs Run from scripts File/new script Select what you want to run and press Ctr-r
17
Basic Useful Packages See script Ask around See r-bloggers community For development look into RStudio
18
Get Data a<-read.csv(filename.csv)
19
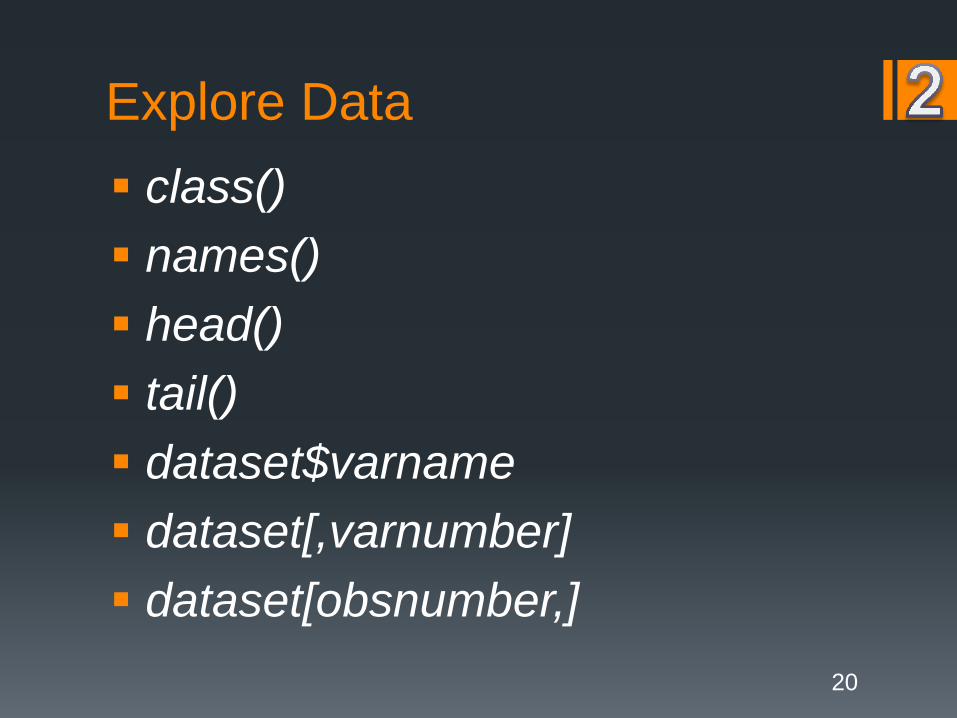
Explore Data class() names() head() tail() dataset$varname dataset[,varnumber] dataset[obsnumber,]
20

Explore Data str() summary() dim() length() For factors: unique(), levels() Conditions ==, !,…
21
Data Craft Histogram Correlations
See Regression diagnostics by John Fox 22
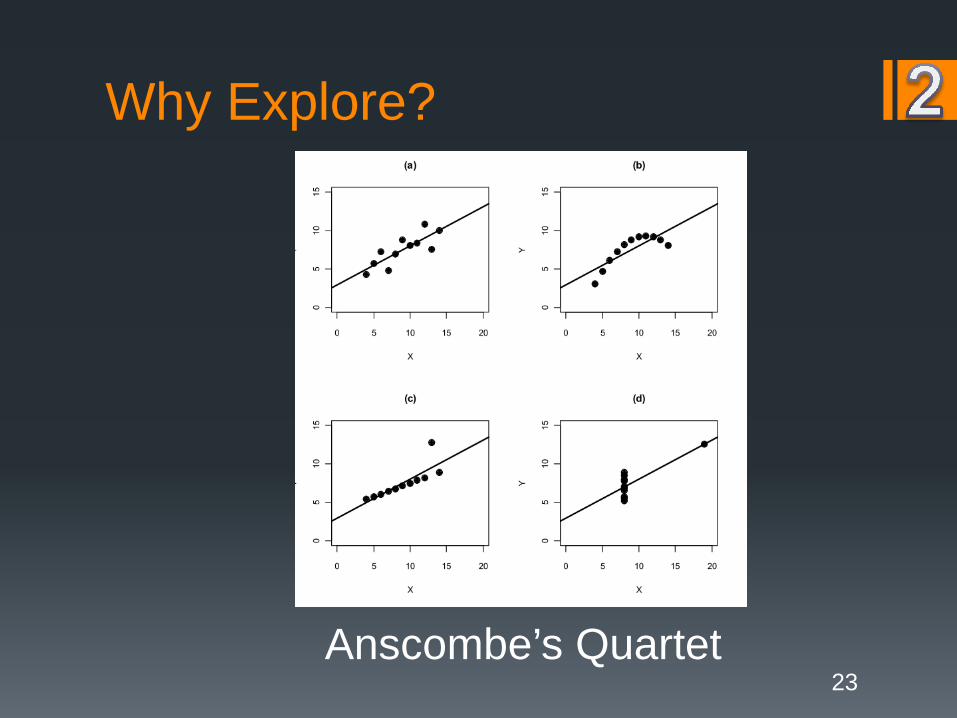
Why Explore?
Anscombe’s Quartet23
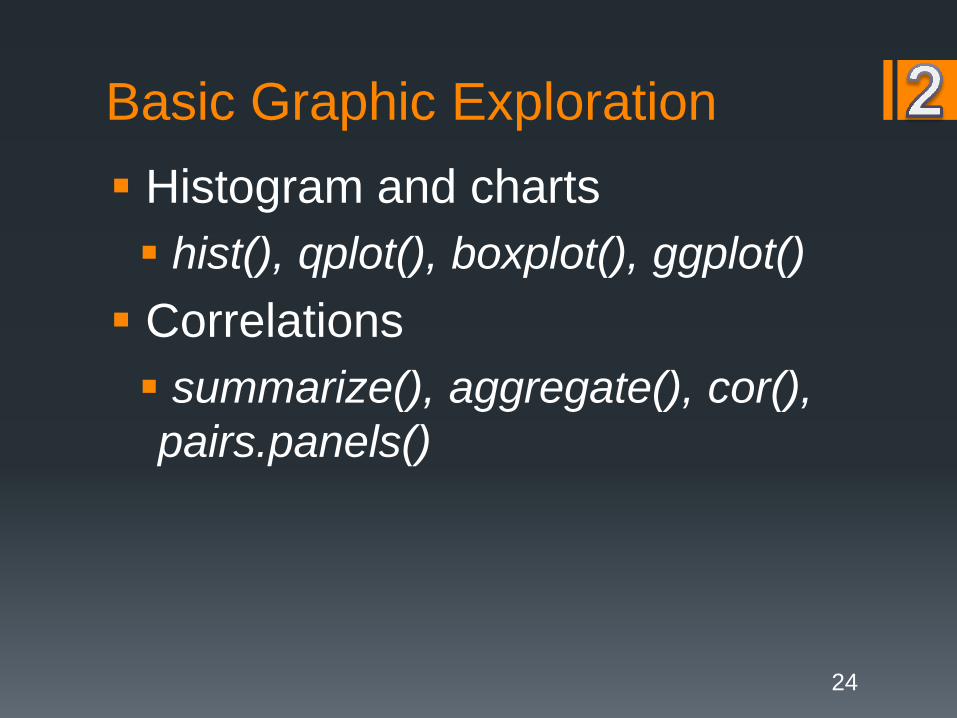
Basic Graphic Exploration Histogram and charts hist(), qplot(), boxplot(), ggplot() Correlations summarize(), aggregate(), cor(), pairs.panels()
24
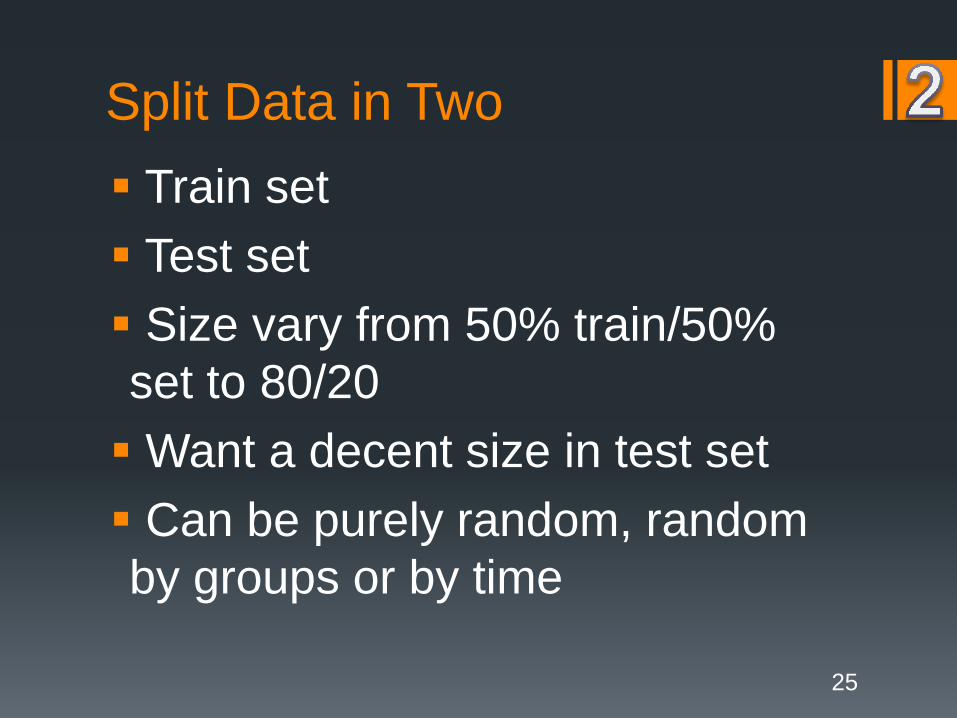
Split Data in Two Train set Test set Size vary from 50% train/50% set to 80/20Want a decent size in test set Can be purely random, random by groups or by time
25
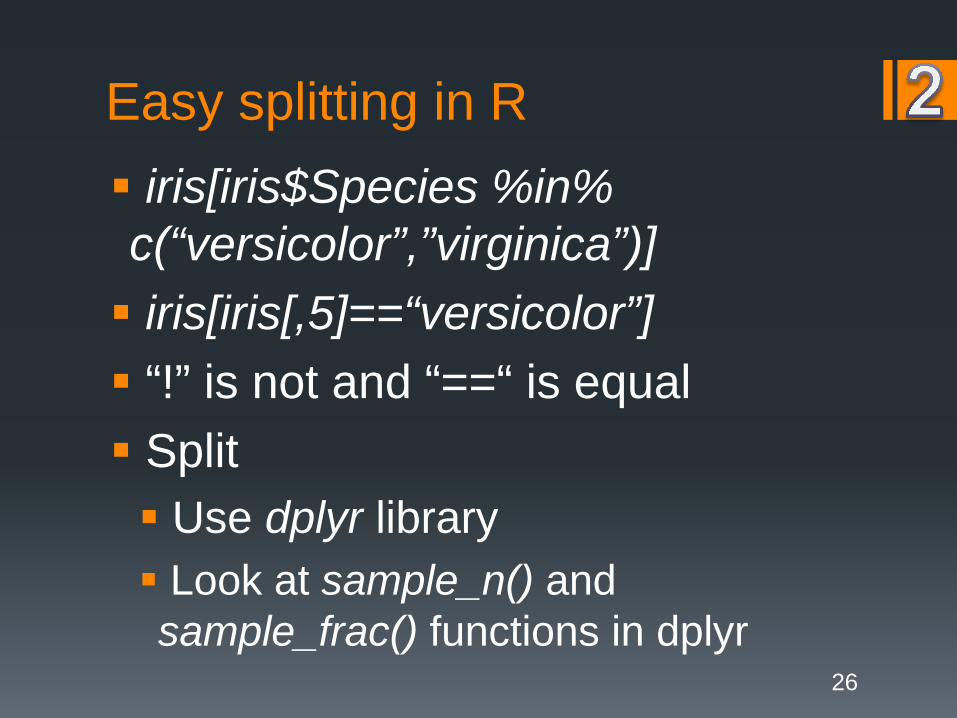
Easy splitting in R iris[iris$Species %in% c(“versicolor”,”virginica”)] iris[iris[,5]==“versicolor”] “!” is not and “==“ is equal Split Use dplyr library Look at sample_n() and sample_frac() functions in dplyr
26
Why the split?Overfitting is the bane of the modeler!
27
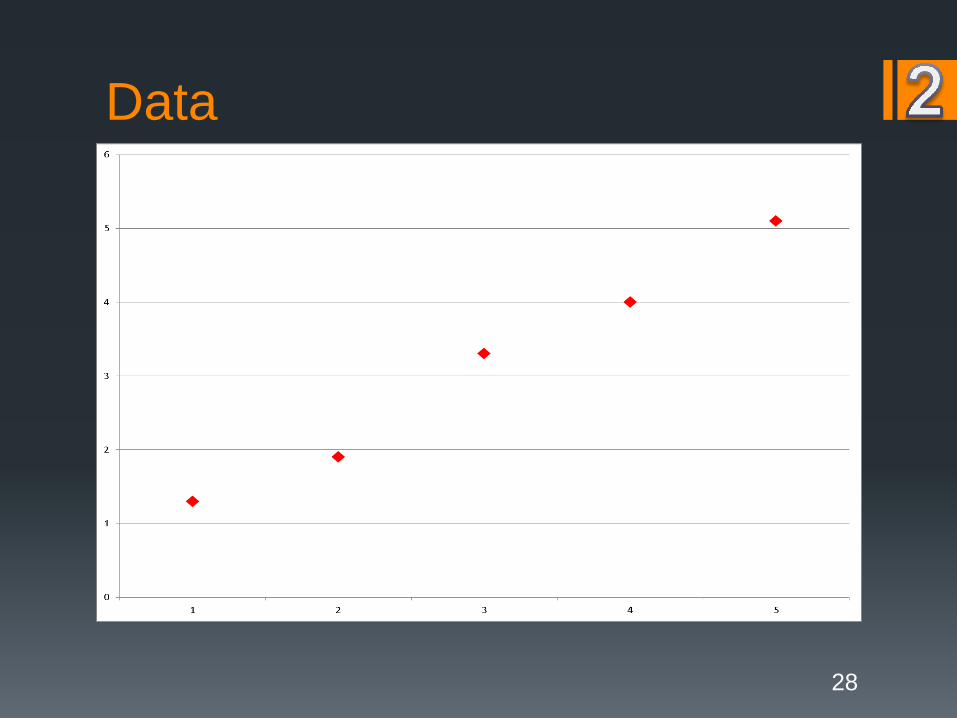
Data
28
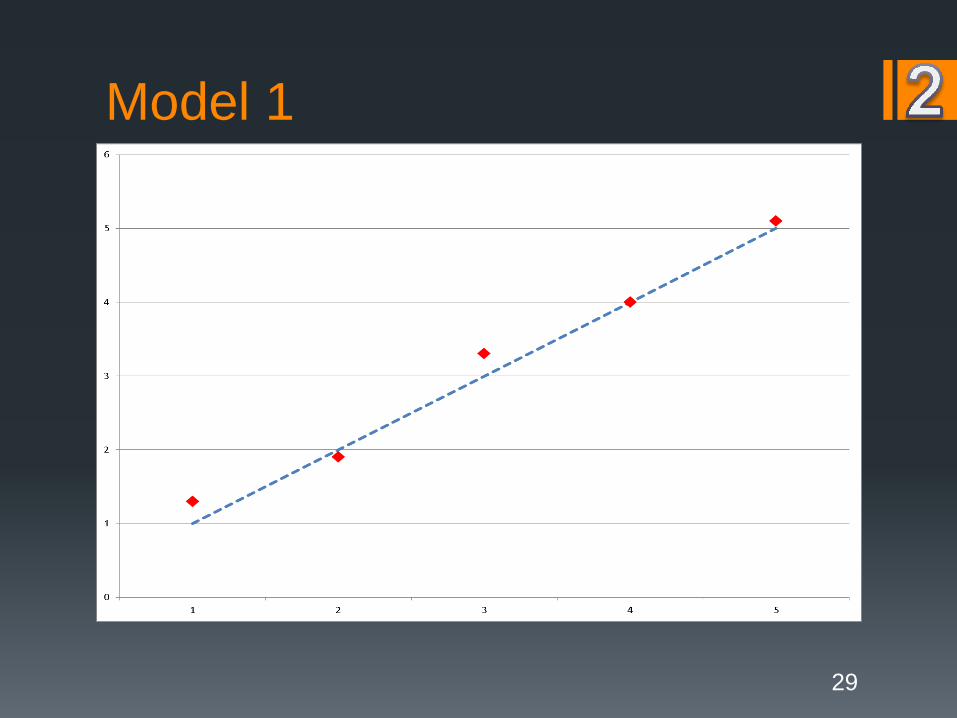
Model 1
29
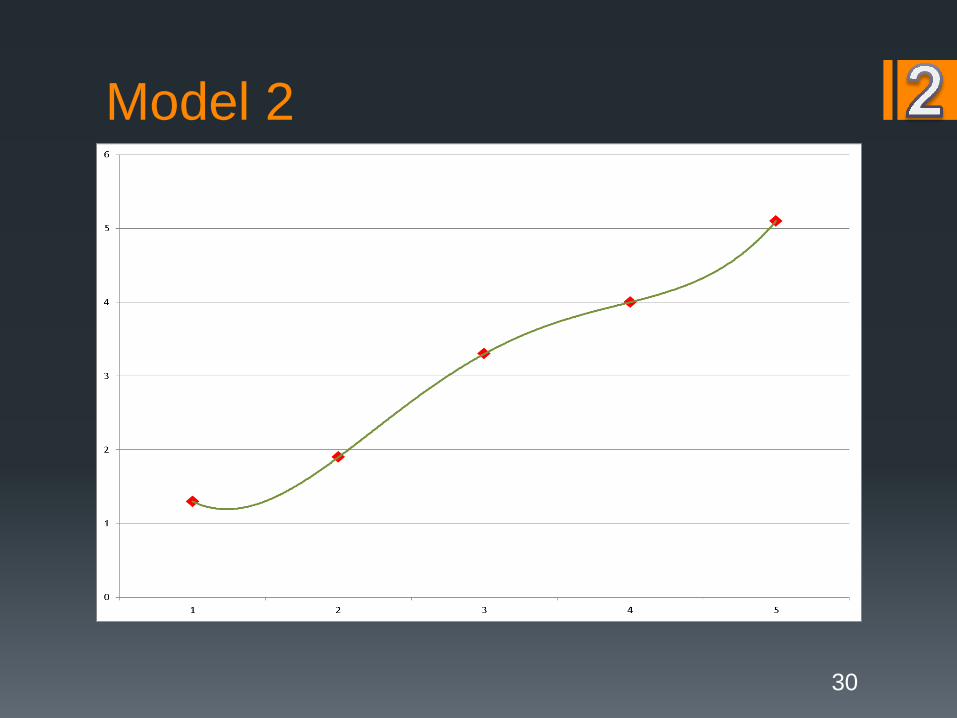
Model 2
30
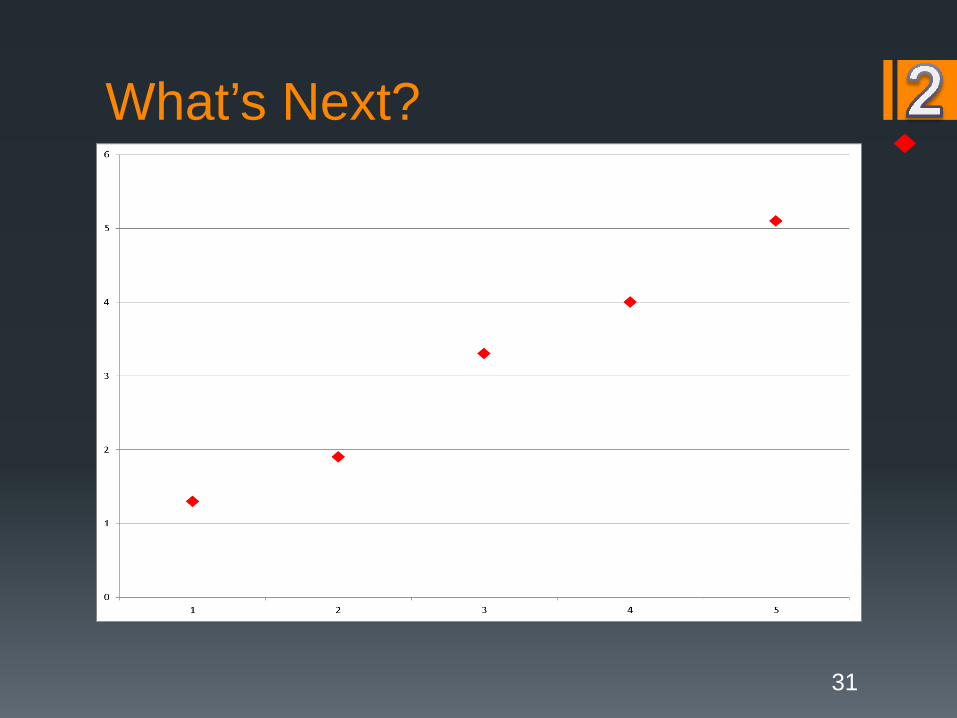
What’s Next?
31

Components of GLME(Y)=g-1(βX)
or g(E(Y))=βX
or g(Y)=βX + ε
Independent variables
Dependent variables
generated by an exponential
family distribution
Link function
32
Random error
Choose Model ParametersDistribution for lapses: commonly used Poisson distributionLink function: default link for Poisson is log
33
Modeling Group DataUsing an “offset” to adjust for exposure
34
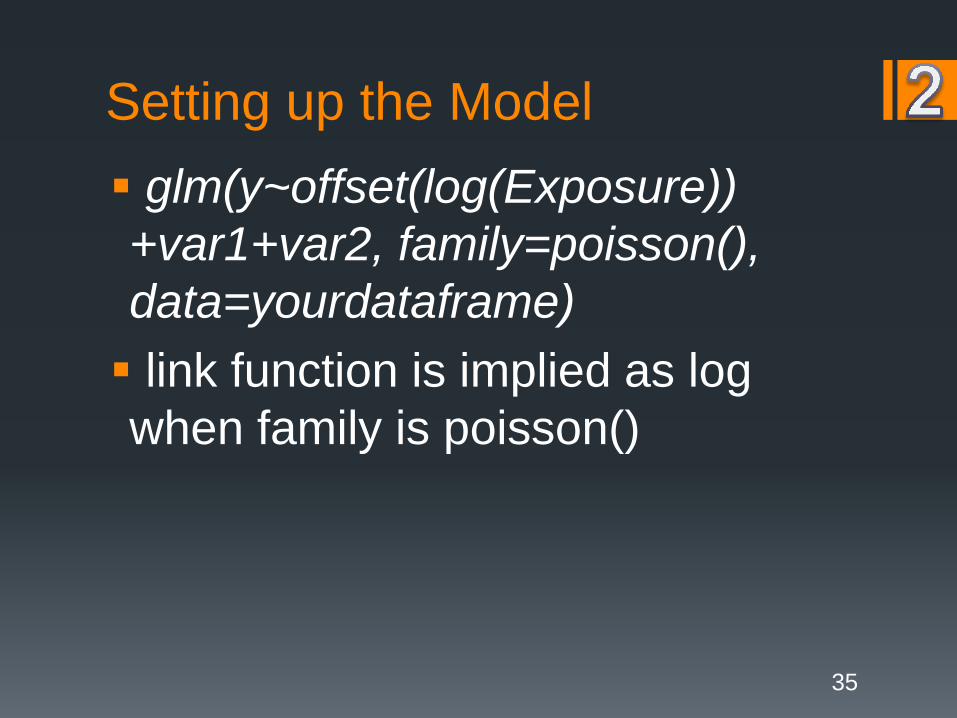
Setting up the Model glm(y~offset(log(Exposure)) +var1+var2, family=poisson(), data=yourdataframe) link function is implied as log when family is poisson()
35
Run First Iteration on Train Look at variables Pick the one with the most “lift” Run the model
36
Run First Iteration on Train Add a new variable Evaluate AIC - lower is better Is the complexity worth it? Repeat Variables can be interaction between variables or lagged or power of variables
37

You Think Your Model is Good? Look at the residuals Any patterns?
38
The Proof is in the (New) Pudding
Now run your model on the test set? Does it still look good?
39

The View from Square 2
Pygmalion by Etienne Falconet
40
The End Look at the final model developed by Richard Xu and his team for the report “Lapse Modeling for the Post-Level Period” on the SOA website Pay special attention to the appendices Go forth and multiply model
41