session 14: viral load scale-up and laboratory … m2000 8 0 8 178,560 357,120 489,600 133,920...
TRANSCRIPT

February 2018
Session 14: Viral Load Scale-Up and Laboratory Instrument Mapping and
Optimization

Prefabs / Renovations
Instruments
DISA Lab / DISA Link
Introduce Plasma
Hire New Staff
Training / Mentorship
Sample Transport
VL Specimens
Backlog – MoH
Backlog Register
DISA - Total # of
Viral Load
Performed /
Target / Monthly
TAT for Viral
Testing - DISA LAB
Increase
Testing
Capacity to
Meet Country
VL Need
Reduce Viral
Load TAT
Inadequate
Testing
Capacity to
Meet VL
Demand
High TAT for
Viral Testing
Results
Low
Coverage
and Access
to VL Testing
Problem Strategic Objectives ApproachMonitoring / Partner
Management

Current State
4
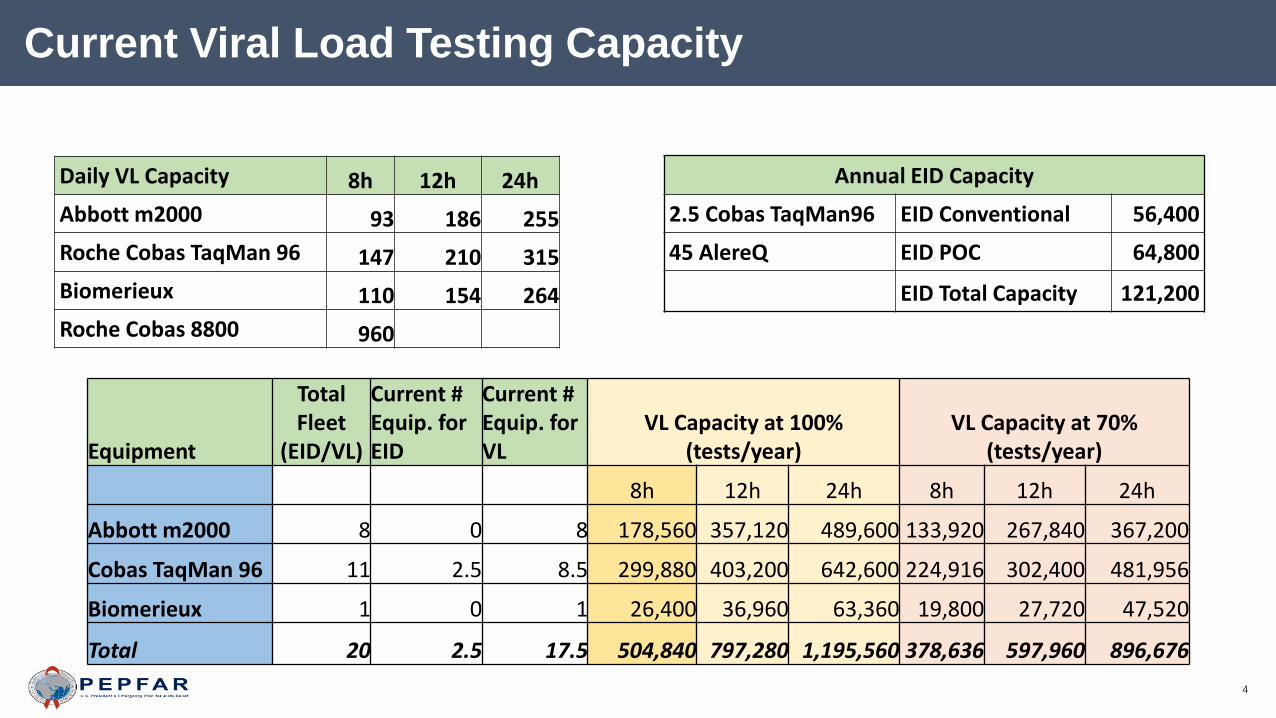
Current Viral Load Testing Capacity
Equipment
Total Fleet
(EID/VL)
Current # Equip. for EID
Current # Equip. for VL
VL Capacity at 100% (tests/year)
VL Capacity at 70% (tests/year)
8h 12h 24h 8h 12h 24h
Abbott m2000 8 0 8 178,560 357,120 489,600 133,920 267,840 367,200
Cobas TaqMan 96 11 2.5 8.5 299,880 403,200 642,600 224,916 302,400 481,956
Biomerieux 1 0 1 26,400 36,960 63,360 19,800 27,720 47,520
Total 20 2.5 17.5 504,840 797,280 1,195,560 378,636 597,960 896,676
Daily VL Capacity 8h 12h 24h
Abbott m2000 93 186 255
Roche Cobas TaqMan 96 147 210 315
Biomerieux 110 154 264
Roche Cobas 8800 960
Annual EID Capacity
2.5 Cobas TaqMan96 EID Conventional 56,400
45 AlereQ EID POC 64,800
EID Total Capacity 121,200

5
Location of Molecular Labs, GeneXpert, and POC EID, Mozambique 2018
• 11 Molecular Labs now running• 4 more to be added this year• Adding two high throughput Roche 8800• Adding Plasma Strategy
• GeneXpert• 76 current• 96 additional planned (GF&WB)
• POC EID (Alere Q)• 45 current• 93 more planned
• 30 Zambézia (PEFPAR)• 63 Non-PEPFAR

6
Viral Load Testing, FY 17 + F18 Q1
8,9
98
14
,30
2
15
,12
0
19
,45
6
23
,50
4
22
,68
7
26
,33
6 32
,97
6
32
,08
8
28
,77
0
38
,52
7
39
,13
4 4
6,7
83
58
,07
0
52
,23
2
-
10,000
20,000
30,000
40,000
50,000
60,000
70,000
Oct-16 Nov-16 Dec-16 Jan-17 Feb-17 Mar-17 Apr-17 May-17 Jun-17 Jul-17 Aug-17 Sep-17 Oct-17 Nov-17 Dec-17
FY17 = 301,898
FY18 Q1 = 157,085

7
Need to Actively Manage Pre-Analytic & Analytic Phases
0
10
20
30
40
50
60
70
80
Oct Nov Dec Jan Feb Mar Apr May Jun Jul Aug Sep Oct Nov Dec Jan
T1 @ HF T2 Lab to registration T3 Arrival to testing T4 Testing to results release
Average TAT for Viral Load Testing in Days(Oct 2016 – Jan 2018)
8
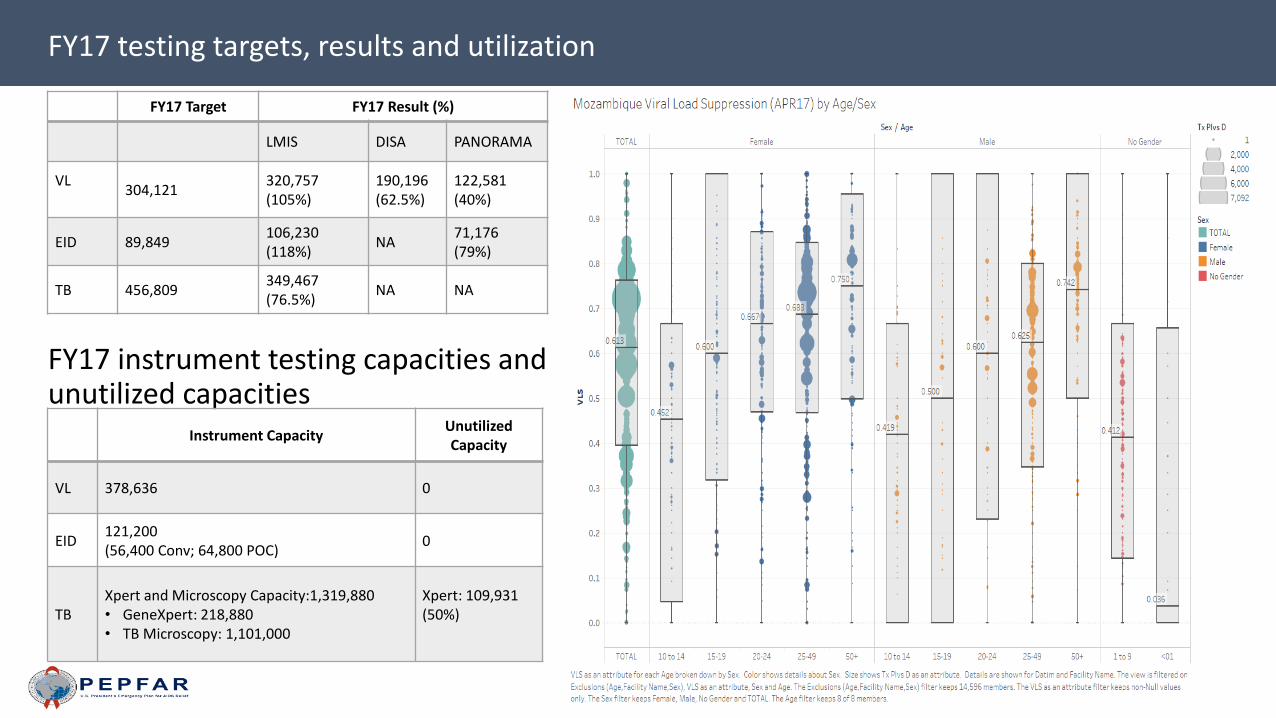
FY17 testing targets, results and utilization
FY17 instrument testing capacities and unutilized capacities
FY17 Target FY17 Result (%)
LMIS DISA PANORAMA
VL304,121
320,757 (105%)
190,196(62.5%)
122,581(40%)
EID 89,849106,230(118%)
NA71,176(79%)
TB 456,809349,467 (76.5%)
NA NA
Instrument CapacityUnutilized Capacity
VL 378,636 0
EID121,200 (56,400 Conv; 64,800 POC)
0
TBXpert and Microscopy Capacity:1,319,880• GeneXpert: 218,880• TB Microscopy: 1,101,000
Xpert: 109,931 (50%)
9
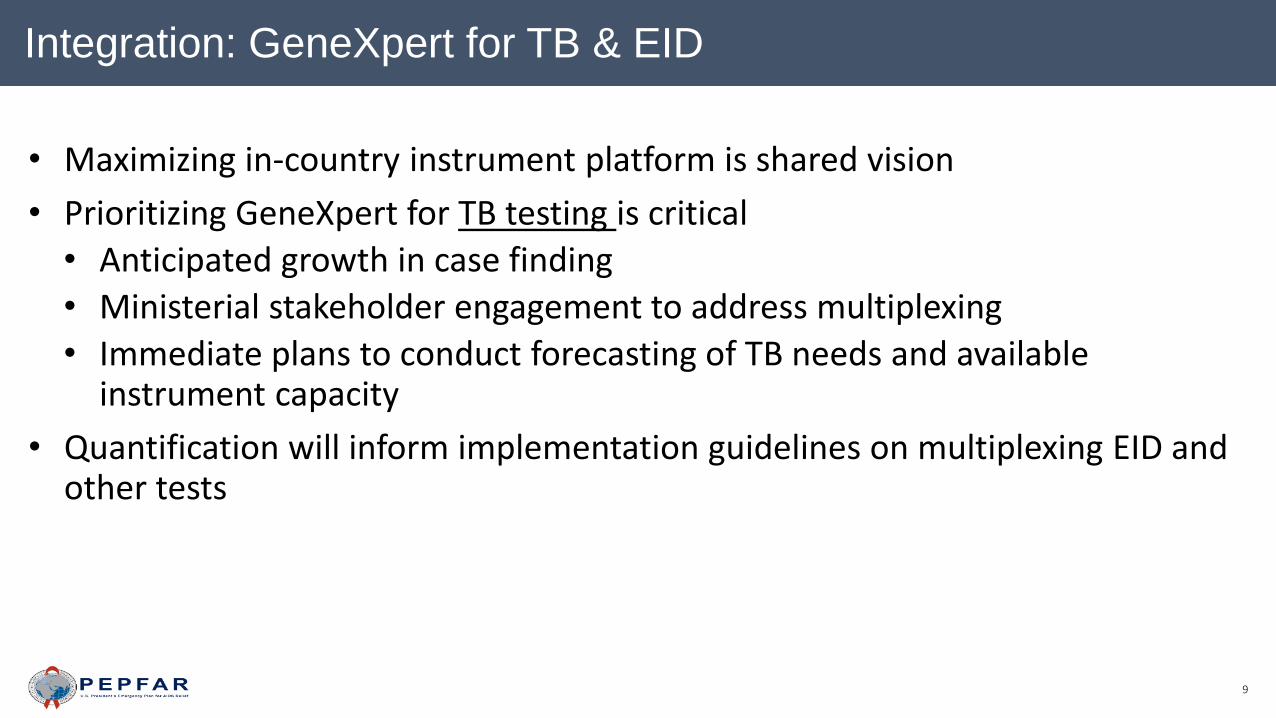
Integration: GeneXpert for TB & EID
• Maximizing in-country instrument platform is shared vision
• Prioritizing GeneXpert for TB testing is critical
• Anticipated growth in case finding
• Ministerial stakeholder engagement to address multiplexing
• Immediate plans to conduct forecasting of TB needs and available instrument capacity
• Quantification will inform implementation guidelines on multiplexing EID and other tests
10
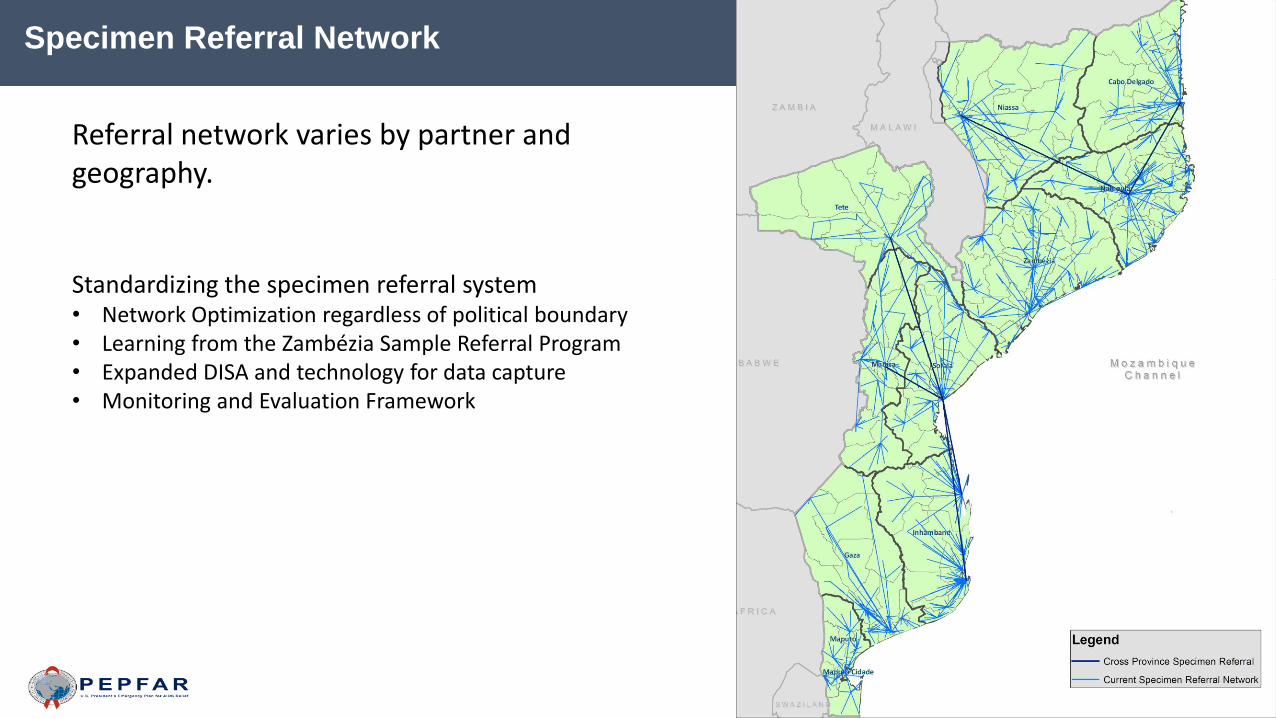
Specimen Referral Network
Referral network varies by partner and geography.
Standardizing the specimen referral system• Network Optimization regardless of political boundary• Learning from the Zambézia Sample Referral Program• Expanded DISA and technology for data capture• Monitoring and Evaluation Framework

11
77499
24942
151444823
32%
61%
32%
0%
10%
20%
30%
40%
50%
60%
70%
0
10000
20000
30000
40000
50000
60000
70000
80000
90000
Patients eligiblefor VL
VL samples sent VL resultsreturned
Tests VL>1000
Viral Load Results Reporting, FY17, Q4
*Data available from Inhambane, Maputo City, Nampula and Zambezia; Phase 1 and 2 Test and Start districts only ; sites > 1,000 ART patients
12
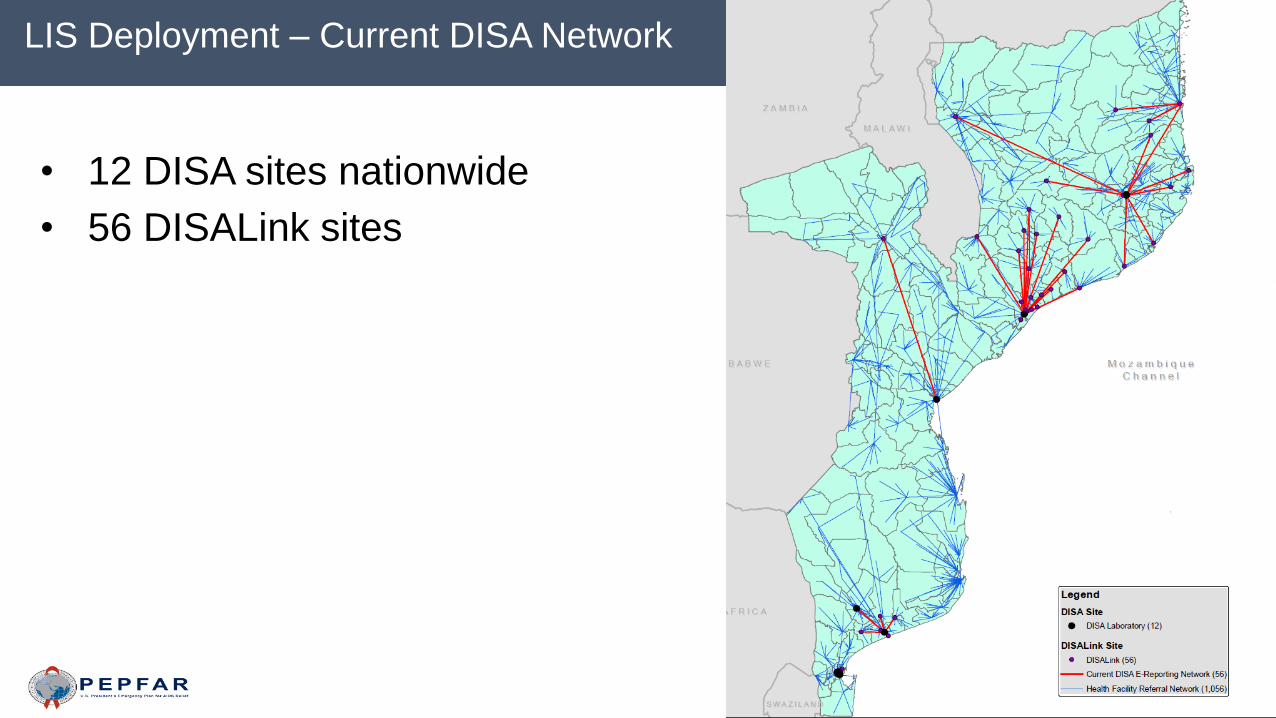
LIS Deployment – Current DISA Network
• 12 DISA sites nationwide
• 56 DISALink sites

13
LIS Deployment – FY18 DISA Network
• 16 DISA sites nationwide
• 96 additional DISALink sites • Total 152
Improved monitoring of TAT
Faster return of results
15
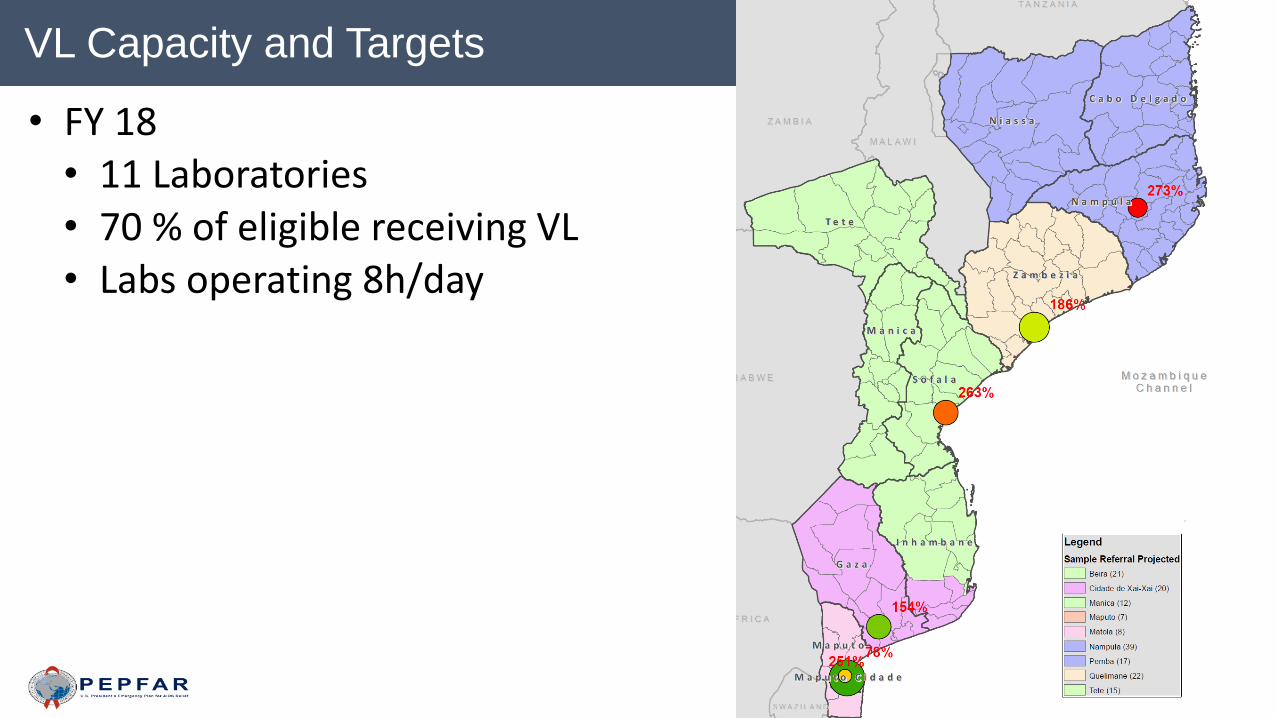
VL Capacity and Targets
• FY 18• 11 Laboratories• 70 % of eligible receiving VL• Labs operating 8h/day
16
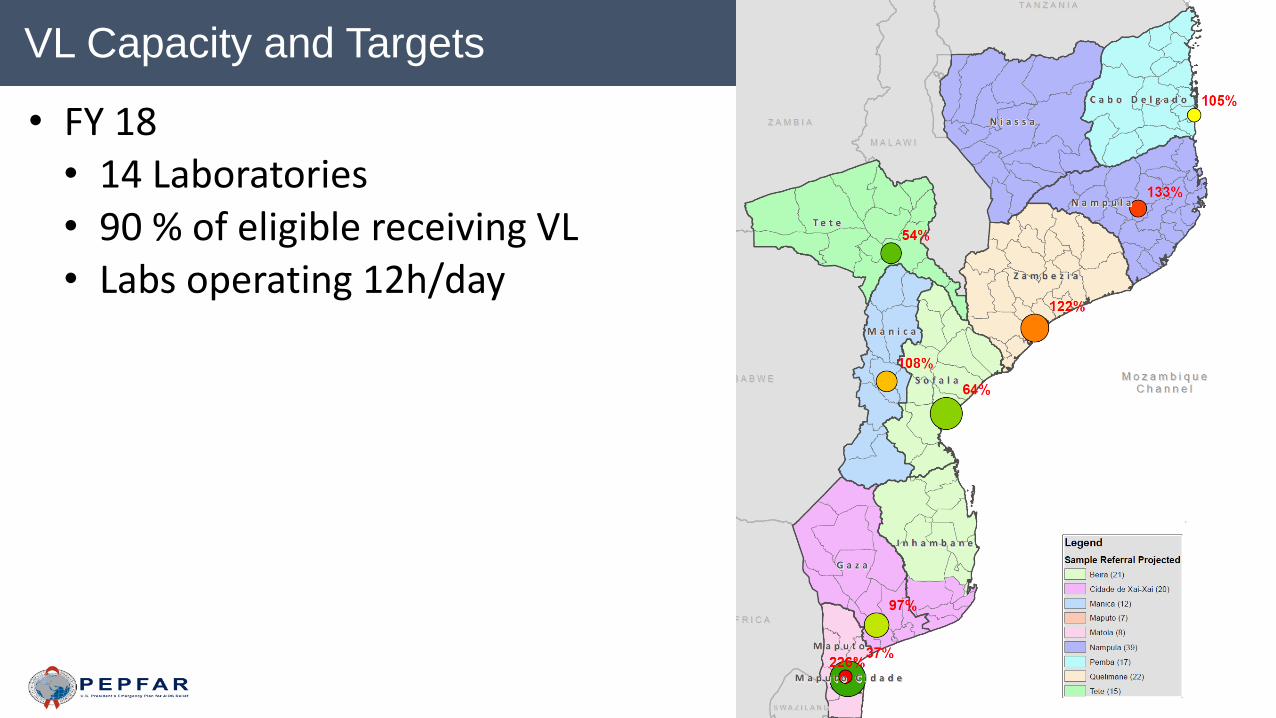
VL Capacity and Targets
• FY 18• 14 Laboratories• 90 % of eligible receiving VL• Labs operating 12h/day

17
VL Capacity and Targets
• FY 19• 14 Laboratories• 90 % of eligible receiving VL• Labs operating 12h/day

18
VL Capacity and Targets
• FY 20• 14 Laboratories• 90 % of eligible receiving VL• Labs operating 12h/day

Planning for VL scale up

20
VL Forecasts
Key assumptions:
- 1 VL test per patient
- VL scale up 90% PLHIV
- Aligned with T&S expansion
- Instrument capacity/contribution & utilization rates:
Year VL Tests CD4 Tests
FY18 673,552 1,078,534
FY19 1,327,653 647,667
FY20 1,900,717 512,348
Instrument Tests/8 hours Run/day # Tests/monthWorking days
per month
Biomerieux 84 2 3,696 22
Cobas/Taqman 96 168 2 3,696 22
Cobas 8800 960 2 21,120 22
Abbott m2000 186 2 4,092 22
VL Reagent Financial Needs
FY19 FY20
Number of Tests 1,327,653 1,900,717
Funding Need $25,704,358 $36,799,307
Funding $22,000,027
Remaining Need $(3,704,331) $(36,799,307)
21
Equipment Maintenance
• Vendor strategy in place for appropriate equipment maintenance
• Routine preventive maintenance
• Roche reagent rental (64% of network and growing)
– Financial incentives for the vendor to respond quickly
• Abbott maintenance contract
– Challenges with response and repair time
• Training or refresher training for lab personnel
• Super users
• Regular review of errors and causes of breakdowns to determine root causes
• Challenges with electrical systems

22
Instrument Planning
COP18
23
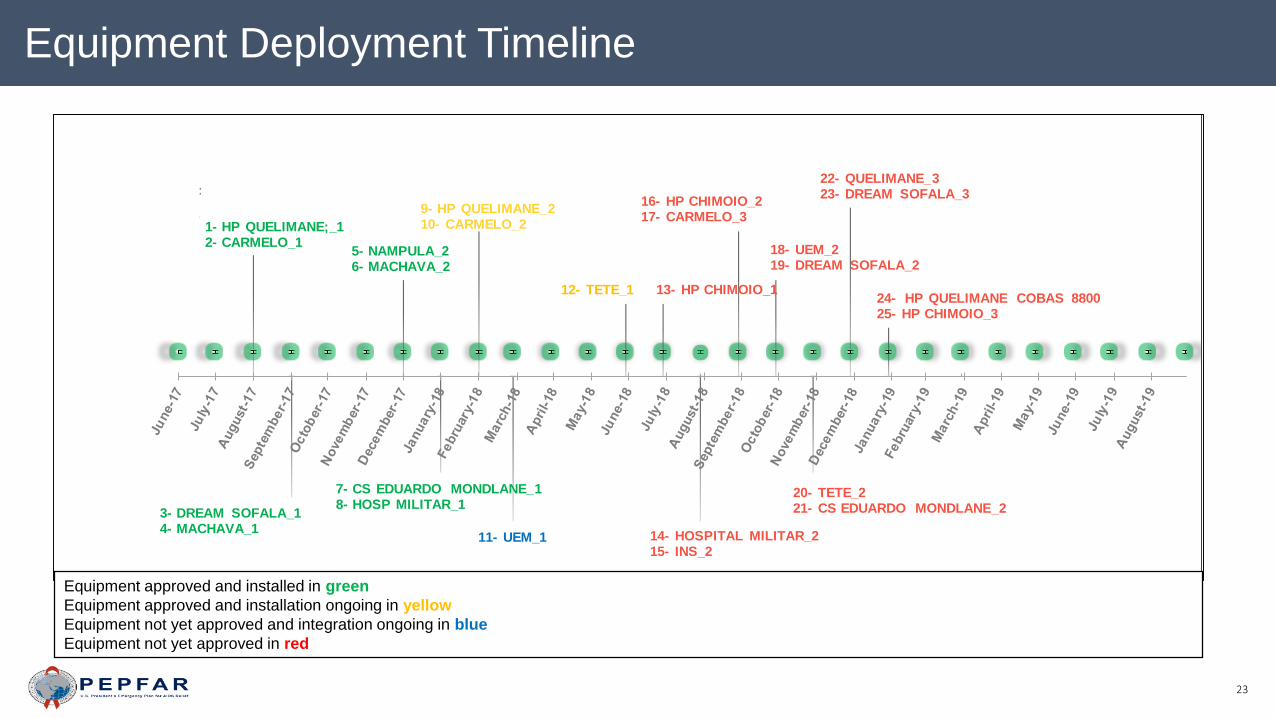
Equipment Deployment Timeline Viral Load
Equipment Deployment Timeline
DEC 2016-JULY 2017: BID/TECH EVAL/APPROVAL BY
USAID WSIGNATURE RRA BY GHSC-PSM
1- HP QUELIMANE;_12- CARMELO_1
3- DREAM SOFALA_14- MACHAVA_1
5- NAMPULA_26- MACHAVA_2
7- CS EDUARDO MONDLANE_18- HOSP MILITAR_1
9- HP QUELIMANE_210- CARMELO_2
11- UEM_1
12- TETE_1 13- HP CHIMOIO_1
14- HOSPITAL MILITAR_215- INS_2
16- HP CHIMOIO_217- CARMELO_3
18- UEM_219- DREAM SOFALA_2
20- TETE_221- CS EDUARDO MONDLANE_2
22- QUELIMANE_323- DREAM SOFALA_3
24- HP QUELIMANE COBAS 880025- HP CHIMOIO_3
Equipment approved and installed in green
Equipment approved and installation ongoing in yellow
Equipment not yet approved and integration ongoing in blue
Equipment not yet approved in red
24
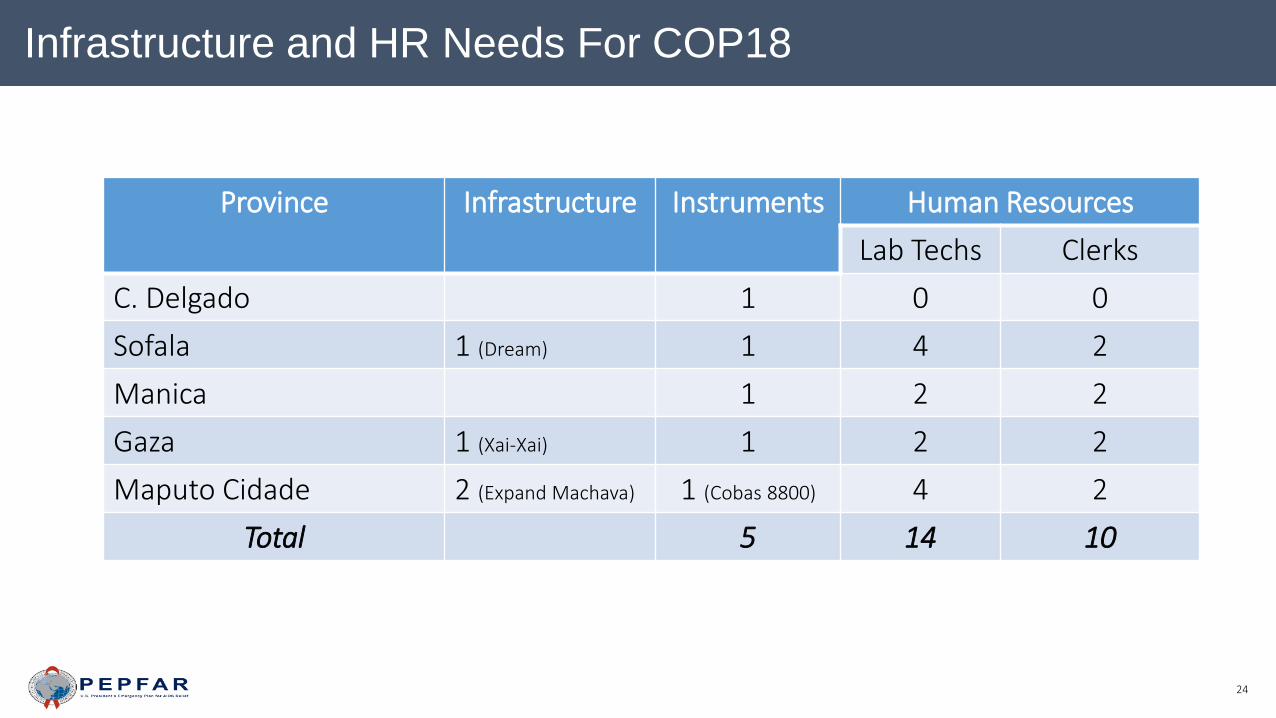
Infrastructure and HR Needs For COP18
Province Infrastructure Instruments Human Resources
Lab Techs Clerks
C. Delgado 1 0 0
Sofala 1 (Dream) 1 4 2
Manica 1 2 2
Gaza 1 (Xai-Xai) 1 2 2
Maputo Cidade 2 (Expand Machava) 1 (Cobas 8800) 4 2
Total 5 14 10

Way Forward: Learning from Experience
26
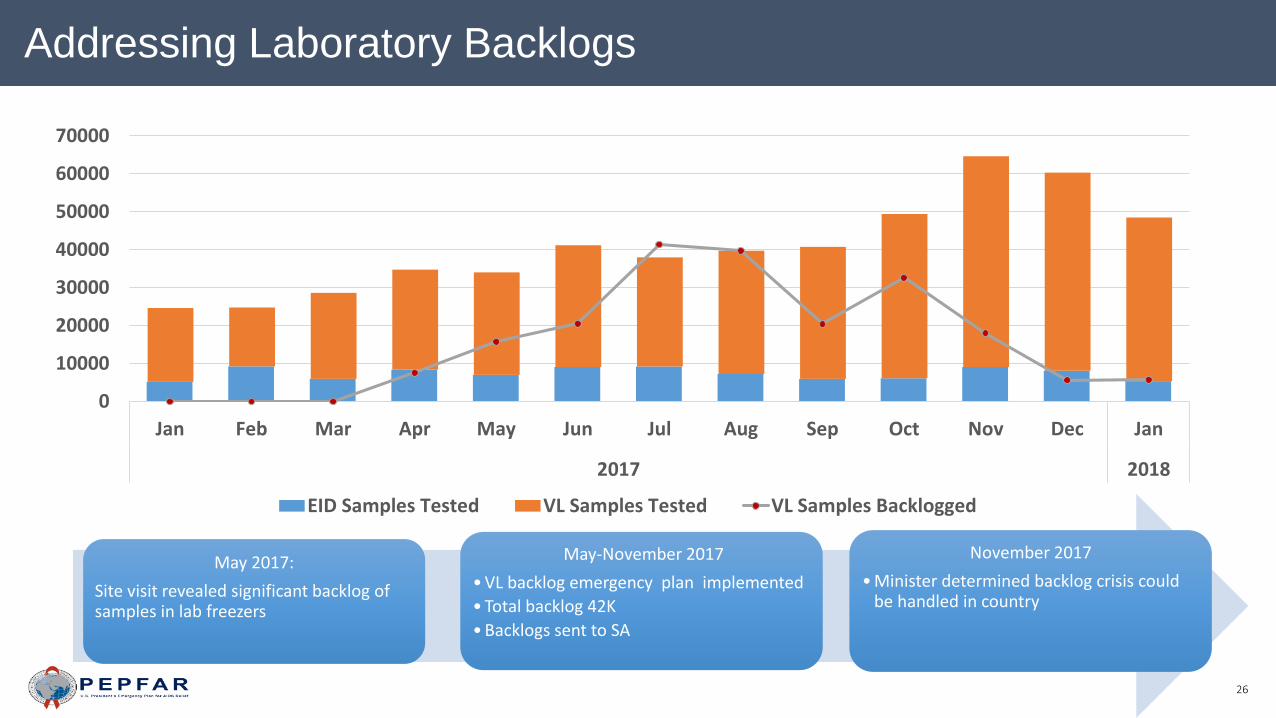
Addressing Laboratory Backlogs
0
10000
20000
30000
40000
50000
60000
70000
Jan Feb Mar Apr May Jun Jul Aug Sep Oct Nov Dec Jan
2017 2018
EID Samples Tested VL Samples Tested VL Samples Backlogged
May 2017:
Site visit revealed significant backlog of samples in lab freezers
November 2017
• Minister determined backlog crisis could be handled in country
May-November 2017
• VL backlog emergency plan implemented
• Total backlog 42K
• Backlogs sent to SA
27
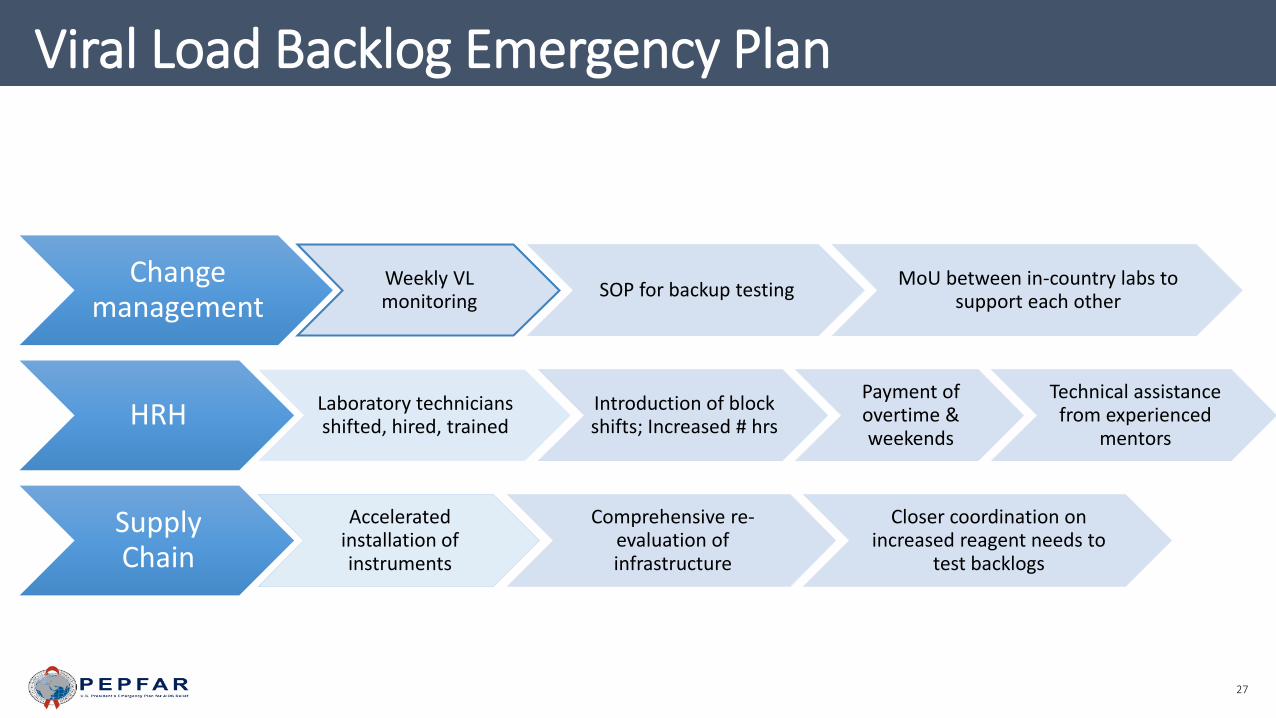
Viral Load Backlog Emergency Plan
Change management
Weekly VL monitoring
SOP for backup testingMoU between in-country labs to
support each other
HRH Laboratory technicians shifted, hired, trained
Introduction of block shifts; Increased # hrs
Payment of overtime & weekends
Technical assistance from experienced
mentors
Supply Chain
Accelerated installation of instruments
Comprehensive re-evaluation of infrastructure
Closer coordination on increased reagent needs to
test backlogs
28
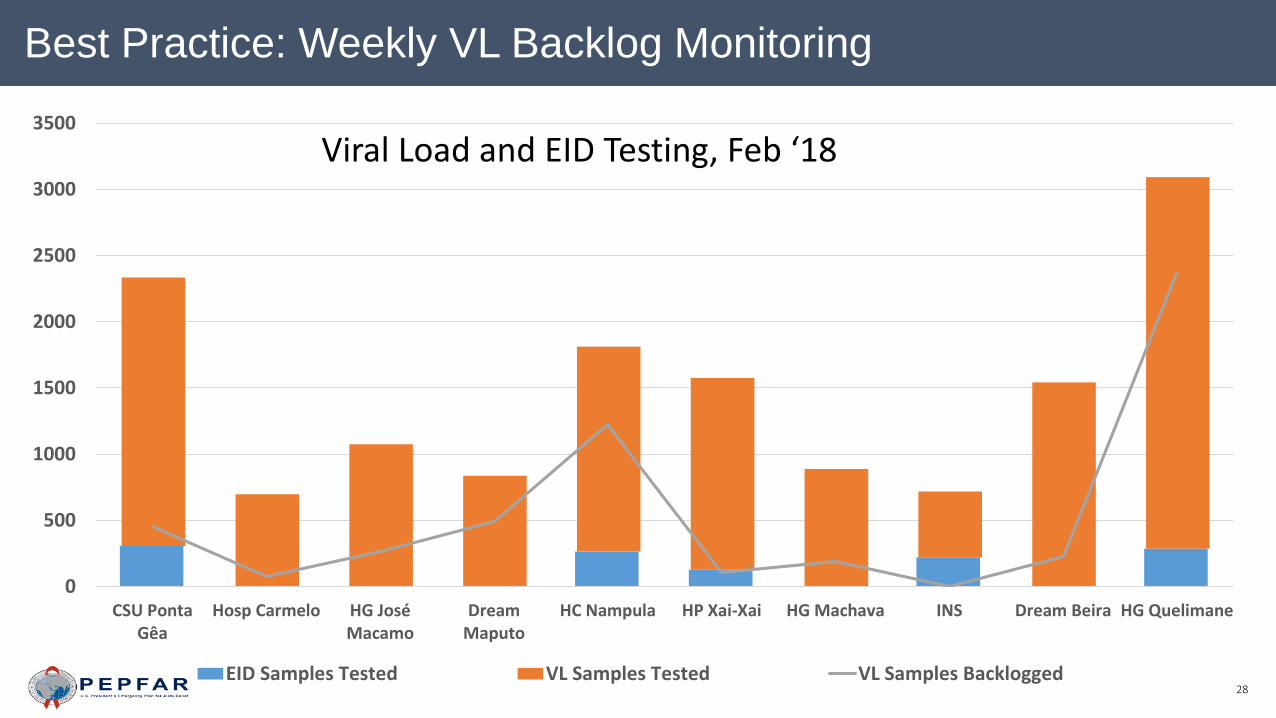
Best Practice: Weekly VL Backlog Monitoring
0
500
1000
1500
2000
2500
3000
3500
CSU PontaGêa
Hosp Carmelo HG JoséMacamo
DreamMaputo
HC Nampula HP Xai-Xai HG Machava INS Dream Beira HG Quelimane
EID Samples Tested VL Samples Tested VL Samples Backlogged
Viral Load and EID Testing, Feb ‘18
29
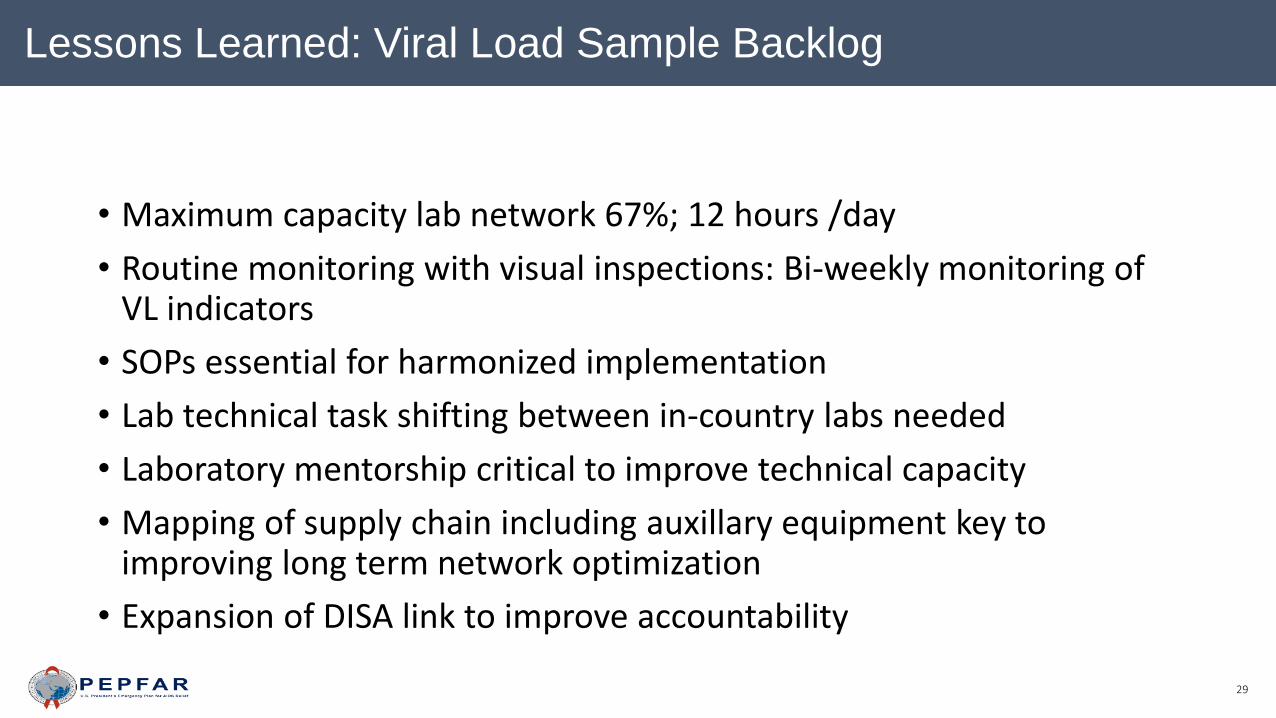
Lessons Learned: Viral Load Sample Backlog
• Maximum capacity lab network 67%; 12 hours /day
• Routine monitoring with visual inspections: Bi-weekly monitoring of VL indicators
• SOPs essential for harmonized implementation
• Lab technical task shifting between in-country labs needed
• Laboratory mentorship critical to improve technical capacity
• Mapping of supply chain including auxillary equipment key to improving long term network optimization
• Expansion of DISA link to improve accountability
30
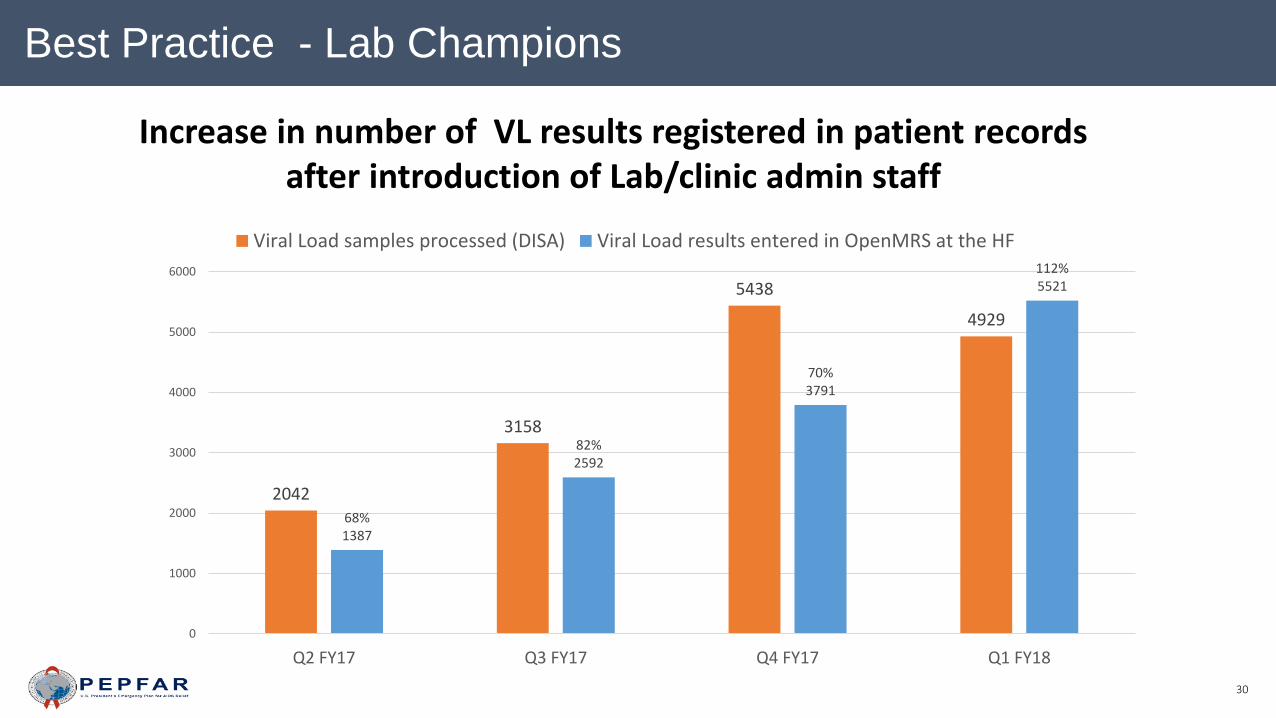
Best Practice - Lab Champions
2042
3158
5438
4929
68%1387
82%2592
70%3791
112%5521
0
1000
2000
3000
4000
5000
6000
Q2 FY17 Q3 FY17 Q4 FY17 Q1 FY18
Viral Load samples processed (DISA) Viral Load results entered in OpenMRS at the HF
Increase in number of VL results registered in patient records after introduction of Lab/clinic admin staff
31
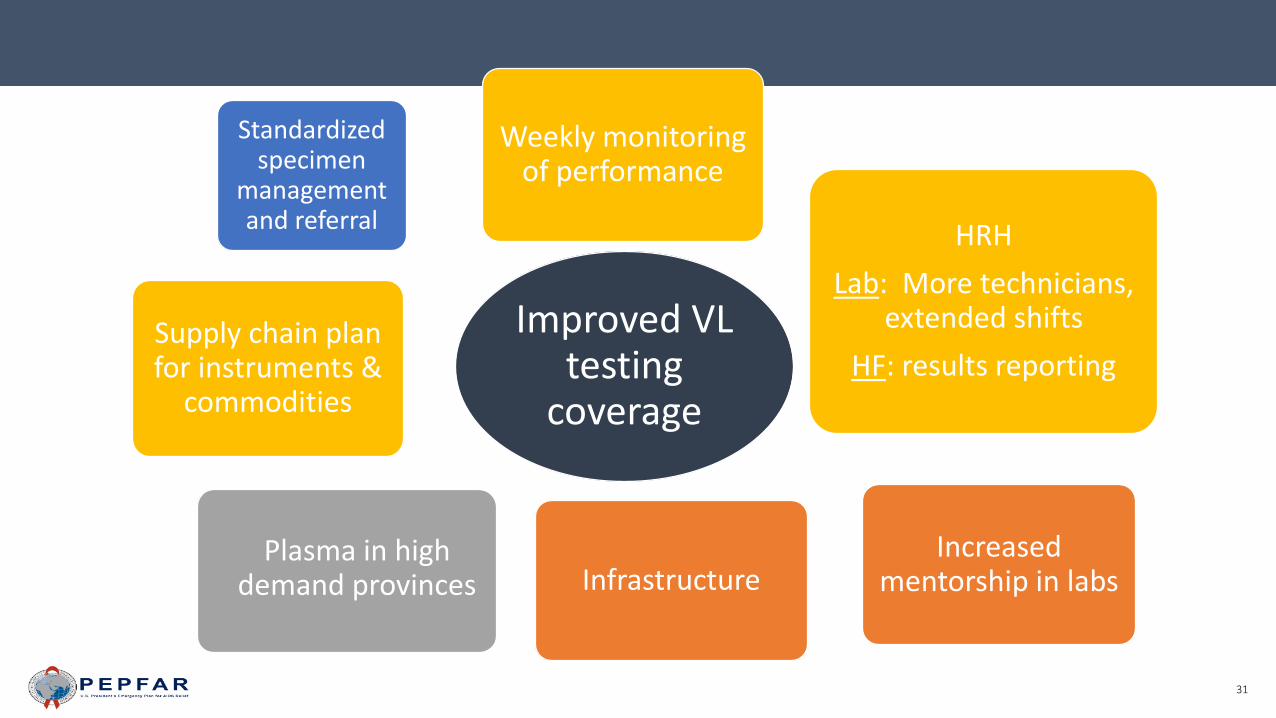
Improved VL testing
coverage
Standardized specimen
management and referral
HRH
Lab: More technicians, extended shifts
HF: results reporting
Weekly monitoring of performance
Supply chain plan for instruments &
commodities
Plasma in high demand provinces
Increased mentorship in labsInfrastructure

32
Lab Continuous Quality Improvement
Continuous Quality
Improvement
Auditing
Mentoring
Laboratory CQIExternal quality
assessment
International accreditation
33
Summary of Concerns: Increasing demand on lab system
• Mozambique context: Ground up lab support• Test & Start scale up• Future backlogs• Tight budget of 1 test per/person• Lab site readiness• HRH gaps• Turn around times• Results reporting
