session 1 - introduction & workshop overview
TRANSCRIPT

Session 1 Introduction and Workshop Overview
Performance Monitoring
September 2014

Course Content
• Session 1: Introduction and Course Overview
• Session 2: Performance Monitoring within the USAID Program Cycle
• Session 3: Developing Performance Indicators
• Session 4: Monitoring Best Practices & Tools
• Session 5: Analyzing and Using Data
• Session 6: Mobile Data Collection
• Session 7: Exploring the Design Space

Performance Monitoring: What is it?
Exercise10 minutes in pairs
Brainstorm top 3 ways that performance monitoring helps your team do its work.
Performance Monitoring – How it Helps Us as Development Professionals
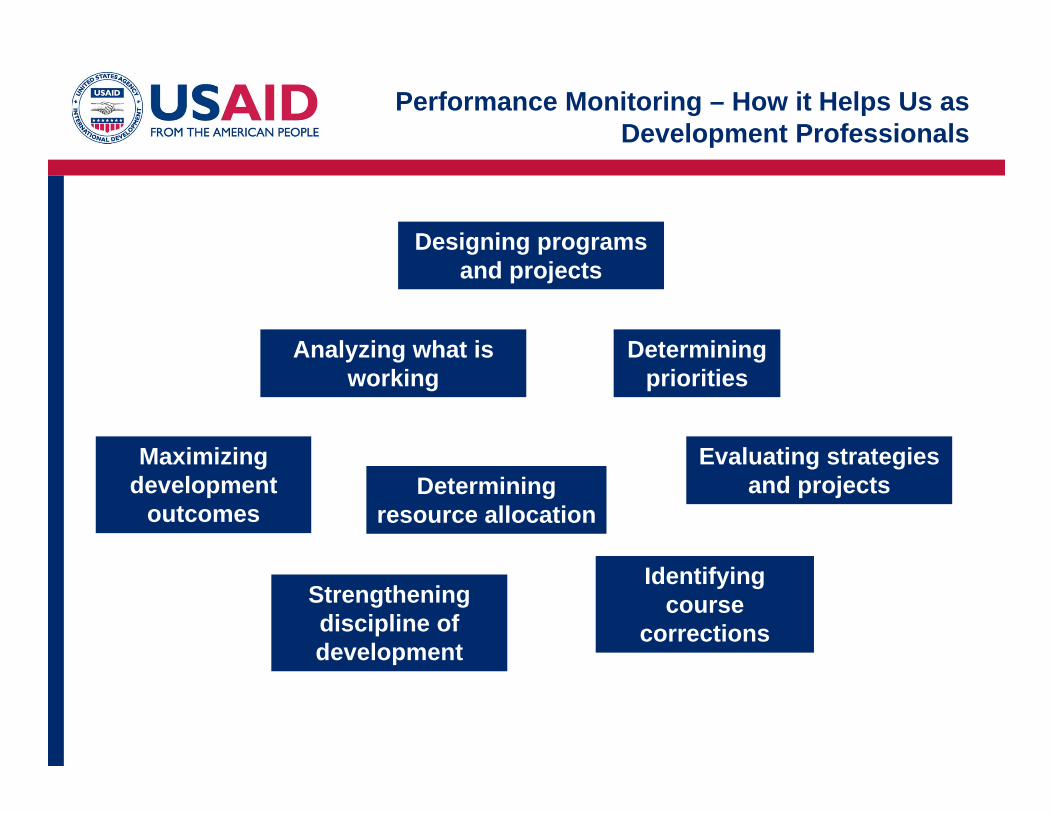
Designing programs and projects
Determining resource allocation
Maximizing development
outcomes
Strengthening discipline of development
Analyzing what is working
Evaluating strategies and projects
Determining priorities
Identifying course
corrections
Performance Monitoring – How it Helps Us as Development Professionals

Performance monitoring contributes to better development results.
Performance MonitoringWhy We Do It

• High-quality performance monitoring aids accountability to USAID headquarters, Congress, and taxpayers.
• Required by law: Government Performance and Results Act (GPRA) of 1993 and GPRA Modernization Act of 2011
• USAID Guidance (ADS 203) specifies USAID’s PM requirements and procedures.
• Performance monitoring data is auditable.
Performance MonitoringImproves Accountability
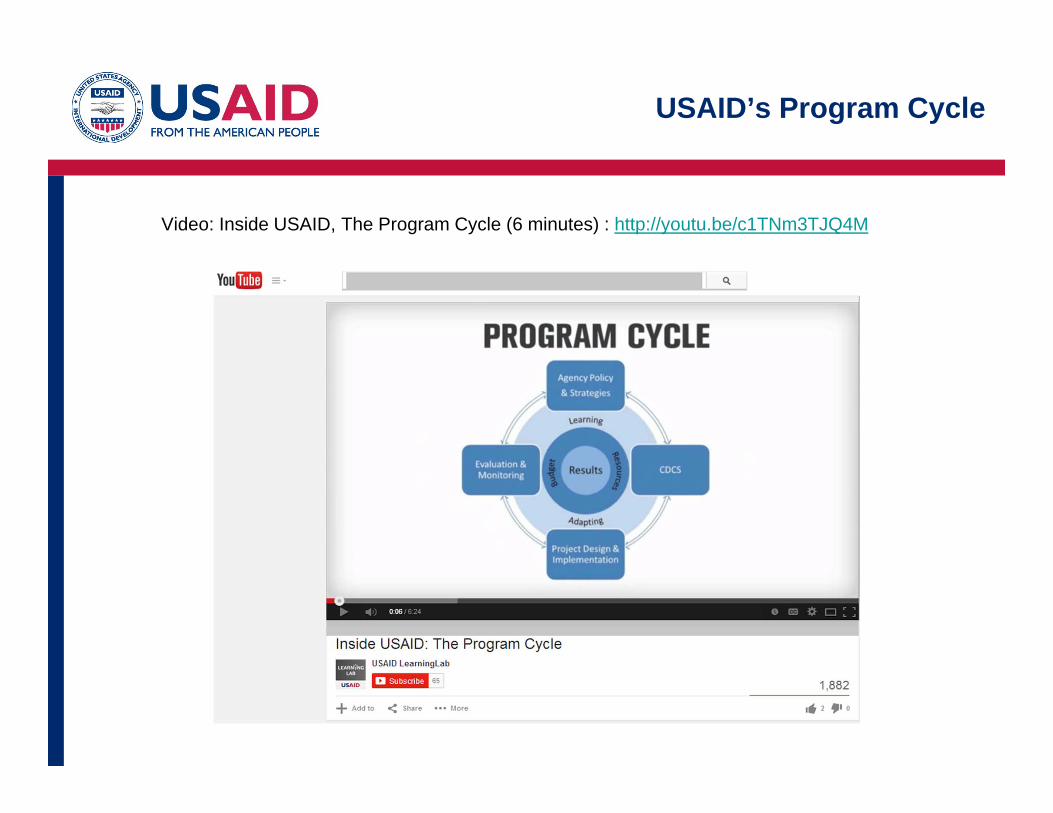
USAID’s Program Cycle
Video: Inside USAID, The Program Cycle (6 minutes) : http://youtu.be/c1TNm3TJQ4M

Session 2 Performance Monitoring in the USAID Program Cycle
Performance Monitoring
September 2014

Mechanism Level Mission Level
Activities Projects Strategies
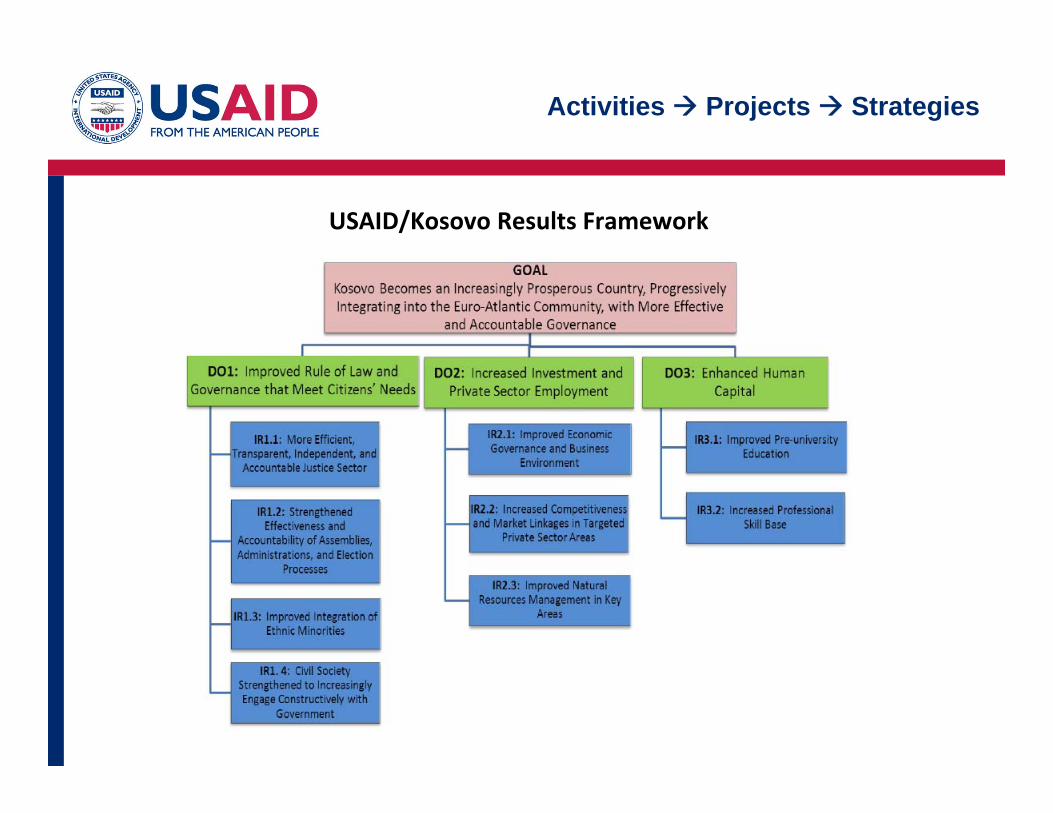
Activities Projects Strategies
USAID/Kosovo Results Framework
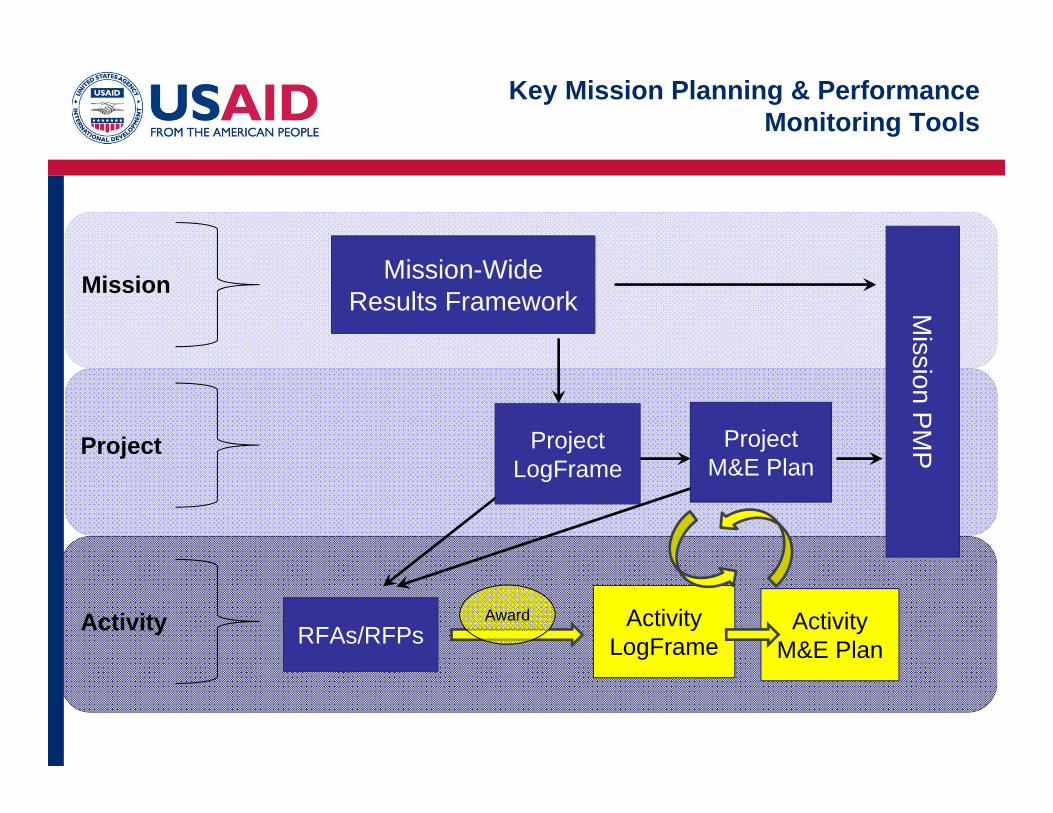
Key Mission Planning & Performance Monitoring Tools
Mission
Project
Activity
Mission-Wide Results Framework
RFAs/RFPs
Mission P
MPProject
M&E Plan
Activity LogFrame
Award Activity M&E Plan
Project LogFrame

CDCS: Farmers’ IncomeGoal: 200,000 farmers increase income by 20%
PD: North West Region’s Apricot Farmers IncomeGoal: 50,000 apricot smallholders increase income by 10%
Solicitation & Post-Award: North West Region’s Apricot Farmers’ crop yieldGoal: 50,000 apricot smallholders increase yield by 10%
Implementation: Price of Apricots from the North West RegionGoal: 50,000 apricot smallholders receive price increase of 15%
The Story of an Indicator

Project Goal
Project Result #1
Sub‐Result Sub‐Result
Activity Goal
Activity Purpose
Sub‐Purpose Sub‐Purpose
Outputs Outputs
InputsInputs
Project Result #2
Project Logical Framework Activity Logical Framework
Performance Indicator(s)
Performance Indicator(s)
Performance Indicator(s)
Performance Indicator(s)
Linking Logical Frameworksto Performance Indicators
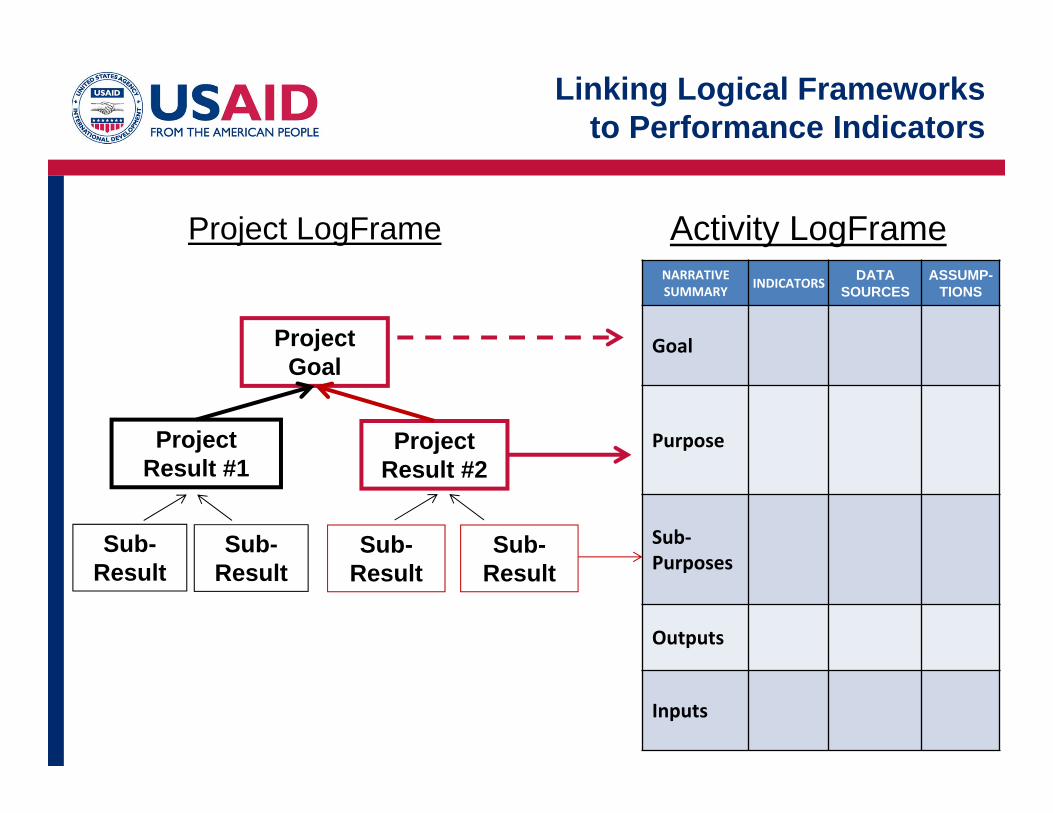
Linking Logical Frameworksto Performance Indicators
O u t p u t s
Project Goal
Project Result #1
Project Result #2
Project Goal
Project Purpose
Sub-Purpose(s)
Project LogFrame Activity LogFrame
Inputs
NARRATIVE SUMMARY INDICATORS DATA
SOURCESASSUMP-
TIONS
Goal
Purpose
Sub‐Purposes
Outputs
Inputs
Sub-Result
Sub-Result
Sub-Result
Sub-Result

An Example LogFrame
NARRATIVE SUMMARY INDICATORS DATA SOURCES ASSUMPTIONS
Goal: Inclusive economic growth from agriculture increased
% change in the contribution of key commodities to agric. GDP
Commodity platform reports
Commodity prices not too volatile
Purpose: Increased income of male and female smallholder farmers in NE region
EOPS: % increase in per capita household expenditures of USG targeted beneficiaries
FTF baseline CPRs
Macroecon. (I.Rate (inflation) stability
Sub‐Purpose 1: Increased agricultural productivity of male and female smallholder farmers in NE region
Gross margins per hectare of key commodities in targeted region
Impact evaluation
Real producer prices do not decline
Outputs: • M/F smallholder famers have increased knowledge on commercial farming and on‐farm climate change risk reducing practices ∙ New market‐tested technologies developed∙ Climate change vulnerability assessment completedInputs: Training farmers, TA for research, vulnerability assessment, seeds & fertilizer for testing new tech.
Average score from training participants on quality of the training course.‐# of farmers trained in new farming tech.‐# of key commodity technologies under development as a result of USG assistance‐# of recs for climate change adaptation from vulnerability assessment tested.
Project Activity reports
The Climate Change vulnerability assessment identifies viable opportunities for climate change adaptation
Sub‐Purpose 2: Increased access to markets x% increase in the $ value of export of key commodities by end of project
National statistics
New market linkages result in ↑ sales
Outputs: • Buyer facilitation and training provided∙Market information system facilitation deliveredInputs: TA & equipment for info systems, TA & resources to train buyers, and convene and promote buyers’ network
‐# info. system recommendations produced‐# stakeholders convened to assess information system weaknesses‐# buyer contacts made‐# buyers trained
Project Activity reports
Buyers willing to participate in training & perceive benefits of organizing in networks
Sub‐Purpose 3: Improved access to support services X% increase in the # of farmers/value chain actors accessing support services by 2016
Activity reports
Interest rates remain stable
Outputs: • Service providers trained to improve outreach service quality∙ Farmers’ networks facilitated∙ Financial institutions supported to develop products, i.d. clients, improve financial literacy
‐# of advisory service providers receiving USG assistance to improve service delivery capacity ‐# of farmer orgs receiving USG assistance‐$ value of credit guarantee extended
Activity reports
Increased credibility of farmers’ groups will build farmers’ trust in them
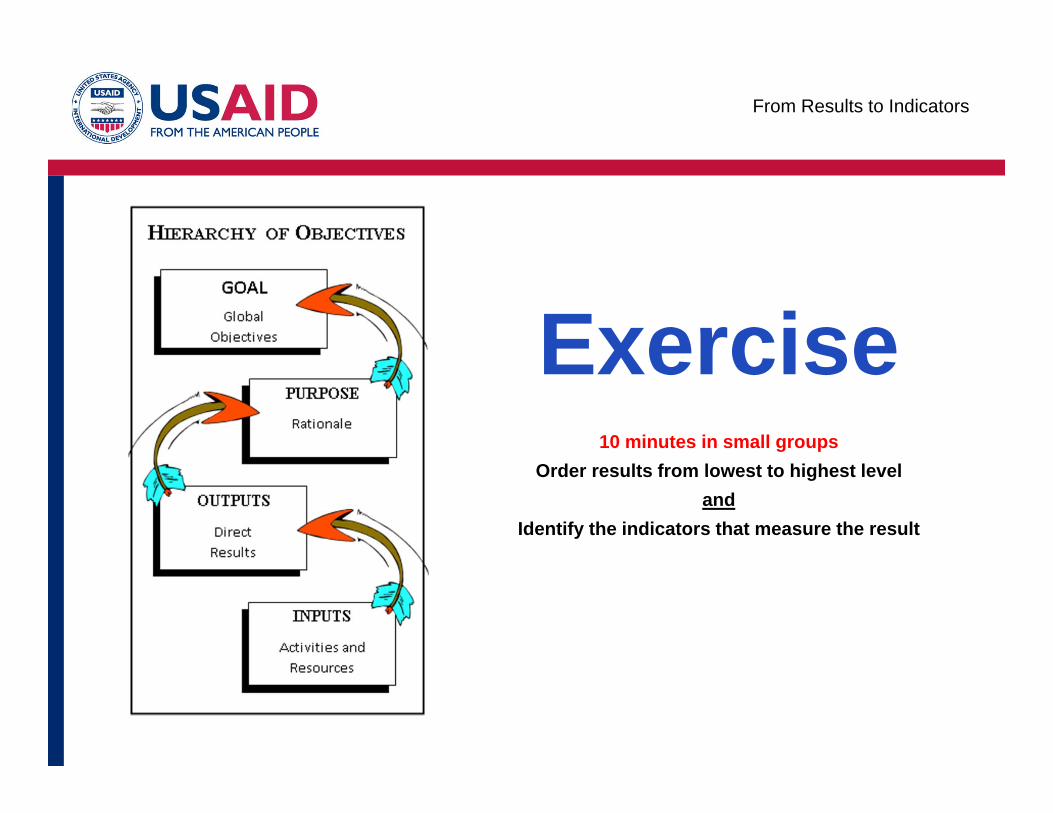
Exercise10 minutes in small groups
Order results from lowest to highest level and
Identify the indicators that measure the result
From Results to Indicators

Results to Indicator Exercise
Inclusive economic growth from agriculture increased
Gross margins per hectare of key commodities in targeted region
% change in contribution of key commodities to agricultural GDP
% of targeted beneficiaries applying new farming technology
Average change between pre-test and post-test score on information about new farming technology
Number of farmers in targeted areas applying new farming technology
% change in per capita household expenditures of USG targeted beneficiaries
Results Statements Indicators
Number of farmers trained in new farming technology
Average score from training participants on quality of the training course
Smallholder farmer income increased in NE region
Increased productivity for key commodities
Increased adoption of new technologies
Improved knowledge of new farming technology
Smallholder farmers trained in new farming technology

Mechanism Level Mission Portfolio Level
Activities Projects Strategies
Performance Monitoring
Session 3Developing Effective Indicators
September 2014

1) 1-3 indicators per result• That are appropriate in scope and scale
2) Apply quality standards
3) Balance considerations of cost and utility • Utility=usefulness for decision-making• Trade-off between the quality of data needed and
resources required to collect and analyze data
4) Select and adapt indicators from existing sources, if feasible. Don’t adapt USAID mandated indicators
Guidelines for SelectingPerformance Indicators
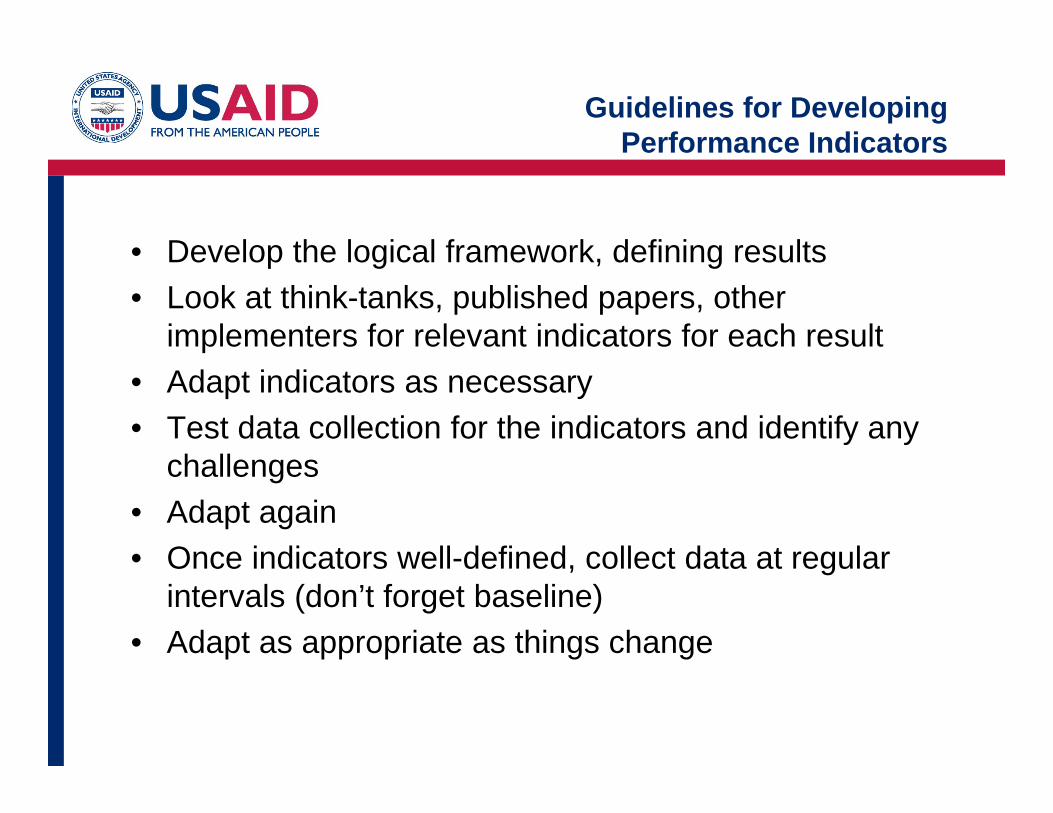
• Develop the logical framework, defining results• Look at think-tanks, published papers, other
implementers for relevant indicators for each result• Adapt indicators as necessary• Test data collection for the indicators and identify any
challenges• Adapt again • Once indicators well-defined, collect data at regular
intervals (don’t forget baseline)• Adapt as appropriate as things change
Guidelines for DevelopingPerformance Indicators

Result Basic Education Strengthened
What are the strengths/weaknesses of each indicator?
Hours teachers have devoted to reading skills over the past month
Improvement in students’ reading test scores
Indicator Exercise
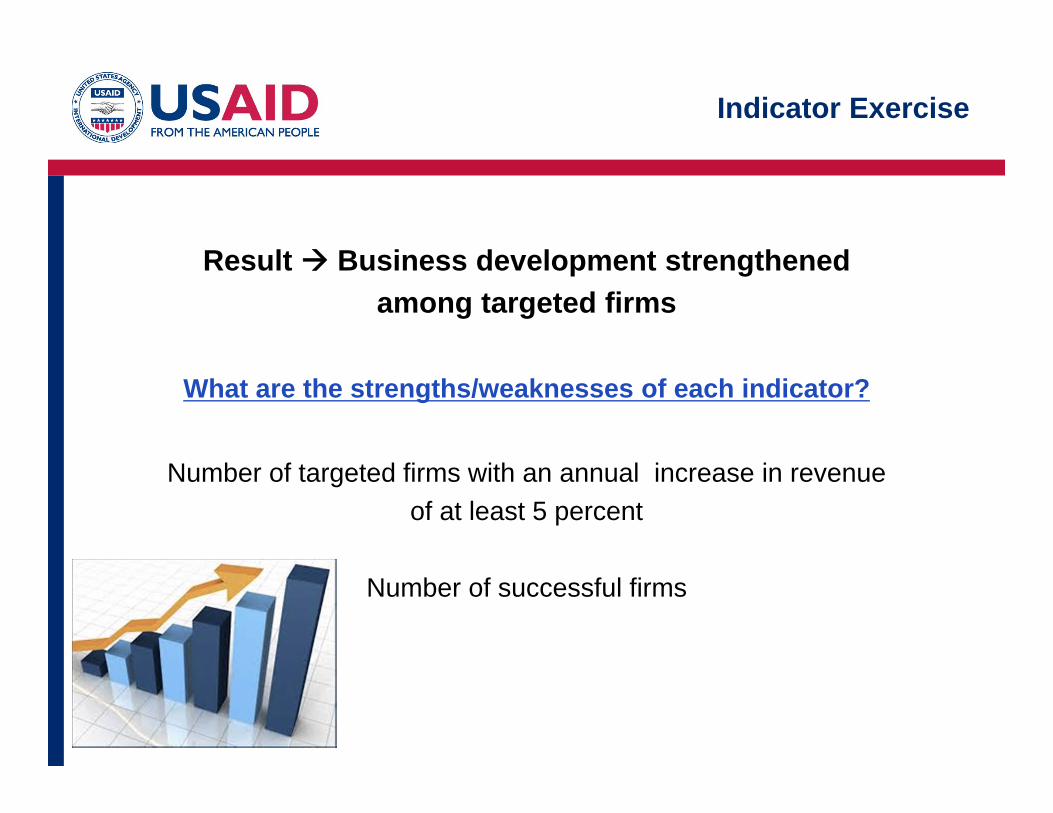
Result Business development strengthened among targeted firms
What are the strengths/weaknesses of each indicator?
Number of targeted firms with an annual increase in revenue of at least 5 percent
Number of successful firms
Indicator Exercise

Result Increased Transparency of Key Public Sector Institutions
What are the strengths/weaknesses of each indicator?
The passage of the Freedom of Information Act (FOIA)
Number of regulatory processes changed as a result of input during public hearings
Indicator Exercise
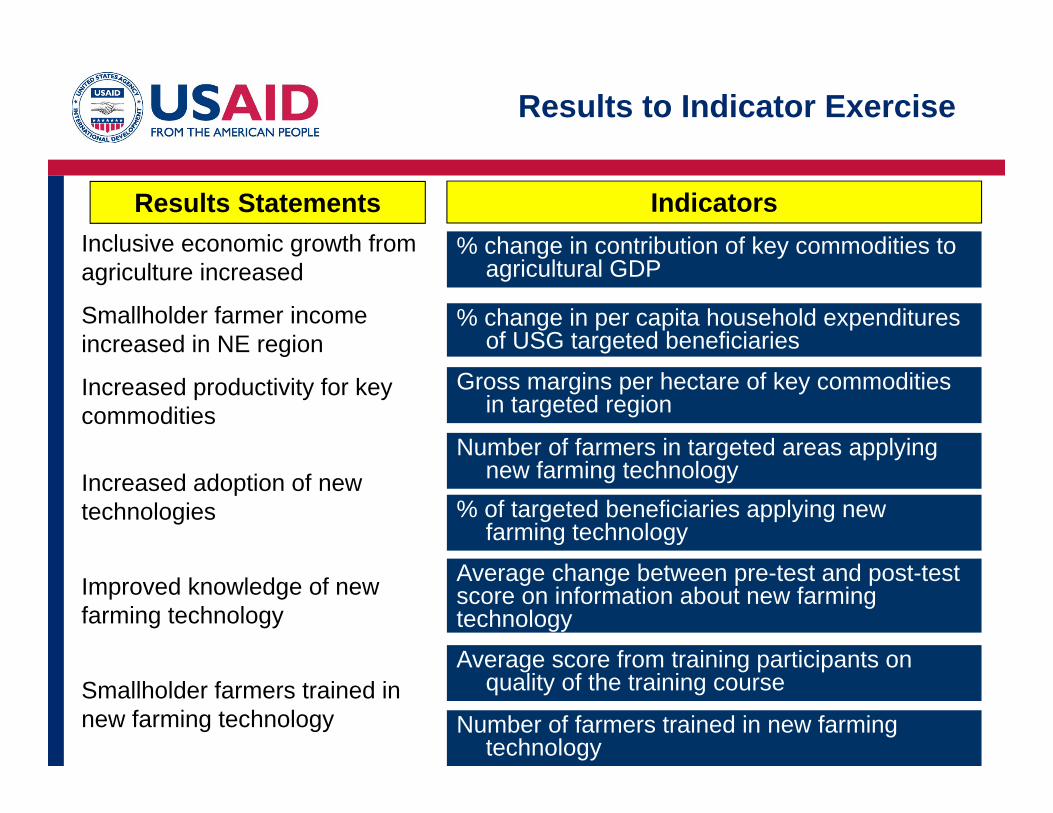
Results to Indicator Exercise
Inclusive economic growth from agriculture increased
Gross margins per hectare of key commodities in targeted region
% change in contribution of key commodities to agricultural GDP
% of targeted beneficiaries applying new farming technology
Average change between pre-test and post-test score on information about new farming technology
Number of farmers in targeted areas applying new farming technology
% change in per capita household expenditures of USG targeted beneficiaries
Results Statements Indicators
Number of farmers trained in new farming technology
Average score from training participants on quality of the training course
Smallholder farmer income increased in NE region
Increased productivity for key commodities
Increased adoption of new technologies
Improved knowledge of new farming technology
Smallholder farmers trained in new farming technology
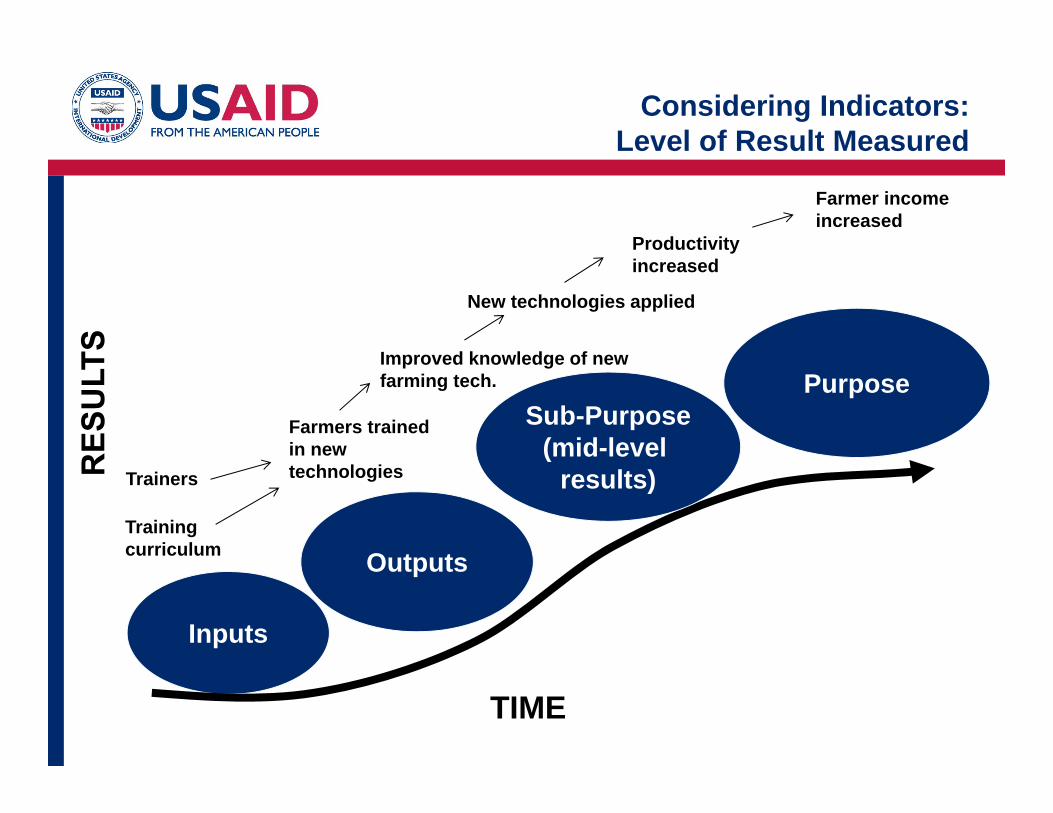
Considering Indicators:Level of Result Measured
Inputs
Outputs
TIME
Sub-Purpose(mid-level
results)
Purpose
Farmer income increased
New technologies applied
Farmers trained in new technologiesTrainers
Training curriculum
Improved knowledge of new farming tech.
Productivity increased
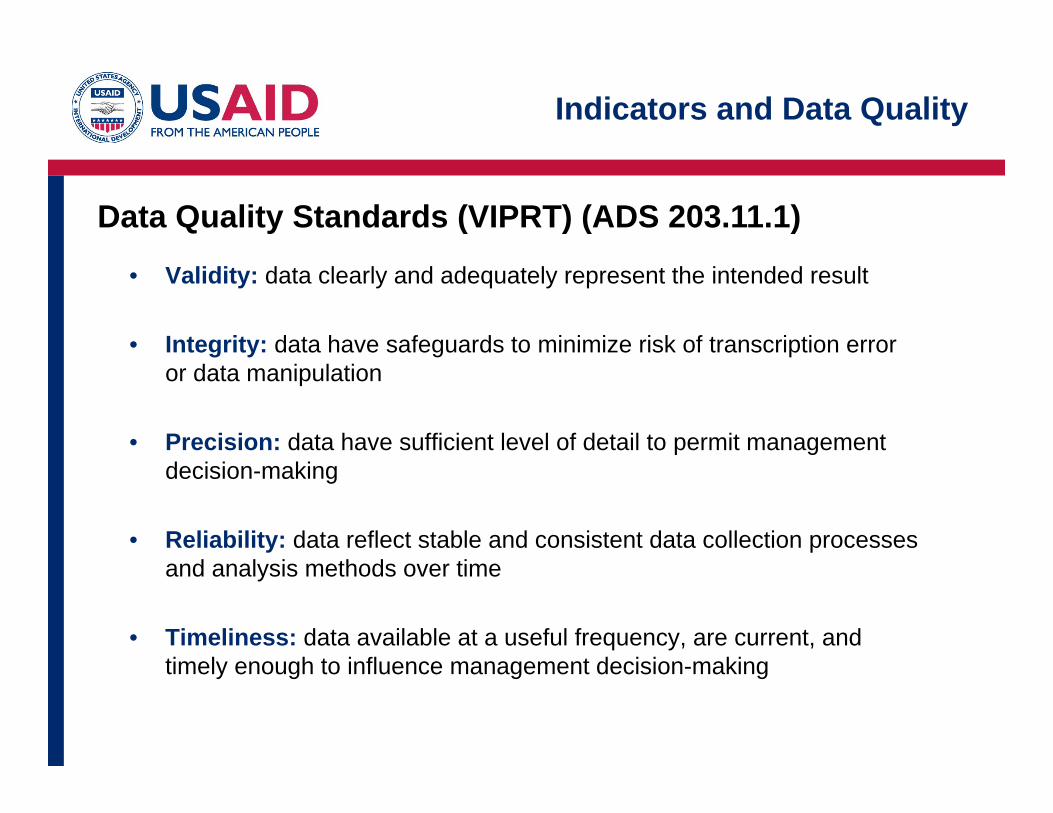
• Validity: data clearly and adequately represent the intended result
• Integrity: data have safeguards to minimize risk of transcription error or data manipulation
• Precision: data have sufficient level of detail to permit management decision-making
• Reliability: data reflect stable and consistent data collection processes and analysis methods over time
• Timeliness: data available at a useful frequency, are current, and timely enough to influence management decision-making
Indicators and Data Quality
Data Quality Standards (VIPRT) (ADS 203.11.1)

The indicator “# of houses in the target community with tin roofs” is being used to measure “increased household income in target community.” However, in this community there is no clear relationship between tin roofs and household income.
Indicator# of houses with tin roofs in the target
community
ResultIncreased household income
in target community
Discuss: What are the potential data quality issues?
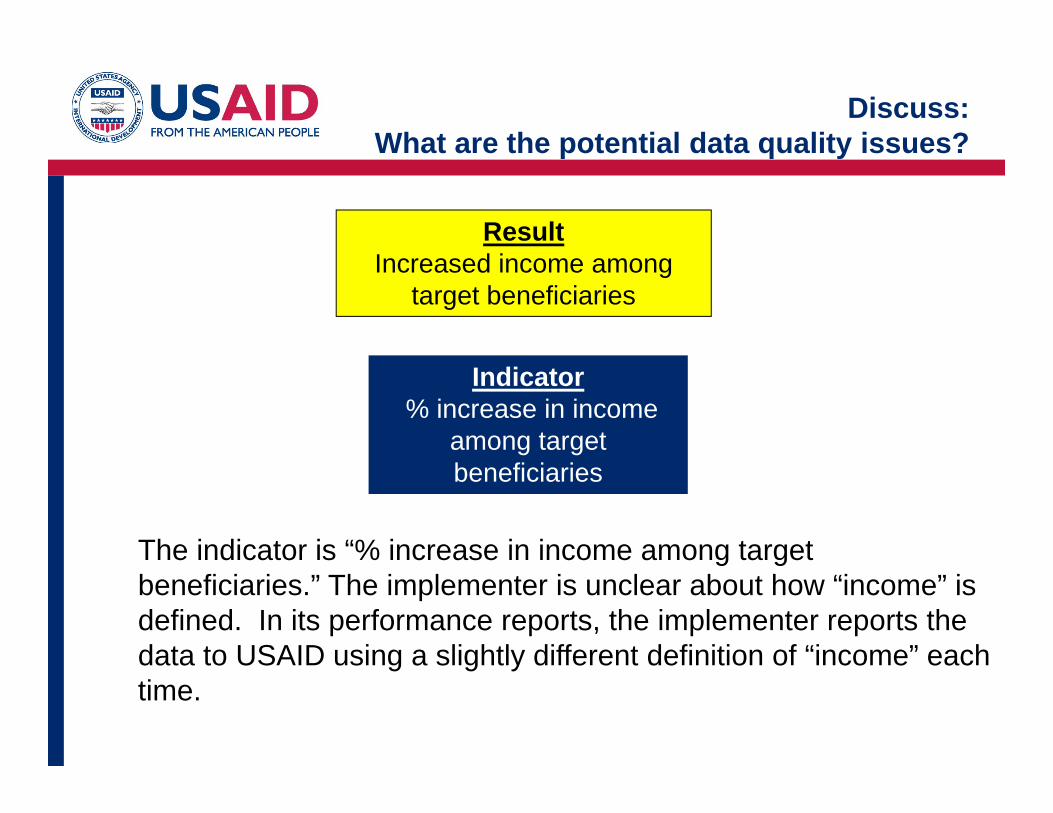
The indicator is “% increase in income among target beneficiaries.” The implementer is unclear about how “income” is defined. In its performance reports, the implementer reports the data to USAID using a slightly different definition of “income” each time.
Indicator% increase in income
among target beneficiaries
ResultIncreased income among
target beneficiaries
Discuss: What are the potential data quality issues?
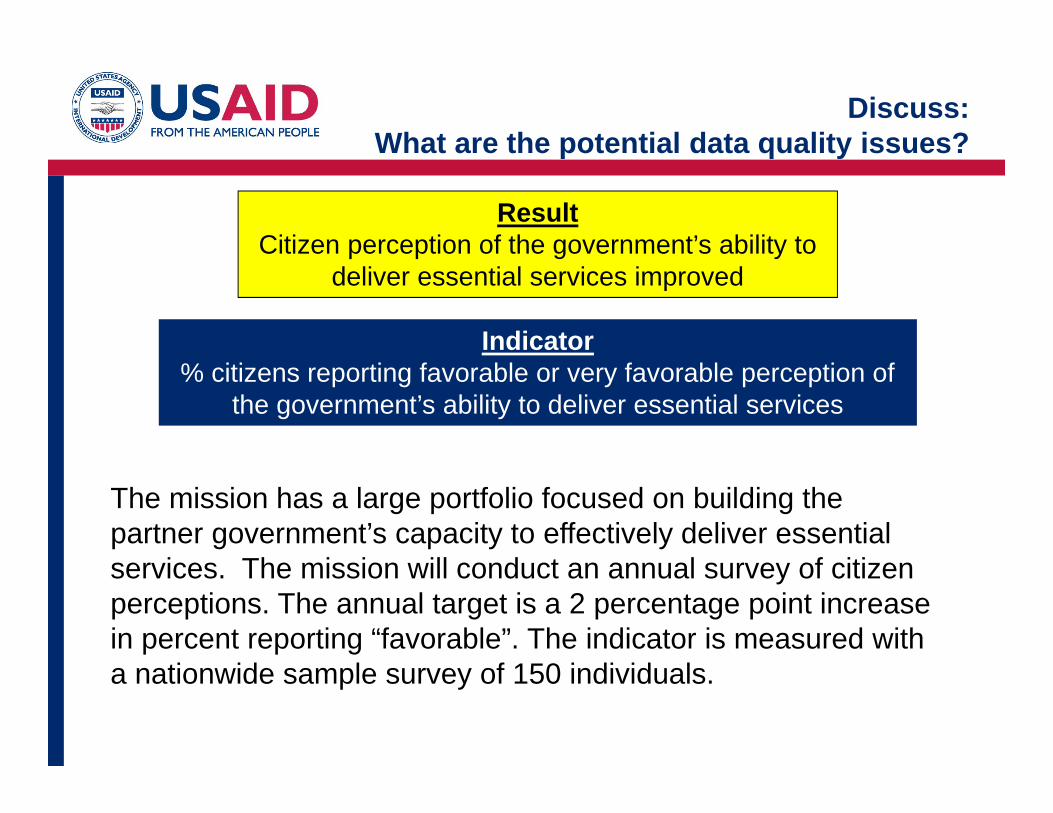
Indicator% citizens reporting favorable or very favorable perception of
the government’s ability to deliver essential services
ResultCitizen perception of the government’s ability to
deliver essential services improved
The mission has a large portfolio focused on building the partner government’s capacity to effectively deliver essential services. The mission will conduct an annual survey of citizen perceptions. The annual target is a 2 percentage point increase in percent reporting “favorable”. The indicator is measured with a nationwide sample survey of 150 individuals.
Discuss: What are the potential data quality issues?
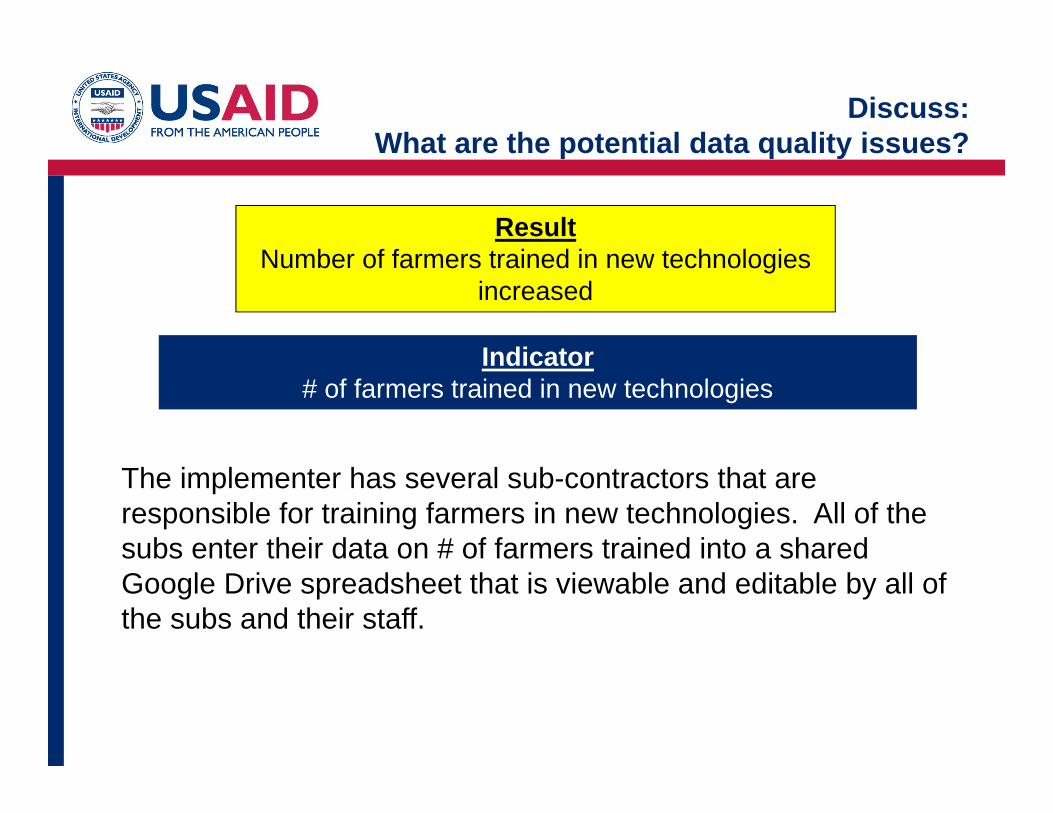
Indicator# of farmers trained in new technologies
ResultNumber of farmers trained in new technologies
increased
The implementer has several sub-contractors that are responsible for training farmers in new technologies. All of the subs enter their data on # of farmers trained into a shared Google Drive spreadsheet that is viewable and editable by all of the subs and their staff.
Discuss: What are the potential data quality issues?
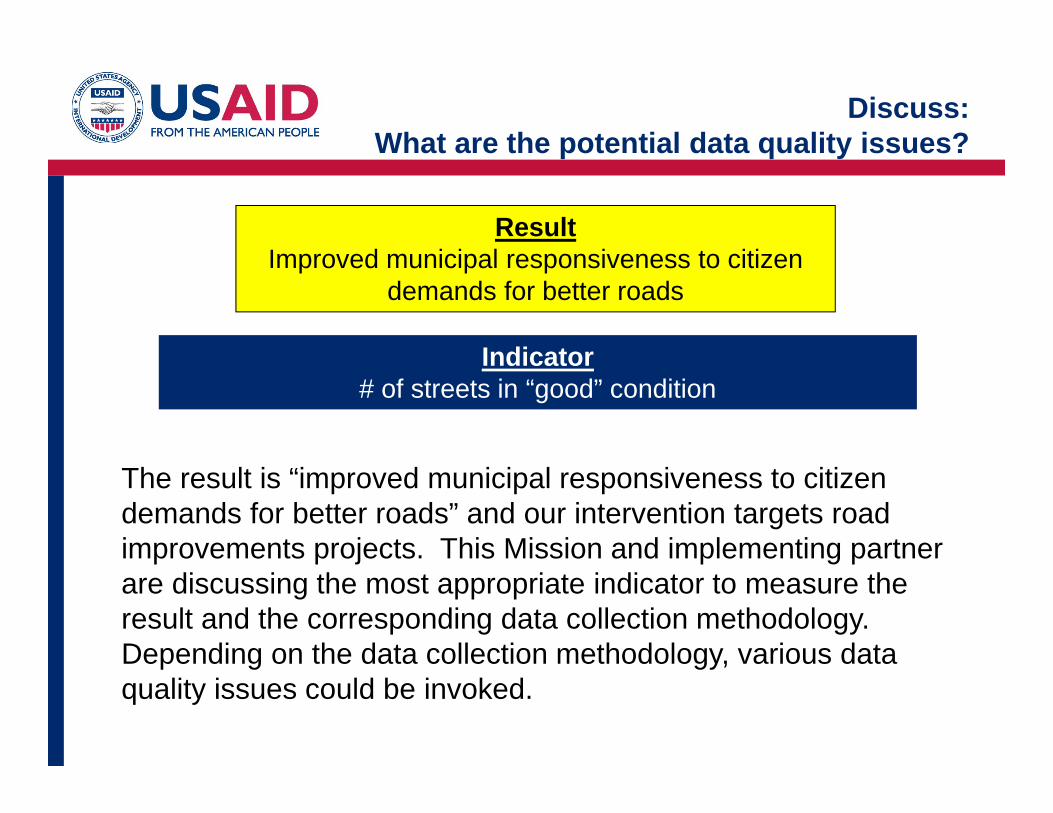
Indicator# of streets in “good” condition
ResultImproved municipal responsiveness to citizen
demands for better roads
The result is “improved municipal responsiveness to citizen demands for better roads” and our intervention targets road improvements projects. This Mission and implementing partner are discussing the most appropriate indicator to measure the result and the corresponding data collection methodology. Depending on the data collection methodology, various data quality issues could be invoked.
Discuss: What are the potential data quality issues?
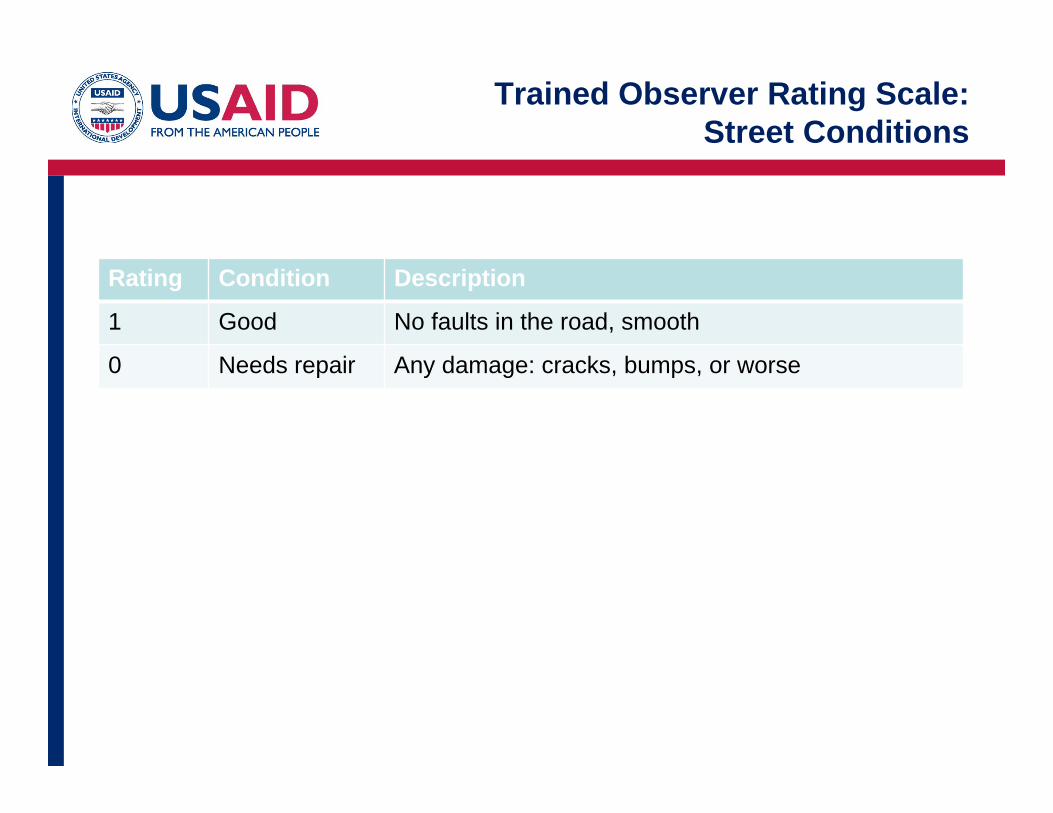
Trained Observer Rating Scale: Street Conditions
Rating Condition Description
1 Good No faults in the road, smooth
0 Needs repair Any damage: cracks, bumps, or worse

Photographic Rating Scale: Street Conditions

Photographic Rating Scale: Street Conditions

Trained Observer Rating Scale: Street Conditions
Rating Condition Description
1 Excellent Recently completed work, no faults, smooth
2 Good Recently completed work, normal wear, small cracks
3 Fair (upper) Slight damage, minor cracks need filling or some leveling would help
4 Fair (lower) Bumpy. Numerous minor cracks, easily visible bumps.
5 Poor Considerably bumpy. At least one section of the street is broken. Potholes present. Needs repair.
6 Very Poor Multiple potholes and breaks. Needs reconstruction.
7 Dangerous Potential safety hazard or cause of severe jolt. One or more large potholes, or other major defects three and a half inches high or deep.

Cost
Indicator selection is always a balance between: • The quantity and
quality needed for management decisions, and
• The resources required to collect and analyze those indicators
Utility
Need to consider how useful your selected indicators are for management at the relevant level of decision making.
Balance Cost and Utility
High quality is not all that matters! (ADS 203.3.6)

• 5%-10% of a project budget is the budget suggested for M&E. Sufficient resources are needed to increase the sophistication and increased monitoring presence
M&E Budget
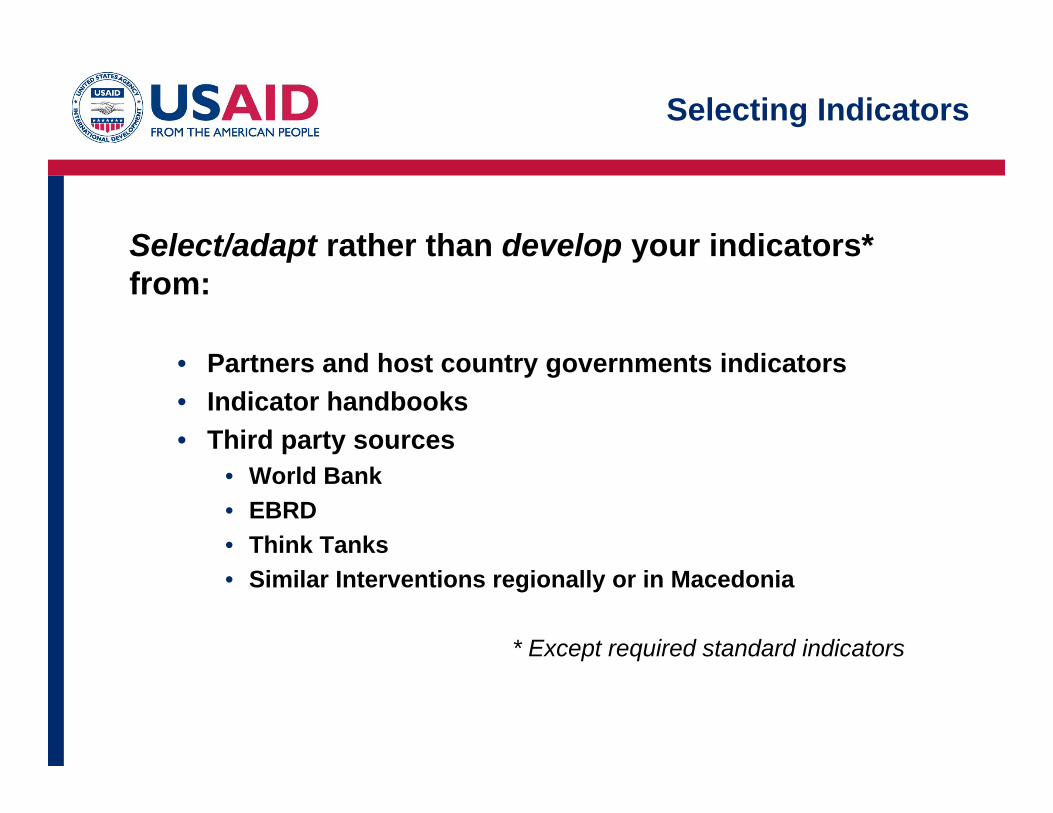
Select/adapt rather than develop your indicators* from:
• Partners and host country governments indicators• Indicator handbooks • Third party sources
• World Bank• EBRD• Think Tanks• Similar Interventions regionally or in Macedonia
* Except required standard indicators
Selecting Indicators

• ADS 205 – Integrating Gender Equality and Female Empowerment in USAID’s Program Cycle
• Performance monitoring– Collect appropriate sex-disaggregated data– Need sex-disaggregated baselines and targets– Develop indicators to track changes in key gender gaps from
baseline to end line
• Beyond Disaggregation– Disadvantaged groups should be considered in how the
program might effect them.
Gender-Sensitive Indicators
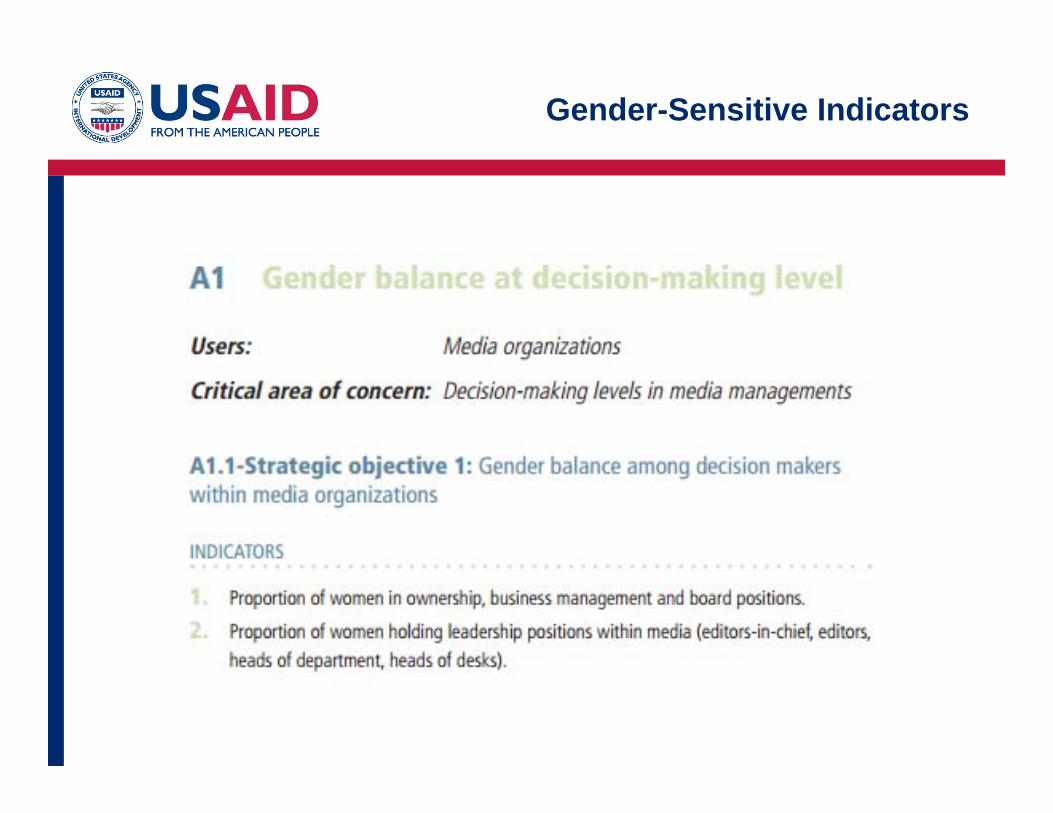
Gender-Sensitive Indicators

• Country Context. Relevant to performance of projects –macroeconomic, social, political considerations
• Assumptions. General condition that must hold true in order to achieve results– E.g. elections will take place, decentralization will proceed as scheduled,
permissive security situation will continue in implementation areas
• Game-Changers. Newly introduced element or factor that changes an existing context or project in a significant way– E.g. new natural resource discoveries
• Risk. A condition that could negatively influence program outcomes.– E.g. inability to monitor activities in conflict areasDocument!
Context Indicators: Can be used to measure/track
Exercise10 minutes individually20 minutes in groups
• Individually- critique the results framework provided. Consider indicators that you might add or revise.
• As a group discuss your revisions an be prepared to provide 2-3 recommendations to the class.
From Results to Indicators
Session 4Best Practices and Useful Tools
Performance Monitoring
September 2014
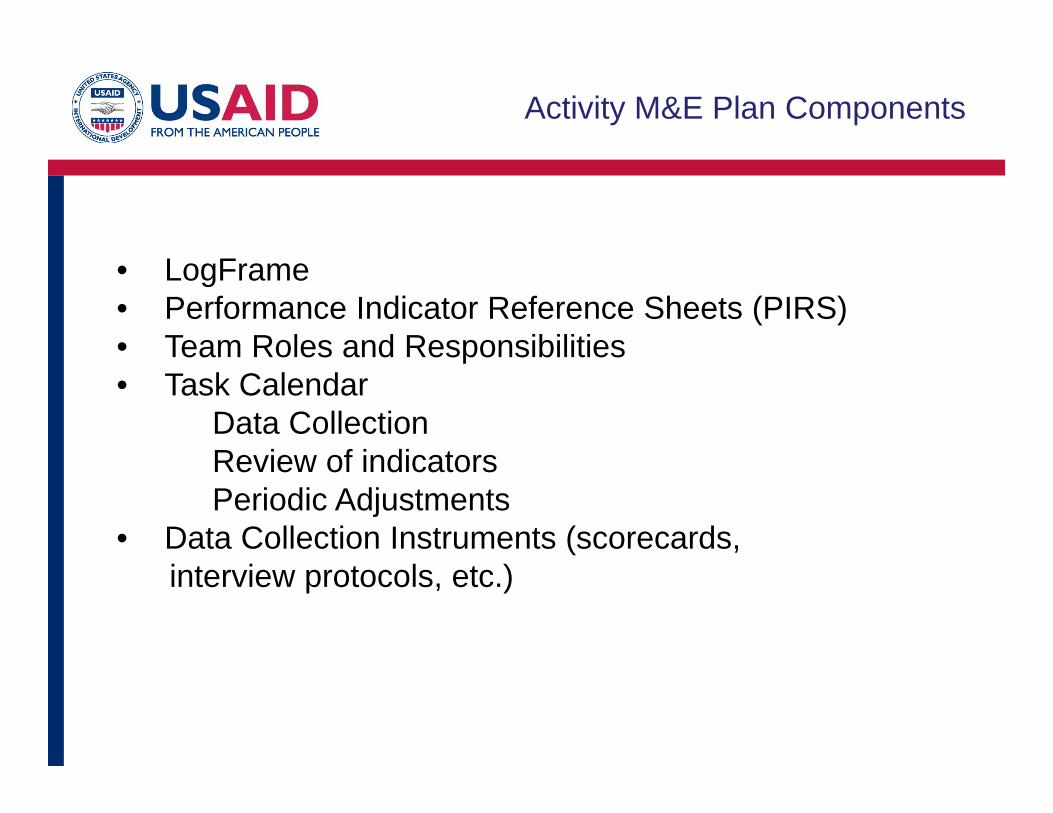
Activity M&E Plan Components
• LogFrame• Performance Indicator Reference Sheets (PIRS)• Team Roles and Responsibilities• Task Calendar
Data CollectionReview of indicatorsPeriodic Adjustments
• Data Collection Instruments (scorecards, interview protocols, etc.)
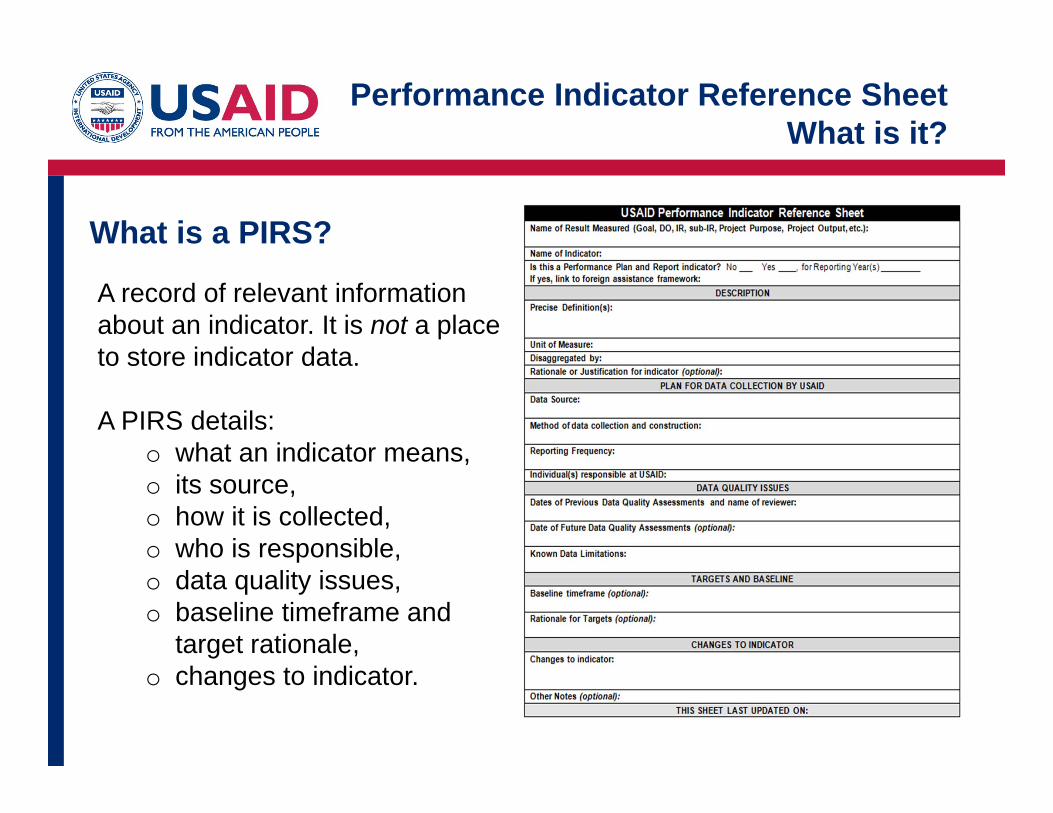
Performance Indicator Reference Sheet What is it?
What is a PIRS?
A record of relevant information about an indicator. It is not a place to store indicator data.
A PIRS details:o what an indicator means, o its source, o how it is collected,o who is responsible, o data quality issues,o baseline timeframe and
target rationale,o changes to indicator.

Why use a PIRS?
• Clarity in indicator definition, methodology, responsibilities
• Consistency in data collection and use across USAID staff and IPs
• Transparency and documentation in decision-making around indicator selection and indicator changes
• Collaboration between USAID and partners to collect the data we want and need
• Higher quality data!
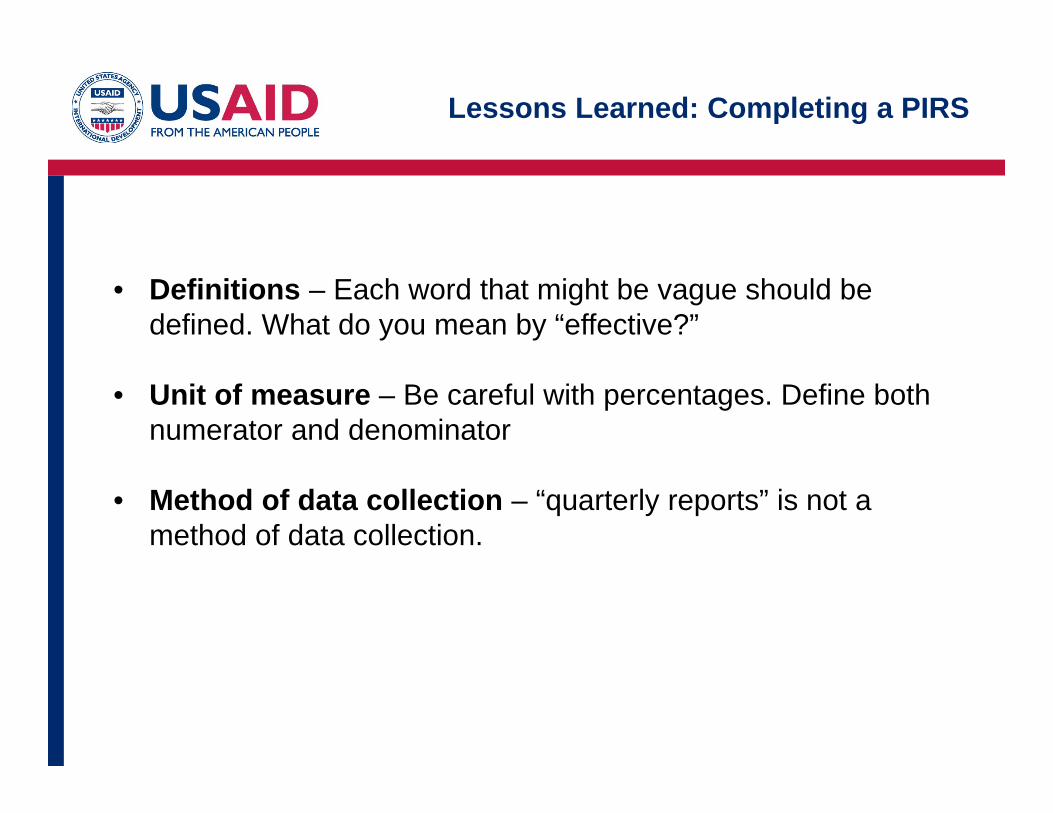
• Definitions – Each word that might be vague should be defined. What do you mean by “effective?”
• Unit of measure – Be careful with percentages. Define both numerator and denominator
• Method of data collection – “quarterly reports” is not a method of data collection.
Lessons Learned: Completing a PIRS

Setting Baselines for Performance Indicators
What is a baseline? • First measurement of an indicator
• Conducted prior to delivery of project outputs
• Include baseline timeframe in the PIRS
• Uses the same measurement method and data source that will be throughout the life of your activity/project, as specified in the PIRS
• Baselines also needed for disaggregations

Baseline is already established
• Common for outcome indicators from third party sources, often for higher-level results• For example, National unemployment rate
Baseline must be collected
•Typical for project level outcome indicators•For example, average Organizational CapacityAssessment Score among Civil Society Orgs
Baselines are established on rolling basis
• Typical for outcome indicators for projects that are rolled-out across multiple sites at different times• For example, average score on pre-training test of knowledge of accounting rules.
Baseline is zero• Typical for output indicators• For example, Number of Farmers Trained on new technology.
Baseline Scenarios
Setting Baselines for Performance Indicators
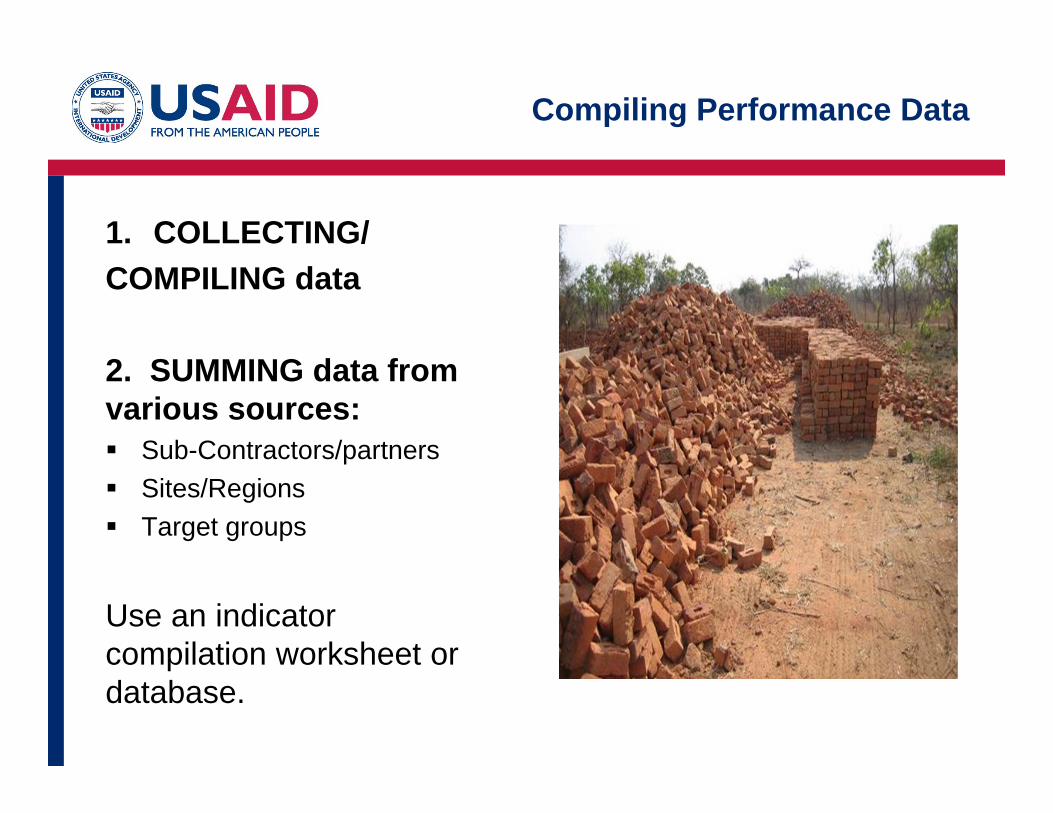
1. COLLECTING/COMPILING data
2. SUMMING data from various sources: Sub-Contractors/partners Sites/Regions Target groups
Use an indicator compilation worksheet or database.
Compiling Performance Data
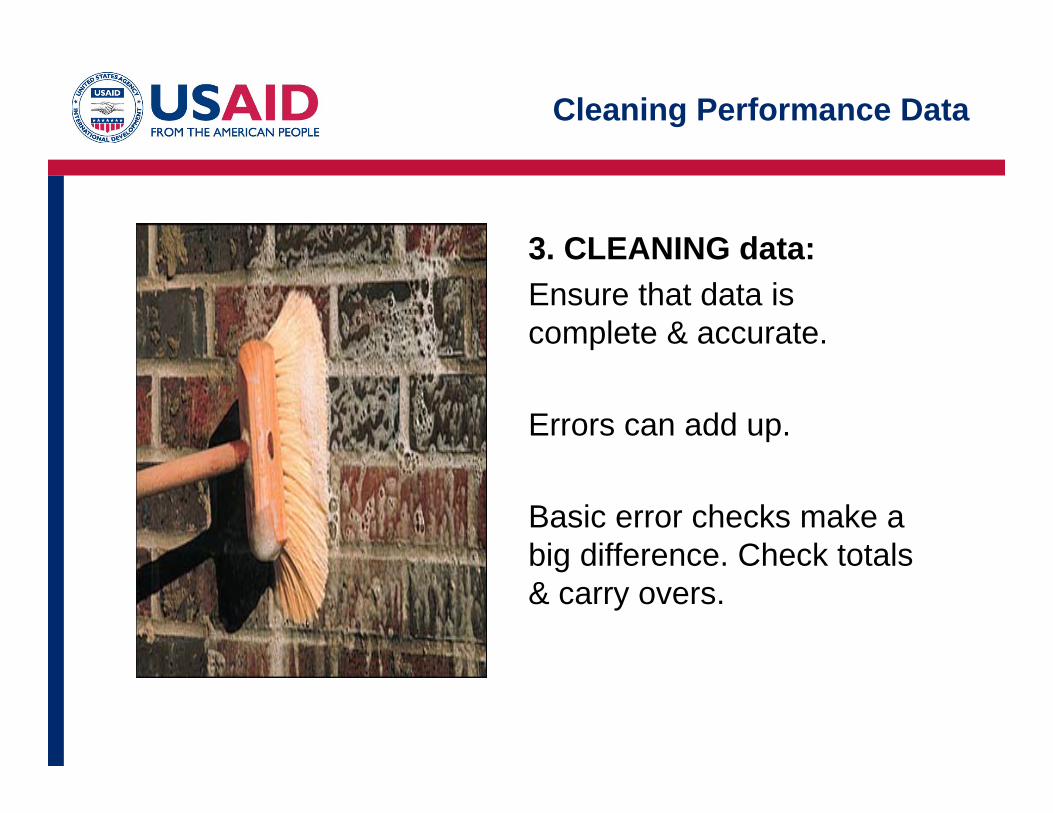
3. CLEANING data:Ensure that data is complete & accurate.
Errors can add up.
Basic error checks make a big difference. Check totals & carry overs.
Cleaning Performance Data
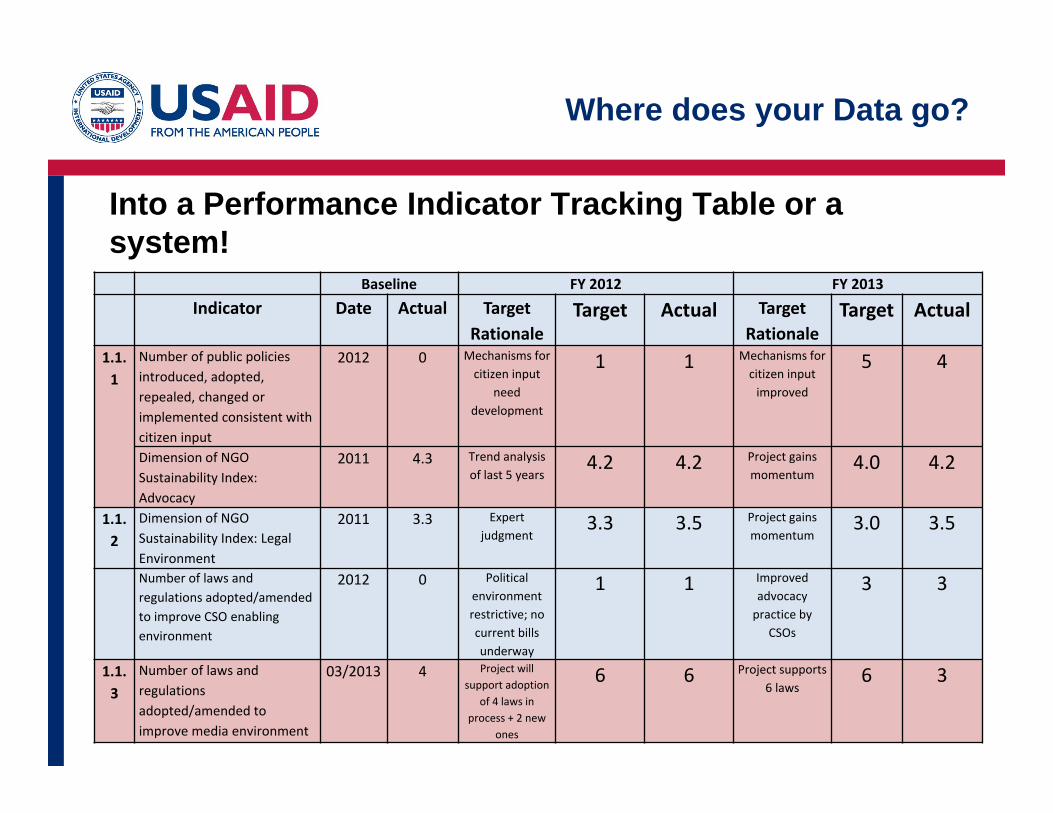
Into a Performance Indicator Tracking Table or a system!
Where does your Data go?
Baseline FY 2012 FY 2013Indicator Date Actual Target
RationaleTarget Actual Target
RationaleTarget Actual
1.1.1
Number of public policies introduced, adopted, repealed, changed or implemented consistent with citizen input
2012 0 Mechanisms for citizen input
need development
1 1 Mechanisms for citizen input improved
5 4
Dimension of NGO Sustainability Index: Advocacy
2011 4.3 Trend analysis of last 5 years
4.2 4.2 Project gains momentum
4.0 4.2
1.1.2
Dimension of NGO Sustainability Index: Legal Environment
2011 3.3 Expert judgment
3.3 3.5 Project gains momentum
3.0 3.5
Number of laws and regulations adopted/amended to improve CSO enabling environment
2012 0 Political environment restrictive; no current bills underway
1 1 Improved advocacy practice by
CSOs
3 3
1.1.3
Number of laws and regulations adopted/amended to improve media environment
03/2013 4 Project will support adoption
of 4 laws in process + 2 new
ones
6 6 Project supports 6 laws
6 3

Performance Management TaskSchedules – What are they?
• The Task Schedule can include:
A tool to plan and track the organization’s performance management tasks
• Data collection & analysis• Data quality assessments • M&E update and revision• Evaluation design &
implementation tasks
• Dissemination of performance information
• Learning opportunities
• Task schedule can be organized by task, date, responsible officer, or by another organizing principle
*Consider What Works Best for your Organization*
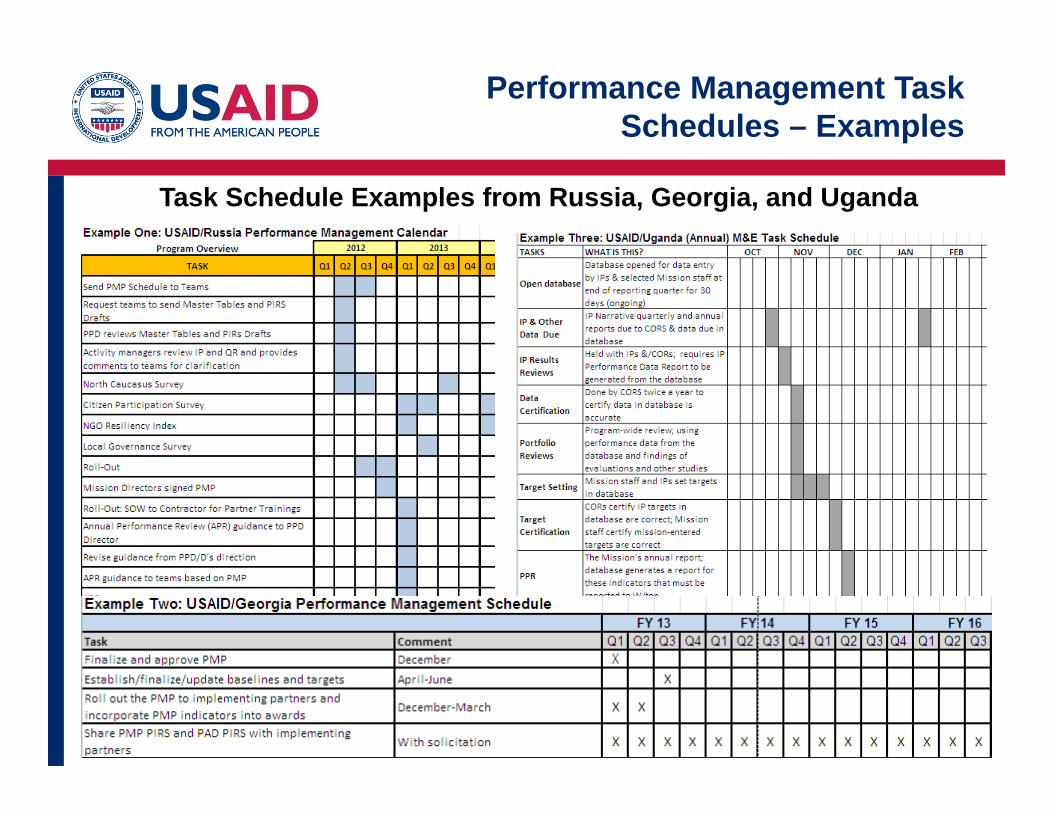
Performance Management Task Schedules – Examples
Task Schedule Examples from Russia, Georgia, and Uganda

A process to:• Verify the quality of the data collected
• Identify strengths and weaknesses of data
• Determine extent to which data integrity can be trusted to inform management decisions
Data Quality Assessment

• Validity: data clearly and adequately represent the intended result
• Integrity: data have safeguards to minimize risk of transcription error or data manipulation
• Precision: data have sufficient level of detail to permit management decision-making
• Reliability: data reflect stable and consistent data collection processes and analysis methods over time
• Timeliness: data available at a useful frequency, are current, and timely enough to influence management decision-making
Indicators and Data Quality
Data Quality Standards (VIPRT) (ADS 203.11.1)

USAID’s Steps in Conducting DQAs
• Review indicator definition in PIRS
• Review data collection methodology
• Verify partners collect the data according to the methodology
• Review implementing partner’s files/records against the methodology for data collection
• Visit the site where data is stored
• Document discrepancies and other concerns
• Summarize significant limitations in PIRS
• Prepare a plan of action to address the limitations
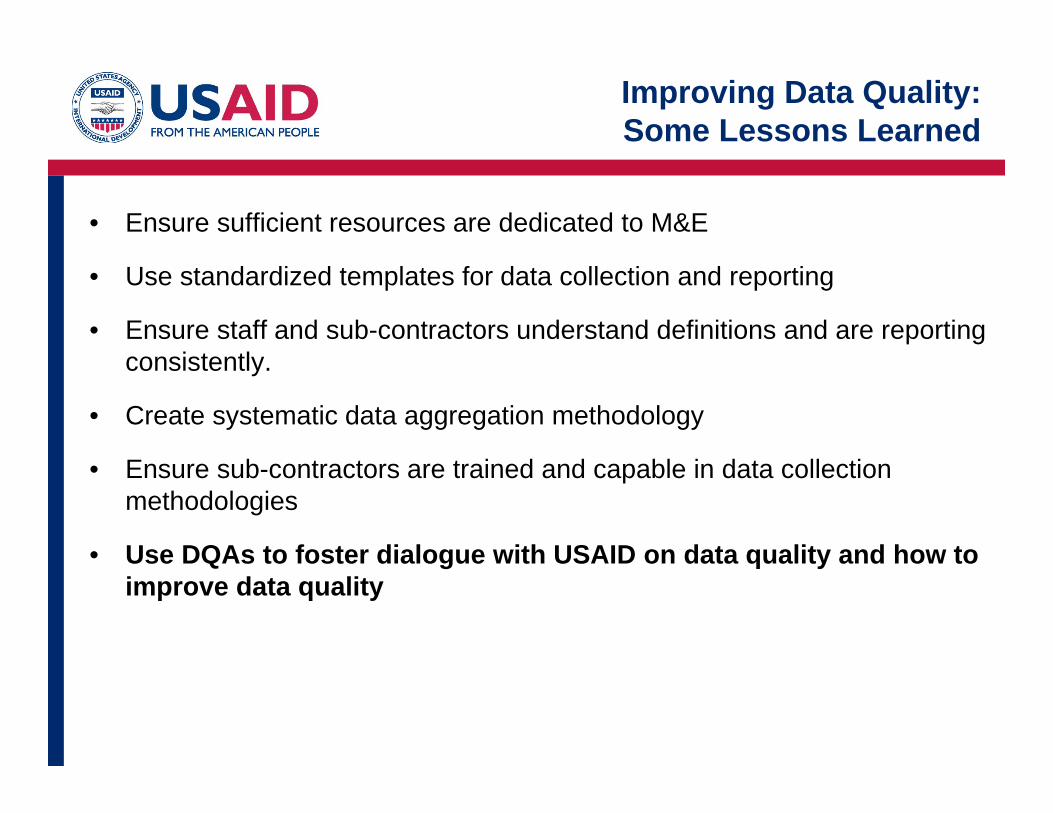
• Ensure sufficient resources are dedicated to M&E
• Use standardized templates for data collection and reporting
• Ensure staff and sub-contractors understand definitions and are reporting consistently.
• Create systematic data aggregation methodology
• Ensure sub-contractors are trained and capable in data collection methodologies
• Use DQAs to foster dialogue with USAID on data quality and how to improve data quality
Improving Data Quality: Some Lessons Learned

Checking In

Session 5Analyzing and Using Data
September 2014
Performance Monitoring

Managing the design, collection, storage, analysis, and use of performance monitoring and evaluation.
• Monitoring data should inform decision making.
• Management decisions are also based on findings from evaluation, collaboration, and learning.
Performance Management

Using data in your work (for performance management):
• Day-to-day oversight?
• Periodic reviews of your organization’s strategy?
• Ongoing learning?
Performance Management
Data Analysis
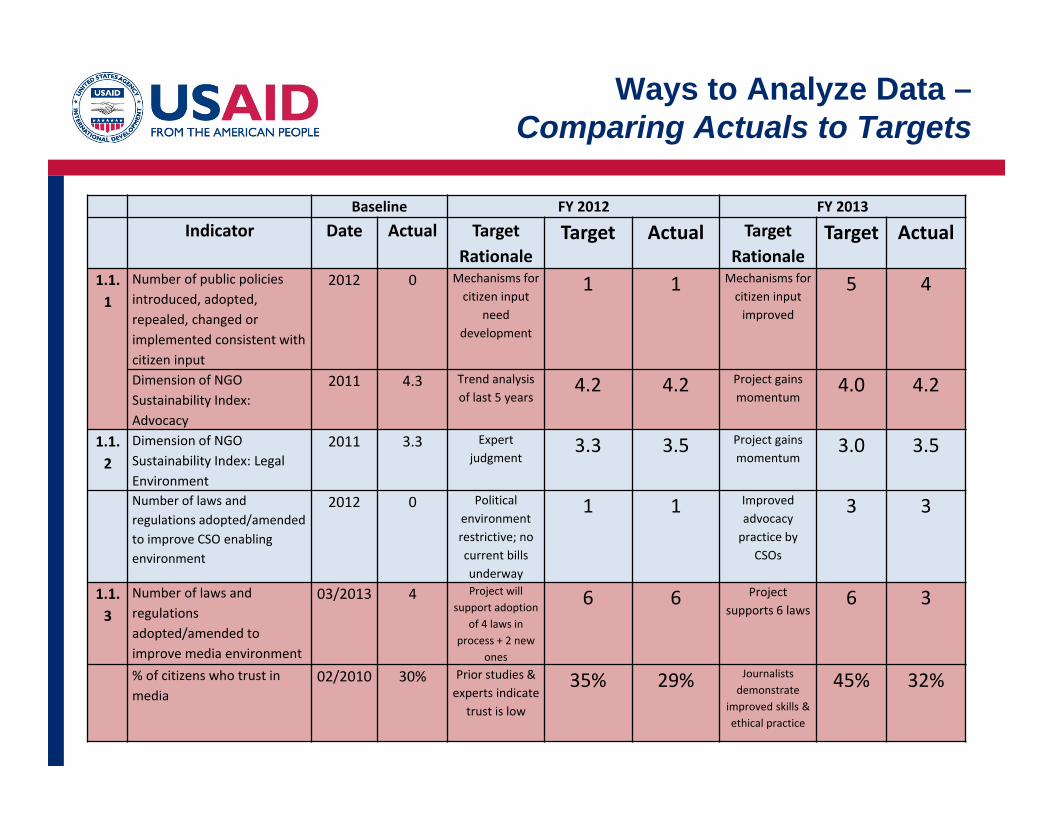
Ways to Analyze Data –Comparing Actuals to Targets
Baseline FY 2012 FY 2013Indicator Date Actual Target
RationaleTarget Actual Target
RationaleTarget Actual
1.1.1
Number of public policies introduced, adopted, repealed, changed or implemented consistent with citizen input
2012 0 Mechanisms for citizen input
need development
1 1 Mechanisms for citizen input improved
5 4
Dimension of NGO Sustainability Index: Advocacy
2011 4.3 Trend analysis of last 5 years
4.2 4.2 Project gains momentum
4.0 4.2
1.1.2
Dimension of NGO Sustainability Index: Legal Environment
2011 3.3 Expert judgment
3.3 3.5 Project gains momentum
3.0 3.5
Number of laws and regulations adopted/amended to improve CSO enabling environment
2012 0 Political environment restrictive; no current bills underway
1 1 Improved advocacy practice by
CSOs
3 3
1.1.3
Number of laws and regulations adopted/amended to improve media environment
03/2013 4 Project will support adoption
of 4 laws in process + 2 new
ones
6 6 Project supports 6 laws
6 3
% of citizens who trust in media
02/2010 30% Prior studies & experts indicate
trust is low
35% 29% Journalists demonstrate
improved skills & ethical practice
45% 32%

0
50
100
150
200
250
300
350
2006 2007 2008 2009 2010 2011 2012
Target
Actual
Program expected to wined down
TeachersTrained
Low target for program ramp-up
Program implementationstarted later than projected in year
Demand For Program Exceeds Expectations
Program Funds are depleted early due to very successful program
Analyzing Performance DataComparing Actuals to Targets

Disaggregation
Expose differences between Geographical Location Index Component Political/Administrative Unit Beneficiary Group
(i.e. sex, age, income, urban/rural, socio-cultural orethnic background, language, assistance received)
Analyzing Performance Data

Analyzing Performance Data:Disaggregation
Improvements by Type of Respondent
Annual % Change in Sales by Location and Year

Looking for Patterns
Compare PM data with
• Other indicators for the same result
• Context indicators• Other geographical areas• International & national standards• Data from other sources (other
implementing organizations, other donors, govt)
Analyzing Performance Data

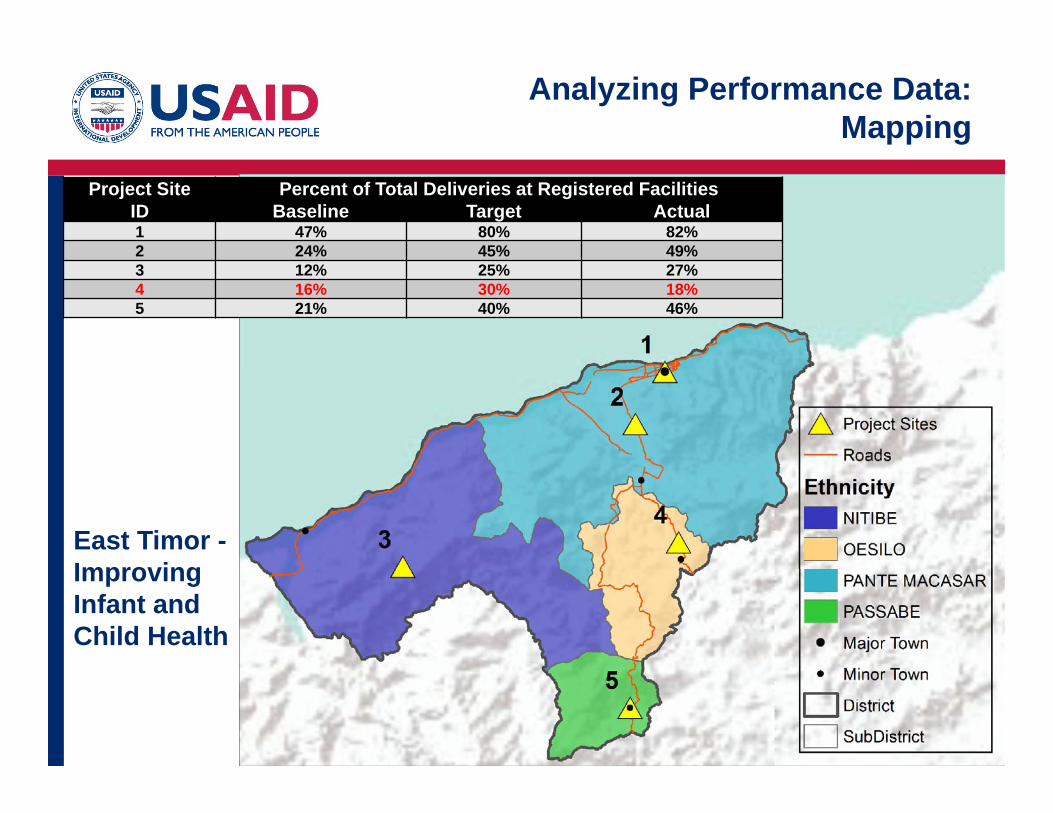
Analyzing Performance Data:Mapping
Project Site Percent of Total Deliveries at Registered FacilitiesID Baseline Target Actual1 47% 80% 82%2 24% 45% 49%3 12% 25% 27%4 16% 30% 18%5 21% 40% 46%
East Timor -Improving Infant and Child Health

Analyzing Performance Data:Mapping
Project Site Percent of Total Deliveries at Registered FacilitiesID Baseline Target Actual1 47% 80% 82%2 24% 45% 49%3 12% 25% 27%4 16% 30% 18%5 21% 40% 46%
East Timor -Improving Infant and Child Health
Analyzing Performance Data:Mapping
East Timor -Improving Infant and Child Health
Project Site Percent of Total Deliveries at Registered FacilitiesID Baseline Target Actual1 47% 80% 82%2 24% 45% 49%3 12% 25% 27%4 16% 30% 18%5 21% 40% 46%
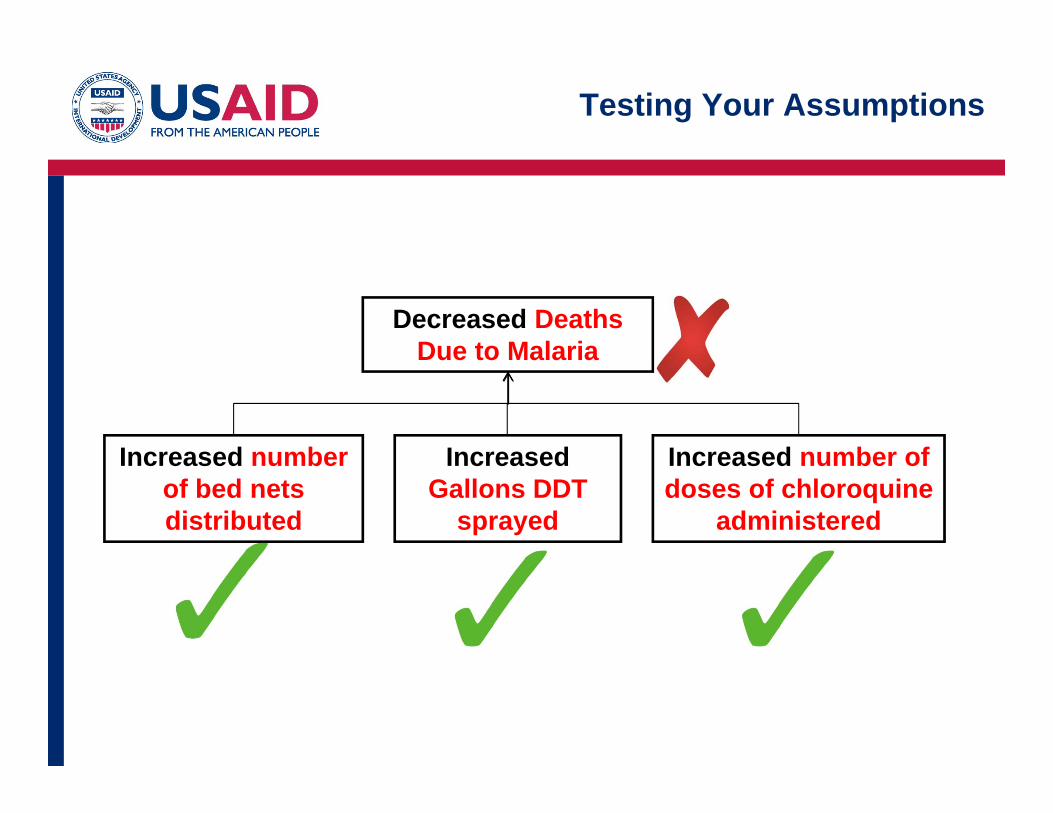
Decreased Deaths Due to Malaria
Increased number of bed nets distributed
Increased Gallons DDT
sprayed
Increased number of doses of chloroquine
administered
Testing Your Assumptions

• Re-examine causal logic of your logical framework
• Respond to identified context changes
• Engage USAID in analysis and discussions around performance trends and gaps in causal logic
• Enhance dialogue, collaboration, and coordination with stakeholders around new knowledge and learning
• Share knowledge to influence others
• Inform implementation and facilitate adaptive management
Ways to Utilize Knowledge Gained from Data Analysis

Session 6Mobile Data Collection
Performance Monitoring
September 2014

Advantages of Mobile Data Collection:
• Improved data collection speed• Increased responsiveness to changes on the ground• Reduces data collection costs• Improved accuracy/quality• Added functionality (videos,
graphics, GPS, timers)• Keep better track of
collected data• Accountability

Increased Responsiveness:
• Fix small errors in questionnaire design (typos, badly phrased questions)
• Add questions to investigate interesting findings• GPS and time stamps allow for greater supervision of
enumerators.
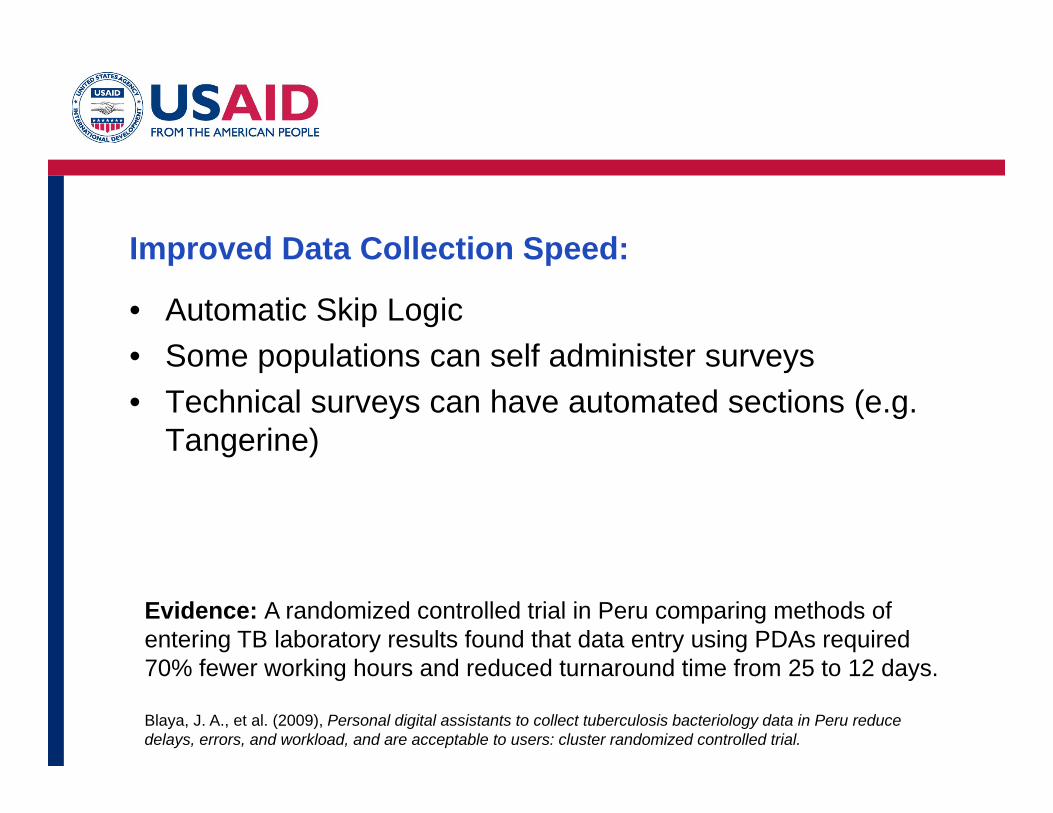
Improved Data Collection Speed:
• Automatic Skip Logic• Some populations can self administer surveys• Technical surveys can have automated sections (e.g.
Tangerine)
Evidence: A randomized controlled trial in Peru comparing methods of entering TB laboratory results found that data entry using PDAs required 70% fewer working hours and reduced turnaround time from 25 to 12 days.
Blaya, J. A., et al. (2009), Personal digital assistants to collect tuberculosis bacteriology data in Peru reduce delays, errors, and workload, and are acceptable to users: cluster randomized controlled trial.

Lower Cost of Data Collection:
• No need for data transcription • No printing costs (but still print a few)• Edits easily implemented• Lower collection costs from faster surveys• Multiple translations on same device
Evidence: Proof for the cost efficiency benefits of mobile data collection is robust. A World Bank study on the question found that average interview cost was reduced by up to 71%.
Schuster, C. and Brito, C. P. (2011), Cutting costs, boosting and collecting data real-time – Lessons from a Cell Phone-Based Beneficiary Survey to Strengthen Guatemala’s Conditional Cash Transfer Program, World Bank.

Improved Data Accuracy & Quality:
• Built in Error Checking• Fewer miss-filled forms (ex: skipped to wrong bubble)• Automatically cross- reference questions• No need for transcription so no transcription errors

Added Functionality:
• Play music• Graphics and movies• GPS• Capture Pictures (farmer fields, building status)

Is ICT a good fit for my project?
Is quantitative data included in monitoring plan
Survey Repeated
More than 300 observations
Data is time sensitive
Complex Survey Logic
Multimedia tools are
useful
MDC may not be a good fit
Secondary Considerations
NO YES
Primary Considerations

What’s Required:• Skills• Hardware• Software
Available Tools:
• Hardware (Nexus Tablet ~$140USD)• Open Data Kit (ODK) – Free• Google Apps Engine – Free

Session 7Exploring the Design Space
Performance Monitoring
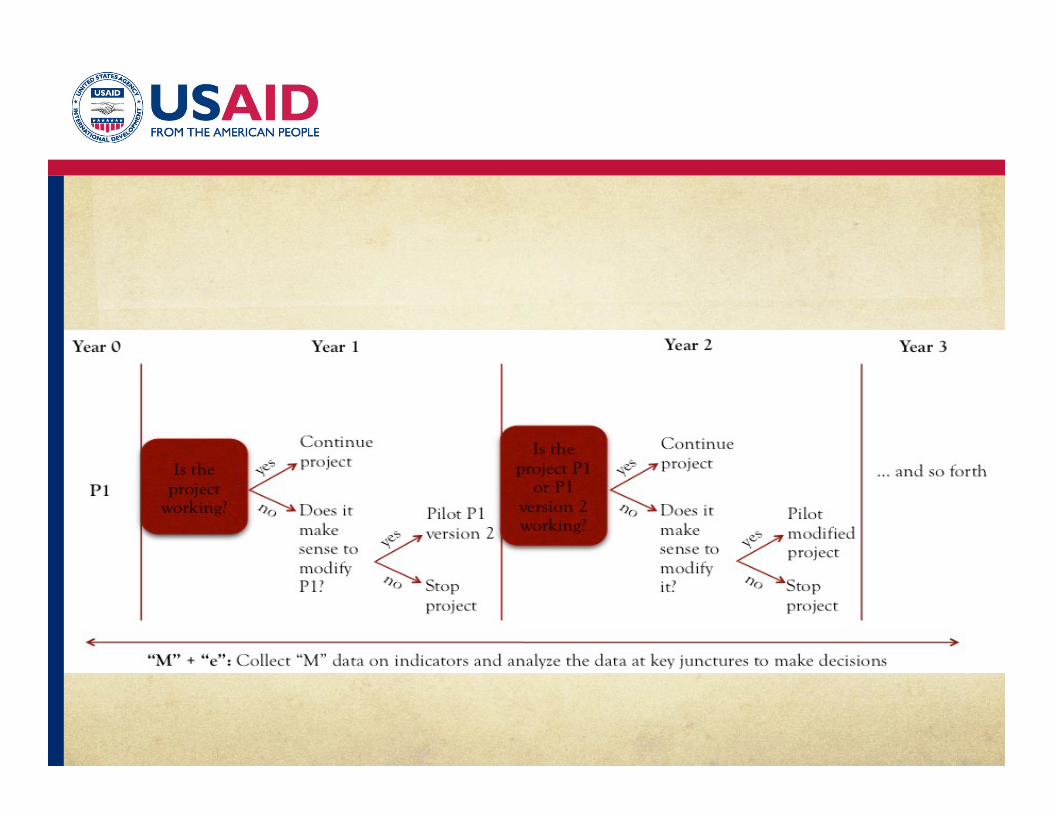

Rapid Iteration, and Continuous process improvement, Lean Manufacturing:

Advantages of exploratory learning:• No collection of data on a “no program” group required—the
comparisons are “within program/project” variants
• Ability to explore the interactions of the policy or policies with all kinds of background variables
• can explore only a tiny part of the design space (even with 5 design parameters, 2 options each, with complementarities the dimensionality blows up)
• generalization beyond places where the specific distribution of all variables that can influence the outcome is precisely the same as the original study location
Good Countries or Good Projects
• World Bank: Lending is project based and projects are structured on compliance versus learning.
• Attitude of “implementation is for dummies” undermines capability of implementation and the learning of partners.
• Individual projects are difficult to restructure or cancel outright even after early indications of problems arise.
• High frequency of projects are rated as satisfactory throughout the implementation process but are then ultimately rated as unsatisfactory upon completion.

• Kraay et al (2011) looked at over 6,000 WB projects evaluated between 1983 and 2009, in 130 developing countries to investigate macro and micro correlates of project outcomes. They find:
• 80 percent of the variation in project outcomes occurred across projects within countries.
• Project complexity (as proxied by size) is associated with worse project performance.
• Strong negative partial correlation between project length and project outcomes, with longer projects associated with significantly worse outcomes.
• When a project starts to go wrong, more resources are devoted to supervision in an effort to turn around
What to varyMultiple viable concepts in similar space (when are their options and cost is low, try both and analyzeA/B Testing