session 050 of, provider payment reform: using benchmarks … · session 50 of, provider payment...
TRANSCRIPT
Session 50 OF, Provider Payment Reform: Using Benchmarks as a Foundation for the
Future
Moderator: Gregory G. Fann, FSA, MAAA
Presenters:
Joan C. Barrett, FSA, MAAA Zachary Miller Davis, FSA, MAAA Courtney R. White, FSA, MAAA
SOA Antitrust Disclaimer SOA Presentation Disclaimer
ProviderProviderProviderProvider PaymentPaymentPaymentPayment ReformReformReformReform:::: UsingUsingUsingUsing BenchmarksBenchmarksBenchmarksBenchmarks asasasas aaaa
FoundationFoundationFoundationFoundation forforforfor thethethethe FutureFutureFutureFuture
Zach Davis FSA, MAAA
Courtney White FSA, MAAA
Joan Barrett FSA, MAAA
October 24, 2016

SOCIETY OF ACTUARIES
Antitrust Notice for Meetings
Active participation in the Society of Actuaries is an important aspect of membership. However, any Society activity that arguably could be perceived as a restraint of trade exposes the SOA and its members to antitrust risk. Accordingly, meeting participants should refrain from any discussion which may provide the basis for an inference that they agreed to take any action relating to prices, services, production, allocation of markets or any other matter having a market effect. These discussions should be avoided both at official SOA meetings and informal gatherings and activities. In addition, meeting participants should be sensitive to other matters that may raise particular antitrust concern: membership restrictions, codes of ethics or other forms of self-regulation, product standardization or certification. The following are guidelines that should be followed at all SOA meetings, informal gatherings and activities:
• DON’TDON’TDON’TDON’T discuss your own, your firm’s, or others’ prices or fees for service, or anything that might affect prices or fees, such as costs, discounts, terms of sale, or profit margins.
• DON’TDON’TDON’TDON’T stay at a meeting where any such price talk occurs.
• DON’TDON’TDON’TDON’T make public announcements or statements about your own or your firm’s prices or fees, or those of competitors, at any SOA meeting or activity.
• DON’TDON’TDON’TDON’T talk about what other entities or their members or employees plan to do in particular geographic or product markets or with particular customers.
• DON’T DON’T DON’T DON’T speak or act on behalf of the SOA or any of its committees unless specifically authorized to do so.
• DODODODO alert SOA staff or legal counsel about any concerns regarding proposed statements to be made by the association on behalf of a committee or section.
• DODODODO consult with your own legal counsel or the SOA before raising any matter or making any statement that you think may involve competitively sensitive information.
• DODODODO be alert to improper activities, and don’t participate if you think something is improper.
• If you have specific questions, seek guidance from your own legal counsel or from the SOA’s Executive Director or legal counsel.
2

Presentation Disclaimer
Presentations are intended for educational purposes only and do not replace independent professional judgment. Statements of fact and opinions expressed are those of the participants individually and, unless expressly stated to the contrary, are not the opinion or position of the Society of Actuaries, its cosponsors or its committees. The Society of Actuaries does not endorse or approve, and assumes no responsibility for, the content, accuracy or completeness of the information presented. Attendees should note that the sessions are audio-recorded and may be published in various media, including print, audio and video formats without further notice.
3
Overview – Provider Benchmarking
Why do we need benchmarking
Introduction to benchmarking
Access to data
Provider Benchmarking From The Stakeholder’s Point of View
Case study
4

Why Now?
5

CMS Initiatives
• Vision: Transform HealthVision: Transform HealthVision: Transform HealthVision: Transform Health
• Overall goalsOverall goalsOverall goalsOverall goals• Better care
• Smarter spending
• Healthier people
• Primary focusPrimary focusPrimary focusPrimary focus• Incentives
• Care delivery
• Information sharing
• Specific targetsSpecific targetsSpecific targetsSpecific targets• CMS Managed Care Categories
• Category 1—fee-for-service with no link of payment to quality
• Category 2—fee-for-service with a link of payment to quality
• Category 3—alternative payment models built on fee-for-service architecture
• Category 4—population-based payment
• 85% of fee-for-service payments are tied to quality or value by 2016 and 90% by 2018 (Category 2-4)
• 30% of Medicare payments are tied to quality or value through alternative payment models by the end of 2016 and 50% by 2018 (Category 3-4)
6
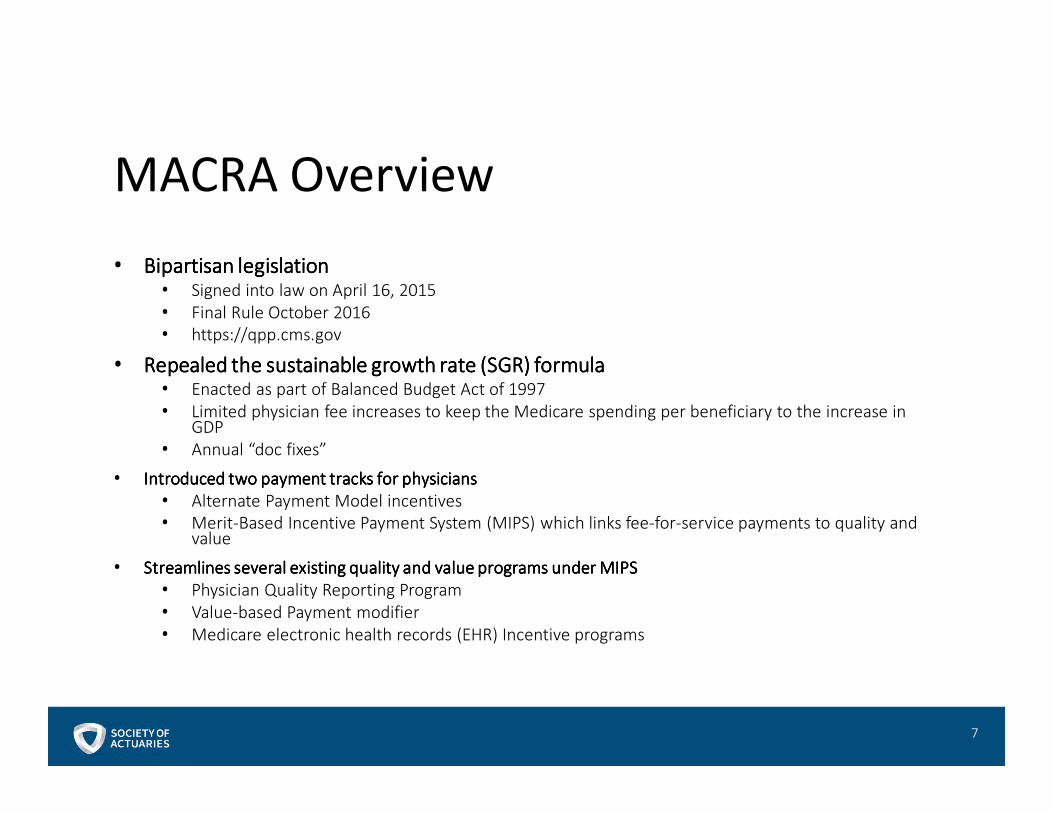
MACRA Overview
• Bipartisan legislation Bipartisan legislation Bipartisan legislation Bipartisan legislation • Signed into law on April 16, 2015
• Final Rule October 2016
• https://qpp.cms.gov
• Repealed the sustainable growth rate (SGR) formulaRepealed the sustainable growth rate (SGR) formulaRepealed the sustainable growth rate (SGR) formulaRepealed the sustainable growth rate (SGR) formula• Enacted as part of Balanced Budget Act of 1997
• Limited physician fee increases to keep the Medicare spending per beneficiary to the increase in GDP
• Annual “doc fixes”
• Introduced two payment tracks for physiciansIntroduced two payment tracks for physiciansIntroduced two payment tracks for physiciansIntroduced two payment tracks for physicians
• Alternate Payment Model incentives
• Merit-Based Incentive Payment System (MIPS) which links fee-for-service payments to quality and value
• Streamlines Streamlines Streamlines Streamlines several existing quality and value programs under MIPSseveral existing quality and value programs under MIPSseveral existing quality and value programs under MIPSseveral existing quality and value programs under MIPS
• Physician Quality Reporting Program
• Value-based Payment modifier
• Medicare electronic health records (EHR) Incentive programs
7

Introduction to Benchmarking
8

Degree of Healthcare ManagementLo
ose
ly m
an
age
d • Limited evidence based best practices
• Minimal incentives to manage care
• Limited use of low cost alternatives
• Some inpatient reviewW
ell
Ma
na
ged • Best practices
• Provider incentives
• Low cost alternatives
• Higher consumer awareness
9

Comparisons to Benchmark Population
Service CategoryService CategoryService CategoryService Category
Plan PBPM Plan PBPM Plan PBPM Plan PBPM
ExpendituresExpendituresExpendituresExpenditures
Well Managed Well Managed Well Managed Well Managed
PBPM ExpendituresPBPM ExpendituresPBPM ExpendituresPBPM Expenditures
Savings Savings Savings Savings
OpportunityOpportunityOpportunityOpportunity PBPMPBPMPBPMPBPM
Savings as % of Savings as % of Savings as % of Savings as % of
Service CategoryService CategoryService CategoryService Category
Savings as % of Savings as % of Savings as % of Savings as % of
Total ExpendituresTotal ExpendituresTotal ExpendituresTotal Expenditures
Inpatient Medical $ 129 $ 100 $ 28 22% 3.7%
Inpatient SurgicalInpatient SurgicalInpatient SurgicalInpatient Surgical $ 144 $ 106 $ 38 26% 5.0%
SkilledSkilledSkilledSkilled Nursing FacilityNursing FacilityNursing FacilityNursing Facility $ 105 $ 36 $ 68 65% 8.9%
All OtherAll OtherAll OtherAll Other InpatientInpatientInpatientInpatient $ 2 $ 1 $ 0 17% 0.0%
Inpatient Total $ 379 $ 244 $ 135 36% 17.6%
Loosely Managed
Benchmark
Well Managed
BenchmarkTotal Expenditures
$770 $251 PBPM (33%) $519$778 $770
10
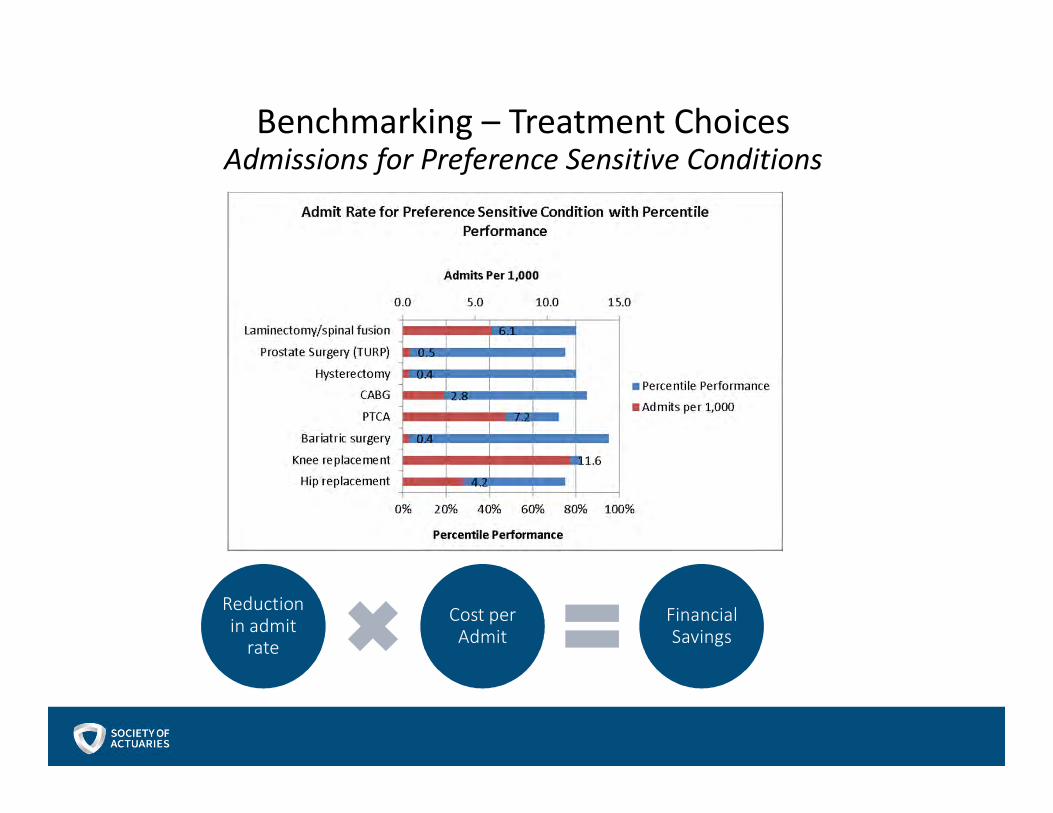
Benchmarking – Treatment ChoicesAdmissions for Preference Sensitive Conditions
Reduction in admit
rate
Cost per Admit
Financial Savings

Population Health – Data-Driven Performance Improvement
ExampleExampleExampleExample OpportunitiesOpportunitiesOpportunitiesOpportunities
ActionableActionableActionableActionable
OutcomeOutcomeOutcomeOutcome
Minimize Diabetes –
Related
Complications
Reduce Post-
Surgical Costs
Reduce Price
Variation of Elective
MRIs
SampleSampleSampleSample
InterventionsInterventionsInterventionsInterventions
Set up diabetes
registry with triggers
for outreach for
patients whose status
is unknown
Document
patient’s recovery
plan and assist
with identifying
and arranging
most appropriate
option
Require approval for
MRI and provide
pricing information
for provider as well as
prices at alternative
providers
LeadingLeadingLeadingLeading
IndicatorsIndicatorsIndicatorsIndicators
• % of patients with
recommended visit
frequencies
• % of patients
reporting
biometrics at
requested intervals
• % of patients
with
documented
recovery plan at
time of surgery
• % of patients
planning to
recover at home
• % of patients
receiving pricing
information
• % of patients
changing provider
choice
1. Benchmark Outcome
Performance
2. ID and Implement
Interventions
3. ID Leading Indicators
4. Monitor Leading
Indicators
5. Tweak Interventions
12
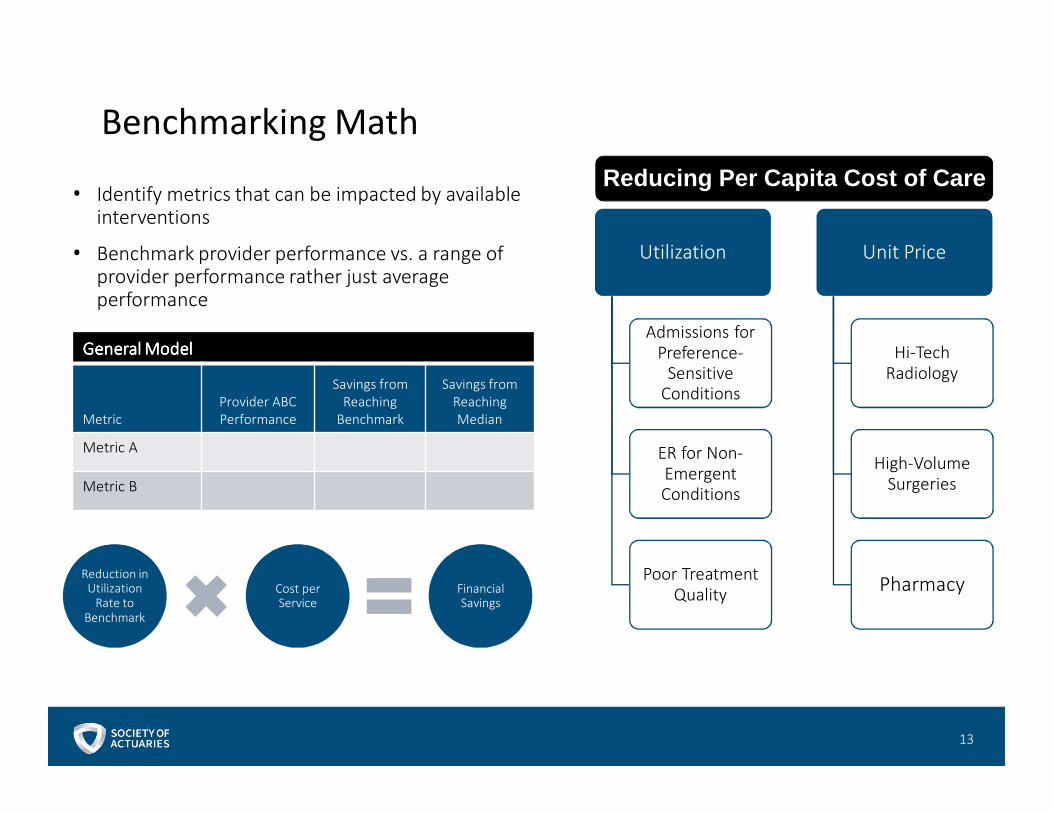
Benchmarking Math
• Identify metrics that can be impacted by available interventions
• Benchmark provider performance vs. a range of provider performance rather just average performance
Utilization
Admissions for Preference-
Sensitive Conditions
ER for Non-Emergent Conditions
Poor Treatment Quality
Unit Price
Hi-Tech Radiology
High-Volume Surgeries
Pharmacy
Reducing Per Capita Cost of Care
GeneralGeneralGeneralGeneral ModelModelModelModel
Metric
Provider ABC
Performance
Savings from
Reaching
Benchmark
Savings from
Reaching
Median
Metric A
Metric B
Reduction in Utilization
Rate to Benchmark
Cost per Service
Financial Savings
13
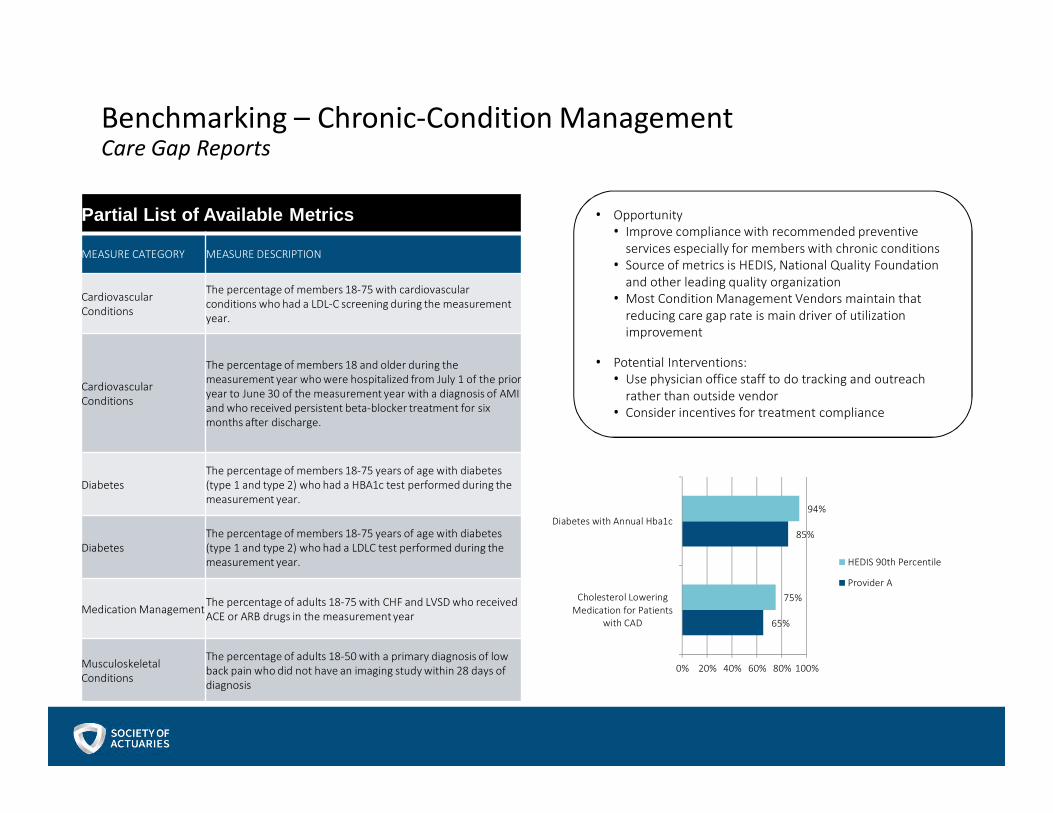
Benchmarking – Chronic-Condition Management Care Gap Reports
• Opportunity
• Improve compliance with recommended preventive
services especially for members with chronic conditions
• Source of metrics is HEDIS, National Quality Foundation
and other leading quality organization
• Most Condition Management Vendors maintain that
reducing care gap rate is main driver of utilization
improvement
• Potential Interventions:
• Use physician office staff to do tracking and outreach
rather than outside vendor
• Consider incentives for treatment compliance
Partial List of Available Metrics
MEASURE CATEGORY MEASURE DESCRIPTION
Cardiovascular
Conditions
The percentage of members 18-75 with cardiovascular
conditions who had a LDL-C screening during the measurement
year.
Cardiovascular
Conditions
The percentage of members 18 and older during the
measurement year who were hospitalized from July 1 of the prior
year to June 30 of the measurement year with a diagnosis of AMI
and who received persistent beta-blocker treatment for six
months after discharge.
Diabetes
The percentage of members 18-75 years of age with diabetes
(type 1 and type 2) who had a HBA1c test performed during the
measurement year.
Diabetes
The percentage of members 18-75 years of age with diabetes
(type 1 and type 2) who had a LDLC test performed during the
measurement year.
Medication ManagementThe percentage of adults 18-75 with CHF and LVSD who received
ACE or ARB drugs in the measurement year
Musculoskeletal
Conditions
The percentage of adults 18-50 with a primary diagnosis of low
back pain who did not have an imaging study within 28 days of
diagnosis
65%
85%
75%
94%
0% 20% 40% 60% 80% 100%
Cholesterol Lowering
Medication for Patients
with CAD
Diabetes with Annual Hba1c
HEDIS 90th Percentile
Provider A

Example – Knee Replacement Bundle
$8,400
$6,200
$2,400
$2,200
$1,200
$1,000
$6,000
$2,000
$1,000
$2,000
0
2,000
4,000
6,000
8,000
10,000
12,000
14,000
16,000
18,000
20,000
Fee For Service Well Managed
Home Health
Post Acute Care
Anesthesiologist
Surgeon
Facility
Total: $13,400
Target Price: $17,000
Total: $19,000
15

Access to Data
16

Available Data Sets
• CMS 5% sample files• Medicare population
• Wide range of data sets
• Available for a nominal fee
• Truven Health Analytics – Marketscan Database• Multiple populations
• 230 million unique patients since 2015*
• Milliman Health Cost Guidelines (“HCGs”)• Both commercial and Medicare Populations
• Other
*http://truvenhealth.com/markets/life-sciences/products/data-tools/marketscan-databases
17

Provider Benchmarking From The Stakeholder’s Point of View
18
Overview
• The StakeholdersThe StakeholdersThe StakeholdersThe Stakeholders• Consumers/Patients• Employers• Health Plans• CMS• Providers
• Key QuestionsKey QuestionsKey QuestionsKey Questions• What do they want to know?• What do they need to know?
• Types of information• Possible misinterpretations
• Analytics/Strategies• Communications
19

Consumer Attitudes on Providers
• Primary carePrimary carePrimary carePrimary care• Prioritize convenience and continuity over credentials
• Manners beat credentials
• Medical errors/missteps top reason consumers leave PCP, not competition
• SpecialistsSpecialistsSpecialistsSpecialists• Affiliation matters for some specialties (oncology but not
dermatology)
• Distance still important
• HospitalsHospitalsHospitalsHospitals• Rely on doctor’s recommendation
• Distance, neighborhood still important
20
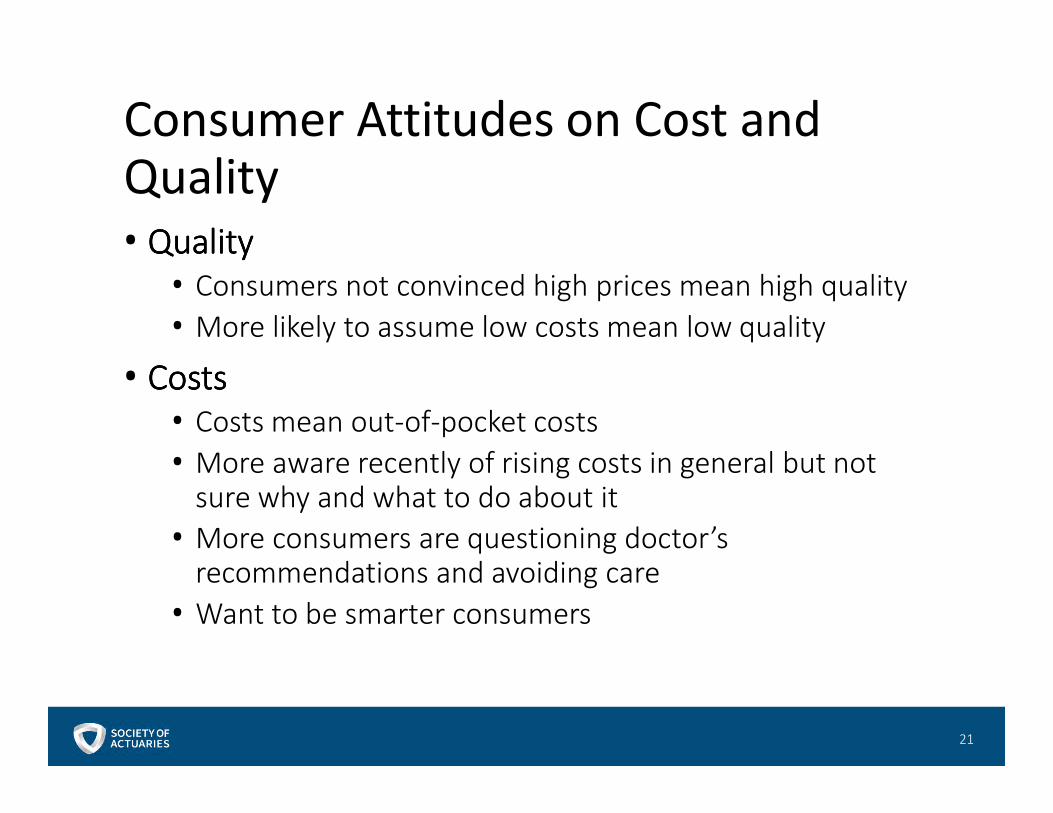
Consumer Attitudes on Cost and Quality
• QualityQualityQualityQuality• Consumers not convinced high prices mean high quality
• More likely to assume low costs mean low quality
• CostsCostsCostsCosts• Costs mean out-of-pocket costs
• More aware recently of rising costs in general but not sure why and what to do about it
• More consumers are questioning doctor’s recommendations and avoiding care
• Want to be smarter consumers
21
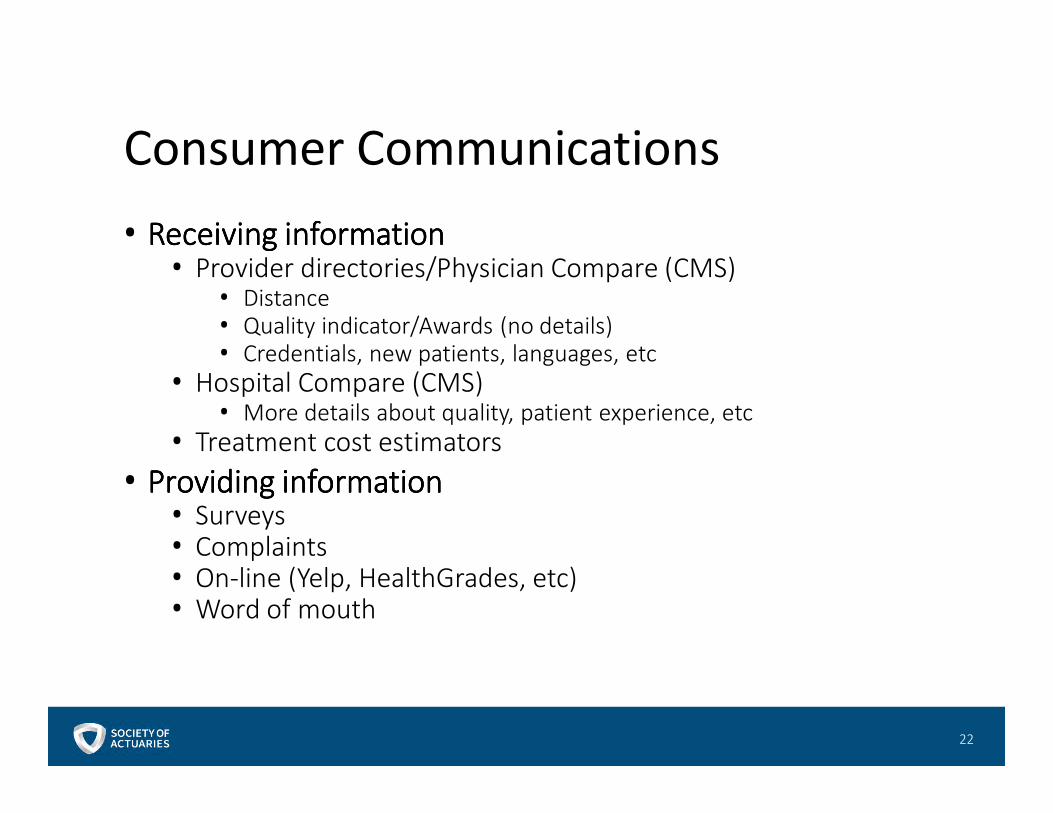
Consumer Communications
• Receiving informationReceiving informationReceiving informationReceiving information• Provider directories/Physician Compare (CMS)
• Distance• Quality indicator/Awards (no details)• Credentials, new patients, languages, etc
• Hospital Compare (CMS)• More details about quality, patient experience, etc
• Treatment cost estimators
• Providing informationProviding informationProviding informationProviding information• Surveys• Complaints• On-line (Yelp, HealthGrades, etc)• Word of mouth
22
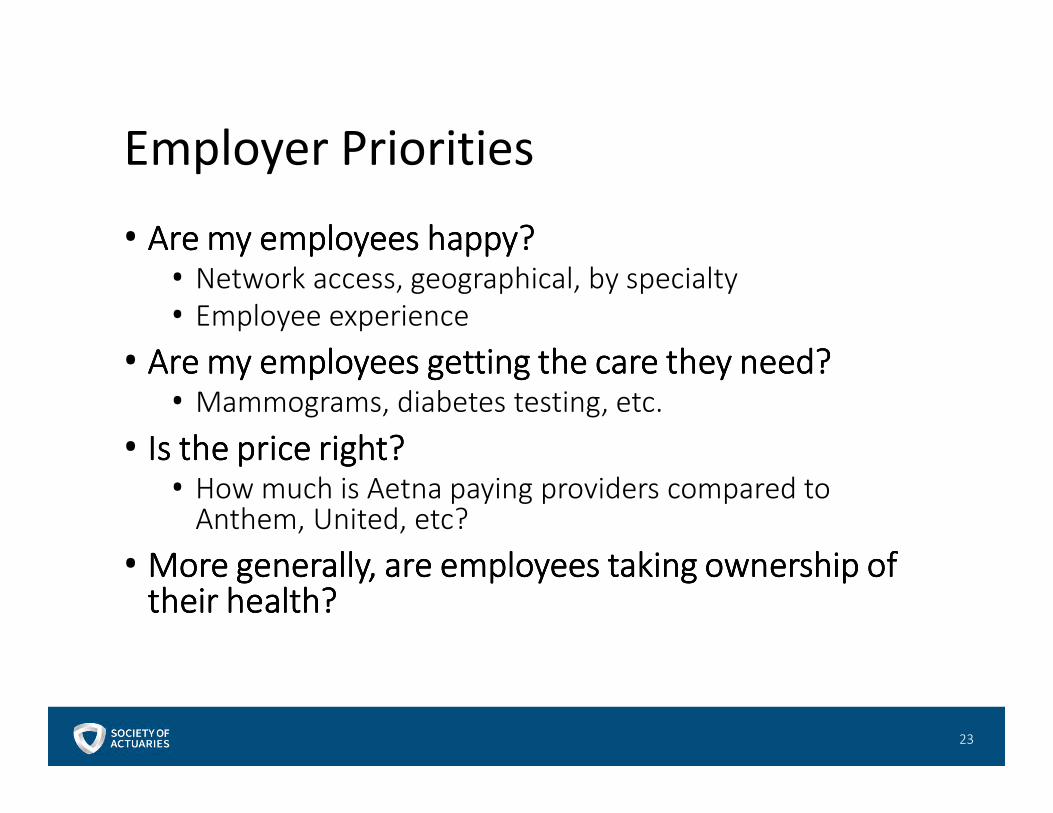
Employer Priorities
• Are my employees happy?Are my employees happy?Are my employees happy?Are my employees happy?• Network access, geographical, by specialty
• Employee experience
• Are my employees getting the care they need?Are my employees getting the care they need?Are my employees getting the care they need?Are my employees getting the care they need?• Mammograms, diabetes testing, etc.
• Is the price right?Is the price right?Is the price right?Is the price right?• How much is Aetna paying providers compared to
Anthem, United, etc?
• More generally, are employees taking ownership of More generally, are employees taking ownership of More generally, are employees taking ownership of More generally, are employees taking ownership of their health?their health?their health?their health?
23

Employer: Information Received
• Employee feedbackEmployee feedbackEmployee feedbackEmployee feedback
• Vendor reportingVendor reportingVendor reportingVendor reporting• Claims, financial experience
• Access reports
• Satisfaction surveys
• Net quality measures
• Network ExperienceNetwork ExperienceNetwork ExperienceNetwork Experience• Uniform Discount Submission
• Total Cost of Care
24

Health Plan Priorities
• Are consumers happy and getting the care they Are consumers happy and getting the care they Are consumers happy and getting the care they Are consumers happy and getting the care they need?need?need?need?
• Are employers happy?Are employers happy?Are employers happy?Are employers happy?
• CostsCostsCostsCosts• CompetitivenessCompetitivenessCompetitivenessCompetitiveness
• PredictabilityPredictabilityPredictabilityPredictability
• Which measures really matter?Which measures really matter?Which measures really matter?Which measures really matter?• EfficiencyEfficiencyEfficiencyEfficiency
• SavingsSavingsSavingsSavings
25
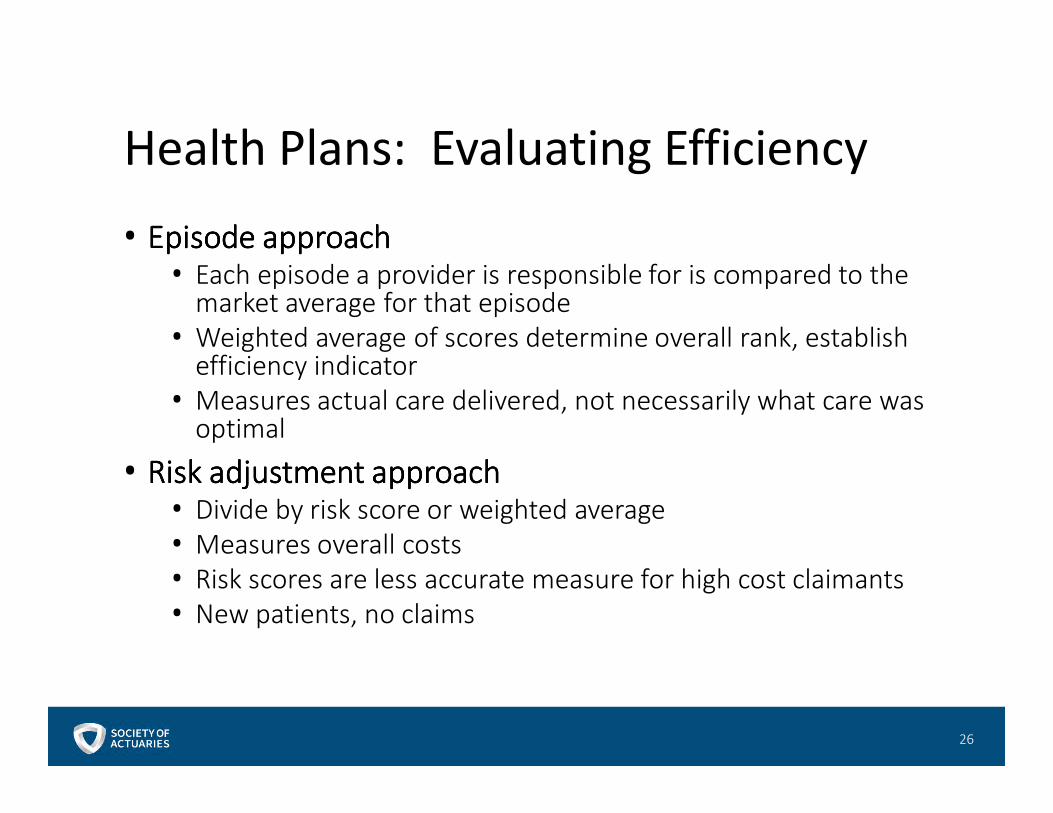
Health Plans: Evaluating Efficiency
• Episode approachEpisode approachEpisode approachEpisode approach• Each episode a provider is responsible for is compared to the
market average for that episode
• Weighted average of scores determine overall rank, establish efficiency indicator
• Measures actual care delivered, not necessarily what care was optimal
• Risk adjustment approachRisk adjustment approachRisk adjustment approachRisk adjustment approach• Divide by risk score or weighted average
• Measures overall costs
• Risk scores are less accurate measure for high cost claimants
• New patients, no claims
26
Health Plans: Evaluating Savings (Controlled Comparisons)• Controls Controls Controls Controls
• Age-sex or risk
• Area
• Plan design
• ComparisonsComparisonsComparisonsComparisons• Clinical trials
• Historical trends
• Pre-treatment vs. post-treatment
• Participant/Non-participant
• Confounder: Reversion to the meanConfounder: Reversion to the meanConfounder: Reversion to the meanConfounder: Reversion to the mean
27
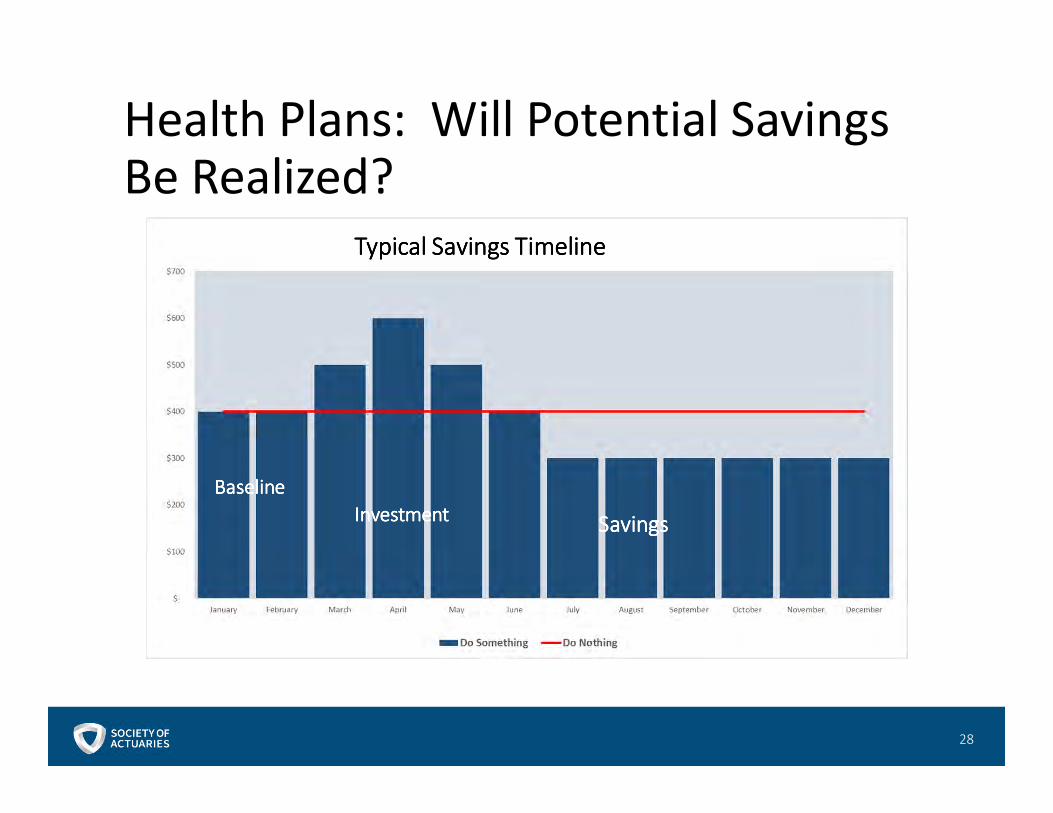
Health Plans: Will Potential Savings Be Realized?
28
Typical Savings TimelineTypical Savings TimelineTypical Savings TimelineTypical Savings Timeline
BaselineBaselineBaselineBaseline
InvestmentInvestmentInvestmentInvestment SavingsSavingsSavingsSavings
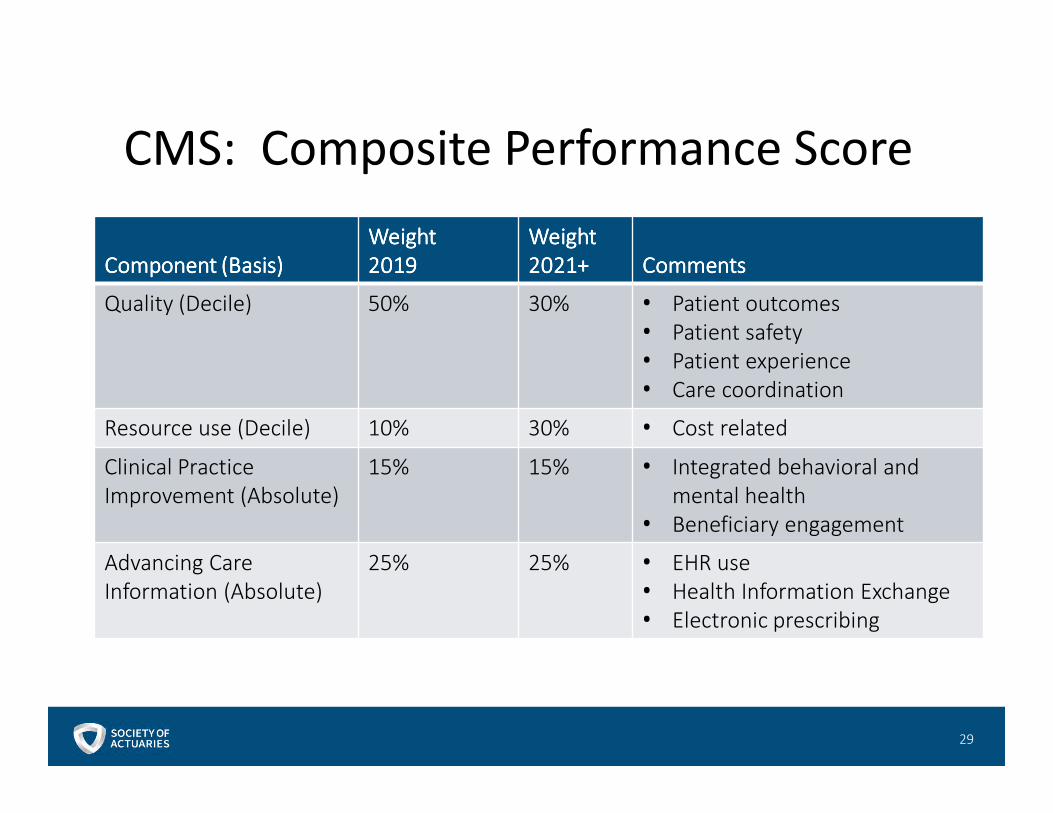
CMS: Composite Performance Score
Component (Basis)Component (Basis)Component (Basis)Component (Basis)
WeightWeightWeightWeight
2019201920192019
WeightWeightWeightWeight
2021+2021+2021+2021+ CommentsCommentsCommentsComments
Quality (Decile) 50% 30% • Patient outcomes
• Patient safety
• Patient experience
• Care coordination
Resource use (Decile) 10% 30% • Cost related
Clinical Practice
Improvement (Absolute)
15% 15% • Integrated behavioral and
mental health
• Beneficiary engagement
Advancing Care
Information (Absolute)
25% 25% • EHR use
• Health Information Exchange
• Electronic prescribing
29
Physician Priorities and Strategies
• PrioritiesPrioritiesPrioritiesPriorities• Income
• Level
• Predictability
• Minimize administrative duties• Time/money involved in oversight
• Want to spend more time practicing medicine
• StrategiesStrategiesStrategiesStrategies• Mergers/hospital systems
• Choice of measures
• Financial planning
• Cost-shifting
30
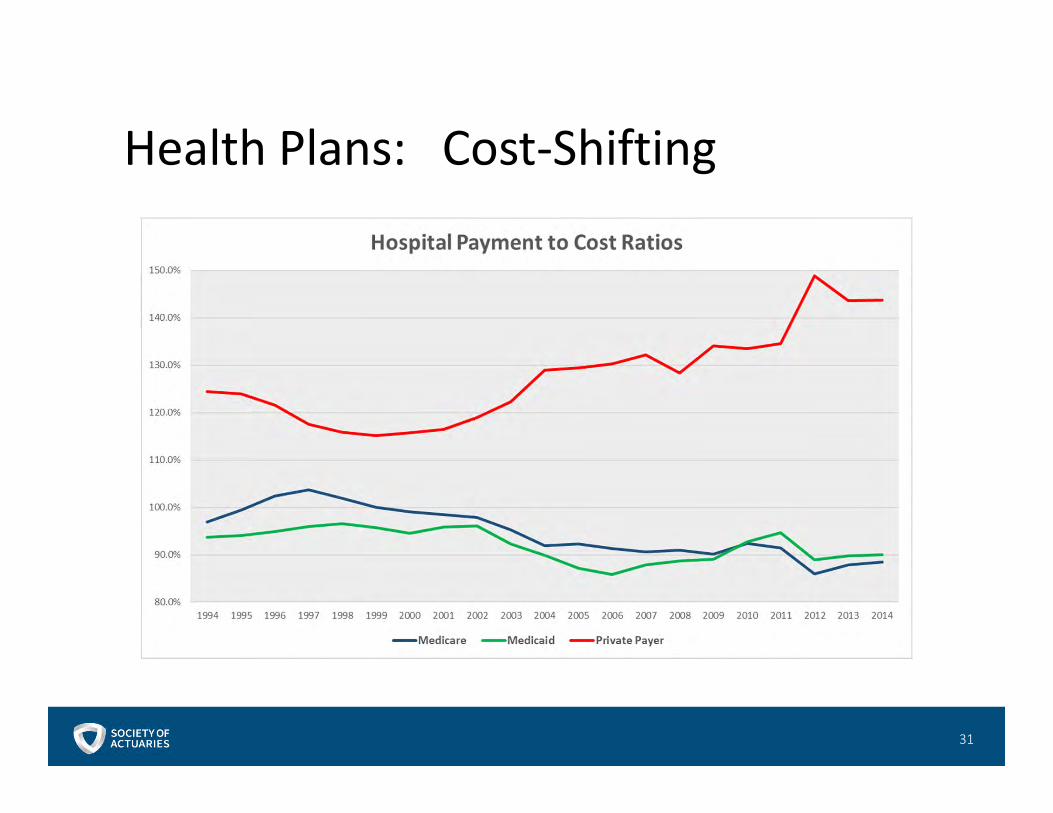
Health Plans: Cost-Shifting
31

Hospital Priorities and Strategies
• PrioritiesPrioritiesPrioritiesPriorities• Income
• Triple Aim• Improve patient experience
• Improve population health
• Reduce the per capita cost of care
• Strategies and analyticsStrategies and analyticsStrategies and analyticsStrategies and analytics• Process improvements
• Destination programs
• Emphasis on outpatient
• Financial projections
32
Parting Thoughts
• MACRA can be transformationalMACRA can be transformationalMACRA can be transformationalMACRA can be transformational• Clinical practice
• Reimbursement
• Expect trend volatilityExpect trend volatilityExpect trend volatilityExpect trend volatility
• Pay attention Pay attention Pay attention Pay attention –––– things are changing rapidlythings are changing rapidlythings are changing rapidlythings are changing rapidly
• New opportunities for actuariesNew opportunities for actuariesNew opportunities for actuariesNew opportunities for actuaries
33

Case Study
34
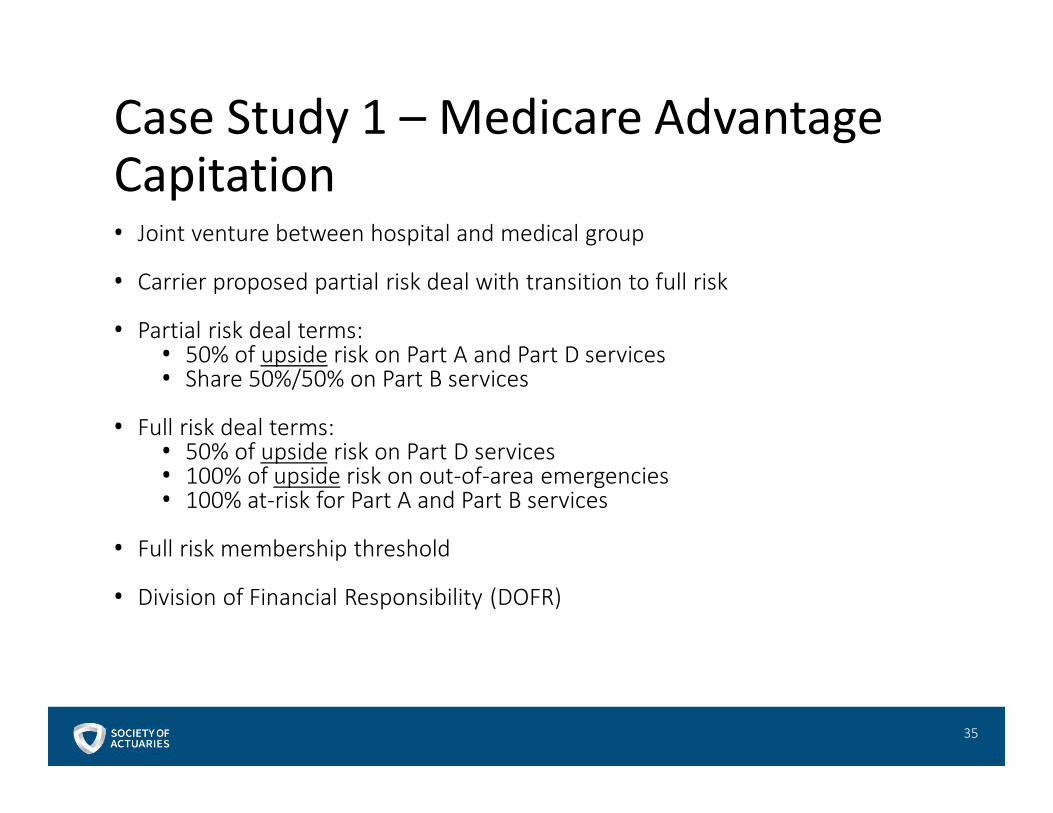
Case Study 1 – Medicare Advantage Capitation• Joint venture between hospital and medical group
• Carrier proposed partial risk deal with transition to full risk
• Partial risk deal terms:• 50% of upside risk on Part A and Part D services• Share 50%/50% on Part B services
• Full risk deal terms:• 50% of upside risk on Part D services• 100% of upside risk on out-of-area emergencies• 100% at-risk for Part A and Part B services
• Full risk membership threshold
• Division of Financial Responsibility (DOFR)
35

• Approach
1. Build actuarial cost model for service area
• 0.95 risk score per the contract (all differences attributed to
morbidity)
• Limited managed care efficiency (loosely managed)
• 100% of Medicare fee-for-service reimbursement
2. Test sensitivity to risk score assumption
3. Test sensitivity to managed care efficiency
Case Study 1 – Medicare Advantage Capitation
36

Case Study 1 – Medicare Advantage Capitation• Other considerations
• Medicare Advantage education
• Bidding basics
• Risk scores
• Part D
• Star rating (impact on percent of premium deals)
• Contract terms
• Actuaries, not attorneys
• Attribution
• Benefit design
• Identify favorable and unfavorable risk terms (i.e., reconciliation
process)
• Benchmark contract terms
37
Case Study 1 – Medicare Advantage Capitation
ExhibitsExhibitsExhibitsExhibits
38
Case Study 2 – Medicare Shared Savings Program• Clinic
• Selected by CMS as Accountable Care Organization (ACO) under Medicare
Shared Savings Program (MSSP)
• CMS provided prior year data
• Need baseline to measure potential savings and opportunities for program
39
Case Study 2 – Medicare Shared Savings Program• Key Issues
• Identify starting point
• Leakage
• Lack of benchmarks for subpopulations
• Data
• Claim and Claim Line Feed (CCLF) files
• No substance abuse costs due to HIPAAc
• No risk scores
• No decedents
• No member months or exposure file (based on patients)
40

Case Study 2 – Medicare Shared Savings Program
ExhibitsExhibitsExhibitsExhibits
41