sesa goa & sterlite...
TRANSCRIPT

Please refer to important disclosures/disclaimers in Appendix A Centrum Equity Research is available on Bloomberg, Thomson Reuters and FactSet
INDIA
Sesa Goa & Sterlite Industries Metals
Q4FY13 Result Update 2 May 2013
Sesa Goa - Accumulate Target Price: Rs180
CMP: Rs158.8*
Upside: 13.4% *as on 30 April 2013
Sterlite - Accumulate Target Price: Rs108
CMP: Rs95.7*
Upside: 12.9% * as on 30 April 2013
Abhisar Jain, CFA [email protected] +91 22 4215 9928
Operational performance improves, valuation and debt concerns remain For the proposed Sesa Sterlite group (expected to be in place soon), operational performance surprised positively across assets with i) higher earnings from domestic zinc operations on the back of higher surplus concentrate zinc sales of 61kt and increase in integrated metal volumes, ii) higher volumes (up ~31% QoQ) from merchant power division at SEL with low CoP of Rs1.76/unit (down ~22% QoQ), iii) stable cost performance from VAL and iv) higher earnings from copper and aluminium operations on account of better premiums. Positive developments were mainly from easing of evacuation constraints and better coal availability at power operations, guidance of 15% YoY growth in mined metal output at HZL and visibility on restart of iron ore operations of Sesa Goa after positive order from the Supreme Court.
We were negatively surprised by further delay in 325ktpa smelter commissioning at BALCO along with delay in receiving factory license for operational startup of 1200 MW power plant. We remain concerned on long term volumes and profitability of VAL (which operates without captive assets in bauxite and alumina and will become the 100% subsidiary of the merged entity) and continuation of funding for VAL’s losses from standalone operations. Increase in consolidated debt for Sterlite during FY13 remained a drag on the balance sheet. We continue to see the merger offering limited benefits to the consolidated entity on account of its huge debt and skewed EBITDA profile (~70% of group EBITDA comes from HZL and Cairn whose cash fungibility does not exist with the group) and see HZL stake buyout as a key event as well as the requirement for the entity to have better cash flow and stable operations.
We have used FY15E EV/EBITDA valuation (see table below) to arrive at a SOTP fair value of Rs180 for Sesa Sterlite and corresponding fair value of Rs108 for Sterlite (based on 0.6x Sesa Sterlite value). We upgrade our rating to Accumulate from Reduce on both the stocks. Possible stake buyout in HZL and BALCO by the group from the GoI could lead to material upgrades in our target prices. The result update details for both Sesa Goa and Sterlite industries with detailed financials and revised estimates are shown on the next few pages.
Price Performance (%)*
1M 6M 1Yr
Sesa Goa 1.2 (9.7) (15.6)
Sterlite Ind. 2.8 (5.8) (9.0)
NIFTY 4.0 5.1 13.0
* as on 30 April 2013 Source: Bloomberg, Centrum Research
SOTP valuation for Sesa Sterlite group (based on FY15E EV/EBITDA) FY15E (Rs mn) Copper HZL Zinc Intnl BALCO SEL VAL MALCO Sesa Goa CairnStake (%) 100 64.9 100 51 100 100 100 100 58.9EBITDA 9,562 65,652 15,474 9,852 14,264 13,000 510 9,409 114,942 EV/EBITDA (x) 5.5 5.5 3 6 6 5 4 4 5EV 52,593 361,087 46,421 59,114 85,586 65,000 2,040 37,636 574,710 Acquisition Debt 288,000 Gross Debt 72,058 4 0 49,122 63,400 200,000 0 67,342 0Gross Cash 37,649 309,650 40,000 12,898 2,000 2,000 1,870 10,895 204,063 Net Debt 34,408 (309,646) (40,000) 36,224 61,400 198,000 (1,870) 56,447 83,937 Equity Value 18,185 670,734 86,421 22,890 24,186 (133,000) 3,910 (18,811) 490,773 Holding Company Disc (%) 25 25 25Attributable Equity value 18,185 326,480 86,421 8,756 24,186 (133,000) 3,910 (18,811) 216,799 Total shares of Sesa Sterlite (mn) 2,965 SOTP Contribution (Rs) 6.1 110.1 29.1 3.0 8.2 (44.9) 1.3 (6.3) 73.1 Total SOTP Value (Sesa Sterlite group) 180 Sterlite share value (0.6x Sesa Sterlite) 108 Sesa goa share value (1x Sesa Sterlite) 180
Source: Company, Centrum Research Estimates

Please refer to important disclosures/disclaimers inside Centrum Equity Research is available on Bloomberg, Thomson Reuters and FactSet
INDIA
Sesa Goa Metals Accumulate
Q4FY13 Result Update 2 May 2013
Visibility on restart of operations improve Sesa Goa’s iron ore operations remained closed during Q4FY13E and as a result company suffered EBITDA loss of ~Rs960mn on account of non-recovery of fixed costs from pig iron and coke divisions. Pig iron and coke sales volumes saw impressive YoY increase of 75% and 48% respectively but lower margins due to depressed pricing could not help in the recovery of overall fixed costs. PAT was reported at Rs2.97bn including profit from Cairn of Rs5.1bn and forex gain of ~Rs183mn. Karnataka operations restart is on the cards after direction by the Supreme Court recently but we remain cautious on the overall prospects of the company with Goa operations’ restart visibility low and Karnataka restart dependent on grant of various approvals on time. Recommend Accumulate with a target price of Rs180 based on the SOTP valuation of the proposed Sesa Sterlite group. Iron ore division remains closed: Iron ore operations remained closed in both Goa and
Karnataka while pig iron and coke divisions delivered sales volumes of 95000 tonne and 90000 tonne, up by 75% YoY and by 48% YoY respectively. Market conditions remained tough for the pig iron division with shortage of iron ore and low end user demand from the domestic market which has kept pig iron prices under pressure.
EBITDA remains in the red: With iron ore operations remaining shut, EBITDA came into negative zone of ~Rs956mn. Coke and pig iron operations showed higher production volumes but tough market conditions and lower pig iron prices resulted in pressure on margins and the company could not recover the fixed costs of iron ore business.
Y/E Mar (Rs mn) Q4FY13 Q4FY12 YoY% Q3FY13 QoQ%
Net sales 2,909 27,944 (89.6) 2,365 23.0Employee costs 599 876 (31.6) 560 6.9Export duty (3) 7,422 -EBITDA (959) 11,678 (817)EBITDA margin (%) (33) 42 (35)Depreciation 984 286 244.2 354 178.2Interest 1,378 1,011 36.4 1,257 9.6Forex loss/(gain) (183) (950) 250Other income 91 141 (35.2) 154 (40.7)Exceptional items - 661 7PBT (3,047) 10,811 (2,530)Provision for tax (895) 3,848 (807) 10.9Effective tax rate 29 36 32PAT (reported) (2,152) 11,621 (1,723)Profit of associate (C i )
5,127 4,658 6,690PAT group (rep) 2,975 11,621 (74.4) 4,967 (40.1)
*adjusted for forex (after tax adjustment); Source: Company, Centrum Research Conference call highlights: Goa operations remained closed and restart could depend on
various factors including CEC recommendations and Supreme Court (SC) hearings in the matter. Inventory sales of already mined ore could be allowed by SC and Sesa holds ~3.5 MT of inventory in Goa. SC has allowed the restart of B category mines in Karnataka and Sesa’s operations can begin production with 2.29 mtpa capacity only after other approvals related to forest clearance by MoEF and compliance for R&R by monitoring committee are received. The company has taken full ownership of the Liberia iron ore asset but has reduced its phase 1 capacity guidance to 2mtpa at a capex of US$180-200mn to be completed by FY15E. It has also maintained its guidance of partial shipments by the end of FY14E from the Bomi Hills mines of WCL. Depreciation expense has been higher due to pro-rata amortization of stamp duty expense (levied by Goa government at ~Rs200mn for every MT of EC capacity) for the last five years. Additional depreciation expense of ~Rs580mn accounted during Q4FY13 and expected increase for FY14 is ~Rs120mn.
Earnings revised downwards on lower volumes: We revise our iron ore volume estimates lower for FY14E/15E with low visibility on volumes from Goa post shutdown and the need of various approvals and start of hearing from Supreme Court in Goa. We expect Karnataka operations to start by Q2FY14E after receiving MoEF and monitoring committee clearances. We now build in 2.29MT volumes from Karnataka operations and 2MT volumes from Goa in FY14E. We have revised our EBITDA estimates for FY14E lower by 52%.
Valuations: We continue to value the stock on the basis of our SOTP valuation for the proposed group entity Sesa Sterlite (which is expected to be in place soon). We recommend Accumulate with a target price of Rs180.
Key Data
Target Price Rs180 Bloomberg Code SESA IN
CMP Rs158.8 Reuters Code SESA.BO
Upside 13.4% Current Shares O/S (mn) 869.1
Previous Target Rs175 Diluted Shares O/S(mn) 869.1
Previous Rating Reduce Mkt Cap (Rsbn/USDbn) 138/2.6
Price Performance (%)* 52 Wk H / L (Rs) 208/140
1M 6M 1Yr Daily Vol. (3M NSE Avg.) 1,692,538
SESA 1.2 (9.7) (15.6) Face Value (Rs) 1
NIFTY 4.0 5.1 13.0 USD = Rs53.8
Source: Bloomberg, Centrum Research *as on 30 April 2013
Sales volume and revenues (Iron ore)
23903 25979 15683 925 207 158
2.9
0.2 0.0 0.0
0
5,000
10,000
15,000
Q3FY12 Q4FY12 Q1FY13 Q2FY13 Q3FY13 Q4FY13
0.0
1.0
2.0
3.0
5.0 5.2
20,000
25,000
30,000
4.0
5.0
6.0
Revenues (Rs mn) Sales Volume (DMT)
Source: Company, Centrum Research
EBITDA and margin
10,852 11,678 58
(959)(817)
6,762
41.5 41.8 39.0
2.0
(4,000)(2,000)
02,0004,0006,0008,000
10,00012,00014,000
Q3FY12 Q4FY12 Q1FY13 Q2FY13 Q3FY13 Q4FY13
051015202530354045
EBITDA (Rsmn) EBITDA Margin-RHS (%)
Source: Company, Centrum Research
Earning Revision
FY14E FY15E (Rs mn) Revised Prev. Chg % Revised Prev. Chg %
Revenue 27,063 33,637 (19.5) 47,693 68,782 (30.7)
EBITDA 1,514 3,160 (52.1) 9,409 18,404 (48.9)EBITDA Margin % 5.6 9.4 19.7 26.8PAT Adj -Core w/o cairn (705) (642) 9.8 3,599 8,947 (59.8)
Group PAT incl. cairn 18,988 17,786 6.8 21,253 25,441 (16.5)Volumes-Iron ore (DMT) 4.3 5.3 (18.9) 7.3 10.3 (29.2)Realizn. - Iron ore (US$/t) 85.1 86.4 (1.5) 80.6 83.2 (3.1)
Source: Company, Centrum Research
Abhisar Jain, CFA [email protected] +91 22 4215 9928
Y/E Mar (Rsmn) Rev YoY %) EBITDA EBITDA (%) Adj. PAT YoY (%) RoE (%) RoCE (%) EPS (Rs) PE (x) PB (x) EV/EBITDA (x)FY11 91,933 56.9 51,916 56.5 42,225 60.6 33.0 36.7 47.0 3.4 1.1 1.0FY12 83,101 (9.6) 36,815 44.3 26,955 (36.2) 17.9 18.9 30.0 5.3 0.9 4.6FY13 25,544 (69.3) 5,160 20.2 22,803 (15.4) 13.1 1.4 25.4 6.3 0.8 34.8FY14E 27,063 5.9 1,514 5.6 18,988 (16.7) 9.9 (0.1) 21.1 7.5 0.7 123.4FY15E 48,019 77.4 9,534 19.9 21,339 12.4 10.1 2.6 23.8 6.7 0.7 20.4Source: Company, Centrum Research Estimates

Exhibit 1: Sensitivity Analysis For 1% change % impact on EBITDA % impact on EPS
Iron ore volumes 2.9 0.8
Iron ore realization 2.2 0.6
Source: Company, Centrum Research Estimates
Exhibit 2: 1 year forward EV/EBITDA chart Exhibit 3: 1 year forward P/E chart
050,000
100,000150,000200,000250,000300,000350,000400,000450,000
Apr
-06
Aug
-06
Dec
-06
Apr
-07
Aug
-07
Dec
-07
Apr
-08
Aug
-08
Dec
-08
Apr
-09
Aug
-09
Dec
-09
Apr
-10
Aug
-10
Dec
-10
Apr
-11
Aug
-11
Dec
-11
Apr
-12
Aug
-12
Dec
-12
Apr
-13
EV 2x 4x 6x 8x
0
100
200
300
400
500
600
Apr
-06
Aug
-06
Dec
-06
Apr
-07
Aug
-07
Dec
-07
Apr
-08
Aug
-08
Dec
-08
Apr
-09
Aug
-09
Dec
-09
Apr
-10
Aug
-10
Dec
-10
Apr
-11
Aug
-11
Dec
-11
Apr
-12
Aug
-12
Close Price 4x 6x 8x 10x
Source: Bloomberg, Company, Centrum Research Estimates Source: Bloomberg, Company, Centrum Research Estimates
Exhibit 4: Global peer comparison
P/E (x) EV/EBITDA (x) EBITDA Margin (%)
Company CY12 CY13E CY14E CY12 CY13E CY14E CY12 CY13E CY14E
Iron Ore Miners
Cliffs Natural Resources Inc 9.0 11.7 11.7 5.9 6.1 5.9 22.6 22.2 21.6
Fortescue Metals Group Ltd 7.0 5.1 4.7 6.5 4.6 3.8 39.0 37.9 36.9
Ferrexpo PLC 5.7 5.7 6.2 4.2 4.3 4.9 31.7 29.0 27.5
Kumba Iron Ore Ltd 10.4 11.0 13.0 NA 6.1 7.1 NA 49.0 44.8
MMX Mineracao e Metalicos SA (22.8) 16.0 62.5 24.6 14.7 8.6 20.7 28.5 34.1
Mount Gibson Iron Ltd 4.4 5.0 8.8 0.6 0.2 (0.0) 38.0 38.5 29.9
Atlas Iron Ltd 13.7 8.4 7.7 5.0 2.4 2.2 16.1 24.9 25.6
Average 3.9 9.0 16.4 7.8 5.5 4.7 28.0 32.9 31.5
Diversified Miners
BHP Billiton Ltd 13.4 11.3 10.5 6.9 5.9 5.5 42.7 45.3 46.2
Rio Tinto Ltd 10.1 8.9 8.6 5.7 5.1 4.5 37.7 38.2 39.3
Vale SA 7.2 7.4 8.0 5.2 5.2 5.2 45.4 43.3 42.2
Exxaro Resources Ltd 9.6 7.9 7.5 NA 13.6 10.9 NA 24.0 25.5
Average 10.1 8.9 8.7 5.9 7.5 6.5 41.9 37.7 38.3
Source: Bloomberg, Centrum Research
3

4
Exhibit 5: Quarterly Financials (SIIL-Cons) Particulars (Rs mn) Q1FY12 Q2FY12 Q3FY12 Q4FY12 Q1FY13 Q2FY13 Q3FY13 Q4FY13
Sales/Income from operations 22,631 8,551 28,780 30,253 19,331 3,213 2,518 3,148Other Operating Income 141 56 128 30 76.9 59.3 89.6 60.5
Total Income 21,089 7,897 26,171 27,944 17,326 2,944 2,365 2,909
Accretion to Stocks in trade & work in progress (1,090) (852) 2,179 60.5 (378.7) (1,570.7) (1,176.3) (179.8)
Purchase of Ore 871 346 1,421 1031.7 943.5 21.7 (2.9) (0.4)
Raw Materials Consumed 974 1,507 1,796 1490.1 1359.6 1542.2 2,494 2,619
Staff Cost 545 625 638 876 692.9 643 560 599
Consumption of stores 913 719 956 895 1,009 656 216 197Contractors for inland transportation & other services
2,105 1,143 2,563 2,683 1,730 842 389 202
Export Duty 3,454 872 4,485 7,422 4,338 95 0 (3.1)
Other Expenses 1,922 938 1,334 1,926 943 656 701 434
Operating Profit (Core EBITDA) 11,474 2,600 10,852 11,678 6,762 58 (817) (959)
Depreciation 269 243 263 286 303 334 354 984
EBIT 11,205 2,357 10,589 11,392 6,459 (276) (1,170) (1,943)
Interest 493 516 730 1,011 1,178 817 1,257 1,378
Forex loss/(gain) 15 2,341 1,779 (950) 2,324 (1,885) 250 (183)
Other Revenue/Income 1,521 504 180 141 151 142 154 91
Exceptional Items - - - 661 198 7 7 -
Profit Before Tax 12,217 4 8,260 10,811 2,910 927 (2,530) (3,047)Tax 3,811 (9) 2,564 3,848 922 351 (807) (895)
Profit After Tax 8,406 13 5,696 6,963 1,988 576 (1,723) (2,152)
Add/(Less) - Share in the profit/(loss) of associates - - 1,219 4,658 7,652 4,644 6,690 5,127
Profit after Tax attributable to Consolidated Gr. 8,406 13 6,915 11,621 9,640 5,220 4,967 2,975
Growth (%)
Revenue (16.0) (16.6) 15.1 (23.0) (14.6) (62.4) (91.3) (89.6)
EBITDA (26.0) (13.9) (11.8) (44.6) (41.1) (97.8) (107.5) (108.2)
PAT (35.4) (99.7) (35.1) (20.5) 14.7 40,684.4 (28.2) (74.4)
Margin (%)
EBITDA 54.4 32.9 41.5 41.8 39.0 2.0 (34.5) (33.0)
EBIT 53.1 29.8 40.5 40.8 37.3 (9.4) (49.5) (66.8)
PAT 39.9 0.2 21.8 24.9 11.5 19.6 (72.8) (74.0)
Key Drivers
Volumes (tonne)
Iron ore 4,300,000 1,550,000 5,040,000 5,200,000 2,900,000 200,000 30,000 -
Pig Iron 58,079 64,611 68,020 60,000 45,000 72,650 62,258 95,000
Coke 60,000 60,000 65,000 70,000 53,000 79,506 79,542 90,000
Realizations (Rs/t)
Iron ore 4,502 3,834 4,743 4,996 5,408 4,627 6,890 NA
Pig Iron 28,079 28,876 29,921 29,558 30,422 29,703 29,254 26,229
Coke 23,338 19,503 22,002 21,496 21,828 20,748 17,136 15,704
Source: Company, Centrum Research
Exhibit 6: Key Assumptions
Operating Metrics FY11 FY12 FY13 FY14E FY15E
Volumes (Tonne)
Iron ore 18,157,800 16,000,000 3,130,000 4,290,000 7,362,900
Pig Iron 265,661 248,440 274,908 437,500 468,750
Coke 263,000 250,466 302,048 392,000 420,000
Realizations (Rs/tonne)
Iron ore 4,733 4,699 5,423 4,511 4,233
Pig Iron 25,378 29,404 28,519 27,000 28,000
Coke 19,259 21,980 18,483 16,000 17,000
Source: Company, Centrum Research Estimates

5
Financials-consolidated
Exhibit 7: Income Statement Y/E March (Rsmn) FY11 FY12 FY13 FY14E FY15E
Revenues 91,933 83,101 25,544 27,063 48,019Growth in revenues (%) 56.9 (9.6) (69.3) 5.9 77.4
Raw material, stores & spares 6,925 9,386 10,245 12,387 15,247
% of net sales 7.5 11.3 40.1 45.8 31.8
Employee expenses 2,076 2,684 2,495 2,745 3,019
% of net sales 2.3 3.2 9.8 10.1 6.3
Purchase of Ore 5,091 3,670 962 - -
% of net sales 5.5 4.4 3.8 - -Transportation & other services 12,907 8,477 3,163 3,396 6,307
% of net sales 14.0 10.2 12.4 12.5 13.1
Export Duty 6,620 16,233 4,430 2,706.4 6,349.8
% of net sales 7.2 19.5 17.3 10.0 13.2
Total expenses 40,018 46,286 20,384 25,549 38,485
% of net sales 43.5 55.7 79.8 94.4 80.1
EBITDA 51,916 36,815 5,160 1,514 9,534Y-o-y growth (%) 64.9 (29.1) (86.0) (70.7) 529.6
EBITDA Margin (%) 56.5 44.3 20.2 5.6 19.9
Depreciation & Amortisation 964 1,061 1,975 1,667 2,207
EBIT 50,952 35,754 3,185 (153) 7,327
Interest expenses 381 4,333 4,747 5,447 6,397
Other Income 5,517 2,346 539 4,579 4,411
EBT bef. Excep. Items 56,088 33,767 (1,023) (1,022) 5,340
EBT 56,088 33,767 (1,023) (1,022) 5,340Provision for tax 13,372 10,214 (429) (317) 1,656
Effective tax rate (%) 23.8 30.2 42.0 31.0 31.0
Profit after tax 42,225 21,078 (1,310) (705) 3,685Sh. in profit/loss of associates - 5,877 24,113 19,693 17,654
Net Profit Adjusted 42,225 26,955 22,803 18,988 21,339
Y-o-y growth (%) 60.6 (36.2) (15.4) (16.7) 12.4
Adjusted Net Profit Margin (%) 45.9 32.4 89.3 70.2 44.4
Source: Company, Centrum Research Estimates
Exhibit 8: Balance Sheet Y/E March (Rsmn) FY11 FY12 FY13 FY14E FY15E
Equity Share Capital 869 869 869 869 869
Reserves & surplus 127,181 150,068 172,769 190,741 210,046
Shareholders' fund 128,050 150,938 173,638 191,610 210,916
Total Debt 9,995 37,342 47,342 57,342 67,342
Deferred Tax Liability 682 1,046 253 253 253
Total Capital Employed 138,726 189,325 221,233 249,204 278,510
Gross Block 30,648 39,728 45,728 57,728 69,728
Less: Acc. Depreciation 5,348 6,409 8,384 10,051 12,258
Net Block 25,301 33,319 37,345 47,678 57,471
Capital WIP 5,436 8,372 7,225 7,425 7,625
Net Fixed Assets 30,737 41,691 44,570 55,103 65,096
Investments in mutual funds 87,998 5,040 5,040 5,040 5,040
Investment in Cairn India - 136,626 136,626 136,626 136,626
Cash 9,622 485 731 3,503 5,954
Trade Receivables 6,830 5,494 1,424 1,854 3,289
Loans & Advances 13,217 5,679 8,212 8,212 8,212
Inventories 7,438 8,752 9,610 4,694 6,921
Total Current Asset 37,248 20,410 19,976 18,263 24,376
Current Liab. & Prov. 17,256 14,442 8,846 9,387 13,842
Net Current Asset 19,992 5,968 11,130 8,875 10,534
Total Assets 138,726 189,325 221,233 249,204 278,510
Source: Company, Centrum Research Estimates
Exhibit 9: Cash flow Y/E March (Rsmn) FY11 FY12 FY13 FY14E FY15E
PBT 55,597 31,292 (1,740) (1,022) 5,340Interest 381 4,333 4,747 5,447 6,397
Depreciation 964 1,061 1,975 1,667 2,207
Change in working capital 40,557 37,599 23,815 31,130 30,736
Tax 13,372 10,214 (429) (317) 1,656
Cash flow from operations 40,557 37,599 23,815 31,130 30,736
Change in fixed assets 7,787 12,016 4,853 12,200 12,200
Change in investments 42,350 53,667 23,867 19,693 17,654
Cash flow from investments (50,136) (65,683) (28,721) (31,893) (29,854)
Change in equity capital 38 - - - -
Change in debt (9,611) 27,347 10,000 10,000 10,000
Dividends paid 3,559 4,067 102 1,017 2,034
Interest paid 381 4,333 4,747 5,447 6,397
Cash flow from financing (3,558) 18,947 5,152 3,536 1,569Net cash flow (13,137) (9,137) 246 2,772 2,450
Opening cash balance 22,759 9,622 485 731 3,503
Closing cash balance 9,622 485 731 3,503 5,954
Free Cash Flow 32,770 25,583 18,961 18,930 18,536
Source: Company, Centrum Research Estimates
Exhibit 10: Key Ratios Y/E March FY11 FY12 FY13 FY14E FY15E
Margin Ratios (%)
EBITDA Margin 56.5 44.3 20.2 5.6 19.9
PBT Margin 61.0 40.6 -4.0 -3.8 11.1
Adj. PAT Margin 45.9 32.4 89.3 70.2 44.4
Growth Ratio (%)
Revenue 56.9 (9.6) (69.3) 5.9 77.4
EBITDA 64.9 (29.1) (86.0) (70.7) 529.6
Net Profit 60.6 (36.2) (15.4) (16.7) 12.4
Return Ratios (%)
ROE 33.0 17.9 13.1 9.9 10.1
ROCE 36.7 18.9 1.4 (0.1) 2.6
ROIC 96.2 54.4 3.8 1.0 5.0
Turnover Ratios
Asset turnover ratio (x) 0.7 0.4 0.1 0.1 0.2
Debtors (days) 27.1 24.1 20.3 25.0 25.0
Inventory (days) 82.6 79.1 197.4 75.0 75.0
Creditor (days) 191.6 130.5 181.7 150.0 150.0
Per share Ratios (Rs)
Basic EPS 48.6 31.0 26.2 21.8 24.6
Fully diluted EPS with cairn 47.0 30.0 25.4 21.1 23.8
Book value 147.3 173.7 199.8 220.5 242.7
Cash earnings per share 49.7 32.2 28.5 23.8 27.1
Dividend per share 3.5 4.0 0.1 1.0 2.0
Gearing Ratio (x)
Debt-equity 0.1 0.2 0.3 0.3 0.3
Interest coverage ratio 133.7 8.3 0.7 0.0 1.1
Valuation (x)
P/E (Fully Diluted) 3.4 5.3 6.3 7.5 6.7
P/BV 1.1 0.9 0.8 0.7 0.7
EV/EBITDA 1.0 4.6 34.8 123.4 20.4
EV/Sales 0.5 2.0 7.0 6.9 4.0
M-cap/Sales 1.5 1.7 5.4 5.1 2.9
Source: Company, Centrum Research Estimates

Please refer to important disclosures/disclaimers inside Centrum Equity Research is available on Bloomberg, Thomson Reuters and FactSet
INDIA
Sterlite Industries Metals Accumulate
Q4FY13 Result Update 2 May 2013
Margins expand smartly Sterlite Industries’ (SIIL) EBITDA stood at ~Rs33bn, well above our estimates of Rs26.8bn on account of robust operational performance which led to margin expansion across operations (mainly power and domestic zinc). Margin stood at 26.2%, higher by 440bps QoQ on account of higher margins in domestic zinc (61kt surplus zinc concentrate sales and higher integrated metal volume share) and higher profitability from SEL (power volumes higher by ~31% QoQ at lower CoP of Rs1.8/unit, down ~20% QoQ). Copper and aluminium operations also delivered stable volumes with better margins on the back of higher TC/RC and strong metal premiums. We see volume growth remaining strong in power operations but remain concerned on the performance of VAL and BALCO going ahead with smelter commissioning without captive alumina. We recommend Accumulate with a target price of Rs108, which is based on our SOTP valuation of the proposed merged group entity Sesa Sterlite. Volumes increase in power and zinc operations: SIIL saw a sharp increase of ~31%
QoQ in power volumes at SEL due to easing of evacuation constraints. Zinc volumes at HZL surprised positively with 61kt surplus zinc concentrate sales while lead & silver had higher integrated volume share. International zinc operations witnessed a fall as per guidance and aluminium production at VAL was higher than rated capacity. Copper volumes stood at 86kt.
Margins expand smartly: EBITDA increased by ~42% QoQ to ~Rs33.1bn (margin of 26.2%, up by 440 bps QoQ) on account of higher volumes coupled with lower cost performance at zinc and power operations. Copper and aluminium operations benefitted from higher TC/RC and better metal premiums respectively. Higher margin performance at zinc international operations continued backed by low CoP.
Y/E Mar (Rsmn) Q4FY13 Q4FY12 YoY% Q3FY13 QoQ% Q4FY13E Var %
Net sales 126,092 107,568 17.2 106,924 17.9 106,564 18.3Operational expenses 93,670 81,120 15.5 84,106 11.4 80,232 16.7EBITDA 33,067 27,009 22.4 23,269 42.1 26,859 23.1EBITDA margin (%) 26.2 25.1 21.8 25.2Depreciation 4,534 5,028 (9.8) 5,382 (15.8) 5,305 (14.5)Interest 2,758 2,504 10.1 2,269 21.6 3,204 (13.9)Forex loss/(gain) (779) (1,840) 625 0Exceptional items 1,175 4,319 0 0Other income 8,629 8,295 4.0 9,041 (4.6) 8,982 (3.9)PBT 33,363 24,733 34.9 23,583 41.5 26,805 24.5Provision for tax 4,180 4,867 (14.1) 3,555 17.6 5,093Effective tax rate 12.5 19.7 15.1 19PAT 29,183 19,866 46.9 20028 45.7 21712 34.4Minority interest 7,872 5,499 5,853 6,261Profit/loss of associate (2,063) (1,598) (2,261) (2,097)PAT group (rep) 19,247 12,769 50.7 11,914 62 13,354 44.1
*adjusted for forex (after tax adjustment); Source: Company, Centrum Research Conference call highlights: SEL power plant operated at 58% PLF for its three units in
Q4FY13 (up from 31% in Q3FY13) due to easing of evacuation issues and is expected to operate at ~50-60% PLF for full 2400MW capacity going ahead (4th unit capitalized in Q4). BALCO’s power plant commissioning is delayed due to the suspension of its factory license and metal tapping from 325ktpa smelter is delayed further to Q2FY14E. BALCO coal block has received stage 2 forest clearance but mining lease is yet to be signed along with diversion of forest land. Zinc international operations are expected to deliver 390-400kt volumes in FY14E at CoP of US $1100-1200/t. Mining expansions are expected to deliver 15% volume growth in MIC production in domestic zinc operations. Debt levels in standalone books have gone up on account of funds raised and given as additional loans and advances to VAL along with higher working capital requirements. Capex guidance for FY14E at Rs60-65bn.
Earnings revised downwards on lower LME prices: We revise our earnings estimate as we factor in higher volumes in power but lower volumes in aluminium and copper businesses. We remain conservative on our LME assumptions on the back of slow global economic recovery and revise LME prices lower by 3-8% for FY14E/15E across base metals. We revise our USD/INR estimate for FY14E/15E to Rs53/52. We revise our EBITDA estimate lower for FY14E/15E by 6.7% and 16.5% respectively.
Valuations: We continue to value the stock at 0.6x the fair value of Sesa Sterlite (Rs180 assigned by us) based on the announced share swap ratio in the merger. We recommend Accumulate with a target price of Rs108.
Key Data
Target Price Rs108 Bloomberg Code STLT IN
CMP Rs95.7 Reuters Code STRL.BO
Upside 12.9% Current Shares O/S (mn) 3,360.7
Previous Target Rs105 Diluted Shares O/S(mn) 3,360.7
Previous Rating Reduce Mkt Cap (Rsbn/USDbn) 321.6/6
Price Performance (%)* 52 Wk H / L (Rs) 123/83
1M 6M 1Yr Daily Vol. (3M NSE Avg.) 5,880,196
STLT 2.8 (5.8) (9.0) Face Value (Rs) 1
NIFTY 4.0 5.1 13.0 USD = Rs53.8
Source: Bloomberg, Centrum Research; *as on 30 April 2013
Operational Metrics
Q4FY13 Q4FY12 YoY % Q3FY13 QoQ %
Volume (tonne) Copper 86,000 80,000 7.5 92,000 (6.5)Aluminium (BALCO) 62,000 62,000 - 62,000 -Zinc & Lead - India 217,000 227,000 (4.4) 203,000 6.9Zinc International 102,000 106,000 (3.8) 104,000 (1.9)Power - SEL (Mn
i )2,073 1,674 23.8 1,578 31.4
Realizations (US$/t) LME Aluminium 2,003 2,177 (8.0) 1,997 0.3LME Zinc 2,033 2,025 0.4 1,947 4.4LME Lead 2,301 2,093 9.9 2,199 4.6Copper (TC/RC) 14.8 15.3 (3.3) 12.4 19.4Power - SEL (Rs/unit) 3.1 3.4 (9.9) 3.3 (6.6)Cost of Prod. (US$/t) Aluminium (BALCO) 1,930 1,918 0.6 1,995 (3.3)Zinc & Lead - India 998 995 0.3 993 0.5Zinc International 1,181 1,158 2.0 1,095 7.9Power - SEL (Rs/unit) 1.8 2.3 (22.8) 2.2 (20.7)
Source: Company, Centrum Research Estimates
Earnings/Estimates Revision
Rev. Estimates Old Estimates % change FY14E FY15E FY14E FY15E FY14E FY15EFinancials (Rs bn) Net Sales 412.6 455.2 446.3 480.9 (7.5) (5.3)EBITDA 108.0 115.8 115.7 138.7 (6.7) (16.5)Margin (%) 26.2 25.4 25.9 28.8PAT (Attributable) 52.7 61.0 49.2 66.8 7.1 (8.8)EPS (Rs) 15.3 17.7 14.3 19.4 7.1 (8.8)Sales Volumes (tonne) Zinc & Lead - HZL 897,690 945,500 897,690 949,360 - (0.4)Zinc International 396,500 376,675 399,000 399,000 (0.6) (5.6)Aluminium (BALCO) 287,500 352,500 320,000 368,750 (10.2) (4.4)Copper 303,750 344,250 352,350 344,250 (13.8) -Power (SEL) - Mn Units 10,973 12,968 9,660 11,592 13.6 11.9Surp. Pow. (BALCO) - Mn Units 1,048 2,291 646 2,516 62.2 (8.9)LME Prices (US$/tonne) Zinc 2,000 2,040 2,065 2,147 (3.1) (5.0)Lead 2,100 2,142 2,237 2,326 (6.1) (7.9)Aluminium 2,050 2,150 2,150 2,250 (4.7) (4.4)Copper 8,000 8,200 8,200 8,500 (2.4) (3.5) US$/Rs Rate 53 52 50 48 6.0 8.3
Source: Company, Centrum Research Estimates
Abhisar Jain, CFA [email protected] +91 22 4215 9928
Y/E Mar ( )
Revenue YoY (%)
EBITDA EBITDA (%) Adj. PAT YoY (%) Adj. EPS (R )
RoE (%) RoCE (%) PE (x) PB (x) EV/EBITDA (x)
FY11 302,481 23.5 80,495 26.6 50,425 34.7 14.6 12.2 10.6 6.5 0.8 4.5
FY12 409,668 35.4 101,686 24.8 48,279 (4.3) 14.0 10.6 10.9 6.8 0.7 4.1
FY13 449,219 9.7 104,689 23.3 60,603 25.5 17.6 12.0 9.4 5.4 0.6 4.1
FY14E 412,638 (8.1) 107,998 26.2 52,724 (13.0) 15.3 9.7 9.0 6.3 0.6 3.8
FY15E 455,220 10.3 115,795 25.4 60,963 15.6 17.7 10.3 9.0 5.4 0.5 3.2
Source: Company, Centrum Research Estimates
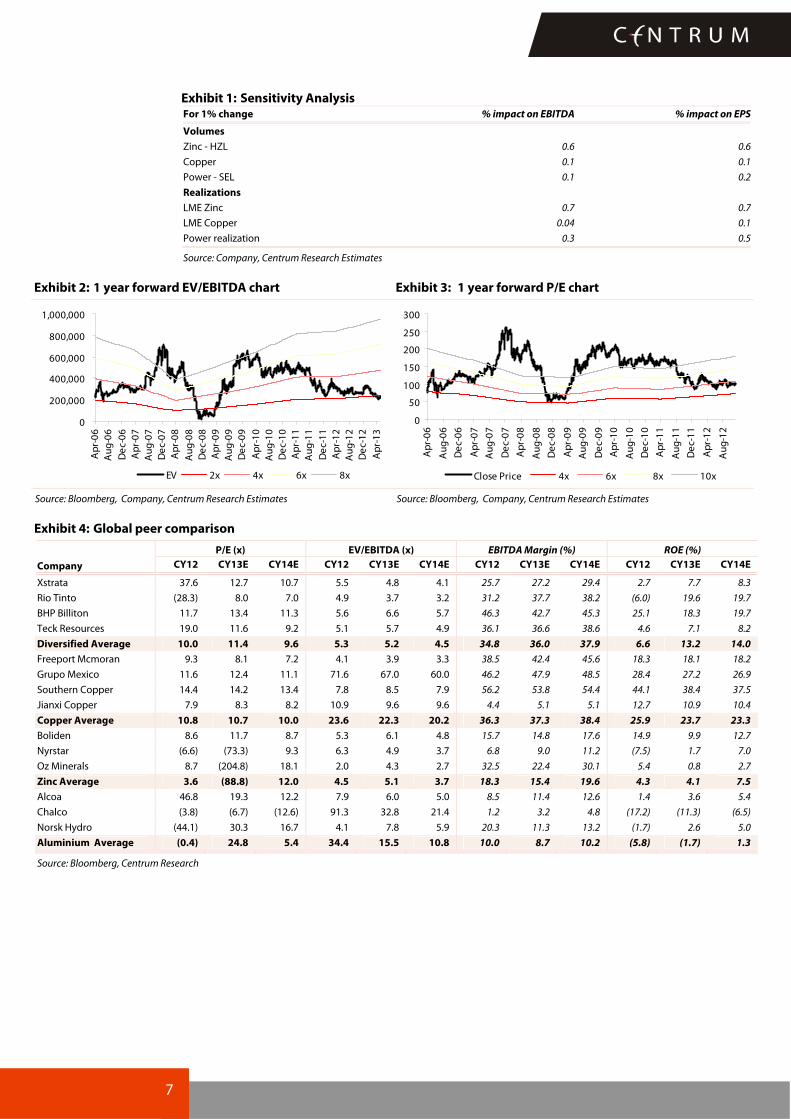
Exhibit 1: Sensitivity Analysis For 1% change % impact on EBITDA % impact on EPS
Volumes
Zinc - HZL 0.6 0.6
Copper 0.1 0.1
Power - SEL 0.1 0.2
Realizations
LME Zinc 0.7 0.7
LME Copper 0.04 0.1
Power realization 0.3 0.5
Source: Company, Centrum Research Estimates
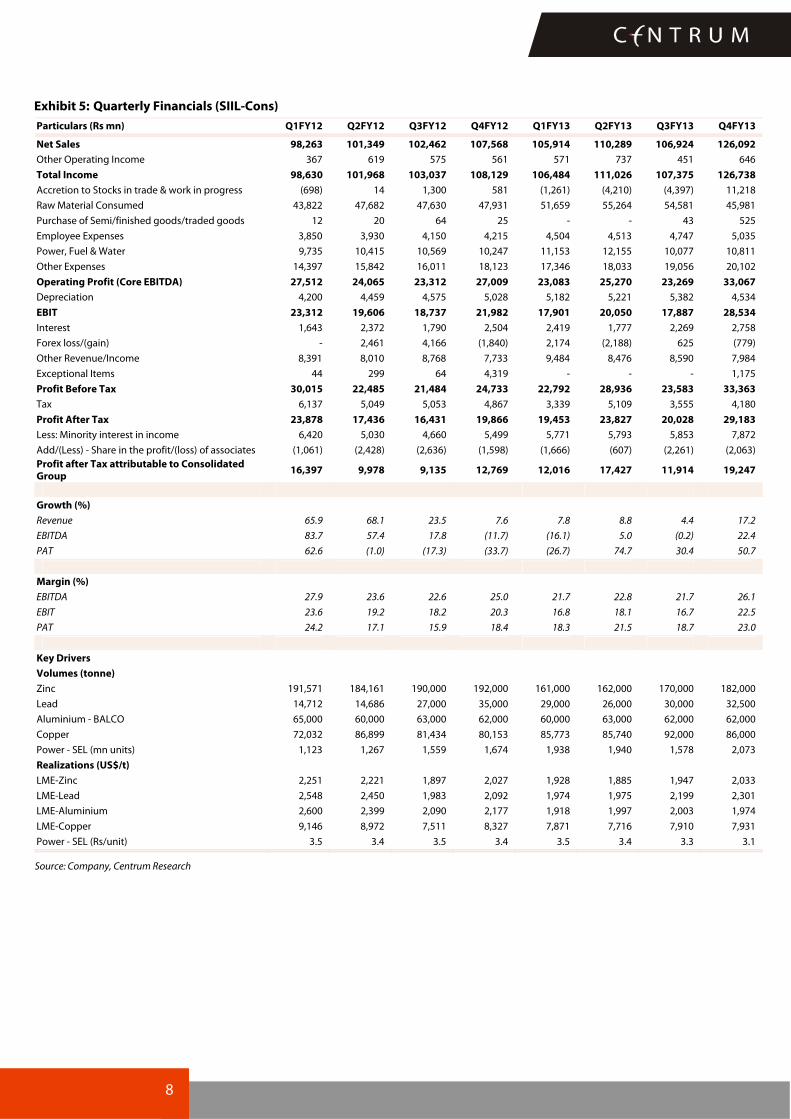
Exhibit 2: 1 year forward EV/EBITDA chart Exhibit 3: 1 year forward P/E chart
0
200,000
400,000
600,000
800,000
1,000,000
Apr
-06
Aug
-06
Dec
-06
Apr
-07
Aug
-07
Dec
-07
Apr
-08
Aug
-08
Dec
-08
Apr
-09
Aug
-09
Dec
-09
Apr
-10
Aug
-10
Dec
-10
Apr
-11
Aug
-11
Dec
-11
Apr
-12
Aug
-12
Dec
-12
Apr
-13
EV 2x 4x 6x 8x
0
50
100
150
200
250
300
Apr
-06
Aug
-06
Dec
-06
Apr
-07
Aug
-07
Dec
-07
Apr
-08
Aug
-08
Dec
-08
Apr
-09
Aug
-09
Dec
-09
Apr
-10
Aug
-10
Dec
-10
Apr
-11
Aug
-11
Dec
-11
Apr
-12
Aug
-12
Close Price 4x 6x 8x 10x
Source: Bloomberg, Company, Centrum Research Estimates Source: Bloomberg, Company, Centrum Research Estimates
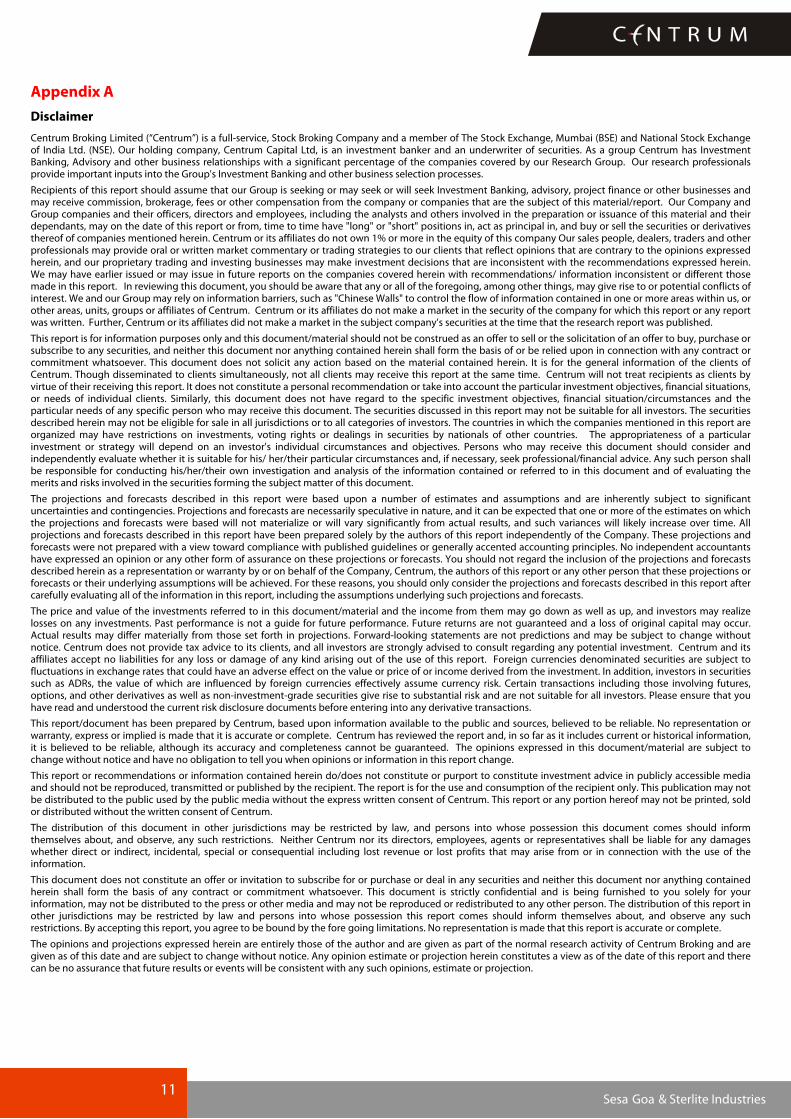
Exhibit 4: Global peer comparison
P/E (x) EV/EBITDA (x) EBITDA Margin (%) ROE (%)
Company CY12 CY13E CY14E CY12 CY13E CY14E CY12 CY13E CY14E CY12 CY13E CY14E
Xstrata 37.6 12.7 10.7 5.5 4.8 4.1 25.7 27.2 29.4 2.7 7.7 8.3
Rio Tinto (28.3) 8.0 7.0 4.9 3.7 3.2 31.2 37.7 38.2 (6.0) 19.6 19.7
BHP Billiton 11.7 13.4 11.3 5.6 6.6 5.7 46.3 42.7 45.3 25.1 18.3 19.7
Teck Resources 19.0 11.6 9.2 5.1 5.7 4.9 36.1 36.6 38.6 4.6 7.1 8.2
Diversified Average 10.0 11.4 9.6 5.3 5.2 4.5 34.8 36.0 37.9 6.6 13.2 14.0
Freeport Mcmoran 9.3 8.1 7.2 4.1 3.9 3.3 38.5 42.4 45.6 18.3 18.1 18.2
Grupo Mexico 11.6 12.4 11.1 71.6 67.0 60.0 46.2 47.9 48.5 28.4 27.2 26.9
Southern Copper 14.4 14.2 13.4 7.8 8.5 7.9 56.2 53.8 54.4 44.1 38.4 37.5
Jianxi Copper 7.9 8.3 8.2 10.9 9.6 9.6 4.4 5.1 5.1 12.7 10.9 10.4
Copper Average 10.8 10.7 10.0 23.6 22.3 20.2 36.3 37.3 38.4 25.9 23.7 23.3
Boliden 8.6 11.7 8.7 5.3 6.1 4.8 15.7 14.8 17.6 14.9 9.9 12.7
Nyrstar (6.6) (73.3) 9.3 6.3 4.9 3.7 6.8 9.0 11.2 (7.5) 1.7 7.0
Oz Minerals 8.7 (204.8) 18.1 2.0 4.3 2.7 32.5 22.4 30.1 5.4 0.8 2.7
Zinc Average 3.6 (88.8) 12.0 4.5 5.1 3.7 18.3 15.4 19.6 4.3 4.1 7.5
Alcoa 46.8 19.3 12.2 7.9 6.0 5.0 8.5 11.4 12.6 1.4 3.6 5.4
Chalco (3.8) (6.7) (12.6) 91.3 32.8 21.4 1.2 3.2 4.8 (17.2) (11.3) (6.5)
Norsk Hydro (44.1) 30.3 16.7 4.1 7.8 5.9 20.3 11.3 13.2 (1.7) 2.6 5.0
Aluminium Average (0.4) 24.8 5.4 34.4 15.5 10.8 10.0 8.7 10.2 (5.8) (1.7) 1.3
Source: Bloomberg, Centrum Research
7
8
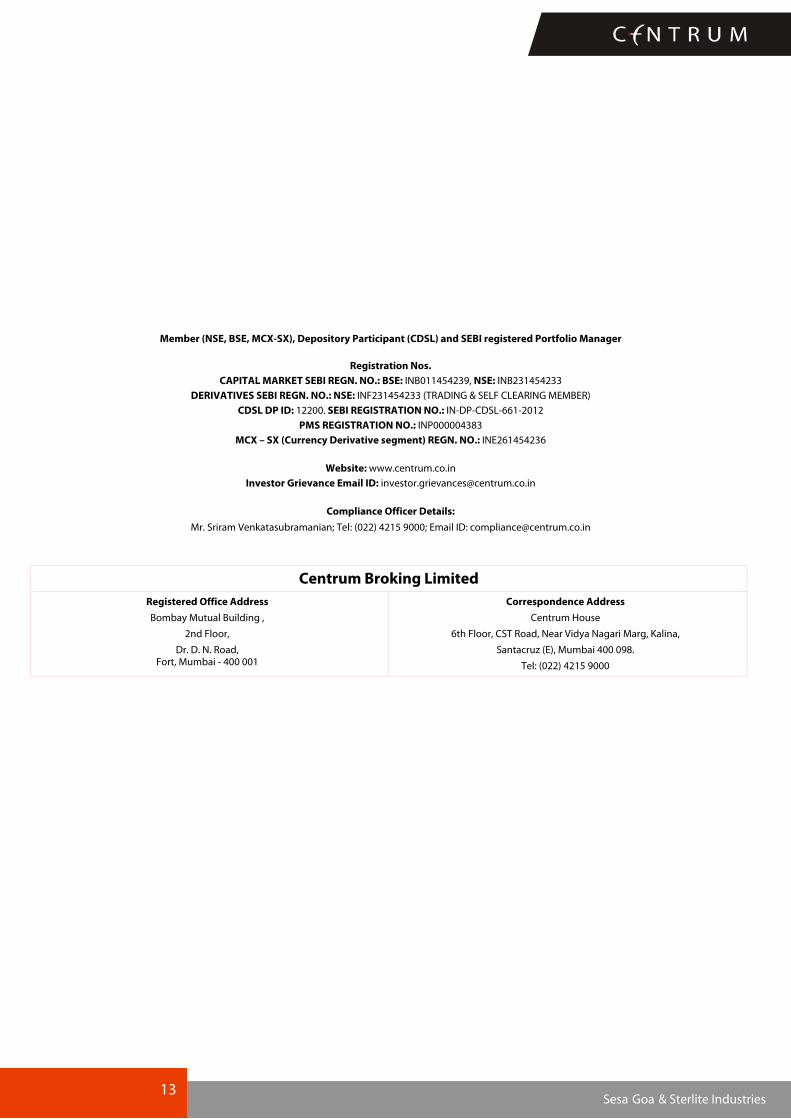
Exhibit 5: Quarterly Financials (SIIL-Cons) Particulars (Rs mn) Q1FY12 Q2FY12 Q3FY12 Q4FY12 Q1FY13 Q2FY13 Q3FY13 Q4FY13
Net Sales 98,263 101,349 102,462 107,568 105,914 110,289 106,924 126,092 Other Operating Income 367 619 575 561 571 737 451 646
Total Income 98,630 101,968 103,037 108,129 106,484 111,026 107,375 126,738
Accretion to Stocks in trade & work in progress (698) 14 1,300 581 (1,261) (4,210) (4,397) 11,218
Raw Material Consumed 43,822 47,682 47,630 47,931 51,659 55,264 54,581 45,981
Purchase of Semi/finished goods/traded goods 12 20 64 25 - - 43 525
Employee Expenses 3,850 3,930 4,150 4,215 4,504 4,513 4,747 5,035
Power, Fuel & Water 9,735 10,415 10,569 10,247 11,153 12,155 10,077 10,811
Other Expenses 14,397 15,842 16,011 18,123 17,346 18,033 19,056 20,102
Operating Profit (Core EBITDA) 27,512 24,065 23,312 27,009 23,083 25,270 23,269 33,067 Depreciation 4,200 4,459 4,575 5,028 5,182 5,221 5,382 4,534
EBIT 23,312 19,606 18,737 21,982 17,901 20,050 17,887 28,534
Interest 1,643 2,372 1,790 2,504 2,419 1,777 2,269 2,758
Forex loss/(gain) - 2,461 4,166 (1,840) 2,174 (2,188) 625 (779)
Other Revenue/Income 8,391 8,010 8,768 7,733 9,484 8,476 8,590 7,984
Exceptional Items 44 299 64 4,319 - - - 1,175
Profit Before Tax 30,015 22,485 21,484 24,733 22,792 28,936 23,583 33,363
Tax 6,137 5,049 5,053 4,867 3,339 5,109 3,555 4,180
Profit After Tax 23,878 17,436 16,431 19,866 19,453 23,827 20,028 29,183 Less: Minority interest in income 6,420 5,030 4,660 5,499 5,771 5,793 5,853 7,872
Add/(Less) - Share in the profit/(loss) of associates (1,061) (2,428) (2,636) (1,598) (1,666) (607) (2,261) (2,063) Profit after Tax attributable to Consolidated Group 16,397 9,978 9,135 12,769 12,016 17,427 11,914 19,247
Growth (%)
Revenue 65.9 68.1 23.5 7.6 7.8 8.8 4.4 17.2
EBITDA 83.7 57.4 17.8 (11.7) (16.1) 5.0 (0.2) 22.4
PAT 62.6 (1.0) (17.3) (33.7) (26.7) 74.7 30.4 50.7
Margin (%)
EBITDA 27.9 23.6 22.6 25.0 21.7 22.8 21.7 26.1
EBIT 23.6 19.2 18.2 20.3 16.8 18.1 16.7 22.5
PAT 24.2 17.1 15.9 18.4 18.3 21.5 18.7 23.0
Key Drivers
Volumes (tonne)
Zinc 191,571 184,161 190,000 192,000 161,000 162,000 170,000 182,000
Lead 14,712 14,686 27,000 35,000 29,000 26,000 30,000 32,500
Aluminium - BALCO 65,000 60,000 63,000 62,000 60,000 63,000 62,000 62,000
Copper 72,032 86,899 81,434 80,153 85,773 85,740 92,000 86,000
Power - SEL (mn units) 1,123 1,267 1,559 1,674 1,938 1,940 1,578 2,073
Realizations (US$/t)
LME-Zinc 2,251 2,221 1,897 2,027 1,928 1,885 1,947 2,033
LME-Lead 2,548 2,450 1,983 2,092 1,974 1,975 2,199 2,301
LME-Aluminium 2,600 2,399 2,090 2,177 1,918 1,997 2,003 1,974
LME-Copper 9,146 8,972 7,511 8,327 7,871 7,716 7,910 7,931
Power - SEL (Rs/unit) 3.5 3.4 3.5 3.4 3.5 3.4 3.3 3.1
Source: Company, Centrum Research

9
Exhibit 6: Key Assumptions
Operating Metrics FY11 FY12 FY13 FY14E FY15E
Sales Volumes (tonne)
Copper 303,327 320,518 344,250 303,750 344,250
Aluminium (BALCO) 255,000 250,000 247,000 287,500 352,500
Refined Zinc - India 712,603 757,732 675,000 747,150 791,100
Refined Lead - India 57,299 91,398 117,500 150,540 154,400
Silver - India 147 208 375 420 440
Zinc International 93,200 445,000 425,000 396,500 376,675
Power - SEL (Mn units) 210 5,638 7,529 10,973 12,968
Realizations (US$/t)
LME Aluminium 2,257 2,177 1,974 2,050 2,150
LME Zinc 2,185 2,099 1,948 2,000 2,040
LME Lead 2,244 2,268 2,110 2,100 2,142
Copper (TC/RC) 11.9 14.0 12.8 14.5 14.0
Power - SEL (Rs/unit) 3.4 3.4 3.33 3.1 3.1
Source: Company, Centrum Research Estimates

10
Financials-consolidated
Exhibit 7: Income Statement Y/E March (Rsmn) FY11 FY12 FY13 FY14E FY15E
Revenues 302,481 409,668 449,219 412,638 455,220Growth in revenues (%) 23.5 35.4 9.7 (8.1) 10.3
Raw material consumed 149,380 187,123 207,484 199,735 222,517
% of net sales 49.4 45.7 46.2 48.4 48.9
Employee expenses 11,317 16,122 18,799 15,364 0
% of net sales 3.7 3.9 4.2 3.7 -
Power & Fuel 23,796 40,401 44,196 36,874 41,080
% of net sales 7.9 9.9 9.8 8.9 9.0
Total expenses 223,790 310,104 346,934 307,284 342,334
% of net sales 74.0 75.7 77.2 74.5 75.2
EBITDA 80,495 101,686 104,689 107,998 115,795Y-o-y growth (%) 24.3 26.3 3.0 3.2 7.2
EBITDA Margin (%) 26.6 24.8 23.3 26.2 25.4
Depreciation & Amortisation 10,301 18,298 20,318 22,852 25,584
EBIT 70,193 83,388 84,371 85,146 90,211
Interest expenses 3,012 8,524 9,222 13,051 11,651
Other Income 24,724 31,632 34,532 31,350 36,575
EBT bef. Excep. Items 91,905 106,496 109,681 103,445 115,134
Excep. items 568 4,726 1,175 - -
EBT 91,337 101,769 108,506 103,445 115,134Provision for tax 18,116 21,106 16,184 20,689 23,027
Effective tax rate (%) 19.8 20.7 14.9 20.0 20.0
Profit after tax 73,220 77,611 92,490 82,756 92,108Minority Interest 19,945 21,609 25,289 24,981 26,661
Share in profit/loss of asso. (2,850) (7,723) (6,598) (5,050) (4,484)
Net Profit for the group 50,425 48,279 60,603 52,724 60,963Y-o-y growth (%) 34.7 (4.3) 25.5 (13.0) 15.6
Adjusted Net Profit Margin (%) 16.7 11.8 13.5 12.8 13.4
Source: Company, Centrum Research Estimates
Exhibit 8: Balance Sheet Y/E March (Rsmn) FY11 FY12 FY13 FY14E FY15E
Equity Share Capital 3,362 3,362 3,362 3,362 3,362
Reserves & surplus 410,316 450,123 501,680 542,067 588,764
Shareholders' fund 413,678 453,484 505,041 545,428 592,125
Total Debt 118,456 149,941 196,450 176,450 156,450
Deferred Tax Liability 21,789 22,083 23,993 23,993 23,993
Total Capital Employed 662,306 763,224 895,086 945,505 1,003,347Gross Block 311,886 372,898 451,837 520,587 568,087
Less: Acc. Depreciation 73,990 92,288 112,606 135,458 161,042
Net Block 237,896 280,610 339,231 385,129 407,045
Capital WIP 99,180 120,899 114,149 109,899 111,899
Net Fixed Assets 337,076 401,509 453,380 495,028 518,944
Investments 129,553 181,406 178,556 218,556 258,556
Cash 81,489 59,239 93,857 86,750 107,626
Trade Receivables 16,183 18,182 16,382 16,958 18,708
Loans & Advances 129,668 146,515 180,733 160,733 145,733
Inventories 51,547 44,981 70,765 54,722 51,585
Total Current Asset 282,623 273,110 367,102 324,527 329,016
Current Liab. & Prov. 86,945 92,802 103,951 92,606 103,169
Net Current Asset 195,678 180,308 263,151 231,921 225,847
Total Assets 662,306 763,224 895,086 945,505 1,003,347
Source: Company, Centrum Research Estimates
Exhibit 9: Cash flow Y/E March (Rsmn) FY11 FY12 FY13 FY14E FY15E
PBT 91,337 98,717 108,674 103,445 115,134Interest 3,012 8,524 9,222 13,051 11,651
Depreciation 10,301 18,298 20,318 22,852 25,584
Change in working capital (21,771) (6,880) (48,225) 24,123 26,950
Tax 18,116 21,106 16,184 20,689 23,027
Cash flow from operations 93,822 127,180 107,602 172,813 187,438
Change in fixed assets 118,433 82,732 72,188 64,500 49,500
Change in investments (73,492) 51,853 (2,851) 40,000 40,000
Cash flow from investments (46,067) (134,585) (69,338) (104,500) (89,500)
Change in equity capital (317) - - - -
Change in debt 25,860 31,485 46,509 (20,000) (20,000)
Dividends paid 4,747 8,473 9,046 12,338 14,265
Interest paid 3,012 8,524 9,222 13,051 11,651
Cash flow from financing (5,012) (14,844) (3,647) (75,420) (77,062)Net cash flow 42,743 (22,249) 34,618 (7,107) 20,876
Opening cash balance 38,746 81,489 59,239 93,857 86,750
Closing cash balance 81,489 59,239 93,857 86,750 107,626
Free Cash Flow (24,611) 44,448 35,414 108,313 137,938
Source: Company, Centrum Research Estimates
Exhibit 10: Key Ratios Y/E March FY11 FY12 FY13 FY14E FY15E
Margin Ratios (%)
EBITDA Margin 26.6 24.8 23.3 26.2 25.4
PBIT Margin 23.2 20.4 18.8 20.6 19.8
PBT Margin 30.2 24.8 24.2 25.1 25.3
PAT Margin 16.7 11.8 13.5 12.8 13.4
Growth Ratio (%)
Revenue 23.5 35.4 9.7 (8.1) 10.3
EBITDA 24.3 26.3 3.0 3.2 7.2
Net Profit 34.7 (4.3) 25.5 (13.0) 15.6
Return Ratios (%)
ROE 12.2 10.6 12.0 9.7 10.3
ROCE 10.6 10.9 9.4 9.0 9.0
ROIC 14.3 15.4 14.3 13.5 14.5
Turnover Ratios
Asset turnover ratio (x) 0.5 0.5 0.5 0.4 0.5
Debtors (days) 19.5 16.2 13.3 15.0 15.0
Inventory (days) 84.1 52.9 74.4 65.0 55.0
Creditor (days) 141.8 109.2 109.4 110.0 110.0
Per share Ratios (Rs)
Basic EPS 15.0 14.4 18.0 15.7 18.1
Fully diluted EPS 14.6 14.0 17.6 15.3 17.7
Book value 123.1 134.9 150.2 162.3 176.1
Cash earnings per share 18.1 19.8 24.1 22.5 25.7
Dividend per share 1.1 2.2 2.3 3.1 3.6
Gearing Ratio (x)
Debt-equity 0.3 0.3 0.4 0.3 0.3
Interest coverage ratio 23.3 9.8 9.1 6.5 7.7
Valuation (x)
P/E (Fully Diluted) 6.5 6.8 5.4 6.3 5.4
P/BV 0.8 0.7 0.6 0.6 0.5
EV/EBITDA 4.5 4.1 4.1 3.8 3.2
EV/Sales 1.2 1.0 0.9 1.0 0.8
M-cap/Sales 1.1 0.8 0.7 0.8 0.7
Source: Company, Centrum Research Estimates
11 Sesa Goa & Sterlite Industries
Appendix A
Disclaimer
Centrum Broking Limited (“Centrum”) is a full-service, Stock Broking Company and a member of The Stock Exchange, Mumbai (BSE) and National Stock Exchange of India Ltd. (NSE). Our holding company, Centrum Capital Ltd, is an investment banker and an underwriter of securities. As a group Centrum has Investment Banking, Advisory and other business relationships with a significant percentage of the companies covered by our Research Group. Our research professionals provide important inputs into the Group's Investment Banking and other business selection processes.
Recipients of this report should assume that our Group is seeking or may seek or will seek Investment Banking, advisory, project finance or other businesses and may receive commission, brokerage, fees or other compensation from the company or companies that are the subject of this material/report. Our Company and Group companies and their officers, directors and employees, including the analysts and others involved in the preparation or issuance of this material and their dependants, may on the date of this report or from, time to time have "long" or "short" positions in, act as principal in, and buy or sell the securities or derivatives thereof of companies mentioned herein. Centrum or its affiliates do not own 1% or more in the equity of this company Our sales people, dealers, traders and other professionals may provide oral or written market commentary or trading strategies to our clients that reflect opinions that are contrary to the opinions expressed herein, and our proprietary trading and investing businesses may make investment decisions that are inconsistent with the recommendations expressed herein. We may have earlier issued or may issue in future reports on the companies covered herein with recommendations/ information inconsistent or different those made in this report. In reviewing this document, you should be aware that any or all of the foregoing, among other things, may give rise to or potential conflicts of interest. We and our Group may rely on information barriers, such as "Chinese Walls" to control the flow of information contained in one or more areas within us, or other areas, units, groups or affiliates of Centrum. Centrum or its affiliates do not make a market in the security of the company for which this report or any report was written. Further, Centrum or its affiliates did not make a market in the subject company’s securities at the time that the research report was published.
This report is for information purposes only and this document/material should not be construed as an offer to sell or the solicitation of an offer to buy, purchase or subscribe to any securities, and neither this document nor anything contained herein shall form the basis of or be relied upon in connection with any contract or commitment whatsoever. This document does not solicit any action based on the material contained herein. It is for the general information of the clients of Centrum. Though disseminated to clients simultaneously, not all clients may receive this report at the same time. Centrum will not treat recipients as clients by virtue of their receiving this report. It does not constitute a personal recommendation or take into account the particular investment objectives, financial situations, or needs of individual clients. Similarly, this document does not have regard to the specific investment objectives, financial situation/circumstances and the particular needs of any specific person who may receive this document. The securities discussed in this report may not be suitable for all investors. The securities described herein may not be eligible for sale in all jurisdictions or to all categories of investors. The countries in which the companies mentioned in this report are organized may have restrictions on investments, voting rights or dealings in securities by nationals of other countries. The appropriateness of a particular investment or strategy will depend on an investor's individual circumstances and objectives. Persons who may receive this document should consider and independently evaluate whether it is suitable for his/ her/their particular circumstances and, if necessary, seek professional/financial advice. Any such person shall be responsible for conducting his/her/their own investigation and analysis of the information contained or referred to in this document and of evaluating the merits and risks involved in the securities forming the subject matter of this document.
The projections and forecasts described in this report were based upon a number of estimates and assumptions and are inherently subject to significant uncertainties and contingencies. Projections and forecasts are necessarily speculative in nature, and it can be expected that one or more of the estimates on which the projections and forecasts were based will not materialize or will vary significantly from actual results, and such variances will likely increase over time. All projections and forecasts described in this report have been prepared solely by the authors of this report independently of the Company. These projections and forecasts were not prepared with a view toward compliance with published guidelines or generally accented accounting principles. No independent accountants have expressed an opinion or any other form of assurance on these projections or forecasts. You should not regard the inclusion of the projections and forecasts described herein as a representation or warranty by or on behalf of the Company, Centrum, the authors of this report or any other person that these projections or forecasts or their underlying assumptions will be achieved. For these reasons, you should only consider the projections and forecasts described in this report after carefully evaluating all of the information in this report, including the assumptions underlying such projections and forecasts.
The price and value of the investments referred to in this document/material and the income from them may go down as well as up, and investors may realize losses on any investments. Past performance is not a guide for future performance. Future returns are not guaranteed and a loss of original capital may occur. Actual results may differ materially from those set forth in projections. Forward-looking statements are not predictions and may be subject to change without notice. Centrum does not provide tax advice to its clients, and all investors are strongly advised to consult regarding any potential investment. Centrum and its affiliates accept no liabilities for any loss or damage of any kind arising out of the use of this report. Foreign currencies denominated securities are subject to fluctuations in exchange rates that could have an adverse effect on the value or price of or income derived from the investment. In addition, investors in securities such as ADRs, the value of which are influenced by foreign currencies effectively assume currency risk. Certain transactions including those involving futures, options, and other derivatives as well as non-investment-grade securities give rise to substantial risk and are not suitable for all investors. Please ensure that you have read and understood the current risk disclosure documents before entering into any derivative transactions.
This report/document has been prepared by Centrum, based upon information available to the public and sources, believed to be reliable. No representation or warranty, express or implied is made that it is accurate or complete. Centrum has reviewed the report and, in so far as it includes current or historical information, it is believed to be reliable, although its accuracy and completeness cannot be guaranteed. The opinions expressed in this document/material are subject to change without notice and have no obligation to tell you when opinions or information in this report change.
This report or recommendations or information contained herein do/does not constitute or purport to constitute investment advice in publicly accessible media and should not be reproduced, transmitted or published by the recipient. The report is for the use and consumption of the recipient only. This publication may not be distributed to the public used by the public media without the express written consent of Centrum. This report or any portion hereof may not be printed, sold or distributed without the written consent of Centrum.
The distribution of this document in other jurisdictions may be restricted by law, and persons into whose possession this document comes should inform themselves about, and observe, any such restrictions. Neither Centrum nor its directors, employees, agents or representatives shall be liable for any damages whether direct or indirect, incidental, special or consequential including lost revenue or lost profits that may arise from or in connection with the use of the information.
This document does not constitute an offer or invitation to subscribe for or purchase or deal in any securities and neither this document nor anything contained herein shall form the basis of any contract or commitment whatsoever. This document is strictly confidential and is being furnished to you solely for your information, may not be distributed to the press or other media and may not be reproduced or redistributed to any other person. The distribution of this report in other jurisdictions may be restricted by law and persons into whose possession this report comes should inform themselves about, and observe any such restrictions. By accepting this report, you agree to be bound by the fore going limitations. No representation is made that this report is accurate or complete.
The opinions and projections expressed herein are entirely those of the author and are given as part of the normal research activity of Centrum Broking and are given as of this date and are subject to change without notice. Any opinion estimate or projection herein constitutes a view as of the date of this report and there can be no assurance that future results or events will be consistent with any such opinions, estimate or projection.

12 Sesa Goa & Sterlite Industries
This document has not been prepared by or in conjunction with or on behalf of or at the instigation of, or by arrangement with the company or any of its directors or any other person. Information in this document must not be relied upon as having been authorized or approved by the company or its directors or any other person. Any opinions and projections contained herein are entirely those of the authors. None of the company or its directors or any other person accepts any liability whatsoever for any loss arising from any use of this document or its contents or otherwise arising in connection therewith.
Centrum and its affiliates have not managed or co-managed a public offering for the subject company in the preceding twelve months. Centrum and affiliates have not received compensation from the companies mentioned in the report during the period preceding twelve months from the date of this report for service in respect of public offerings, corporate finance, debt restructuring, investment banking or other advisory services in a merger/acquisition or some other sort of specific transaction.
As per the declarations given by them, Mr. Abhisar Jain, research analyst and and/or any of his family members do not serve as an officer, director or any way connected to the company/companies mentioned in this report. Further, as declared by him, he has not received any compensation from the above companies in the preceding twelve months. Our entire research professionals are our employees and are paid a salary. They do not have any other material conflict of interest of the research analyst or member of which the research analyst knows of has reason to know at the time of publication of the research report or at the time of the public appearance.
While we would endeavour to update the information herein on a reasonable basis, Centrum, its associated companies, their directors and employees are under no obligation to update or keep the information current. Also, there may be regulatory, compliance or other reasons that may prevent Centrum from doing so.
Non-rated securities indicate that rating on a particular security has been suspended temporarily and such suspension is in compliance with applicable regulations and/or Centrum policies, in circumstances where Centrum is acting in an advisory capacity to this company, or any certain other circumstances
Key to Centrum Investment Rankings:
Stock to Sector Sector to Market Stock to Market
Outperform Buy
Neutral Buy Outperform
Underperform Accumulate
Outperform Neutral
Neutral Neutral Neutral
Underperform Neutral
Outperform Reduce
Neutral Sell Underperform
Underperform Sell
Accumulate: Add on decline; Reduce: Sell on rise
Stock to Sector – This is the relative rating of the stock to the sector and reflects its relative attractiveness vis-à-vis other coverage stocks in the sector.
Sector to Market – This is the relative rating of the sector vis-à-vis the other sectors in the coverage space. This is derived based on the conviction of the analyst on a sector and macro view outlined in market strategy.
Stock to Market – The final rating on the stock is obtained as a combination of the “stock to sector” and “sector to market” view as outlined in the table above.
13 Sesa Goa & Sterlite Industries
Member (NSE, BSE, MCX-SX), Depository Participant (CDSL) and SEBI registered Portfolio Manager
Registration Nos. CAPITAL MARKET SEBI REGN. NO.: BSE: INB011454239, NSE: INB231454233
DERIVATIVES SEBI REGN. NO.: NSE: INF231454233 (TRADING & SELF CLEARING MEMBER) CDSL DP ID: 12200. SEBI REGISTRATION NO.: IN-DP-CDSL-661-2012
PMS REGISTRATION NO.: INP000004383 MCX – SX (Currency Derivative segment) REGN. NO.: INE261454236
Website: www.centrum.co.in Investor Grievance Email ID: [email protected]
Compliance Officer Details:
Mr. Sriram Venkatasubramanian; Tel: (022) 4215 9000; Email ID: [email protected]
Centrum Broking Limited Registered Office Address
Bombay Mutual Building ,
2nd Floor,
Dr. D. N. Road, Fort, Mumbai - 400 001
Correspondence Address
Centrum House
6th Floor, CST Road, Near Vidya Nagari Marg, Kalina,
Santacruz (E), Mumbai 400 098.
Tel: (022) 4215 9000