serviceability in the design of bridge foundations 2005_paikowsky_tcm18-106816.… · 251...
TRANSCRIPT

251
Serviceability in the Design of Bridge Foundations S. G. Paikowsky Professor, Geotechnical Engineering Research Laboratory, Department of Civil & Environmental Engineering, University of Massachusetts Lowell, Lowell, MA 01854, USA. Email: [email protected], Principal, Geosciences Testing and Research, Inc. (GTR), 55 Middlesex St., Suite 225, N. Chelmsford, MA 01863, USA. ABSTRACT An ongoing research project supported by the USA National Cooperative Highway Research Program (NCHRP) under the Transportation Research Board (TRB) of the National Academy of Science is aimed at developing the AASHTO LRFD Specifications for Serviceability in the Design of Bridge Foundations. The AASHTO specifications are traditionally observed on all federally aided projects and generally viewed as a national code of US highway practice, hence influencing the construction of all highway bridges throughout the USA. The main challenges in the development of the specifications include; establishing serviceability criteria, compilation of databases for foundation displacements, determination of analyses methods and their uncertainty as well as development of methodology and LRFD parameters for serviceability. The various stages of the project are outlined and examples are provided. The need for a multiphase approach in the development of serviceability criteria is presented and its feasibility is demonstrated. 1 INTRODUCTION A demand for a more economical design, and an attempt to improve structural safety has resulted over the past 50 years in the re-examination of the entire design process. A design of a structure need to ensure that while being economically viable, it will suit the intended purpose during its working life. Limit State (LS) is a condition beyond which the structure (i.e. bridge in the relevant case), or a component, fails to fulfil in some way the intended purpose for which it was designed. Limit State Design (LSD) comes to meet the requirements for safety, serviceability, and economy. LSD generally refers, therefore, to two types of limit states; Ultimate Limit State (ULS), which deals with the maximum loading capacity of the structure, and Serviceability Limit State (SLS), which deals with the functionality and service requirements of a structure to ensure adequate performance under expected conditions (e.g. normal expected loads, impact, or earthquake). The ULS design of a structure and its components (e.g. column, pile) depends upon the predicted loads and the capacity of the component to resist them. Both loads and capacity have various sources and levels of uncertainty. Engineering design has historically compensated for these uncertainties by using experience and subjective judgment. The new approach that has been evolved aims to quantify these uncertainties and achieve more rational engineering designs with consistent levels of reliability. These uncertainties can be quantified
252
using probability-based methods resulting with the Load and Resistance Factor Design (LRFD) allowing to separate uncertainties in loading from uncertainties in resistance, and then to use procedures from probability theory to assure a prescribed margin of safety. The same principles used in the LRFD for ULS can be applied to the SLS, substituting the capacity of the component with a serviceability limit, may it be quantified deflection, crack, or vibration. Since failure under the SLS will not lead to collapse, the prescribed margin of safety can be smaller, i.e. the SLS can tolerate a higher probability for “failure” (i.e. exceedance of criteria) compared with that for the ULS. A variation of LRFD was first adopted by AASHTO (American Association of State Highway Transportation Officials) for the design of certain types of bridge superstructures in 1977 under a design procedure known as Load Factor Design (LFD). The AASHTO LRFD Bridge Design and Construction Specifications were published in 1994 based on NCHRP project 12-33. Since 1996 (16th edition, 1st LRFD addition) the AASHTO LRFD Specifications are applied to Geotechnical Engineering utilizing the work performed by Barker et al., (1991). This code was mostly based on adaptation of Working Stress Design (WSD) to LRFD and only marginally addresses the SLS. A continuous attempt has been made since to improve upon the scientific basis on which the specifications were developed, including NCHRP 20-7 Task 88, NCHRP 12-35 and 12-55 for earth pressures and retaining walls, NCHRP 12-24 for soil-nailing, and NCHRP 24-17 that calibrated for the first time the LRFD parameters for deep foundations based on extensive databases of deep foundation testing (NCHRP Report 507, Paikowsky, 2004). The current study (NCHRP 12-66) is a major effort addressing the needs of SLS in design of bridge foundations. A complete approach requires developing serviceability criteria for bridges based on foundation performance, defining methods for the evaluation of foundation displacements and establishing their uncertainty, and calibrating the resistance factors assigned for the use of these methods based on the established SLS and a decided target reliability. The main challenges of the study are:
1. Establish serviceability criteria for bridges under normal operation. 2. Compile large high quality databases for foundation displacements. 3. Determine the analyses methods used for calculating foundation displacements
and establish their uncertainty. 4. Develop methodology and establish LRFD parameters for serviceability.
The following sections outline briefly the aforementioned challenges and some of the preliminary results obtained in the study. 2 SERVICEABILITY CRITERIA OF BRIDGES A limit state is a point at which the structure fails to serve its intended purpose in some way. Serviceability Limit State (SLS), deals with the functionality and service requirements of a structure to ensure adequate performance under expected conditions (e.g. normal expected loads, impact, or earthquake). Unlike ultimate limit state, serviceability limit state is more subjective and deals with the everyday usefulness of the structure, or the in-service performance. In order for the structure to fulfil the requirements for SLS, the structure must perform satisfactorily under normal service loads without causing discomfort to the users by giving them an unsafe perception or disrupting the functions of the structural system, e.g. the passage of vehicles on the bridge. SLS is generally classified in one of three ways: deflections, cracks, and vibrations. Unacceptable deflections may affect the efficient use of the structure. Cracks and other local damage may reduce the durability of the structure and affect the efficiency of the structural elements. Excessive vibrations may affect the non-structural elements while deflections and cracks may also spoil the aesthetic appearance of the structure. Deflections and vibrations may also affect the transportation on the bridge. Excessive deflections, cracks, or vibrations may cause discomfort and an unsafe perception to the motorists and pedestrians. In foundations, SLS is defined by deformation or settlement of foundations and deterioration of the structure or the foundation system.
253
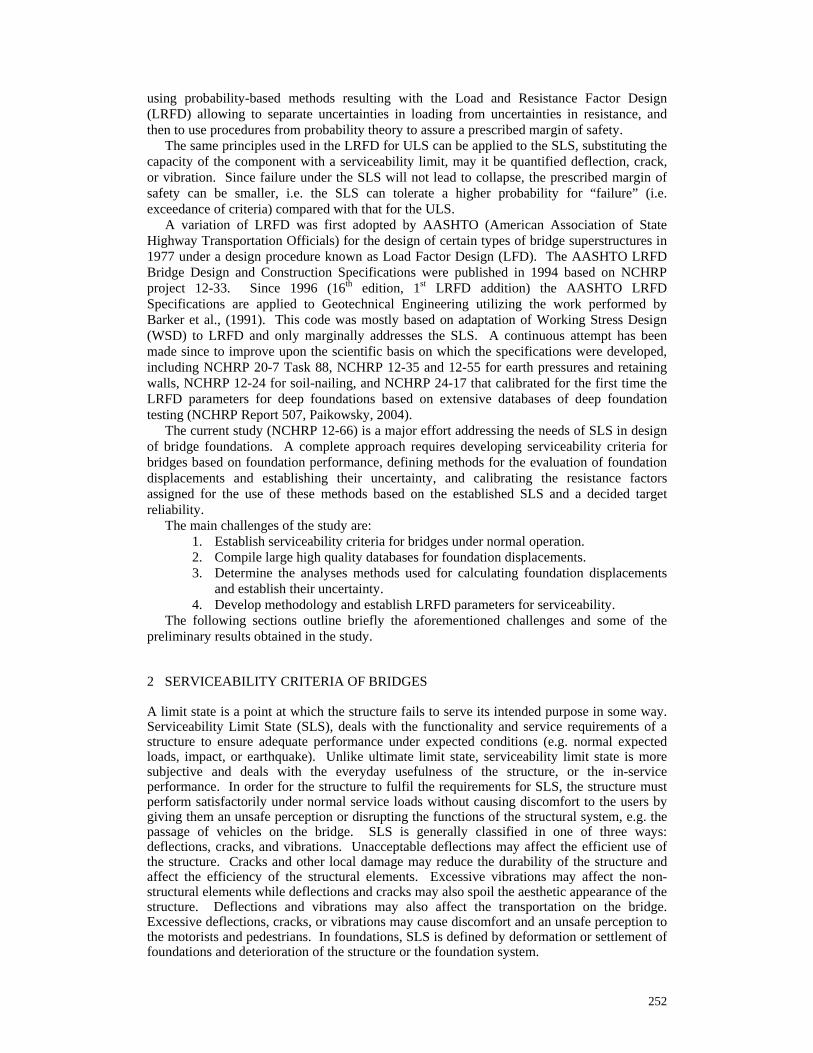
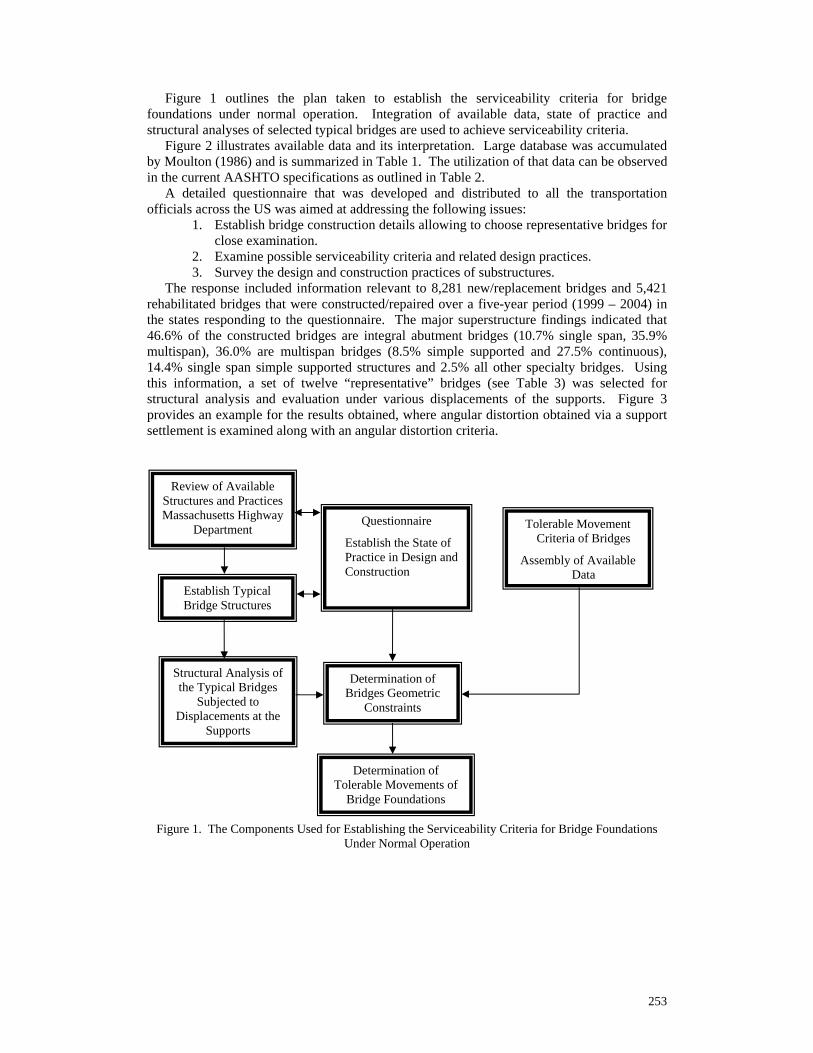
Figure 1 outlines the plan taken to establish the serviceability criteria for bridge foundations under normal operation. Integration of available data, state of practice and structural analyses of selected typical bridges are used to achieve serviceability criteria. Figure 2 illustrates available data and its interpretation. Large database was accumulated by Moulton (1986) and is summarized in Table 1. The utilization of that data can be observed in the current AASHTO specifications as outlined in Table 2. A detailed questionnaire that was developed and distributed to all the transportation officials across the US was aimed at addressing the following issues:
1. Establish bridge construction details allowing to choose representative bridges for close examination.
2. Examine possible serviceability criteria and related design practices. 3. Survey the design and construction practices of substructures.
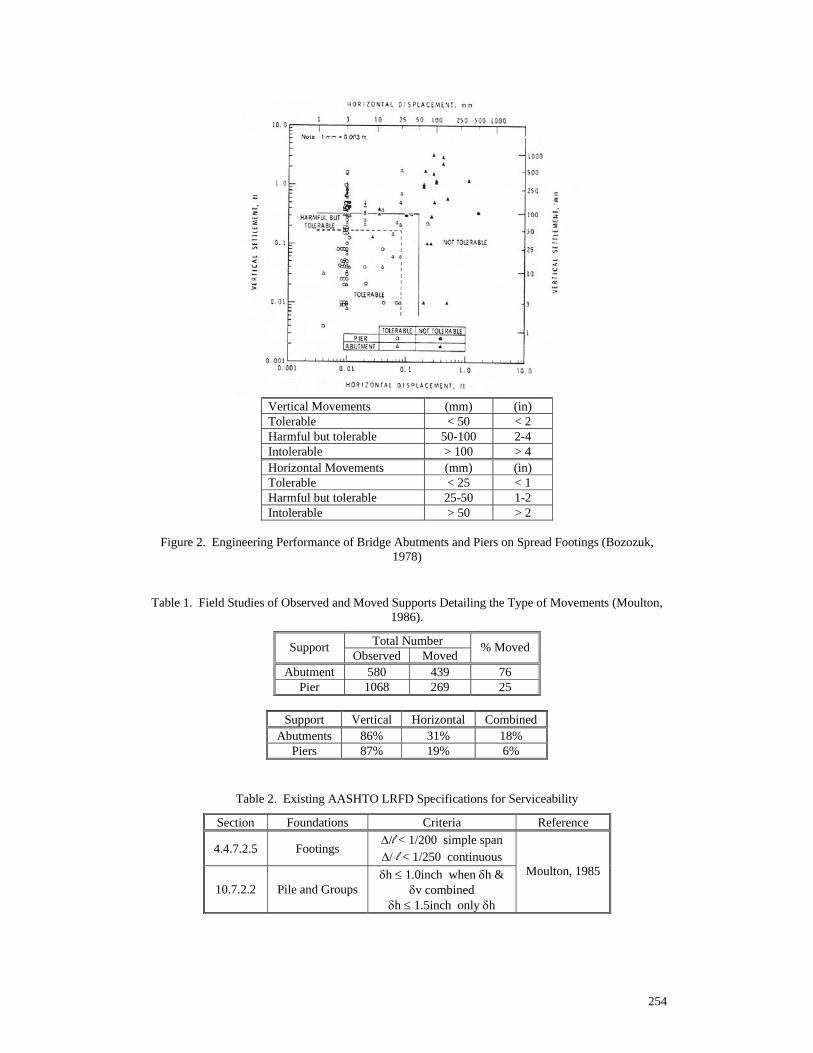
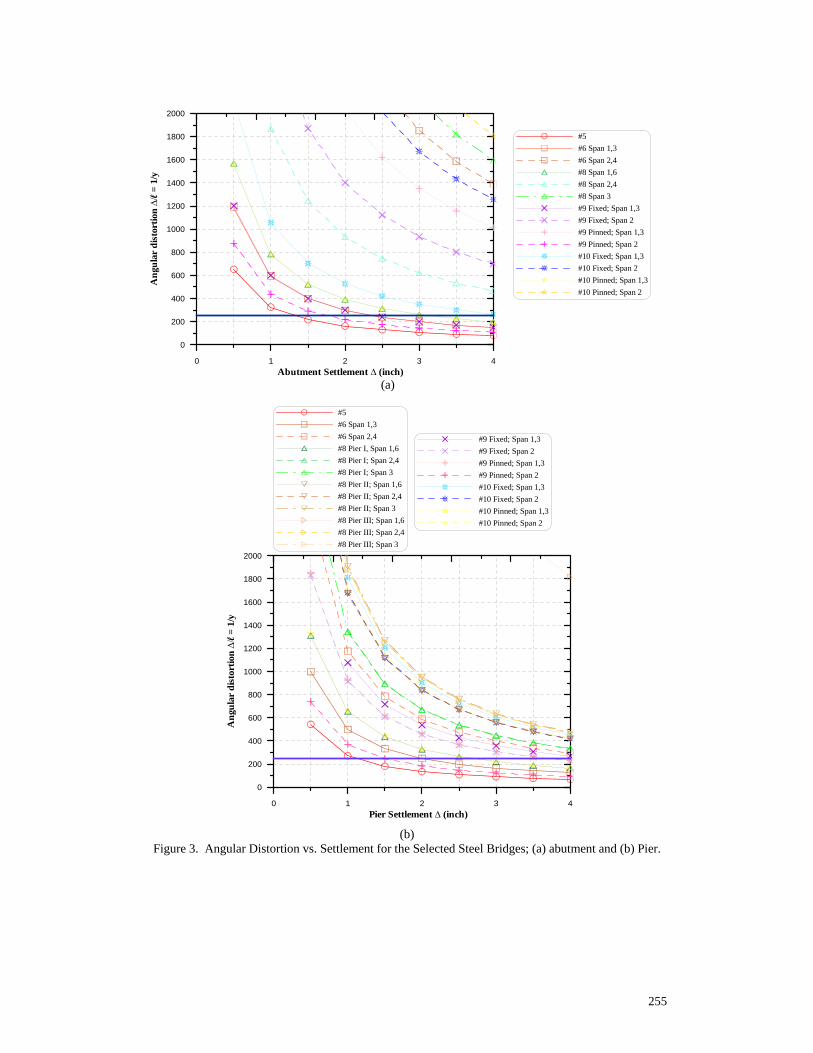
The response included information relevant to 8,281 new/replacement bridges and 5,421 rehabilitated bridges that were constructed/repaired over a five-year period (1999 – 2004) in the states responding to the questionnaire. The major superstructure findings indicated that 46.6% of the constructed bridges are integral abutment bridges (10.7% single span, 35.9% multispan), 36.0% are multispan bridges (8.5% simple supported and 27.5% continuous), 14.4% single span simple supported structures and 2.5% all other specialty bridges. Using this information, a set of twelve “representative” bridges (see Table 3) was selected for structural analysis and evaluation under various displacements of the supports. Figure 3 provides an example for the results obtained, where angular distortion obtained via a support settlement is examined along with an angular distortion criteria.
Figure 1. The Components Used for Establishing the Serviceability Criteria for Bridge Foundations
Under Normal Operation
Review of Available Structures and Practices Massachusetts Highway
Department Questionnaire
Establish the State of Practice in Design and Construction
Tolerable Movement Criteria of Bridges
Assembly of Available Data
Establish Typical Bridge Structures
Determination of Bridges Geometric
Constraints
Determination of Tolerable Movements of
Bridge Foundations
Structural Analysis of the Typical Bridges
Subjected to Displacements at the
Supports
254
Vertical Movements (mm) (in) Tolerable < 50 < 2 Harmful but tolerable 50-100 2-4 Intolerable > 100 > 4 Horizontal Movements (mm) (in) Tolerable < 25 < 1 Harmful but tolerable 25-50 1-2 Intolerable > 50 > 2
Figure 2. Engineering Performance of Bridge Abutments and Piers on Spread Footings (Bozozuk,
1978) Table 1. Field Studies of Observed and Moved Supports Detailing the Type of Movements (Moulton,
1986).
Total Number Support Observed Moved
% Moved
Abutment 580 439 76 Pier 1068 269 25
Support Vertical Horizontal Combined
Abutments 86% 31% 18% Piers 87% 19% 6%
Table 2. Existing AASHTO LRFD Specifications for Serviceability
Section Foundations Criteria Reference
4.4.7.2.5 Footings Δ/l < 1/200 simple span Δ/ l < 1/250 continuous
10.7.2.2 Pile and Groups δh ≤ 1.0inch when δh &
δv combined δh ≤ 1.5inch only δh
Moulton, 1985
255
(b)
Figure 3. Angular Distortion vs. Settlement for the Selected Steel Bridges; (a) abutment and (b) Pier.
0 1 2 3 4Abutment Settlement Δ (inch)
0
200
400
600
800
1000
1200
1400
1600
1800
2000
Ang
ular
dis
tort
ion
Δ/l =
1/y
#5#6 Span 1,3#6 Span 2,4#8 Span 1,6#8 Span 2,4#8 Span 3#9 Fixed; Span 1,3#9 Fixed; Span 2#9 Pinned; Span 1,3#9 Pinned; Span 2#10 Fixed; Span 1,3#10 Fixed; Span 2#10 Pinned; Span 1,3#10 Pinned; Span 2
0 1 2 3 4Pier Settlement Δ (inch)
0
200
400
600
800
1000
1200
1400
1600
1800
2000
Ang
ular
dis
tort
ion
Δ/l =
1/y
#5#6 Span 1,3#6 Span 2,4#8 Pier I, Span 1,6#8 Pier I; Span 2,4#8 Pier I; Span 3#8 Pier II; Span 1,6#8 Pier II; Span 2,4#8 Pier II; Span 3#8 Pier III; Span 1,6#8 Pier III; Span 2,4#8 Pier III; Span 3
#9 Fixed; Span 1,3#9 Fixed; Span 2#9 Pinned; Span 1,3#9 Pinned; Span 2#10 Fixed; Span 1,3#10 Fixed; Span 2#10 Pinned; Span 1,3#10 Pinned; Span 2
(a)

256
Table 3. Number of Bridges per Type and Span Selected as “Typical” Bridges (represent 97.5% of Constructed Bridges)
Bridge Type / Case No. Span Length Simple Single
& Multi-Span Continuous Multi-Span
Integral Abutment
Short 20 – 125ft #1 #5 #9 *Medium 125 – 400ft #2, #3 #6, #7 #10, #11
Long > 400ft #4 #8 #12 * Steel & concrete construction for each medium span length bridge type
The integration of all the components in the above process, lead to the conclusion that a serviceability criteria need to be closely related to structural type and construction stage. Preliminary criteria were developed and presented in Table 4.
Table 4. Summary of Proposed Serviceability Criteria (Preliminary)
Criteria Bridge Type Limit State Limitations Comments
Angular distortion Simple Support Δ/l < 1/200
• l ≥ 50ft • subjected to limit vertical displacements
• exc. rigid frame structures
Angular distortion Continuous Δ/l < 1/250 • l ≥ 50ft steel • exc. integral abutment
bridges assuming pinned connection at the abutment
Steel ΔVA < 3in • l ≥ 50ft steel • I/l ≤ 20in3
Moulton, 1986, Table 7; Current study Table 4.14 Abutment differential
vert. displacement for bridge lifetime Concrete ΔVA < 3in • l ≥ 100ft Moulton, 1986, p.58;
Current study Table 4.14
Steel ΔVP < 2in • l ≥ 50ft Moulton, 1986, Table 7; Current study Table 4.14
Pier differential vert. displacement for bridge lifetime Concrete ΔVP < 2in
Steel ΔVA < 2in • l ≥ 50ft Abutment differential vert. displacement following bridge
completion Concrete ΔVA < 2in
Steel ΔVP < 1.25in Pier differential displacement
following bridge completion
Concrete ΔVP < 1.50in
Horiz. displacements All Substructures Δh < 1.5in Controlling criteria AASHTO; Moulton 1986,
Δh < 2.0in Horiz. displacements combined with vert.
displacements
All Substructures Δh < 1.0in Controlling criteria AASHTO; Moulton 1986,
Δh < 1.5in
3 DATABASES Five types of databases are required to address the needs of establishing the performance of the methods used for evaluating the displacements of bridge foundations. These databases are categorized according to the foundation type and loading conditions in the following way:
(a) Performance of driven piles under compression, tension and lateral loads subcategorized according to pile and soil types.
(b) Performance of In Place Constructed Deep Foundations (IPCDF, a.k.a. drilled foundations) under compression, tension and lateral load subcategorized according to construction methods and soil types.
257
(c) Performance of pile groups, categorized under installation method (driven vs. IPCDF), load direction (vertical and lateral) and soil types.
(d) Performance of shallow foundations categorized according to foundation size (plate B < 1m, small 1m < B < 3m, large 3m < B < 6m, rafts B > 6m and tanks), load orientation and soil types.
(e) Performance of full-scale structures like bridge piers, abutments, complete bridges.
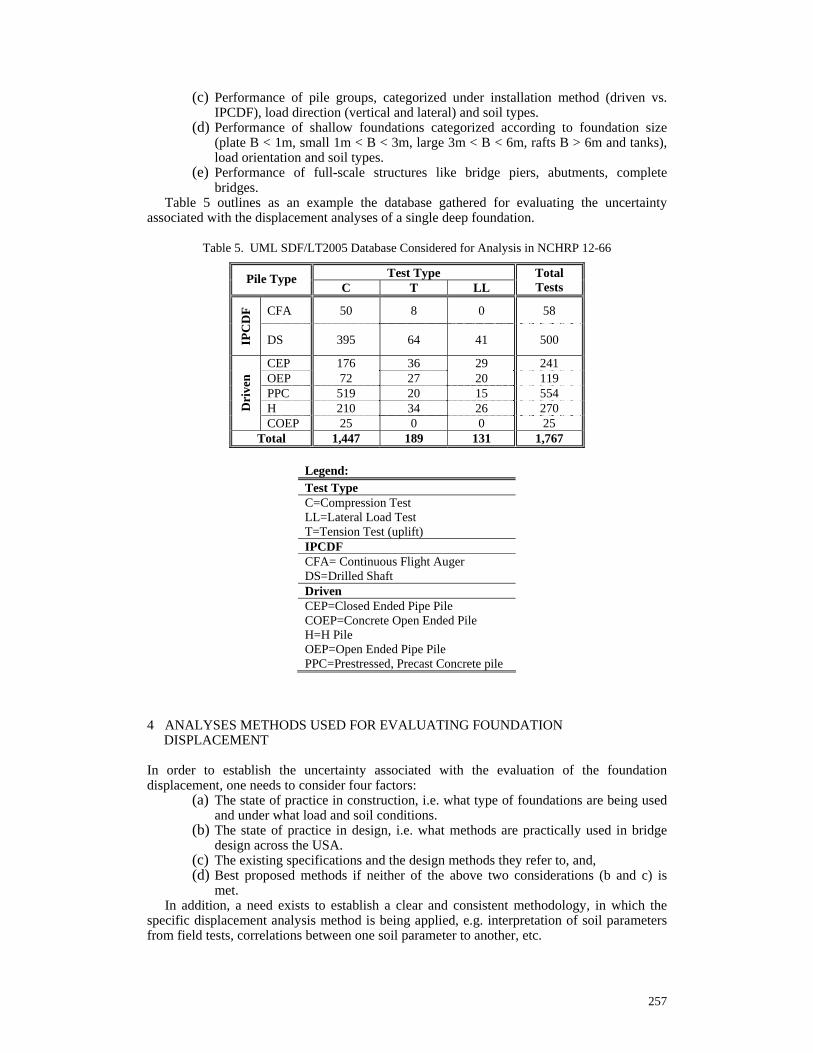
Table 5 outlines as an example the database gathered for evaluating the uncertainty associated with the displacement analyses of a single deep foundation.
Table 5. UML SDF/LT2005 Database Considered for Analysis in NCHRP 12-66
Test Type Pile Type C T LL
Total Tests
CFA 50 8 0 58
IPC
DF
DS 395 64 41 500
CEP 176 36 29 241 OEP 72 27 20 119 PPC 519 20 15 554 H 210 34 26 270 D
rive
n
COEP 25 0 0 25 Total 1,447 189 131 1,767
Legend: Test Type C=Compression Test LL=Lateral Load Test T=Tension Test (uplift) IPCDF CFA= Continuous Flight Auger DS=Drilled Shaft Driven CEP=Closed Ended Pipe Pile COEP=Concrete Open Ended Pile H=H Pile OEP=Open Ended Pipe Pile PPC=Prestressed, Precast Concrete pile
4 ANALYSES METHODS USED FOR EVALUATING FOUNDATION
DISPLACEMENT In order to establish the uncertainty associated with the evaluation of the foundation displacement, one needs to consider four factors:
(a) The state of practice in construction, i.e. what type of foundations are being used and under what load and soil conditions.
(b) The state of practice in design, i.e. what methods are practically used in bridge design across the USA.
(c) The existing specifications and the design methods they refer to, and, (d) Best proposed methods if neither of the above two considerations (b and c) is
met. In addition, a need exists to establish a clear and consistent methodology, in which the
specific displacement analysis method is being applied, e.g. interpretation of soil parameters from field tests, correlations between one soil parameter to another, etc.
258
The state of practice in construction was established via a questionnaire. An example of foundation alternatives and their use follows:
1. Foundation alternatives include 62% driven piles, 21% In Place Constructed Deep Foundations (IPCDF) and 17% shallow foundations.
2. Shallow foundations are founded on rock (55%), frictional soil (23%), IGM (19%), and cohesive soils (3%). About half of the shallow foundations built on clay are constructed with ground improvement measures, i.e. only about 0.25% of the total bridge foundations are built on clay with some states indicating they construct shallow foundations on rock only (AK, TN), don’t use shallow foundations at all (LA, TX) but utilize the analyses for retaining walls, etc. (TX).
3. Lateral loads in piers and abutments, respectively are resolved by batter driven piles (42%, 50%), vertical driven piles (30%), drilled shafts (25%, 17%), and pile cap resistance (1%). Rock anchored pipe piles are used in Maine and shallow foundations in limited cases in MA and CA.
4. Most batter piles range in batter between 1H:5V to 1H:9V 5. Lateral loading and movements due to embankments are considered by 69% of
the responders utilizing lateral earth pressure analysis and p-y lateral pile analysis (LPile).
6. Tension loads in piers and abutments are resolved by vertical driven piles (69%), drilled shafts in piers (35%) and in abutments (25%) with the remainder resolved by anchors.
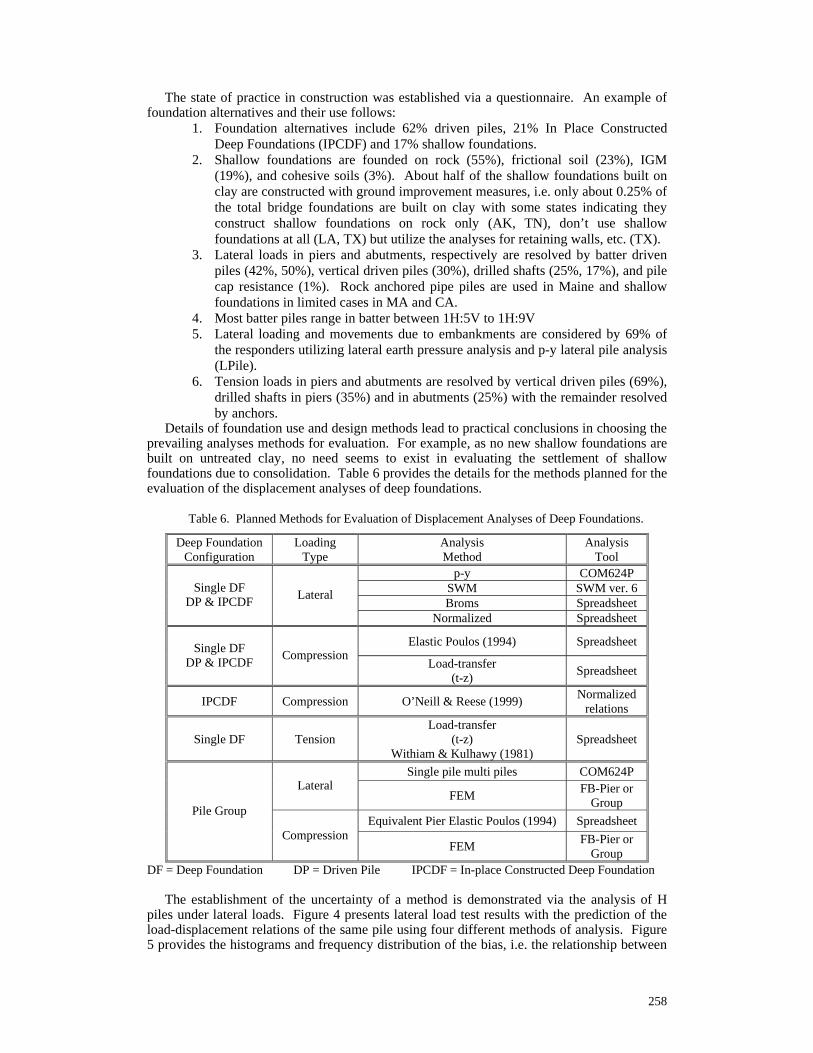
Details of foundation use and design methods lead to practical conclusions in choosing the prevailing analyses methods for evaluation. For example, as no new shallow foundations are built on untreated clay, no need seems to exist in evaluating the settlement of shallow foundations due to consolidation. Table 6 provides the details for the methods planned for the evaluation of the displacement analyses of deep foundations.
Table 6. Planned Methods for Evaluation of Displacement Analyses of Deep Foundations.
Deep Foundation Configuration
Loading Type
Analysis Method
Analysis Tool
p-y COM624P SWM SWM ver. 6 Broms Spreadsheet
Single DF DP & IPCDF Lateral
Normalized Spreadsheet
Elastic Poulos (1994) Spreadsheet Single DF DP & IPCDF Compression
Load-transfer (t-z) Spreadsheet
IPCDF Compression O’Neill & Reese (1999) Normalized relations
Single DF Tension Load-transfer
(t-z) Withiam & Kulhawy (1981)
Spreadsheet
Single pile multi piles COM624P Lateral
FEM FB-Pier or Group
Equivalent Pier Elastic Poulos (1994) Spreadsheet Pile Group
Compression FEM FB-Pier or
Group DF = Deep Foundation DP = Driven Pile IPCDF = In-place Constructed Deep Foundation
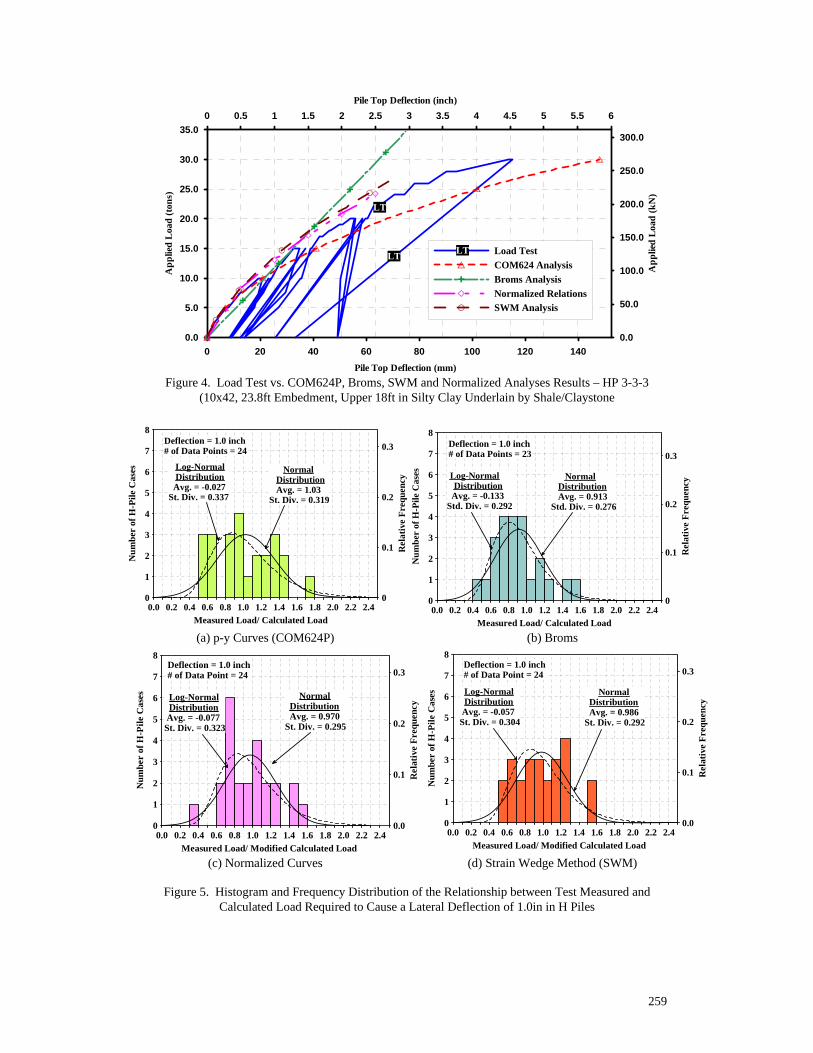
The establishment of the uncertainty of a method is demonstrated via the analysis of H
piles under lateral loads. Figure 4 presents lateral load test results with the prediction of the load-displacement relations of the same pile using four different methods of analysis. Figure 5 provides the histograms and frequency distribution of the bias, i.e. the relationship between
259
Figure 4. Load Test vs. COM624P, Broms, SWM and Normalized Analyses Results – HP 3-3-3 (10x42, 23.8ft Embedment, Upper 18ft in Silty Clay Underlain by Shale/Claystone
(a) p-y Curves (COM624P) (b) Broms (c) Normalized Curves (d) Strain Wedge Method (SWM)
Figure 5. Histogram and Frequency Distribution of the Relationship between Test Measured and
Calculated Load Required to Cause a Lateral Deflection of 1.0in in H Piles
0 1 2 3 4 5 60.5 1.5 2.5 3.5 4.5 5.5Pile Top Deflection (inch)
0.0
100.0
200.0
300.0
50.0
150.0
250.0
App
lied
Loa
d (k
N)
0 40 80 12020 60 100 140Pile Top Deflection (mm)
0.0
10.0
20.0
30.0
5.0
15.0
25.0
35.0
App
lied
Loa
d (t
ons)
Load Test COM624 AnalysisBroms AnalysisNormalized RelationsSWM Analysis
LT
LT
LT
0.0 0.2 0.4 0.6 0.8 1.0 1.2 1.4 1.6 1.8 2.0 2.2 2.4Measured Load/ Calculated Load
0
1
2
3
4
5
6
7
8
Num
ber
of H
-Pile
Cas
es
0
0.1
0.2
0.3
Rel
ativ
e Fr
eque
ncy Normal
Distribution Avg. = 0.913Std. Div. = 0.276
Deflection = 1.0 inch# of Data Points = 23
Log-Normal Distribution Avg. = -0.133Std. Div. = 0.292
0.0 0.2 0.4 0.6 0.8 1.0 1.2 1.4 1.6 1.8 2.0 2.2 2.4Measured Load/ Modified Calculated Load
0
1
2
3
4
5
6
7
8
Num
ber
of H
-Pile
Cas
es
0.0
0.1
0.2
0.3
Rel
ativ
e Fr
eque
ncy
Deflection = 1.0 inch# of Data Point = 24
Log-Normal Distribution Avg. = -0.077St. Div. = 0.323
Normal Distribution Avg. = 0.970St. Div. = 0.295
0.0 0.2 0.4 0.6 0.8 1.0 1.2 1.4 1.6 1.8 2.0 2.2 2.4Measured Load/ Modified Calculated Load
0
1
2
3
4
5
6
7
8
Num
ber
of H
-Pile
Cas
es
0.0
0.1
0.2
0.3
Rel
ativ
e Fr
eque
ncy
Deflection = 1.0 inch# of Data Point = 24
Log-Normal Distribution Avg. = -0.057St. Div. = 0.304
Normal Distribution Avg. = 0.986St. Div. = 0.292
0.0 0.2 0.4 0.6 0.8 1.0 1.2 1.4 1.6 1.8 2.0 2.2 2.4Measured Load/ Calculated Load
0
1
2
3
4
5
6
7
8
Num
ber
of H
-Pile
Cas
es
0
0.1
0.2
0.3
Rel
ativ
e Fr
eque
ncy
Deflection = 1.0 inch# of Data Points = 24
Normal Distribution Avg. = 1.03St. Div. = 0.319
Log-Normal Distribution Avg. = -0.027St. Div. = 0.337
260
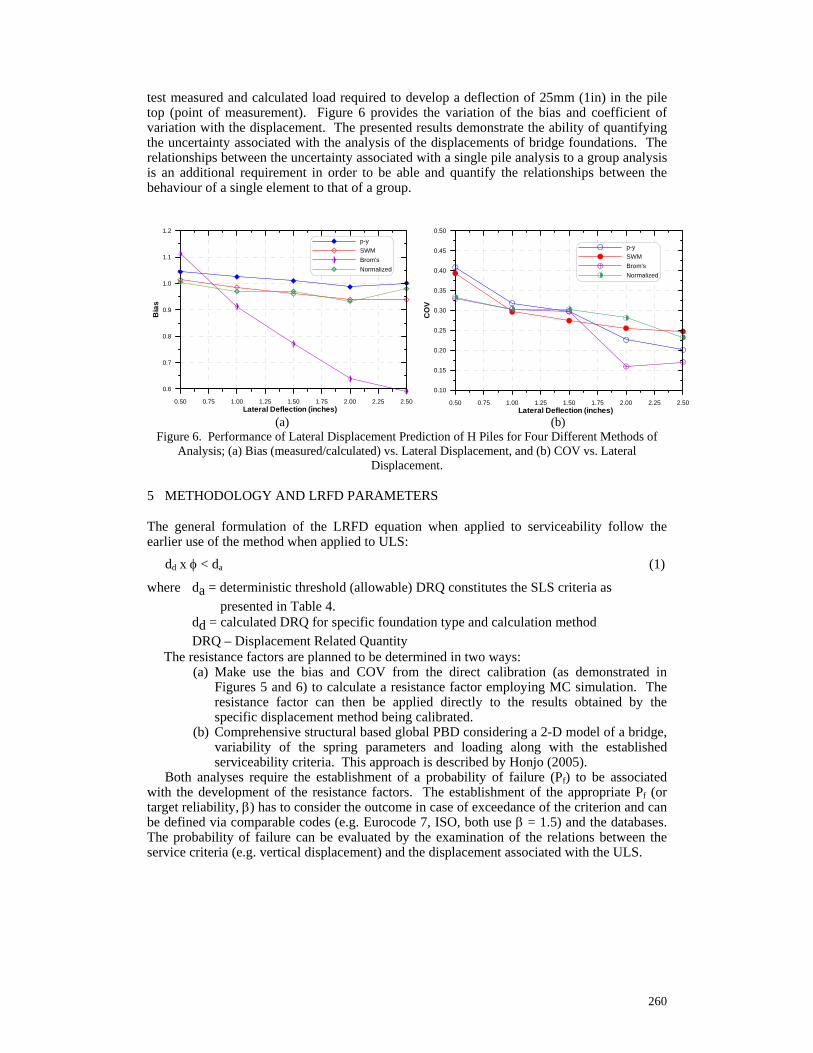
test measured and calculated load required to develop a deflection of 25mm (1in) in the pile top (point of measurement). Figure 6 provides the variation of the bias and coefficient of variation with the displacement. The presented results demonstrate the ability of quantifying the uncertainty associated with the analysis of the displacements of bridge foundations. The relationships between the uncertainty associated with a single pile analysis to a group analysis is an additional requirement in order to be able and quantify the relationships between the behaviour of a single element to that of a group.
(a) (b) Figure 6. Performance of Lateral Displacement Prediction of H Piles for Four Different Methods of
Analysis; (a) Bias (measured/calculated) vs. Lateral Displacement, and (b) COV vs. Lateral Displacement.
5 METHODOLOGY AND LRFD PARAMETERS The general formulation of the LRFD equation when applied to serviceability follow the earlier use of the method when applied to ULS:
dd x φ < da (1)
where da = deterministic threshold (allowable) DRQ constitutes the SLS criteria as presented in Table 4.
dd = calculated DRQ for specific foundation type and calculation method DRQ – Displacement Related Quantity
The resistance factors are planned to be determined in two ways: (a) Make use the bias and COV from the direct calibration (as demonstrated in
Figures 5 and 6) to calculate a resistance factor employing MC simulation. The resistance factor can then be applied directly to the results obtained by the specific displacement method being calibrated.
(b) Comprehensive structural based global PBD considering a 2-D model of a bridge, variability of the spring parameters and loading along with the established serviceability criteria. This approach is described by Honjo (2005).
Both analyses require the establishment of a probability of failure (Pf) to be associated with the development of the resistance factors. The establishment of the appropriate Pf (or target reliability, β) has to consider the outcome in case of exceedance of the criterion and can be defined via comparable codes (e.g. Eurocode 7, ISO, both use β = 1.5) and the databases. The probability of failure can be evaluated by the examination of the relations between the service criteria (e.g. vertical displacement) and the displacement associated with the ULS.
0.50 0.75 1.00 1.25 1.50 1.75 2.00 2.25 2.50Lateral Deflection (inches)
0.10
0.15
0.20
0.25
0.30
0.35
0.40
0.45
0.50
CO
V
p-ySWMBrom'sNormalized
0.50 0.75 1.00 1.25 1.50 1.75 2.00 2.25 2.50Lateral Deflection (inches)
0.6
0.7
0.8
0.9
1.0
1.1
1.2
Bia
s
p-ySWMBrom'sNormalized
261
6 CONCLUSIONS The quantitative development of serviceability based design requires a multiphase approach in establishing the serviceability criteria and the parameters used in design to comply by it. The development of such parameters and its use is feasible, but demands careful progress as most designers do not consider the serviceability requirements in routine design, and hence do not see the need for it.
The presented material needs, therefore, to be examined in the general context of design practices, which is expected to be available (to some extent) upon completion of the research study.
7 ACKNOWLEDGEMENTS
The presented research is sponsored by the American Association of State Highway and Transportation Officials (AASHTO), under project 12-66. The panel of the research project and Mr. David Beal of the NCHRP are acknowledged. The Research Team includes:
• Samuel G. Paikowsky (P.I.), and Mary Canniff of GTR, Inc. • Lu Ye, Yu Fu, Roiy Guy, Geotechnical Eng. Research Lab., University of
Massachusetts – Lowell • Zeidan Ashraf, Guy Levi, Wisam Mualem and Sam Frydman, Technion – Israel
Institute of Technology, Structural Engineering and Construction Management area of the Civil Engineering Department (during the PI sabbatical, Spring 2004).
• Japan Team including: Yusuke Honjo, Gifu University, Ikumasa Yoshida, Shuichi Suzuki, Hyoudou Junichi, TEPSCO, Tokyo, Masahiro Shirato, PWRI, Japan
• Susan Faraji, Faraji Consulting, Inc., Winchester, MA
REFERENCES AASHTO (1977). Standard Specifications for Highway Bridges: 16th Edition (1996 with 1997
interims). American Association of State Highway and Transportation Officials, Washington, DC. Barker, R., Duncan, J., Rojiani, K., Ooi, P., Tan, C., and Kim, S. (1991). Manuals for the Design of
Bridge Foundations, NCHRP Report 343, Transportation Research Board, National Research Council, Washington, D.C.
Bozozuk, M. (1978). “Bridge Foundation Move”, Transportation Research Record No. 678, Transportation Research Board, Washington, DC, pp. 17-21.
Honjo, Y. (2005). “Reliability Analysis for Serviceability and the Problems of Code Calibration”, ERTC10/GeoTechNet WP2 Workshop, Evaluation of Eurocode7, Trinity College, Dublin.
Moulton, L. (1986). Tolerable Movement Criteria for Highway Bridges, FHWA Report, FHWA-TS-85-228, February, pp. 86.
Moulton, L. (1985). Tolerable Movement Criteria for Highway Bridges, Federal Highway Administration Publication Report No. FHWA-TS-85-228, 93 pp.
O’Neill, M.W., and Reese, L.C. (1999). Drilled Shafts: Construction Procedures and Design Methods, Vol. 2, Publication No. FHWA-IF-99-025.
Paikowsky, S. (2004). NCHRP Report 507, Load and Resistance Factor Design (LRFD) for Deep Foundations, Transportation Research Board, National Research Council, Washington, DC.
Poulos, H.G. (1994). “Settlement Prediction for Driven Piles and Pile Groups,” Settlement ’94: Vertical and Horizontal Deformations of Foundations and Embankments, Texas A&M University, June 16-18, ASCE Geotechnical Special Publication No. 40, pp.1629-1649.
Withiam, J.L., and Kulhawy, F.H. (1981). “Analysis Procedure for Drilled Shaft Uplift Capacity”, Drilled Piers and Caissons, ASCE, pp. 82-97.