series f-92. indications of error 176-178 22 6. sampling error 179-180 22 b. estimation 181-193 22...
TRANSCRIPT


iii
CONTENTS
Paragraph Page INTRODUCTION 1-23 1
A. Purpose of the handbook 1-3 1 B. Methods of data collection 4-14 1 C. The importance of fieldwork 15-17 2 D. Related publications 18-23 3
I. PLANNING THE COLLECTION OF FERTILITY AND MORTALITY DATA 24-79 6 Introduction 24-26 6 A. Fertility and mortality data 27-55 6
1. Civil registration, census, and survey records 28-32 6 2. Counts of births, deaths, and persons 33-35 6 3. Rates and summary measures 36-40 7 4. Geographic classifications 41-48 7 5. Time and time period 49-55 8
B. Reviewing past data collection activities 56-66 8 1. Civil registration 57-58 9 2. Population censuses 59-60 9 3. General household surveys 61-62 10 4. Birth history surveys 63-64 10 5. Other methods 65 10 6. Overall assessment 66 10
C. Planning future data collection activities 67-78 10 1. Civil registration 68-72 10 2. Population censuses 73-75 11 3. General household surveys 76 11 4. Birth history surveys 77 11 5. Other methods 78 11
D. Coordinating data collection activities 79 11
II. FIELDWORK, DATA PROCESSING AND ARCHIVING 80-139 12 Introduction 80-82 12 A. Fieldwork 83-104 12
1. Planning 88-90 12 2. Form design 91-94 13 3. Recruitment and training 95-99 13 4. Supervision 100-102 13 5. Transmission of information 103-104 14
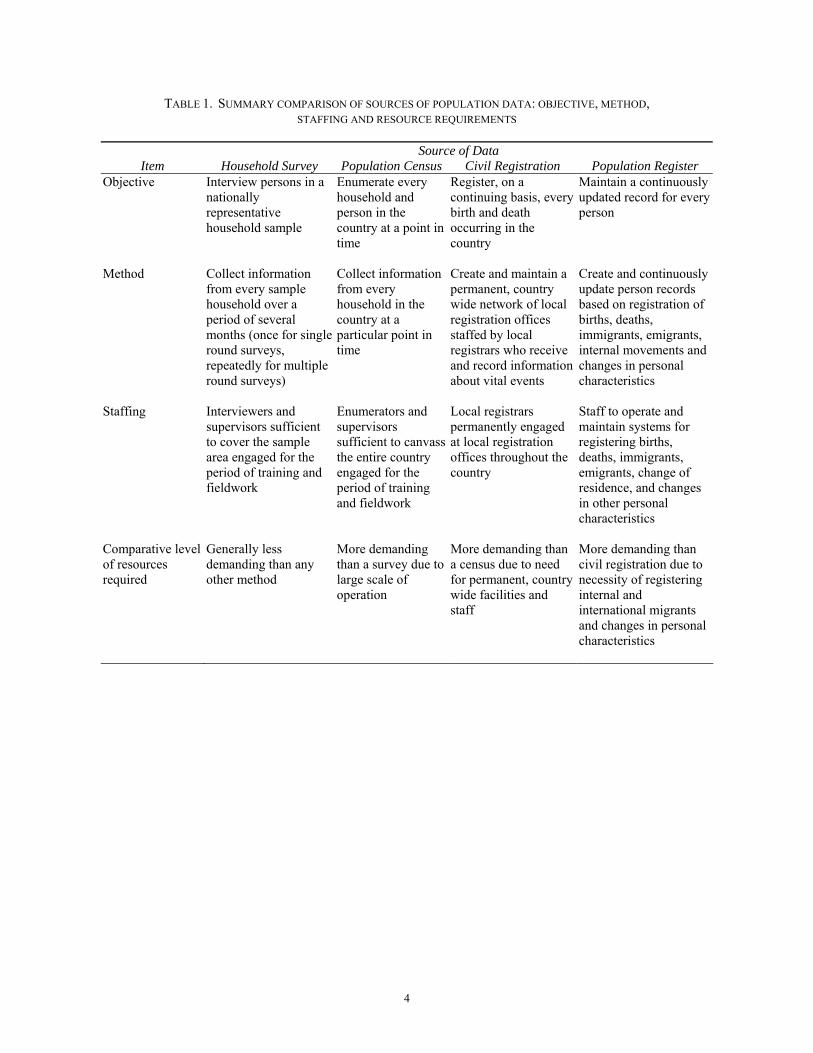
B. Data processing 105-126 14 1. Manual processing 107-110 14 2. Data entry 111-113 14 3. Computer editing 114-122 15 4. Tabulation 123-125 15 5. Other tasks 126 16
C. Archiving 127-139 16 1. Functions 130-133 16 2. Content 134-136 16 3. Security and maintenance 137-139 17
III. EVALUATION, ESTIMATION AND DISSEMINATION 140-226 18 Introduction 140-142 18 A. Evaluation 143-180 18
1. Quality of operations 145-146 18 2. Relevance and timeliness 147-148 18

iv
3. Data quality 149-161 18 4. Accuracy of estimates 162-175 20 5. Indications of error 176-178 22 6. Sampling error 179-180 22
B. Estimation
181-193
22
1. Civil registration data 183-186 23 2. Census and survey data 187-190 23 3. Level and trend from multiple estimates 191-193 24
C. Dissemination 194-226 24 1. Print publication 196 24 2. Data sets 197-203 24 3. Digital publication 204-209 25 4. Digital formats 210-212 25 5. Digital photocopies 213-216 26 6. Standard Generalized Markup Language (SGML) and Extensible Markup Language (XML)
217-226 26
IV. CIVIL REGISTRATION AS A SOURCE OF FERTILITY AND MORTALITY DATA
227-379 29
Introduction 227-231 29 A. Civil registration 232-281 29
1. Central agency for civil registration 236-237 29 2. Local registration offices 238 30 3. The process of registration 239-243 30 4. Birth and death registration records 244-248 30 5. Knowledge and responsibility in civil society 249 31 6. Tabulation programme 250-271 31 7. Publication programme 272-275 33 8. Quality of civil registration data 276-281 34
B. Calculation of birth and death rates using civil registration data 282-323 35 1. Exposure to risk 286-287 35 2. Classification by place of usual residence 288-292 35 3. Estimation of denominators 293-308 36 4. Birth and death rates at the national level 309-313 37 5. Birth and death rates for subnational geographic areas 314-318 38 6. Birth and death rates for population subgroups 319-323 38
C. Concepts of registration completeness 324-347 39 1. Components of unregistered births and deaths 328-330 39 2. Selectivity of registration 331-334 39 3. Date of occurrence and date of registration 335-337 40 4. Analysis of delayed registration 338-342 40 5. Trends in registration completeness 343-347 41
D. Utilization of incomplete civil registration data 348-363 41 1. Indications and estimates of incomplete registration 352-355 41 2. Aggregate comparisons with census and survey data 356-359 42 3. Use of patterns 360-363 43
E. Population registers as a source of fertility and mortality data 364-379 43 1. Concept 365-367 43 2. Registering immigrants and emigrants 368-372 44 3. Registering changes of residence 373-374 44 4. Registering changes in other personal characteristics 375-376 44 5. Creating and maintaining a population register 377-379 45

v
V. FERTILITY DATA FROM CENSUSES AND SURVEYS 380-559 46
Introduction 380-382 46 A. Reverse survival 383-419 46
1. Questions 386-391 46 2. Tabulation 392-393 47 3. Estimation 394-397 47 4. Quality 398-406 47 5. Age distribution errors 407-419 48
B. The own-children method 420-443 50 1. Questions 422-426 50 2. Tabulation 427 51 3. Estimation 428 51 4. Matching 429-436 51 5. Quality 437-443 52
C. Birth history reconstruction 444-472 53 1. Questions 449 53 2. Tabulation 450-462 53 3. Estimation 463-471 56 4. Quality 472 58
D. Children ever born 473-516 58 1. Questions 475-480 58 2. Tabulation 481-488 59 3. Estimation 489-508 60 4. Quality 509-516 62
E. Recent births 517-538 63 1. Questions 519-524 64 2. Tabulation 525-528 64 3. Estimation 529-530 65 4. Quality 531-538 65
F. Birth histories 539-559 66 1. Questions 542-550 66 2. Tabulation 551-552 67 3. Estimation 553 67 4. Quality 554-559 67
VI. MORTALITY DATA FROM CENSUSES AND SURVEYS 560-665 69 Introduction 560-564 69 A. Survival of children ever born 565-578 69
1. Questions 566-568 69 2. Tabulation 569-572 70 3. Estimation 573-574 70 4. Quality 575-578 71
B. Mortality data from birth histories 579-612 71 1. Questions 582 71 2. Tabulation 583-588 71 3. Estimation 589-595 73 4. Quality 596-612 75
C. Recent household deaths 613-635 79 1. Questions 618-623 79 2. Tabulations 624-625 81 3. Estimation 626-627 83 4. Quality 628-635 83
D. Survival of parents 636-651 84 1. Questions 637-638 84 2. Tabulation 639-640 84

vi
3. Estimation 641-643 84 4. Quality 644-651 85
E. Survival of siblings 652-665 86 1. Questions 653-658 86 2. Tabulation 659 86 3. Estimation 660 87 4. Quality 661-665 87
VII. CONCLUSION 666-681 88 A. Demographic research 667-668 88 B. Technological development 669-670 88 C. Users and user needs 671-673 88 D. Data collection environment 674-678 89 E. International cooperation 679-681 89
ANNEX
LEXIS DIAGRAMS 682-733 90 A. Lexis diagram representation 683-691 90 B. The method of extremes 692-694 91 C. The method of intersections 695-702 92 D. Age-specific death rates 703-707 93 E. Infant mortality rates 708-712 95 F. Reverse survival 713-718 96 G. Own-children 719-722 97 H. Children ever born 723-726 98 I. Birth histories 727-733 100
Glossary 102 References 107 Index 112 TABLES 1. Summary comparison of sources of population data: objective, method, staffing and resource
requirements 4
2. Summary comparison of sources of population data: timing and characteristics of information provided
5
3. Own-children tabulation 51 4. Women with one or more children ever born, by year of birth of first child and age of woman at
end of year of birth of first child 54
5. Women with two or more children ever born, by year of birth of second child and age of woman at end of year of birth of second child
55
6. Women with two or more children ever born, by year of second birth and completed years in parity 1 at end of year of birth of second child
56
7. Women with three or more children born, by year of second birth and completed years in parity 2 at end of year of birth of third child
57
8. Women, by age and number of children ever born, and total children ever born by age group of women
59
9. Births captured by birth history 68 10. Tabulation of children ever born and surviving for the estimation of mortality 70 11. Children by month of birth (months prior to interview), and deceased children by month of birth
(months prior to interview) and age at death, in completed months 72
12. Infant and child mortality statistics from birth history data, Myanmar 76

vii
FIGURES 1. Comparison of total fertility rate estimates for Pakistan 21 2. Lexis diagram representation of mortality data derived from a birth history 73 3. Lexis diagram illustrating the calculation of probabilities of death 74 4. Lexis diagram illustrating age-selection bias for mortality estimates calculated from birth history
data 77
BOXES 1. Data, statistics and population: terminology 9 2. Illustration of Extensible Markup Language (XML) 27 3. Recent household death questions, Tanzania census of 1988 80 4. Recent household death questions, 1988 census of Malawi 80 5. Recent household death questions, 1990 population census of China 81 6. Recent household death questions in the 1991 Population Changes and Fertility Survey of
Myanmar 82
ANNEX FIGURES A.1. Lexis diagram representation 90 A.2. Period-cohort sets of events 92 A.3. Age-cohort sets of events 93 A.4. Age-specific death rates 94 A.5. Infant mortality rates 95 A.6. Reverse survival 96 A.7. Own-children 98 A.8. Children ever born 99 A.9. Birth history data 101


1
INTRODUCTION
A. PURPOSE OF THE HANDBOOK 1. Social and economic planning and monitoring require information on numbers of births, deaths and population. Planning for the provision of maternal and child health services, for example, will take account of expected numbers of births in future years. The construction of schools and training of teachers will be guided by expected numbers of students at different grade levels. Employment policies will be based in part on expected numbers of persons entering and leaving the labour force. Social security systems must anticipate changes in the numbers of persons who will claim benefits. 2. Data on births, deaths and population are collected by several complementary methods. Different combinations of methods are appropriate in different circumstances. The present handbook provides detailed information on available methods that may be used to decide what combination will best suit national conditions. It describes, in addition, how the data produced by these methods may be used to derive basic fertility and mortality indicators. 3. The handbook will be useful to government officials and planners responsible for national statistical activities, to the heads of national statistical offices, to the heads of civil registration and vital statistics offices, and to subject-matter and data-processing specialists in those organizations. It will be useful to scholars, researchers and other persons who use fertility and mortality data, who will benefit from knowing something of how they are produced. It will also be of interest to staff of national and international organizations that provide funding and/or technical assistance for statistical work.
B. METHODS OF DATA COLLECTION
4. Three methods of data collection are commonly used to collect fertility and mortality data: population censuses, civil registration and household surveys.
• A population census collects information on economic and social characteristics of every person and household in the nation at a particular point in time. Population censuses are typically taken once every 10 years. One important use of population census data is the design of the samples for population surveys, noted below.
• Civil registration collects information on births, deaths and other vital events occurring in a country. Like the population census, civil registration aims at universal coverage. Unlike the population census, civil registration is a continuous operation. Births and deaths are to be registered within a short time of occurrence.
• Household surveys collect information for relatively small but scientifically designed samples of households. The relatively small sample size makes surveys less expensive and more flexible than population censuses and civil registration, but also less able to provide detailed information on small geographic areas and population subgroups.
5. None of the three methods exists solely or even primarily for the purpose of collecting fertility and mortality data. Population censuses, for example, generally provide information on place of residence and migration, household and family characteristics and educational and economic characteristics, as well as demographic information. Civil registration exists primarily for the purpose of legally documenting births, deaths and other vital events. Household surveys are deployed to collect many different kinds of information and are rarely limited to the collection of fertility and mortality data. 6. As sources of fertility and mortality data, population censuses, civil registration and surveys are complementary. Civil registration is the preferred method for collecting basic data on births and deaths and data on cause of death once complete registration has been achieved. Population censuses are generally required to provide numbers of persons for the calculation of rates and summary measures of fertility and mortality. Population census data are often used also to design the samples used in household surveys. Household surveys, in turn, are the most appropriate method for obtaining detailed data on conditions influencing fertility and mortality. Because of their flexibility and relatively low expense, household surveys are usually the best method for collecting data on topics of current interest. 7. Most countries recognize this complementarity by employing all three methods. The decision with

2
respect to the collection of fertility and mortality data will not be whether to conduct a population census or household survey, or to implement a civil registration system, but how to optimally coordinate the use of these three methods for the collection of fertility and mortality data. 8. Civil registration is the most demanding method of collecting data on births and deaths. More than half the world population lives in countries in which civil registration is lacking altogether or provides incomplete coverage of births and deaths. The development of civil registration systems that provide complete coverage of births and deaths has generally occurred over several decades, and in some cases over much longer periods. The creation and initial development of a civil registration system will usually be justified by its primary legal functions rather than by its secondary statistical functions. 9. In the absence of a fully developed civil registration system, population censuses and household surveys are used to collect data on births and deaths. Though a population census is a major enterprise, it is far less demanding than creating and maintaining a fully developed civil registration system. Almost every country in the world has taken at least one population census and achieved reasonably complete enumeration. Most countries have taken censuses at approximately 10-year intervals for many decades. 10. Population censuses and civil registration will provide information at the local level, even for the smallest local areas, because they cover all persons and all births and deaths. They will provide, for example, the number of persons in the catchment area of every primary health-care facility in the country, from which valuable indicators of the adequacy of service provision may be calculated. Primary and secondary schools are other examples of facilities that serve relatively small local areas. 11. When information is needed only for the country as a whole, however, or for relatively large areas, a household survey based on a scientifically designed sample will provide data at far less cost than a population census or civil registration system. The smaller scale of household survey operations has the additional advantage of making them more adaptable to changing information needs. 12. A few countries utilize population registers in conjunction with a fully developed civil registration system as a source of fertility and mortality data. Population registers are not generally a method of
data collection as such, but a way of organizing data collected by civil registration and other methods. 13. Table 1 summarizes the main features of household surveys, population censuses, civil registration and population registers as sources of fertility and mortality data. The comparative level of resources required to implement each source is indicated in the last two rows of the table. 14. Table 2 summarizes the timing and characteristics of the information provided by the four sources. Both tables aim to give a high level overview of typical characteristics. More detailed information is provided in the following chapters.
C. THE IMPORTANCE OF FIELDWORK
15. Fertility and mortality data are generated by fieldwork, during which members of the general public supply information about themselves, their families and the households in which they live, to fieldworkers representing the data-collection organization. The completeness and accuracy of data collected by any method depend on the quality of fieldwork. Fieldworkers are in this sense the most important people in every data-collection operation. Their position at the bottom of the organizational hierarchy should not be allowed to obscure this fundamental fact. 16. No aspect of data collection is more important than the recruitment, training and supervision of fieldworkers. Producing statistical information is a long and often complex process. The final result will be no better than the weakest link in the chain. Fieldwork is the first and most unforgiving link. Subsequent stages of the work may sometimes be redone if the first attempt fails. Fieldwork cannot be repeated, and most consequences of failures in fieldwork cannot be undone by later stages of processing. 17. An important practical constraint on all data-collection operations is that more questions, and more complicated questions, require more extensive training and supervision if they are to result in useful information. Population census and household survey planners are often besieged with requests to add questions of all kinds. These pressures must be resisted unless the necessary resources for recruiting, training and supervising fieldworkers can be made available.
3
D. RELATED PUBLICATIONS 18. Population censuses are discussed in the Principles and Recommendations for Population and Housing Censuses, Revision 1 (United Nations, 1998a). See also the Handbook on Census Management for Population and Housing Censuses (United Nations, 2000a), the Handbook on Population and Housing Census Editing (United Nations, 2001a), and the Handbook on Geographic Information Systems and Digital Mapping (United Nations 2000b). Cho (1976) and Cho and Hearn (1984) include copies of census questionnaires for numerous countries in Asia and the Pacific. 19. Civil registration systems are discussed in the Principles and Recommendations for a Vital Statistics System, Revision 2 (United Nations, 2001b), and in the five-volume Handbook on Civil Registration and Vital Statistics Systems (United Nations, 1998b, 1998c, 1998d, 1998e and 1998f). 20. Household surveys are discussed in Handbook of Household Surveys (United Nations, 1984). Sample design and implementation are presented in Sampling Frame and Sample Designs for Integrated Household Survey Programs – Preliminary Version (United Nations, 1986), the development and design of questionnaires in United Nations (1985), sampling errors in United Nations (1993) and non-sampling
errors in Non-Sampling Errors in Household Surveys: Sources, Assessment and Control – Preliminary Version (United Nations, 1982). 21. The experience of the World Fertility Survey (WFS) programme is reviewed in Cleland and Scott (1987), which also provides a guide to the literature of surveys aimed specifically at understanding fertility. The experience of the Demographic and Health Survey (DHS) programme is reviewed in Demographic and Health Surveys World Conference, August 5-7, 1991, Washington D.C. (Institute for Resource Development/Macro International, 1991). Voluminous detail is available in the various country reports and related publications of both the WFS and the DHS programmes. 22. Population registers are discussed in Methodology and Evaluation of Population Registers and Similar Systems (United Nations, 1969). Only a few countries use population registers as a source of fertility and mortality data. 23. A review of data collection for the estimation of fertility and mortality was undertaken by the United States National Academy of Sciences in the late 1970s (National Academy of Sciences, 1981). See also the survey paper by Cleland (1996). A very general treatment of data collection in developing countries is given in Casley and Lury (1981).
4
TABLE 1. SUMMARY COMPARISON OF SOURCES OF POPULATION DATA: OBJECTIVE, METHOD, STAFFING AND RESOURCE REQUIREMENTS
Source of Data
Item Household Survey Population Census Civil Registration Population Register Objective Interview persons in a
nationally representative household sample
Enumerate every household and person in the country at a point in time
Register, on a continuing basis, every birth and death occurring in the country
Maintain a continuously updated record for every person
Method Collect information from every sample household over a period of several months (once for single round surveys, repeatedly for multiple round surveys)
Collect information from every household in the country at a particular point in time
Create and maintain a permanent, country wide network of local registration offices staffed by local registrars who receive and record information about vital events
Create and continuously update person records based on registration of births, deaths, immigrants, emigrants, internal movements and changes in personal characteristics
Staffing Interviewers and supervisors sufficient to cover the sample area engaged for the period of training and fieldwork
Enumerators and supervisors sufficient to canvass the entire country engaged for the period of training and fieldwork
Local registrars permanently engaged at local registration offices throughout the country
Staff to operate and maintain systems for registering births, deaths, immigrants, emigrants, change of residence, and changes in other personal characteristics
Comparative level of resources required
Generally less demanding than any other method
More demanding than a survey due to large scale of operation
More demanding than a census due to need for permanent, country wide facilities and staff
More demanding than civil registration due to necessity of registering internal and international migrants and changes in personal characteristics

5
TABLE 2. SUMMARY COMPARISON OF SOURCES OF POPULATION DATA: TIMING AND CHARACTERISTICS OF INFORMATION PROVIDED
Source of Data
Item Household Survey Population Census Civil Registration Population Register Timing of data collection
Flexible Usually once per decade
Continuous
Continuous
Timing of reporting
Typically 1 month to 1 year after fieldwork
Typically 1-3 years for complete enumeration results
Typically annual reports within one year of end of reporting year
Insufficient experience
Data time reference
Data for 15 or more years prior to fieldwork
Data for 15 or more years prior to reference date (adult mortality data only 1-2 years)
Flexible (subject to limitations imposed by delayed registration)
Flexible
Geographic coverage
National and major divisions only (larger samples give more detail)
All geographic areas
All geographic areas, subject to incomplete registration
All geographic areas, subject to accurate registration of all migration
Other information detail
Potentially very detailed, but not for small groups, rare events, or cause of death
Basic information Basic information plus cause of death
Basic information plus cause of death
Flexibility Most flexible Less flexible than survey; scale of census requires few and relatively simple questions
Less flexible than census; difficult to change items on registration forms
Less flexible than civil registration; difficult to change systems that capture changes in personal charactheristics

6
I. PLANNING THE COLLECTION OF FERTILITY AND MORTALITY DATA
Introduction 24. Fertility and mortality data typically derive from more than one data source. When numbers of births and deaths are derived from civil registration, for example, corresponding numbers of persons required for the calculation of rates and summary measures are usually estimated from population census data. When population censuses are used to collect data on numbers of births and deaths, they are often supplemented by surveys of various kinds, which may provide more detailed and timely data. Whatever sources of data are used, evaluation of data from each source usually involves comparisons with data from other sources. 25. Planning the collection of fertility and mortality data therefore involves two distinct stages. The first stage identifies what fertility and mortality data will be obtained from which sources and addresses issues of coordination between different sources. The second stage feeds this information into the planning for the civil registration system, the next population census, an upcoming household survey or whatever data-collection operations are involved. 26. The planning of civil registration systems, population censuses and household surveys is discussed extensively in the literature of those methods. The present chapter focuses on the planning required to integrate information from those three sources. Before addressing these issues, however, it is necessary to define specifically the several different kinds of fertility and mortality data. This is done in the following section.
A. FERTILITY AND MORTALITY DATA
27. There are several different kinds of fertility and mortality data, ranging from information on particular births and deaths to summary indicators of the level of fertility or mortality in the country as a whole. Section A covers the different types of data and the relations between them.
1. Civil registration, census and survey records
28. At the most fundamental level, fertility and mortality data consist of information about particular births, deaths and persons. 29. Civil registration systems provide information about particular births and deaths. It is important to distinguish between the legal record of the event and
the statistical record. Legal records of births and deaths are the primary output of civil registration. Statistical records are created for the purpose of compiling numbers of births and deaths, which is considered further in the following subsection. 30. Statistical records of births and deaths include information about the event, such as the date and place of occurrence; about the person(s) who experienced the event, such as age at death, birth weight, and age of mother at birth; and about the registration of the event, such as date and place of registration. For additional details, see section A.4 of chapter IV and Principles and Recommendations for a Vital Statistics System, Revision 2 (United Nations, 2001b). 31. Population censuses produce records of households and persons in a population at a particular point in time. Person records include such information as place of residence, sex and date of birth or age at the time of the census. Population censuses generally provide less detailed information on persons than household surveys, but they provide information for every person in the population, rather than only for a sample of persons. For a list of topics recommended for inclusion in population censuses, see Principles and Recommendations for Population and Housing Censuses, Revision 1 (United Nations, 1998a). 32. Household surveys also produce records of households and persons in a population, but the information usually refers to the date of interview rather than to a fixed reference time. Household surveys generally include more detailed information on persons than is included in a census and refer to only a sample of the population.
2. Counts of births, deaths and persons
33. For the purpose of statistical description and analysis, information on individual births, deaths and persons is summarized in various ways. The most basic summaries are counts of births, deaths and persons in various groups. 34. In the terminology of civil registration, records of births are compiled to produce the total number of births occurring during a calendar year or other time period and the distribution of those births by sex of the child born, age of the mother at the time of birth and other characteristics of the child, the mother or related persons. Similarly, records of deaths are compiled to produce numbers and distributions of

7
deaths. For a list of recommended tabulations of births and deaths see Principles and Recommendations for a Vital Statistics System, Revision 2 (United Nations, 2001b). 35. In the terminology of censuses and surveys, records of persons are tabulated to produce total numbers of persons and distributions by sex, age and other characteristics. For a list of recommended census tabulations see Principles and Recommendations for Population and Housing Censuses, Revision 1 (United Nations, 1998a).
3. Rates and summary measures
36. Rates of birth and death are relative numbers constructed by dividing a number of births or deaths by a corresponding number representing persons at risk of experiencing those events. Numbers of births and deaths alone do not convey useful information about levels of fertility and mortality because they reflect the size of the population and the length of the period of observation. More births are to be expected in China than in Monaco, for example, because there are more persons in China, and more births are expected during a 10-year period than during a single year. 37. The most important rates for the study of fertility are age-specific birth rates, which relate births in age groups to numbers of females in these age groups. The most important rates for the study of mortality are age-specific death rates, which relate numbers of deaths in age groups to numbers of persons in these age groups. Age-specific death rates should always be given separately for males and females, though they may be presented for both sexes combined as well. 38. Birth rates and death rates may be specific for characteristics other than or in addition to age. Birth rates, for example, may be specific for age and the number of children a woman has borne, and death rates may be specific for age and cause of death. 39. It is common to summarize the information contained in a set of rates specific for age and/or other characteristics by computing one or more summary measures from these rates. A basic indicator of the level of fertility, for example, is the total fertility rate, calculated by summing age-specific birth rates over all reproductive ages. The total fertility rate may be interpreted as the expected number of children a woman who survives to the end of the reproductive age span will have during her lifetime if she experiences the given age-specific rates.
40. Fundamental indicators of the level of mortality are the infant mortality rate and life expectancy at birth. The infant mortality rate indicates what proportion of infants born may be expected to die before reaching their first birthday. Life expectancy at birth indicates how long a child just born may be expected to live if this child experiences the age-specific death rates observed during a given year or other time period. Life expectancy is one of many summary measures that may be derived from a life table calculated from age-specific death rates.
4. Geographic classifications
41. Population data of all kinds refer to persons, births and deaths located in space and in time. Geographic (spatial) classifications are discussed in this subsection; time and chronological groupings, in the following subsection. 42. When fertility and mortality data are derived from population censuses and civil registration, one of the most difficult aspects of tabulation planning concerns the geographic detail that will be provided. Geographic detail is less problematic for surveys because sampling greatly reduces the possibilities. 43. "Place" of residence (of persons) or occurrence (of births and deaths) has meaning only in relation to some system of geographic classification. The most common systems of classification are urban and rural areas, major and minor civil divisions, and principal cities and towns. 44. In fact, census data may be tabulated down to the level of the census enumeration district, and civil registration data may be tabulated down to the level of primary and secondary registration units. There will probably be many thousands of these units, however, and for larger countries there may be several millions of them. It will not usually be either useful or feasible to produce large numbers of detailed tabulations for all of them. 45. It is therefore necessary to decide which tabulations will incorporate what level of geographic detail. The difficulty of such decisions reflects the scores or hundreds of tabulations that may be produced for any single area in combination with geographical classifications with very large numbers of areas. When the tabulations are to be used for the calculation of various kinds of birth and death rates, a further consideration is coordination of census and civil registration tabulations.

8
46. A general principle is that more and more detailed tabulations will be provided at the national level, with successively fewer and less detailed tabulations for major civil divisions, minor civil divisions and more detailed geographic classifications. Though useful as far as it goes, this principle provides no guidance on which particular tables should be produced for which geographical classifications. 47. The universal coverage of censuses and civil registration makes it possible, in fact, to provide data for many different kinds of geographic systems beyond the familiar nested hierarchy of administrative units. Geographic regions of all kinds may be closely approximated by aggregating data for the smallest possible tabulation units. Data may be produced for regions defined by topography, such as water conservation areas, forest reserves or proximity to rivers and coastlines. 48. The development of geographic information systems (GIS) in recent decades has greatly facilitated the production and use of spatial data of this kind. The Handbook on Geographic Information Systems and Digital Mapping (United Nations, 2000b) provides a very useful introduction to the topics in connection with particular reference to population censuses, but much of the information is equally relevant to civil registration data.
5. Time and time period
49. Population data of all kinds refer to persons who have an existence in time and events that occur to these persons at particular points in time. The time or time period to which data refer should always be made explicit. 50. Population censuses are by definition enumerations of a population at a point in time, called the reference time of the census. The reference time may be, for example, midnight of 30 June 2000. In practice, it is generally sufficient to identify the date of the census. 51. Civil registration data refer to births and deaths occurring during particular time periods, calendar years and months, and sometimes shorter periods. The calendar periods begin at midnight of the first day and end at midnight of the last day. Time reference in a fully developed civil registration system may be very precise. 52. Time reference for household surveys is more complicated. Some surveys follow the census rule of obtaining all information as of a specific point in
time, but most surveys obtain information as of the time of interview. Since survey fieldwork may extend over many months, the data collected for different households refer to different points in time. Population numbers are therefore not strictly comparable to census data, and numbers of births and deaths are not strictly comparable to civil registration data. 53. In practice, survey data may usually be regarded as though they referred to a particular point in time, taken as some measure of central tendency of the times at which interviews were conducted. The simplest such measure is the midpoint of the period over which interviews were conducted, and this will be sufficient for most purposes. It often happens, however, that interviews occur over a relatively long period of time, perhaps six months, with most interviews concentrated at the beginning of the period. In that case, a mean or median date of interview will give a more appropriate time reference. Survey reports may provide the distribution of interviews by the month in which they were conducted, from which this median or mean can be estimated. 54. Demographic statistics, like the data from which they are derived, always have a time reference that should be made explicit. In general, numbers, percentages and ratios of persons are given for a point in time; numbers, percentages and ratios of births and deaths are given for a time period; and rates of all kinds are given for a time period. In the case of household survey data, the time reference may be imprecise for the reasons discussed in the preceding two paragraphs, but this generally has no practical consequence. 55. Exceptions to the general rule that rates refer to time periods occur in some cases. When infant and child mortality rates are estimated from numbers of children ever born and surviving, for example, some estimation procedures produce rates that refer to points in time rather than to time periods (see section A of chapter VI). Comparison of these rates with rates that refer to time periods may be effected by identifying the rates for periods with the midpoint of the period and interpolating rates for times between these midpoints.
B. REVIEWING PAST DATA-COLLECTION ACTIVITIES
56. Planning for the collection of fertility and mortality data should begin with a review of existing data resources, with the intention of summarizing what information is already available and assessing

9
how well existing resources serve the needs of users. This review will consist primarily of answering a series of questions about each existing source of data. The following subsections indicate some of the questions that may be asked about each source.
1. Civil registration 57. Civil registration is the preferred source of basic fertility and mortality data and cause-of-death data when complete coverage of births and deaths has been achieved. When civil registration is incomplete but captures a substantial fraction of births or deaths, it may be a valuable source of fertility and mortality data. Civil registration as a source of fertility and mortality data is addressed in chapter IV. 58. Questions relating to civil registration may include the following: Is there a national civil registration system? Does it produce annual tables of births and deaths by age and other pertinent characteristics? If so, how long has it been in effect? What is the estimated completeness of birth registration? What is the estimated completeness of death registration? Are estimates of age-specific birth and death rates and other statistics produced from these data? If so, how satisfactory are these estimates? What methods of assessment have been applied to reach these conclusions?
2. Population censuses
59. The population census is a potentially rich source of fertility and mortality data. Like civil registration, it will provide data on all geographic areas, but it will also provide data for any population subgroup definable in terms of the census questions, such as educational attainment, occupation or migration status. Civil registration, even where fully developed, will often not provide as much detail as a population census. Retrospective questions and methods frequently allow the production of fertility and mortality data for 15 or more years prior to the date of the census. Questions and methods for producing fertility and mortality data from population censuses are covered in chapter V (fertility) and chapter VI (mortality). 60. Examples of questions concerning population censuses include the following: When was the most recent population census taken? Were any retrospective questions on births and deaths included and used to estimate fertility and/or mortality? Was the own-children method used to produce estimates of age-specific birth rates for the 15 years prior to the census? Were these questions asked of the population
Box 1. Data, Statistics and population: Terminology
Data may be defined as systematic information about the entities in some statistical aggregate. Systematic here means that, subject to missing values and information not applicable to particular entities, the same information is provided for every entity in the aggregate. The concept of statistical aggregate is very general. It requires only that the entities comprising the aggregate be discrete and that rules of membership defining the aggregate clearly specify which entities of a given type are members and which are not members.
Examples of statistical aggregates are the births or deaths occurring in a population during a given year; the dwelling units, households and persons existing in a population at a particular point in time; and the sample households and persons for which information is obtained in a household survey. The major and minor civil divisions of a country and the countries of the world are also statistical aggregates.
A statistic is a number calculated from data. Counts of births, deaths and persons and rates and summary measures of all kinds are statistics. Statistics, such as total fertility rates or infant mortality rates, are often assembled for selected countries of the world or the major or minor civil divisions of a particular country. This information is data in the sense of the preceding paragraph, where the statistical aggregate consists of countries or areas of a country. "Data" is thus a more inclusive concept than it might at first appear.
"Data" and "statistic" have the same
meaning in demography as in statistics, but demographers and statisticians use the word "population" in entirely different ways. In demography, a population is an aggregate whose membership changes with time as the results of entries to and departures from the population. This is the meaning intended when the word is used in this handbook. Statisticians use the word "population" to describe the statistical aggregate to which data refer (Stuart and Ord, Vol. 1, 1987).

10
as a whole, or only of a sample? How satisfactory were the resulting estimates? What methods of assessment were used to arrive at these conclusions?
3. General household surveys
61. General household surveys are also a potentially rich source of fertility and mortality data. They will not provide the geographic detail or the information for small population subgroups that will be provided by a census, but they may include more detailed questions on fertility and mortality and may be carried out more frequently than population censuses. Questions and methods for fertility and mortality data from general household surveys are covered in chapter V (fertility) and chapter VI (mortality). 62. Questions relating to general household surveys may include the following: When was the most recent general household survey taken? Were any retrospective questions on births and deaths included and used to estimate fertility and/or mortality? Was the own-children method used to produce estimates of age-specific birth rates for the 15 years prior to the census? What was the sample size? The sample design? What method(s) were used to calculate sampling errors? What were the estimated sampling errors for the desired fertility and mortality statistics?
4. Birth history surveys
63. Birth history surveys may give more detailed information on fertility than any other source, but the extensive questions involved generally restrict them to relatively small samples. Birth history surveys typically include very detailed questions on related topics, such as factors influencing the level and trend of fertility, contraceptive use or information on child and family health and the availability of health services. Birth history questions are covered in section F of chapter V. 64. Question such as the following may be asked for a birth history survey: When was the most recent birth history survey carried out? Did the survey include a complete birth history? How satisfactory were the resulting estimates of fertility? Was there any indication of bias resulting from misstatement of birth dates? What methods of assessment were applied to reach these conclusions? How large was the sample? Were sampling errors for the desired fertility and mortality statistics estimated? If so, what were the sampling errors?
5. Other methods
65. Have other methods, such as multi-round surveys or a dual-record system, been used? If so, how satisfactory are the resulting estimates of age-specific birth and death rates? What methods of assessment were applied to reach these conclusions?
6. Overall assessment
66. Questions of relevance when conducting an overall assessment include the following: How satisfactory are available data on fertility and mortality? To what extent do they meet user needs? What user needs, if any, have not been met? Do available data provide sufficient detail for subnational geographic areas and population subgroups? Do they provide sufficient detail to portray trends? To what extent are estimates of the same or similar statistics produced by different methods consistent with each other? How accurate are the estimates considered to be? What methods of assessment have been applied to reach these conclusions? Evaluation of fertility and mortality data is discussed in general terms in section A of chapter III. Estimation of the completeness of civil registration data is discussed in section D of chapter IV.
C. PLANNING FUTURE DATA COLLECTION ACTIVITIES
67. The review of current activities may point to numerous possibilities that have not been exploited in the past. Section C indicates briefly the possibilities represented by the main data-collection methods.
1. Civil registration
68. Future activities with respect to civil registration as a source of fertility and mortality data may address (a) evaluating the coverage and selectivity of birth and death registration; (b) improving the coverage of civil registration; (c) improving the compilation and publication of civil registration data; or (d) improving the utilization of civil registration data. 69. Assessing the completeness and accuracy of information on vital events is an important aspect of the use of civil registration as a source of statistical information. Estimation of the completeness of birth and death registration is discussed in section C of chapter IV. If such assessments have not been made in the recent past, it may be appropriate to initiate them. 70. Efforts to improve the coverage of incomplete civil registration are important, but they will usually be justified by the primary legal function of civil

11
registration as well as by its secondary statistical functions. Attaining complete coverage will generally be a long-term goal. 71. Where a civil registration system exists but does not produce annual numbers of births and deaths, relevant questions include the following: What problems are preventing the production of these numbers? What improvements in the organization of the processing of vital records are necessary to provide the desired statistical outputs? 72. Incomplete civil registration data are rarely utilized as fully as they might be. A system that captures even a modest fraction of all births and deaths may provide valuable data on fertility and mortality. Estimated levels of completeness may be used to adjust registered numbers of births and deaths to provide estimates of total numbers, with due allowance for the selectivity of registration.
2. Population censuses
73. The next population census should always be considered as a potential source of fertility and mortality data. This is particularly important where civil registration data are incomplete or do not exist. The special questions required are minimal, but the value of the fertility and mortality data provided may be very great. 74. Where birth registration does not capture all births, high priority should be given to the application of the own-children method to provide estimates of age-specific birth rates for the 15-year period prior to the census. See chapter V for further details. 75. Where death registration does not capture all deaths, consideration should be given to including questions on recent deaths on the census questionnaire for the purpose of estimating the level of adult mortality. See chapter VI for further details.
3. General household surveys 76. The next general household survey should always be considered as a potential source of fertility and
mortality data. This is particularly important where civil registration data are incomplete or do not exist and where the population census is not used as a source of fertility and mortality data. Questions and methods are explored in chapter V (fertility) and chapter VI (mortality).
4. Birth history surveys
77. Birth history surveys are designed in part to provide more or less standard information on fertility and mortality. When planning birth history surveys it is important to plan for the calculation of sampling errors for the derived fertility and mortality statistics, such as the total fertility rate and the infant and child mortality rates. It is also important to systematically compare the levels and trends of fertility and mortality estimated from these surveys, which may provide the most accurate data, with estimates from other sources. Birth history questions are discussed in section F of chapter V.
5. Other methods
78. Multi-round surveys and dual-system methods are substantially more complex and expensive than single-round surveys and probably should not be considered as methods for collecting fertility and mortality data, unless concerted efforts to collect data by other means have failed. If a multi-round survey is to be carried out for the purpose of collecting other kinds of data, the inclusion of appropriate questions for collecting fertility and mortality data should of course be considered.
D. COORDINATING DATA-COLLECTION ACTIVITIES
79. Since fertility and mortality data are derived from numerous different sources, plans for producing data from any one source should take account of plans for producing data from other sources. When civil registration does not provide complete reports of births and deaths, for example, it is more important to use population censuses and household surveys as sources of fertility and mortality data. Similarly, the importance of using a general household survey to produce fertility and mortality data will be higher if censuses are not used for this purpose.

12
II. FIELDWORK, DATA PROCESSING AND ARCHIVING
Introduction 80. Every method of collecting fertility and mortality data involves fieldwork, during which information is collected from persons in the general population, and data processing, during which this information is brought together and processed to provide useful statistical information. The first two sections of this chapter describe these operations in general terms, noting points of particular relevance to the collection of fertility and mortality data. 81. Today, data processing is nearly always done by computer, and the large capacity of modern computer storage media makes it possible to save even the largest data sets for reuse in the future. Computers are increasingly used for planning, management and administrative work as well, so that operational documents of all kinds may also be archived for future reference to use for planning, evaluation and other purposes. 82. Archiving has become a more important and larger task as the emphasis has shifted from printed documents and publications to computer files. It is considered in the third and final section of this chapter. Though the issues are general, they have particular relevance for fertility and mortality data because these data so often derive from multiple data sources.
A. FIELDWORK
83. Fieldwork is the process of collecting information about persons and events "in the field"�throughout the country in the case of civil registration or a population census, or in sample areas in the case of a household survey. Members of the general public are requested to supply information about themselves, their families and the households in which they live to fieldworkers representing the data-collection organization. 84. In the case of civil registration, information is collected by local registrars when informants come to local registration offices to register births and deaths. The process of registration is covered further in section A of chapter IV. 85. In the case of censuses and surveys, information is most often collected by census enumerators or survey interviewers who visit households throughout the country and obtain information from one or more
respondents in each household. Censuses and surveys may also employ the method of "self-enumeration", in which forms are mailed to households in the hope that the head of household or other reference person will complete the forms and return them by mail. Enumerators and interviewers are used only for households that do not return completed forms. 86. Fieldwork makes heavy demands on the organizational and logistical capabilities of the data-collection organization. Civil registration and population censuses in large countries involve hundreds of thousands of fieldworkers working throughout the country. These fieldworkers must be recruited, trained, equipped and supervised. In the case of censuses and surveys, work occurring across the country in a relatively short period of time must be tightly coordinated and controlled. 87. In particular, it is imperative that logistical procedures for collecting completed forms ensure that forms are not damaged or lost in transit from the field to data processing. A population census even in a smaller country will involve tens of millions of forms, all of which must be transported to one or more central processing locations and appropriately stored to await further processing.
1. Planning
88. The planning of fieldwork must anticipate (a) design of the forms that will be used to collect information; (b) recruiting and training the staff who perform the work; (c) providing the equipment, supplies, reference and training materials and other resources required to carry out the work; (d) monitoring their work to identify problems and take remedial action; and (e) monitoring the storage and transmission of information to ensure that it arrives intact and in a timely manner at the appropriate central processing location or locations. 89. The planning of a population census is discussed in the Principles and Recommendations for Population and Housing Censuses, Revision 1 (United Nations, 1998a) and in the Handbook on Census Management for Population and Housing Censuses (United Nations, 2000a). Planning for the statistical processing of civil registration information is addressed in Principles and Recommendations for a Vital Statistics System, Revision 2 (United Nations, 2001b). Planning of household surveys is discussed in the Handbook of Household Surveys (United Nations, 1984).

13
90. With respect to the collection of fertility and mortality data, planning should anticipate what information will be required for statistical purposes and what forms will be used to collect this information. In the case of fertility and mortality data collected in censuses and surveys, planning should allow for advance testing of the questions used and for the training of fieldworkers in the administration of the questions. Testing may also be useful in the context of civil registration.
2. Form design
91. The design of statistical forms, whether for civil registration, a population census or a household survey, is fundamental to the successful conduct of fieldwork. Although the first consideration is the particular information to be collected, the wording of questions and the layout of the form may greatly facilitate or impede the collection of complete and accurate information. 92. This is particularly true when collecting retrospective information on births and deaths in population censuses and household surveys. Births and deaths are too important in the lives of the persons involved for their occurrence to be forgotten. To secure information about those events, however, specific sequences of questions must be designed to overcome particular difficulties. People may be reluctant to speak of deaths, for example, or of children who died shortly after birth. In addition, while remembering clearly the occurrence of the event, persons may be uncertain as to when exactly the event occurred. 93. While familiarity with national conditions and knowledge of the experience of other countries will provide valuable background for the design of forms, they cannot substitute for field testing. Field testing should always be considered the "court of last resort" in deciding what kinds of questions will yield the most complete and accurate reporting of information. 94. Questions for the collection of fertility and mortality data in population censuses and household surveys are covered in detail in chapter V (fertility) and chapter VI (mortality).
3. Recruitment and training
95. No aspect of fieldwork is more important than the recruitment, training and supervision of fieldworkers. This applies to local registrars for civil registration as well as to census enumerators and survey interviewers. The dual functions of training are to
impart the specific knowledge required for fieldworkers to do their job and to create an esprit de corps that will motivate them to do the best job possible under what may often be difficult circumstances. The function of recruitment is to select fieldworkers most capable of carrying out the work. 96. Collection of accurate information requires that fieldworkers understand in detail every item on the form or forms that they will be completing, that they know the appropriate procedures for completing the forms and that they know how to obtain assistance in case of difficulty. In the case of censuses and surveys, enumerators and interviewers must be able to find their way to the households they are assigned to enumerate. 97. Clear and detailed understanding of the various items of information gathered is essential. Apparently simple questions frequently involve ramifications that must be learned in training. Questions on children ever born, for example, refer to biological, not adoptive, children; to deceased as well as to living children; and to children living elsewhere as well as to children living with their mother. 98. Detailed explanations of every item on the forms used should be included in a training manual. Every fieldworker should receive a copy of the manual during training and retain a copy for reference during fieldwork. 99. Censuses and surveys that have more questions and more complicated questions require more extensive training and supervision if they are to result in useful information. It is a practical reality that population census and sample survey operations are often under pressure to include more questions, and more difficult questions, than the resources available for carrying out the operation will allow. Information generated by questions for which fieldworkers have been inadequately trained is likely to be of little or no value.
4. Supervision 100. Supervision of fieldworkers is critical to the success of fieldwork. Time and resources for training are invariably limited and even with the best possible training, some lessons learned will be forgotten as fieldwork proceeds. Fieldwork may also raise questions or involve difficulties that were not anticipated in training. Supervision of fieldworkers as fieldwork proceeds is necessary to ensure that they are doing the best possible job of obtaining accurate information from respondents.

14
101. Supervisors are themselves fieldworkers and must be trained for the task, as well as suitably supervised. Regular meetings of fieldworkers and their supervisors should be held to discuss problems that have arisen and how to deal with them. In the case of census and survey fieldwork, there should be daily meetings between supervisors and enumerators to review problems that arose during the day's work and ways in which those problems can be addressed. 102. A second element of effective supervision is the monitoring of the performance of the work of individual fieldworkers by means of field editing. Supervisors scrutinize the forms produced by particular fieldworkers for errors, omissions and ambiguities. Any problems found are then discussed with the fieldworker who produced the forms. Errors will then be corrected, omissions supplied and ambiguities resolved to the extent possible. The primary purpose of field editing is not to correct errors, however, but to prevent future errors. The supervisor remains informed of the quality of each fieldworker's performance and can deal with confusion, errors and negligence before they endanger the success of fieldwork. For further observations on this point see the Handbook on Census Management for Population and Housing Censuses (United Nations, 2000a).
5. Transmission of information
103. Information has traditionally been recorded on a paper form or "schedule" or �questionnaire�. These forms are then transported to one or more central locations for further processing. Various procedures will be employed to ensure that forms are not lost or misclassified. 104. Information is still most often collected on paper forms, but in some cases it is entered directly into a computer. When entered directly into a computer, information may be transported on a suitable computer medium, such as a diskette or CD-ROM, or transmitted over telephone lines or a computer network to a central location for further processing.
B. DATA PROCESSING
105. Data processing takes as input the information collected in the field from respondents (censuses and surveys) or informants (civil registration) and produces as output data sets, tabulations and other derived statistics, and associated documentation and data processing reports.
106. Data processing for civil registration systems and for population censuses and household surveys involves the same fundamental operations. Data processing for civil registration systems operates continuously or at regular and relatively frequent intervals, whereas data processing for a census or survey is generally confined to a fixed period following fieldwork.
1. Manual processing
107. Data processing begins with procedures to check that all information collected in the field has been received in a form suitable for further processing. Records will be checked to ensure that basic identification information is present. 108. In the case of civil registration, the organization responsible for data processing for statistical purposes will generally receive statistical reports of births and deaths at regular intervals. Checks that statistical reporting forms are forthcoming at the stipulated times will be made, as well as some basic checks on the content of forms to ensure that they are ready for data entry. 109. In the case of a population census, the number of questionnaires received from each enumeration district will be checked against a summary form from that district to ensure that all forms collected in the field are received at the processing location. Censuses generally collect information on households as well as persons, including the number of persons living in the household. 110. Certain information, such as census or survey information on occupation or industry, may require manual coding prior to data entry. With the development of information technology, however, computer-assisted and automatic coding, described in more detail below, may replace manual coding.
2. Data entry
111. Data-collection operations of all kinds generally aim to minimize manual processing by transferring information to computer media at the earliest possible time. When data are collected on paper forms, data entry, or "capture", may be accomplished either by typing information on the forms at computer keyboards or by any of several different optical scanning technologies. 112. Whichever of these methods is used, the accuracy of the process must be verified by systematically comparing the information on the

15
computer records produced with the information on the forms they represent. Verification is generally done on a sample basis, with provision for complete verification in any group of records for which the sample indicates problems. 113. When information is entered directly into computers in local registration offices or during census or survey fieldwork, data entry ceases to become a distinct operation. The translation of verbal responses to computer codes will be carried out by computer software. Once the accuracy of the software is established, the verification operations required by other methods of data entry become superfluous. Direct entry of information into computers during fieldwork will probably become increasingly common in the future as the cost of the required computer hardware declines.
3. Computer editing
114. Following data entry and any necessary classification operations, the resulting data sets are subject to a series of computer-executed edits. Each edit consists of an edit check and an associated edit action that is carried out if the test fails. 115. Structure checks test for the presence or absence of certain records. The complete set of records in any data set may be checked, for example, to ensure that every local registration area or census enumeration district is represented. Checks of this kind will generally be carried out concurrently with the manual checks described in section B.1 above. Should records for any area be absent, measures would be taken to locate and incorporate them into the data set. 116. Other structure checks might ascertain whether each household has one and only one record for the head of household/reference person, whether any two records in a household are duplicates erroneously introduced during data entry or whether the number of person records for each household equals the number of persons indicated on the household record. 117. Individual records will be checked for invalid codes and missing values. Invalid codes generally indicate errors during data entry and may be corrected by reference to the paper form from which the information was obtained. Invalid code checks are often incorporated in the data-entry verification process. 118. Missing information is best supplied from the source, the paper form from which the record was derived or the informant or respondent who originally
supplied the information. When this is not possible, "not stated" codes should be assigned, with tabulations of the data showing corresponding categories, for example, "Age not stated". Explicit "not stated" codes should always be used to avoid confusion between information that is missing and information that is not applicable. Care should be taken to ensure that missing-value codes are not confused with values. 119. Missing information is sometimes imputed, that is, assigned a value that is statistically plausible but not necessarily correct. Imputation should be used sparingly, for while the user's convenience is served by supplying missing information, there is a risk that improper imputations will corrupt the data. 120. Consider, for example, the questions on number of children ever born and number of children surviving. If number of children surviving is reported, but number of children ever born is not reported, it might be proposed to set the number of children ever born equal to the number of children surviving. By doing so, however, the number of deceased children is imputed to zero for all such cases. This would impute zero mortality risk to the children in question and bias the level of mortality estimated from these data downward. 121. Consistency checks compare the values of different information items to identify inconsistencies. A civil registration, census or survey record representing a 14-year-old woman with eight children ever born is certainly erroneous, for example, although from this information alone it is not possible to infer whether it is the information on age or number of children ever born that is incorrect. 122. It is generally considered appropriate to resolve inconsistencies even if it is necessary to resort to imputation to do so. When using imputation in this way, however, it is important to check that an imputation made to resolve one inconsistency does not introduce new inconsistencies.
4. Tabulation
123. Tabulation or compilation is the process of deriving numbers of persons or events with specified combinations of characteristics from the records comprising a data set. Tabulation is used in connection with censuses and surveys, and compilation is used in connection with civil registration. To avoid unnecessary repetition the word "tabulation" will be used here.
16
124. The tabulations to be produced from a data set may be precisely specified by identifying the domain of the tabulation (the group of births, deaths or persons to be tabulated), its dimensions (such as age or number of children ever born), truncation points for any dimensions that require them and the handling of missing values. Truncation points should generally be chosen to ensure that only a small percentage (for example, less than one per cent) of all cases fall in open-ended groups. Missing values, when present, should always be accorded a separate place in the tabulation; under no circumstances should they be combined with other values. 125. Tabulation specifications should be intelligible to both subject-matter specialists and data-processing staff and sufficiently detailed that data-processing staff do not need to make decisions regarding the content of the tabulations.
5. Other tasks
126. Various other data-processing tasks may be carried out once computer editing is complete:
• Special processing may be required to produce "camera-ready" copy for printed publications, for example, or to produce the various special computer files required for digital publication.
• The own-children method described in section B of chapter V may require special processing of person and household records to match children and mothers in households.
• The calculation of sampling errors for household surveys may involve computationally intensive methods and therefore become part of data processing.
• In the case of population censuses, one or more household samples should generally be created for future use. This allows supplementary tabulations and other processing to be done using the sample, rather than on the complete count records, either as an alternative or as a preliminary to processing all census records.
C. ARCHIVING
127. An archive is a repository for documents and data. Archiving serves the same purposes at present as it has in the past, but developments in information technology have greatly increased its potential scope, changed the means and media used for archiving and introduced new issues concerning the security of archives.
128. The rapid decline in the cost of storing and processing information in digital form has made it possible to archive inexpensively most or all of the materials generated in the course of any data-collection operation, including all planning materials, operational documents, questionnaires, control forms, data sets, final results and evaluation materials. 129. Nearly all of these materials are now produced using computers and therefore originate in digital form. Efficient archiving requires organizing the work of data production to ensure that the digital files are suitably named, indexed, secured, saved and, at the completion of the work, transferred to a suitable digital archive.
1. Functions
130. Archives are essential for purposes of official reference. The data-producing organization should have a repository of authoritative copies of all publicly released information. Archives of civil registration records (and in some cases census records) may be legally required. 131. Archives provide "institutional memory", a systematic and reliable record of past experience of the organization that may be consulted for purposes of planning and evaluation. 132. Archives maintain data for future use. Official data-collection operations are nearly always multi-purpose. They typically provide far more information than is utilized or published at the time of collection. Archived data frequently find uses unanticipated at the time the data were collected. Given the high cost of data collection, it is important to maximize the use of all data collected. 133. Archives provide a means of managing uncertainty about future information needs. Given the relatively low cost of producing and maintaining digital archives, it will often be appropriate to archive information that might be found useful in the future.
2. Content
134. All publicly released information should be archived. The individual records comprising all data sets produced by censuses, surveys and civil registration should be archived together with the technical documentation required to process these records, such as code books and file format specifications.

17
135. Many of the planning, operational and evaluation documents produced in the course of any data-collection operation should be archived. Relevant items include, for example, operational plans of all kinds, training manuals, computer editing specifications and records, tabulation plans and evaluation reports. Given the essentially unlimited storage capacity of digital media, the primary constraints on how much information is archived will be the ability of the organization to capture documents as they are produced and index documents for ready retrieval of information in the future. 136. Many fieldwork operations involve the preparation of "sketch maps" of sample areas or, in the case of a population census, all populated areas of the country. While it may be desirable to archive these sketch maps, this will not always be feasible. Increasingly, however, the maps used are produced by geographic information systems software. In this case the maps originate in digital form and should be archived along with other materials.
3. Security and maintenance
137. Security of archives includes protection against loss, corruption and unauthorized access. Rapid change in information technology has created a new risk of loss, that which occurs when archives are
stored on obsolescent computer media. Computer archives must be protected against this risk by a programme for periodically "refreshing" archived files onto new media. The rate of technological change is so rapid that media may become obsolescent within five years. 138. Digital archives involve physical media that must be protected from deterioration, loss and unauthorized access in the same matter as traditional paper records. The relative ease with which digital information may be copied and transported makes it possible to maintain copies of all archived materials in multiple geographical locations, thus avoiding the risk of loss through human actions or natural disaster. Digital archives thus hold the promise of greater security as well as reduced expense and greatly increased ease of access. 139. At the same time, digital media pose security risks that do not exist with traditional paper-based information. The ease with which digital information may be transformed creates risks of tampering, inadvertent corruption, or even complete loss by inadvertent erasure, which do not exist for traditional materials. While measures exist to reduce these risks to negligible levels, it is essential to understand them and to implement them.

18
III. EVALUATION, ESTIMATION AND DISSEMINATION
Introduction 140. Evaluation and estimation, unlike the operations discussed in the preceding chapter, generally involve two or more sources of data. The following section presents basic concepts of the evaluation of data sets, including coverage and content error and the distinction between data quality and the accuracy of estimates. 141. Section B addresses the estimation of levels and trends in fertility and mortality in general terms, with particular emphasis on the importance of deriving and comparing estimates from multiple sources. Evaluation and estimation are closely related, since assessing the accuracy of estimates produced from one or more data sets is one approach to the evaluation of the quality of the data sets. 142. Section C discusses the dissemination of data in a form suited to user needs. In the past this was primarily a matter of what information should be provided�what tabulations, what derived statistics, what supplementary textual information. The rapid development of information technology has focused attention as well on the media and format in which information should be supplied, with strong emphasis on computer media and formats.
A. EVALUATION
143. Data-producing organizations should evaluate the data they produce and take appropriate measures to inform users of the results of the evaluation. Without that information, users may draw incorrect conclusions from the data, make poor decisions based on those conclusions and take inappropriate actions based on their decisions. 144. Evaluation is also important to the internal operations of the data-collection organization. It provides a basis for maintaining and improving data quality and for adapting data-collection activities to changing circumstances.
1. Quality of operations
145. Every aspect of a data-collection operation may be evaluated, including initial planning and user consultations; the content and format of schedules and forms; recruitment, selection, and training of fieldworkers; transmission and control of completed forms; data entry; manual and computer editing; tabulation plans and adequacy of tabulations;
archiving and dissemination; and overall planning and management. Much of the information for the evaluations may be provided by the records of quality control operations. In the case of population censuses, evaluation of operations is often discussed in the administrative report of the census. 146. Assessment of the quality of population census operations is addressed in the Handbook on Census Management for Population and Housing Censuses (United Nations, 2000a). Assessment of the quality of civil registration and vital statistics operations is addressed in the Principles and Recommendations for a Vital Statistics System, Revision 2 (United Nations, 2001b).
2. Relevance and timeliness
147. The utility of data and statistics for particular purposes depends on their relevance and timeliness. The importance of producing information relevant to user needs requires no particular emphasis, this being the rationale for collecting the data in the first place. It might be supposed, however, that the planning and user consultation that precedes data-collection would render post hoc evaluation of relevance superfluous. In fact, the scale of many data collection operations, the long period of time over which they occur and the size of the bureaucracies required to undertake them make it a non-trivial task to maintain appropriate focus on user needs. 148. Timeliness is important because data tend to lose value over time as the period to which they refer recedes into the past. Achieving timeliness is in part a matter of planning data-collection operations so as to provide data when they are needed. Once a data-collection operation is under way, timeliness is largely a matter of seeing that the various data-processing tasks, from data entry through final dissemination, are carried out on schedule. Timeliness may be facilitated by rapid release of preliminary data, with final data issued at a later date.
3. Data quality
149. Fieldwork and data processing produce one or more data sets, each comprising records containing information about the entities constituting some statistical aggregate. A civil registration system, for example, will produce annually one data set representing the births and one data set representing the deaths that occurred in the preceding year. A population census produces a data set containing

19
records for persons and households present in the population at the time of enumeration. A household survey produces a data set containing records for persons and households in a household sample at the time of interview. The following sections discuss basic concepts for assessing the quality of data sets. (a) Quality of coverage 150. The quality of coverage of a data set refers to the correspondence between the records it contains and the entities those records are supposed to represent. Data sets may omit records for some entities that should be represented and include records that should not be included. Improper inclusions occur when a data set includes more than one record for the same entity, records for entities not included in the aggregate represented or records that do not represent any entity. (b) Quality of content 151. The quality of content of a data set refers to the quality of the information contained in the records in the data set. This is described by the incidence of missing values, the incidence of logical inconsistencies and the accuracy of values contained in the records. (c) Record-matching studies 152. The most general tool for evaluation of a data set is the record-matching study, in which records from the data set to be evaluated, the primary data set, are matched with records from a secondary data set that represents the same statistical aggregate. The process of matching may be very complex. A useful overview of record matching is given in Marks, Seltzer and Krotki (1974). 153. Matching accomplishes two purposes. The first is the division of the records in both the primary and the secondary data sets into two groups, matched records and unmatched records. Matched records are records in either data set corresponding to entities represented by records in the other data set. Unmatched records are records in either data set corresponding to entities not represented by a record in the other data set. 154. Subject to the accuracy of the matching procedure, unmatched records in the primary data set represent improper inclusions in this data set or omissions from the secondary data set, and unmatched records in the secondary data set represent omissions from the primary data set or improper
inclusions in the secondary data set. Matching thus provides information on the quality of coverage of the primary data set. Depending on the nature of the secondary data set, matching may provide information on its quality of coverage as well. 155. The value of the information on quality of coverage provided by a record-matching study is reduced to the extent that there is response correlation bias between the two data sets�to the extent that an entity included in the primary data set has a higher chance of inclusion in the secondary data set. In the extreme case of perfect correlation, no entity not included in the primary data set would be included in the secondary data set. Strict independence may be unattainable, but a modicum of independence is necessary for a record-matching study to yield useful information on quality of coverage. 156. The second purpose accomplished by matching is the identification of pairs of matched records, one in the primary and one in the secondary data set, representing the same entity. Comparison of the information on these two records provides information on the quality of content of both data sets. (d) Census post-enumeration surveys 157. A post-enumeration survey is carried out to evaluate the quality of the census data. Post-enumeration surveys pose two technical challenges above and beyond the usual household survey. First, they must be carried out in such a way that it is possible to match households and persons in the sample with households and persons enumerated in the census. This requires careful attention to the content of the survey questionnaire, and it requires that the survey be taken shortly after the census. The second technical challenge is that a post-enumeration survey should be designed so that, insofar as possible, the chance of inclusion in the survey is independent of inclusion in the census. Census post-enumeration surveys are discussed in the Principles and Recommendations for Population and Housing Censuses, Revision 1 (United Nations, 1998a). (e) Civil registration matching studies 158. In the case of civil registration, a secondary data set may come from a retrospective survey designed for the purpose, from special questions included in a population census or from an existing source, such as newspaper reports of births and deaths. Newspaper reports illustrate the problem of response correlation bias, as births and deaths reported in newspapers will in many cases be more likely to have been registered

20
than births and deaths not reported in newspapers. Evaluation of completeness of registration is discussed in section D of chapter IV. See also chapter 2 of Marks, Seltzer and Krotki (1974) and the references therein. (f) Quality of coverage in household surveys 159. The situation with respect to quality of coverage is somewhat different for household surveys. These are usually designed to provide estimates of relative numbers, such as means and proportions, rather than total numbers of persons or events. The main coverage issue for household surveys is generally the household response rate, defined as the percentage of sample households from which information was obtained. A response rate of 90 per cent or more is generally considered acceptable. For household surveys, the selectivity of non-response is generally more important than its level. (g) Reinterview surveys 160. The quality of content of a data set may also be assessed by what is known in the context of censuses and surveys as a reinterview survey, although the same principle may be applied in the context of civil registration. A sample of the entities in the data set is selected for "reinterview", and the reinterview information is compared with the original information to assess the quality of reporting on common items. (h) Statistical analysis 161. A third approach to evaluating data quality involves the analysis of statistics derived from the data set being evaluated. The net coverage error of a data set is the difference between omissions and improper inclusions. The net coverage error of a population census may be estimated by comparing the number of persons enumerated in the census with an estimate of the number of persons in the population at the census reference time. One way to estimate total population is to sum (a) the estimated total population at the previous census, (b) the difference between births and deaths to the population during the intercensal period and (c) the difference between immigrants and emigrants during the intercensal period. This approach to estimating net coverage error of a census is sometimes referred to as the demographic analysis method.
4. Accuracy of estimates
162. Data sets are produced for the purpose of estimating various demographic quantities, such as
counts of births, deaths and persons and various kinds of rates and summary measures. Those quantities have a true value, the value that would be determined from complete and perfectly accurate data. In practice, data are always imperfect and yield only estimates of the quantities that differ to a greater or lesser degree from the true values. Estimation is discussed in general terms in section B below. 163. The error of an estimate reflects the coverage and content error in the data set(s) from which the estimate is derived and by the �selection bias�, if any, of the data set with respect to the quantity estimated. (a) Selection bias 164. Selection bias may occur when, for whatever circumstantial reasons, the available data do not refer precisely to the pertinent statistical aggregate. In collecting information on recent deaths in a population census or household survey (see section B of chapter VI), for example, a respondent in the household is asked about the occurrence of deaths of household members during the past 12 months or other recent time period. Even in the absence of any coverage or content error, the resulting data will omit deaths that occurred in households that were dissolved prior to the census reference time or survey interview date. Households consisting of a single elderly person are one obvious example of such households. 165. Selection bias shares with coverage error an imperfect correspondence between the entities in the statistical aggregate about which information is desired and the records in a data set representing this aggregate. Selection bias, however, derives from imperfections in the data set that are inherent in the design of the data-collection process and will be present even if the process is perfectly executed. The quality of coverage of a data set, in contrast, reflects imperfections in the execution of the data-collection operation. Selection biases in various kinds of fertility and mortality estimates are discussed in chapter V and chapter VI. (b) Evaluating the accuracy of estimates 166. The principal technique for evaluating the accuracy of estimates is to compare different estimates of the same quantity. Assessment of errors on this basis is possible for several reasons. Different estimates tend to err in different ways. Even if two estimates tend to err in the same direction, underreporting of infant deaths in civil registration and a household survey, for example, the magnitude of the error is unlikely to be the same. Prior

21
information about errors is often available. Civil registration systems are often known to omit substantial numbers of births and/or deaths, for example, and population censuses rarely overenumerate their target population. When estimates of multiple quantities are available, such as time series of annual series or estimates for all geographic subareas, comparisons often reveal patterns that point to conclusions about errors. 167. Different estimates may also have complementary patterns of error. Census and survey questions on recent births (section E of chapter V), for example, may substantially understate the true number of births, but the extent of understatement is likely to be similar over all ages, so that the age distribution of reported events is approximately correct. Reports of number of children ever born (section D of chapter V), in contrast, may be reasonably completely reported by younger women but underreported by older women. Comparing the two types of information allows inferences about the errors in each, as illustrated by the P/F ratio method (United Nations, 1983). 168. Errors in estimates of fertility and mortality may also be evaluated by comparing the population growth they imply with intercensal population change, taking account of migration as appropriate. In the simplest case, the population growth rate estimated as the crude birth rate minus the crude death rate is compared with the growth rate calculated from successive population censuses. Adjustments for
migration and for differential completeness of enumeration between the two censuses may be made as required. A far more powerful approach utilizes population projection to assess the consistency of the population age distributions from two successive censuses with estimates of age-specific birth and death rates for the intercensal period. (c) Comparison of retrospective time series 169. When population censuses and surveys are used as sources of fertility (chapter V) and mortality (chapter VI) data, methods that produce retrospective time series are particularly valuable, partly because they permit ready comparison with all available estimates and partly because patterns of error in retrospective series often facilitate evaluation. 170. The analysis of Retherford and others (1987), illustrates how comparisons of retrospective time series may be used to evaluate estimates of the total fertility rate (TFR). In Pakistan, the own-children method (section B of chapter V) was used to produce annual estimates of the TFR for the 15 years prior to four data-collection operations (the 1973 Housing, Economic and Demographic (HED) Survey, the 1975 Pakistan Fertility Survey (PFS), the 1979 Population, Labour Force and Migration (PLM) Survey and the 1981 census). The estimates are plotted in figure 1. Estimates for more than five years prior to each data-collection operation have been smoothed to reveal the pattern of the estimates more clearly.
Figure 1. Comparison of total fertility rate estimates for Pakistan

22
171. The estimates from the first survey, the 1973 HED survey, suggest that fertility decline began in the late 1960s and accelerated rapidly after 1971. The decline between 1971 and 1972 is unreasonably rapid, however, and is followed by an increase between 1972 and 1973, suggesting that at least part of the decline shown may be the result of errors in the estimates. 172. The estimates from the other three data-collection operations reinforce this sceptical interpretation. The 1975 Pakistan Fertility Survey estimates show no decline between 1971 and 1972, but a rapid decline between 1972 and 1974, followed by a slight increase between 1974 and 1975. The 1979 Population, Labour Force and Migration Survey estimates show no significant fertility decline prior to 1975, but an unreasonably rapid decline between 1977 and 1978, followed by a slight rise between 1978 and 1979. The 1981 population census estimates show generally rising fertility through 1977, an extremely rapid decline between 1979 and 1980, and a substantial rise between 1980 and 1981. 173. Figure 1 shows beyond any doubt that the fertility declines indicated by the four data-collection operations, taken individually, are spurious. The apparent decline results from a pattern of error that brings estimates sharply down between the third and the second years preceding the survey. When retrospective estimates from the four surveys are compared, it is evident that there was no fertility decline before 1980. Indeed, the estimates suggest that there may have been a gradual increase in fertility during the 1960s and 1970s. This could be the result of declines in widowhood and breastfeeding. 174. The pattern shown in figure 1 is frequently encountered when age is poorly reported. Retherford and Alam (1985) note similar patterns for Nepal and Indonesia. When fertility is estimated retrospectively from census and survey data, fluctuations in the numbers of persons reported at each single year of age in childhood translate into fluctuations in numbers of births and levels of fertility in the years prior to the census or survey. Less complete enumeration of very young children may also play a role. 175. The same general approach may be used to assess the quality of infant and child mortality estimates produced from data on children ever born and surviving (sections A of chapter VI) and also of adult mortality estimates produced from data on surviving parents and/or siblings (sections C+D of chapter VI). For an overview of infant and child mortality estimates, see Feeney (1991).
5. Indications of error 176. Indications of error are statistics or observations of any kind that suggest or imply errors in the data. Indications of error often provide only circumstantial evidence, but the evidence may be very strong. 177. Consider, for example, a distribution of total population by age in single years. Inspection of the distribution may show much greater numbers of persons at ages ending in �0� or �5� than at the immediately surrounding ages, particularly at older ages. This is a very strong indication that large numbers of persons are misreporting their ages by �rounding off� to a nearby (not necessarily the nearest) multiple of five, a type of misreporting known as �age heaping�. 178. This indication of age heaping does not, however, provide any ready estimate of the true numbers of persons at each single year of age, which depends on differential completeness of enumeration by age as well as on age misreporting.
6. Sampling error
179. The preceding discussion of the accuracy of statistics applies both to civil registration and population census data, which provide (in principle) complete counts of births, deaths and persons, and to household survey data. In the case of household survey data, however, it is necessary to consider the additional error incurred by the use of sampling. In the terminology of sampling, the errors discussed above are non-sampling errors. 180. Sampling error may in principle, and to a large extent in practice, be both controlled by sample design and estimated on the basis of sampling theory. The calculation of sampling errors is an indispensable adjunct to the evaluation and analysis of household survey data. It must be borne in mind, however, that sampling errors constitute an additional component of error, above and beyond the errors discussed in the preceding subsections. When household survey data are utilized, it is necessary to assess both kinds of errors.
B. ESTIMATION
181. In an ideal world of complete and perfect data, counts of births, deaths and persons would be generated by tabulation, and rates and summary measures would be produced by calculation based on the various formulas that define them. In the real world of incomplete and imperfect data, various

23
expedients are usually required to generate the desired demographic statistics. 182. Estimation refers here to a means of arriving at a value for some demographic quantity that cannot be calculated exactly from available data. The result is an estimate of the quantity, a number that is expected to depart to a greater or lesser degree from the true value of the quantity. Even when complete and accurate civil registration and population census data are available, the calculation of rates requires the estimation of denominators.
1. Civil registration data
183. Complete and accurate civil registration data will provide counts of births and deaths that may be utilized without adjustment or estimation in the calculation of rates and summary measures. In many countries, however, civil registration provides a valuable source of data, but not so complete and accurate that it may be used without adjustment. In this case the registered numbers of births and deaths, together with supplementary information from population censuses and household surveys, are used to estimate true numbers of births and deaths. These estimated true numbers are then used for the calculation of rates and summary measures. 184. Civil registration data may provide complete data on births and deaths while providing defective information about characteristics of those births and deaths, such as the age at which the decedent died, the cause of death, or the age of or number of children ever born to the mother at the time of birth. In practice, there tends to be correlation between quality of coverage and quality of content. In particular, countries with incomplete registration of births and deaths have in many cases relatively poor reporting of age and cause of death. 185. Evaluation of the completeness of civil registration of birth and death reports is covered in section D of chapter IV. 186. When civil registration data are considered to be complete and accurate, the only estimation required is of the denominators for the calculation of rates. When population censuses, perhaps supplemented by household surveys, are the source of denominator information, it is necessary to estimate the denominators of rates for each year or other time period and each population subgroup (such as age group) required. The estimation of denominators is discussed in section B.3 of chapter IV.
2. Census and survey data 187. There are three broad approaches to using population censuses and household surveys to produce fertility and mortality data. The first utilizes retrospective questions about births and deaths. It attempts to use the census or survey to obtain information similar to that provided by civil registration. The simplest example is a question, addressed to reproductive-age women, asking whether a woman had any births in the 12 months preceding the census reference time or survey interview date (section D of chapter V). Birth histories carry this idea further, asking women about the date and other details of all the children they have borne. 188. The second approach, which provides data on fertility only, utilizes the information on age that is collected in every population census and household survey to estimate numbers of births during the years prior to the census or survey. This approach is based on the simple observation that persons age zero (in completed years) at the time of a census were necessarily born during the preceding year. Similarly, persons age one were necessarily born in the second year preceding the census reference time. Given an estimate of the level of infant and child mortality, an adjustment for the number of children dying between birth and the time of the census may be made. This is the basis of the methods of reverse survival, own-children, and birth history reconstruction, which are explained in sections A, B and C respectively of chapter V. 189. The third approach utilizes questions that provide information on fertility and mortality without attempting to obtain information on the time of occurrence of particular births and deaths. The oldest and most widely used method is based on questions on the total number of children a woman has borne in her lifetime and the number of those children who are surviving at the census reference time or survey interview. It is evident that the proportions of surviving children are an indication of the level of mortality, although not how this information may be used to estimate the level of mortality. Other examples of this approach are questions on the survival of parents ("orphanhood" questions) and on the survival of siblings. The three approaches are discussed, respectively, in section A section D and section E of chapter VI. 190. Over the past half century many techniques have been developed for estimating levels and trends of fertility and mortality from census and survey data. Estimation procedures are explained in Manual X:

24
Indirect Techniques for Demographic Estimation (United Nations, 1983) and in a forthcoming volume on estimation of adult mortality. Further references to this literature are given in chapter VI and chapter VII.
3. Level and trend from multiple estimates
191. Different estimation procedures applied to different data will in general produce different estimates of the same quantities, for example, total fertility rates (compare with section A.3 above). In some cases different estimates of the same quantity will be nearly identical, but in other cases agreement may be very poor. 192. When agreement is poor, there are two possibilities. It may be that one estimate or series of estimates is clearly superior to the others, and in such cases this estimate or series will be chosen as the final estimate. In other cases, none of the original estimates or series will be clearly superior. In this case the preferred approach is not to choose among the estimates, but to summarize the information contained in all of them. 193. When multiple estimates of a single quantity are involved, a final estimate may be obtained by calculating an average, a weighted average, or a median. When multiple time series of estimates are involved, however, the best approach will often be to fit a straight line or curve to all available series. Sometimes, when the accuracy of the available estimates is poor, the most that can reasonably be expected is a fitted straight line indicating the level and trend of whatever quantity is being estimated (for example, the total fertility rate, life expectancy at birth, infant mortality rate). When the accuracy of the estimates is higher, it may be appropriate to utilize curvilinear fits.
C. DISSEMINATION
194. Data production is not complete until the information collected is made available to potential users in a form suited to their needs (United Nations, 1998a). The purpose of dissemination is to make information available to persons and organizations to whom it is or may be useful. 195. Dissemination is best understood as a systematic and sustained effort to identify potential users of data, inform them of what data are available and solicit feedback from them about their use of and need for data. A continuing dialogue between producers and users of data is the most effective way to ensure that the data being generated are useful and used.
1. Print publication
196. Printed publications made available by the national statistical office or other responsible entity are the traditional form of dissemination. They may be supplemented by printed reports of various kinds, such as working papers or suitably labeled and catalogued computer output, aimed at small audiences for which traditional publication is not cost-effective.
2. Data sets
197. Data sets containing records of births, deaths and persons are valuable to users because they do not restrict users to analyses based on published tabulations. This is a powerful advantage, for the number of tabulations that may be made from a large data set is so large that only a tiny fraction of possible tabulations will ever be produced by the data-producing organization. 198. Dissemination of data sets is valuable to the data-producing organization as the most cost-effective way of disseminating very large volumes of information. Users, in producing their own tabulations, absorb the cost of tabulation and dissemination of tabulations. 199. Dissemination of population census and civil registration data sets raises the fundamental issue of preserving the confidentiality of individuals. Confidentiality of census and civil registration data is generally mandated by law. Mandated by law or not, confidentiality is of fundamental importance to data-producing organizations because it influences their ability to collect accurate information from respondents and informants. Before data sets are publicly released, therefore, it is imperative that they be processed in such a way that individuals cannot be identified. This process is sometimes referred to as anonymization. 200. For population census and civil registration data sets, confidentiality is ensured by the combined use of sampling and the removal of information on detailed geographic location. For household surveys, only the latter is required. The essential criterion for preserving confidentiality is that the probability of being able to identify any individual in a data set be negligibly small. 201. The resulting data sets are often known as public use samples. Public use samples of census data are usually computer-drawn samples of households. They may or may not include "institutional" households,

25
such as the inmates of prisons and other institutions. Public use samples of civil registration data are samples of registered births or deaths. 202. A second issue raised by the dissemination of data sets is the ability of users to realize their potential value. In the past, few users were equipped with the capacity to store and process large volumes of data generated by a population census or civil registration system. With the rapid development of information technology, more and more users have gained the ability to process large data sets. This has led to an increase in the demand for data sets, a trend that may be expected to continue for the foreseeable future. 203. At the present time, population and civil registration data sets for large countries still exceed what most users are capable of utilizing. The constraint on user capability will probably disappear over the next decade, but the confidentiality issue will remain. While it would be possible to anonymize every record in a population census or civil registration data set, much of the value of the complete coverage of these data sets lies in the geographic detail they provide. The primary utility of such data sets would probably be the study of small population subgroups, such as ethnic minorities.
3. Digital publication
204. With the rise of the personal computer, increasing numbers of users process data and information of all kinds using computers. If data are available only in print form, they must be converted into digital form for use. This is a time-consuming, error-prone and expensive process. For large quantities of data it will often be prohibitively expensive. It is, moreover, intrinsically wasteful in the sense that nearly all data are now produced by computer and therefore originate in digital form. 205. Digital publication refers to the distribution of information in a form immediately usable for computer processing. Digital publication eliminates the necessity for users to convert printed information to digital form. In this way digital publication saves time, effort and expense for users and promotes better utilization of data. 206. Digital publication may involve the distribution of physical computer media, such as computer disks, tapes or CD-ROMs, containing the information disseminated. In this case, dissemination involves the same transportation network used for print publications. Digital publication may also be effected over a computer network, such as the Internet, in
which case there is no distribution of physical media. Information is transferred directly from an internal storage device in one computer to an internal storage device in another computer. 207. When information is transmitted over a computer network, distribution may be offline or online. Offline distribution means that some designated person in the responsible organization receives and processes a request for data from a user. The request for the data may be sent over a computer network, but human intervention is required to process the request. Online distribution likewise involves a user request and the transmission of information in response to this request, but the request is processed by a computer server, without human intervention. 208. Dissemination by computer network makes it possible to implement online tabulation, whereby users submit requests for tabulations over the network to a server operated by the data-collection organization or other responsible entity. The server may be programmed to respond to these requests, first examining the tabulation request to ensure that it conforms to tabulation guidelines protecting the confidentiality of users and then, if the request is acceptable, producing the tabulation and sending it to the requester over the computer network. The server may be programmed to carry out these operations without human intervention. Online tabulation facilities are illustrated by the Demographic and Health Survey STATcompiler, available from the DHS web site, http://www.measuredhs.com. 209. At the present time, the World Wide Web is the most convenient facility for online distribution (it may be used for offline distribution as well), but distribution may also be accomplished by ftp (file transfer protocol) or by means of computer bulletin boards, computers that users may access and retrieve data from by telephone.
4. Digital formats
210. Whether a computer file generated on one computer may be used on a different computer depends first on the format of the file and secondly on the characteristics of the computers involved. Some file formats are usable on essentially any computer. Such formats are referred to as platform independent. Other formats are usable only by particular software applications, which may be available only for particular computer operating systems. 211. Some formats are publicly documented and freely available for use by all. Others are proprietary

26
and not publicly documented, usable only by persons or organizations who have obtained a licence for use. Such formats are usually associated with particular computer programs. 212. At the present time, text files in the American Standard Code for Information Exchange (ASCII) format come closest to providing an internationally standardized format that is platform independent and non-proprietary. Text files are distinguished from binary files, which are specific to particular computer software applications (and operating systems) and are frequently unreadable by other applications. The ASCII format is in the process of being extended by the Unicode Worldwide Character Standard, which supports nearly 50,000 distinct characters that cover the principal written languages and symbol systems of the world (The Unicode Consortium, 2000; see also http://www.unicode.org).
5. Digital photocopies
213. The rapid emergence of digital publication against the background of a long tradition of print publication has led to a hybrid computer file format that combines digital information storage with traditional, page-oriented presentation. Pages appear on the computer screen as they would appear in print. Files of this type may be referred to as "digital photocopies" or "digital facsimiles". The most widely used format of this type is the Portable Document Format (PDF) of the Adobe Corporation. 214. Digital photocopy formats have the advantage of allowing publishers and users to exploit some of the advantages of digital media and processing while conforming to the familiar conventions of print publication. Digital photocopy formats allow publishers to transmit files to users from which the users can produce printed copies identical to the publications they might formerly have received in printed form. Given the requisite technological infrastructure, the cost of storing, copying and transporting or transmitting published information is greatly reduced. Indeed, in many cases, information that was formerly sold at a price sufficient to cover costs of printing, storage and distribution may be distributed free of charge. 215. The page-oriented nature of print publications that is from one point of view the great advantage of digital photocopy format is, from a different point of view, a considerable disadvantage, particularly when the content of publications consists primarily of tabular data. Census tabulations, in particular, vary widely in size, with smaller tables requiring only a
fraction of a page and large tables requiring tens or hundreds of pages. The print medium imposes the requirement of fixed page size, so that large tabulations must be broken into page-sized pieces. If the primary use of tabulations is visual inspection by users, this may be a minor disadvantage. If the tabulations are to be processed by computer, however�and large tabulations in particular will nearly always be used in this way�the complete table must be reassembled from the page-sized pieces. 216. A powerful advantage of other digital file formats is that they do not impose any fixed size on the "pages" that contain tables. Every table, no matter how large or small, may be accommodated in its natural size. This greatly simplifies the processing of the tables by computer software. For purposes of visual inspection, tables that will not fit on a computer screen may be "scrolled". Thus, in this context, the page-orientation of digital photocopy formats is a liability rather than an advantage.
6. Standard Generalized Markup Language (SGML) and
Extensible Markup Language (XML) 217. The tools discussed in section C.6 address several basic issues in disseminating data and associated documentation to users in digital form, including the following:
• Providing information readily accessible by different computer software applications running under different computer operating systems
• Providing "self-documenting" data�data and documentation together in a single convenient digital package
• Providing information in a form that maximizes the user's ability to pre-process the information by computer, for example, to minimize the labour of manually searching through extensive documentation
The tools are also useful for the management of information within the data-producing organization. They may be used, for example, in the following ways:
• To implement document-management systems�systems for storing documents, tracking their contents, controlling access to them and enabling staff to locate information contained in the documents quickly and easily
• To store, promulgate and enforce standards of various kinds, such as data documentation

27
standards and standard coding schemes, such as for geographic areas and causes of death
• To implement "re-purposing" systems that store information in a standard format from which various other formats may be readily produced, including page-oriented formats for print publication, HyperText Markup Language (HTML) documents for distribution on the World Wide Web, and spreadsheet files for users who want to process the data in this form
218. Before describing SGML and XML, it will be useful to indicate the general motivation for the development of these tools. As indicated in section C.4 above, text files in ASCII format are accessible by most computer software applications on most computer operating systems. Text files may also include text-documenting data as well as the data itself. Those features offer important advantages. 219. The disadvantage of text files (this is true of binary files as well) is that they may be "read" by computers only in the sense that the characters contained in the file are recognized. The meaning of the file contents cannot be established by a computer, only by a human being who reads the file in the human sense of the word. 220. To illustrate the significance of the distinction, suppose that a particular user wishes to know which population censuses of some country included a question on children ever born (see section C of
chapter V). Suppose further, for the sake of this example, that this information is available on the World Wide Web in the form of facsimile copies of the census questionnaires. 221. To obtain the desired information the user must locate the questionnaire for each census on the World Wide Web and then read the questionnaire to see if a question on children ever born was included. Users accustomed to the print medium will perhaps not imagine that any other solution is possible, but users accustomed to using search engines on the World Wide Web may expect to have their computer carry out this work. 222. Now suppose that the user wants this information not for a single country, but for many countries, perhaps for all countries in the world, of which there are nearly 200. The manual labour involved is very great, on the one hand, but on the other hand, it is a routine clerical task of the sort that computers might be expected to help the user carry out. 223. To enable computers to provide this kind of assistance to users it is necessary to create files representing census, survey or civil registration forms in which computers can recognize information as easily as human readers. The established way of doing this is to "mark up" text with "tags" that signal different kinds of information. Consider for example the following fragment of marked-up text representing a census questionnaire:
The text contained between the left and right angles,
for example, <census_questionnaire>, is
Box 2. Illustration of Extensible Markup Language (XML)
<census_questionnaire> <country>South Africa</country> <year>2001</year> <time>midnight between 9-10 October</time> . . . <question> <number>P-03</number> <name>Sex</name> <wording>Is (the person) male or female?</wording> </question> . . . </census_questionnaire>

28
markup. All other text is content. Markup facilitates automatic processing of the document by enclosing different kinds of content in tags that indicate the meaning of this content. 224. The syntax and meaning of the markup in this example are largely self-explanatory. All content is contained between start and end tags containing a name that identifies the meaning of the content. The content contained between the tags <question> and </question>, for example, refers to a question on the questionnaire, which will also contain identification information and instructions to enumerators. Tags may be nested (contain other tags). Questions, for example, consist of three tagged elements: the number of the question on the questionnaire, the name of the question and the wording of the question. 225. When questionnaires are contained in text files, word processor files or facsimile images, it is not
possible for computer programs to ascertain whether particular questions were asked. When questionnaires are contained in suitable marked-up text files, computers can carry out this and many other information-processing tasks on the questionnaire content. 226. SGML stands for Standard Generalized Markup Language, an international standard, ISO 8879, that may be used to define markup languages for many different purposes (Goldfarb, 1990). XML stands for Extensible Markup Language, a simple, flexible text file format derived from SGML. XML has been developed in connection with applications for the World Wide Web. The World Wide Web Consortium web site (http://www.w3.org) provides detailed information on XML and related specifications and their uses.

29
IV. CIVIL REGISTRATION AS A SOURCE OF FERTILITY AND MORTALITY DATA
Introduction
227. Civil registration exists primarily for the purpose of legally documenting births, deaths and other vital events; the provision of statistical information is a secondary function. When civil registration achieves complete coverage of births and deaths, however, it is the preferred source of basic data on fertility and mortality and of data on cause of death. 228. This chapter describes the use of civil registration as a source of fertility and mortality data. A brief synopsis of the operation of a civil registration system, emphasizing the data-collection and processing aspects rather than the legal aspects, is given in section A. The calculation of birth and death rates using civil registration data is explained in section B. 229. Concepts of registration completeness are presented in section C. Section D covers the use of civil registration data when births and deaths are not completely registered. Incomplete civil registration data is often a valuable source of information on fertility and mortality, but its utilization requires special techniques. Nevertheless, utilization of incomplete civil registration data may provide an impetus for the development of civil registration as well as providing information on fertility and mortality. 230. The final section of the chapter, section E, explores the use of population registers in conjunction with a civil registration system as a source of fertility and mortality data. 231. For further information on civil registration systems see the Principles and Recommendations for a Vital Statistics System, Revision 2 (United Nations, 2001b) and the five-volume Handbook on Civil Registration and Vital Statistics Systems (United Nations, 1998b, 1998c, 1998d, 1998e and 1998f).
A. CIVIL REGISTRATION
232. Civil or vital registration is defined as the continuous, universal, permanent and compulsory recording of the occurrence and characteristics of vital events, primarily for the value of legal documents as provided by law, and secondarily for their usefulness as a source of vital statistics. Vital events include live
births, deaths, foetal deaths, marriages, divorces, adoptions, legitimations, recognitions, annulments and legal separations (United Nations, 2001b). 233. Civil registration has deep historical roots. Government registers of various kinds have existed for thousands of years. Civil registration systems in some developed countries have been in operation for over 200 years. As a result of this extensive experience, concepts, definitions and procedures are well developed and have been extensively codified. 234. The laws governing civil registration vary from country to country, but to promote effective civil registration systems, and in the interest of international comparability, countries are encouraged to observe the principles and recommendations for civil registration published by the United Nations, with due regard for the national situation (United Nations, 2001b). 235. Statistical compilation of civil registration data should be centrally planned, organized and implemented. In some countries the organization responsible for statistical compilation may not be the same as the organization responsible for the operation of the civil registration system.
1. Central agency for civil registration
236. The laws governing civil registration in a country should designate a single central agency with primary responsibility for civil registration. The law will stipulate the specific duties, powers and responsibilities of the central agency. In federal systems, the central agency may be at the province or state level rather than at the federal level. 237. Generally speaking, the central agency will be responsible for delineating primary registration areas and for creating, operating and maintaining the network of local registration offices that serve them; for creating a system for compiling the information collected by the local offices for statistical purposes; for enforcing the security and confidentiality of the information collected; and for providing technical guidance to all elements of the network, including training for registration staff. The central agency office will also be responsible for coordination with other government agencies that support the civil registration system, such as the agencies responsible

30
for health services and statistics. For more information on the role of the central agency, see Principles and Recommendations for a Vital Statistics System (United Nations, 1973 and 2001b).
2. Local registration offices
238. Civil registration requires the establishment of registration offices throughout the country, sufficient in numbers and located so that every household is within a reasonable travel distance of a local office. Local offices should be staffed with salaried registrars who have been trained in registration procedures, are equipped with the necessary forms and reference information and are allowed sufficient time for the work. Offices should be kept open for business during convenient hours.
3. The process of registration
239. Responsibility for registration of a vital event lies with a legally designated informant and a local registrar. The informant is responsible for reporting that the event occurred and supplying factual information about it. The local registrar is responsible for completing and processing a registration record on the basis of information supplied by the informant and, if applicable, the certification of the event by a physician or other certifying official. 240. For civil registration purposes, the geographic area of a country is divided into primary and secondary registration areas. Secondary areas of registration may be authorized within a primary registration area, particularly in major hospitals and other health centres where births and deaths occur. In general, each registration area is served by a local registration office, but remote and thinly populated areas may be served by mobile registration facilities. 241. Births and deaths should be registered in the primary registration area in which the birth or death occurred. Boundaries of primary registration areas should be clearly defined and demarcated to avoid confusion with regard to the area in which any given birth or death will be registered. 242. The informant is specified by the laws governing civil registration. For a birth, the informant may be the mother, the father or the administrator of the hospital in which the birth occurred. For a death, the informant may be the closest surviving relative or the attending physician at the time of death. To minimize possible confusion over who is responsible, it is recommended that the law should clearly designate one and only one person as the informant for every
event. A substitute or alternate informant should be designated as well, in case the primary informant is unable to fulfill his or her responsibility. 243. It is recommended that civil registration laws stipulate that events be registered within a certain number of days or weeks of occurrence of the event. The law may specify a small penalty to be imposed for events registered after this time. The system should accommodate late registration, however, preferably in a manner that will discourage late registration of future births and deaths without discouraging registration of births and deaths that have already occurred.
4. Birth and death registration records
244. The information obtained when a birth or death is registered is defined by and recorded on a birth registration record or a death registration record. A distinction may be drawn between the content of the legal registration record and additional information collected for statistical purposes. Registration records are produced by the local registrar at the time of registration. 245. For the purpose of generating fertility data, the most important items on the birth registration record are as follows:
• Date and place of occurrence • Date and place of registration • Type of birth (single, twin, etc.) • Attendant at birth (physician, nurse, etc.) • Type of place of birth (hospital, home, etc.) • Sex of the child • Birth weight • Date of birth of mother • Place of usual residence of mother • Children born alive to mother • Marital status of mother • Date of current marriage of mother (if
married) • Date of previous live birth to mother (if any) • Survival of last live birth to mother (if any) • Date of last menstrual period of mother • Date of birth of father
246. For a complete list of the items recommended for inclusion on birth records, see Principles and Recommendations for a Vital Statistics System, Revision 2 (United Nations, 2001b). That list does not include survival of last live birth. Where registration of infant and child deaths is incomplete, however, survival of last live birth provides valuable data on

31
infant and child mortality (Brass and Macrae, 1984 and 1985). 247. For the purpose of generating mortality data, the most important items on the death registration record are as follows:
• Date and place of occurrence • Date and place of registration • Underlying cause of death • Certifier of cause of death • Place of usual residence of the deceased • Date of birth of the deceased • Sex of the deceased • Marital status of the deceased • Place of usual residence of mother of the
deceased (infant deaths) For a complete list of the items recommended for inclusion on death records see Principles and Recommendations for a Vital Statistics System, Revision 2 (United Nations, 2001b). 248. The underlying cause of death is defined as the disease or injury which initiated the train of events leading directly to death or the circumstances of the accident or violence which produced the fatal injury. For more information on cause of death see the International Statistical Classification of Diseases and Related Health Problems, Tenth Revision, vol. 2, Instruction Manual (World Health Organization, 1993).
5. Knowledge and responsibility in civil society
249. In addition to the necessary governmental infrastructure, civil registration requires that the general public be knowledgeable, capable and cooperative with respect to registration. In particular, informants must be aware that they have been designated as such and know where to go to register the events they are responsible for registering. They should also know that events should be reported promptly and have accurate knowledge of the information, such as the age of a deceased person at the time of death, requested at the time of registration. Information, education and communication (IEC) programmes aimed at improving public knowledge of civil registration and at promoting registration of all vital events are essential to the development and maintenance of a civil registration system (United Nations, 1998d).
6. Tabulation programme 250. In a well-developed civil registration system, every birth or death is registered at a local registration office within a few weeks of occurrence. Shortly thereafter, a statistical record of the event is incorporated into a central data set representing all registered births or all registered deaths. Tabulations of births and deaths may be prepared from these data sets weekly, monthly, quarterly and annually. The detail of the tabulations is generally greater as the period is longer. (a) Date of occurrence and date of registration 251. Final tabulations for any period should generally be based on events that occurred during each time period, as opposed to events that were registered during the period. To ensure comparability over time, tabulations for each period should be produced after a uniform delay, such as tabulations for the month of January made at the end of February or tabulations for each calendar year three months after the end of the calendar year. 252. When there is an urgent need for the most current data possible, special tabulations based on date of registration may be produced, provided that the value of more current information is not vitiated by the resulting coverage error and selection bias. Coverage error results because events registered during any time period (a) include some events that occurred during earlier periods and (b) exclude some events that occurred during the given period but were not registered by the end of the period. The net coverage error is the difference between the numbers of events in these two groups. Even if the net error is zero, the distributions by various characteristics of events registered during the period will not be the same as the corresponding distributions of events occurring during the period. (b) Place of occurrence and place of registration 253. Births and deaths may be classified by place of occurrence of the event and by the place of usual residence of one or more reference persons connected with the event. Place of residence may change with time; it is given as of the time the event occurred. In tabulations of births, the reference person is the mother. In tabulations of all deaths, the reference person is the deceased. In tabulations of infant deaths, the reference person is the mother of the child who died.
32
254. The distinction between place of occurrence and place of residence applies to tabulations at the national as well as the subnational level. Citizens of a country sometimes give birth or die abroad, and citizens of other countries sometimes give birth or die in the country for which data are being tabulated. Civil registration systems may make provision for registration of births to and deaths of citizens living abroad. 255. The distinction between place of occurrence and place of residence is most pertinent, however, in connection with tabulations that provide numbers for geographic subdivisions of the country. In general, the smaller the geographic areas, the more important the distinction, as the distribution of distances between place of occurrence and place of residence is heavily concentrated at relatively short distances. (c) Tabulations for subnational geographic areas 256. An important advantage of civil registration as a source of fertility and mortality data is that data are provided for every part of the country. This makes it possible to provide tabulations for many different systems of geographic classification. 257. The specific meaning of "place" depends on the system of geographical classification used. Principles and Recommendations for a Vital Statistics System, Revision 2 (United Nations, 2001b) recommends tabulations for urban and rural areas, principal cities and towns, and major and minor civil divisions. 258. As indicated in section A.4 of chapter I, however, it may be useful for administration, planning and policy purposes to produce tabulations for other geographical classification systems. Examples noted in the Handbook on Geographic Information Systems and Digital Mapping include labour market areas, economic development areas, school districts, transport planning areas, health planning zones and water resources planning regions (United Nations, 2000b, figure III.1). (d) Age-specificity 259. Tabulations of births and deaths should always include tabulations specific for age. It is very important that sufficient age group detail be provided. For births, age refers to age of mother at the time of birth. For deaths, age refers to age of the deceased at the time of death. 260. Tabulations of births by age of mother will generally include at least one table by single years of
age at the national level, with appropriate allowance for births to women under age 15 and over age 49, the conventionally recognized reproductive age span. Other tabulations generally show standard five-year age groups only, but again with allowance for births to women outside the normal reproductive age span. Unknown ages should always be reported in a �not stated� category. 261. Tabulations of deaths by age will generally include at least one table by single years of age at the national level. Tabulations of deaths by five-year age groups should always disaggregate the 0-4 age group into age 0 (infant deaths) and ages 1-4. It is desirable to disaggregate the 1-4 group into single years as well. Differential mortality by age in the 0-4 age group is always extreme. If this age group is not disaggregated, important information is lost. The lower age limit of the open-ended age group should be sufficiently high that negligible numbers of deaths fall in this group. The open-ended group "100+" is recommended. (e) Examples of tabulations 262. The tabulations that may be produced are obviously constrained by the items included in the statistical records of births and deaths. Even with minimal content, however, tabulations of both births and deaths may be divided into the following four broad groups:
• Tables used for the calculation of birth and death rates
• Tables providing information on characteristics of births and deaths that reflect health conditions in the population
• Diagnostic tables used to analyse the characteristics and operation of the civil registration system
• Miscellaneous tables 263. Tabulations may also be divided into national-level tabulations and tabulations for subnational areas and population subgroups. More and more detailed tabulations will generally be provided for the national level than for subnational areas or population subgroups. 264. Particular national conditions may impose special requirements. In a country in which large numbers of non-citizens live and work, for example, the tabulation programme may incorporate the distinction between citizens and non-citizens. Some tabulations may include a citizenship dimension. Other tabulations may be given separately for citizens

33
and non-citizens, and different tabulations may be provided for the two groups. 265. Examples of tabulations used for the calculation of birth and deaths rates are given below:
• Births classified by age of mother at the time of birth, used in the calculation of age-specific birth rates
• Deaths classified by age of the deceased person at the time of death and sex, used in the calculation of age-specific death rates and life tables
• Births classified by age of mother and live birth order, used in the calculation of age-order-specific birth rates and birth probabilities
• Deaths classified by age of the deceased person at the time of death, by sex and by cause of death, used in the calculation of cause-specific death rates and life tables
• Infant deaths by year of birth (current year, preceding year)
• Infant deaths during each calendar year by month of occurrence of death and age at death in completed months
266. The calculation of age-specific birth and death rates using the first two of these tabulations is discussed in section B below. The fifth table is useful in connection with the calculation of infant mortality rates. The last table is useful in connection with the calculation of life tables. It may be elaborated by providing information on age at death in weeks for deaths occurring in the first month of life, age at death in days for deaths occurring in the first week of life and age at death in hours for deaths occurring in the first day of life. 267. The following examples describe tables providing information on characteristics of births and deaths that reflect health conditions in the population:
• Births by place of occurrence, attendant at birth and hospitalization
• Births by place of occurrence, birth weight and hospitalization
• Births by place of occurrence, period of gestation and hospitalization
• Deaths by place of occurrence, hospitalization and type of certification
• Deaths by place of occurrence and underlying cause of death
268. The information provided by these tables will be most useful for planning and administration of health services if the place-of-occurrence classification is more detailed, for example, by minor civil divisions or smaller areas. In some cases it will be useful to supplement the above list with selected tables incorporating place of usual residence. 269. Examples of tables used to analyse the characteristics and operation of the civil registration system are provided below:
• Births by place of usual residence of mother and place of occurrence of birth
• Infant deaths by place of usual residence of mother and place of occurrence of infant death
• Deaths by place of usual residence of the deceased and place of occurrence of death
• Births registered in current year by year of occurrence
• Deaths registered in current year by year of occurrence
270. The first three tables provide a basis for analysing differences between place of occurrence and place of residence. The last two tables may be used for the analysis of delayed registration, as discussed in section C below. Examples of miscellaneous tabulations include the following:
• Births by age of mother and age of father • Births by number of children ever born to
mother and number of surviving children of mother
• Second and higher-order live births by survival status of preceding birth (alive, deceased)
271. The first table provides information useful in connection with indirect estimation procedures and also for sociological research. Tables two and three provide information on infant and child mortality. All three of the tables will be useful even when registration of births is substantially incomplete.
7. Publication programme
272. The statistical component of a civil registration system will include regular and timely publication of tabular data on vital events, including births and deaths, together with appropriate documentary material. Documentary material includes definitions of terms, descriptions of the various methods and procedures of the civil registration system and

34
evaluations of the timeliness and completeness of registration of births and deaths. 273. The publication programme may be initiated as soon as a substantial fraction of births or deaths is attained in any substantial geographic area of the country. Although generally accepted guidelines for what constitutes "substantial" are not available here, a reasonable interpretation would be more than one quarter of births or deaths registered in an area at least the size of the national capital. 274. The publication of tabulations of births and deaths based on registrations known to be incomplete should be accompanied by pertinent documentary information so that users are aware of the limitations of the data. Information about the operation of the system in different parts of the country and about any available estimates of completeness of registration are especially important while registration is still incomplete. 275. It is sometimes considered that civil registration data are not useful unless registration of births and deaths is complete or nearly complete. Even very incomplete civil registration data may contain valuable information, however, and publishing available data will provide some impetus for further development of civil registration. See section E below for further discussion.
8. Quality of civil registration data
276. The quality of civil registration data consists of the coverage and content dimensions discussed in section A.3 of chapter III. At the national level, when events are tabulated by date of occurrence, quality of coverage in civil registration data is overwhelmingly a matter of completeness of coverage; improper inclusions will usually be rare or non-existent. It should be emphasized that coverage of births and coverage of deaths may be very different, and that where coverage is incomplete, infant deaths may be much less completely registered than non-infant deaths. 277. When events are tabulated by date of registration, the situation is very different. There will usually be no inherent interest in births or deaths registered during a year or other calendar period. Tabulations by date of registration will be regarded as providing an approximation to data tabulated by date of occurrence. This being the case, events occurring during the given period but registered after the end of the period are omissions, and events occurring before the beginning of the period but registered during the
period are improper inclusions. Changes in the pattern of delay between occurrence and registration of events may therefore result in estimated numbers of events that are too large as well as too small. 278. Suppose, for example, that in the past, 25 per cent of all births occurring in any year were registered in the following year; but that improvements in registration have reduced this percentage to zero in the current year. Births registered in the current year will then include all births that occurred in this year, plus 25 per cent of all births that occurred in the previous year. Births will be "over-registered" by about 25 per cent in the current year. 279. At the subnational level, the issue of coverage error is more complicated even when events are tabulated by date of occurrence. Quality control procedures in the civil registration system should ensure that place of registration is accurately reported. Place of usual residence may be misreported, however, and this may create coverage error for local areas. Moreover, place-of-occurrence data are sometimes used as a proxy for place-of-residence data. This may lead to high levels of coverage error, both positive and negative. See the example in section B.2 below. 280. Owing to the primary legal functions of civil registration, statistical processing may be less adequately implemented for civil registration than it is for censuses and surveys. If births and/or deaths appear to be incompletely reported, an attempt should be made to determine whether the statistical processing, rather than the registration per se, is at fault. From the statistical point of view, an event is registered only if it is (a) registered in the local registration office, and (b) this information is captured in the data set used to produce tabulations and other statistics; registration alone does not count. 281. Civil registration has an advantage over census and survey methods in that information is obtained shortly after the events occur, and from an informant most likely to be able to provide accurate information. If date of birth or age are poorly reported in censuses and surveys, however, they may be poorly reported in civil registration data as well.

35
B. CALCULATION OF BIRTH AND DEATH RATES USING CIVIL REGISTRATION DATA
282. Section B covers the calculation of birth and death rates when civil registration is regarded as complete. In practice this usually means that evaluation studies have estimated the completeness of birth and death registration to be sufficiently high that it is not considered necessary to make any adjustment for events not registered. Utilization of incomplete registration data is covered in section D below. 283. Calculation of rates from civil registration and population census (and perhaps also household survey) data involves two principal stages. The first stage attempts to obtain numbers of births and deaths from civil registration and corresponding numbers of persons from the censuses and surveys. 284. The second stage is the estimation of denominators for the rates from the census and survey data. Population censuses are generally taken every 10 years, but denominators will be required for annual, quarterly, monthly and perhaps even weekly numbers of births and deaths. The estimation of denominators is discussed in section B.5 below. 285. A small number of countries maintain complete and up-to-date population registers from which denominators for some birth and death rates may be calculated directly. Population registers are presented in section E below.
1. Exposure to risk
286. A fundamental principle of demographic measurement is that numbers of events of any kind must be related to "exposure to the risk". The principle is most commonly recognized by dividing numbers of events by corresponding numbers of "person-years lived", or "exposure", a statistic that combines numbers of persons who might have experienced ("were exposed to the risk of") the event and the length of time each person was exposed. The resulting quotient is a rate or, more precisely, an "occurrence-exposure rate" of the event. 287. The principle of exposure to risk has two fundamental implications for the calculation of birth and death rates. First, every birth counted in the numerator of any birth rate should have occurred to a woman represented in the denominator of the rate, and likewise for deaths. Second, every birth to a woman represented in the denominator of any birth rate should be counted in the numerator of the rate, and likewise for deaths. The following section gives
an example in which these conditions are not satisfied.
2. Classification by place of usual residence
288. When civil registration system data on births and deaths are tabulated for the purpose of calculating birth and death rates, geographic classifications should generally be by place of usual residence rather than by place of occurrence or place of registration. The population census and survey data from which denominators for birth and death rates are derived nearly always use a geographic classification based on place of usual residence. The principle of exposure to risk dictates that the same geographic classification used for the persons represented in the denominator of any rate be used for the births or deaths counted in the numerator of the rate. 289. Exceptions to this rule occur for tabulations of infant deaths for the purpose of calculating infant mortality rates and tabulations of maternal deaths for the purpose of calculating maternal mortality rates. Since the denominators for these rates are numbers of births rather than numbers of persons, tabulations may be made by both place of occurrence and place of residence. Infant mortality rates and maternal mortality rates may be calculated either by place of residence or by place of occurrence. 290. A simple example shows the kind of error that may result if births are classified by place of occurrence rather than place of residence. Suppose that a local registration area containing a hospital is surrounded by areas that do not have a hospital, and that many women living in the surrounding areas travel to the hospital to give birth. If births are classified by place of occurrence, many births for the area containing the hospital will be to women living in surrounding areas. In consequence, rates calculated for the area containing the hospital will be too high and rates calculated for the surrounding areas will be too low. 291. In terms of the coverage errors discussed in section A.3 of chapter III, both omissions and improper inclusions may result when births tabulated by place of occurrence are used in lieu of births tabulated by place of usual residence of mother. A birth to a woman who lives in area A but gives birth in a hospital in area B will be excluded from the tabulation for area A, an omission, and included in the tabulation for area B, an improper inclusion. 292. The statistical definition of "usual residence" may involve complicated issues (United Nations,

36
1998a, paras. 2.20-2.24). Principles and Recommendations for a Vital Statistics System, Revision 2 (United Nations, 2001b) recommends that civil registration systems adopt the definition of usual place of residence used in the population census (ibid., para. 276).
3. Estimation of denominators
293. It is nearly always necessary to estimate denominators for birth and death rates from population census and survey data that do not provide these denominators directly. Population census data will generally be available only at 10-year intervals, and large sample population surveys will not usually be taken more than once in each intercensal interval. Denominators will generally be required for every calendar year, however, and often for shorter periods as well. 294. The denominators of birth and death rates are by definition numbers of "person-years" of exposure. In practice, person-years lived by a population group during a time period are often approximated by the number of persons in the group at the midpoint of the time period multiplied by the length of the time period. The following discussion will assume that this approximation is used. 295. There are three general approaches to estimation: interpolation or extrapolation, demographic equation methods and modeling methods. Interpolation and extrapolation are simpler, require less data and are most widely applicable, but they may give unsatisfactory results when population change does not follow the pattern assumed in the mathematical procedure. Demographic equation methods are capable of giving very precise results, but they are more complicated and require data that are often not available. Modeling methods will sometimes give best results, and some of these methods are widely applicable, but they tend to be substantially more complicated. 296. To illustrate the first two approaches, consider the problem of estimating (a) the total population and (b) the total number of persons in some age group at some point in time for which a census is not available. (a) Interpolation and extrapolation 297. If census figures for total population size are available from censuses both before and after the given year, the estimated number of persons may be obtained by interpolating between them.
Exponential interpolation using the intercensal population growth rate is often used, though other interpolation methods are possible. 298. If a population census figure is available for some preceding year only, the estimated population will be extrapolated forward from the census figure using an estimated population growth rate. If population growth rates have been approximately constant, the most recent available intercensal population growth rate may be used. If population growth rates have been changing, some allowance may be made for the change. 299. The same procedures may be used to interpolate or extrapolate the number of persons in a particular age group. In this case, the quality of the resulting estimate may be heavily influenced by errors in the census or survey age distributions. Where age distribution errors are severe, appropriate adjustments should be made. (b) The demographic equation approach 300. The demographic equation, also known as the balance equation, is ending population = beginning population + entries - exits It applies to any population observed over any time period. If the population in question experiences no international migration, entries are given by births, exits by deaths. If international migration is present, entries are the sum of births and immigrants, exits the sum of deaths and emigrants. 301. The demographic equation method uses civil registration data on births and deaths, together with data and/or estimates of international migration as required, to estimate population change (entries minus exits) between the time of a census or survey and a later or earlier time for which a population estimate is desired. Some interpolation of numbers of births and deaths will usually be required, because civil registration data will not usually be available for time periods smaller than calendar months. 302. When population numbers are estimated for a time between two population censuses, a "forward" estimate may be made from the earlier census and a "backward" estimate from the later census. Since the available data are never exact, there will be some discrepancy between the forward and backward estimates. This discrepancy is a useful indication of the magnitude of the error of the estimates.

37
303. The demographic equation method is often useful for national-level estimates of total population when net international migration is negligible or can be satisfactorily estimated. It is less often useful for subnational estimates of total population. Internal migration may be the dominant component of population change for subnational areas, particularly for small areas, and data on numbers of internal migrants are often unavailable. 304. The demographic equation method is impractical in many cases because the necessary data on entries to and exits from the population are not available. When estimating numbers of persons in a given age group, for example, entries include persons reaching the lower age limit of the age group during the time period in question and exits include persons who reach the upper limit of the age group during the time period in question. Those numbers are rarely available directly and their estimation may be problematic. (c) Estimation based on age groups versus estimation based on birth cohorts 305. When estimating numbers of persons in particular age groups, the census numbers from which the estimate is made may be either the numbers in the age groups or the numbers in the birth cohort corresponding to the given age group. Suppose, for example, that the number of women 15-19 is to be interpolated to the time midway between two decennial population censuses. The age group calculation would interpolate between the number of women 15-19 at the first census and the number of women 15-19 at the second census. The birth cohort calculation would interpolate between the number of women 10-14 at the first census and the number of women 20-24 at the second census. 306. When age reporting is reasonably accurate, calculations by birth cohort will be more accurate than calculations by age group if there are significant irregularities in the population age distribution. This will be particularly true when estimating numbers of persons at single years of age. When the quality of age reporting is poor, calculations by age group should generally be used. (d) Modeling methods 307. The two approaches described above are simple in principle, although their application often requires careful attention to many small details. Far more elaborate approaches for estimating denominators for age-specific birth and death rates are available. These methods may involve some combination of the
interpolation/extrapolation and the demographic equation approaches. See, for example, the methods described in Coale (1984) and Stupp (1988). 308. Population projection methods, in which the history of changing age distribution is reconstructed in detail so as to optimally fit available data, have the advantage of providing estimated denominators that are consistent with each other over all age groups and time periods and consistent with estimated age-specific fertility and mortality rates. Denominators calculated by any other method will generally not be consistent in this way, though inconsistencies may be statistically negligible.
4. Birth and death rates at the national level
309. The calculation of national-level birth and death rates from civil registration data consists simply of dividing the numbers of births or deaths from the appropriate tabulation (see section A.6 above) by the corresponding denominator estimated from population censuses and household surveys (see the preceding section). 310. In some countries, substantial numbers of citizens give birth or die abroad. Civil registration systems may have provisions for registering pertinent events that occur abroad. If events to citizens living abroad are included in the numerators of rates, the principle of exposure to risk requires that these citizens also be counted in the denominators of the rates. This should be taken account of when estimating denominators. 311. In some countries, substantial numbers of births to non-citizens many occur. Non-citizens may be visitors, foreign workers resident in the country or refugees. If events to any of these classes of persons are registered by the civil registration system, a decision on how to handle them in the calculation of rates is required. By the principle of exposure to risk, if they are included in tabulations of births and deaths and in the numerators of the rates, the corresponding population numbers should be used in the denominators. 312. National practices vary, but civil registration in many countries will register events occurring to visitors and foreign workers, but not events occurring to refugees. Visitor events may be excluded from tabulations of births and deaths, however, as visitors will usually not be enumerated by the population census. Births to and deaths of foreign workers may be included in tabulations, but distinguished from births to citizens.
38
313. Age-specific birth and death rates for single years of age are required for some purposes. The rate of change of fertility and mortality risks is usually very rapid for some ages. The details of this change will be obscured when rates are provided only for five-year age groups. At the same time, calculation of accurate rates for single years of age requires accurate age reporting both in the civil registration system and in the population censuses or other sources from which denominators are calculated.
5. Birth and death rates for subnational geographic
areas 314. As noted in section A.6(c) above, the possibility of providing data for essentially all subnational geographic areas is one of the most important advantages of civil registration as a method of collecting fertility and mortality data. In principle, the calculation of rates for subnational areas is no different than for the country as a whole. In practice, there are usually important differences. 315. The estimation of denominators for rates for subnational areas is nearly always more difficult than for the country as a whole, particularly for smaller areas. Interpolation and extrapolation methods may always be applied, but fluctuations in annual numbers of net migrants for smaller areas may render them less accurate than the same methods applied at the national level. This problem is more severe for interpolation or extrapolation over longer time periods. Demographic equation and the other more advanced methods discussed in section B.3(d) above are often inapplicable because the necessary data on internal migration are not available. 316. The calculation of rates for subnational geographic areas requires that the civil registration system and the population censuses use the same definition of place of usual residence. It also requires coordination in the treatment of visitors, foreign workers and refugees in civil registration and the population censuses. If births to and deaths of visitors are registered, for example, but visitors are not enumerated by the census, the civil registration system should provide tabulations that exclude births and deaths to visitors. 317. Another issue, which arises when rates for very small areas are calculated, is that the numbers of events counted in the numerators of the rates may be too small to provide reliable information. The assessment of random variability due to small population numbers is similar to the assessment of sampling error. A detailed analysis of the issue lies
outside the scope of this handbook, but a useful rule of thumb is that rates should not be calculated if the numerator is less than 25 births or deaths. 318. In the past, birth and death rates have often not been presented for geographic areas smaller than minor civil divisions. With current information technology, however, it is practical to tabulate and store much larger tables of births and deaths and to calculate rates for very large numbers of very small geographic areas�tens or hundreds of thousands of areas or even, for large populations, millions of areas. The development of geographic information systems over the past several decades has provided concepts and tools for the analysis of such very detailed spatial data. For an introduction emphasizing census applications, see the Handbook on Geographic Information Systems and Digital Mapping (United Nations, 2000b).
6. Birth and death rates for population subgroups
319. Population subgroups are defined by such characteristics as sex, ethnicity, urban-rural residence and place of birth. Some characteristics, such as urban-rural residence, may change with time. Others, such as place of birth, are by definition fixed for the lifetime of the individual. Still others, such as ethnicity, are ambiguous in respect to time. Ethnicity is in one sense unchanging over time. Ethnicity is nearly always self-reported in population censuses, however, and persons may change the way they report themselves over time. 320. Even when a characteristic is by definition fixed for the life of an individual, it may be reported differently at different times in the individual's life. Place of birth, for example, may be correctly reported when a person is young, but misreported as place of current residence when the person is older. 321. The calculation of rates for population subgroups is similar in several respects to the calculation of rates for subnational geographic areas. It is necessary to match tabulations of births and deaths from the civil registration system, which provides numerators of the rates, with tabulations of persons from population censuses and household surveys, which provide (via estimation) the denominators of the rates. This requires coordination of statistical definitions between the two data sources. 322. One issue arises in the calculation of rates for population subgroups that does not arise in the case of rates for subnational geographic areas. Information on characteristics of births and deaths in the civil

39
registration system or of persons in population censuses and household surveys, may be unreported. A tabulation of births by ethnicity, for example, may include an �ethnicity�not�reported� category. The usual approach to handling such not-reported numbers is to prorate them. This will incur some error, however, and if the percentage not reporting is high, the error may be considerable. The problem is compounded when not-reported numbers are present in both the civil registration and the census numbers, as will usually be the case, because the patterns of non-reporting may be different between the two sources. 323. Estimation of denominators for rates for population subgroups differs from estimation for subnational geographic areas because it may involve estimating movements between subgroups rather than changes in usual residence. For characteristics that change over time, it will usually be necessary to use interpolation and extrapolation methods, as data required for other approaches to estimation will generally not exist.
C. CONCEPTS OF REGISTRATION COMPLETENESS
324. The standard definition of completeness of registration refers to events (births and deaths) and registrations of those events that occur during a particular time period, most often a calendar year. "Period" completeness of birth registration for a given population (national population, subnational geographic area or population subgroup) during a given time period is defined as the number of births to the population that were registered during the period as a percentage of the number of births that occurred to the population during the period. Period completeness of death registration is defined similarly. 325. When calculating period completeness, an allowance may be made for the maximum permitted delay between the occurrence and the registration of the event. Suppose, for example, that the registration law stipulates that deaths are to be registered within 14 days of occurrence. Then the numerator of death registration completeness for calendar year 2000 may incorporate deaths registered during the first two weeks of 2001 as well as those registered during 2000. 326. Completeness of registration may also be defined as the number of events occurring during a given year that are ever registered, or are registered within a specified time of occurrence. It is desirable to impose some truncation to avoid reference to the indefinite
future. Completeness may be expressed, for example, as the percentage of events that are registered within 10 years of the end of the year of occurrence. 327. Such measures may be referred to as "cohort" completeness statistics. In the case of births, they refer to the subsequent registration history of the cohort of persons born in a given calendar year or other period. In the case of deaths, they refer to the cohort of persons dying during some time period�a less conventional concept, but appropriate to the study of delayed registration of deaths. Delayed registration is discussed in section C.4 below.
1. Components of unregistered births and deaths
328. It is sometimes useful to distinguish unregistered births and deaths that occur where a civil registration system is not functional, which therefore have no possibility of being registered, from births and deaths that occur where civil registration is functional but does not register all events. 329. One simple but important use of this conceptual distinction is the recognition that the civil registration system should provide numbers of births and deaths in sufficient geographic detail to distinguish the two kinds of areas. Estimates of completeness of registration in areas in which civil registration is functional but incomplete may then be made. These are a useful adjunct to estimates of completeness for the country as a whole. 330. It is not uncommon for civil registration to be functional in urban areas and in some rural areas, but to be non-functional in other rural areas.
2. Selectivity of registration
331. Selectivity of registration occurs when completeness of registration differs between geographic areas, population subgroups, or by age, sex or other demographic characteristics. If there were no selectivity of incomplete registration, registered numbers of births and deaths would still have to be adjusted for omissions, but a single adjustment factor could be used for all numbers of births and deaths. 332. Selective registration should be analysed and assessed, to the extent possible, to ensure that civil registration data do not convey a distorted picture of demographic conditions. It is often the case, for example, that completeness of registration of births and deaths is higher in urban areas than in rural areas. Applying a single adjustment factor, accurate for the country as a whole, to urban and rural areas separately

40
will in this case overstate the level of fertility and mortality in urban areas and understate the levels in rural areas. 333. Most methods for estimating completeness of registration make the assumption that under registration is uniform with respect to certain characteristics, such as age, within some population group. Information on the selectivity of registration with respect to those characteristics is useful when evaluating estimates of completeness produced by these methods. 334. Selectivity of registration can sometimes have unexpected and surprising results. One study found, for example, that selected American cities in which there were university schools of public health had higher death rates than comparable cities without such schools. The study concluded that the schools of public health were indeed responsible for the difference. The causative factor, however, was the positive influence of these schools on completeness of registration�not a negative influence on health conditions.
3. Date of occurrence and date of registration
335. Date of registration of a birth or death should always be part of the information that a civil registration system gathers about the event. Date of registration is an artifact of the registration process, rather than a characteristic of the event as such, but it is important for assessing the extent of delayed registration. 336. Delayed registration occurs when births or deaths are registered after the deadline stipulated by the civil registration law. It may happen, for example, when a large fraction of births are not registered until the children reach primary school age, whereupon they are registered to permit the child to enter primary school. 337. Delayed registration of deaths is probably less common than delayed registration of births for the simple reason that deceased persons are no longer present in the society. Nonetheless, evaluations of civil registration should scrutinize evidence of delayed death registration as well as of delayed birth registration.
4. Analysis of delayed registration
338. Delayed registration is a possible cause of incomplete registration during a particular year or other time period. When births or deaths are tabulated
by date of registration, rather than by date of occurrence, it may also result in numbers of deaths that are too high, as noted in section A.6 (a) above. 339. To assess the extent of delayed registration the civil registration system may produce, each year, tables showing all births and deaths registered during the year classified by year of occurrence. The tabulations may include other characteristics, such as age of mother at birth (for births) and sex and age of the deceased person (for deaths). 340. These tabulations provide valuable information about the extent of delayed registration. If there is little delayed registration, nearly all births or deaths registered in any given year will have occurred in this same year. If registration of many births and deaths is delayed, many events registered in any given year will have occurred in prior years. The supplementary dimensions of the tabulations will reveal similarities and differences between registration delays according to the corresponding characteristics. Differences in registration delays are one possible source of selectivity in incomplete registration. 341. The tabulations are particularly valuable when accumulated over two or more years. Suppose, for example, that tabulations of births registered each year by year of occurrence are available for the years 1990 to 2000. The tabulation for 1990 will show the number of births registered in 1990 that also occurred in 1990. The tabulation for 1991 will show the number of births registered in 1991 that occurred in 1990, and similarly for later years. An annual series of tabulations makes it possible to follow the cohort of persons born in any year�the cohort of persons born in 1990, for example�and see how many of the persons were registered in that year and how many were registered in each following year. 342. When patterns of delayed registration are reasonably regular, they may be used to estimate the number of events occurring in any given year from the number of events occurring and registered in subsequent years. This provides a method of estimating incompleteness of registration due to delayed registration. Life-table methods may be used to analyse the delay between the occurrence of an event and its registration by the civil registration system in much the same way as they are used to analyse length of life, which may be thought of as a "delay" between birth and death. For an example involving delays in registration of marriages, see Feeney and Saito (1985).
41
5. Trends in registration completeness 343. When assessing completeness of registration it should generally be assumed that completeness is changing over time. Statements of registration completeness must therefore refer to particular years or other time periods. 344. It will often be impossible to estimate completeness of birth and death registration directly for every calendar year. Special surveys to evaluate completeness may be taken only once or twice in each decade. Methods that estimate completeness using population census or survey data may give estimates for periods considerably longer than calendar years, such as for the period between two censuses. 345. Assessments of changing registration completeness will therefore sometimes take the form of qualitative assessments: whether completeness is rising or falling, whether changes are gradual or abrupt, or, in the case of gradual changes, the approximate annual rate of change. 346. Gradual changes are to be expected if registration completeness is slowly improving. Abrupt changes may result from various causes, such as expansion of the civil registration system to areas not previously served, campaigns aimed at persuading citizens to register births and deaths, or announcements of changes in fines for late registration. Documentary materials provided in annual reports of civil registration data may provide information on activities, changes or developments that may have affected registration completeness. 347. Gradual changes in registration completeness may usually be approximated by a linear trend over periods of a decade or more. The assumption of linear changes in completeness is sometimes used to model and estimate changing registration completeness (Macura, 1972).
D. UTILIZATION OF INCOMPLETE CIVIL REGISTRATION
DATA 348. The general approach to the use of incomplete civil registration data is to estimate the level of registration completeness and use that estimate to adjust registered numbers of events upwards to estimate true numbers. This is generally done on a period basis by multiplying registered births and deaths occurring in a given year or other time period by a correction factor. The correction factor is simply the inverse of the estimated completeness of registration.
349. When adjustment factors are applied to distributions of births or deaths by age or other characteristics, the accuracy of the adjusted distributions depends both on the accuracy of the estimated completeness of registration and on the selectivity of registration (section C.3 above). When adjustment factors are applied to data for a series of years or other time periods, changing completeness of registration must be taken into account (section C.5 above). 350. Systematic assessment of the completeness of birth and death registration should be part of the normal operation of every civil registration system. If registration is seriously incomplete, estimates of completeness are invaluable for making the data useful for statistical purposes. If registration is complete or nearly complete, estimates are necessary to ensure that completeness of registration does not deteriorate as conditions affecting the system change. 351. Record-matching studies were mentioned in section A.3 of chapter III as a general approach to evaluating data quality. Applied to civil registration data, these studies match civil registration records of individual births or deaths with records derived from population censuses, household surveys or some other source. When such studies are available, they should be utilized. Often they are not available, however, and in this case estimates of registration completeness may be made by means of aggregate comparisons with population census and household survey data, covered in section D.2 below.
1. Indications and estimates of incomplete registration
352. Indications of incomplete registration of births and deaths are statistics that suggest that some events are not registered but that do not provide a quantitative estimate of the extent of incomplete registration. When no estimates of completeness are available, indications may be useful for guiding efforts to produce estimates. 353. The simplest indications of incomplete registration are birth or death rates that are unreasonably low. Given that the highest levels of life expectancy at birth observed in national populations are around 80 years, for example, a set of death rates derived from civil registration that yields an expectation of life of 90 years almost certainly reflects incomplete registration of deaths. 354. Other indications are based on simple comparisons. If rural death rates are much lower than urban death rates, for example, it is likely that death
42
registration in rural areas is incomplete. The inference is based partly on the expectation that it is more difficult to achieve complete registration in rural areas and partly on the expectation that death rates are likely to be lower in urban areas than in rural areas. 355. The spatial and temporal detail provided by civil registration may be the basis for more sophisticated comparisons. To quote an early study of registration completeness in the United States of America:
If the death rate of a district increases and those in all adjoining districts decrease, there is ground for suspecting that the increase is due to improvement of the records. ... A similar argument applies if the rate of the central district rose much while that of the surrounding ones rose little. If the rural death rate near a city is extremely low while that of the adjoining city is much higher, and if the low rate in the country has been increasing while that in the city has not, this would indicate that the death records in the country districts were incomplete at the start but had been improving (Willcox, 1940, p. 205).
Observations such as these do not provide any basis for adjusting registered numbers of births and deaths, but they do provide useful information about completeness of registration.
2. Aggregate comparisons with census and survey data
356. The general approach to aggregate comparisons is to identify a statistic that can be computed from both available civil registration data and data available from another source that may be more accurate. The difference between the two statistics, if in the expected direction, is then imputed to incomplete registration. Completeness of registration is estimated by determining how large an adjustment factor must be applied to the registered numbers of events to bring the statistic derived from civil registration into agreement with the statistic derived from the alternative source.
Example 1. Suppose that a fertility survey has provided a total fertility rate of 3.4 children per woman for the three-year period preceding the survey interviews and that the total fertility rate calculated from civil registration data for the same period is 2 children per woman. Multiplying the civil registration value by 3.4/2 = 1.700 will give the survey rate. The implied
completeness of registration is 2/3.4 = 0.600, or 60 per cent. Note that completeness of registration, expressed as a proportion, is the reciprocal of the adjustment factor that must be applied to the registered number of events to obtain the estimated true number of events.
357. In practice the calculation will not be so simple, although the principle is the same. Fertility survey interviews are generally conducted over a period of many months, and the information obtained usually refers to the date of interview rather than to any fixed reference time. Civil registration data are generally provided for calendar periods, years, quarters or months, which will generally not correspond precisely to the survey fieldwork period. Comparison requires appropriate reconciliation of the time reference of the two sources of information.
Example 2. Suppose that life expectancy at birth has been estimated from census or survey data to be 68 years and that life expectancy calculated from civil registration data is 75 years. It is evident that multiplying the civil registration death rates by some factor greater than one and recalculating the life table will give a lower life expectancy, but there is no simple formula for calculating the factor that will reduce the civil registration life expectancy from 75 to 68 years. Given the computational power of modern personal computers, however, the desired factor may be easily obtained by numerical methods.
An essential difference between example two and example one is the lack of a linear relationship between the statistic compared and the age-specific rates from which it is computed. Multiplying a set of age-specific birth rates by any factor will multiply the total fertility rate calculated from them by the same factor. Multiplying a set of age-specific death rates by some factor, however, will multiply the resulting life expectancy by a different factor. 358. Computer spreadsheet programs provide a simple computational approach to the problem of finding the desired factor. The first step is to develop a spreadsheet that takes age-specific death rates as input and produces a life table, including the value of life expectancy at birth, as output. This spreadsheet is then edited so as to allow the input age-specific death rates to be multiplied by a factor contained in one of the spreadsheet cells. The value in this cell is then set
43
to the value which gives the desired life expectancy at birth. This may be accomplished by trial and error or by using a spreadsheet function designed for this purpose. 359. In the first two examples the statistic compared is a common demographic indicator whose value is of interest in its own right. It may happen, however, that comparison is facilitated by choosing a statistic that is not a familiar demographic indicator, as in the following example.
Example 3. Suppose that registered births distributed by single year of age of mother at birth are available for each year between two censuses taken five years apart. Suppose also that a question on number of children ever born to women was included in both censuses and that the average numbers of children ever born to women at each single year of age are available for both censuses. The difference between the average number of children born to women at any given age at the first census and the average number of children born to women at this age plus five years at the second census gives an estimate of the cumulative cohort birth rate between the two ages. An estimate of the same statistic may be derived from the birth registration data, which may then be compared to the census-derived estimate to estimate completeness of reporting for the given cohort and age group. For an example of this procedure see Coale, Cho and Goldman (1980, pp.14-18).
In example three, the statistic compared is unusual and of limited interest as a measure of fertility. Once the comparison is effected, however, the resulting estimate of registration completeness may be applied to births registered during the intercensal period and the result used to estimate standard age-specific birth rates from the incomplete civil registration data.
3. Use of patterns
360. Certain uses of civil registration data do not depend on registration being complete, only on the extent of incompleteness being approximately constant over time or across certain population groups. 361. If registration completeness is approximately constant, for example, the trend of birth and death rates computed from civil registration will be correct
even though the level is low. This may be valuable information in conjunction with estimates from other sources subject to different kinds of errors. Birth rates estimated by the own-children method or from a birth history, for example, may provide a better indication of overall level but, owing to age or date misreporting, a distorted indication of trend. In this case the overall level of fertility may be set from the one source and the trend from the other. For an example of an analysis using this approach see Retherford, Mishra and Prakasam (2000). 362. In the same way, the age distribution of births or deaths derived from civil registration may be approximately correct even though the level of registration is low. The age pattern of fertility from incomplete civil registration data, for example, may be used in connection with fertility estimation from population censuses or surveys. 363. The age pattern of deaths may give a useful indication of adult mortality, although the level of completeness of reporting of infant and child deaths is likely to differ from that of adult deaths. In particular, when HIV/AIDS prevalence is high, the age pattern of adult deaths will clearly indicate the presence of AIDS deaths, which occur over an age range during which rates of death from other causes are relatively low.
E. POPULATION REGISTERS AS A SOURCE OF FERTILITY
AND MORTALITY DATA 364. A population register is a continuously updated data set containing one record for each person in a population. A fully developed population register may be a very desirable source of fertility and mortality data, but the development of such a register poses many challenges. A population register is a method of organizing data collected by various data collection systems, including a civil registration system for collecting data on births and deaths and closely coordinated systems for collecting information on immigrants, emigrants, changes of residence and changes in such personal characteristics as educational attainment or occupation. Many countries maintain population registers of some kind, but few have population registers sufficiently developed to provide fertility and mortality data comparable to that provided by the other sources discussed in this handbook.
1. Concept
365. As indicated in section B of the present chapter, the calculation of birth and death rates from civil

44
registration data consists of dividing numbers of births and deaths by the corresponding numbers of persons. The relative complexity of those calculations arises from the use of one data source (civil registration) to provide numerators and a different source (population censuses and surveys) to provide denominators. 366. Civil registration may in some circumstances be used to provide denominators as well as numerators for birth and death rates. Imagine a country that has had complete birth and death registration for as long as anyone in the population has been living, approximately 100 years. Suppose also that the country experienced no immigration or emigration over this period. Suppose finally that every time the civil registration system registers a birth, a record for the person born is created, and that every time the civil registration system registers a death, the record of the person who died is located and the fact of death recorded on it. 367. The person records created in this way provide, in principle, complete information on the size and age-sex distribution of the population at every point in time. To determine the number of the persons in the population as of midnight on a given date, for example, it is necessary only to determine the number of records for persons who were born before this time and died after this time. To determine the number of these persons in a particular age group, it is necessary only to select those records with corresponding dates of birth.
2. Registering immigrants and emigrants
368. National populations, particularly over long time periods, invariably experience some combination of immigration and emigration. Immigrations and emigrations are not vital events, by internationally accepted definition, though they are as "vital" for population change as births and deaths. Data on numbers and characteristics of international migrants are therefore not captured by civil registration. 369. The maintenance of a population register therefore requires, in addition to a civil registration system, a system that registers every immigrant coming into a country and every emigrant leaving the country. If such a system exists, or can be created, and if it provides complete and accurate information on every international migrant, it may be used to update a population register for international migration in much the same way as civil registration records are used to update the register for natural population change.
370. Every time an immigrant is registered, the population register will be searched to determine whether a record for this person exists, since it is possible that this person was previously a member of the population. If a record for this person is found, it will be updated with the information on the time of most recent entry to the population. 371. If the population register contains no record for the immigrant, a new record containing the sex and date of birth of the immigrant and the date of immigration will be created. 372. Every time an emigrant is registered, the record of the person who emigrated will be located in the population register and updated to reflect the particulars of emigration.
3. Registering changes of residence
373. Fertility and mortality data are nearly always wanted at the subnational as well as at the national level. For a population register to provide information at the subnational level it must provide information on place of residence. To update this information requires a system for registering changes in place of residence. Creating such a system may be more difficult than creating a civil registration system or a system for registering immigrants and emigrants. This is probably the main reason population registers are not more widely used as a source of fertility and mortality data. 374. If a system for registering changes of residence exists or can be created, the procedure for using it to keep the population register up to date is similar to the procedures already discussed. Every time a change of residence is registered, the record of the person in question is identified in the population register and updated. If all changes of residence are registered, and if the information provided is accurate, the register may be used to produce the number of persons in any age-sex group in any local area at any time.
4. Registering changes in other personal characteristics
375. Place of residence is one of many individual characteristics that change with time and may be used to calculate birth and death rates for particular population subgroups. The ability of a population register to provide fertility and mortality data for population subgroups will be limited by the information included on person records. Each personal characteristic that may change over time requires a system for updating the information in the register for every person in the population.

45
376. The information required may be available from administrative records, such as student records maintained by educational institutions or unemployment records maintained by employment security systems. A population register may in principle draw on this information to update information on the educational and employment status of every person in the population. Practical implementation is another matter. At the present time, such schemes are practical only in a few developed countries.
5. Creating and maintaining a population register
377. Creating a population register requires the creation of a data set containing one record for every person in the population. Every population census creates such a data set, subject to incomplete enumeration. 378. Maintaining a population register requires that the records be continuously updated, including the following tasks:
• A new person record must be created when a birth or immigrant is registered
• When a person in the population changes his or her place of residence, the record must be updated accordingly, and similarly for any other personal characteristics included in the population register
• When a death or an emigration occurs, the record of the person who died or emigrated must be updated to reflect pertinent information about this event
379. To be useful as a source of fertility and mortality data, therefore, a population register must be supported by data-collection systems that register every immigrant to a population, every emigrant from the population, every change of residence in the population and every change in other personal characteristics that may alter with time and are included in the register. Those requirements are in addition to the requirement for a civil registration system that registers all births and deaths.

46
V. FERTILITY DATA FROM CENSUSES AND SURVEYS
Introduction 380. The present chapter examines the various questions that may be included in population censuses and sample surveys to generate data on fertility, and emphasizes the interplay between questions on age, relation to head of household, and children ever born and surviving. 381. The question of number of children ever born, covered in section D, provides important data on fertility that are often unavailable from any other source, including a fully developed civil registration system. It is very widely used in censuses and surveys throughout the world. When asked together with the question on surviving children presented in section A of chapter VI, it provides important data available on infant and child mortality. 382. The most detailed questions used to produce fertility data by census and survey methods are those that generate a birth history for each woman, which consists essentially of a list of all the woman's children indicating the date of birth of each child and various other information. Birth histories, presented in section F, are characteristic of fertility surveys, but they are sometimes used in large-scale household surveys and even, rarely, in population censuses. Despite the "birth" history designation, birth histories are an important source of information on infant and child mortality, as they nearly always include questions of whether each child born is surviving at the time of the survey interview and, if not, the date of death.
A. REVERSE SURVIVAL
383. The number of persons under one year of age enumerated in a population census may be regarded as an estimate of the number of births that occurred in the population during the year prior to the census. If migration is negligible and estimates of mortality are available, the estimate can be improved by adjusting the number of persons upward to account for persons who died before the census was taken. This adjustment is known as reverse survival. 384. Where complete civil registration data on births do not exist, reverse survival may be routinely used to estimate numbers of births, crude birth rates and general fertility rates for the 15 years prior to each population census and some or all population surveys.
Estimates for longer periods are possible, but may be problematic for various reasons, and since censuses are usually available every 10 years, the value of longer series is usually small. If age patterns of fertility are available, total fertility rates may be estimated as well. 385. It is very valuable to have overlapping series of estimates from successive censuses and/or surveys because this provides a test of accuracy. The following section illustrates the importance of coordinating the production of fertility data from different data sources. Reverse survival estimates derived from a census taken in 2000 alone will be far less valuable than those estimates taken in conjunction with similar estimates derived from a census taken in 1990 and one or more surveys taken during the intercensal decade.
1. Questions
386. The only information strictly required for reverse survival is the age, in single years, of every census or survey respondent. That information may be obtained either by questions on date of birth (preferable) or by a direct question on age. Reverse survival requires estimates of the level of mortality, however, which are frequently provided by questions on children ever born and surviving. Children-ever-born questions are covered in section D below, and children-surviving questions in section A of chapter VI. 387. Age is by far the most important of all demographic characteristics, for the measurement of fertility and mortality as well as for many other purposes. The concept of age in Western cultures is simple and well established. A person's exact age at any given time is the time elapsed since the person was born. A person's age in completed years is the greatest integral number (0, 1, 2, ...) less than the person's exact age. 388. The preferred approach to collecting information on age in population censuses and surveys is to include a question on date (year, month and day) of birth. This is likely to provide more accurate information than a direct question on age. When a direct question on age is used, age should always be recorded in single years to at least age 97 (98 and 99 may sometimes be reserved as codes for "age 98 or older" and "age not stated").
47
389. A general principle to be observed when collecting population census and survey data of all kinds is to use, to the greatest extent possible, questions that respondents are most likely to be able to answer accurately. In the case of date of birth and age, this means asking questions in terms of calendrical systems and methods of age reckoning used by respondents and informants. In many Asian societies, for example, census and survey questions should ask date of birth according to the lunar calendar. Translation of lunar calendar to solar calendar dates may be effected during data processing. Fieldworkers should not be used to make such translations, as the work will distract them from the more important task of obtaining the most accurate information possible, without yielding consistently accurate results. 390. It may be appropriate to include extra questions to facilitate the collection of more accurate information on age and date of birth. For example, in situations where many respondents have documents, such as identity cards or vaccination records, that indicate their date of birth, a survey may include a question on whether this documentation was made available for the enumerator. 391. The importance of date of birth and age should always be emphasized in the training of fieldworkers, and it will often be useful for fieldworkers to convey this importance explicitly to respondents. With respect to the collection of fertility data, it is particularly important to obtain the most accurate birth dates or ages possible for children and young adults.
2. Tabulation
392. Every population census and most population surveys will provide a tabulation of total population by sex and age in single years. This tabulation is the primary input to reverse-survival calculations of numbers of births and of birth rates. 393. Single-year age distributions should be produced and analysed even when the quality of age reporting is poor. Single-year distributions allow a far more detailed scrutiny of the data for errors and make it possible to regroup ages to minimize the effects of age misreporting.
3. Estimation
394. Estimated numbers of births during the first, second, ... year prior to a population census or survey are calculated by applying reverse survival factors to
the numbers of persons age 0, 1, 2, .... These factors are most often calculated from an estimated life table applicable to the population during the years for which estimates are calculated. If mortality has been changing and a series of life tables for the years prior to the census or survey is available, reverse survival factors may be calculated from the series of life tables rather than from a single table. 395. For many countries, the children-ever-born and children-surviving questions discussed in section D of the present chapter and section A of chapter VI are an important source for the estimated life tables used in these calculations. When children-ever-born and children-surviving data are used for reverse survival calculations, a convenient method for calculating reverse survival factors directly, without the calculation of life tables, can be found in Brass (1979). 396. The estimation of crude birth rates and general fertility rates requires the total number of persons and the number of reproductive age women respectively, as of the midpoint of each year prior to the census or survey. Those numbers may be estimated by reverse survival of the census or survey age distribution, again using one or more estimated life tables. 397. The reverse survival calculations described above do not take account of migration. At the national level, migration may be negligible, but it will often be significant for subnational areas, particularly for small subnational areas. The effect of migration is likely to be larger for estimates of births and birth rates in the more distant past because older persons are generally more likely to have migrated than younger persons. While it is in principle possible to make adjustments for migration, this seems rarely to have been done in practice. Information on place of birth and/or duration of residence might be utilized for this purpose, for example.
4. Quality
398. The quality of reverse survival estimates of births and birth rates depends on the accuracy of the age distribution data, the accuracy of the reverse survival factors, and the extent of migration (or, if migration is adjusted for, the accuracy of those adjustments). 399. The impact of age distribution errors on the quality of reverse survival estimates is easily understood. If the reported number of persons at age 0 is 10 per cent low, the estimated number of births for the year prior to the census or survey will be 10 per

48
cent low as well. Erratic fluctuations in the age distribution of children and young adults due to age misreporting will translate into correspondingly erratic fluctuations in estimates over time. Estimates of numbers of births and birth rates over the 15-year period prior to a census or survey may be reasonably good, however, even if year-to-year estimates are very poor (Retherford, Mishra and Prakasam, 2000). 400. The impact of errors in the reverse survival factors is equally simple, but in this case there is a robustness not present in the case of age distribution errors. Reverse survival factors that are too high (low) because the level of mortality has been overestimated (underestimated) will give estimates of births and birth rates that are too high (low). In all but very high mortality populations, however, the importance of these errors is attenuated because reverse survival ratios reflect proportions surviving rather than proportions dying. 401. Suppose, for example, that 10 per cent of births in some cohort die and that the estimate of this percentage is low by 30 per cent, a large error. The estimated reverse survival ratio will then be 1/(1-0.07) = 1.075, as compared with a correct ratio of 1/(1-0.1) = 1.111. The estimated survival ratio is of course too low, but it errs by only 3.2 percent (1 - 1.075/1.111), barely more than one tenth the error in the mortality estimate. 402. The impact of migration on reverse survival estimates is simple if no adjustments are made for migration. If a particular birth cohort loses (gains) members as a result of migration, the reverse survival estimate of the number of births in this cohort will be too low (high). If adjustments are made for migration, the impact will presumably be reduced, but the specific impact will depend on the particular adjustment procedure and the accuracy of the data used. 403. In practice, the accuracy of the age distribution data is usually the most important consideration. When estimates are made for very small subnational areas, however, high levels of migration may be an important factor. Errors due to poor estimates of reverse survival ratios will generally be the least important factor, although this is contingent on reasonable care being taken in the estimation of the level and trend of mortality. Age distribution errors are discussed in detail in the following section. 404. When reverse survival estimates are made for subnational geographic areas, such as for urban and rural areas, states or provinces or lower-level
geographic units, migration may lead to errors. Although reverse survival provides retrospective estimates for 15 or more years prior to a census or survey, those estimates are based on place of residence at the time of the census or survey. 405. Consider, for example, a 15-year series of estimates for urban areas of a country made from a census taken in 2000. Many of the persons living in urban areas at the time of the census may have lived in rural areas five, ten or fifteen years earlier, but their childbearing will be attributed to urban areas. The urban fertility estimates for earlier years will be an amalgam of the urban fertility of those who were living in urban areas in the earlier years and those who were living in rural areas and subsequently migrated. A tendency for rural-to-urban migrants to have lower fertility than rural non-migrants may of course mitigate this effect of migration. 406. The most effective approach to assessing the quality of reverse survival estimates is to compare time series of estimates derived from different data-collection operations carried out at different points in time. If the different trends are reasonably consistent, this is usually a good (though not definitive) indication that the estimates are of reasonably good quality. If the different trends differ sharply, this is a certain indication that some or all of the estimates err. Analysis of the differences may then point to conclusions about the magnitude and direction of the errors in the various series that may be used to improve the estimates. The example of section A.4 of chapter III is illustrative. This approach has the advantage of addressing all the errors to which the estimates are subject.
5. Age distribution errors
407. Age distribution errors result from age misreporting and from differential underenumeration by age. Age misreporting errors, particularly those attributable to age heaping, are the most familiar, but not necessarily the most important. To assess age distribution errors it is essential to consider errors of all kinds. (a) Age misreporting 408. Age misreporting may be usefully visualized by imagining a square table showing the population in question classified by true age (rows) and reported age (columns). If there were no age misreporting, this table would have non-zero entries only in the diagonal extending from the uppermost left cell to the lowermost right cell. The distribution of non-zero

49
cells in any row represents the distribution of reported ages for persons of the true age represented by the row. 409. Any age or age group may gain and lose members as a result of age misreporting. Considering enumerated persons only, the reported number of persons at any age x will be the number of persons whose true age is x plus the net number of persons transferred to this age from other ages by misreporting. Because the net number transferred may be zero, even with substantial age misreporting, there is a distinction between the extent of age misreporting and the extent to which the number of persons reported as being a given age differs from the number of persons actually at this age. 410. Age heaping, in which exaggerated numbers of persons are reported at ages ending in �0� and �5�, is the best known and least important form of age misreporting. In its more pronounced manifestations, which are common, it is instantly apparent. Various indices of its severity exist and are routinely computed, but they are of limited use. More substantial information may be gained simply by plotting the age distribution. Age heaping tends to affect older ages more than younger ages and may be fairly effectively neutralized by appropriate adjustments. 411. More important forms of age misreporting in the present context are those that (a) shift the ages of very young children upward, (b) bias the reported ages of young women on the basis of their marital status or number of children ever born, or (c) exaggerate the ages of older persons. 412. Ages of young children (infants and children under 5 years of age) are frequently overreported, resulting in a net deficit of persons in younger age groups. Why this should happen is not well understood, but the error is of great practical importance. It results in estimates for the period immediately preceding the census or survey that are too low, thereby creating the appearance of a fertility decline where none has occurred, or exaggerating an actual decline. The effect is most readily recognized when estimates are made from two or more different censuses and/or surveys. Figure 1 of chapter III provides a striking and instructive example. 413. Reported ages of young women may be biased in different directions depending on whether or not they are married and how many children they have. Where age is not an important social consideration, respondent's knowledge of age may be poor, so that
the respondent and/or the fieldworker are obliged to guess an approximate age. In this situation, the age of women who are unmarried or childless may be reported as younger than their true age, and the age of women who are married and have children may be reported as older than their true age. Misreporting of this kind can result in very substantial net transfers among age groups 10-14, 15-19 and 20-24. For reasons that are not well understood, such transfers may occur for men as well. 414. Ages of older persons, sometimes including young adults, may be exaggerated, that is, the proportion of persons whose age is reported as greater than their true age may regularly exceed the proportion of persons whose age is reported as being less than their true age. This may result from some idea that advanced age is a personal and social distinction. The paper by Retherford and Mirza (1982) provides a useful case study. 415. The three kinds of age misreporting errors are more difficult to assess than age heaping errors and, perhaps for this reason, have been less studied and are less well understood. Their assessment must usually be combined with that of age-selective under-enumeration, as in the study of Luther, Dhanasakdi and Arnold (1986). (b) Age-selective underenumeration 416. The quality of age data reflects age-selective underenumeration as well as age misreporting. Age misreporting distorts the reported age distribution of the enumerated population. Age-selective under enumeration distorts the true age distribution of the reported population. The two kinds of errors combine to create differences between (a) the reported age distribution of the enumerated population, and (b) the true age distribution of the �true� population, that is, the population that would have been enumerated if there were no age misreporting and no coverage error. 417. A tendency to omit infants in censuses and surveys is the simplest example of age-selective underenumeration, as well as being most important for the accuracy of reverse-survival estimates. If 20 per cent of persons aged 0 years are omitted from a census or survey, for example, the estimated number of births for the year prior to the census or survey will be, on this account, 20 per cent low. In practice, it is difficult to distinguish between the effects of age misreporting and age-selective underenumeration in age distribution data.

50
418. Age-selective underenumeration and age misreporting may interact when certain questions are addressed only to persons of certain ages. Suppose, for example, that women under age 50 are asked a very detailed set of questions about all the children they have borne, whereas women age 50 or over are not asked these questions. This creates an incentive�for enumerators who prefer minimizing their work to obtaining accurate information�to overstate the ages of women close to age 50. 419. Ewbank (1981) provides an older but meticulous and thorough discussion of errors in census and survey age distributions.
B. THE OWN-CHILDREN METHOD
420. The own-children method is an extension of the reverse survival method in which the children who are reverse survived are matched, where possible, to their mothers. The matching of children and mothers allows characteristics of the mothers to be attached to their children. This makes it possible to disaggregate reverse-survived numbers of births by age of mother at birth, and therefore to calculate age-specific birth rates. It also makes it possible to calculate age-specific birth rates for various subgroups of the population, for example, by educational attainment of mother. 421. In the context of the own-children method, any person under age 15 may be referred to as a �child�. Age 15 is chosen because this is, approximately, the lower boundary of the reproductive age span. For every such child it is ascertained, first, whether the mother of this child is alive and living in the same household, and second, if so, which person the mother is. Children of women living in the household are the �own-children� of these women, rather than adopted or temporarily resident children of other women; hence the name of the method. �Non-own-children� are children who live in households that do not include their mother.
1. Questions
422. Because the own-children method is an extension of reverse survival, the most fundamental questions are those on date of birth or age, already presented in section A.1 above. The other questions required vary with circumstance but may include �line number of mother�, relation to head of household, children ever born and children surviving. 423. The simplest way to match children to their mothers is to include on the census or survey schedule
the question, �What is the line number of the mother of this person?� �Line number� identifies the number of the line on the census or survey questionnaire that contains information about the mother (United Nations, 1998a, para 2.75). The �line number� phrasing assumes a row-column questionnaire format in which rows correspond to persons and columns to information items. Other formats may be handled by suitably rephrasing the question. 424. If the question on line number of mother is the only pertinent question, fieldworkers may be instructed to leave the space provided blank if the mother of the child is deceased or living elsewhere. In some cases, however, questionnaires will include one or more questions on the survival of parents to provide information on the level and trend of adult mortality (see section C of chapter VI). In this case, the line-number-of-mother question may follow the question on survival of mother. The sequence of questions might be, for example:
Is this person's mother still living? If so, is this person's mother living in this household? If so, what is the line number of this person's mother?
In this case, since the first question on survival of mother will generally be asked of all persons, the other questions may be asked of all persons as well. The information may be used for birth history reconstruction, an extension of the own-children method that produces birth histories from censuses and large-scale population surveys. Birth history reconstruction is introduced in the following section. 425. The question on survival of mothers, which provides information on adult female mortality, will usually be accompanied by a question on survival of fathers, which provides information on adult male mortality. In this case, the second two questions in the above list may be asked of fathers as well as of mothers. This will allow the calculation of birth rates specific for characteristics of father as well as for characteristics of mother. This includes birth rates specific for age of father, required for some methods of adult mortality estimation, as well as conventional maternal age-specific birth rates for population subgroups defined by characteristics of fathers. 426. The own-children method may often be applied even if the question on line number of mother is not included in the census or survey. Virtually all population censuses and surveys include a question on relation to head of household. That information may

51
often be used to infer the correspondence between children and mothers. This approach, explained further in section B.4 below, will be satisfactory if (a) the relation-to-head question provides sufficient detail and (b) households are reasonably close to nuclear (i.e., consist of mother/wife, father/husband and one or more children). Where extended households with relatively large numbers of members are common, it is important to include a question on the line number of mother if the own-children method is to be applied.
TABLE 3. OWN-CHILDREN TABULATION
NOTE: NOC = non-own children
2. Tabulation 427. Once children have been matched to mothers, the age of the mother for each own-child is available and may be used to make the following tabulation of all persons under age 15 by age of child and age of mother. Ages must be given in single years. If significant numbers of births occur to women under age 15, women aged 10-64 should be included in the table. Women aged 50-64 years are included because these women contribute births to the population during the 15 years prior to the census. �NOC� denotes "non-own children", children who do not live with their mother (whether because the mother is deceased or because she is living elsewhere) and for whom age of mother therefore cannot be determined. That row consists effectively of children for whom age of mother is �not stated�.
3. Estimation
428. The tabulation described in the preceding subsection is used to compute age-specific birth rates
for the 15 years prior to the census. The numbers in the cells of the table provide, after some technical adjustments, numerators of age-specific birth rates. Corresponding denominators are obtained by reverse survival of the population age distribution. Details of the method are given in Cho, Retherford and Choe (1986). Computer programs for carrying out the calculations are available. See also United Nations (1983).
4. Matching
429. The information provided in this section is pertinent only if questions identifying mothers and children in households (such as the �line number of mother� question) are not included in the census or survey. In this case, mothers and children may, under certain conditions, be matched using the �relation to head of household� question that is all but universally included in population censuses and surveys. 430. The question on relation to head of household asks, for each person in the household, the relation of that person to the head of household or other reference person. One and only one person in the household must be designated as the head or reference person. Other persons in the household are then identified in relation to this person. To avoid unnecessary repetition any question of this type will be referred to here as a "relation to head" question, even if the question refers to a reference person of some other type. 431. Many variations in the classification of relation to head may be found, but all are based primarily on kinship relations. Typical categories are: head, spouse, child, spouse of child, grandchild or great grandchild, parent or parent of spouse, other relative, domestic employee and other unrelated person (United Nations, 1998a, para 2.73). 432. The idea of matching is sketched briefly in the following paragraphs. For a more extended commentary see chapter 4 of Cho, Retherford and Choe (1986). 433. Matching is carried out household by household using the person records for all persons in the household. The objective is to determine, for each person under age 15 in the current household, whether (a) this person's mother is present in the household and, if so, (b) which person the mother is. Each person under age 15 is processed in turn. If no mother is identified, this person is marked as a "non-own" child. If the mother is identified, the record of the mother is identified.
Age of child Age of mother
0
1
2
3
4
.
.
.
10
11
12
13
14
15 16 17 18 19 . . .
60 61 62 63 64
NOC

52
434. Suppose for example that (a) a person under age 15 has the relation-to-head classification �child� and (b) the head of the household is a female over age 15. In this case the head of the household will be identified as the mother of the child. 435. Or suppose that (a) a person under age 15 has relation-to-head classification �child�, (b) the head of the household is male, and (c) there is a woman over age 15 in the household with the relation-to-head classification �spouse�. In this case the woman may be identified as the mother of the person under age 15. It is of course possible that this woman is not the mother of the child. She may be a second wife, for example, and the person under age 15 a child of the first wife. In many circumstances, however, occasional matching errors will not significantly affect the accuracy of the resulting estimates. 436. A variety of supplementary information may be used to improve the quality of the matching. Mother's ages may be checked, for example, to ensure that they were in the reproductive ages when matched children were born. If information on surviving children is available, a check may be introduced to ensure that no woman is matched to more than the number of her surviving children. If information on the number of children living in the same household as the mother is available (see the discussion of the children-ever-born question in the following section), a check may be introduced to ensure that no woman is matched to more than this number of children.
5. Quality
437. Because the own-children method is an extension of reverse survival, the discussion of the quality of reverse survival estimates given in section A.4 applies to own-children estimates as well as to reverse survival estimates. More particularly, the estimates of fertility level yielded by the own-children method are subject to precisely the same kinds of errors as reverse survival estimates. 438. The quality of the age pattern of fertility indicated by own-children estimates reflects the accuracy with which children are matched to mothers and the accuracy of age information for mothers. Age-heaping errors will not appear as such in estimates of age-specific birth rates by single years of age because the larger numbers of mothers at particular ages will tend to be matched with correspondingly large numbers of children. Age exaggeration, however, may result in age-specific birth rates for older age groups that are too high. To illustrate with a simple artificial example, if all women in the 40-45 age group are
reported as being in the 45-49 age group, the fertility rate estimated for the older age group will be much higher than the true rate. 439. If the question on line number of mother is used, it will usually be possible to identify accurately the woman the respondent regards as the mother of each child in the household. The intention of the question is to obtain information on the biological mother-child relation, but respondents may regard social relationships as more important. There may be a tendency, for example, to report adoptive children as biological children, even in the face of enumerator instructions to the contrary. This will distort the age distribution of fertility if, for example, adoptive mothers tend to be older than the biological mothers (Rindfuss and Sweet, 1977, p. 31). 440. With respect to the estimation of fertility rates for the population as a whole, the accuracy of the matching of children to their mothers is important only insofar as it affects the age of the woman identified as the mother of each child. If the wrong woman is identified as the mother of the child, but her age is the same as the age of the true mother, the estimates will be unaffected. 441. If mothers of children are identified by matching, the accuracy of the resulting estimates depends on the accuracy of responses to the question on relation to head, and on the sufficiency of this and other information used to effect the match. Misreporting of relation to head of household is unlikely to be a serious problem. Spouses, children, grandchildren and parents will rarely, if ever, be confused with each other. Careless errors might result in some persons in these categories being identified as �other relative�, though this seems unlikely. The distinction between the two classifications of unrelated persons might in some cases be unclear, but this will not matter for purposes of matching for children and mothers. 442. Whether the information on relation to head and supplementary information used are sufficient to effect an accurate match depends mainly on the composition of households. If households consist mainly of nuclear families, matching will often give good results. Good results may also be obtained when households include grandparents, other relatives and unrelated persons. As households become more complex, however, to the point of including more than one nuclear family, the possibility of accurate matching of mothers and children declines. Where such households are common, the question on line number of mother should be used if the own-children method is to be applied.

53
443. When the own-children method is used to provide estimates of population subgroups, errors may arise from the movement of persons between these subgroups. The phenomenon is similar to the effect of migration in the case of estimates for subnational geographic areas, as discussed in connection with reverse survival in section A.4 above. When persons move between subgroups (e.g., change employment status or occupation) retrospective estimates of fertility rates will amalgamate the experience of those in different employment or occupational-status groups at each year prior to the census or survey. The effect will be to attenuate estimated differences between groups. Trends as well as levels may be affected.
C. BIRTH HISTORY RECONSTRUCTION
444. Birth history reconstruction is an extension of the own-children method that produces a complete birth history for every woman under age 65 years from population census or survey data (Luther and Cho, 1988). Reconstructed birth histories may be used to produce many of the same detailed measures of fertility as birth histories. Birth histories are considered in section F below. In the present context, birth histories generated by the detailed questions described in section F may be referred to as �actual� birth histories. 445. The matching of children to mothers effected by the own-children method produces what may be called an �own-children history�, a list of the own-children of each woman aged 15-64 years of age showing the sex and age of each child. The age of the children gives the year of birth, where �year� is understood to refer to years beginning and ending at the reference time of the census or survey. 446. If for some woman the number of own-children equals the number of children ever born, the own-children history includes all children and is therefore a birth history. If the number of own-children is less than the number of children ever born, some of the woman's children are living elsewhere or are deceased. The difference between the number of own-children and the number of surviving children for this woman is the number of her children who are living elsewhere. The difference between the number of children surviving and the number of children ever born is the number of her deceased children. 447. Birth history reconstruction imputes years of birth for surviving children living elsewhere and deceased children based on the years of birth of the own-children and the estimated age patterns of fertility and mortality. In this way a complete birth
history for each woman is generated. Reconstructed birth histories for particular women will generally differ from their true birth histories, but the nature of the reconstruction assures that the aggregate of all reconstructed birth histories will be statistically similar to the aggregate of true birth histories. 448. Applications of birth history reconstruction indicate that when age reporting is reasonably accurate, fertility measures derived from reconstructed birth histories closely approximate the same measures derived from reported birth histories (Luther, Feeney and Zhang, 1990).
1. Questions
449. In addition to including questions that allow the application of the own-children method (see section B.1 above), the census or survey must include questions on number of children ever born (see section D below) and number of surviving children (see section A of chapter VI).
2. Tabulation
450. Tabulation of reconstructed birth histories is similar in principle to tabulation of actual birth histories, but there are two important practical differences. The first difference is that reconstructed birth histories provide only the year of birth of each child, rather than date of birth, where year refers to years beginning and ending at the reference time of the census or survey. This is in many respects a minor disadvantage in practice, but it requires tabulations designed accordingly. 451. The second difference between reconstructed and actual birth histories is that reconstructed birth histories will often be available for much larger sample sizes than actual birth histories. Actual birth histories are generally collected for 5,000 to 10,000 women of reproductive age. Birth history reconstruction may be applied to arbitrarily large population surveys and to samples of census data that may include many millions of women of reproductive age. It is therefore possible to produce many more and much more detailed tabulations from reconstructed birth histories than from actual birth histories. (a) Age-parity tabulations 452. Reconstructed birth histories may be used to calculate age-parity-specific birth rates, where �parity� is defined as the number of children a woman has borne. A sequence of tabulations is required, one for births of each order. The tabulation for first births

54
is shown in table 4. Since age of mother at the time of birth is not available from reconstructed birth histories, age of mother is taken as of the end of the year of birth. 453. The asterisk in table 4 show (the potential) non-zero cells of the table. Entries lying on the upper left to lower right diagonals represent births to the same birth cohort of women. Thus the entries along the lowest diagonal represent first births to women aged 64 years at the time of the census or survey; those births occurred in the fifty-fourth through the first year prior to the census or survey. It is suggested that the tabulation be constructed exactly as shown, including the rows corresponding to births to women under age 10, which should of course only contain zeros. This will facilitate the programming required to calculate age-order specific birth rates from the table and will also provide a check on errors that arise from age misreporting.
454. The tabulation is of women rather than of births. Since there is a one-to-one correspondence between
women having a birth of a given order during any time period and births of this order during that same time period, however, the numbers in the table may be interpreted as numbers of first births as well as of numbers of women having a first birth. 455. The table for second births is similar (table 5). Here also the tabulation is of women, but the cells represent numbers of second births as well as numbers of women having a second birth. The tabulations for third and higher-order births are similar to those for first and second births.
456. The final tabulation of the series will in principle aggregate nth and higher-order births, where n is chosen so that the proportion of nth and higher-order births is negligibly small. In practice, the simplest procedure is generally to make tables for the first through the twentieth births. Higher-order births will in most cases be so few that they may be safely ignored.
TABLE 4. WOMEN WITH ONE OR MORE CHILDREN EVER BORN, BY YEAR OF BIRTH OF FIRST CHILD AND AGE OF WOMEN AT END OF YEAR OF BIRTH OF FIRST CHILD
Year of birth of first child
(Years prior to census)
54
53
52
.
.
.
3
2
1
Age of woman at
end of year of
first birth 0 1 2 . . .
* * * . . . * * * 10 * * . . . * * * 11 * . . . * * * 12 . . . . . . . . . . . . . . . . . * * * 62 * * 63 * 64
NOTES: * = cell potentially filled · = continuation blank = no entry

55
(b) Parity-duration in parity tabulations 457. Reconstructed birth histories may also be used to construct tabulations of births by birth order and completed years �duration in parity� of the mother at the time of the birth. These tables may be used to compute parity progression ratios of the type originated by Henry (1980; for recent work see Feeney, 1983; Feeney and Yu, 1987; Feeney, 1988; Luther, Feeney and Zhang, 1990; and Feeney and Wang, 1993). 458. Parity progression refers generally to demographic statistics that describe what proportion of women with a given number of children go on to have another child and, for those women who do have another child, the distribution of waiting times between the given birth and the next birth. 459. Since duration in parity zero is the same as age, the basic tabulation for progression to first birth is the same as in table 4. The basic tabulation for
progression from first to second birth is shown in table 6. 460. The vertical dimension of the tabulation, mother's completed years in parity 1 at the end of the year of second birth, is simply the year of second birth minus the year of first birth. Thus women who have their first and second births in the same year (this will usually be the result of multiple births and only very rarely of short inter-birth intervals) have duration in parity zero at the end of the year. Women who have their second birth the year following their first birth have duration in parity 1 at the end of the year, and so on. 461. The table for progression from second to third birth is similar (table 7). The tables for progression from third to fourth birth and for higher-order progressions are similar to those for progression from first to second and progression from second to third birth.
TABLE 5. WOMEN WITH TWO OR MORE CHILDREN EVER BORN, BY YEAR OF BIRTH OF SECOND CHILD AND AGE OF
WOMEN AT END OF YEAR OF BIRTH OF SECOND CHILD
Year of birth of second child (Years prior to census)
54
53
52
.
.
.
3
2
1
Age of woman at
end of year of
second birth 0 1 2 . . .
* * * . . . * * * 10 * * . . . * * * 11 * . . . * * * 12 . . . . . . . . . . . . . . . . . * * * 62 * * 63 * 64
NOTES: * = cell potentially filled · = continuation blank = no entry

56
TABLE 6. WOMEN WITH TWO OR MORE CHILDREN EVER BORN, BY YEAR OF SECOND BIRTH AND COMPLETED YEARS IN PARITY 1 AT END OF YEAR OF BIRTH OF SECOND CHILD
Year of second birth
(Years prior to census)
21
20
19
.
.
.
3
2
1
Completed years in parity 1 at end of year of second birth
* * * . . . * * * 0 * * . . . * * * 1 * . . . * * * 2 . . . . . . . . . . . . . . . . . * * * 18 * * 19 * 20
NOTES: * = cell potentially filled · = continuation blank = no entry
462. The last tabulation in the series will in principle aggregate tabulations for progression from nth to n + 1st birth and all higher-order progressions. In practice, the simplest procedure is generally to make tables for all progressions through progression from nineteenth to twentieth birth. Higher-order births will nearly always be negligible.
3. Estimation
463. Subsection C.3 gives a very brief description of estimation procedures for the tabulations described in subsection C. 2. The references indicated should be consulted for further information. 464. Since the calculations described here will rarely, if ever, be carried out manually, the large number and size of the tabulations involved will not usually be problematic.
(a) Age-parity-specific birth rates 465. The birth rates calculated from the age-parity tabulations described above (tables 4 and 5) are period-cohort rates, defined as women age x at the beginning of year y divided into the numbers of births to these women during year y. Because the number of women does not change over time, the number of women age x at the beginning of year y is the same as the number of person years lived by these women during year y. 466. Conventional central (age-period) rates are defined as births during year y to women age x at the time of birth divided by person years lived by women age x during year y. The central rate for women age x in year y may be approximated as the average of the period-cohort rates for women age x - 1 and women age x at the beginning of year y.

57
TABLE 7. WOMEN WITH THREE OR MORE CHILDREN EVER BORN, BY YEAR OF THIRD BIRTH AND COMPLETED YEARS IN PARITY 2 AT END OF YEAR OF BIRTH OF THIRD CHILD
Year of third birth
(Years prior to census)
21
20
19
.
.
.
3
2
1
Completed years in parity 2 at end of year
of third birth
* * * . . . * * * 0 * * . . . * * * 1 * . . . * * * 2 . . . . . . . . . . . . . . . . . * * * 18 * * 19 * 20
NOTES: * = cell potentially filled · = continuation blank = no entry
467. Tables 4 and 5 give the numerators of (period-cohort) age-specific birth rates. The corresponding denominators are given by numbers of women at each single year of age at the time of census or survey. Since all births in the table are to women surviving at that time, the denominators for all births to any given birth cohort of women are the same. Thus the number of women aged 64 years at the time of the census or survey is the denominator for all the rates corresponding to the births on the diagonal extending from far lower right to upper left in the table. (c) Age-parity-specific birth probabilities 468. The tabulations used to estimate age-parity-specific birth rates may also be used to estimate age-order-specific birth �probabilities�. This usage of the word �probability" originates with Whelpton (1954) and is idiosyncratic to demography. 469. The essential difference between the age-parity-specific birth rate for ith order births to women age x in year y and the age-order-specific birth probability for the same age and year is that the rate takes all women in the denominator whereas the probability takes only those women who are able to have an ith birth, that is, women with i - 1 children ever born. 470. Denominators of age-parity-specific birth probabilities are calculated progressively within birth cohorts by subtracting numbers of births of each order that occur during a given year from the number of women of the corresponding parity at the beginning
of the year, a procedure originated by Whelpton (1954). Consider, for example, the cohort of women age 14 years at the beginning of some year, and suppose that none of these women have had any children, so that they are all parity zero. The number of those women still in parity zero at the end of the year is the number in parity zero at the beginning of the year less (a) the number who died and (b) the number who had a first birth during the year. When the calculation is applied to births to women surviving at the time of a census or survey, deaths are nil and numbers of women of parity i at the end of any given year are obtained by subtracting the number of i +1st births during the year from the number of parity i women at the beginning of the year. (d) Birth probabilities specific for parity and duration in parity 471. The calculation of birth probabilities specific for parity and duration in parity is similar in principle to the calculation of probabilities specific for age and parity, but the details are quite different. Calculations of probabilities specific for age and parity are organized around birth cohorts of women, that is, groups of women born during the same year. Calculations of probabilities specific for parity and duration in parity are organized around parity cohorts of women, that is, groups of women having a birth of a given order during a given year. The calculations are described in detail in Feeney (1988) and in Feeney and Wang (1993).

58
4. Quality 472. Since birth history reconstruction is an extension of the own-children method, the explanations of quality given in sections A.4, A.5 and B.5 of the present chapter apply to the results of birth history reconstruction as well as to the results of the reverse survival method and the own-children method. Beyond the considerations discussed in those sections, the quality of estimates derived from reconstructed birth histories depends primarily on the quality of the imputation of dates of birth for non-own and deceased children. When the level of mortality is moderate to low and most children under age 15 live in the same household as their mother, year of birth is imputed for a relatively small fraction of all births, so that even an imperfect imputation procedure will give reasonably good overall results. The study by Luther, Feeney and Zhang (1990) shows that estimates derived from reconstructed birth histories may be nearly as accurate as estimates derived from actual birth histories if reverse survival and the own-children method give good results.
D. CHILDREN EVER BORN
473. Questions on number of children ever born to women have been very widely used in population censuses over the past 50 years and have on the whole been very successful. The questions have also been used with success in population surveys. They provide important information on fertility and, when combined with the question on surviving children (chapter VI, section A), equally important information on infant and child mortality. 474. Data on children ever born are important for countries that do not have complete birth registration, where they serve as an alternative source of information on the level and trend of fertility. They are also important for countries with complete birth registration, however, for two different reasons. The first reason is that they are generally necessary for the calculation of fertility measures based on birth order and parity of women, which may be very important for analysing fertility trends. Civil registration data on births may easily be tabulated by birth order as well as age, but the corresponding numbers of women "exposed to risk" are given by census tabulations of women classified by age and parity. The second reason is that children-ever-born data from a census or survey may be used to study differential fertility using the other information collected in the census or survey. Socioeconomic information, in particular, is generally far more detailed in census and survey data than it is in vital registration data.
1. Questions 475. The basic question is
Children ever born How many children have you [has this woman] had altogether in your [her] lifetime, including children who died shortly after birth and children living elsewhere?
If possible, the question should be asked of all women who might have had any children. In some cases, it is asked only of ever married women; in other cases, of women above some minimum age, usually taken to be between 10 and 15 years. 476. In a few cases, an upper age limit has been specified. This is not recommended: an upper age limit may tempt fieldworkers to exaggerate women's ages to avoid asking the question; and the information for older women often provides information on historical levels and patterns of fertility available from no other source. 477. The question on children ever born is often asked in conjunction with a question on the number of these children who are surviving, discussed further in section A of chapter VI. In this case the two questions are asked together in sequence:
Children ever born How many children have you [has this woman] had altogether in your [her] lifetime, including children who died shortly after birth and children living elsewhere? Children surviving How many of these children are now living?
This pair of questions is sometimes elaborated into the following four questions:
Children living here How many children have you [has this woman] borne who are living in this household? Children living elsewhere How many children have you [has this woman] borne who are living elsewhere? Children deceased How many children have you [has this woman] borne who are no longer living? Please include all children born alive, including any who died shortly after birth.

59
Children ever born How many children have you [has this woman] borne altogether in your [her] lifetime?
Taken together, these four questions are logically redundant, since the answers to any three imply the answer to the fourth. The wording indicates explicitly that children ever born includes deceased children, however, and the redundancy provides a check that may be used during fieldwork to identify and probe inconsistent responses. In some cases a question on number of children born dead has been added to this list, as, for example, in the 1970 census of Malaysia (Cho, 1976). 478. In population surveys, where it is possible to include more questions, it may be desirable to preface the detailed questions on children ever born by a �filter� question such as the following:
Have you [Has this woman] ever had a live birth?
The question may include the definition of �live birth� (see the entry for live birth in the glossary). 479. The rationale for asking four questions instead of two is that the additional questions may improve completeness of reporting of children ever born by encouraging the inclusion of deceased children and children living elsewhere. Whether the four questions do in fact give results sufficiently superior to justify the burden of the additional two questions has never been established by empirical studies. In population surveys that include relatively large numbers of
questions, it may be advisable to utilize the four questions. In population censuses, in which it usually necessary to strictly limit the total number of questions, the choice is not so clear. In the absence of field test results clearly indicating that four questions provide superior results, it may be preferable to use two questions only. 480. Questions on children ever born may be extended to obtain information on numbers of male and female children, allowing the estimation of sex ratios at birth and, if numbers of male and female children surviving are ascertained as well, estimates of sex differentials in mortality. The sex ratio at birth does not vary greatly from one population to another, however, so questions to ascertain the sex of children ever born will be useful only if quality of reporting is reasonably high. An important exception to this general rule occurs where there are sex differentials in abortion, which may result in extremely high sex ratios at birth.
2. Tabulation
481. Despite the inclusion of questions on children ever born in censuses and surveys throughout the world for well over half a century, tabulation of data on children ever born involves several subtleties, and published examples of unsatisfactory tabulations are regrettably common. The problems involve the choice of open-ended age and parity groups, the handling of not-stated cases, and the provision of total numbers of children ever born to women. 482. Table 8 may be taken as a general guide for the tabulation of data on children ever born.
TABLE 8. WOMEN BY AGE AND NUMBER OF CHILDREN EVER BORN, AND TOTAL CHILDREN EVER BORN BY AGE GROUP OF WOMEN
Number of children ever born
Age of woman
0 1 2 . . . 14 15+
CEB not
stated
Total women
Total children
born
10-14 15-19 20-24
.
.
. 80-84 85+ NS
Total NOTES: CEB = children ever born NS = not stated
60
The precise specification of the tabulation depends on the women of whom the question on children ever born is asked. If it is asked of all women over a certain age, the title will refer to "women aged ... and over" and the lower limit of the age classification will reflect this. If the question is asked of ever-married women only, the title will refer to "ever-married women" and the age classification will reflect the lower age limit of the women of whom the question on marital status is asked. 483. The standard age grouping is by five-year groups, modified if necessary to allow for the ages of the women of whom the questions are asked. The open-ended age group should be set higher, rather than lower, to avoid needlessly discarding data that might prove to be useful. A minimum age of 85 years as the lower bound of the open-ended age group is recommended. A higher age may be appropriate for populations with higher proportions of persons over age 85. The age-not-stated (NS) row will be absent if not-stated ages have been imputed. 484. It is advisable to produce at least one table for the national level showing children ever born by single years of age. If age reporting is accurate, that table will provide substantially more information than a table showing five-year age groups only. If the quality of age reporting is poor, a table by single years will be useful for assessing the effects of age misreporting on the pattern of children ever born by age of mother (Hull and Sunaryo, 1978; Hull, 1995). 485. Numbers of children ever born should be given by single integers, never grouped, except for the open-ended group. The parity distribution will generally be truncated with an open-ended parity group, since the alternative is to allow for the maximum possible number of children ever born, which is more than 30 (Bongaarts and Potter, 1983). The open-ended group should be chosen to keep the proportion of women falling in it below one per cent over all age groups. For high-fertility populations, the open-ended parity group should generally be no earlier than 15 or more children. 486. The column for �children ever born not stated� will be absent if those cases have been imputed. If not-stated cases are present, they must be shown explicitly. Not-stated cases should never be grouped together with zero-parity women. In one documented instance where this was done, proportions of childless women were grossly overstated (Feeney, 1991). 487. Total children ever born to women in any given age group may be calculated from the untruncated
distribution of these women by children ever born as the number of women with one child ever born, plus twice the number of women with two children ever born, plus three times the number of women with three children ever born, and so on. A complete distribution is necessary for an exact calculation since there is no way of knowing, for a truncated distribution, the number of children ever born to women in the open-ended parity group. 488. The column showing total number of children ever born should be regarded as mandatory, for its omission will often impair the quality of the estimates produced from the tabulation and will always cause substantial extra work for anyone producing the estimates. The counts in this column are produced during tabulation by incrementing the appropriate cell, each time a record is processed, by the number of children ever born.
3. Estimation
489. Data on children ever born provide the basis for estimating a wide variety of fertility statistics. Only birth history data, actual or reconstructed, provides more opportunity to generate detailed fertility statistics. Data on children ever born may be generated by a single question, however, whereas birth history data require either the asking of a large number of complex questions (section F below) or the implementation of a complex methodology (section C above). Section D.3 describes briefly the various kinds of fertility statistics that may be estimated from children-ever-born data. (a) Parity distributions 490. The simplest fertility measures that may be estimated from data on children ever born are parity distributions of women in different age groups. "Parity" in this context is synonymous with "number of children ever born". The parity distribution consists simply of the proportion distribution of women in any age group by number of children ever born. 491. If there are no �not-stated� cases, the parity distribution is calculated simply by dividing the number of women with each number of children ever born by the total number of women. If �not stated� cases are present, the division should be by the total number of women less the number of women for whom children ever born is not stated. 492. There is, however, an important caveat for the latter calculation. It may be that number of children ever born is far more likely to be unreported for

61
women with no children ever born than for women with one or more children ever born. If this is the case, an attempt should be made to estimate the proportion of women with children ever born not stated who are childless. For more information see section 4 below. 493. Parity distributions are of limited interest for women who have not yet completed reproduction. For women near or past the end of the reproductive age span, however, parity distributions estimate the distribution of women by completed fertility. Such distributions of completed fertility provide important information about the pattern of fertility in both high- and low-fertility populations. For high-fertility populations, they show that substantial proportions of women have only a few children, even though on the average women may have six or more children ever born. For low-fertility populations, they show the importance of third and higher-order births in populations in which average completed fertility is less than two children per woman. A number of issues of the United Nations Demographic Yearbook have dealt specifically with fertility. Those volumes, covering scores of countries throughout the world over the past half century, contain data on children ever born that provide evidence for the preceding conclusions. 494. Parity distributions may be calculated for any group of women for whom number of children ever born is available, including all women and women in various duration-of-marriage groups as well as women in various age groups. Parity distributions for groups of women not disaggregated by age or duration of marriage are generally of little interest, however, since they merge the experience of women just beginning childbearing, who have no or few children, and women who have completed childbearing. (b) Parity progression ratios 495. A parity progression ratio is a proportion of women, among those who have had at least a given number of children, who go on to have another child; or, in the case of women with no children, who have at least one child. 496. When calculating parity progression ratios from a children-ever-born tabulation shown in table 8, the ratio for progression from ith to i + 1st birth is the number of women with i + 1 or more children ever born divided by the number of women with i or more children ever born. For i = 0 this is the same as the number of women who have one or more children divided by the total number of women.
497. Parity progression ratios may be calculated for any group of women for whom number of children ever born is available, but they are of most interest for women who have completed or nearly completed their fertility. In practice this means women close to or over age 50. (c) Average number of children ever born 498. The average numbers of children ever born to women in different age groups provide a convenient summary of fertility in a population. Those averages are calculated by dividing the total number of children born to women in an age group by the total number of women in the age group, with appropriate allowance for women for whom number of children ever born is not stated. 499. If total children ever born must be calculated from truncated distributions of children ever born, various procedures are available to estimate approximately the number of children born to women in the open-ended parity group. One method involves the calculation and extrapolation of parity progression ratios. A simpler method, involving the less realistic assumption that higher-order parity progression ratios are identically equal, is described in a study of the 1947 and 1957 censuses of Malaya (Saw Swee-Hock, 1964). These methods will provide satisfactory estimates of total children born only if the proportion of women in the open-ended group is small. Avoidance of such estimation procedures is an important reason for including a "total children ever born" column in tabulations of children ever born. (d) Completed fertility 500. Completed fertility refers to the average number of children born to an actual or hypothetical group of women who have reached the end of the reproductive ages, generally taken to be age 50. Average children ever born to women aged 50-54 years at a particular census, for example, estimates completed fertility for this group of women. 501. Completed fertility may also refer to a birth cohort, that is, the group of women born during a given time period. There is a simple correspondence between birth cohorts and age groups, for persons in any age group at any given time were born during a particular time period and therefore belong to a particular birth cohort. Women aged 50-54 years as of 1 January 2000, for example, were necessarily born during calendar years 1945-1949.

62
502. Completed fertility for this birth cohort will not necessarily be the same as completed fertility for this age group, however, because the average number of children ever born to women who die before reaching age 50 may not be the same as the average number of children ever born to women who survive to age 50. 503. Completed fertility is sometimes calculated by cumulating age-specific birth rates for a cohort of women. In this case, completed fertility refers to the average number of children born to a hypothetical group of women who experienced these age-specific birth rates, but did not experience any mortality. 504. Average numbers of children ever born for women in age groups that begin above age 50 are often regarded as estimates of completed fertility for the corresponding birth cohort. Where levels of fertility and mortality are not very high, the quality of these estimates may be very good. 505. Average numbers of children ever born to women in age groups beginning below age 50 may also be used to estimate completed fertility for the corresponding birth cohorts. Consider, for example, the group of women age 25-29 years at the time of some census or survey. The fertility of those women is incomplete, since they will have more children in future years. Suppose, however, that an estimate of the age pattern of fertility for the cohort is available. From the age pattern it is possible to calculate the ratio of the average number of children ever born to women in the cohort when they are age 25-29 years to the completed fertility of the cohort. The calculation is essentially that used by the P/F ratio method described in Manual X: Indirect Techniques for Demographic Estimation (United Nations, 1983). Dividing the average number of children born to women in the age group by this ratio gives an estimate of completed fertility for the corresponding birth cohort. The age pattern of fertility required to carry out this estimation may be obtained in various ways. The simplest approach is to use the age pattern of fertility for the year prior to the census or survey obtained from the own-children method or a question on recent births (see section E below). More elaborate approaches may be used to take account of changes in the age pattern of fertility over time. (e) Total fertility rates 506. The completed fertility of any birth cohort provides an estimate of the total fertility rate as of the time this cohort reaches its mean age at childbearing (see glossary entries for definitions of the total fertility rate and the mean age at childbearing). This
observation provides a basis for estimating fertility trends from census or survey data on children ever born. Since the mean age at childbearing, generally just under 30 years of age, tends to vary little even when fertility is changing, the quality of the estimation mainly reflects the accuracy of the average numbers of children ever born. The procedure is most valuable when data on children ever born are available from two or more censuses and/or surveys, in which case the comparison of trends from each census or survey provides a simple way of assessing the accuracy of the estimates. 507. Total fertility rates may also be estimated by the procedure noted in the following paragraph. (f) Age-specific birth rates 508. When data on children ever born by age of mother are available from two or more successive censuses and/or surveys, average numbers of children ever born for cohorts may be differenced to estimate the age-specific birth rate for the cohort during the period between the censuses and/or surveys. Various techniques may be used to derive estimates of period fertility from this data. For an example, see Coale, Cho and Goldman, 1980.
4. Quality
(a) Underreporting of children ever born 509. Experience in Africa during the 1950s and 1960s showed that (a) although recent births were often seriously understated, the age pattern of fertility could be reasonably accurate; and that (b) completeness of reporting of children ever born was often satisfactory for younger women, but deteriorated seriously for older women. This led to the development of the P/F ratio method for estimating the level of fertility when both types of data are available (Brass et al., 1968; United Nations, 1983). The method uses the information on age pattern of fertility from the data on recent births and the information on level of fertility from the data on children ever born, together with the assumption that the level of fertility has not been changing, to estimate and correct for both types of errors. 510. The early experience of underreporting of children ever born to older women led to undue neglect of those data, which subsequent experience has shown may be as accurate as data for younger women. One study, for example, used data on children ever born for women aged 50 years or over in the 1962, 1969 and 1979 censuses of Kenya to
63
show that the level of fertility in Kenya increased substantially between 1920 and 1960. Although data from all three censuses were far from perfect, the errors were not consistent with a pattern of deteriorating completeness of reporting with increasing age, and it was possible to arrive at strong conclusions regarding the level and trend of fertility despite the errors. Given the paucity of data for the country before 1960, this finding probably could not have been obtained in any other way. 511. If respondents fail to report deceased children and children living elsewhere because they do not understand that they are supposed to be included, the more detailed questions discussed above may improve the quality of response. Good results have been obtained with the simpler questions, however, and poor results with the more elaborate questions. Confusion over the meaning of the questions is not the only explanation for underreporting. Respondents may be disinclined to speak of children who have died, for example, in which case clarifying the meaning of the questions is not likely to improve response. 512. Respondents may include adopted children and exclude biological children given up for adoption in their reports of children ever born. This will lead to errors for individual women, and may distort the shape of the parity distribution (if childlessness is a motivation for adoption). It will not affect reporting of the total number of children ever born, however, unless large numbers of children were born to women living in a different country. Inclusion of specific questions on adopted children is not recommended. In one instance in which this was done, the quality of reporting deteriorated so seriously that the resulting data were unusable, though the basic children ever born and surviving questions had been used successfully in previous censuses (Banister, 1979). (b) Enumerator failure to record childlessness 513. Fieldworkers should be trained to record �0� children ever born explicitly for women who have no children. It might be supposed that this would be obvious, but experience shows that fieldworkers confronted with a woman who has no children, particularly a very young woman, will frequently leave the space provided for children ever born blank or enter a ��� instead of entering �0�. In consequence, when the data are processed, substantial numbers of women who had no children, and for whom this fact either was or could have been correctly ascertained by the fieldworker, are
incorrectly classified as �children ever born not stated�. 514. This error results in proportions of childless women that are too low and average numbers of children ever born that are too high. The error in average number of children ever born is unlikely to be large except for very young women, but the error in proportions of women childless may be so severe as to render this information useless. 515. The phenomenon has been known for at least 50 years�the main report of the 1947 census of Malaya contains a lucid and detailed description (Del Tufo, 1949)�but the resulting errors are observed in many censuses. A technique for detecting, and in some circumstances correcting, such errors in tabulated data was pioneered by Vincent (1946) and elaborated by El-Badry (1961). (c) Selection error 516. Data on children ever born, however perfectly reported, represent only the experience of women included in the census or survey, but they are commonly treated as though they represented the past experience of the population at large, which includes women who died before the census or survey was taken. This will not ordinarily pose a problem. Exceptions occur for very old women and in circumstances with unusual patterns of mortality�for example, in populations with high mortality related to acquired immunodeficiency syndrome (AIDS).
E. RECENT BIRTHS
517. Census and survey respondents may be asked how many live births occurred in their household, or to particular women in the household, during the past year or other recent time period. Additional questions may be used to ascertain when the birth occurred, the sex of the child born and whether or not it is still surviving. Alternatively, for women who have had at least one child, respondents may be asked the date of the most recent birth. All of these questions aim at getting information on "recent births" and, unlike the question on children ever born, require respondents to remember when particular births occurred. 518. The data provided by questions on recent births may also be obtained by applying the own-children method (section B above), which will provide information not only on recent births, but on births for 15 years prior to the census or survey. If the own-children method is applied, therefore, it may not be
64
worthwhile to include questions on recent births in a census or survey.
1. Questions
519. The first and simplest question is
1. Did you [this woman] have any live birth
during the past 12 months (if multiple births, indicate number)?
520. The question is asked of all ever-married women or of all women within an appropriate age range. The literal sense of the question is �How many live births did you have during the past 12 months?�, but so few women will have had more than one birth that this phrasing is likely to feel peculiar to both fieldworkers and respondents. The possibility of multiple births should in principle be allowed for. The incidence of multiple births is normally very low, however, and this detail is frequently ignored in practice. This question may be expanded to ask the sex of the child and whether or not the child is still living. 521. A second question that will yield similar information is
2. What was the year and month of your most
recent live birth (if multiple birth, so indicate)?
The question should be asked only of women with one or more children ever born and is therefore appropriate only if the question on children ever born is used. The possibility of multiple births should in principle be allowed for, but this stricture seems to be often ignored in practice. This question does not yield useful information on births before the year prior to the census or survey. Births reported in earlier years are incomplete because some of the mothers for those births will have had another birth whose year and month of death will be reported. This question also may be expanded by asking the sex of the child and whether or not the child is still living. 522. A third question that will yield similar information is
3. Have there been any live births in this
household during the past 12 months?
This question refers to births occurring to persons who were members of the household at any time during the past 12 months, whether or not they are still living or still members of the household. It must be followed by questions on the age of the mother at
the time of each live birth reported. Often a question on the sex of each birth reported will be asked as well. 523. This question will in principle supply information on births that occurred in the household to women who have since died or moved out of the household. Since the unit of observation is the live birth occurring in the household, however, rather than a woman living in the household (as in the first question), a separate section of the questionnaire is required and the additional question on age of mother at birth must be included. This type of question on recent births is similar in form to the questions on recent deaths discussed in the following chapter. 524. The first and third questions may ask for births occurring during some period other than the 12 months preceding the census or survey, for example, the most recent completed calendar year or the 18 or 24 months preceding the census. In this case it may be useful to obtain further information on when births occurred, such as during which quarter or half year.
2. Tabulation
525. When women are asked how many births they had in the past 12 months (or other period), the basic tabulation shows all women to whom the question was addressed classified by the number of births and the age of the woman at the time of the census. If information is obtained for a longer period and/or for half years or quarters, the tabulation should be expanded to show the full detail available on the questionnaires. If sex and/or survival of births is obtained, numbers of male and female and/or of surviving and deceased births should be given by the tabulation. 526. A tabulation by single years of age should be produced for the total population. If the quality of age reporting is high, this tabulation will contain useful information on the age pattern of fertility, which is obscured by data shown for five-year age groups only. If the quality of age reporting is poor, the single-year data will be useful for assessing its effects (Hull and Sunaryo, 1978; Hull, 1995). 527. When the question on month and year of last birth is used, the basic tabulation shows all women with one or more children ever born classified by age of woman at the time of the census or survey and year/period of most recent birth. Some grouping of year and month will be appropriate, since it is primarily the number of births during the year prior to the census or survey that is used. Here also a tabulation by single year of age for the total
65
population should be made, but tabulations by five-year age groups may suffice for subnational geographic areas and population subgroups. If this question is used together with the question on children ever born, as will usually be the case, a tabulation of women with one or more children ever born by age, year of last birth and number of children ever born should also be prepared (Feeney and Ross, 1984). 528. The tabulations produced from information on household births are similar in form to those produced from questions on births to women present in the household. Since the information comes from a separate portion of the questionnaire, it will usually be included in a separate data set containing one record for each birth reported. The unit of tabulation is therefore the birth, rather than the woman. Tabulations will show births during the 12 months preceding the census or survey distributed by age of mother at time of birth. If additional information on births is obtained, additional dimensions may be incorporated for this information.
3. Estimation
529. Experience suggests that questions on recent births are likely to result in under reporting of births, though careful fieldwork may result in completeness of 90 per cent or better. It is therefore necessary to have some means of assessing the level of completeness of reporting so that the reported numbers may be adjusted upward. The P/F ratio method was devised for this purpose. In its original form, it required fertility to have been constant during the decades prior to the census or survey. Subsequent development relaxed this assumption (United Nations, 1983, chapter II, section B). 530. When the questions on births to women (rather than the question on births in households) are used, the age dimension of the tabulations refers to age of woman/mother at the time of the census or survey, rather than to her age at the time of birth. The birth rate calculated for women aged 15-19 therefore refers on the average to the age interval beginning at age 14 1/2 and ending at age 19 1/2, and similarly for older age groups. Translation to standard five-year age groups may be effected in various ways, most usefully by the use of models for the age pattern of fertility.
4. Quality (a) Reporting errors 531. The general tendency is for numbers of births to be underreported. Given the nature of the childbearing experience and its importance for the household and the life of the woman and her family, it is inconceivable that births will be forgotten in so short a time. Explanations for underreporting necessarily lie elsewhere. 532. One explanation is poor performance of fieldworkers, whose work is made slightly easier in the case of a negative answer. Outright negligence is one possibility, but poorly trained fieldworkers may imagine that they are improving the efficiency of data collection by �second guessing" respondents. They may think that, in the case of younger or older women, or women with no young children about, they know the answer to the question and therefore need not ask. These issues should be addressed in the training and supervision of fieldworkers. 533. Another explanation for underreporting of births is that respondents are uncertain about the date of birth and therefore of whether or not it occurred during the period to which the question refers. This "reference period error� could as easily result in overstatement as in understatement of numbers of births, however, and overstatement is rarely observed. A possible explanation is that uncertainty leads respondents to evade the question, leading the fieldworker to record no births. 534. One rationale for asking year and month of most recent birth is that this question requires a positive answer for every eligible woman and an explicit entry on the census form by the fieldworker. This removes any incentive for either party to avoid the fact of a birth. Non-response is always an option, however, whether exercised by the respondent or by the fieldworker who does not ask the question, so this approach will not necessarily provide good results. 535. A third explanation for underreporting of births is that respondents may be reluctant to report the birth of a child who has since died. In this case respondents may report the year and month of birth of the youngest surviving child rather than the year and month of most recent birth. Since most, if not all, of these births will have occurred earlier, this will result in understatement of the number of births during the 12 months prior to the census or survey. One rationale for asking whether the most recently born child is surviving is to test for this form of response error,

66
which will be indicated by an unreasonably high proportion of children surviving. 536. When the question on births in households is used, reporting error considerations are generally similar to when the question on births to women is used. When the question on births in households is combined with the question on deaths in households, however, respondents may be asked whether they are sure that there were no live births that did not survive. The results of this probe may then be used to amend the information on recent births and recent deaths (see section C of chapter VI). 537. Data on the distribution of recent births by sex allows the calculation of sex ratios at birth. Since the range of variation in sex ratios at birth is generally rather small, however, calculated sex ratios at birth may be most useful as indications of differential completeness of reporting of male and female births. Very high sex ratios may be observed, however, where there is differential abortion of female fetuses. (b) Selection errors 538. The question on number of live births women had during the past 12 months (or other period) and the question on the year and month of their most recent live birth obviously exclude births to women who died before the time of the census or survey. The question on the number of live births that occurred in households will (if responses are accurate) capture those births. The household question will not capture births occurring in households that were dissolved before the census or survey, however, and those births will (if responses are accurate) be captured by the question on births to women so long as the woman is surviving. The distinctions may not be very important in practice, as selection errors in data on recent births are likely to be overwhelmed by reporting errors. Selection errors may become very important in special circumstances, however, such as when there is a high prevalence of human immunodeficiency virus/acquired immunodeficiency syndrome (HIV/AIDS).
F. BIRTH HISTORIES
539. A birth history consists essentially of a list of all children a woman has had, living and deceased, together with certain information about those children, including their date of birth, sex and whether they were one of multiple births. Despite the "birth" history designation, birth histories are an important source of information on infant and child mortality (chapter VI).
540. Birth histories are by far the most intensive form of questioning used in demographic data-collection operations. Their use has generally been restricted to samples of 5,000 to 10,000 women, though they have occasionally been used in larger surveys and sometimes even in population censuses. A 1982 survey carried out in China, for example, collected birth histories for over 300,000 women (China Population Information Centre, 1984). 541. Most experience with birth histories has been either with the World Fertility Survey or with the Demographic and Health Survey programmes.
1. Questions
542. The inclusion of birth histories is a defining characteristic of fertility surveys. Fertility surveys typically include two basic questionnaires: a relatively brief household questionnaire similar to those used in a larger population survey; and a much more extensive woman's questionnaire that includes the birth history questions. The woman's questionnaire is most often administered to ever-married women age 15-49 years who appear on the household questionnaires. Birth history information is sometimes collected from women aged 50 years or over, notably in China's 1982 One-per-Thousand Population Survey (China Population Information Centre, 1984), but this is rare. 543. Birth history questions are nearly always asked following the elaborated questions on numbers of children ever born and surviving described in section D.1 above. In this way the total number of children ever born for whom birth dates and other information should be obtained is established before the detailed birth history questions begin. 544. A series of questions will then be asked for each live birth, including the following:
Name of child Was this child a boy or a girl? In what month and year was this child born? Was this child one of twins? Is this child still alive? If not alive, how old was this child when he/she died?
Dates of birth (i.e., day as well as month and year of birth) may be useful for special purposes. If reliable reports of date of birth can be obtained, it will be desirable to ask date (year, month and day) of birth rather than year and month only.

67
545. Interviewers may be instructed to cross-check living children with children recorded on the household questionnaire and to probe respondents in case of discrepancies. Those should usually be accounted for by children living elsewhere. 546. Age of deceased children should be reported in days if the child died within one month of birth, in months if the child died within two years and in years if the child died later than two years after birth. The rationale for obtaining month of death for children who died within two years, rather than within one year, is that age heaping on months, which is common, may be assessed more reliably if age at death in months is available for ages just over as well as just below one year. In particular, heaping of deaths at 12 months may transfer substantial numbers of deaths occurring under age one year into the child death category, thus deflating the number of infant deaths. 547. In some cases a question on year and month of death may be used in place of the question on age at death. This has the disadvantage, however, that data on age at death in days cannot as easily be obtained for children who die within one month of birth. 548. Birth histories have usually included all births to women up to the time of interview, but in some cases they have been restricted to births occurring in the past 5 or 10 years. The rationale for these partial birth histories is that they reduce the burden of collecting information on all births while realizing most of the advantages. A risk of partial birth histories is that interviewers may misdate ages or dates of birth of children so as to avoid collecting the more detailed information for them required in the birth history. It is generally considered that savings are not worth the risk, for the additional cost of obtaining full instead of partial birth histories is generally small. 549. Birth histories may also be made partial by restricting the birth orders for which information is collected. A partial birth history may include, for example, information on first through fourth births and on most recent birth, but not on fifth and higher order births other than the most recent birth. This approach is unsuitable for higher fertility countries, but it may be appropriate for low fertility countries. 550. Pregnancy histories, in which information on all pregnancies a woman has experienced in her lifetime, are sometimes used. In many cases, pregnancies that do not result in live births or stillbirths have been very incompletely reported. Even incompletely reported stillbirths may be used to obtain more accurate infant
mortality rates by ensuring that stillbirths are not confused with infant deaths, and sufficiently intensive field procedures will in some cases enable reasonably complete recording of stillbirths.
2. Tabulation
551. Birth history data are not usually processed in the same way as the data from the other questions discussed above. For each of the questions discussed in preceding sections, individual census or survey records are used to produce tabulations. Those tabulations are then used, often in conjunction with other tabulations, perhaps from other sources, to produce estimates of levels and trends in fertility and/or mortality. 552. Birth history data, in contrast, are generally processed so as to produce the desired measures of fertility and mortality directly. Tabulations may be produced as intermediate results by the computer programs that effect the processing, but they are generally not provided as output. An important exception occurs with respect to special tabulations used for diagnosing certain kinds of response errors. See for example the data quality tables in the report published by the International Institute for Population Sciences (Retherford, Mishra and Prakasam, 2000, appendix D).
3. Estimation 553. The calculation of age-specific birth rates and infant and child mortality rates from birth history data is simple in principle, but implementation involves various complexities. Many of them result from having information only on year and month of birth rather than on date of birth. A related complication is the calculation of the numbers of person-years lived that are the denominators of the rates. The principles of the calculations are described in detail in Verma (1980).
4. Quality (a) Reporting errors 554. The most serious reporting errors in birth history data involve the misreporting of dates of birth, which shifts significant numbers of births from the years immediately prior to the survey to earlier years. The effect is to understate the level of fertility in the years immediately prior to the survey and overstate the level for earlier years. The result will be to create the appearance of a decline in fertility when fertility was in fact constant (or even increasing) or to exaggerate a real decline.
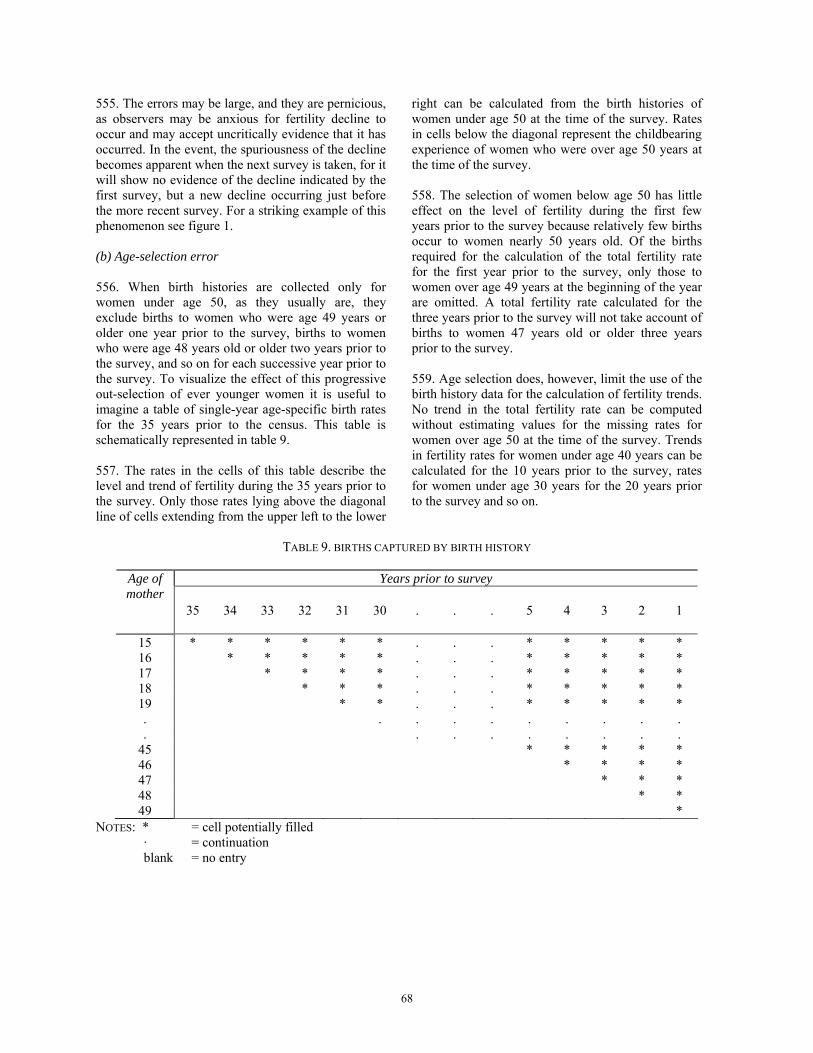
68
555. The errors may be large, and they are pernicious, as observers may be anxious for fertility decline to occur and may accept uncritically evidence that it has occurred. In the event, the spuriousness of the decline becomes apparent when the next survey is taken, for it will show no evidence of the decline indicated by the first survey, but a new decline occurring just before the more recent survey. For a striking example of this phenomenon see figure 1. (b) Age-selection error 556. When birth histories are collected only for women under age 50, as they usually are, they exclude births to women who were age 49 years or older one year prior to the survey, births to women who were age 48 years old or older two years prior to the survey, and so on for each successive year prior to the survey. To visualize the effect of this progressive out-selection of ever younger women it is useful to imagine a table of single-year age-specific birth rates for the 35 years prior to the census. This table is schematically represented in table 9. 557. The rates in the cells of this table describe the level and trend of fertility during the 35 years prior to the survey. Only those rates lying above the diagonal line of cells extending from the upper left to the lower
right can be calculated from the birth histories of women under age 50 at the time of the survey. Rates in cells below the diagonal represent the childbearing experience of women who were over age 50 years at the time of the survey. 558. The selection of women below age 50 has little effect on the level of fertility during the first few years prior to the survey because relatively few births occur to women nearly 50 years old. Of the births required for the calculation of the total fertility rate for the first year prior to the survey, only those to women over age 49 years at the beginning of the year are omitted. A total fertility rate calculated for the three years prior to the survey will not take account of births to women 47 years old or older three years prior to the survey. 559. Age selection does, however, limit the use of the birth history data for the calculation of fertility trends. No trend in the total fertility rate can be computed without estimating values for the missing rates for women over age 50 at the time of the survey. Trends in fertility rates for women under age 40 years can be calculated for the 10 years prior to the survey, rates for women under age 30 years for the 20 years prior to the survey and so on.
TABLE 9. BIRTHS CAPTURED BY BIRTH HISTORY
Years prior to survey Age of
mother 35 34 33 32 31 30 . . . 5 4 3 2 1
15 * * * * * * . . . * * * * * 16 * * * * * . . . * * * * * 17 * * * * . . . * * * * * 18 * * * . . . * * * * * 19 * * . . . * * * * * . . . . . . . . . . . . . . . . . . .
45 * * * * * 46 * * * * 47 * * * 48 * * 49 *
NOTES: * = cell potentially filled · = continuation blank = no entry

69
VI. MORTALITY DATA FROM CENSUSES AND SURVEYS
Introduction 560. The present chapter explores questions that may be included in population censuses and sample surveys to generate data on mortality. In several instances, a group of related questions is used to obtain both fertility and mortality data. Questions on children ever born and surviving are an important example. Accordingly, chapters V and VI should be read in conjunction with each other. 561. Two distinctions are fundamental to the collection of mortality data in censuses and surveys. The first distinction is between the level and trend of mortality and the age pattern of mortality. Only two of the five approaches discussed in this chapter, birth histories and recent household deaths, provide information on the age pattern of mortality. The remaining three methods provide estimates of level and trend based on assumptions about the age pattern. It is always desirable to test these assumptions using data on the age pattern of mortality. 562. The second distinction is between deaths of younger persons, including infants, children and young adults, and deaths of adults of all ages. Only one of the five approaches discussed here, recent household deaths, provides information on mortality for all ages. Questions on children ever born and surviving provides information mainly for persons under age 15 years, although in some cases the upper limit may be as high as age 30 years. Birth histories provide information only for persons under age 15 years, and sample size generally limits useful information to persons under age 5 years. Questions on survival of parents and siblings provide information only on adult mortality. 563. All of the approaches covered in this chapter may be used to supplement death registration data. In particular, they may be used to provide information on mortality for population subgroups not identifiable from death registration data. When reliably complete death registration data are not available, however, it will generally be advisable to utilize at least four of the five approaches described in this chapter, though not necessarily all in the same data-collection operation. Questions on children ever born and surviving may be used to provide estimates of the level and trend of infant and child mortality. Birth history questions may be used to provide estimates of the age pattern of infant and child mortality. Questions on recent household deaths may be used to estimate the age pattern of adult mortality, and
questions on survival of parents and/or siblings may be used to estimate the level and trend of adult mortality. 564. Incomplete death registration data will provide information on the age pattern of mortality that may be utilized in connection with the census and survey approaches discussed in this chapter, but it must be recognized that completeness of death registration is likely to be age selective. In particular, deaths of infants and young children may be less completely reported than deaths of older persons.
A. SURVIVAL OF CHILDREN EVER BORN
565. Questions on children ever born and surviving have been used throughout the world over the past 50 years to collect data on infant and child mortality. Those questions have on the whole been very successful. They may be used in population censuses and in surveys of all kinds. Section A or chapter VI should be read in conjunction with �children ever born� in section D of chapter V.
1. Questions
566. Questions on number of children ever born and surviving have already been covered in detail in section D.1 of chapter V. The purpose of those questions is to ascertain, for every woman of whom the questions are asked, (a) the number of female children this woman has borne altogether in her lifetime, (b) the number of male children this women has borne altogether in her life time, (c) the number of female children who are surviving and (d) the number of male children who are surviving. 567. In general, numbers of female and male children ever born and surviving should be obtained. The resulting data may be used both to estimate mortality levels and trends separately for females and males and for the purpose of internal assessment of data quality. Where pressure to limit the number of questions is very great, however, as in the case of some population censuses, questions may be limited to total number of children ever born and total number surviving. 568. Subtracting the number of surviving (male or female) children from the number of (male or female) children ever born gives the number of (male or female) deceased children. Dividing the number of deceased children by the corresponding number ever born gives the proportion deceased, from which life table measures of infant, child and young adult mortality may be derived.
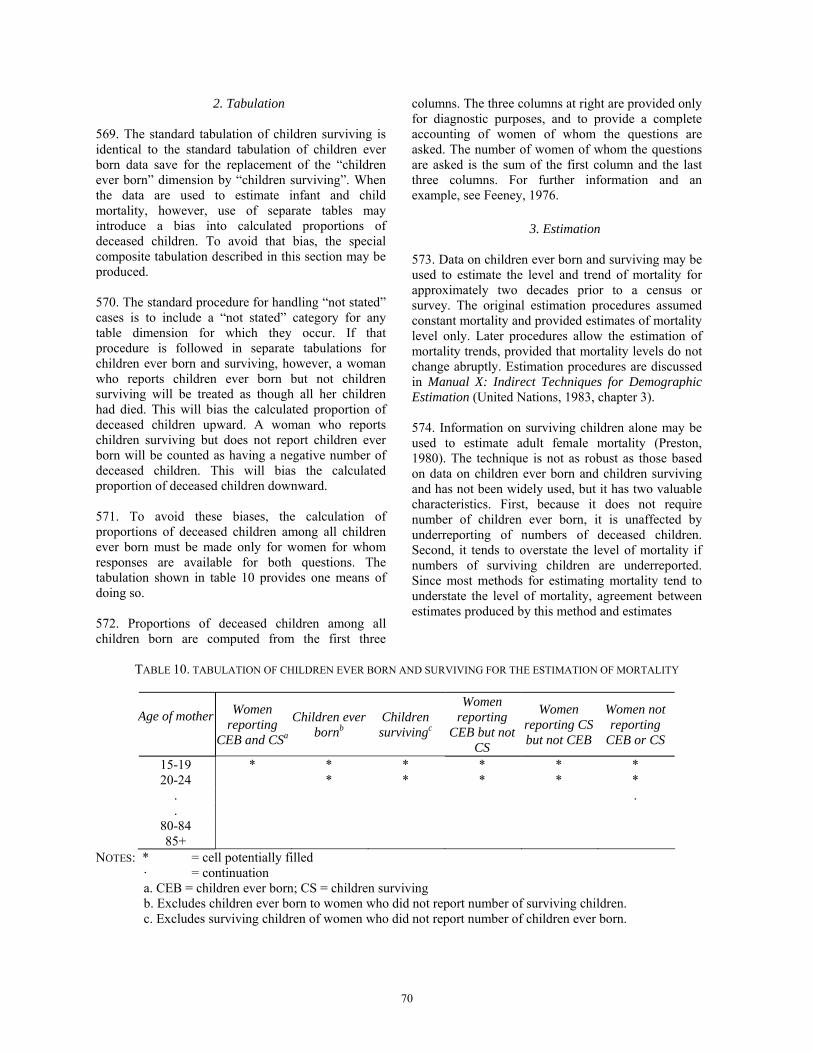
70
2. Tabulation 569. The standard tabulation of children surviving is identical to the standard tabulation of children ever born data save for the replacement of the �children ever born� dimension by �children surviving�. When the data are used to estimate infant and child mortality, however, use of separate tables may introduce a bias into calculated proportions of deceased children. To avoid that bias, the special composite tabulation described in this section may be produced. 570. The standard procedure for handling �not stated� cases is to include a �not stated� category for any table dimension for which they occur. If that procedure is followed in separate tabulations for children ever born and surviving, however, a woman who reports children ever born but not children surviving will be treated as though all her children had died. This will bias the calculated proportion of deceased children upward. A woman who reports children surviving but does not report children ever born will be counted as having a negative number of deceased children. This will bias the calculated proportion of deceased children downward. 571. To avoid these biases, the calculation of proportions of deceased children among all children ever born must be made only for women for whom responses are available for both questions. The tabulation shown in table 10 provides one means of doing so. 572. Proportions of deceased children among all children born are computed from the first three
columns. The three columns at right are provided only for diagnostic purposes, and to provide a complete accounting of women of whom the questions are asked. The number of women of whom the questions are asked is the sum of the first column and the last three columns. For further information and an example, see Feeney, 1976.
3. Estimation 573. Data on children ever born and surviving may be used to estimate the level and trend of mortality for approximately two decades prior to a census or survey. The original estimation procedures assumed constant mortality and provided estimates of mortality level only. Later procedures allow the estimation of mortality trends, provided that mortality levels do not change abruptly. Estimation procedures are discussed in Manual X: Indirect Techniques for Demographic Estimation (United Nations, 1983, chapter 3). 574. Information on surviving children alone may be used to estimate adult female mortality (Preston, 1980). The technique is not as robust as those based on data on children ever born and children surviving and has not been widely used, but it has two valuable characteristics. First, because it does not require number of children ever born, it is unaffected by underreporting of numbers of deceased children. Second, it tends to overstate the level of mortality if numbers of surviving children are underreported. Since most methods for estimating mortality tend to understate the level of mortality, agreement between estimates produced by this method and estimates
TABLE 10. TABULATION OF CHILDREN EVER BORN AND SURVIVING FOR THE ESTIMATION OF MORTALITY
Age of mother Women reporting
CEB and CSa
Children ever bornb
Children survivingc
Women reporting
CEB but not CS
Women reporting CS but not CEB
Women not reporting
CEB or CS
15-19 * * * * * * 20-24 * * * * *
. .
. 80-84 85+
NOTES: * = cell potentially filled · = continuation a. CEB = children ever born; CS = children surviving b. Excludes children ever born to women who did not report number of surviving children. c. Excludes surviving children of women who did not report number of children ever born.

71
produced by most other methods is evidence for the accuracy of the estimates. (If a and b are estimates of c and a ≤ b and b ≥ c, then a = b implies a = b = c.)
4. Quality
575. Experience has shown that it is possible to obtain high-quality responses to questions on children ever born and surviving in all kinds of data-collection operations, including population censuses. Where errors occur, they tend to understate both the number of children surviving and the number of children ever born. When the data are used to estimate mortality, however, what matters is the proportion of surviving children. If both children ever born and children surviving are understated, some cancellation of error will occur. If numbers of children ever born and surviving are both underreported to the same extent�for example, if both are underreported by 10 per cent�the calculated proportions surviving and deceased will be correct. 576. In practice, where underreporting is a problem, reporting of surviving children is likely to be more complete than reporting of children ever born. Calculated proportions of deceased children are accordingly more likely to be too low than too high. Where serious errors in mortality estimates produced in this way have occurred, the estimates have generally been too low rather than too high. 577. Imperfect reporting is not the only influence on the accuracy of mortality estimates produced from these data, however. Deriving mortality estimates from data on children ever born and surviving requires assumptions about both the age pattern of mortality and the age pattern of fertility. The assumptions may introduce errors as well, and those errors may result in estimates that are either too low or too high. Errors resulting from assumptions about the age pattern of fertility will generally be small, but errors resulting from assumptions about the age pattern of mortality may be substantial. 578. The value of data on children ever born and surviving is greatly increased when they are available from two or more data-collection operations carried out at different points in time. Comparison of the overlapping portions of the series provides a powerful test of the quality of the estimates. The point is the
same as that made in connection with fertility estimates in section A.4 of chapter III.
B. MORTALITY DATA FROM BIRTH HISTORIES
579. Section B deals with birth histories as a source of data on infant and child mortality. It should be read in conjunction with "birth histories" in section F of chapter V, which discusses birth histories as a method for collecting data on fertility. 580. Extensive experience with birth histories as sources of mortality data began with the World Fertility Survey programme. The WFS surveys generated infant and child mortality data mainly as a by-product of the effort to obtain accurate data on fertility. Studies of the resulting data made important contributions to the study of mortality, however, and the use of birth histories to collect mortality as well as fertility data is now well established (Preston, 1985). In particular, it is an important component of the Demographic and Health Surveys and similar surveys. 581. Aside from a civil registration system that registers essentially all infant and child deaths, birth histories are likely to provide the most accurate data on the age pattern of infant and child mortality. That information may be used to check the validity of the assumed age pattern of mortality used to produce mortality estimates from data on children ever born and surviving.
1. Questions
582. Birth history questions are discussed in section F.1 of chapter V. Those questions aim to ascertain, for every child born to every women of whom the questions are asked, (a) the sex and date of birth of each child, (b) whether the child is still alive and, if not, (c) the age and/or date of death.
2. Tabulation
583. The primary table for the calculation of infant and child mortality from birth-history data is illustrated in table 11. Since survey interviews will usually be carried out over a period of many months, the time dimension of the tabulation is months prior to interview rather than calendar months.
Field Cod
Field Cod
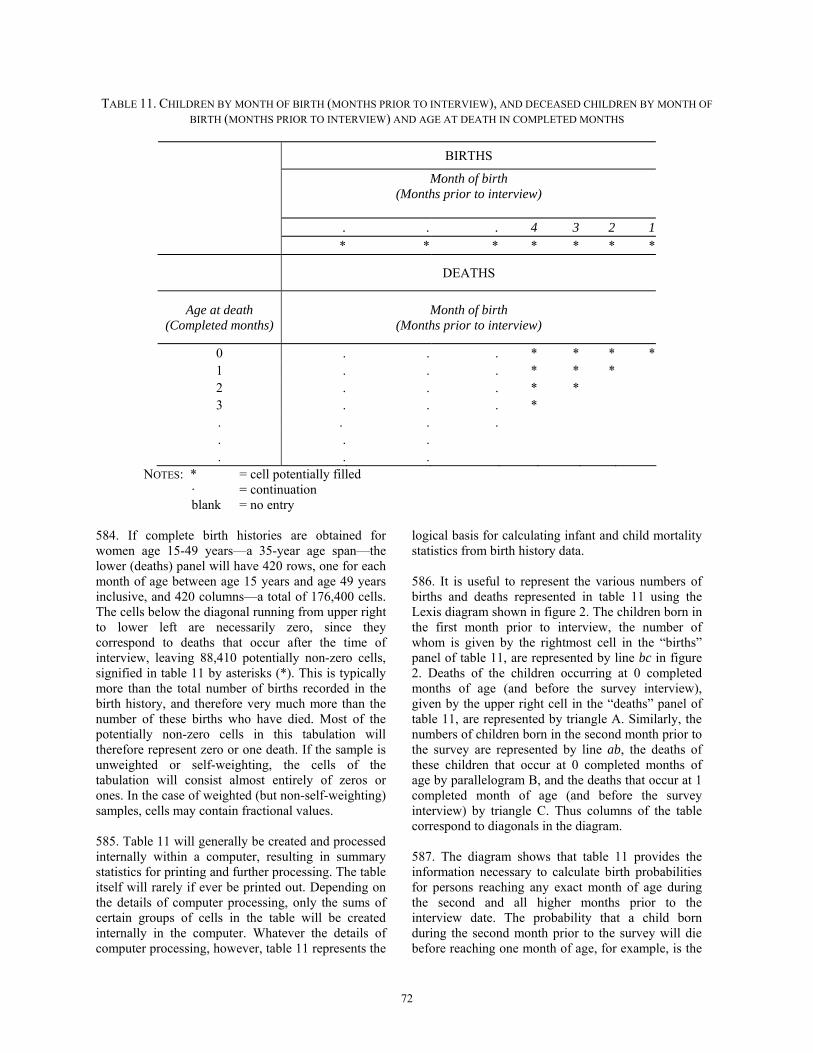
72
TABLE 11. CHILDREN BY MONTH OF BIRTH (MONTHS PRIOR TO INTERVIEW), AND DECEASED CHILDREN BY MONTH OF BIRTH (MONTHS PRIOR TO INTERVIEW) AND AGE AT DEATH IN COMPLETED MONTHS
BIRTHS
Month of birth (Months prior to interview)
. . . 4 3 2 1
* * * * * * *
DEATHS
Age at death (Completed months)
Month of birth (Months prior to interview)
0 . . . * * * *1 . . . * * * 2 . . . * * 3 . . . * . . . . . . . . . .
NOTES: * = cell potentially filled · = continuation blank = no entry
584. If complete birth histories are obtained for women age 15-49 years�a 35-year age span�the lower (deaths) panel will have 420 rows, one for each month of age between age 15 years and age 49 years inclusive, and 420 columns�a total of 176,400 cells. The cells below the diagonal running from upper right to lower left are necessarily zero, since they correspond to deaths that occur after the time of interview, leaving 88,410 potentially non-zero cells, signified in table 11 by asterisks (*). This is typically more than the total number of births recorded in the birth history, and therefore very much more than the number of these births who have died. Most of the potentially non-zero cells in this tabulation will therefore represent zero or one death. If the sample is unweighted or self-weighting, the cells of the tabulation will consist almost entirely of zeros or ones. In the case of weighted (but non-self-weighting) samples, cells may contain fractional values. 585. Table 11 will generally be created and processed internally within a computer, resulting in summary statistics for printing and further processing. The table itself will rarely if ever be printed out. Depending on the details of computer processing, only the sums of certain groups of cells in the table will be created internally in the computer. Whatever the details of computer processing, however, table 11 represents the
logical basis for calculating infant and child mortality statistics from birth history data. 586. It is useful to represent the various numbers of births and deaths represented in table 11 using the Lexis diagram shown in figure 2. The children born in the first month prior to interview, the number of whom is given by the rightmost cell in the �births� panel of table 11, are represented by line bc in figure 2. Deaths of the children occurring at 0 completed months of age (and before the survey interview), given by the upper right cell in the �deaths� panel of table 11, are represented by triangle A. Similarly, the numbers of children born in the second month prior to the survey are represented by line ab, the deaths of these children that occur at 0 completed months of age by parallelogram B, and the deaths that occur at 1 completed month of age (and before the survey interview) by triangle C. Thus columns of the table correspond to diagonals in the diagram. 587. The diagram shows that table 11 provides the information necessary to calculate birth probabilities for persons reaching any exact month of age during the second and all higher months prior to the interview date. The probability that a child born during the second month prior to the survey will die before reaching one month of age, for example, is the

73
number of deaths represented by parallelogram B divided by the number of children represented by line ab. Similarly, the probability that a child reaching exact age 1 month during the second month prior to interview will die before reaching exact age 2 months is the number of deaths represented by parallelogram D divided by the number of children represented by line de. 588. The diagram also shows that probabilities for children born the month prior to interview cannot be calculated directly because some of the deaths represented in the numerator occur after the time of interview. Those deaths are represented by points falling to the right of the age axis in figure 2.
3. Estimation 589. The life table probability of death by exact age x+n for persons who reach exact age x during any
given time period is defined as the number of these persons divided into the number of these persons who die before reaching exact age x+n. The Lexis diagram in figure 3 illustrates possible approaches to calculating the probability of death by exact age 6 months for children who reach exact age 3 months during the one-year period preceding a particular survey. Probabilities of death for other age groups and time periods may be calculated in the same way. 590. The standard approach used with death registration data consists of first calculating the age-specific death rate for the age group and time period in question and then using a mathematical formula for converting this death rate into a life table probability. The rectangle in panel A of figure 3 represents both the deaths counted by the numerator of the rate and the person-years of exposure represented in its denominator.
Figure 2. Lexis diagram representation of mortality data derived from a birth history
f
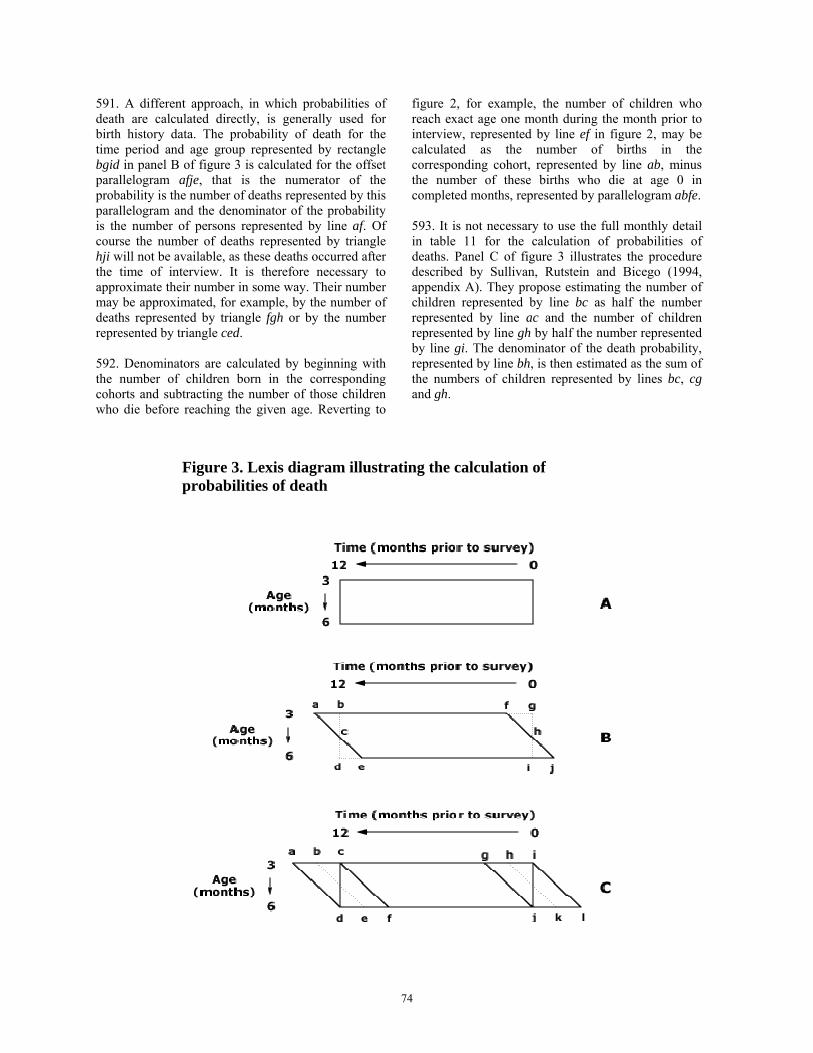
74
591. A different approach, in which probabilities of death are calculated directly, is generally used for birth history data. The probability of death for the time period and age group represented by rectangle bgid in panel B of figure 3 is calculated for the offset parallelogram afje, that is the numerator of the probability is the number of deaths represented by this parallelogram and the denominator of the probability is the number of persons represented by line af. Of course the number of deaths represented by triangle hji will not be available, as these deaths occurred after the time of interview. It is therefore necessary to approximate their number in some way. Their number may be approximated, for example, by the number of deaths represented by triangle fgh or by the number represented by triangle ced. 592. Denominators are calculated by beginning with the number of children born in the corresponding cohorts and subtracting the number of those children who die before reaching the given age. Reverting to
figure 2, for example, the number of children who reach exact age one month during the month prior to interview, represented by line ef in figure 2, may be calculated as the number of births in the corresponding cohort, represented by line ab, minus the number of these births who die at age 0 in completed months, represented by parallelogram abfe. 593. It is not necessary to use the full monthly detail in table 11 for the calculation of probabilities of deaths. Panel C of figure 3 illustrates the procedure described by Sullivan, Rutstein and Bicego (1994, appendix A). They propose estimating the number of children represented by line bc as half the number represented by line ac and the number of children represented by line gh by half the number represented by line gi. The denominator of the death probability, represented by line bh, is then estimated as the sum of the numbers of children represented by lines bc, cg and gh.
Figure 3. Lexis diagram illustrating the calculation of probabilities of death

75
594. Similarly, the authors propose estimating the number of deaths represented by parallelogram bcfe by one half the deaths represented by parallelogram acfd and the number of deaths represented by parallelogram ghkj by one half the deaths represented by parallelogram gilj. The numerator of the probability, represented by parallelogram bhke is then estimated as the sum of the numbers of deaths represented by parallelograms bcfe, cgjf and ghkj. 595. Illustrative summary statistics of infant and child mortality that may be generated from the data in table 11 are shown in table 12. The probabilities of dying shown in the third section of the table are calculated by dividing the numbers of deaths shown in the fourth section of the table by the numbers of persons exposed shown in the fifth section of the table.
4. Quality
596. Birth history data generally provide the best opportunity for obtaining high-quality data on infant and child mortality when complete and accurate death registration data are not available. The detailed questions involved and the possibilities for interviewer probing may be exploited to minimize errors in reporting. To realize those advantages, however, high standards for the training and supervision of fieldworkers must be maintained. The ability of respondents to recall dates of events accurately and their reluctance to speak of children who died may of course place limits on the accuracy of the data collected.
(a) Misreporting of age at death 597. Inaccurate reporting of age of death of deceased children is a common problem. When ages at death are reported in completed months, a tendency to �heaping� on multiples of 12 months may result in some infant deaths being reported as having occurred at age one in completed years. Such heaping may be detected if tabulations of age at death by month of death are made for children dying before exact age 2, rather than only for children dying in infancy. (b) Age-selection bias 598. When birth histories are collected only for women under 50 years of age, as is commonly the case, retrospective statistics calculated from those birth histories are subject to age-selection bias. Age-selection bias may occur because statistics for earlier time periods are limited to the experience of younger women. 599. Age-selection bias is illustrated in figure 4. Births occurring during the 35 years prior to the survey are represented by the square formed by the vertical lines extending down from the time axis at times 0 and -35 and the horizontal lines extending to the left from the age axis at ages 15 and 50. It is assumed here that all births occur to women in this age range.

76
TABLE 12. INFANT AND CHILD MORTALITY STATISTICS FROM BIRTH HISTORY DATA, MYANMAR
Probabilities of dying over selected age intervals in months, infant mortality rate, under-five mortality rate, and numerators and denominators of probabilities of dying, selected periods, Myanmar, 1991
Both sexes Years prior to survey 0-14 0-4 5-9 10-14
(Years) 1976-1990 1986-1990 1981-1985 1976-1980 Infant and under-five mortality rate
IMR 100.1 102.9 96.1 101.65q0 138.2 146.9 126.5 140.6
Exact age in months Probabilities of dying
0-1 55.9 53.5 54.6 60.31-3 16.9 18.9 15.8 15.93-6 14.2 16.3 13.5 12.66-12 16.5 17.9 15.3 16.1
12-24 13.1 14.6 10.7 14.224-36 9.1 10.4 6.4 10.936-48 12.3 14.9 11.2 9.748-60 8.4 10.2 5.7 9.4
Exact age in months Number of deaths
0-1 887.0 296.0 310.0 281.01-3 253.0 99.0 85.0 69.03-6 208.0 84.5 71.0 52.56-12 237.0 93.0 78.5 101.0
12-24 183.5 76.0 52.5 55.024-36 122.5 54.0 29.5 39.036-48 158.0 76.5 50.0 72.048-60 103.0 51.0 24.0 28.0
Exact age in months Exposure (numbers of persons exposed)
0-1 15 878 5 534 5 682 4 6631-3 14 952 5 244 5 372 4 3373-6 14 640 5 189 5 272 4 1796-12 14 377 5 182 5 134 4,061
12-24 13 969 5 201 4 884 3 88424-36 13 421 5 214 4 643 3 56436-48 12 851 5 148 4 466 3 23848-60 12 192 5 003 4 200 2 989
Source: Based on Population Changes and Fertility Survey, 1991 (Yangon, Ministry of Immigration and Population, 1995) table 7.1.
NOTE: Probabilities of dying calculated by dividing number of deaths by corresponding number of persons exposed. Infant mortality rate (IMR) and under-five mortality rate (5q0) calculated from probabilities of death by life table method, e.g., IMR for 0-14 years prior to the survey for all children equals 1 minus the product of 1-0.05587, 1-0.01692, 1-0.0142 and 1-0.01648.

77
Figure 4. Lexis diagram illustrating age-selection bias for mortality estimates calculated from birth-history data
600. The line connecting the upper left-hand and lower right-hand corners of the square in figure 4 divides the square into two triangles. The upper right triangle represents births to women who were under age 50 at the time of the survey. The lower left triangle represents births to women who were over age 50 at the time of the survey. Birth histories for women up to age 50 obviously provide no information on this second group of births. 601. For the five-year period immediately preceding the survey, birth histories for women under age 50 provide information on the births represented by area A (excepting, of course, births that occurred during this period to women who did not survive to the time of the survey) and omit information on the births
represented by area A'. Since a relatively small proportion of all births in any given period occur to women over age 45, the effect of the omission will generally be small. 602. For earlier periods, however, the omissions become more serious, and for the earliest period for which the birth histories provide any information, the five-year period ending 30 years prior to the survey, the birth histories provide data only for the births represented by area G, omitting data for births represented by area G'. The births represented by area G occur only to women under age 20, and on the average to women under age 17 1/2 years.

78
603. Consider now the effect of this age selection on the calculation of infant mortality rates for the various five-year periods preceding the survey. Infant mortality rates tend to be substantially higher for births that occur at either extreme of the reproductive age span. Infant mortality rates tend to be lowest for women in their middle twenties, with higher rates for younger and older women. The exclusion of the births represented by triangle A' from the calculation of the infant mortality rate for the five-year period preceding the survey will thus bias the calculated rate downward because it excludes some births with higher mortality risks. The bias will not be large, however, because relatively few births occur so near the end of the reproductive age span. 604. The bias may be higher for the immediately preceding periods because larger proportions of births are omitted. The magnitude is uncertain, however, because although larger proportions of births are omitted (births represented by areas B' and C', for example), the differential between the infant mortality rates for the omitted and included births will be less. 605. For the earliest periods, the direction of the bias reverses and the magnitude is likely to be severe. The infant mortality rate for the period 30 to 34 years prior to the survey, for example, is based entirely on births to women under age 20, and on the average to women under age 17 1/2. That rate will generally be much higher than the true infant mortality rate, the rate calculated for all births during the period (areas G and G' combined). 606. The magnitude of age-selection bias in the calculation of infant mortality rates from birth history data has not been widely studied or assessed. It is probably modest so long as rates are not calculated for more than 15 years prior to the survey. 607. Since age-selection bias increases for periods further removed from the survey, it may result in spurious time trends. Trend bias may be eliminated by calculating infant mortality rates only for births to mothers below a certain age. If rates are to be calculated for 15 years prior to the survey, for example, they may be calculated only for births to women below age 35 years. 608. Age-selection bias may be reduced by obtaining birth histories for women aged 50 years or older. When life expectancy is reasonably high and it is possible to obtain accurate reports of births from older women, this may be more appropriate than the conventional limitation to the reproductive age span.
(c) Mortality-selection bias 609. Mortality-selection bias occurs because some women giving birth during the years prior to the survey die before the survey and are therefore excluded from the sample. Under normal circumstances, with reasonably low levels of mortality, birth histories limited to women under age 50, and infant and child mortality rates calculated for no more than 15 years prior to the survey, the biases are likely to be negligible. If any of those conditions fails, however, mortality-selection bias may become important. If the upper age-limit of women for whom birth histories are collected is raised to reduce age selection bias, for example, mortality selection bias will become more serious because older women are subject to higher mortality risks. Higher than normal mortality risks during the reproductive age span, as will result, for example, from a high prevalence of HIV/AIDS, may also result in serious mortality-selection bias. (d) Sampling error 610. Surveys that collect birth histories typically involve samples of 5,000 to 10,000 women. With a crude birth rate of 30 births per thousand women, a survey of 10,000 women will produce approximately 300 births per year for the years immediately preceding the survey. There will thus be approximately 1,500 births during the first five years prior to interview. If the infant mortality rate is 100 infant deaths per 1,000 births, the expected number of infant deaths will be 150. 611. Using the approximate rule that the coefficient of variation of a small proportion is approximately one divided by the square root of the number of deaths, the coefficient of variation of the resulting infant mortality rate will be approximately 8 per cent. Smaller sample sizes or lower infant mortality rates will yield larger errors, as will calculations for population subgroups. Sample design factors will often push this error up to 10-15 per cent. 612. Thus, use of birth histories as sources of mortality data involves a trade-off between potentially lower non-sampling errors and higher sampling errors. Questions on recent household deaths and on survival of parents, siblings and children ever born may be included in very large surveys, for which sampling errors will be smaller than for most surveys including a complete birth history. They may also be fielded in many population censuses, for which sampling errors are nil. With good fieldwork, non-

79
sampling errors for these simpler questions may be comparable to or less than the sampling error for a typical birth history survey.
C. RECENT HOUSEHOLD DEATHS
613. Questions on recent deaths in households have not been as widely used as questions on children ever born and surviving. This may be in part because some early experience revealed severe underreporting of deaths. More recent experience suggests, however, that with appropriate questions and careful fieldwork, questions on recent household deaths may give good results. In view of this, it is likely that they should be more widely used than they have been. 614. Questions on recent household deaths have several important advantages. In the absence of complete and accurate death registration data, they are the only possible source of information on the age pattern of adult mortality. This is important because the only alternative census and survey questions that provide data on adult mortality make assumptions about the age pattern of mortality, and those assumptions may be tested only if evidence from death registration data or recent household deaths data is available. 615. Questions on recent household deaths are also the only census and survey questions that potentially provide data on mortality over the entire age span. Numbers of infant and child deaths have been seriously underreported in some cases, but other cases in which detailed questions and probes were used have yielded good results for infant and child deaths. 616. Questions on household deaths are particularly amenable to obtaining data on cause of death and in particular data on maternal mortality. No census or survey questions can yield the highly detailed and accurate information on cause of death provided by a death registration system utilizing medical
certification. With appropriate supplementary questions and careful fieldwork, however, questions on recent household deaths may provide useful information on cause of death. 617. Even under optimal conditions, it should not be expected that questions on recent household deaths will yield data comparable in completeness and accuracy to a fully developed system of death registration. For many countries, however, the questions may yield far more complete reports of deaths than existing death registration systems. Methods exist for assessing completeness of reporting and for adjusting reported numbers of deaths upward to better estimate true numbers. Complete reporting is always desirable, but it is not required to justify use of the questions. A census or survey that attains 80 per cent or more completeness of reporting of recent household deaths will often make a major contribution to measurement of mortality.
1. Questions
618. Questions on recent household deaths differ from the other questions considered in this and the preceding chapter because they refer to persons not enumerated or interviewed. Information about them must therefore be recorded in a specially created section of the questionnaire. Partly for this reason, and partly because information on the sex and age of each deceased person must be obtained, questions on recent household deaths may be phrased and formatted in many different ways. Four examples are given in section C.1 to illustrate the possibilities. 619. Box 3 shows the questions used in the 1988 census of the United Republic of Tanzania. The questions aim to obtain the sex and age at death of all persons who died during the 12 months preceding the census date and allow for a total of as many as 3 deaths.

80
Box 3. Recent household death questions, United Republic of Tanzania census of 1988
[Section] F. Deaths in the household
Occurrence of death Person 1 Person 2 Person 3
Was there any death which occurred in the household during the last 12 months? YES=1 NO=2 IF THE ANSWER IS NO, SKIP TO QUESTION 34.
Was the deceased a male or a female? MALE=1 FEMALE=2
How old was that person at the time of death? WRITE AGE IN COMPLETED YEARS IF BELOW 1 YEAR WRITE '00'
Was the deceased a male or a female? MALE=1 FEMALE=2
How old was that person at the time of death? WRITE AGE IN COMPLETED YEARS IF BELOW 1 YEAR WRITE '00'
Was the deceased a male or a female? MALE=1 FEMALE=2
How old was that person at the time of death? WRITE AGE IN COMPLETED YEARS IF BELOW 1 YEAR WRITE '00'
(27) (28) (29) (30) (31) (32) (33)
620. Box 4 shows an alternative approach, in which the sex and age of the deceased persons are recorded in tabular form. The questions and enumerator instructions included explicitly in box 3 are only implicit here. With appropriate training of fieldworkers, however, this need not disadvantage data collection, and it saves space on the forms.
621. The examples in boxes 3 and 4 enquire about deaths during the 12 months preceding the census. It is possible to enquire about deaths over longer periods, however, in which case additional questions on when deaths occurred will usually be included. Box 5 shows the questions used in the 1990 census of China.
Box 4. Recent household death questions,
1988 census of Malawi All deaths that occurred in the household from September 1987 to date:
Sex of the deceased? M=1 F=2
Age at death? (Years)
C1 C2 C3 Total deaths (If no deaths enter 00)
NOTE: M = male; F = female; C = code for the question.

81
This example illustrates how closely the detailed phrasing of the questions may be tied to the particular circumstances of the data-collection operation. Since the census reference time was mid-year 1990, obtaining information on deaths during the 18 months prior to the census and for half-year periods during this period provides both (a) the number of deaths during the one-year period preceding the census and (b) the number of deaths during calendar year 1989. 622. The final example shows how questions on recent household deaths and recent household births may be integrated to reduce the chances of omission in the reporting of either event. The main advantage
here is the possibility of improving the reporting of infant and child deaths. Box 6 shows the questions used in the 1991 Population Changes and Fertility Survey of Myanmar. Tables for recording births and deaths during the 12 months prior to interview are supplemented by a question probing for infant deaths, questions on day and month of death for infant deaths, and a final probe for completeness of reporting and consistency between reported births and deaths. 623. The careful probing here for infant deaths appears to have been effective, for the infant mortality rate derived from this data was slightly higher than the rate derived from birth history data collected in the same survey (Myanmar Immigration and Population Department, 1995, chapter 7).
2. Tabulations
624. The basic tabulation will show all reported household deaths classified by sex and age of the deceased. Tabulation by single years of age may be made for the population as a whole. If the quality of age reporting is poor, tabulations by age in five-year groups may suffice for subnational geographic areas and population subgroups. In every tabulation, however, the 0-4 age group should be disaggregated into deaths of persons zero years of age (infant deaths) and deaths of persons 1-4 years of age. The mortality risks of these groups are very different. If they are not distinguished, a large information loss will occur.
Box 5. Recent household death questions, 1990 population census of China
4. Number of deaths in the household
First
6 months of 1989 Second
6 months of 1989 First
6 months of 1990
M ___ F ___
Total ___
M ___ F ___
Total ___
M ___ F ___
Total ___

82
Box 6. Recent household death questions
in the 1991 Population Changes and Fertility Survey of Myanmar Fertility table Were there any live births in your household during the last 12 months, including those who may have died later? ENTER IN TABLE BELOW.
Mother Sex of child Serial No. Line No Age Boy Girl (1) (2) (3) (4) 1 1 2 2 1 2 3 1 2 4 1 2 5 1 2 6 1 2
If twins, write separate line for each child, using brackets.
Mortality table Were there any members of your household who died during the last 12 months? ENTER IN TABLE BELOW.
Sex Serial No. Name Male Female Age at death
(Years) (1) (2) (3) (4) 1 1 2 2 1 2 3 1 2 4 1 2 5 1 2 6 1 2
Enter total births Enter total deaths 1(a) Have there been any infant deaths (children aged one year or less who died) in this household during the last 12 months? YES.......1 (GO TO QUESTION 1(b) NO.......2 (GO TO QUESTION 2) (b)
SEX AGE AT DEATH (DAYS OR MONTHS) MALE FEMALE
1 2 DAYS...... or MONTHS..... 1 2 DAYS...... or MONTHS..... 1 2 DAYS...... or MONTHS..... 1 2 DAYS...... or MONTHS.....
2. Just to make sure I have this information correct: Was there any child who was born in the last 12 months who died after a short time? YES.....1 (INTERVIEWER: CHECK AND CORRECT IN FERTILITY TABLE, MORTALITY TABLE AND QUESTION 1[a]). NO.....2

83
625. If the question asks for deaths during a longer period or provides any information on when in the reference period the deaths occurred, that information should be included in the tabulation. In the case of the questions used in the 1990 census of China, for example, the tabulations of recent household deaths show numbers of male and female deaths at each single year of age for each of the three six-month periods that appear in box 5.
3. Estimation
626. Questions on recent deaths provide �proxies� for information on deaths that might have been collected by a complete civil registration system. If reporting were complete (subject to the limitation imposed by selection errors), they could be used directly as numerators of age-specific death rates. 627. It should generally be assumed that reporting will not be complete, however, and therefore that it will be necessary to estimate and adjust for unreported deaths. For methods of doing so see Bennett and Horiuchi (1981 and 1984), Hill (1987), and United Nations (1983, chapter 5).
4. Quality
628. Early experience with questions on recent household deaths frequently resulted in high levels of omission, but recent experience indicates that the questions may in many cases be made to yield good results. While it is probably unrealistic to expect complete reporting, and special efforts must be made to avoid underreporting of infant and child deaths, it seems likely that such questions should play a greater role in the future than they have in the past. (a) Response error 629. The common response error is underreporting of deaths. Given the nature and importance of deaths in any household, it is unlikely that respondents would not know of them or would have forgotten them in so short a time. As in the case of recent births, the explanation must lie elsewhere. 630. Recent deaths may be underreported for the same reasons that recent births are underreported. Poorly trained enumerators may avoid asking the questions. Respondents may be reluctant to report deaths, or may be uncertain whether or not a death should be reported because they are uncertain when exactly it occurred. The first two problems are likely to be more serious for recent deaths than for recent births. Enumerators may dislike asking about deaths because respondents
dislike answering questions about them. An additional consideration is that recent births, other than those who have died, will usually be present in the household and a clear reminder to both fieldworker and respondent of the event of birth. 631. It may safely be assumed that the sex of recently deceased persons is accurately reported, but their ages at death may be less accurately reported than the ages of persons living in the household. Accurate reports of age at death are as important as accurate reports of age of living members of the household. If a question on household deaths is used, similar efforts should be made to obtain the most accurate reporting possible. 632. Infant and child deaths may be less completely reported than deaths of older persons. Infant deaths in particular are likely to occur very soon after birth, before the child has any chance of becoming established in the family, and deaths of young children may have less serious consequences for the household than deaths of older children and adults. The Myanmar survey mentioned above suggests, however, that with sufficiently detailed questions and high quality fieldwork it is possible to obtain good results even for infants. 633. The example of Myanmar illustrates the danger of generalizations based on the experience of other countries or other data collection operations or on general opinions formed on the basis of that experience. Questions about how well particular questions will work in particular circumstances are best be resolved by testing rather than by resorting to �conventional wisdom�. (b) Selection error 634. For a death to be reported in response to a question on household deaths it must occur in a household existing at the time of the census or survey. Deaths that occur in households that cease to exit before the census or survey is taken will not be reported. This obviously includes all deaths occurring in one-person households. Similarly, the death of an adult household member may be the cause of the dissolution of a household, and that death may also be missed. Selection errors of this kind are likely to be particularly serious where the prevalence of HIV/AIDS is high. 635. These omissions are important less for the fact of omission, which is in some degree expected and can be adjusted for, than for the likelihood that they are selective by age and so distort the age pattern of reported deaths. Such omissions as a source of age
84
selectivity have not been satisfactorily studied, although census and survey data on household structure provide a basis for such studies.
D. SURVIVAL OF PARENTS
636. The proportion of respondents whose mother is surviving, or whose father is surviving, at the time of a census or survey reflects the level of adult mortality. Higher mortality levels will result in lower proportions surviving, and lower mortality levels will result in higher proportions surviving. Procedures have been developed for estimating the level and trend of adult mortality during the years prior to a census or survey from this information. Data derived from such questions are often referred to as �orphanhood� data, but it should be noted that the question is asked of adults as well as children.
1. Questions
637. The simplest question is:
Is your [this person's] mother still living?
It was for data derived from this question that methods for estimating the level of female mortality were first developed. Subsequently methods were developed for estimating male mortality from the corresponding question for males:
Is your [this person's] father still living? Either question may be elaborated by asking the year and month of death when the mother or father is deceased (Chakiel and Orellana, 1985). If it is possible to obtain this information with reasonable accuracy, those data simplify estimation procedures and provide estimates of mortality for more recent periods. 638. A less demanding alternative asks of each married person whether (a) this person�s mother or father was surviving at the time of the person's marriage and (b) whether this person's mother or father is still surviving. The same information may be obtained for the person's mother-in-law and father-in-law.
2. Tabulation 639. The basic tabulation for the question on survival of mother is the total population by age, sex and whether or not the mother was surviving at the time of the census or survey. Age in five-year groups suffices for all tabulations, but groupings into broader groups
should be avoided. The open-ended age group may be taken to be 60+ or higher. 640. The sex dimension is recommended because it has been observed that the adoption bias (see below) is more pronounced for male respondents than for female respondents. The possibility of producing estimates by sex of respondent therefore facilitates the assessment of adoption bias. If there were response bias, reports by male and female respondents would give nearly identical proportions of surviving mothers and fathers.
3. Estimation
641. The idea of estimating adult mortality from proportions of surviving parents is simple. For example, persons aged 20-24 years, at the time of a census or survey were born 22½ years before on average, when their mothers were alive 22½ years ago. Knowing that the average age at childbearing in the population is approximately 28 years, the proportion of surviving mothers is an estimate of the life-table probability of surviving from age 28 to age 28+22½, or to age 50½. 642. The basic estimation procedure estimates life-table probabilities of survival from the proportion of persons (males, females or both sexes) in each five-year age group (5-9, 10-14, ....). The 0-4 age group is not used because the proportion of deceased parents is usually very low and subject to erratic fluctuations (Brass, 1975: 67). Older age groups give estimates of survival over longer adult age intervals. Data for the 10-14 and 15-19 age groups give an estimate of female survival from ages 25 to 40, while data from the 45-49 and 50-54 age groups give an estimate of survival from ages 25 to 75. 643. Since older persons were born longer ago, the time over which their parents were exposed to the risk of dying is longer than it is for the parents of young persons. This suggests that data on proportions of parents surviving for different age groups of respondents contains, if only implicitly, information on the trend of adult mortality during the several decades prior to the census or survey. During the 1980s techniques were developed for estimating trends of adult mortality from data on survival of parents (Brass, 1985). Using those methods, the trend of adult mortality can be estimated for approximately 15 years prior to the time of a census or survey (United Nations, 1983, chapter IV).

85
4. Quality 644. The quality of adult mortality estimates derived from data on survival of parents depends on the quality of the data, the accuracy of supplementary parameters required by the estimation procedure and the validity of the model life-table family used for the estimation. Generally, the most effective way of assessing quality is to compare the parental survival estimates with estimates from other sources. (a) Misreporting of survival of parents 645. To respond accurately to questions on the survival status of the mother or father of a given person the respondent must (a) know the identity of the mother or father, (b) know whether those persons are living or dead and (c) accurately report the information. 646. A respondent reporting the survival status of his or her own mother or father will generally know both their identity and their survival status. Only in special circumstances will persons not know the identity of their parents. Either or both parents would have to have died when the person was very young, and the persons who raised the child would have to have left them ignorant of the identity of their biological parents. Such persons will presumably report the survival status of the persons they regard as their mother and father. These reports may be correct, even though made for the wrong person. If children are adopted or fostered because either or both of their biological parents die, however, the tendency will be to misreport deceased persons as surviving, and thus to overstate survival of parents. 647. A respondent reporting the survival status of some other person in the household may be less able and less inclined to report accurately. The chances of misreporting depend both on the size and complexity of the household and of the relation of the respondent to the person for whom he or she is reporting. If households consist primarily of nuclear families, respondents will usually know the survival status of the mother and father of every person in the household. As households become larger and more complex, so does the possibility that some misreporting will occur because respondents do not know the correct answers to the questions posed. The tendency of misreporting is unclear in this case, but respondents might suppose persons to be living unless they know them to be deceased. If so, the tendency will be to overstate survival of parents.
648. If the respondents are adoptive or foster parents of the person for whom they are reporting, there may be a tendency to report their own survival status, rather than the biological parent's status, on the grounds that they are the �real� parents. If the biological parent in question is living, the report will be correct, even though made for the wrong person. If the biological parent is deceased, however, they will be incorrectly reported as being living. Misreporting of this kind will tend to overstate survivorship of parents, but may be minimized by training fieldworkers to recognize the tendency and emphasize to respondents that the question refers to biological parenthood. 649. Whether respondents are reporting on their own or another person�s parents, it may be that the mother or father lived elsewhere and that news of their death has not yet reached the respondent. This will result in a mother or father being reported as surviving when in fact they have died. Misreporting of this kind will tend to overstate survivorship of parents. When misreporting occurs because respondents report the survival status of an adoptive or foster parent rather than the true parent, the level of misreporting is likely to vary systematically with age. The older the person the survivorship of whose parents is being reported, the greater the chance that his or her adoptive or foster parents will have died. If the person�s biological parents have also died, this having been the reason for adoption or fostering, there will be less misreporting for older persons than for younger persons. The error resulting from this misreporting is referred to as adoption bias. (b) Misreporting of age 650. Age misreporting, particularly age exaggeration, will introduce errors into estimates of adult mortality derived from data on survival of parents. Younger respondents have, on average, younger parents, and it is therefore more likely that their parents are surviving. Age exaggeration will result in proportions of surviving parents that are too high and therefore in estimates of mortality that are too low. For additional remarks on the effects of age misreporting see Blacker and Mukiza-Gapere (1988, 3.2.27) and Dechter and Preston (1991). (c) Selection error 651. The mortality experience of men and women with no surviving children is necessarily excluded from the responses to the questions in paragraph 637.

86
This omission may bias the estimates. If childless men and women have higher mortality, for example, the resulting estimates will tend to be too low. Men and women with many surviving children will (to the extent that reporting is accurate and complete) be reported by all of them. The mortality experience of persons with larger numbers of children will thus be more heavily represented than the experience of persons with smaller numbers of children. If parents of larger families have higher mortality, the resulting estimates will tend to be too high.
E. SURVIVAL OF SIBLINGS
652. The idea of deriving adult mortality estimates from information on the survival of siblings is broadly similar to that of basing estimates on survival of parents or children ever born. These questions have been used even less frequently than the questions on survival of parents, so that relatively little experience has been gained in their use. For this reason, they may not be included in censuses unless their suitability has been established by field tests. In the many countries that have little or no data on adult mortality, however, they might be widely used in large-scale household surveys and fertility surveys.
1. Questions
653. The basic sibling survival questions are as follows:
Brothers ever born How many brothers do you [does this person] have altogether, including brothers that have died? Brothers surviving How many of these brothers are living now? Sisters ever born How many sisters do you [does this person] have altogether, including sisters that have died? Sisters surviving How many of these sisters are living now?
654. These questions might be asked of all persons, but the information for children is not generally considered valuable (the questions on children ever born and surviving are likely to provide better information on child mortality). Given the interest in adult mortality, the questions may be asked of all
persons above a certain minimum age, such as 10 or 15 years. 655. A disadvantage of the questions is that respondents may be unaware of brothers and sisters who died in infancy. A respondent may be unaware, for example, that one or more earlier children born to his or her mother died in infancy. 656. An alternative set of questions refers only to siblings who survived beyond infancy or beyond.
Brothers surviving to age 15 How many of your [this person's] brothers survived to age 15? Brothers surviving now How many of these brothers are living now? Sisters surviving to age 15 How many of your [this person's] sisters survived to age 15? Sisters surviving now How many of these sisters are living now?
These questions are asked of all persons aged 15 years and over. 657. However, in solving one problem, the questions in paragraph 656 introduce another. When respondents find it difficult to report age accurately, it may be difficult for them to know whether or not any particular person did or did not survive to age 15. Nevertheless, on balance, the questions on adult sibling survival will usually be preferable, as mortality risks are lowest in late childhood and early adulthood. 658. A more elaborate alternative is to ask questions aimed at obtaining a �sibling history�, that is, a list of all siblings indicating for each sibling, sex, date of birth, whether or not they are currently surviving and, if not, the date (or age) of death. Questions of this kind have been included in some Demographic and Health Surveys as part of an attempt to measure maternal mortality.
2. Tabulation
659. The basic tabulation for the basic sibling-survival questions in paragraph 653 shows all persons over age 15 by age in five-year groups.

87
NOTES: * = cell potentially filled
· = continuation When the adult sibling questions are asked, �ever born� is replaced by �surviving at age 15�, and �surviving� is replaced by �surviving now�. However, the form of the tabulation for both the basic sibling-survival questions (see illustration) and the adult sibling question is the same.
3. Estimation 660. The tabulations are used to compute proportions of brothers and sisters surviving for each age group. The proportions are then transformed into estimates of life-table �survival probabilities� for females and males. A further calculation identifies each survival probability with a point in time, with probabilities derived from older age groups corresponding to earlier points in time. In this way a level and trend of adult mortality are derived. For the method of estimation see Hill and Trussell (1977) and Timæus, and others (1996).
4. Quality
(a) Response error 661. The problem of respondents not knowing of the existence of siblings who died in infancy has already been mentioned. Since this lack of knowledge selectively omits deceased siblings, the proportions of surviving siblings derived from these questions will be too high and will result in estimates of adult survival that are too high. 662. Adult respondents will generally know how many brothers and sisters they had when they themselves were around age 15, although they may be
uncertain of the exact age at death of those who died. Reluctance to acknowledge the existence of siblings who have died will result in implied numbers of deaths that are too low. The questions on survival of parents have an advantage in this respect: the existence of the persons whose survival is queried cannot be concealed. 663. As in the case of the questions on children ever born and children surviving, a concerted effort should be made in the training and supervision of fieldworkers to ensure the most accurate reporting possible. (b) Selection error 664. No information on the mortality experience of single children will be obtained, since single children who die have no siblings to report the fact. If single children experience mortality risks different from those of non-single children, bias will result. Where fertility is moderate or high, the proportion of women having only one child is small, however, and the proportion of persons who are single children smaller still, so that even substantial differences will not weigh very heavily. 665. Children with many siblings, on the other hand, will be reported as surviving by all surviving siblings; therefore, their mortality experience will weigh more heavily in the results. Information on number of siblings might be used to counter this effect. In general, however, it is considered that mortality differentials by number of surviving siblings are not likely to be strong enough to introduce significant bias.
Brothers Sisters
Age Persons Living
here Living
elsewhere Deceased Living
here Living
elsewhere Deceased
15-19 * * * * * * * 20-24 * * * * * * *
. . . . . . . .
. . . . . . . .
. . . . . . . . 80-84 * * * * * * * 85+ * * * * * * *

88
VII. CONCLUSION
666. Methods for collecting fertility and mortality data and the various issues that arise in using those methods evolve over time. Demographic research leads to the development of new methods. Application of new and existing methods in countries throughout the world adds to knowledge of how different methods work in different contexts. Technological developments create new opportunities for application. Changing economic, political and social conditions in each country change the environment within which data collecting occurs and the needs, interests and sophistication of users. The present handbook attempts to distill fundamental principles as well as to summarize the state of knowledge at the time of writing, but organizations and persons responsible for data collection must seek and find ways for keeping current with new developments in the field. This is the focus of this concluding chapter.
A. DEMOGRAPHIC RESEARCH
667. Methods for collecting fertility and mortality data have been remarkably stable over time. Most of the methods discussed in this handbook were developed over ten years ago, and many have been in use for decades. New methods will be developed from time to time, however, and it is important to become aware of those developments. Conferences, informal contacts between national data-collection organizations in different countries and the literature of demographic research are all sources of information on new developments. 668. Genuinely new methods may be rare, but experience with existing methods in different contexts accumulates constantly. The knowledge that comes with practical application of existing methods is probably more important in practice than the development of new methods. Much of this knowledge is acquired within data-collection organizations and is most effectively shared by contacts between those organizations. National, regional and international organizations can play an important role in the dissemination of this knowledge, which tends to be poorly represented in the literature of demographic research.
B. TECHNOLOGICAL DEVELOPMENT
669. The rapid pace of technological development in the modern world, and of development in information
technology in particular, is well known. It has profound consequences for data-collection organizations, whose sole or primary product is information. It is a mistake to overemphasize the role of information technology in data collection, for there is much of fundamental importance that it does not address. Effective management of data-collection operations is perhaps the most important example. At the same time, there is hardly any aspect of the work of data-collection organizations that is not touched by developments in information technology. It is important to keep in touch with those developments. 670. Perhaps the most important development in recent decades is the emergence of the Internet as a fundamental resource for sharing knowledge and information between individuals and organizations of all kinds throughout the world. The Internet may become the fundamental tool for keeping up, not only with developments in information technology, but with many other kinds of developments as well.
C. USERS AND USER NEEDS
671. The increasing complexity and interdependence of modern societies can only increase the demand for information to guide action of all kinds, by government, by business, by non-governmental organizations and by families and individuals. The globalization of economic, and to some extent social and political activity, will tend to make policy makers and planners of all kinds think more in terms of the global or regional situation than in terms of the situation in 200 or so different countries of the world. This will create ever-increasing pressure, not only for appropriate uniformity of statistical definitions and formats, but also for compilations and presentations of global and regional data. 672. The users of data and statistics are, of course, the primary source of information on their needs and concerns. This has always been the case, but the rapid pace of social change and the increase in the number and diversity of users make it both more difficult and more important for data-collection organizations to systematically develop and maintain two-way channels of communication with their users to monitor their changing needs and concerns. 673. Data producers tend to think in terms of methods of data collection and to structure their organizations around those methods. Users tend to think in terms of

89
the information they need, or think they need, with little attention to the way in which this information will be generated. Both viewpoints are valid and necessary, but there is an inherent tension between them. Since it is user needs that ultimately drive data production, the data-producing organization bears the responsibility for responding to users. In some cases, to be sure, the appropriate response may be to attempt to educate users about the realities of data collection.
D. DATA COLLECTION ENVIRONMENT
674. The collection of social data of all kinds is conditioned by the social environment in which it takes place. The data-collection organization must be sensitive to changes in the social environment that influence the social process of data collection. The social environment is too rich and diverse to permit a definitive enumeration of those conditions, but examples of influences will suggest the range of factors to which attention must be paid. 675. Changing health conditions may require different approaches to, as well as make new demands upon, data-collection activities. The HIV/AIDS epidemic, for example, has changed demographic patterns in high-prevalence countries in ways that tend to invalidate many standard methods of demographic estimation. 676. International movements of population, including labour migration and refugee movements, are becoming increasingly important in many parts of the world. This increasing interdependence between countries raises new challenges for data-collection organizations that traditionally have had to deal primarily with national concerns. 677. Citizen concerns with privacy and with the actual or perceived invasiveness of data�collection procedures employed by Governments and businesses have already had an important influence on data collection in some countries. Such concerns frequently influence decisions to include particular questions in censuses and surveys. In a few extreme cases, they have effectively voided the use of the traditional population census. 678. From a technical and statistical point of view, the linking of different kinds of information about persons from different sources enriches all the sources, and a nationally mandated system of personal identification numbers is a valuable tool for effecting
the linkage. From the broader perspective of social and political concerns, however, such developments may threaten citizens� right to privacy. This issue is of vital concern to data-collection organizations, which cannot do their job without public cooperation.
E. INTERNATIONAL COOPERATION
679. International cooperation in matters concerning the collection and use of statistical information is important today and will be increasingly important in the future. In the future, more than in the past and at present, users of the statistical information produced by a country will be located in other countries and in international organizations. This will increase the demand for international standardization, of the content of statistical information, the form in which it is presented and the �metadata� that describe it. Additionally, the shift from paper-based information to computer-based information is raising new standardization issues that need to be addressed. For all of those reasons, the importance of communication and cooperation among national data-producing organizations will increase. 680. International cooperation will also be important to the internal operations of the data-producing organization. The opportunities and risks created by new information technology and the speed with which they arrive will make the sharing of experience between organizations in different countries ever more valuable. Numerous international and regional conferences and organizations exist to promote communication and cooperation of this nature. They are likely to become more important in the future. The development of telecommunications and computer networks will create new mechanisms for �interaction at a distance� to complement face-to-face meetings. 681. Bilateral and multilateral contacts between data-producing organizations in different countries are very valuable. Few people understand the pressures, the risks and the problems of data collection as well as other persons engaged in the same work in other countries. International conferences that bring data producers together are important for this reason, and because they keep the staff of data-producing organizations abreast of the significance of new developments relevant to data collection. The face-to-face interaction provided by international conferences will play an important role for the foreseeable future, but may be increasingly complemented and reinforced by contact at a distance via the Internet.

90
ANNEX
LEXIS DIAGRAMS
682. Lexis diagrams are a way of visualizing various sets of persons and events and of the relationships between them. They provide a specialized but highly effective language for communicating about and understanding demographic tabulations, calculations and statistics. Lexis diagrams are used in section B of chapter VI to elucidate the calculation of probabilities of death from birth-history data. The present annex gives a systematic exposition of Lexis diagrams and illustrates their use in connection with other methods discussed in chapters V and VI.
A. LEXIS DIAGRAM REPRESENTATION
683. Given a coordinate plane with axes for time and age, every demographic event may be represented by a point whose time and age coordinates are the time at which the event occurred and the age of the person to whom it occurred. Every person may be represented by the straight line, called a life line, connecting the points representing that person�s birth and death.
684. Figure A.1 shows life lines for two persons, both of whom died during year t at age 1 in completed years. The lower right end points of these lines represent the deaths of the persons represented by the lines.
Figure A.1. Lexis diagram representation
685. Life lines provide a basis for representing sets of persons. The general rule is that any line in the coordinate plane represents the set of persons whose life lines intersect this line. Line ad in figure A.1, for example,

91
represents persons between exact age 1 and exact age 2 at time t, line bc represents persons in the same age group at time t+1, and line ab represents persons who reached exact age 1 during the year beginning at time t.
686. The representation of events by points provides a basis for representing sets of events. The general rule is that any two dimensional figure may be regarded as representing the set of events whose representing points lie within it. Square abcd in figure A.1 represents persons who died during year t (time coordinate between time t and time t+1) at age 1 in completed years (age coordinate between exact age 1 and exact age 2).
687. Since the life line representing a person extends up and to the left from the point representing this person�s death, triangle acd in figure A.1 represents deaths of persons who were age 1 in completed years at the beginning of year t, whereas triangle abc represents deaths of persons who reached exact age 1 during the year. This division of deaths during a year to persons at a given completed years of age according to whether the persons who died were (a) in the age group at the beginning of the period or (b) reached the lower limit of the age group during the period is important in many demographic calculations. The number of deaths represented by either of the triangles in figure A.1 as a fraction of the number of deaths represented by the square is called a separation factor.
688. Sets of deaths are represented in figure A.1, but the same principles of representation apply to demographic events of all kinds, such as births regarded as events occurring to the mother, marriages and divorces. The diagram does not indicate what kinds of events are represented. That information must be supplied by context.
689. Different orientations of the Lexis diagram axes may be used for different purposes. The time axis may be drawn down and the age axis to the right, for example, or the age axis drawn up instead of down. The orientation shown in figure A.1 is the most generally useful one, if not necessarily the most widely used, because it corresponds to the way tables of births and deaths are arranged, with rows for events occurring at older ages placed below rows for events occurring at younger ages.
690. Age and time may be replaced by different variables representing the passage of time. The age axis, for example, may be replaced by an axis representing time elapsed since marriage, first birth or i-th birth. The time axis most often represents calendar time, but diagrams representing survey data may express time as months or years prior to interview.
691. Lexis diagrams are used to display definitions and relationships. They do not represent quantitative aspects of particular populations. The totality of points representing births, deaths or other events in a particular population are never drawn, except perhaps by way of example for a very small population. The same is true of the life lines representing persons.
B. THE METHOD OF EXTREMES
692. Two methods facilitate the drawing and interpretation of Lexis diagrams. The method of extremes consists of identifying extreme cases, drawing lines or plotting points representing these cases and connecting those points or lines to obtain the desired representation.
693. In figure A.1, for example, persons reaching exact age 1 year during the year beginning at time t are represented by line ab. The extreme cases in this instance are reaching exact age 1 year at time t, corresponding to the life line passing through point a, and reaching exact age 1 year at time t+1, corresponding to the life line passing through point b. The Lexis diagram representation is the line ab connecting the two points.
694. Square abcd in figure A.3 represents deaths occurring during the year beginning at time t to persons age x in completed years at time t. The extreme cases here are a death occurring at time t to a person at exact age x (point a), a death occurring at time t+1 to a person at exact age x (point b), a death occurring at time t +1 to a person at exact age x+1 (point c), and a death occurring at time t to a person at exact age x+1 (point d). The Lexis diagram representation is the square whose vertices are those points.

92
C. THE METHOD OF INTERSECTIONS
695. The method of intersections applies only to sets of events. It consists of identifying the age group, time period and/or birth cohort involved, drawing the representations of the age group, time period and/or birth cohort, and taking the intersection of those representations to obtain the desired representation.
696. Consider again, for example, square abcd in figure A.1, which represents deaths occurring during the year beginning at time t to persons aged 1 in completed years at death. This description specifies a time period, year t and an age group, age 1 in completed years.
697. Deaths occurring during the time period are represented by the rectangular area formed by the vertical lines extending down from times t and t+1. Deaths occurring to persons age 1 in completed years are represented by the horizontal rectangular area formed by the horizontal lines passing through these ages on the time axis. The intersection of these two areas, square abcd, gives the desired representation.
698. Consider next events that occur during year t to persons age x in completed years at time t (figure A.2). This description identifies a time period, year t and a cohort, the cohort whose members were age x in completed years at time t.
699. Events occurring during the time period are represented by the rectangular area formed by the lines extending down from times t and t+1. Events occurring to members of the cohort are represented by the diagonal area formed by the parallel diagonal lines ab and dc. The intersection of the two areas, parallelogram abcd, gives the desired representation.
Figure A.2. Period-cohort sets of events
700. Consider finally events that occur between exact age x and exact age x+1 to persons who reach exact age x during the year beginning at time t (figure A.3). This description identifies an age interval (ages between x and x+1) and a cohort (the cohort whose members reach exact age x during the year beginning at time t).

93
701. Events occurring in the age interval are represented by the rectangular area formed by the lines at exact ages x and x+1. Events occurring to members of the cohort are represented by the diagonal area formed by the parallel diagonal lines extending the line segments ad and bc. The intersection of the two areas, parallelogram abcd, is the desired representation.
702. As useful as these two general methods are for drawing and understanding Lexis diagrams, facility with the diagrams is best attained through familiarity with their application to many different practical situations. The following sections provide a series of examples drawn from the body of the handbook.
D. AGE-SPECIFIC DEATH RATES
703. Age-specific death rates are usually defined as the number of deaths occurring to persons in a given age group during a given time period divided by the number of person-years lived in the population in this age group during this time period. The number of deaths in the numerator is simply explained. The definition of the person-years in the denominator is more complicated, but becomes clear when illustrated in figure A.4.
Figure A.3. Age-cohort sets of events

94
Figure A.4. Age-specific death rates
704. Figure A.4 shows a simple example involving only five persons, represented by the life lines a, b, c, d and e. Person a was exact age x+1/2 at time t and survives past age x+1. That person lives for 1/2 year in the age group and during the time period shown in the diagram and contributes 1/2 of one person year of exposure to the denominator of the age-specific death rate. Person b was exact age x+1/4 at time t and died at age x+3/4. This person also contributes 1/2 of one person year to the denominator of the age-specific death rate for the age group and time period shown.
705. Person c was age x exactly at time t and survived past age x + 1. He or she contributes 1 person-year to the denominator of the age-specific death rate. Note that this is the maximum that any person can contribute. Persons d and e each contribute 1/4 of one person year to the denominator of the rate.
706. The denominator of the age-specific death rate is the total of the person years contributed by every person who was alive and in the age group at any time during the period. In the example, the five persons contribute a total of 2.5 person-years lived. Two deaths occur during the time period to persons in the age group; hence the death rate is 2/2.5 = 800 deaths per thousand person-years lived.
707. When numbers of persons and deaths are very large, the numbers of person-years lived used for the denominators of age-specific death rates may be calculated approximately as the average of the number of persons in the age group at the beginning and the end of the time period times the length of the time period, a calculation that does not require data on exact ages of individuals and ages of death. When numbers of persons and deaths are small, however, as is often the case for survey data, a more exact calculation may be used.

95
E. INFANT MORTALITY RATES
708. The infant mortality rate is commonly defined as the number of infant deaths (deaths of children under exact age 1 year) occurring during a calendar year divided by the number of births occurring in this year. This calculation does not respect the principle of exposure to risk, however, since some infant deaths occurring during a calendar year are to children born in the preceding year, and some of the children born during a calendar year who die in infancy do so in the following year. This is evident in figure A.5.
709. The conventional calculation of the infant mortality rate divides the number of deaths represented by square abdc by the number of children represented by line ab. Of the three life lines shown, however, only one reflects the correct relation of events to exposure to risk. The child represented by life line 1 died in infancy during year 2, but was born during year 1. This child's death is included in the numerator of the rate, but the birth is not in the denominator. The child represented by life line 3 was born during year 2 but died in infancy during year 3. That child is included in the denominator of the rate, but not in the numerator.
710. The extent of the mismatch between deaths and exposure to risk is less than this diagram suggests, however, because nearly all infant deaths occur within the first month of life, that is, are clustered close to the horizontal line representing exact age zero. Most children born during year 2 who die in infancy will die within the first month of life, and most therefore will die during year 2.
Figure A.5. Infant mortality rates
711. The principle of exposure to risk suggests a different calculation of the infant mortality rate: the number of children born during a given year divided into the number of these children who die before reaching their first birthday, that is, the number of children represented by line ab divided into the number of infant deaths among these children represented by parallelogram abed.
712. The justification for the conventional calculation is twofold. First, if numbers of births and infant deaths are not changing rapidly from one year to the next, the number of deaths in square abdc will approximate the number of deaths in parallelogram abed, because the number of deaths corresponding to triangle adc will be approximately equal to the number represented by triangle bed. Secondly, the number of infant deaths occurring during a given year is often much more readily obtained from standard death registration tabulations than the number of deaths represented by parallelogram abed.

96
F. REVERSE SURVIVAL
713. The reverse survival method of estimating the number of births and birth rates from census and survey age distributions was presented in section V.A of the text. Figure A.6 illustrates several aspects of the method. In the case of a census or a survey with a single reference time, the time axis will represent calendar time, with time zero representing the reference time. In the case of a survey in which interviews are conducted over a period of time and information collected refers to time of interview, the time axis will represent years prior to interview. For simplicity of exposition, the case of estimation from a population census will be assumed here.
714. The vertical (age) axis extending down from time zero represents persons in the population at the time of the census or survey. The horizontal (time) axis extending to the left represents births to the population during the years prior to the census.
715. Segments of the age axis represent persons in particular age groups at the time of the census: for example, the segment between exact age 3 and exact age 4 represents persons age 3 in completed years at the time of the census. Segments of the time axis represent groups of persons born during the various years prior to the census, thus the segment connecting the times -3 and -4 represents births during the fourth year prior to the census.
Figure A.6. Reverse survival*
* See chapter V, sect. A
716. The diagonal lines and the trapezoids they form show the relation between the children born in the various years prior to the census, the survivors among those children at the time of the census and the children who died before the time of the census. Children age 3 in completed years at the time of the census, for example, are the survivors of children born during the fourth year prior to the census. The deaths of children in this cohort that occur before the time of the census are represented by the shaded trapezoid connecting the corresponding intervals on the time and age axes.

97
717. The reverse survival method is based on the simple observation that the number of births in any of the cohorts equals the number of survivors at the time of the census plus the number in the cohort who died before the census reference time. The number of persons is known (subject, of course, to whatever errors are present) from the census age distribution. The number of deaths is estimated from knowledge of the level of infant and child mortality.
718. Figure A.6 illustrates reverse survival for single-year age groups and time periods. The method may also be applied to aggregated age groups. Persons age 0-4 in completed years at the time of the census, for example, represented by line bc, are the survivors of births during the five-year period preceding the census, represented by line ab. The number of births equals the number of survivors plus the number of deaths, represented by triangle abc.
G. OWN-CHILDREN
719. The own-children method of fertility estimation is introduced in chapter V.B of the text. The method involves several technical adjustments to translate the data contained in the own-children tabulations into standard age-specific birth rates. The nature of the adjustments may be clarified by a suitably constructed Lexis diagrams. As in the preceding section, the exposition is simplified by assuming data from a population census.
720. Each row of the own-children tabulation shown in table 3 gives the numbers of children matched to their mothers by age of child. The numbers in the row for age 25 years, for example, shows own-children of women age 25 distributed by age at the census reference time. Children age 0 in completed years were born during the year prior to the census and are represented in figure A.7 by parallelogram behd, the intersection of the vertical rectangular area beneath the interval between -1 and 0 on the time axis and the cohort diagonal extending up and to the left from the interval between exact ages 25 and 26 on the age axis.
721. Figure A.7 shows representations of selected cells in the own-children tabulation table 3. Specifically, the method of intersections shows that:
• Parallelogram behd represents own-children who were born during the year preceding the census to women age 25 at the time of the census
• Parallelogram dhjg represents own-children who were born during the year preceding the census to women
age 26 at the time of the census • Parallelogram adgc represents own-children who were born during the second year preceding the census to
women age 26 at the time of the census • Parallelogram cgif represents own-children who were born during the second year preceding the census to
women age 27 at the time of the census
where ages of women are in completed years. The corresponding numbers of births are obtained by applying reverse survival and non-own-children factors. The numbers of births are not, however, the numerators of standard age-specific birth rates. The number of births in the numerator of the age-specific birth rate for age 25 for the second year prior to the census, for example, is the number of births in the set represented by square cdgf in figure A.7. Conceptually, the approach to obtaining these numbers of births from the own-children tabulation consists of the following steps:
• Calculate the number of births represented by triangle cdg by applying a suitably calculated separation factor to the number of births represented by parallelogram adgc
• Calculate the number of births represented by triangle cgf in the same way from the number of births
represented by parallelogram cgif

98
• Add the numbers of births represented by these two triangles to obtain the number of births represented by square cdgf.
Figure A.7. Own-children*
* See chap. V, sect. B.
722. In practice, a separation factor of one half is often assumed. Separation factors may deviate substantially from one half, in fact, but some cancellation of errors occurs, and the remaining error is often too small in relation to other errors to justify the use of more precise separation factors. In applications to data of very high quality, more elaborate procedures for estimating the numerators of the age-specific birth rates may be justified.
H. CHILDREN EVER BORN
723. Figure A.8 shows the Lexis diagram representation of children ever born to selected age groups of women at the time of a census or survey. It is assumed here that all births are to women age 15-49 years of age.
724. Children ever born to younger women, e.g., women age 20-24 at the time of the census or survey (shaded area 1), reflect the timing of childbearing as well as the level. Children ever born to older women still in the reproductive age span, e.g., women age 35-39 (shaded area 2), are better indicators of completed fertility. Children ever born to women over age 50 approximate the completed fertility of the corresponding birth cohort (shaded areas 3 and 4). The data provides an approximation only because it necessarily excludes births to women who died before the time of the census.

99
Figure A.8. Children ever born
725. The average number of children ever born to women in any birth cohort in a population provides an approximation to the total fertility rate of the population at the time at which the members of the birth cohort reach the mean age of childbearing for the cohort. This is illustrated in figure A.8 for women 50-54 years old at the time of the census. Births to those women are represented by shaded area 3. The number of births divided by the number of women gives the mean number of children ever born for this cohort.
726. Mean age at childbearing varies relatively little, and in the absence of data may be taken to be approximately 30 years. Members of the birth cohort represented by shaded area 3 reach exact age 30, on the average, 20 years prior to the date of the census or survey. The horizontal dotted line at age 30 represents the mean age of childbearing. The vertical dotted line indicates the time for which the average number of children ever born provides an estimate of the total fertility rate in the population.

100
I. BIRTH HISTORIES
727. Birth histories, introduced in chapter V, section F, are an important method for collecting data on fertility and infant and child mortality. The very detailed questions employed provide the opportunity for extensive probing by interviewers. This can be exploited to obtain more accurate information from respondents than is possible with other methods.
728. Birth history data are subject to important technical limitations, however, particularly when, as is usually the case, birth histories are collected only for women of reproductive age. The exclusion of women over age 50 means that data are collected only for "incomplete cohorts"�for cohorts of women who will have more children after the survey interview.
729. Birth histories for women age 15-49 years provide data on births for 35 years prior to the survey interviews, but the data are progressively less complete as they are more removed from the time of the survey. This is illustrated in figure A-9. For the sake of simplicity in the following analysis, it will be assumed that all survey interviews occur at the same point in time.
730. The totality of births occurring during the 35 years prior to the survey is represented by square abdc. Birth histories for women age 15-49 years at time 0 provide information only on the births represented by triangle abd. Births represented by triangle adc are to women over age 50 at time 0, for which no information is obtained.
731. It is apparent from the diagram that although survey birth histories provide some information on births occurring during the three and one half decades preceding the survey, that information is progressively less complete for earlier years.
732. Strictly speaking, the survey data do not even suffice to compute a total fertility rate for the year prior to the survey, since births to women age 49 in completed years during that year are represented only if the mothers reached exact age 49 years during the year. Births to mothers who were age 49 in completed years at the beginning of the year were 50 years of age at the time of the survey and therefore not included.
733. Very few women give birth towards the very end of the reproductive age span, however, and birth histories for women of reproductive age give a satisfactory approximation of the total fertility rate for the first few years prior to the survey. For earlier years, however, total fertility rates can be derived only by introducing some means of approximating numbers of births represented by triangle adc.

101
Figure A.9. Birth history data

102
GLOSSARY
NOTE: References to the text show chapter, section and subsections, as appropriate. Thus (I) refers to chapter I, (II.B) to section B of chapter II, and (III.C.3) to subsection 3 of section C of chapter III.
Age Exact age is defined for any person at any given time as the time elapsed since this person's birth. Age in completed years, also referred to as age at last birthday, is the greatest integer less than exact age. "Age" alone may refer either to exact age or to age in completed years, according to context, which nearly always determines one meaning or the other. Age in completed years See �age�. Balance equation See �demographic equation�. Birth See �live birth�. Birth history A list of all live births to a given woman, or all births prior to a specified date, providing information on the date of birth and the sex of the child born. When the birth history includes births prior to a specified date, the list will usually also include information on whether each child born is surviving as of that date and, if not, the date of death and/or age at death. Birth histories are sometimes partial, limited to births occurring during a particular time period, such as the five years prior to a survey, or to births of a particular order, such as orders 1-4 and most recent birth. Birth-history survey A household survey that includes birth-history questions. Causes of death All diseases, morbid conditions or injuries that either resulted in or contributed to death, and the circumstances of the accident or violence that produced any such injuries. Symptoms or modes of dying, such as heart failure or asthenia, are not considered to be causes of death for vital statistics purposes. See also �underlying cause of death" and "contributory cause of death". (Glossary, Principles and Recommendations for a Vital Statistics System, Revision 2, United Nations, 2001b.) Certifier (of cause of death) Person authorized by law to issue a certificate, in a prescribed format, stating the underlying and contributory causes of death and other facts related to the event for submission to the local registrar or other appropriate authority. The certifier is usually the physician who attended the deceased in his/her last illness; or the medical-legal officer (e.g., coroner or medical examiner) in the case of deaths of persons who were not attended during the last illness by a physician, or who may have died due to violence or injury. (Glossary, Principles and Recommendations for a Vital Statistics System, Revision 2, United Nations, 2001b.) Civil registration Is the continuous, permanent, compulsory, and universal recording of the occurrence and characteristics of vital events (live births, deaths, foetal deaths, marriages, and divorces) and other civil status events pertaining to the population as provided through decree, law or regulation, in accordance with the legal requirements in each country. It establishes and provides legal documentation of such events. Civil registration records are also the best source of vital statistics. (Glossary, Principles and Recommendations for a Vital Statistics System, Revision 2, United Nations, 2001b.)

103
Contributory cause of death A significant medical condition that contributes to death but is not related to the disease or condition directly causing death. (Glossary, Principles and Recommendations for a Vital Statistics System, Revision 2, United Nations, 2001b.) Data 1. Systematic information about the attributes of the entities contained in some well-defined aggregate, such as the person records produced from a census or survey, or the birth or death records produced from a civil registration system. Data of this type may be referred to as "micro" or "unit record" or "individual level" data. Data in this sense is synonymous with data set. Though the information contained on records may be quantitative, the definition of the aggregate is necessarily textual, so that data always involves a qualitative element as well. 2. Numeric information derived from such data, such as a table of numbers of persons in various age-sex groups derived from population census data. Data of this kind may be referred to as "macro" or "aggregate" or "tabular" data. In the terminology of the field of statistics, a statistic. 3. Quantitative information in general, including estimates, indicators and statistics of all kinds. Data set A set of records representing the entities in some well-defined statistical aggregate, such as all births occurring in a particular country during a given year or all persons present in a national population at a particular point in time. In the simplest case, each entity is represented by one record that provides pertinent information about this entity. Generally speaking, the same information is provided for each entity; for example, marital status will be provided for every person or for no persons. Exceptions must be made, however, for inapplicable information. Age at first marriage, for example, is meaningful only for ever married persons. �Data set� is literally synonymous with the first meaning of �data�, but data set connotes representation in a form suitable for processing on a computer and the availability of ancillary information on record format and codes. Death Death is the permanent disappearance of all evidence of life at any time after live birth has taken place (post-natal cessation of vital functions without capability of resuscitation). This definition excludes foetal deaths (see Foetal death). (Glossary, Principles and Recommendations for a Vital Statistics System, Revision 2, United Nations, 2001b.) Demographic equation A tautology stating that the change in the size of a population over any time period is the difference between the number of entries to the population during the period and the number of departures from the population during the time period. Estimate 1. In common parlance, as a verb, the act of arriving at a value for some quantity that cannot be observed or measured directly; as a noun, the result of this act of estimating. 2. In the field of statistics, a statistic used to estimate a parameter in a statistical model. Event register A data set that is updated each time an event of a specified type occurs, such as a register of births or deaths occurring in some well-defined population. See also �population register�. Exact age See �age�. Exposure to risk, principle of (IV.B.1) The principle that, in calculating the rate of occurrence of demographic events, that events counted in the numerator of a rate and persons counted in the denominator of the rate satisfy the following conditions: all events counted in the numerator must have occurred to persons counted in the denominator and all events occurring to persons counted in the denominator are counted in the numerator. See also �person-years lived�.

104
Foetal death The death prior to the complete expulsion or extraction from its mother of a product of conception, irrespective of the duration of the period of gestation; the death is indicated by the fact that after such separation, the foetus does not breathe or show any other evidence of life such as beating of the heart, pulsation of the umbilical cord or definite movement of voluntary muscles. (Glossary, Principles and Recommendations for a Vital Statistics System, Revision 2, United Nations, 2001b.) See also �death�. Imputation Replacement of a missing or unacceptable reported value with an imputed value that is statistically plausible but not necessarily correct. Imputation may also be used to resolve logical inconsistencies between two or more values, for example, by replacing one reported value with an imputed value that is consistent with the other reported value. Informant (Civil registration) The individual whose responsibility, designated by law, is to report to the local registrar the fact of the occurrence of a vital event and to provide all the information and characteristics related to the event. On the basis of such report, the event may be legally registered by the local registrar. (Glossary, Principles and Recommendations for a Vital Statistics System, Revision 2, United Nations, 2001b.) Live birth A live birth is the result of the complete expulsion or extraction from its mother of a product of conception, irrespective of the duration of pregnancy, which after such separation, breathes or shows any other evidence of life such as beating of the heart, pulsation of the umbilical cord, or definite movement of voluntary muscles, whether or not the umbilical cord has been cut or the placenta is attached; each product of such a birth is considered live-born. (Glossary, Principles and Recommendations for a Vital Statistics System, Revision 2, United Nations, 2001b.) Mean age at childbearing The mean of an age schedule of age-specific birth rates. The age-specific birth rates may refer either to a birth cohort or a time period. Maternal death A maternal death is the death of a woman while pregnant or within 42 days after termination of pregnancy, irrespective of the duration and the site of the pregnancy, from any cause related to or aggravated by the pregnancy or its management, but not from accidental or incidental causes. (Glossary, Principles and Recommendations for a Vital Statistics System, Revision 2, United Nations, 2001b.) Maternal mortality rate A vital statistics rate based on the number of deaths due to maternal causes relative to the number of live births occurring during a given period of time, usually a calendar year; that is, the number of deaths to women resulting from direct obstetric complications of pregnancy, labour and the puerperum, from interventions, omissions, or incorrect treatments or their results; or from indirect obstetric causes resulting from previously existing disease or disease arising during pregnancy and which was not due to direct obstetric causes but which was aggravated by physiological effects of the pregnancy occurring in a given geographical area during a given year per 100,000 (or 10,000) live births occurring in the given geographical area during the same year. (Glossary, Principles and Recommendations for a Vital Statistics System, Revision 2, United Nations, 2001b.) Parity A woman's parity at any given time is the number of live births she has had as of a given time. Parity progression ratio The proportion of women, in a group of women who have had at least i live births, who go on to have an i + 1st birth. For i > 0 this is the ratio for progression from i to i + 1st birth. For i = 0 it is the ratio for progression to first birth.

105
Own-children method A method for estimating age-specific birth rates from a population census or household survey. The method will provide rates for 15 or more years prior to the reference time of the data collection operation. It involves processing census or survey records of persons in households to ascertain, for every person under age 15, whether the person's mother is present in the household and, if so, which person the mother is. For more information see section B of chapter V. Person-years lived A person who spends x years in a population during a given time period contributes x person-years lived to the population during this period. Person-years lived in a population during any time period is the sum of person-years lived by all persons who are members of the population at any time during this period. Person-years lived in a population during any time period may also be described as the area under the graph of population size against time for the given period. Person-years lived in a population during a given time period may be approximated by the length of the period, times the average of the beginning and ending population sizes. Person-years may be defined for any subpopulation by regarding the subpopulation as a population in its own right. Population "Population" is a defining concept in both demography and statistics, but denotes very different concepts in the two fields. In both contexts it refers to an aggregate. In demography, however, the aggregate changes over time as new members enter the population and existing members leave the population, whereas in statistics it is static. 1. (Demography) A group of persons whose membership changes with time, where membership is most often defined primarily in terms of geographic location but may be defined in terms of personal characteristics of all kinds, as in "female population" or "population of contraceptive users". 2. (Statistics) ... any collection of objects under consideration, whether animate or inanimate ... (Stuart and Ord 1987, vol. 1, sects. 1.1-1.3). Population register A data set representing the membership and selected characteristics of the persons comprising some population. The records comprising the data set are updated as the membership of the population changes. The content of records in the data set is updated as characteristics of the persons they represent change. Both types of updating may be thought of as being triggered by the occurrence of certain events. In the first case, the events are those which change the membership of the population, entries to or departures from the population. In the second case, the events are changes in the characteristics of persons in the population. See also �event register�. Rate A term used in many ways in demographic studies, but most appropriately applied to the number of events in a given period of time divided by the average population (or appropriate subpopulation) during the period. The word is also used more loosely to refer to the ratio between a subpopulation and the total: for example, the school enrollment rate or literacy rate (Wilson 1985). Register As a verb, the act of recording information about an event that has occurred in the recent past. As a noun, see �event register� and �population register�. Sample A subgroup of a group of persons or events used to represent the characteristics of the group as a whole for statistical purposes. Statistic 1. In common parlance, a number describing some aspect of reality. 2. In the field of statistics, any quantity that may be computed from given data (a statistic is a function of the observations).

106
Tabulation As verb (tabulate), the processing of each record in a data set to ascertain the total number of records in each of several categories; as a noun, a data structure resulting from such tabulation. Total fertility rate A basic indicator of the level of fertility, calculated by summing age-specific birth rates over all reproductive ages. It may be interpreted as the expected number of children a women who survives to the end of the reproductive age span will have during her lifetime if she experiences the given age-specific rates. Underlying cause of death The disease or injury that initiated the train of morbid events leading directly to death or the circumstances of the accident or violence which produced the fatal injury. The underlying cause of death is used as the basis for tabulation of mortality statistics (see also �contributory cause of death�). (Glossary, Principles and Recommendations for a Vital Statistics System, Revision 2, United Nations, 2001b.) Vital event (Civil registration) The occurrence of a live birth, death, foetal death, marriage, divorce, adoption, legitimation, recognition of parenthood, annulment of marriage or legal separation. (Glossary, Principles and Recommendations for a Vital Statistics System, Revision 2, United Nations, 2001b.) Vital event record (Civil registration) A legal document entered in the civil register which attests to the occurrence and characteristics of a vital event. (Glossary, Principles and Recommendations for a Vital Statistics System, Revision 2, United Nations, 2001b.) Weighted sample A sample in which persons or events with particular characteristics have different chances of being included.

107
REFERENCES
Banister, Judith (1979). Census questions on fertility and child mortality: problems with questionnaire design. Asian and Pacific Census Forum vol.6, No. 1.
Bennett, Neil G., and Shiro Horiuchi (1981). Estimating the completeness of death registration in a closed population. Population Index vol. 47, No. 2.
_____________________________ (1984). Mortality estimation from registered deaths in developed countries. Demography vol. 21, No. 2.
Blacker, J. G. C., and J. Mukiza-Gapere (1988). The indirect measurement of adult mortality in Africa. In African Population Conference, Dakar, 1988. Liège, Belgium: International Union for the Scientific Study of Population (IUSSP).
Bongaarts, John, and Robert G. Potter (1983). Fertility, Biology, and Behavior: An Analysis of the Proximate Determinants. New York: Academic Press.
Brass, William (1979). Evaluation of birth and death registration using age distributions and child survivorship data. Asian and Pacific Census Forum vol. 5, No. 3.
____________ (1985). A simple approximation for the time-location of estimates of child mortality from proportions dead by age of mother. In Advances in Methods for Estimating Fertility and Mortality from Limited and Defective Data. Occasional Publication, Centre for Population Studies. London: London School of Hygiene and Tropical Medicine.
Brass, William, and Sheila Macrae (1984). Childhood mortality estimated from reports on previous births given by mothers at the time of a maternity: I. Preceding birth technique. Asian and Pacific Census Forum vol. 11, No. 2.
___________________________ (1985). Childhood mortality estimated from reports on previous births given by mothers at the time of a maternity: II. Adapted multiplier technique. Asian and Pacific Census Forum vol. 11, No. 4.
Casley, D. J., and D. A. Lury (1981). Data Collection in Developing Countries. Oxford, United Kingdom: Clarendon Press.
Chackiel, J., and H. Orellana (1985). Adult female mortality trends from retrospective questions about maternal orphanhood included in censuses and surveys. In International Population Conference, Florence, 1985, vol. 4. Liège, Belgium: International Union for the Scientific Study of Population (IUSSP).
China Population Information Centre (1984). Analysis of China's National One-per-Thousand-Population Fertility Sampling Survey. Beijing: China Population Information Centre.
Cho, Lee-Jay (1976). Introduction to Censuses of Asia and the Pacific: 1970-74. Honolulu: East-West Center.
Cho, Lee-Jay, and Robert L. Hearn (1984). Censuses of Asia and the Pacific: 1980 Round. Honolulu: East-West Center.
Cho, Lee-Jay, Robert D. Retherford and Minja Kim Choe (1986). The Own-Children Method of Fertility Estimation. Honolulu: East-West Center.
Cleland, John (1996). Demographic data collection in less developed countries. Population Studies vol. 50, No. 3.
Cleland, John, and Chris Scott, eds. (1987). World Fertility Survey: An Assessment. Oxford, United Kingdom: Oxford University Press.
Coale, Ansley J. (1984). Construction of a life table from accurate enumeration of a closed population in two censuses. Population Index vol. 50, No. 2.
Coale, Ansley J., Lee-Jay Cho and Noreen Goldman (1980). Estimation of Recent Trends in Fertility and Mortality in the Republic of Korea. Washington, D.C.: National Academy of Sciences.

108
Dechter, Aimée R., and Samuel H. Preston (1991). Age misreporting and its effects on adult mortality estimates in Latin America. United Nations Population Bulletin Nos. 31/32.
Del Tufo, M. V. (1949). A Report on the 1947 Census of Population. Kuala Lumpur: The Government Printer, Federation of Malaya.
El Badry, M. R. (1961). Failure of enumerators to make entries of zero: errors in recording childless cases in population censuses. Journal of the American Statistical Association, vol. 56, no. 296.
Ewbank, D. C. (1981). Age Misreporting and Age-Selective Underenumeration: Sources, Patterns and Consequences for Demographic Analysis. Committee on Population and Demography, Report No. 4. Washington, D.C.: National Academy Press.
Feeney, Griffith (1976). Tabulation of census and survey data on child survivorship. Asian and Pacific Census Newsletter, vol. 3, No. 1.
_____________ (1983). Population dynamics based on birth intervals and parity progression. Population Studies, vol. 37, No. 1.
_____________ (1988). The use of parity progression models in evaluating family planning programmes. In African Population Conference: Dakar 1988, vol. 3, pp. 7.1.17-17.1.30.No. 3. Liège, Belgium: International Union for the Scientific Study of Population.
_____________ (1991). Child survivorship estimation: methods and data analysis. Asian and Pacific Population Forum, vol. 5, Nos. 2-3.
Feeney, Griffith, and Feng, Wang (1993). Parity progression and birth intervals in China. Population and Development Review, vol. 19, No. 1.
Feeney, Griffith and John A. Ross (1984). Analyzing open birth interval distributions. Population Studies, vol. 38, No. 3.
Feeney, Griffith, and Yasuhiko Saito (1985). Progression to first marriage in Japan: 1870-1980. NUPRI Research Paper No. 24, Tokyo: Nihon University, Population Research Institute.
Feeney, Griffith, and Jingyuan Yu (1987). Period parity progression ratio measures of fertility in China. Population Studies, vol. 41, No.3.
Goldfarb, Charles F. (1990). The SGML Handbook. Oxford, United Kingdom: Clarendon Press.
Hanenberg, Robert (1991). The Computation and Analysis of Vital Rates from Demographic Surveys: Using Standard Microcomputer Software. Bangkok: Economic and Social Commission for Asia and the Pacific.
Henry, Louis (1980). Fertility of Marriages: A New Method of Measurement. Population Studies Translation Series, No. 3, Economic and Social Commission for Asia and the Pacific. New York: United Nations. Originally published in 1953 as Fécondité des Mariages: Nouvelle Méthode de Mesure.
Hill, K. (1987). Estimating census and death registration completeness. Asian and Pacific Census Forum, vol. 1, No. 3.
Hill, K., and J. Trussell (1977). Further developments in indirect mortality estimation. Population Studies, vol. 21, No. 2.
Hull, Terence H. (1995). Levels and trends of infant and child mortality in Indonesia, estimated in 1978: a methodological review. In Kecendrungan dan Faktor Penentu Fertilitas dan Mortalitas di Indonesia [Trends and Determinants of Fertility and Mortality in Indonesia], Aris Ananta, ed. Jakarta: Kantor Menteri Negara Kependudukan/BKKBN.
Hull, Terence H., and Sunaryo (1978). Levels and Trends of Infant and Child Mortality in Indonesia. Working Paper 15. Yogyakarta, Indonesia: Universitas Gadjah Mada, Population Institute.
Institute for Resource Development/Macro International (1991). Demographic and Health Surveys World Conference, August 5-7, 1991, Washington, D.C. Columbia, Maryland: Macro International, Inc.
109
Kendall, Maurice, Alan, Stuart and J. Keith Ord (1987). Kendall's Advanced Theory of Statistics, vols. 1 and 2. New York: Oxford University Press.
Luther, Norman Y., and Lee-Jay Cho (1988). Reconstruction of birth histories from census and household survey data. Population Studies, vol. 42, No. 3.
Luther, Norman Y., Neramit Dhanasakdi and Fred Arnold (1986). Consistent Correction of Census and Vital Registration Data for Thailand, 1960-1980. Papers of the East-West Population Institute, No. 103. Honolulu: East-West Center.
Luther, Norman Y., Griffith Feeney and Weimin Zhang (1990). One-child families or a baby boom? Evidence from China's 1987 one-per-hundred survey. Population Studies, vol. 44, No.2.
Macura, Miroslav (1972). Estimates of the completeness of registration of births and infant deaths in Yugoslavia and its main provinces from the late 1940s to 1961. Doctoral dissertation, Princeton University.
Marks, Eli S., William Seltzer and Karol J. Krotki (1974). Population Growth Estimation: A Handbook of Vital Statistics Estimation. New York: The Population Council.
Myanmar Immigration and Population Department (1995). Population Changes and Fertility Survey 1991. Yangon: Ministry of Immigration and Population.
Myanmar Department of Population (1998). Myanmar Fertility and Reproductive Health Survey 1997, Preliminary Report. Yangon: Ministry of Immigration and Population.
National Academy of Sciences (1981). Collecting Data for the Estimation of Fertility and Mortality. Report No. 6, Committee on Population and Demography. Washington, D.C.: National Academy Press.
Preston, Samuel (1980). Estimating adult female mortality from the number of children surviving. Asian and Pacific Census Forum, vol. 6, No. 4.
_____________ (1985). Mortality in childhood: lessons from the WFS. In Reproductive Change in Developing Countries: Insights from the World Fertility Survey, J. G. Cleland and John Hobcraft, eds. London: Oxford University Press.
Retherford, Robert D. and Iqbal Alam (1985). Comparison of fertility trends estimated alternatively from birth histories and own children. Papers of the East-West Population Institute No. 94. Honolulu: East-West Center.
Retherford, Robert D. and others (1987). Fertility trends in Pakistan: The decline that wasn't. Asian and Pacific Population Forum, vol. 1, No. 2.
Retherford, Robert D., and G. Mujtaba Mirza (1982). Evidence of age exaggeration in demographic estimates for Pakistan. Population Studies, vol. 36, No. 2.
Retherford, Robert D., Vinod K. Mishra and G. Prakasam (2000). How Much Has Fertility Declined in Uttar Pradesh? National Family Health Survey Subject Reports, No. 17. Mumbai, India: International Institute for Population Sciences: and Honolulu: East-West Center Population and Health Studies.
Rindfus, Ronald R., and James A. Sweet (1977). Postwar Fertility Trends and Differentials in the United States. New York: Academic Press.
Rutstein, Shea O. (1984). Infant and child mortality: levels, trends and demographic differentials, revised edition. WFS Comparative Studies No. 43. Voorburg, Netherlands: International Statistical Institute.
Saw Swee-Hock (1964). A note on the under-registration of births in Malaya during the intercensal period 1947-1957. Population Studies, vol. 18, No. 1. (July, 1964).
Stupp, Paul W. (1988). Estimating intercensal age schedules by intracohort interpolation. Population Index, vol. 54, No. 2.
Sullivan, Jeremiah M., Shea Oscar Rutstein and George T. Bicego (1994). Infant and child mortality. Demographic and Health Surveys Comparative Studies No. 15. Calverton, Maryland: Macro International, Inc.

110
Timaeus, I. M., Chackiel, J. and Ruzicka, L., eds. (1996). Adult Mortality in Latin America. Oxford: Clarendon Press.
The Unicode Consortium (2000). The Unicode Standard, Version 3.0. Mountain View, California. Available from http://www.unicode.org.
United Nations (1969). Methodology and Evaluation of Population Registers and Similar Systems. Studies in Methods, No. 15. Sales No. E.69.XVII.15.
____________ (1973). Principles and Recommendations for a Vital Statistics System, Revision 1. Sales No. E.73.XVII.9.
____________ (1982). Non-sampling Errors in Household Surveys: Sources, Assessment and Control - Preliminary Version. National Household Survey Capability Programme Technical Study DP/UN/INT-81-041-2.
____________ (1983). Manual X: Indirect Techniques for Demographic Estimation. Population Studies, No. 81. Sales No. E.83.XIII.2.
____________ (1984). Handbook of Household Surveys. Studies in Methods, Series F, No. 31. Sales No. E.83.XVIII.13.
____________ (1985). Development and Design of Survey Questionnaires. National Household Capability Programme. INT-84-014.
____________ (1986). Sampling Frame and Sample Designs for Integrated Household Survey Programs - Preliminary Version. National Household Survey Capability Programme. DP/UN/INT-84-014/5E.
____________ (1993) Sampling Errors in Household Surveys. National Household Capability Programme. INT-92-P80-15E.
____________ (1998a). Principles and Recommendations for Population and Housing Censuses, Revision 1. Sales No. E.98.XVII.8.
____________ (1998b). Handbook on Civil Registration and Vital Statistics Systems: Management, Operation and Maintenance. Sales No. E.98.XXVII.11.
____________ (1998c). Handbook on Civil Registration and Vital Statistics Systems: Preparation of a Legal Framework. Sales No. E.98.XXVII.7.
____________ (1998d). Handbook on Civil Registration and Vital Statistics Systems: Developing Information, Education and Communication. Sales No. E.98.XXVII.4.
____________ (1998e). Handbook on Civil Registration and Vital Statistics Systems: Computerization. Sales No. E.98.XXVII.10.
____________ (1998f). Handbook on Civil Registration and Vital Statistics Systems: Policies and Protocols for the Release and Archiving of Individual Records. Sales No. E.98.XVII.6.
____________ (2000a). Handbook on Census Management for Population and Housing Censuses. Sales No. E.00.XVII.15.
____________ (2000b). Handbook on Geographic Information Systems and Digital Mapping. Sales No. E.00.XVII.12.
____________ (2001a). Handbook on Population and Housing Census Editing. Sales No. E.00.XVII.9.
____________ (2001b). Principles and Recommendations for a Vital Statistics System, Revision 2. Sales No. E.01.XVII.10.
Verma, Vijay (1980). Basic Fertility Measures from Retrospective Birth Histories. World Fertility Survey Technical Bulletins, No. 4/TECH. 1407. The Hague: International Statistical Institute.
Vincent, Paul (1946). L'Utilisation des statistiques des familles. Population, vol.1.

111
Whelpton, Pascal K. (1954). Cohort Fertility: Native White Women in the United States. Princeton, New Jersey: Princeton University Press.
Willcox, Walter F. (1940). Studies in American Demography. New York: Russell and Russell World Health Organization (1993) International Statistical Classification of Diseases and Related Health
Problems, Tenth Revision, vol.2, Instruction Manual. Geneva.

112
INDEX NOTE: Reference numbers refer to paragraphs, not to pages. A abortion, 480, 537 administrative records, data from, 376 adoption, 640, 646 adoption bias, and misreporting of survival of parents, 649 adult mortality, 363, 425, 562 estimating, 574, 641�643 age defined (exact, or age in completed years), 387, glossary codes 98 and 99 for, 388 data on, collected in censuses, 188, 386�391 misreporting of, 393, 408�415, 650 at death, 597, 631 not-stated, 388, 483 questions about, in censuses and surveys, 386�391 tabulations by, 392�393 age distribution errors, 399, 403, 407�419 age groups completed fertility of, 500�505 five-year, 483 open-ended, 483 questions asked of, and age-selective underenumeration, 418 single-year, 484 size of, estimation of, 296�306 tabulations by, 259�261, 305�306, 313 age heaping, 177�178, 410 age-parity-specific birth probabilities, 468�470 age-parity-specific birth rates, 465�467 age-parity tabulations, 452�456; tables 4, 5, 6, 7 age-selection error, in birth histories, 556�559, 598�608; figure 4; table 9 age-selective underenumeration, 416�418 age-specific birth and death rates, 37, 259�261, 357, 362�363, 428 given separately for males and females, 37 age-specific birth rates, 438�440, 503, 508 American Standard Code for Information Exchange (ASCII), 212, 218 anonymization, 199 archives/archiving, 82, 127�139 digital, refreshing of, 137�138 functions served by, 130�133 information technology as affecting, 127�129, 137�139 paper, 139 security and maintenance of, 137�139 what should be archived, 134�136 B balance equation. See demographic equation binary files, 212, 219 birth(s) counts of, 33�35 in the demographic equation, 300�301 estimates of, 383�385, 394�405 in hospitals, 290

113
in a household, 522, 528, 536 information about, 28�30 collecting, 92 multiple (e.g., twins), 520�521 rate of. See birth rates recent, 517�538 estimation, 529�530 quality of data, 531�538 questions that can be asked, 519�524, 534 tabulation of, 525�528 registration of, 241 delayed, 336 underreporting of, explanations for, 328, 531�537 See also events, birth and death birth cohorts calculations by, vs. by age group, 305�306 completed fertility of, 501�505 completeness of registration of, 327, 341 birth histories, 382, 539�559 defined, glossary age-selection errors in, 556�559, 598�608; figure 4; table 9 calculating fertility rates from, 553 fertility and mortality data derived from, 63�64, 187, 579�612 Lexis diagrams for, 586�588, 727�733; figure 2 partial, 548�549 quality of, 554�559, 596�612 reconstruction of, 444�472 estimation procedures, 463�471 quality of, 472 questions asked for, 449 tabulations from, 450�462 reporting errors in, 554�559 sampling errors in, 610�612 tabulations from, 450�451, 551�552, 583�588; table 11 birth-history surveys defined, Glossary planning future activities of, 77 questions about the operations and efficacy of, 64 questions that can be asked, 542�550, 582 birth probabilities, with respect to parity, 468�471 birth rates, 36�40 age-parity-specific, 465�467 age-specific, 438�440, 503, 508 calculating, 356�357, 359, 553 crude, 396 errors in estimating, 554�555 tabulations used for calculation of, 265�266 urban vs. rural areas, 405 See also rates, birth and death birth records, 244�248 items of information recommended for inclusion on, 245�246 bulletin boards, computer, dissemination of data by, 209 C calendar systems, of informants, questions asked in terms of, 389 census. See population censuses

114
census post-enumeration surveys, 157 central (age-period) rates, 466 certifier of cause of death, glossary characteristics changing, fixed, and ambiguous, 319�320, 375�376 misreporting of, 320 childbearing, mean age at, 506 child deaths, underreporting of, 575�576, 615, 632 child mortality rate, 55, 595; table 12 sex differential in, 480, 567�568 children defined as persons under age 15, 421 biological vs. adoptive, 439, 512, 646, 648 and mothers, matching of, 420�442. See also own-children method numbers expected. See fertility rate: total young age misreporting of, 412 children born dead, 477 children deceased, 477, 511 children ever born, 97, 120, 381, 395, 446�447, 452, 473�516 average number of calculating, 498�499 estimating completed fertility from, 504�505 Lexis diagrams for, 723�726 misreporting of, 492 not-stated, 486 other statistics that can be calculated from, 473�474, 489�508 quality of data, 509�516 questions that can be asked, 475�480, 543 redundant, rationale for, 477�479, 511 tabulation of, 481�488; table 8 total number of, 189, 487�488, 499 underreporting of, 509�512 zero, not to be grouped with not-stated, 513�515 children living here or elsewhere, 477 children surviving, 120, 381, 395, 446�447, 477 male vs. female, 567�568 mortality statistics that can be estimated from, 565�578 not-stated, 570�572 quality of data on, 575�578 questions that can be asked, 566�568 tabulation of, 569�572; table 10 total number of, 189 China 1982 One-per-Thousand Population Survey, 540, 542 1990 census, 621, 625 cities and towns classification by, 43 See also urban vs. rural areas citizens living abroad, 310�312 vs. non-citizens, in tabulations, 264, 310�312 civil divisions, major vs. minor, classification by, 43 civil registration, 4�14 defined, 232, glossary archiving of records of, 130, 134

115
completeness of, 108, 282, 324�363 confidentiality of, 199�200 data collection in, 51, 84, 254 data processing for, 106 deadlines for, 336 delayed, 325�327, 338�342 of events. See events, birth and death fertility and mortality data derived from, 28�29, 57�58, 227�378, 563�564,
617 comparisons with census and survey data, 356�359 incomplete indications and estimates of, 352�355 supplemented by censuses and surveys, 563�564 utilization of data from, 342, 348�363 and value of, 274�275 operations of quality control of, 146 questions about the efficacy of, 58 responsibilities of parties in, 239�243 patterns of data in, use of, 360�363 publication programs of, 272�275 publications in which discussed, 19 public awareness of requirements for, 249 quality of content, 108, 276�281, 350�351 and need for estimation, 183�186 matching studies for evaluating, 158 records of, 29, 244�248 legally required information for, 244 statistical processing of, adequacy of, 280 tabulations of data of, 250�272 for analysing operations, 269�270 miscellaneous types, 270�271 trends in completeness of, 343�347 estimating, 344�347 reasons for, 346 usefulness of data from, assessing, 68�72 civil registration systems areas covered by, primary, secondary, and mobile, 240�241 central agencies for, 236�237 functional vs. non-functional, data from, 328�330, 354 history and development of, 233�235 local offices for, recommendations for, 238 planning future activities of, 68�72 recommendations for national systems, 233�235 code books, archiving of, 134 codes, invalid, 117 coding, manual, computer-assisted, and automatic, 110 cohorts. See birth cohorts compilations of births and deaths, 34 See also tabulations completed fertility defined, 500 calculating, 500�505 computer editing, 114�122 computer processing, 81
116
for adjusting incomplete data, 114�122, 358 calculation of rates by, 318 and changes in data collection operations, 669�670 for extracting meaning from files, 219�225 SGML and XML as aid to, 217 tabulations by, 215�217 See also data processing computers and software availability of, and utilization of data sets, 202�203 cost of, 113, 128 for entering information directly (rather than on paper), 104, 113 See also networks, computer confidentiality of data, 199�200, 677�678 consistency checks, 121�122 content vs. markup, 223�224 quality of, 151, 156 counts, of births, deaths, and persons, 33�35 coverage quality of, 150, 154�155, 276�279 estimating, 161 See also net coverage error D data (generally) defined, glossary; box 1 self-documenting, 217 data, fertility and mortality, 140�226 dissemination of, to users, 194�203, 209 evaluation of, 107�109, 143�180 reasons for undertaking, 143�144 incomplete, 348�363 adjustment of, 348�349 multiple sources of, 24. See also data sets, primary and secondary, matching
of evaluating and estimating from, 140 linking, 678 preliminary releasing, 148 quality of, 149�161 relevance and timeliness of, 147�148 sources of birth histories, 63�64, 187 civil registration, 28�29, 57�58, 227�378, 563�564, 617 household surveys, 32, 61�62, 187�190, 283�284, 560�665 population censuses, 31, 59�60, 187�190, 283�284, 384�385, 560�665 time period to which referred, 49�55 types of, that may be required, 27�55 usefulness of, for social planning, 1�3, 67�79 data capture (entry) various methods of, 104, 111�113 verification of accuracy of, 112�113 data collection, 4�17, 51, 84 in an ideal world, 181 importance of fieldwork for, 15�17 methods of, 4�12; table 1

117
assessing the usefulness of data from, and planning of future activities of, 67�79
coordinating, 79 evolving, 666�681 planning, 24�79 quality control of, 144�146 social conditions as affecting, 674�678 technological advances in, 669�670 data collection agencies archives as organizational memory of, 131 review of past activities, as part of planning, 56�66 sharing of information and methods with other agencies, 668, 680�681 data processing, 80�81, 105�126 computerized, 81. See also computer processing manual, 107�110 required operations in, 105�106 tasks performed after computer editing is completed, 126 data sets defined, 149, glossary computerized edit checks performed on, 114�122 dissemination of data in, 197�203 geographic detail of, 203 primary and secondary, matching of, 152�156 quality of content, 151 quality of coverage, 150 sampling of, for public use, 200�201 statistical analysis of, 161 tabulation of, 123�125 specifications for, 124�125 date of birth misreporting of, 554 questions about, 388�391 date of occurrence, 276, 335 vs. date of registration, 251�252, 338�342 tabulations by, 339�341 date of registration, 251�252, 277�278, 335 vs. date of occurrence, 338�342 tabulations by, 339�341 death (generally) defined, glossary cause of, 248, 616 defined, glossary contributory cause of defined, glossary probability of calculating, 589�595; figure 3 rate of. See death rates death(s) counts of, 33�35 in the demographic equation, 300�301 information about, 28�30 collecting, 92 recent household, 613�635 estimation of, 626�627 quality of data, 628�635 questions that can be asked, 618�623; box 3, 4, 5, 6

118
response error, 629�633 selection error, 634�635 tabulation of, 624�625 registration of, 241 delayed, 337 underreporting of, 575�576, 615, 630�633 explanations for, 328 See also deceased persons; events, birth and death death rates, 36�40 age-specific Lexis diagrams for, 703�712 estimate of, 386 tabulations used for calculation of, 265�266 in urban vs. rural areas, 354 See also child mortality rate; infant mortality rate; maternal mortality rate;
rates, birth and death death records, 244�248 items of information recommended for inclusion on, 247�248 deceased persons, and selection bias, 516, 538, 609 demographic analysis method of estimating net coverage error, 161 Demographic and Health Survey (DHS), 21, 208, 541, 580 demographic equation (balance equation), 300�301 defined, glossary demographic equation methods for calculating population size and age group sizes, 300�306 considerations for using, 295, 304�306 demographic research new methods in, 667�668 publications about, 18�23 demographic statistics basic concepts and terms, 33�55 international cooperation as to, 671, 679�681 questions to ask about satisfaction with, 66 standardization of, 679 time or period to which referred, 54�55 Demographic Yearbook , 493 denominators for calculation of rates, 284�308 citizens living abroad and non-citizens included in, 310�312 estimation of, 186 from household surveys, 293�308 from population registers, 365�366 for population subgroups, 321�323 digital formats, 210�226 platform independent, 210 proprietary vs. publicly documented, 211 digital media protection from deterioration or tampering, 137�139 publication via, 206 digital photocopies, 213�216 digital publication, 126, 204�226 via media, 206 via networks, 206�209 offline, with human intervention, 207 online, computer-processed, 207�209 print information converted to, 204�205 dimensions of a tabulation, 124

119
dissemination of data, 194�226 by SGML and XML, 217�226 documentation, archiving of, 134 document-management systems, 217 documents proving date of birth, 390 domain of a tabulation, 124 dual-record systems, 65, 78 E edit checks and edit actions, 114�122 editing. See computer editing; field editing emigrants, registration of, 368�372 entities, defined, 149 enumerators, 85. See also fieldworkers errors correction of, 102 of fieldworkers, 476, 513�515, 532 indications of, 176�178 patterns of, and accuracy of estimation, 166�175 example of, 510 prevention of, 102 estimation, 181�193 defined, 182, glossary accuracy of, 162�175 evaluating, 166�175 dealing with multiple estimates (averaging or fitting), 191�193 �forward� and �backward,� 302 ethnicity, self-reporting of, 319 ethnic minorities, study of, 203 event register, defined, glossary events, birth and death collecting information about, from fieldwork, 83 estimated from incomplete registration data, 342 ever-registered, 326�327 occurring abroad, 310 occurring to non-citizens, 311�312 registration of completeness of, 324�363 delayed, 335�342 selectivity of, 331�334, 349 time requirements for, 243, 336 unregistered, 328�334 exposure to risk, 286�287 defined, glossary Extensible Markup Language (XML), 217�226 sample markup, box 2 extrapolation considerations for using, 295 of population and age group sizes after last census date, 297�299 extremes, method of (Lexis diagrams), 692�694 F father. See survival of father females death rate, 37, 574, 637 at end of reproductive age span

120
omission of birth histories from, 556�559 parity distribution among, 493�494 young age misreporting of, 413 parity misreporting of, 513�515 fertility completed, 500�505 high- and low-fertility populations, 493 summary measures of, 39, 498 fertility and mortality studies, publications about, 18�23 fertility data from censuses and surveys, 380�559 See also data, fertility and mortality fertility rate. See birth rates fertility rate, total. See total fertility rate fertility surveys, 541�542 field editing, 102 fieldwork, 83�104 importance of, 15�17 planning of, steps in, 88�90 fieldworkers errors made by, 476, 513�515, 532 recruitment of, 95�99 supervision of, 86, 100�102 training of, 95�99, 391 file-format specifications, archiving of, 134 file transfer protocol (ftp), dissemination of data by, 209 foetal death, defined, glossary foreign workers, events occurring to, 311�312 forms (schedules, questionnaires), 103�104 collecting and transporting of, to central locations, 87, 103�104 completed, archiving of, 134 computerized, 104, 113 design of, as to wording of questions and layout, 91�94, 99 field testing of, 93�94 training fieldworkers in understanding and filling out, 96�99 future information needs, archives as means of providing for, 132�133 G general household surveys. See household surveys geographic classifications of fertility and mortality data, 41�48 for civil registration, 240�241 defined by administrative units, 44�48 defined by other than administrative units (e.g., by topography), 47�48 degree of detail provided, 42�46, 203 national and subnational rates calculated for, 309�318 tabulations for, 254�258, 303 Geographic Information Systems (GIS) software, 136, 318 geographic location, removal of information about, to preserve confidentiality,
200 H Handbook of Household Surveys, 89 Handbook on Census Management for Population and Housing Censuses, 89,
102, 146

121
Handbook on Civil Registration and Vital Statistics Systems, 231 Handbook on Geographic Information Systems and Digital Mapping, 48, 258,
318 Handbook on the Collection of Fertility and Mortality Data (present
publication), purpose of, 1�3 head of household, 430 question as to, 426 relationship to, 429�436 health conditions, tabulations providing information on, 267�268 HIV/AIDS, 363, 516, 538, 609, 634, 675 hospitals, births in, 290 households births in, 522, 528, 536 deaths in, 613�635 dissolution of, and nonreporting of data, 634�635 information about, 31�32 nuclear vs. extended, 426, 442, 647�648 household samples, 126 household surveys, 4�14 archiving of records of, 134 data collection in, 85 data processing for, 106 denominators for calculation of rates derived from, 293�308 fertility and mortality data and rates derived from, 32, 61�62, 187�190,
283�284, 380�665 planning future activities of, 76 publications in which discussed, 20 quality of content, 281 quality of coverage, 159 questions about the operations and efficacy of, 62 questions that can be asked on, 380�382 response rate, 159 sampling errors in, 126, 180 time of data collection, 52 and imprecision of, 52�53 I immigrants, registration of, 368�372 imputation, 119�120, 122 defined, Glossary individuals. See persons Indonesia, 174 infant deaths, 261, 265, 289, 535, 546�547 underreporting of, 615, 632 infant mortality rate, 40, 55, 266, 289, 595; table 11 age-specific Lexis diagrams for, 708�712 infants age misreporting of, 412 count of, 383 underenumeration of, 417 informants (in civil registration), 84, 239 defined, glossary informing them of their responsibilities, 249 legal designation of, 242 questions asked in terms of calendar systems of, 389

122
information. See data (generally) information, education and communication (IEC) programs, for civil
registration, 249 information technology and archiving operations, 127�129, 137�139 and tabulations, 318 and utilization of data sets, 202�203 See also computers and software intercensal estimates, 384�385 internal migration, 303 unavailability of data for, 315 international cooperation, re demographic statistics, 671, 679�681 International Institute for Population Sciences, 552 international migration, 300, 676 and calculation of rates, 316 in the demographic equation, 300�301 registration of, ideally, 368�372 International Statistical Classification of Diseases and Related Health
Problems, 248 Internet, 670, 681 interpolation, 295 intersections, method of (Lexis diagrams), 695�702 interviewers, 85. See also fieldworkers invalid codes, 117 K Kenya, 510 keyboarding, 111 kinship relations, 431 misreporting of, 441�442 L legal records (created by civil registration systems), 29 vs. statistical records, 29 Lexis diagrams, 682�733 explanation of the method, 683�691 life expectancy at birth, 40 example calculation, 357�358 reasonable figures for, 353 life line, 683 life table, 40 for analysing delayed registration, 342 for calculating reverse-survival factors, 394 line number of mother, 423�426, 442 live birth, defined, glossary M Malawi, 620 Malaya, 1947 census of, 515 male mortality, 37, 637 manual processing, 107�110 manuals, training, 98, 135 Manual X: Indirect Techniques for Demographic Estimation, 190, 505, 573 maps, archiving of, 136 markup, tagged, 223�225 maternal deaths, 289
123
defined, Glossary maternal mortality rate, 289 defined, Glossary mean age at childbearing, defined, Glossary method of extremes (Lexis diagrams), 692�694 method of intersections (Lexis diagrams), 695�702 migration effect on estimates of rates, 397, 402�405 See also internal migration; international migration missing values, 117�120 dealing with, 118�120, 124 modeling methods of estimating population, 307�308 considerations for using, 295, 308 mortality age pattern of, 561, 577, 614 estimates of, from reverse survival calculations, 386 level and trend of, 561, 573�574 summary measures of, 40 See also death (generally) mortality data from birth histories, 579�612 from censuses and surveys, 560�665 from civil registration, 563�564, 617 estimated, 565�578 See also data, fertility and mortality mortality rate. See child mortality rate; death rates; infant mortality rate;
maternal mortality rate mortality selection bias, 516, 538, 609 mother age of, 260, 265 matching with children, 420�442 See also survival of mother multi-round surveys, 65, 78 Myanmar, 622 N Nepal, 174 net coverage error defined, 161 due to difference in place, 291 due to difference in time, 252 networks, computer, 206�209 digital publication via, 206�209 offline vs. online dissemination of data by, 207 newspaper reports, as data source for matching studies, 158 non-citizens, 264, 310�312 non-own-children, 421, 427 not-reported numbers, 322 not-stated codes, 118 numerators for calculation of rates derived from a different source than that of the denominators, 365�366 too small, 317 O older persons, age misreporting of, 414 open ended group, 261, 483

124
100+, 261 optical scanning, 111 organizational memory, archives as, 131 orphanhood data, 636 own-children, 421 own-children method, 420�443 defined, Glossary and birth-history reconstruction, 444�445, 472 data processing for, 126 Lexis diagrams for, 719�722 quality of, 437�443 questions asked in, 422�426 and recent births, 518 and reverse-survival calculations, 420�422 tabulation by age and age of mother, 427�428; table 3 P pages printed vs. digital, 215�216 scrolling of, 216 Pakistan, 170�175; figure I parents. See survival of parents parity defined, 452, glossary distribution of, estimating, 490�494 misreporting of, 513�515 not-stated cases, 491�492 zero, not to be grouped with not-stated, 486, 513�515 parity duration, 457 parity group, open-ended, 485, 499 parity progression, 458�462 parity progression ratio defined, glossary calculating, 495�497 period. See time period period-cohort rates, 465 period completeness of event registration, 324�325 personal identification numbers (PINs), privacy concerns about use of, 678 persons collecting information about, from fieldwork, 83 confidentiality of data about, 199�200, 677�678 counts and tabulations of, 33�35 information about, 30�32 persons living abroad, registration of, 254 person years lived, 286, 294 defined, glossary P/F ratio method, 505, 509, 529 place, classification of (urban vs. rural, etc.), 43, 257 place of occurrence, 253�255, 268, 279, 289�291 place of registration, 253�255, 279 place of residence, 253�255, 268, 279 defined, 292 and calculation of birth and death rates, 288�292 registering changes in, 373�374 planning of fieldwork, 88�90

125
of future data-collection activities, 68�76 planning documents, archiving of, 135 population defined specially in demography vs. in statistics, glossary; box 1 estimation of, 296�306, 308 See also population subgroups population censuses, 4�14 agencies of, 146 archiving of records of, 130, 134 assessing the usefulness of data from, 73�75 confidentiality of, 199�200 data collection in, 85 data processing for, 106 denominators for calculation of rates derived from data from, 293�308 fertility and mortality data and rates derived from, 31, 59�60, 187�190,
283�284, 380�665 household samples created from, 126 planning future activities of, 73�75 publications in which discussed, 18 quality of evaluating, 109, 157 quality control of, 146 quality of content, 281 quality of coverage, 161 questions about the operations and efficacy of, 60 questions that can be asked in, 380�382, 386�391 tabulation of by enumeration districts, 44 by level of geographic detail, 44�48 time of (reference time), 50 population data. See data, fertility and mortality; demographic statistics population projection methods of estimating population, 308 population registers, 12�14, 285 defined, Glossary creating and maintaining, 377�378 idealized operation of, 364�378 publications in which discussed, 22 See also civil registration population subgroups birth and death rates for, 319�323 calculating denominators for, 321�323 characteristics defining ambiguities in, 319�320 registering changes in, 375�376 movements of persons between, effect on estimates, 443 selective registration of events in, 331�334, 349 tabulation of, 263 Portable Document Format (PDF), 213 pregnancy histories, 550 Principles and Recommendations for a Vital Statistics System, 30, 89, 146, 231,
237, 246, 247, 257, 292 Principles and Recommendations for Population and Housing Censuses, 31, 89,
157 printed publications converted to digital format, 204�205, 215�216 dissemination of data in, 196

126
generating copy for, 126 replaced by digital photocopies (e.g., PDF), economics of, 214 privacy concerns, 199�200, 677�678 probability, defined specially in demographics, 468 processing. See data processing public, educating it as to requirements for registration, 249 publication programs of civil registration, 272�275 when to initiate, 273 of tabulations, 215�216, 272�275 publicly released information, archiving of, 130, 134 public use samples, 201 Q questionnaires, 103. See also forms questions appearing on census and survey forms, desirable number of, 479 R rate, defined, glossary rates, birth and death, 36�40 age-specific, 37, 259�261, 357, 362�363, 428 calculation of migration and, 316, 397, 402�405 using civil registration data, 282�323 at the national level, 309�313 for population subgroups, 319�323 for single years of age, 313 specific to age and to other characteristics, 37�38 at the subnational level, 314�318, 373�374 summary measures computed from, 39�40 trends in, 361 unreasonable, indicating incomplete registration, 353�355 See also birth rates; death rates record defined, 149 of civil registration, 244�248 legal vs. statistical, 29 record-matching studies, 152�156, 351 reference period error, 533 reference person, 253, 430 reference time, 50 refugees, 676 events occurring to, 311�312 register, defined, glossary registrars, 84, 239 registration. See civil registration re-interview surveys, 160 relation to head of household, 429�436 relevance of data, 147 reproductive age span, 260 completed fertility at end of, 500, 556�559 parity distribution of women who have completed, 493�494 re-purposing systems, 217 respondents (in censuses and surveys), 85 retrospective time series, evaluating estimates by, 169�175 reverse-survival calculations, 383�419

127
Lexis diagrams for, 713�718 and own-children method, 420�422 quality of, 398�406 assessing, 406 reverse-survival factors bias in, 400�401, 403 calculation of, 394�395 S sample data sets, for public use, 200�201 sampling defined, glossary to preserve confidentiality, 200 sampling error, 179�180 schedule, 103. See also forms search engines, 221 selection bias, 164�165 by excluding deceased persons, 516, 538, 609, 634�635 self-documenting data, 217 self-enumeration, 85 separation factor, 687 sex, tabulations by, 392�393 sex ratios, at birth, 480, 537 siblings. See survival of siblings sketch maps, archiving of, 136 software. See computers and software spreadsheet programs, 358 Standard Generalized Markup Language (SGML), 217�226 standards, enforcement of, 217 statistical aggregate, defined, 149; box 1 statistical records, 29�30 statistical terminology, box 1 statistics defined, glossary; box 1 basic, of demography, 33�55 stillbirths, 550 structure checks, 115�116 subnational geographic areas, 403�405 calculating rates for, 314�318, 373�374 tabulations for, 254�258, 263, 303 supervisors, training of, 101 surveys. See census post-enumeration surveys; household surveys; multi-round
surveys survival of father, 425 survival of mother, 424 survival of parents, 636�651 misreporting of, 645�649 quality of data from, 644�651 questions that can be asked, 637�638 selection error in, 649 tabulation of, 639�640 survival of siblings, 652�665 calculation of, 660 quality of data, 661�665 questions that can be asked, 653�658 response error, 661�663

128
selection error, 664�665 tabulation of, 659 systematic, defined, box 1 T tabulations, 123�125 defined, glossary age-specific, 259�261, 313 based on date of occurrence vs. date of registration, 251�252, 339�341 based on place of occurrence or place of residence vs. place of registration,
253�255 computer processing of, 215�217 dimension and domain of, 124 examples and types of, 262�272 for national and subnational geographic areas, 254�258, 263 online, on demand, 208 of persons, by their characteristics, 35 for population subgroups, 263 publication of, 272�275 page-oriented vs. digital dissemination, 215�216 by sex and age, 392�393 tags, 223�224 Tanzania, 619 technical documentation, archiving of, 134 text files, 212, 218�225 extracting meaning from, 219�225 markup of, by XML or SGML tags, 223�225 timeliness of data, 148 time period net coverage error due to difference in, 252 registration of events occurring during, completeness of, 324�325 to which fertility and mortality data is referred, 49�55 total fertility rate, 39 defined, glossary calculating, 506�507 training manuals, 98 archiving of, 135 truncation points of a tabulation, 124 U underenumeration, age-selective, 416�418 underlying cause of death, defined, glossary Unicode Worldwide Character Standard, 212 urban vs. rural areas birth and death rates in, 354, 405 classification by, 43 and functionality of civil registration systems, 330, 354 migration between, 404�405 users consulting with on usefulness of data, 195, 671�673 when planning data collection operations, 147 dissemination of data to, 194�195 V visitors, events occurring to, 311�312

129
vital event, defined, glossary vital event record, defined, glossary vital statistics. See demographic statistics vital statistics operations, quality control of, 146 W weighted sample, defined, glossary women. See females World Fertility Survey (WFS), 21, 541, 580 World Wide Web, dissemination of data by, 209 X XML, 217�226 Y younger persons, mortality of, 562. See also child mortality rate; females: death
rate; infant mortality rate