serial killer statistics - fgcuskdb.fgcu.edu/public/serial killer statistics 19oct2013.pdf ·...
TRANSCRIPT

Serial Killer Statistics The tables in this report are based on information from the Radford University/FGCU Serial Killer Database. The purpose of the database is to gather data so that researchers and teachers will have accurate information about serial killers. In 2012, Radford University partnered with Florida Gulf Coast University to ensure that the database is continually updated and that summary reports will be made available on an annual basis. When citing information from this report, the following reference should be used: Aamodt, M. G. (2013, October 19). Serial killer statistics. Retrieved (insert date of retrieval) from http://maamodt.asp.radford.edu/serial killer information center/project description.htm Questions about the database or the statistics in this report can be addressed to Dr. Mike Aamodt at Radford University, [email protected]
1
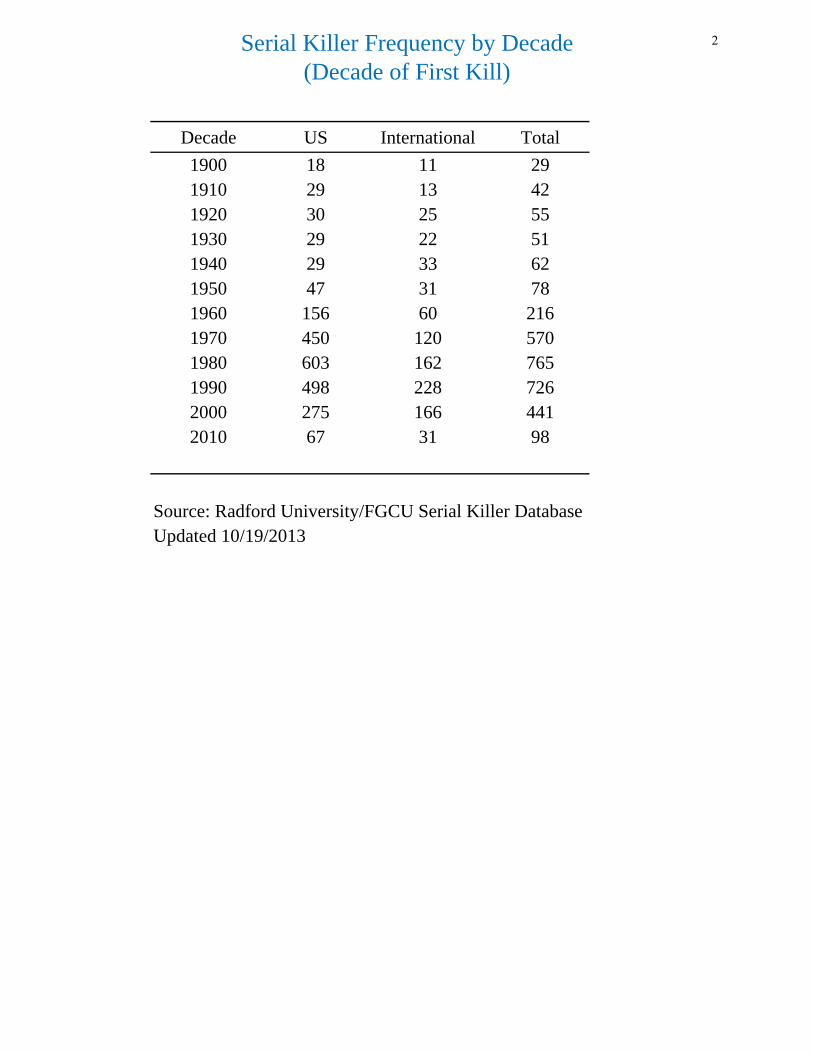
Serial Killer Frequency by Decade(Decade of First Kill)
Decade US International Total
1900 18 11 291910 29 13 421920 30 25 551930 29 22 511940 29 33 621950 47 31 781960 156 60 2161970 450 120 5701980 603 162 7651990 498 228 7262000 275 166 4412010 67 31 98
Source: Radford University/FGCU Serial Killer DatabaseUpdated 10/19/2013
2
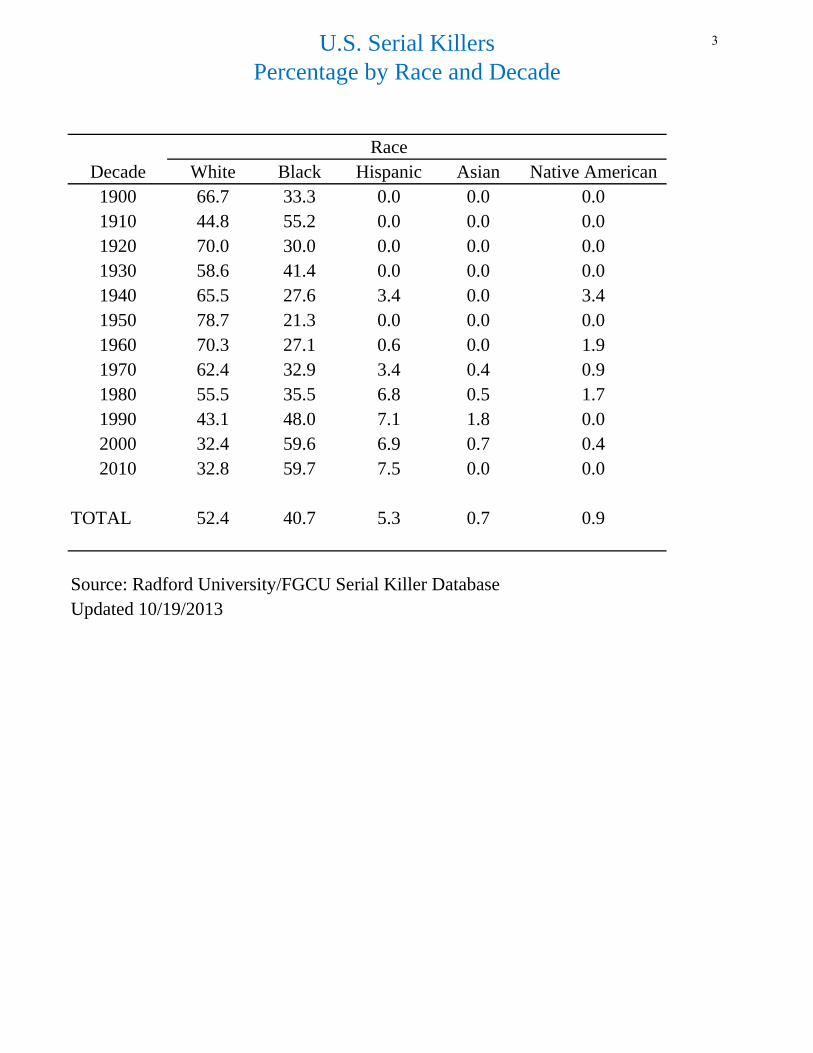
U.S. Serial KillersPercentage by Race and Decade
RaceDecade White Black Hispanic Asian Native American1900 66.7 33.3 0.0 0.0 0.01910 44.8 55.2 0.0 0.0 0.01920 70.0 30.0 0.0 0.0 0.01930 58.6 41.4 0.0 0.0 0.01940 65.5 27.6 3.4 0.0 3.41950 78.7 21.3 0.0 0.0 0.01960 70.3 27.1 0.6 0.0 1.91970 62.4 32.9 3.4 0.4 0.91980 55.5 35.5 6.8 0.5 1.71990 43.1 48.0 7.1 1.8 0.02000 32.4 59.6 6.9 0.7 0.42010 32.8 59.7 7.5 0.0 0.0
TOTAL 52.4 40.7 5.3 0.7 0.9
Source: Radford University/FGCU Serial Killer DatabaseUpdated 10/19/2013
3
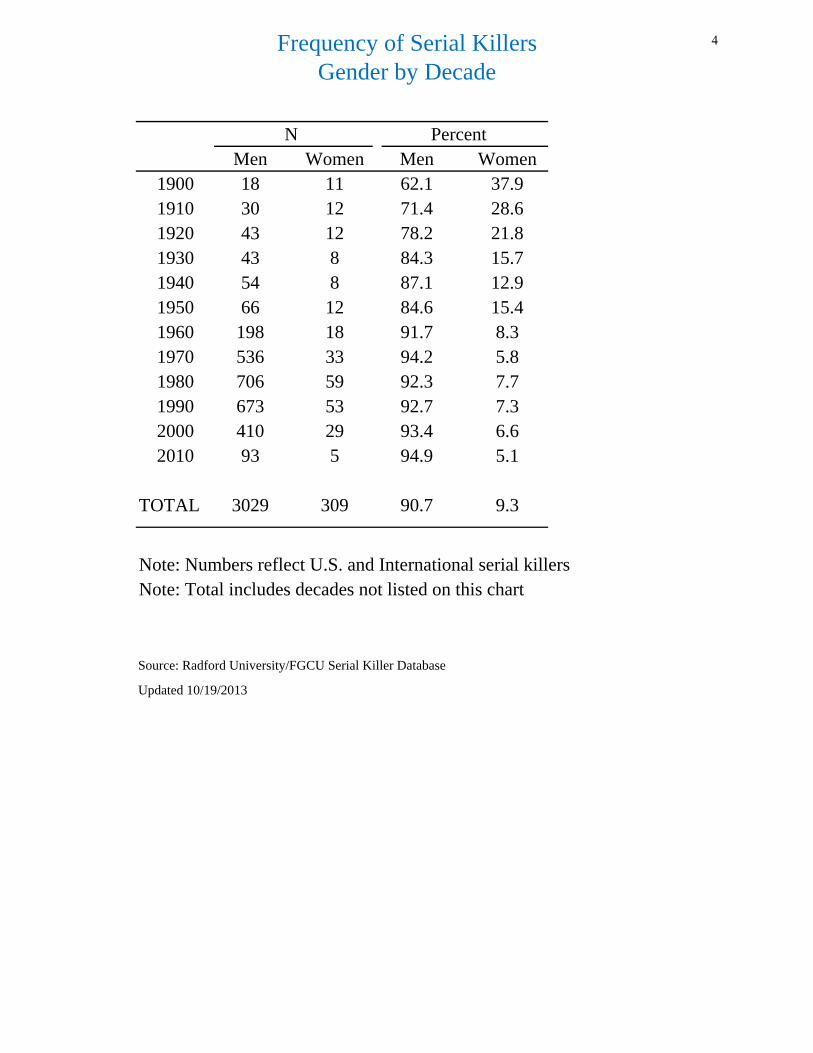
Frequency of Serial KillersGender by Decade
N PercentMen Women Men Women
1900 18 11 62.1 37.91910 30 12 71.4 28.61920 43 12 78.2 21.81930 43 8 84.3 15.71940 54 8 87.1 12.91950 66 12 84.6 15.41960 198 18 91.7 8.31970 536 33 94.2 5.81980 706 59 92.3 7.71990 673 53 92.7 7.32000 410 29 93.4 6.62010 93 5 94.9 5.1
TOTAL 3029 309 90.7 9.3
Note: Numbers reflect U.S. and International serial killersNote: Total includes decades not listed on this chart
Source: Radford University/FGCU Serial Killer Database
Updated 10/19/2013
4
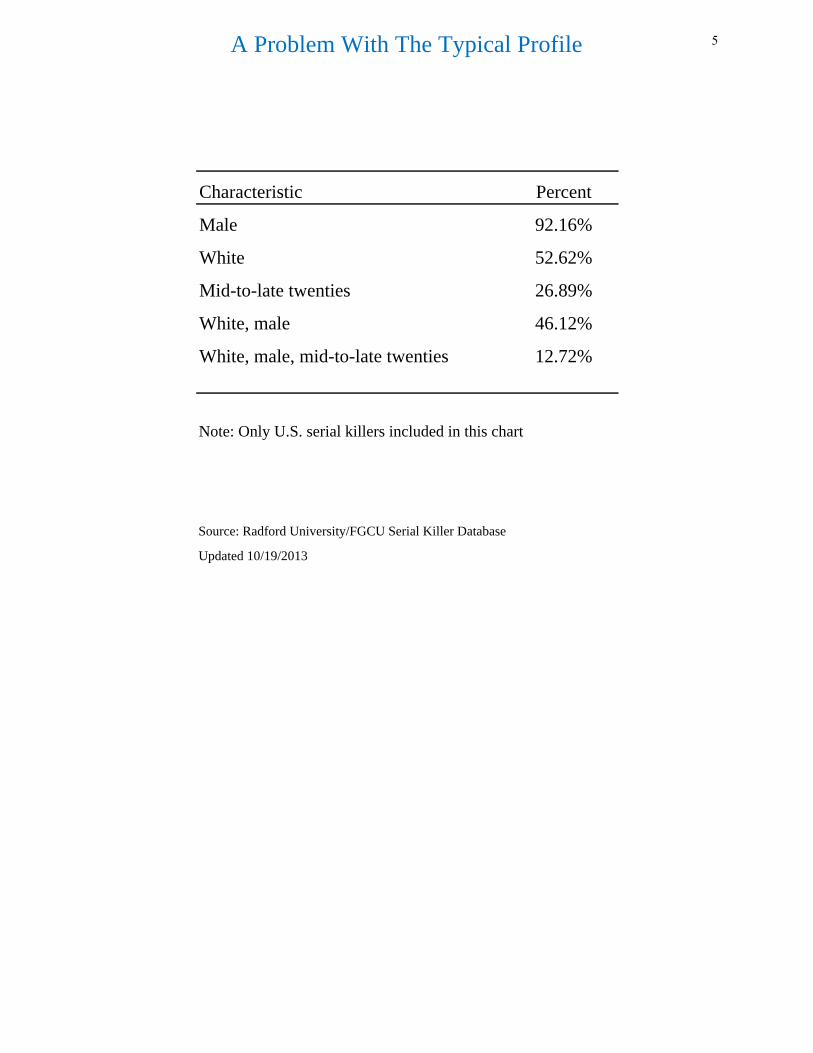
A Problem With The Typical Profile
Characteristic Percent
Male 92.16%
White 52.62%
Mid-to-late twenties 26.89%
White, male 46.12%
White, male, mid-to-late twenties 12.72%
Note: Only U.S. serial killers included in this chart
Source: Radford University/FGCU Serial Killer Database
Updated 10/19/2013
5
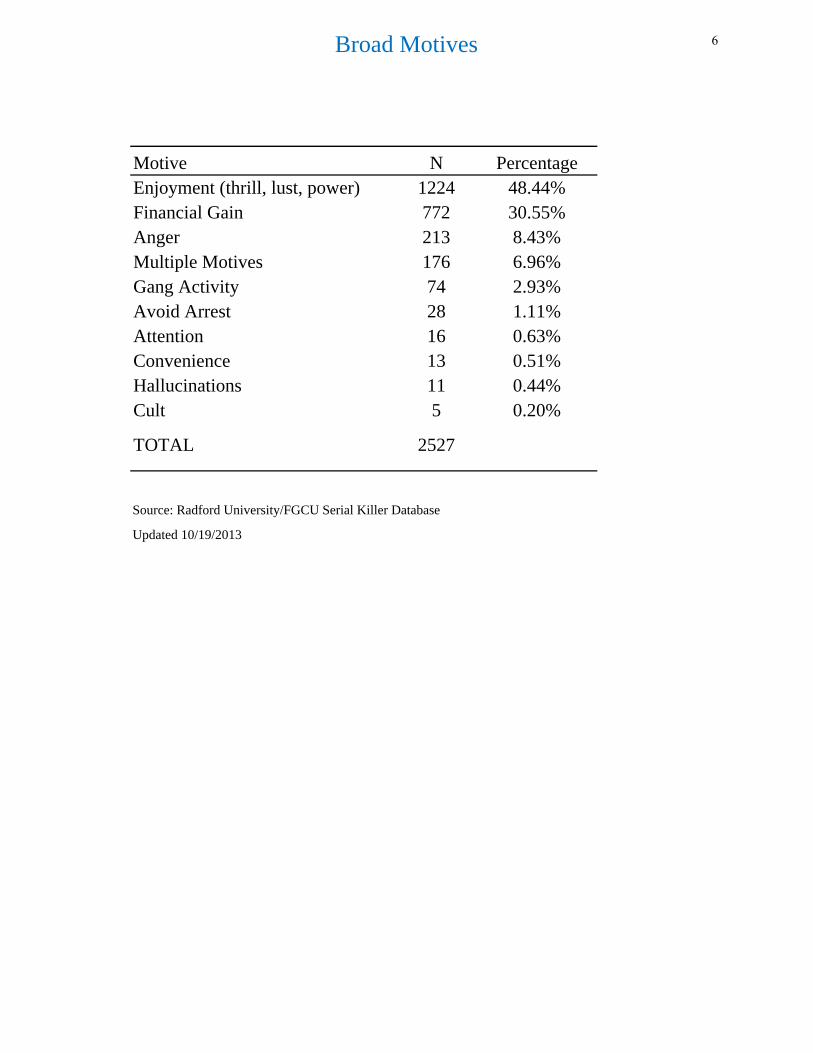
Broad Motives
Motive N PercentageEnjoyment (thrill, lust, power) 1224 48.44%Financial Gain 772 30.55%Anger 213 8.43%Multiple Motives 176 6.96%Gang Activity 74 2.93%Avoid Arrest 28 1.11%Attention 16 0.63%Convenience 13 0.51%Hallucinations 11 0.44%Cult 5 0.20%
TOTAL 2527
Source: Radford University/FGCU Serial Killer Database
Updated 10/19/2013
6
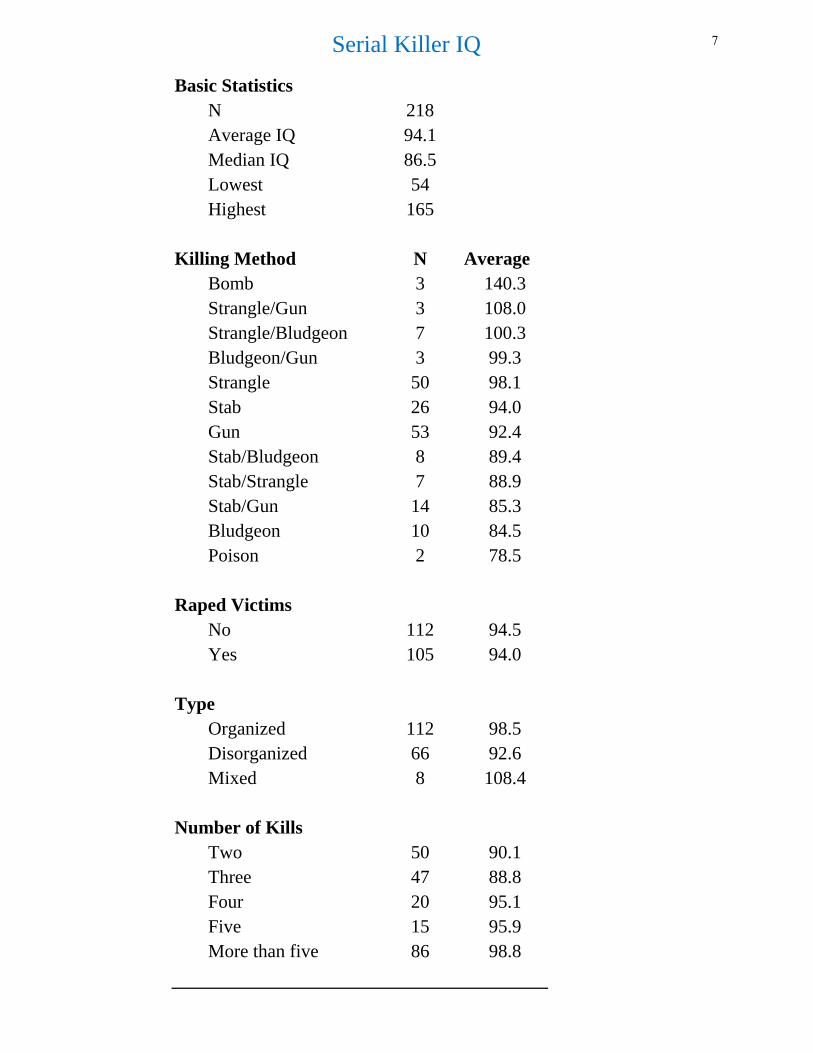
Serial Killer IQ
Basic StatisticsN 218Average IQ 94.1Median IQ 86.5Lowest 54Highest 165
Killing Method N AverageBomb 3 140.3Strangle/Gun 3 108.0Strangle/Bludgeon 7 100.3Bludgeon/Gun 3 99.3Strangle 50 98.1Stab 26 94.0Gun 53 92.4Stab/Bludgeon 8 89.4Stab/Strangle 7 88.9Stab/Gun 14 85.3Bludgeon 10 84.5Poison 2 78.5
Raped Victims No 112 94.5
Yes 105 94.0
Type Organized 112 98.5
Disorganized 66 92.6Mixed 8 108.4
Number of KillsTwo 50 90.1Three 47 88.8Four 20 95.1Five 15 95.9More than five 86 98.8
7

Serial Killer IQ
Source: Radford University/FGCU Serial Killer DatabaseUpdated 10/19/2013
8
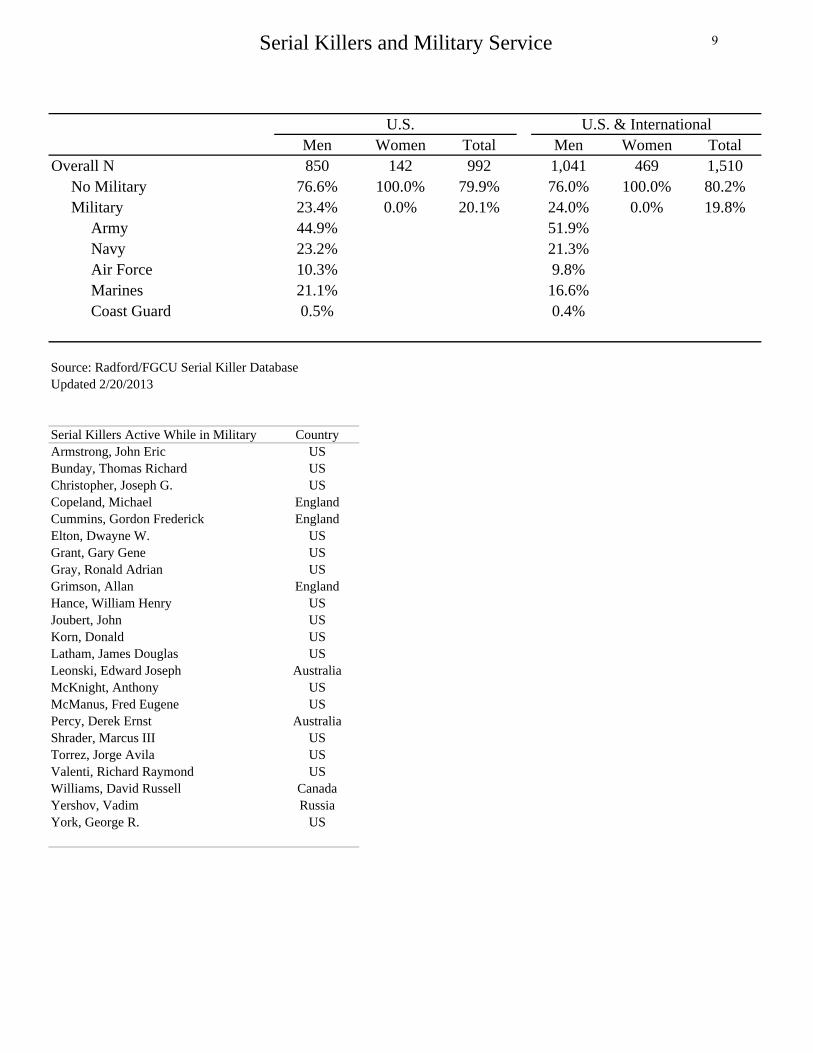
Serial Killers and Military Service
U.S. U.S. & InternationalMen Women Total Men Women Total
Overall N 850 142 992 1,041 469 1,510 No Military 76.6% 100.0% 79.9% 76.0% 100.0% 80.2% Military 23.4% 0.0% 20.1% 24.0% 0.0% 19.8% Army 44.9% 51.9% Navy 23.2% 21.3% Air Force 10.3% 9.8% Marines 21.1% 16.6% Coast Guard 0.5% 0.4%
Source: Radford/FGCU Serial Killer DatabaseUpdated 2/20/2013
Serial Killers Active While in Military CountryArmstrong, John Eric USBunday, Thomas Richard USChristopher, Joseph G. USCopeland, Michael EnglandCummins, Gordon Frederick EnglandElton, Dwayne W. USGrant, Gary Gene USGray, Ronald Adrian USGrimson, Allan EnglandHance, William Henry USJoubert, John USKorn, Donald USLatham, James Douglas USLeonski, Edward Joseph AustraliaMcKnight, Anthony USMcManus, Fred Eugene USPercy, Derek Ernst AustraliaShrader, Marcus III USTorrez, Jorge Avila USValenti, Richard Raymond USWilliams, David Russell CanadaYershov, Vadim RussiaYork, George R. US
9
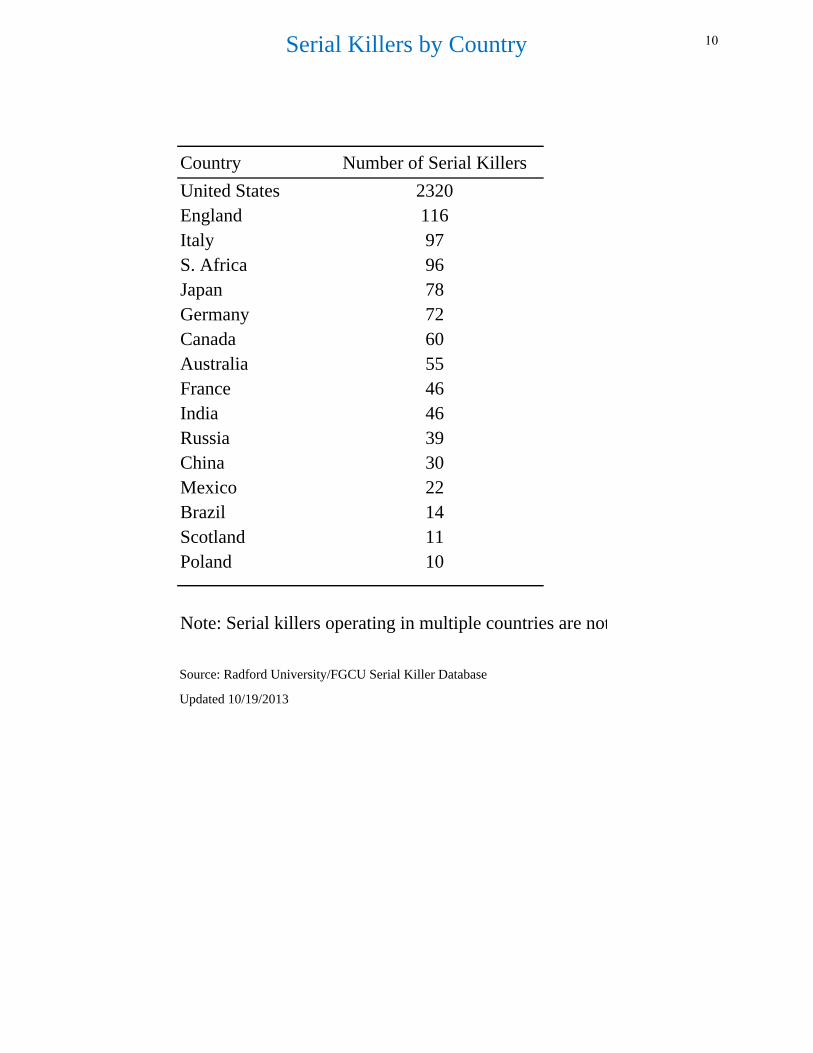
Serial Killers by Country
Country Number of Serial Killers
United States 2320England 116Italy 97S. Africa 96Japan 78Germany 72Canada 60Australia 55France 46India 46Russia 39China 30Mexico 22Brazil 14Scotland 11Poland 10
Note: Serial killers operating in multiple countries are not
Source: Radford University/FGCU Serial Killer Database
Updated 10/19/2013
10
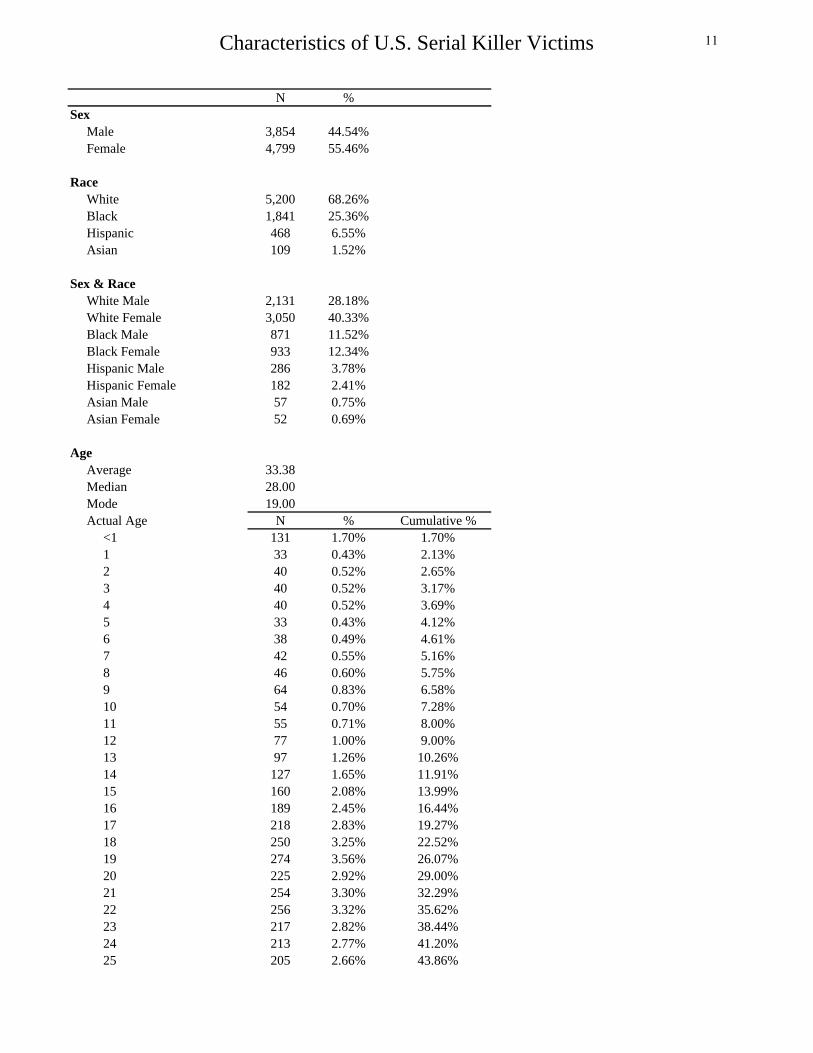
Characteristics of U.S. Serial Killer Victims
N %Sex Male 3,854 44.54% Female 4,799 55.46%
Race White 5,200 68.26% Black 1,841 25.36% Hispanic 468 6.55% Asian 109 1.52%
Sex & Race White Male 2,131 28.18% White Female 3,050 40.33% Black Male 871 11.52% Black Female 933 12.34% Hispanic Male 286 3.78% Hispanic Female 182 2.41% Asian Male 57 0.75% Asian Female 52 0.69%
Age Average 33.38 Median 28.00 Mode 19.00 Actual Age N % Cumulative % <1 131 1.70% 1.70% 1 33 0.43% 2.13% 2 40 0.52% 2.65% 3 40 0.52% 3.17% 4 40 0.52% 3.69% 5 33 0.43% 4.12% 6 38 0.49% 4.61% 7 42 0.55% 5.16% 8 46 0.60% 5.75% 9 64 0.83% 6.58% 10 54 0.70% 7.28% 11 55 0.71% 8.00% 12 77 1.00% 9.00% 13 97 1.26% 10.26% 14 127 1.65% 11.91% 15 160 2.08% 13.99% 16 189 2.45% 16.44% 17 218 2.83% 19.27% 18 250 3.25% 22.52% 19 274 3.56% 26.07% 20 225 2.92% 29.00% 21 254 3.30% 32.29% 22 256 3.32% 35.62% 23 217 2.82% 38.44% 24 213 2.77% 41.20% 25 205 2.66% 43.86%
11
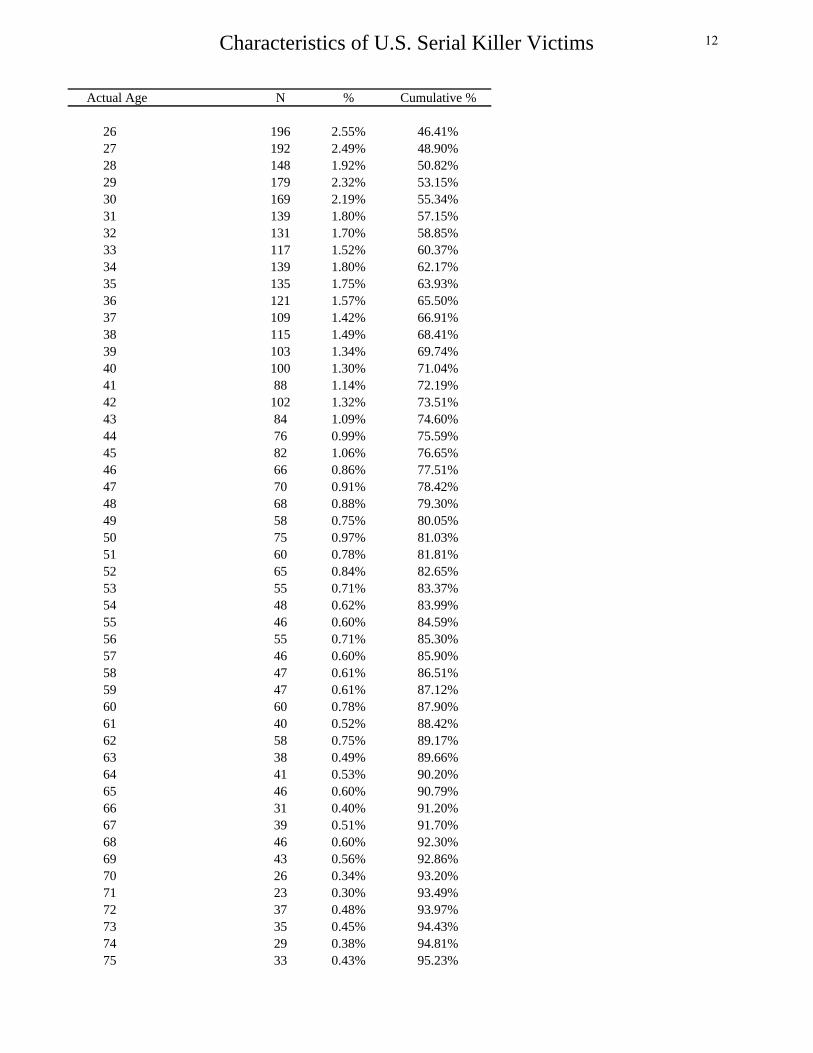
Characteristics of U.S. Serial Killer Victims
Actual Age N % Cumulative %
26 196 2.55% 46.41% 27 192 2.49% 48.90% 28 148 1.92% 50.82% 29 179 2.32% 53.15% 30 169 2.19% 55.34% 31 139 1.80% 57.15% 32 131 1.70% 58.85% 33 117 1.52% 60.37% 34 139 1.80% 62.17% 35 135 1.75% 63.93% 36 121 1.57% 65.50% 37 109 1.42% 66.91% 38 115 1.49% 68.41% 39 103 1.34% 69.74% 40 100 1.30% 71.04% 41 88 1.14% 72.19% 42 102 1.32% 73.51% 43 84 1.09% 74.60% 44 76 0.99% 75.59% 45 82 1.06% 76.65% 46 66 0.86% 77.51% 47 70 0.91% 78.42% 48 68 0.88% 79.30% 49 58 0.75% 80.05% 50 75 0.97% 81.03% 51 60 0.78% 81.81% 52 65 0.84% 82.65% 53 55 0.71% 83.37% 54 48 0.62% 83.99% 55 46 0.60% 84.59% 56 55 0.71% 85.30% 57 46 0.60% 85.90% 58 47 0.61% 86.51% 59 47 0.61% 87.12% 60 60 0.78% 87.90% 61 40 0.52% 88.42% 62 58 0.75% 89.17% 63 38 0.49% 89.66% 64 41 0.53% 90.20% 65 46 0.60% 90.79% 66 31 0.40% 91.20% 67 39 0.51% 91.70% 68 46 0.60% 92.30% 69 43 0.56% 92.86% 70 26 0.34% 93.20% 71 23 0.30% 93.49% 72 37 0.48% 93.97% 73 35 0.45% 94.43% 74 29 0.38% 94.81% 75 33 0.43% 95.23%
12
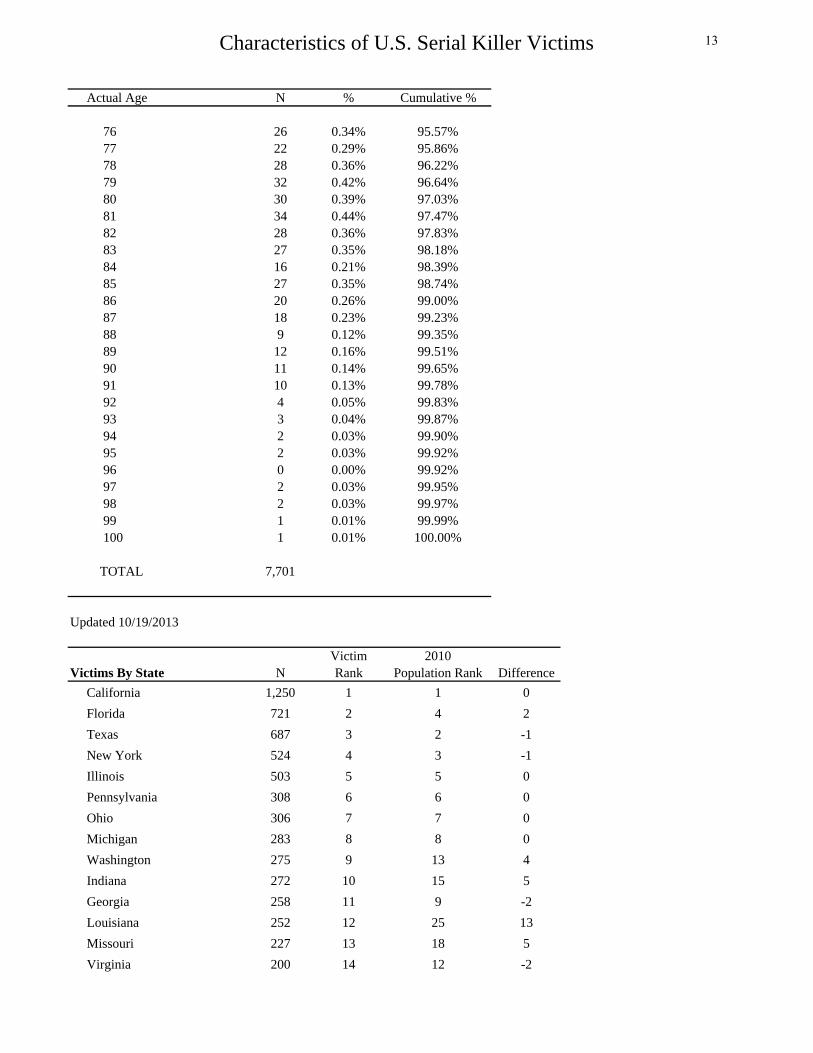
Characteristics of U.S. Serial Killer Victims
Actual Age N % Cumulative %
76 26 0.34% 95.57% 77 22 0.29% 95.86% 78 28 0.36% 96.22% 79 32 0.42% 96.64% 80 30 0.39% 97.03% 81 34 0.44% 97.47% 82 28 0.36% 97.83% 83 27 0.35% 98.18% 84 16 0.21% 98.39% 85 27 0.35% 98.74% 86 20 0.26% 99.00% 87 18 0.23% 99.23% 88 9 0.12% 99.35% 89 12 0.16% 99.51% 90 11 0.14% 99.65% 91 10 0.13% 99.78% 92 4 0.05% 99.83% 93 3 0.04% 99.87% 94 2 0.03% 99.90% 95 2 0.03% 99.92% 96 0 0.00% 99.92% 97 2 0.03% 99.95% 98 2 0.03% 99.97% 99 1 0.01% 99.99% 100 1 0.01% 100.00%
TOTAL 7,701
Updated 10/19/2013
Victim 2010Victims By State N Rank Population Rank Difference
California 1,250 1 1 0
Florida 721 2 4 2
Texas 687 3 2 -1
New York 524 4 3 -1
Illinois 503 5 5 0
Pennsylvania 308 6 6 0
Ohio 306 7 7 0
Michigan 283 8 8 0
Washington 275 9 13 4
Indiana 272 10 15 5
Georgia 258 11 9 -2
Louisiana 252 12 25 13
Missouri 227 13 18 5
Virginia 200 14 12 -2
13
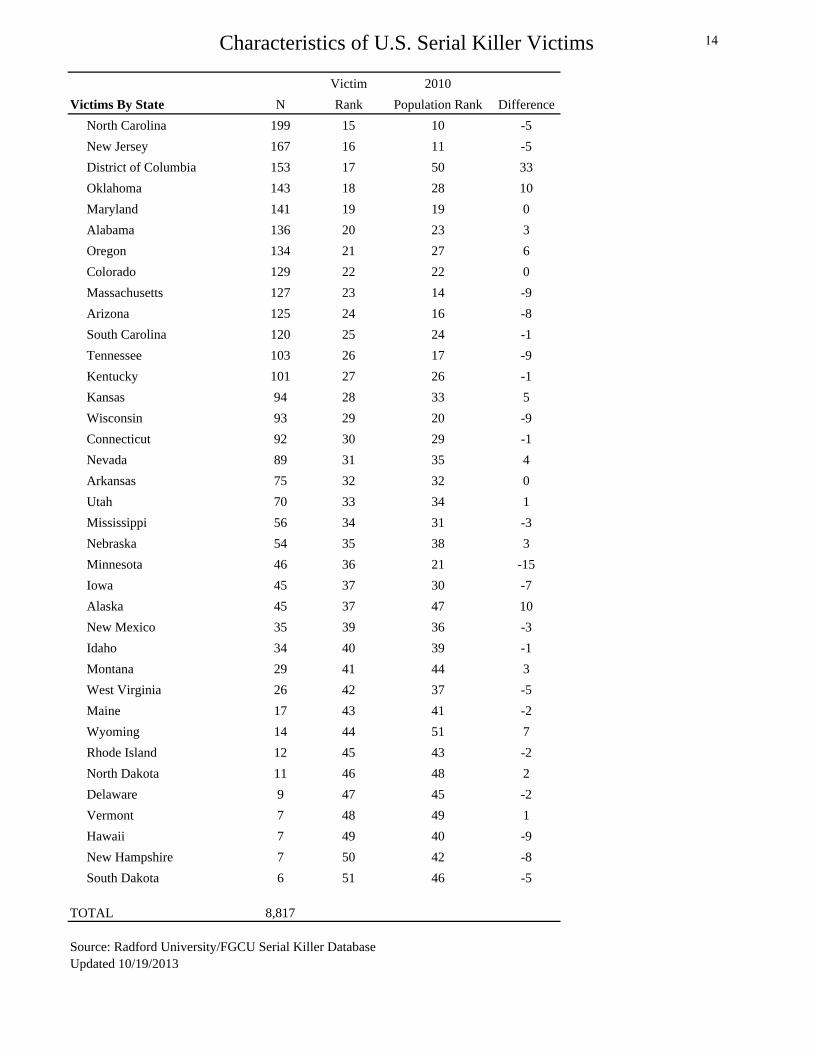
Characteristics of U.S. Serial Killer Victims
Victim 2010
Victims By State N Rank Population Rank Difference
North Carolina 199 15 10 -5
New Jersey 167 16 11 -5
District of Columbia 153 17 50 33
Oklahoma 143 18 28 10
Maryland 141 19 19 0
Alabama 136 20 23 3
Oregon 134 21 27 6
Colorado 129 22 22 0
Massachusetts 127 23 14 -9
Arizona 125 24 16 -8
South Carolina 120 25 24 -1
Tennessee 103 26 17 -9
Kentucky 101 27 26 -1
Kansas 94 28 33 5
Wisconsin 93 29 20 -9
Connecticut 92 30 29 -1
Nevada 89 31 35 4
Arkansas 75 32 32 0
Utah 70 33 34 1
Mississippi 56 34 31 -3
Nebraska 54 35 38 3
Minnesota 46 36 21 -15
Iowa 45 37 30 -7
Alaska 45 37 47 10
New Mexico 35 39 36 -3
Idaho 34 40 39 -1
Montana 29 41 44 3
West Virginia 26 42 37 -5
Maine 17 43 41 -2
Wyoming 14 44 51 7
Rhode Island 12 45 43 -2
North Dakota 11 46 48 2
Delaware 9 47 45 -2
Vermont 7 48 49 1
Hawaii 7 49 40 -9
New Hampshire 7 50 42 -8
South Dakota 6 51 46 -5
TOTAL 8,817
Source: Radford University/FGCU Serial Killer DatabaseUpdated 10/19/2013
14