seri advanced and innovative wind energy concepts · pdf file2.1 conceptual design of an efd...
TRANSCRIPT

SERI/TP-211-1984UC Category: 60DE83011960
The SERI Advanced andInnovative Wind EnergyConcepts Program
Richard L. MitchellEric W. Jacobs
June 1983
Presented at the 1983 Annual Meeting of theAmerican Solar Energy SocietyMinneapolis, Minnesota1-3 June 1983
Prepared under Task No. 1067.10WPA No. 171
Solar Energy Research InstituteA Division of Midwest Research Inst itute
1617 Cole BoulevardGolden, Co lorado 80401
Prepared for the
U.S. Department of EnergyContract No. EG-77-C-'01 -4042
Printed in the United States of AmericaAvailable from:
National Technical Information ServiceU.S. Department of Commerce
5285 Port Royal RoadSpringfield, VA 22161
Price :Microfiche $4.50
Printed Copy $ 7.00
NOTICE
This report was prepared as an account of work sponsored by the United StatesGovernment. Neither the United States nor the United States Department of Energy,nor any of their employees, nor any of their contractors, subcontractors, or theiremployees, makes any warranty, express or implied, or assumes any legal liabilityor responsibility for the accuracy, completeness or usefulness of any information,apparatus, product or process disclosed, or represents that its use would notinfringe privately owned rights.
SERI/TP-1984
THE SERI ADVANCED AND INNOVATIVEWIND ENERGY CONCEPTS PROGRAM
RichardL. MitchellEric W. Jacobs
Solar Energy Research Institute1617 Cole BoulevardGolden, CO 80401
ABSTRACT
In 1978 the Solar Energy Research Institute(SERI) was given the responsibility of managingthe Advanced and Innovative Wind EnergyConcepts (AIWEC) Task by the U.S. Departmentof Energy (DOE). The objective of this programhas been to determine the technical andeconomic potential of advanced wind energyconcepts. Assessment and R&D efforts in the
.AIWEC program have included theoreticalperformance analyses, wind tunnel testing,and/or costing studies. Concepts demonstratingsufficient potential undergo prototype testing ina Proof-of-Concept research phase. Severalconcepts, such as the Dynamic Inducer, theDiffuser Augmented Wind Turbine, theElectrofluid Dynamic Wind-Driven Generator,the Passive - Cyclic Pitch concept, and higherperformance airfoil configurations for verticalaxis wind turbines, have recently madesignificant progress. The latter has currentlyreached the Proof-of-Concept phase. Thepresent paper provides an overview of thetechnical progress and current st at us of theseconcepts.
1. INTRODUCTION
The Advanced and Innovative Wind EnergyConcepts (AIWEC) program at the Solar EnergyResearch Institute (SERI) has been responsiblefor supporting the research and development(R&D) of innovative wind energy concepts sinceFY 1978. The origins of the AIWEC program canbe traced through the Department of Energy(DOE) and the Energy Research and DevelopmentAdministration (ERDA) to the National ScienceFoundation (NSF). The program objective hasbeen to determine the potential of AIWEC fortechnically and economically viable wind energyconversion.
Other than necessary in-house technical support,the research conducted under the AIWECprogram has been performed on a subcontractbasis by private companies and universities.These R&D efforts have incorporated preliminarytechnical and cost assessments, theoreticalanalyses, experimental studies, conceptual
designs, and detailed cost studies of AIWEC. Theconcepts investigated by the program haveincluded higher performance airfoils forDarrieus-type vertical axis wind turbines(V AWT), diffuser augmentation, vortexaugmentation, electrofluld dYnamics, Magnusrotor systems, energy from humid air, dynamicinducers, oscillating vanes, passive cyclic pitchvariation with automatic furl or yaw control, andtethered high altitude wind energy systems.
The final phase of R&D in the AIWEC program isthe Proof-of-Concept testing of a prototype toverify the technical feasibility of a promisingconcept. A number of AIWEC have shown sometechnical and economic potential and the PassiveCyclic Pitch concept has reached the Proof-ofConcept phase. The status of R&D on thePassive Cyclic Pitch concept and four otherpromising AIWEC, (i.e ., the Diffuser AugmentedWind Turbine (DAWT) the Electrofluid Dynamic(EFD) wind-driven generator, and the DynamicInducer (DI), and higher perforrnenee :airfoilconfigurations for VAWT) is the topic of thepresent paper. Each of these concepts has, to avarying degree, shown some potential for cost-competitive wind energy conversion. An .assessment of another technically promisingconcept, tethered wind energy systems, can befound in Reference 1.
Z. THE ELECTROFLUID DYNAMIC (EFD)WIND-DRIVEN GENERATOR
The basic principle behind the EFD concept is theuse of an aerosol particle as the active elementin a drag type Wind Energy Conversion System(WECS). These particles-liquid droplets orhollow spheres (bubblesl-eare charged and carriedby the wind into an electrical field. This fieldexerts an electrical force on the particles that isopposite to the wind direction. In overcomingthe electrical force, the particles extract thekinetie' energy from the wind through the dragforce exerted on them. Unlike a conventional
. lYECS that uses a mechanical coupling betweenthe active elements and the generator, the EFDgenerator uses an electrical field coupling. Anadvantage of this arrangement is that it requiresa minimum of moving components.
1

SERI!TP-1984
This system has two main parts: the colloidcharging section and the working section. Asshown in Figure 1, the working section consists of .an inlet/attractor electrode (item 2) and acollector electrode (item 3). The aerosol ischarged with one polarity by a corona dischargewire or other charging system (item 1) and entersthe working area. The wind then pushes thecharged particle up the potential hill to thecollector electrode. At this point the chargedcloud, formed behind the EFD rig following startup, aids the collector electrode in the collectionof the charged particles. The high voltage powersupply and feedback control system (items 4 and5) ensure that the charge is drained at anadequate rate and that the field voltage isoptimum for the working section. The concepttypically uses ver~ high voltage and low current(330 kV, 15 IJ.A/m ).
Research on the EFD wind-driven generator hasbeen underway at the University of Dayton since1975 (2,3,4,5). Support for this research has beenprovided by the NSF, ERDA, DOE, and SERI.These efforts have resulted in the developmentof analytical models for aerosol and generatorperformance, thereby providing a detailedanalytical model of the EFD system inclUdingfield mapping, field breakdown limits, geometricparameters, and performance characteristics.Wind tunnel configurations have been tested toverify the theoretical models (Figures 2 and 3).
The wind tunnel tests have indicated that th.emore important parameters are particle mobility,electrode diameter vertical electrode spacing,horizontal electrode spacing, field voltage, andwind velocity. Early efforts demonstrated thatwater droplets, although good performers in anEFD concept, could not be generated with thelow mobilities required for high efficiencyoperation. Therefore, SUbsequent researcheff orts were concentrated on the production oflow mobility bubbles, which can be generatedeither singly or in agglomerates with thenecessary mobility. Analysis of the optimumconfiguration for a full-size bubble generator,including pumping and charging requirements,produced encouraging results as shown in Figure4.
12
EFD WindTunnel Test Rig.
Tunn el Atr verccuv tm 5/
Comparison of EFDWind TunnelData -with Theory.
Fig. 2.
'2
16
Fig. 3.
0 0" ----='----"--_......__.L..__...I..__...
.•it
I Coll oid chargi ng SYSlem
2 tntet zatttactor elect rode
3 Collector electrode
.. High voltage power supply
, Feltdback control system
Schematic of the EFD Wind~DrivenGenerator (from Ref. 3).
->-.0 0)
o 0~o Charge
O 0 ClOt."
W,od -
T~~·Fig. 1.
2

SERI/TP-1984
BOO
600
2.1 Conceptual Design of an EFD Wind-DrivenGenerator
(1)
Frontal View of the EFD ConceptualDesign (from Ref. 6).
COE
Fig. 5.
O&M costs, assumed to be small relative toconventional wind energy systems, have not beenincluded in this calculation.
assumption is necessary as the conceptual designlacks any yaw capab ility. When corrected forheight differences, th is AEO estimate is 46% ofthe MOD-2 prediction for a 6.3 m/s (14 mph) windsite (9). Thus the AEO estimate for the EFDconcept~l design appears to be suitablyeonservative,
,-"'-_ -l11._ -"'-_-!1!._ _ !Il...J:.' 2 '" ,
Cost estimates of this EFD conceptual designwere developed at SERI, using a detailedestimate of material and labor requ irementsfrom "Richardson Process Plant ConstructionEstimating Standards" and information frommanufacturers of special ized equipment. Theestimated cost of a single unit constructed onsite, including all overhead and profit but withoutmaking provisions for land cost and withoutincorporating manufacturing or learning curves,is $23,073,000. Using the DOE Cost of Energyequation, t he annualized cost of energy (COE) ofthe EFD system is:
The estimated 100th unit cost is $15,724,000, foran annualized COE of 21.8 cents/kWh. Additionalcost reductions could be obtained by further
rne orenc ar Power. Ou tput
'a
C" 0.45 Iii ' 6 m s
10 14
Wmd v eloc it y tm 51
Theoretical EFD Power OutputDensity vs. Wind Speed.
200
400
Fig. 4.
Based on the promising studies Conducted todate, the current SERI-supported effort ispursuing the development of a conceptual designfor an EFD wind generator (6). The University ofDayton has established the design parameters,with particular attention to the materialrequirements versus system performance. Theconceptual design (Figure 5) has a workingsection 5m (I6.4ft) t065m (213.2 f't) in heightwith a width "l:>L J R9I1l_ j 13lL W givi¥g a wind~rgy conversion area of 24,000m (258,200ft). The SERI estim~te (7) of annual energyoutput (AEO) is 62 W/m or 13,000 MWh based onan average annual wind speed of 6 m/s {13.4 mph),a 1/7 power law height variation of wind speed,and a wind rose with a highly predominant winddirection such as that ofHonolulu (8). The latter
Mass! Energy!Conversion Conversion
Mass Energy/Mass Are/\, AreaWind System (Mg) (kWh/kg) (kg/m~) kWh/ m2
Sandia Darrieus m 3.82 15.7 45.7 717.5Giromill . 9.07 20.9 40.1 838.1Sandia Darrieus (2) U.51 19.9 41.3 821.9Magdalen Island 22.00 17.6 37.0 651.2
DarrieusHutter 13.15 27.8 14.4 400.3MOD-D A 40.37 22.1 35.4 782.3MOD-X 33.08 28.7 29.0 832.3EFD 1,721.50 7.5 71.7 539.9 'MOD-l 297.00 15.0 102.0 1530.0
Table 1. Mass and Wind Energy Value Indica tors
3

SERI/TP-1984
3. THE DIFFUSER AUGMENTED WINDTURBINE mAWT}
---
BOUNOARY LAYERLOSING MOMENTUM
.¢~E"ENERGIZEO:yo .BOUNDARY:~LAYER
,,----,-- ---
ENLARGED VIEWDF BOUNDARYLAYER CONTROLFLOWS
'!..-------
CENTERBODY
Schematic of DAWT Flow FieldShowing Boundary LayerRegeneration (from Ref. 14).
UNDISTURBEDAIR FLOW
........-~---- - _.... D1FFU{..R '"
-....------Schematic of DAWT Flow FieldCompared to that of a Bare Turbine(from Ref. 12).
Fig. 7.
Fig. 8.
-----
~~~AUXILIARYSLOT OIF.FU5ERSECTIONS.~ET /_ -~STREAMTUBE BOUNDARYSlOT~":"'---~ - " f-OR9ARE TURBINE----- =::::::.-------
Further efforts were supported by SERI toestablish the engineering and cost parameters fora full- size DAWT system based on the windtunnel data for the larger model. The results of.this study (16) indicated that the DAWT concepthas a potential for cost-competitive wind energyconversion. Estimated costs of energy (COE)
diffusers to prevent boundary layer separation.A major objective of the Grumman research hasbeen to develop less costly short, wide :anglediffusers. Half-angles of 30 to 4SO have beenachieved with the use of slots in the diffuser wallto provide boundary layer regeneration and thusprevent flow separation (Figure 8).
Initial DAWT research by Grumman involvedopen jet wind tunnel testing of small models(0.045m inlet diameter) (15). SUbsequent researchwith a larger model (14) used the designparameters established in the small model tests.The larger model had. a rotor diameter of O.46m(1.5 rt), a diffuser exist to rotor area ratio of 2.78and a half-angle of 30". Testing of this model ina 2.lm x 3m (7 ft x 10 ft) wind tunnel providedpeak power coefficient (co) augmentation ratiosof-3.0 based on the Betz limit and -4.1 basedon bare turbine performance.
TYPICAL TYPICALDAWT STREAMTUBE BARE TURBINE
~0~7RY __ ~~T7BOU~RY-
-..........,-~------_._---TURBINE
v~
Sketch of a DAWT (from Ref. 12).Fig. 6.
The DAWT concept, shown in Figure 6, employs aconventional horizontal axis wind turbine (HAWT)with an added diffuser shroud to provide flow,and hence power, augmentation. The diffusion orexpansion of the flow within the shroud causes astatic pressure increase, thus permitting a lowerstatic pressure just downstream of the turbineand a correspondingly greater pressure dropacross the rotor disk. The increased pressuredrop induces a greater mass flow of air throughthe turbine as shown in Figure 7.
optimization of the conceptual design. However,the preliminary nature of the design studies arenot detailed enough to establish a definitiverange for a cost reduction. Projected reductionsrange from very modest to well below theprevious prediction.
Due to the variances in costing estimates, it isuseful to look at other parameters such as themass and wind energy value indicators shown inTable 1 nn.u). As shown, the EFD concept iswithin the range .pf most wind systems withrespect to kWh!mW but is extremely materialintensive. This material i2tensity could becompensated for if the kWh!m value were not atthe lower end of the range. The materialintensity will have a negative impact on thesystem potential if it cannot be improved upon.However, significant optimization potentialexists for the EFD concept and the valueindicators could range from very marginal toacceptable compared to conventional windenergy systems. Further research is needed toestablish more accurate estimates of EFD annualenergy output and value indicators with narrowerranges.
Research on the DAWT has been conducted byGrumman Aerospace Corporation since 1973 andhas been supported by ERDA, DOE, and SERIsince 1976. Previous R&D on diffuser shrouds (13)had demonstrated the augmentation effect.However, these research efforts concentrated oncostly, long, narrow angle (half angles <6")
4
SERI/TP-1984
Fig. 9.
c=O.25
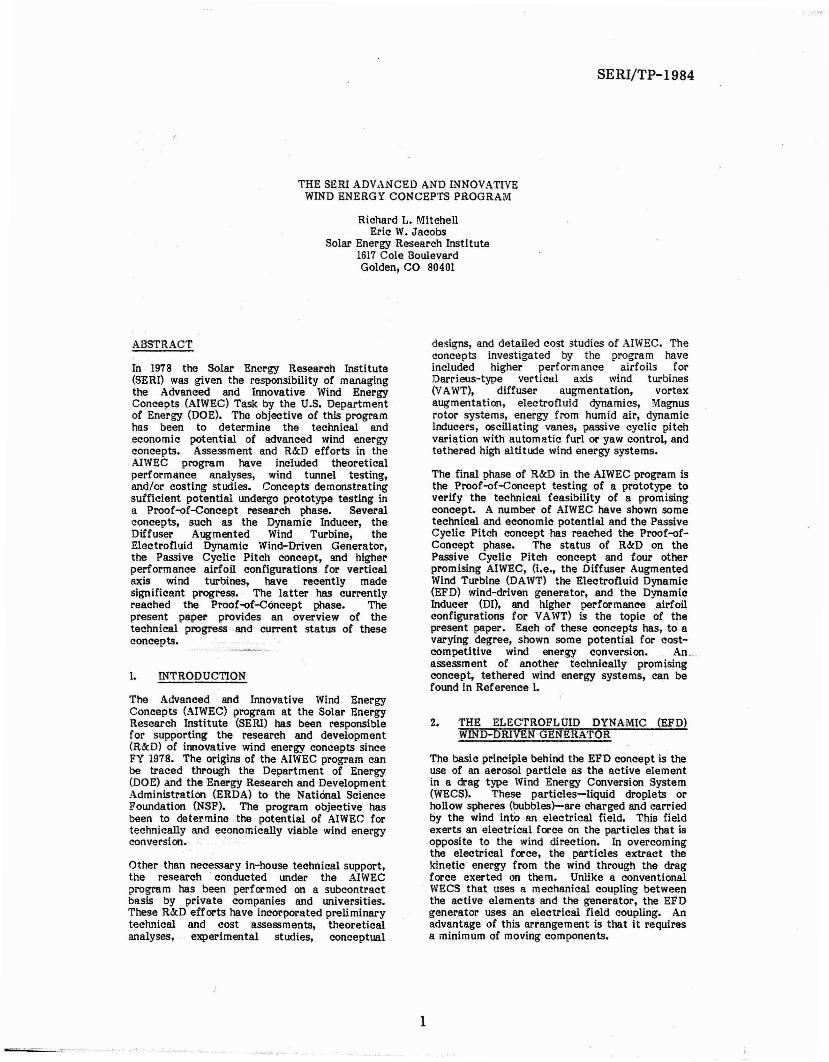
Views of Prototype Scale DynamicInduces (dimensions in meters) (fromRef. 19).
Fig. 10.
results were obtained with an area ratio of 2.62corresponding to a flange width of 1.5% of thediffuser exit diameter. Using the exit arearather than the rotor area zives a poweraugmentation of -1.25 based 0; the Betz limitfor the 450 model. Another imoortant result ofthe open jet wind tunnel' test was thedemonstration of nearly, constant poweraugmentation over a broad range of tip speedrati? Thus the increase in AEO could be nearlyequivalent to the augmentation ratio at peakpower coefficient.
4. THE DYNAMIC INDUCER
The operating principle of the Dynamic Inducer,shown in Figure 10, is similar to that of theDAWT concept. Unlike the passive shroud of theDAWT, however, the augmentation elements ofthe Dynamic Inducer are active, consisting of tipvanes mounted at approximately right angles tothe blade tips of a conventional HAWT. Whenthe turbine is rotating, these tip vanes create alifting force acting in a radially outwarddirection, thereby causing an expansion of thestreamtube. As with the DAWT, this expansion
,results in a lowered SUbatmospheric staticpressure behind the rotor disk, an increasedpressure drop across the turbine, and thus anincreased mass flow rate through the turbine.
300 DAWT Model in the 18m x 1.8mOpen Jet Wind Tunnel.
were 7.5 to 12 cents/kWh for small DAWT ( -llkw) and 4 to 6 cents/kWh for large DAWT (-150kW). These CaE were obtained by using Equation(1). Note, however, that the annual energy output(AEO) estimates used in the study require furtherverification.
The open jet wind tunnel tests of the 3(f modelresulted in augmentation ratios of -3.0 based onthe Betz limit and -5.0 compared to the barerotor performance. The corresponding results forthe 450 dump diffuser were -3.3 and -5.6respectively. These results, along with thosefrom the Grumman wind tunnel, are summarizedin Table 2. The Grumman wind tunnel resultbased on the Betz limit may be high due tosystematic test errors, thus indicating that thecorresponding augmentation ratio based on barerotor performance is more reliable. The 450
Current research has been directed towardsoptimizing DAWT design parameters to increaseperformance and decrease cost. The largerDAWT model has been retested (17) in a 1.8m x1.8m (6 ft x 6 ft) open jet wind tunnel with animproved rotor design (Figure 9). In addition, ashorter, more compact diffuser model with ahalf-angle of 450 was also tested. The 450 modelemployed radial flanges at the diffuser exitwhich provided exit-to-rotor area ratios of 2.55to 3J7 without changes in diffuser length. Thislatter configuration is designated the dumpdiffuser.
Model/Test Based on Betz Limit
(Cp,Betz=O.593)
Based on Bare Rotor
Performance
3(f - Grumman WindTunnel
3(f - VPI Wind Tunnel
4SO - VPI WindTunnel
3.4
3.0
3.3
4.1
5.0
5.6
Table 2. Experimentally Observed Augmentation Ratios of Peak, Power Coefficient by the
DAWT.
5

SERI/TP-1984
0.7
Research on the Dynamic Inducer has beenconducted by AeroVironment, Ine., with thesupport of ERDA, DOE and SERI since 1977. Theinitial efforts included tow testing of a 3.6m (12ft) diameter rotor, shown in Figure 11, in which noaugmentation effect was observed (18). The lackof augmentation was traced to parasitic draglosses associated with the tip vane bladeconnections and subsequent efforts wereconcentrated on the solution of this problem•. Animproved analytical model was developed andapplied to the design and construction of a 1.2m(4 ft) diameter, three-bladed model of theDynamic Inducer. Wind tunnel tests of thismodel (Figure 12) showed, based on bare rotordisk area, an increase in peak power coefficient(cD) of -70'16 over the bare rotor measurementwnen corrected for wind tunnel blockage effects(19). However, as shown in Figure 13, the powercoefficient versus tip speed ratio (X) curve wasmuch narrower and more sharply peaked for theDynamic Inducer. A narrow, sharply peaked tipspeed ratio curve would have significantlyadverse effects on Dvnamic Inducer COE.Further tow testing of the 3.6m (12 ft) diametermodel with improved tip vane blade connectionsyielded a lower increase of -35% for the peakpower coefficient, again based on bare rotor diskarea.
Current research eff orts have been directedtoward tip vane and rotor optimization (19).Tests have been conducted in a 2.4m x 3m (8 ft x10 It) water channel with a 0.51m (1.67 ft)diameter, two-bladed low solidity rotor andseveral tip vane configurations. Wake surveysshowed that the tip vanes were providingsignificant flow augmentation. However, lowshaft power levels relative to theoreticalpredictions were observed due to high draglosses. Comparisons of theoretical and observedperformance based on shaft power and wakedeficit measurements for two test runs in thewater channel are shown in Table 3. The resultsgiven for run no. 48 in Table 3 demonstrate that,although a greater flow augmentation effect wasfound at the higher tip speed ratio, the e basedon shaft power was significantly reducedPdue tothe drag losses. Based on the bare rotor diskarea, the maxim urn increase in peak cp was55% and the tip speed ratio curves were againnarrow and sharply peaked. The drag lossesappeared to be partially due to stalled regions onthe tip vanes and partially due to residualinduced drag. Subsequent tests with linearlytwisted tip vanes eliminated the partial tip vanestall but could not completely reduce the residualinduced drag. Although the twisted tip vaneswere less effective in increasing the peak powercoefficient, the tip speed ratio curves werebroadened with the emergence of a second peakon the curve at a higher tip speed ratio. Asummary .of the results obtained in the windtunnel, tow, and water channel tests is containedin Table 4.10
Tow Test Model of the DynamicInducer.
0.6
M
0.4
Cp
Rotor Alone0.3
0.2
0.1
Fig. u.
Fig. 12. Wind Tunnel Model of the DynamicInducer,
Fig. 13. Power Coefficient (cp) vs, Tip SpeedRatio (X) for the Dynamic Inducerand the Bare Rotor (from Ref. 19).
The water channel tests by Aerovtronmentj lne.,indicate that high shaft power augmentationapproaching the demonstrated flow augmentation
6
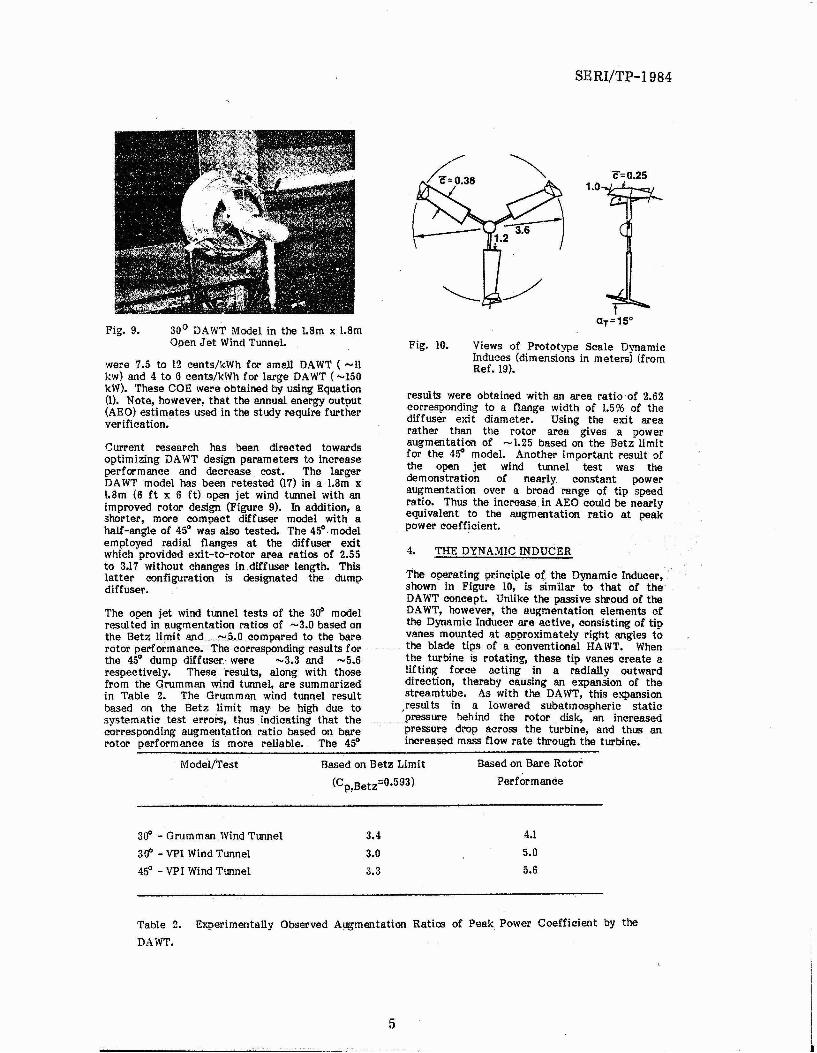
Run No. Tip Speed
Ratio
Power Coefficient Based
on Shaft Power
Theoretical Experimental
SERI/TP-1984
Power Coefficient Based
on Wake Deficit
Theoretical Experimental
48
48
59
3
6
6
0.75
0.80
0.49
0.20
0.18
0.98
1.06
0.70
1.30
0.90
Table 3. Compar isons of Theoretical Predictions and Experimental Observations of Dynamic
Inducer Performance fer Two Test Runs in the Water Channel (Based on effective rotor area
which includes tip vanes) (from Ref. 20).
Wind Tunnel
Tow (Field)
Water Channel (Untwisted Tip Vanes)
Water Channel (Twisted Tip Vanes)
Based on Bare
Rotor Area
70%
35%
55%
40%
Based on
Effective Area
(includes tip vanes)
25%
15%
Table 4. Experimentally Observed Augmentation of Peak Power Coefficient by the Dynamic
Inducer (Based on bare rotor performance).
may be feasible if tip vanes can be designed tosignificantly reduce the induced drag. :This mightbe accomplished through more detailedtheoretical analysis of the now domain and, ifwarranted,experimental verification. Ideallythis typeo! "anll.lysis'"WoUld generate tip vanedesigns which both greatly enhance shaft poweraugmentation " and provide broader powercoefficient veI'sus tip speed ratio curves.
5. VAWT AIRFOIL CONFIGURATIONS
Research on higher perfermance airfoils forvertical axis wind turbines (VAWT) has been inprogress since 1977 under ERDA, DOE, and SERIsupport. Most of the early work at West VirginiaUniversity (WVU) was concentrated oncircUlation controlled airfoils (21). Twopromising offshoots of the VAWT research atWVU are the investigation of higher perfermanceairfoils for VAWT by Melior Corporation (22) andresearch on the elimination of adverse nowcurvature effects on VAWT airfoils, begun at'.NVU (23) and continued by Melior Corporation(22).
The study of higher perfermance airfoils hasinvestigated improving lift-drag characteristicsby employing low. drag airfoil shapes such as the
7
NACA 63b-OXX and NACA 64b-oXX series (22).The NACA-oOXX airfoils, the most commonlyused airfoils for VAWT, provided a baseline forperfcrmance comparisons. The perfermance of .each airfoil was derived from a blade elementmomentum theory developed for VAWT, with liftand drag coefficients obtained from availableliterature on steady state airfoil data for aco~stant chord Reynolds number (Re) of ~ 3.0 x10 • Because of the constant Re assumption, thepredicted performance for each airfoil isprobably too high, but the relative comparisonsbetween airfoils are presumably valid.
The resUlts of the analysis indicate that the lowdrag airfoils, led by the NACA 63b-OXX series,woUld provide ' better performanceCharacteristics. Comparisons of the NACA 632015 with NACA 0015 are shown in Figures 14 and15. Figure 14 shows power coefficient (cp) as afunction of tip speed ratio for these two 9.irfoilsat t'NO different rotor solidi ties (<T). TheseresUlts demonstrate the potential of the NACA63b-OXX airfoil series for significantly enhancingVAI'VT perfermance at the higher tip speedratios. The potential increase in annual energyoutput (AEO) predicted for the NACA 632-015airfoil is shown as a function of rotor solidity inFigure 15. Within the range of rotor solidity usedin the analysis, the predicted AEO is 17'-27%

SERl/TP-1984
Research on VAWT aerodynamics hasdemonstrated, both analytically andexperimentally, that VAWT turbine bladesexperience adverse flow curvature effects (23).These eff ects are due to the apparent (oreffective) camber and incidence of ageometrically symmet ric airfoil caused by therotational pat h of the airfoil, boundary layercentrifugal effects, and the curvilinear flow fieldseen by the rotor. However, the .aerodynamiccharacteristics of the airfoils used in VAWT arebased on rectlinear flow. Analysis has indicatedthat 'a- 'sUghtly cambered" airfoil, obtained byconform ally mapping a symmetrical airfoil(Figure 16), can eliminate adverse flow curvatureeffects. The performance of the camberedairfoil would then be nearly equivalent to that ofthe symmetric airfoil in rec tilinear flow.
higher than that of the NACA 0015 airfoil.
6. PASSIVE CYCLIC PITCH VARIATION
Based on these results, low drag airfoils warrantfurther investigation for use in VAWT. Ofprimary importance is the actual potential forincreased AEO relative to the commonly usedNACA OOXX airfoil series. However, therelative dynamic response characteristics of eachair fo il must also be considered. Potentialaeroelastic and aeroacoustic levels will bedependent on the ·dynamic response of eachairfoil to atmospheric turbulence, to the wakegenerated by the rotor support column, and tothe wakes self generated by the airfoils duringthe upwind half of the rotation.
3 4 _5 6 7 8 9 10 11 12
TI P SrEED RATIO. TSR
Power Coefficient (co) vs, Tip SpeedRatio for the MACA 632-015 andNACA 0015 Airfoils (- - - 0'=0.07, -- 0' = 0.21, -NACA 632-015,.
A -NACA 0015) (from Ref. 22).
Fig. 14.
0 . 5e,-
Ii 0.'..~
0.3
<5 o. ~c
ffi 0. 1'"~
10
c----------~
E-------~
Fig.
ROTOR SOLIDITY. a
15. Annual Energy Output vs. RotorSolidity Using the NACA 632-015 ~dNACA 0015 Airfoils (mean ann~l wmdspeed = 6 m/sat 10 rn, A=187m ) (fromRef. 22).
ORIGINAL NACA 632, 015 S~TR ICAL AIRFOIL
rR.A2; SFOil.~EO NACA 6 3Z
, Ol5 C.I.~BEREO AIRFOIL
The Passive Cyclic Pitch concept incor porates atwo-bladed HAWT teetered about an axis set at apre-lag angle of 2:f from the blade axis (Figure17). This gives a large delta three angle ( 03) of67" as measured from the axis perpendicular tothe blade axis. Teetering of the rotor eliminatesgyroscopic moments during yaw. However, aconventional teeter hinge at glf from the bladeaxis ( 03=0) can produce periodic in-plane bladeexcursions if the blades have built-in or elasticconing and if nonzero yaw angles, yawing, ornonuniform inflow causes blade flapping aboutthe teeter hinge (24). The resulting blade angularvelocity variations cause dynamic loads leadingto vibratioos, fatigue, and teeter instability.Rotors with conventional delta three blade hinges( 0 3 ~ 31f) are similarly affected. Use of thesmall pre-lag (or large . 0 3) angle for the teeterhinge in the Passive Cyclic Pitch . conceptprovides a strongly negative pitch-flap couplingwhich suppresses blade flapping' and theassociated dynamic loads. Thus an unbalancinggyroscopic or aerodynamic moment causes cyclicpitch variation which eliminates the imbalance.However , the st eady state power output isunaffected by passive blade cyclic pitchvariation.
Fig. 16. Original NACA 63.,-015 SymmetricalAirfoil and Transformed NACA 632-015Cambered Airfoil (axis of rotation istoward top of page) (from Ref. 22).
The Passive Cyclic Pitch concept canprovide several performance and cost benefits.Reduc ing dynamic loads on the rotor support andyaw instabili ties due to negative yaw damping
8

SERI/TP-1984
302010
Rotor Power vs, Wind Speed for.,Unfurled Rotor and for 400 Furl"Angle (from Ref. 25).
o Unfurled
o 40° Purl Angle
18. Atmospheric Model with PassiveCyclic Pitch-Rotor is in Furled Position.
Fig.
16..-----_;- .,.-__.,.-_--,
URotor-.....
12
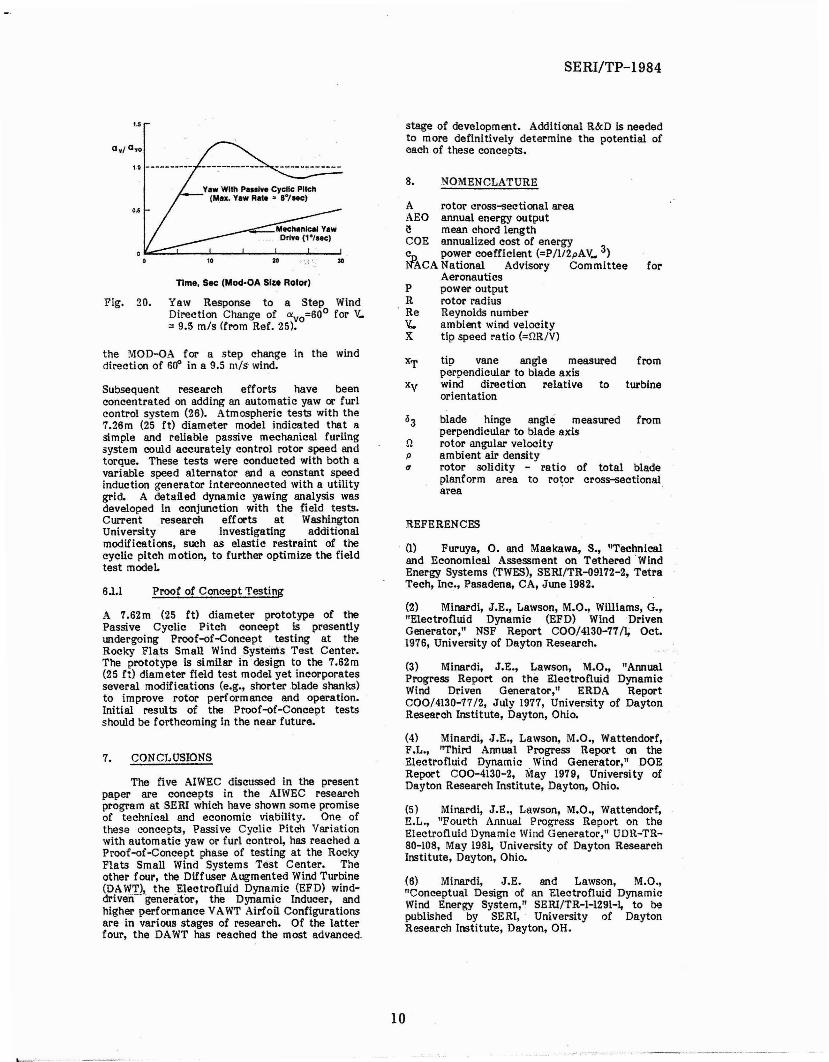
viability of the Passive Cyclic Pitch concept(25). Measured rotor oower versus wind speed forboth the unfurled rotor and the 4{f furl angle areshown in Figure 19. Figure 20 shows thepredicted yaw response, based on theexperimental results, of a MOD-QA size rotorwith passive blade cyclic pitch variationcompared to the actual design yaw response of
Fig. 19.
Flexure
23 Degrees
Blade
Fig. 17. Sketch of a Two-Bladed HAWT withPassive Cyclic Pitch.
while eliminating gyroscopic moments can lowerstructural requirements and costs for a HAWT.Because of the reduced dynamic loads at highyaw angles and yaw rates, .the Passive CyclicPitch concept can employ less costly and morereliable rotor yaw or furling rather than bladefeathering as a means of rotor torque and/orspeed control, The elimination of gyroscopicmoments also removes turbine size limitations onthe use of tail vane stabilization (i.e., passiveyaw control) fer upwind HAWT.
For large wind turbines, the elimination of 10
gyroscopic moments would permit higher yawrates and, hence, increased energy capture.Preliminary estimates .of the increase in annualenergy output are in the neighborhood of 5%.For small wind turbines, the Passive Cyclic Pitchconcept can facilitate reducing the blade numberto two, thus reducing rotor costs. Small turbines'generally have three or more .blades as two-bladed turbines with rigid blade-hub attachmentscan experience severe two per rev (2P)vibrations.
6.1 Research on the Passive Cyclic PitchConcept
The Passive Cyclic Pitch concept has beeninvestigated by Washington UniversityTechnology Associates, Ine., and by WashingtonUniversity under SERI support since 1979. Initialresearch involved wind tunnel testing of a 0.437m(1.43 ft) diameter model operating without powerextraction. These tests verified the predictedoperational characteristics of the concept (25).Detailed analytical models were then developedand applied to the design of a 7.62m (25ft)diameter field test model, shown with the rotorcompletely furled in Figure 18. Atmospherictests of this model demonstrated the technical
9
SERI/TP-1984
stage of development. Additional R&D is neededto more definitively determine the potential ofeach of these concepts.
PR
, Rev:.X
Fig. 20.
Time. Sec (Mod·OA Size Rotor)
Yaw Response to a Step WindDirection Change of Il'vo=600 for V.= 9.5 mls (from Ref. 25).
8. NOMENCLATURE
A rotor cross-sectional areaAEO annual energy outputa mean chord lengthCOE annual ized cost of energy 3c power coefficient (=P/1I2pAV.. )i'fACANational Advisory Committee
Aeronauticspower outputrotor radiusReynolds numberambient wind velocitytip speed ratio (=rlR/V)
for
REFERENCES
(I) Furuya, O. and Maekawa, S., "Technicaland Economical Assessment on Tethered WindEnergy Systems (TWES), SERI/TR-09172-2, TetraTech, lnc., Pasadena, CA, June 1982.
(2) Minardi, J.E., Lawson, M.O., Williams, G.,"Electrofluid Dynamic (EFD) Wind DrivenGenerator," NSF Report COO/4130-77/1; Oct.1976, University of Dayton Research.
(3) Minardi, J.E., Lawson, M.O., "AnnualProgress Report on the Electrofluid DynamicWind Driven Generator," ERDA ReportCOO/4130-77/2, July 1977, University of DaytonResearch Institute, Dayton, Ohio.
(4) Minardi, .J.E., Lawson, M.O., Wattendorf,F.L., "Third Annual Progress Report on the
.Elec trofluid Dynamic Wind Generator," DOEReport COO- 4130-2, May 1979, University ofDayton Research Institute, Dayton, Ohio.
(5) Minard], J.E., Lawson, M.O., Wattendorf,E.L., "Fourth Annual Progress Report on theElectrofluid Dynamic Wind Generator," UDR-TR80-108, May 1981, University of Dayton ResearchInstitute, Dayton, Ohio.
(6) Minardi, J.E. and Lawson, M.O.,"Coneeotual Design of an Electrofluid DynamicWind Energy System," SERI/TR-l-l29l-J, to bepublished by SERI, University of DaytonResearch Institute, Dayton, OH.
the MOD-oA for a step change in the winddirec ti on of 60" in a 9.5 mlS' wind.
SUbsequent research efforts have beenconcentrated on adding an automatic yaw er furlcontrol system (26). Atmospheric tests with the7.26m (25 ft) diameter model indicated that asimple and reliable passive mechanical furlingsystem could accurately control rotor speed andtorque. These tests were conducted with both avariable speed alternator and a constant speedinduction generator interconnected with a utilitygrid. A detailed dynamic yawing analysis wasdeveloped in conjunction with the field tests.Current research efferts at WashingtonUniversity are investigating additionalmodifications, such as elastic restraint of thecyclic pitch motion, to further optimize the fieldtest model.
s.u Proof of Concept Testing
A 7.62m(25 ft) diameter prototype of thePassive Cyclic Pitch concept is presentlyundergoing Proof-of-Concept testing at theRocky Flats Small Wind Systems Test Center.The prototype is similar in design to the 7.62m(25 It) diameter field test model yet incorporatesseveral modifications (e.g., shorter .blade shanks)to improve rotor performance and operation.Initial results of the Proof-of-Concept testsshould be forthcoming in the near future.
7. CONCLUSIONS
The five AIWEC discussed in the presentpaper are concepts in the AIWEC rese~ch
program at SERI which ha~e s!l?w,: .some promiseof technical and economic viability, One ofthese concepts, Passive Cyclic Pitch Variationwith automatic yaw or furl control, has reached IIProof-of-Concept phase of testing at the RockyFlats Small Wind Systems Test Center. Theother four, the Diffuser Augmented WindTurbine(DAWTI, the .Electrofluid Dyna~ic (EFD) winddriven generator, the Dynamic Inducer, andhigher performance VAWT Airfoil Configurationsare in various stages of research. Of the latterfour, the DAWT has reached the most advanced.
Xv
tin vane angle measured fromperpendicular to blade axiswind direction relative to turbineorientation
blade hinge angle measured fromperpendicular to blade axisrotor angular velocityambient air densityrotor solidity - ratio of total bladep1anform area to rotor cross-sectionalarea
10
(7) Mitchell. R.L., "Analysis of the Potentialof the Electrofluid Dynamic Wind-DrivenGenerator," Solar Engineering 1983, Proceedingsof the 5th Annual Technical Conference of theSolar Energy Division of ASME, Orlando, FL,April 19-21, 1983.
(8) ItMOD-2 Wind Turbine System Concept andPreliminary Design Report," Volume n DetailedReport, DOE/NASA 0002-80/2, (also NASA CR159609), July 1979, Boeing Engineering andConstruction, Seattle, Wash.
(9) ''Selected Climatic Maps of the UnitedStates,1t1977, National Climatic Center, Ashville,NC.
(10) McConnell, R.D., "Giromill Overview,"SERI/TP-35-263, ~Ilay 1979, Solar EnergyResearch Institute, Golden, CO.
nn McConnell. R.D., "A Screening Method forWind Energy Conversion Systems,1t SERI/TP-731649, June 1980, Solar Energy Research Institute,Golden, CO.
(12) Foreman, K.M., "Economics of DAWTWind Energy Systems,1t SERI/CP-635-1340 (alsoCONF-Sll043), Proceedings of the Fifth BiennialWind Energy Conference and Workshop (WWV),Washington, D.C., Oct. 5-7,1981. pp. 469-485.
(13) Lilley, G.M. and Rainblrd, W.J., itAPreliminary Report on the Design andPerformance of Ducted Windmills," Report 102,April 1956, College of Aeronautics, Cranfield,England. (Also available as Technical ReportCIT ll9, 1957, Electrical Research Assoc.,Leatherhead, England)• .
(14) Foreman, K.M. and Gilbert, B.L., npurtherInvestigations of Diffuser Augmented WindTurbines, Part n-Technical Report," DOEReport COO-2616-2 (Part 2) (Rev. 2), July 1979,Grumman Aerospace Corp., Bethpage, NY.
(15) Oman, R.A., Foreman, K.M., and Gilbert,B.L., "Investigation of Diffuser ~ugmented WindTurbines, Part n-Technical Report," ERDAReport COO-2616-2 (also available as GrummanResearch Dept. Report RE-534), January 1977,Grumman Aerospace Corp., Bethpage, NY).
(16) Foreman, K.M., "Preliminary Design andEconomic Investigations of Diffuser AugmentedWind Turbines (DAWT),1t SERI/TR-98073-18,December 1981. Grumman Aerospace Corp.,Bethpage, NY.
(17) Foreman, K.M., Maciulaitis, A., andGilbert, B.L., "Performance Predictions andRecent Data for Advanced DAWT Models," SolarEngineering - 1983, Proceedings of the ASMESolar Energy Division Fifth Annual Conference,Orlando, FL, April 18-21.1983, pp, 596-605.
(18) Lissaman, P.B.S. and Walker, S., "DynamicInducer Research Program," DOE Report RLO-
SERI/TP-1984
1021-77/1, June 1978, AeroVironment tne.,Pasadena, CA.
(19) Lissaman, P.B.S., Za1ay, A.D., and Hibbs,B.H., "Advanced and Innovative Wind EnergyConcept Development: Dynamic InducerSystem," SERI/TR-9-8085-lb, August 1981,AeroVironment, Ine., Pasadena, CA.
(20) Gyatt, G.W., Zalay, A.D, and Hibbs, B.,"Optimization of the Dynamic Inducer . WindEnergy Systems," ,:. SERI/T R-1- ll67- 1, to bepublished by SERI, AeroVironment, tne.,Pasadena, CA.
(21) Walters, R., Wolfe, W.P., and Migliore,P.G., "Vertical Axis Wind Turbine Research atWest Virginia University," SERI Second WindEnergy Innovative SYstems Conference,SERI/CP-635-938, Colorado Spr ings, CO,December 3-5, 1980, pp, 159-178.
(22) Migliore, P.G. and Fritschen, J.R.,"Darr ieus Wind Turbine Airfoil Conflgurations,"SERl/TR-ll045-1, June 1982, Melior Corp., Davis,CA.
(23) Migliore, P.G. and Wolfe, W.P., "TheEffects of Flow Curvature on the Aerodynamicsof Darrieus Wind Turbines," DOE ReportORO/5135-77/7, July 1980, West VirginiaUniversity, Morgantown, WV.
(24) Hohenemser, K.H. and Swift, A.H.P., "Onthe Design of Horizontal Axis Two-Bladed HingedWind Turbines," Solar Engineering - 1983,Proceedings of the ASME Solar Energy DivisionFifth Annual Conference, Orlando, FL, April 1821, 1983, pp, 583-589.
(25) Hohenemser, K.H., Swift, A.H.P., .andPeters, D.A., "The Yawing of Wind Turbines withBlade Cyclic Pitch Variation," SERI/TR-9-80833a, August 1981, Washington UniversityTechnology Associates, Ine., St. Louis, MO.
(26) Hohenemser, K.H. and Swift, A.H.P., ''TheInvestigation of Passive Blade Cyclic PitchVariation Using an Automatic Yaw Controlsystem," SERI/TR-1l052-2, August 1982,Washington University Technology Associates,lne., St. Louis, MO.
11