serdp proposal template - defense technical … headquarters services, directorate for information...
TRANSCRIPT

FINAL REPORT Understanding the Science Behind How Methylene
Chloride/Phenolic Chemical Paint Strippers Remove Coatings
SERDP Project WP-1680
OCTOBER 2011 John L. Graham Takahiro Yamada University of Dayton Research Institute
REPORT DOCUMENTATION PAGE Form Approved
OMB No. 0704-0188 Public reporting burden for this collection of information is estimated to average 1 hour per response, including the time for reviewing instructions, searching existing data sources, gathering and maintaining the data needed, and completing and reviewing this collection of information. Send comments regarding this burden estimate or any other aspect of this collection of information, including suggestions for reducing this burden to Department of Defense, Washington Headquarters Services, Directorate for Information Operations and Reports (0704-0188), 1215 Jefferson Davis Highway, Suite 1204, Arlington, VA 22202-4302. Respondents should be aware that notwithstanding any other provision of law, no person shall be subject to any penalty for failing to comply with a collection of information if it does not display a currently valid OMB control number. PLEASE DO NOT RETURN YOUR FORM TO THE ABOVE ADDRESS. 1. REPORT DATE (DD-MM-YYYY)
June 2011 2. REPORT TYPE
Final 3. DATES COVERED (From - To) 21 April 2009 – 30 June 2011
4. TITLE AND SUBTITLE
Understanding the Science Behind How Methylene Chloride/Phenolic Chemical Paint Strippers Remove Paint
5a. CONTRACT NUMBER
W912HQ-09-C-0023
5b. GRANT NUMBER
5c. PROGRAM ELEMENT NUMBER
6. AUTHOR(S)
5d. PROJECT NUMBER WP-1680
John L. Graham and Takahiro Yamada
5e. TASK NUMBER
5f. WORK UNIT NUMBER 7. PERFORMING ORGANIZATION NAME(S) AND ADDRESS(ES)
8. PERFORMING ORGANIZATION REPORT NUMBER
University of Dayton Research Institute 300 College Park Dayton, OH 45469
UDR-TR-2011-114
9. SPONSORING / MONITORING AGENCY NAME(S) AND ADDRESS(ES) 10. SPONSOR/MONITOR’S ACRONYM(S) Strategic Environmental Research & Development Program (SERDP) 901 North Stuart Street, Suite 303
Arlington, VA 22203 11. SPONSOR/MONITOR’S REPORT
NUMBER(S) 12. DISTRIBUTION / AVAILABILITY STATEMENT Approve for public release; distribution is unlimited 13. SUPPLEMENTARY NOTES None
14. ABSTRACT The objective of this program was to obtain a sound understanding of how methylene chloride/phenol-based (MC/P) paint strippers function by understanding the specific roles of the primary paint stripping components; methylene chloride, phenol, ethanol, and water. This was accomplished through s series of tasks including sample selection, conceptual and computational molecular modeling, infrared spectroscopy, measurements of volume swell, the extent and rate of debonding and the analysis of the solvent absorbed by a model coating system. The results show that methylene chloride serves primarily as a penetrant and as a carrier for the other solvent components. Phenol is also a powerful penetrant, but also serves as a weak organic acid and is the primary active component. However, in order to function efficiently, phenol requires the presence of water which ‘activates’ the phenol through a reaction forming phenoxy and hydronium ions. Ethanol serves as a co-solvent and increases the solubility of water in the solvent phase. This study has shown that the two most significant functions of a paint stripping solvent are to penetrate the coating to deliver a weak organic acid to the bonding interface. In the near term it suggests that the performance of some alternative paint strippers may be improved by including a weak organic acid. In the long term, this provides a framework to developing new paint removal systems. Specifically, methylene chloride could be eliminated if an alternative means of accessing the bonding interface could be devised. This in turn would allow the use of a weak organic acid other than phenol, resulting in an environmentally acceptable paint stripping method.
15. SUBJECT TERMS 16. SECURITY CLASSIFICATION OF:
17. LIMITATION OF ABSTRACT
18. NUMBER OF PAGES
19a. NAME OF RESPONSIBLE PERSON Mr. Herbert Nelson
a. REPORT Unclassified
b. ABSTRACT Unclassified
c. THIS PAGE Unclassified
88
19b. TELEPHONE NUMBER (include area code) (703) 696-8726 Standard Form 298 (Rev. 8-98)
Prescribed by ANSI Std. 239.18
i

ii
Table of Contents
Section Page Table of Contents ............................................................................................................................ ii
List of Figures ................................................................................................................................ iii
List of Tables ............................................................................................................................... viii
List of Acronyms ........................................................................................................................... ix
Acknowledgements ......................................................................................................................... x
Keywords ........................................................................................................................................ x
Abstract ........................................................................................................................................ xi
1 Objective ................................................................................................................................ 1
2. Background ............................................................................................................................ 2
3. Materials and Methods ........................................................................................................... 4
3.1 List of Materials ............................................................................................................ 4
3.2 Preparation of Free-standing Films .............................................................................. 5
3.3 Preparation of Coated Samples ..................................................................................... 6
3.4 FTIR Spectra of Free-standing Films ........................................................................... 6
3.5 Volume Swell ............................................................................................................... 7
3.6 Extent of Debonding ..................................................................................................... 8
3.7 Rate of Debonding ........................................................................................................ 8
3.8 Polymer-Fluid Partition Coefficients ............................................................................ 9
4. Results and Discussion ....................................... .................................................................11
4.1 Task 1 - Material Selection & Preparation ..................................................................11
4.2 Task 2 - Molecular Modeling ......................................................................................12
4.3 Task 3 - FTIR of Thin Films ........................................................................................31
4.4 Task 4 - Dynamic Volume Swell .................................................................................43
4.5 Task 5 - Surface Debonding ........................................................................................56
4.6 Task 6 - Solvent Absorption/Extraction ......................................................................70
5. Conclusions and Implications for Future Research/Implementation ....................................73
6. Literature Cited .....................................................................................................................75
Appendix: List of Scientific/Technical Publications ....................................................................76

iii
List of Figures Figure Page
1. Example of a free-standing sample of the epoxy primer being separated from its polystyrene backing sheet ................................................................................................... 5
2. Examples of free-standing samples prepared for volume swell analysis; epoxy
primer on the right, polyurethane topcoat on the right ....................................................... 6 3. Example coated test samples; ½” square aluminum panels (left) and ½” sapphire
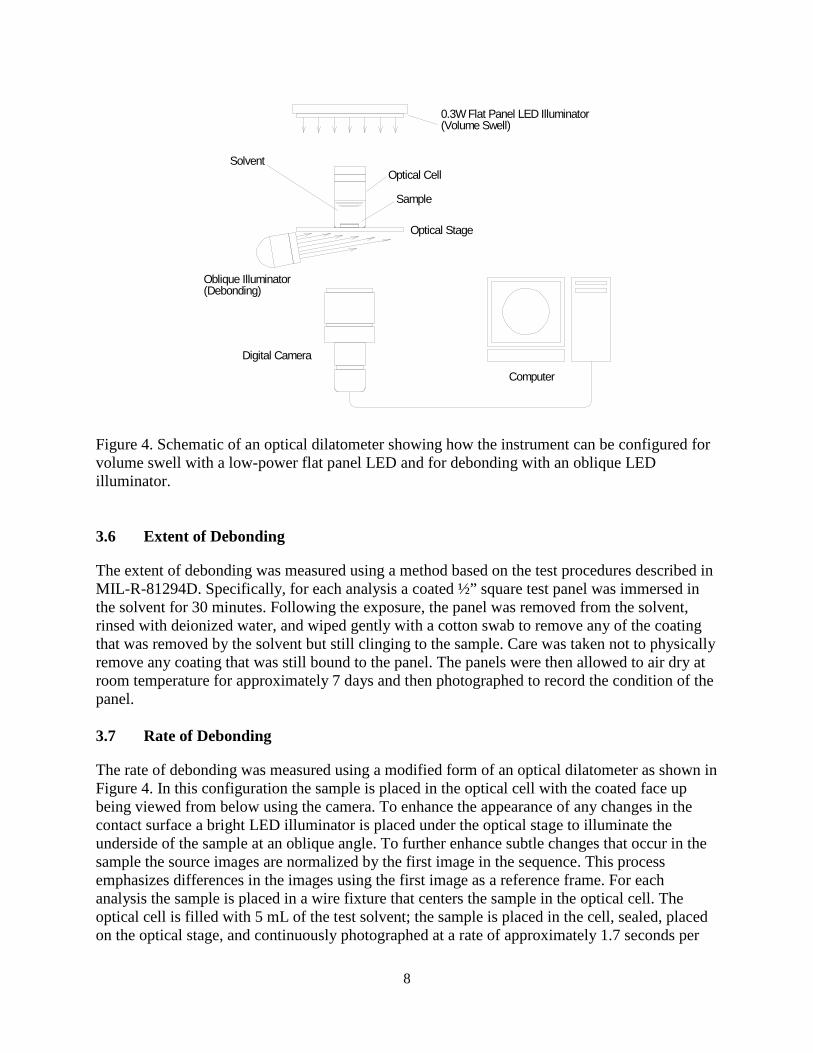
windows (right) ................................................................................................................... 7 4. Schematic of an optical dilatometer showing how the instrument can be configured
for volume swell with a low-power flat panel LED and for debonding with an oblique LED illuminator. ................................................................................................................. 8
5. Schematic of a thermal desorption GC-MS system ...........................................................10 6. Proposed molecular structures for the epoxy primer resin and crosslinker .......................13 7. Measured (top) and model (bottom) IR spectrum of the extracted epoxy resin
showing the peak assignments based on molecular modeling ...........................................14 8. Measured (top) and model (methyl terminated, bottom) IR spectrum of the extracted
epoxy catalyst showing the peak assignments based on molecular modeling ...................15 9. Proposed molecular structures for the polyurethane topcoat resin and crosslinker ...........16
10. Measured (top) and model (bottom) IR spectrum of the extracted polyurethane resin showing the peak assignments based on molecular modeling ...........................................17
11. Measured (top) and model (bottom) IR spectrum of the extracted polyurethane catalyst showing the peak assignments based on molecular modeling..............................18 12. Fractions of Polyurethane that represent carbonyl, carboxyl, and hydroxyl groups of polyurethane ..................................................................................................................21 13. Optimized geometry of epoxy with charge distributions of key atoms. Key:
gray = C, red = O, and white = H ......................................................................................21 14. Optimized geometry of polyurethane. Key: gray = C, red = O, white = H, and
blue = F ..............................................................................................................................22

iv
List of Figures (Continued) Figure Page
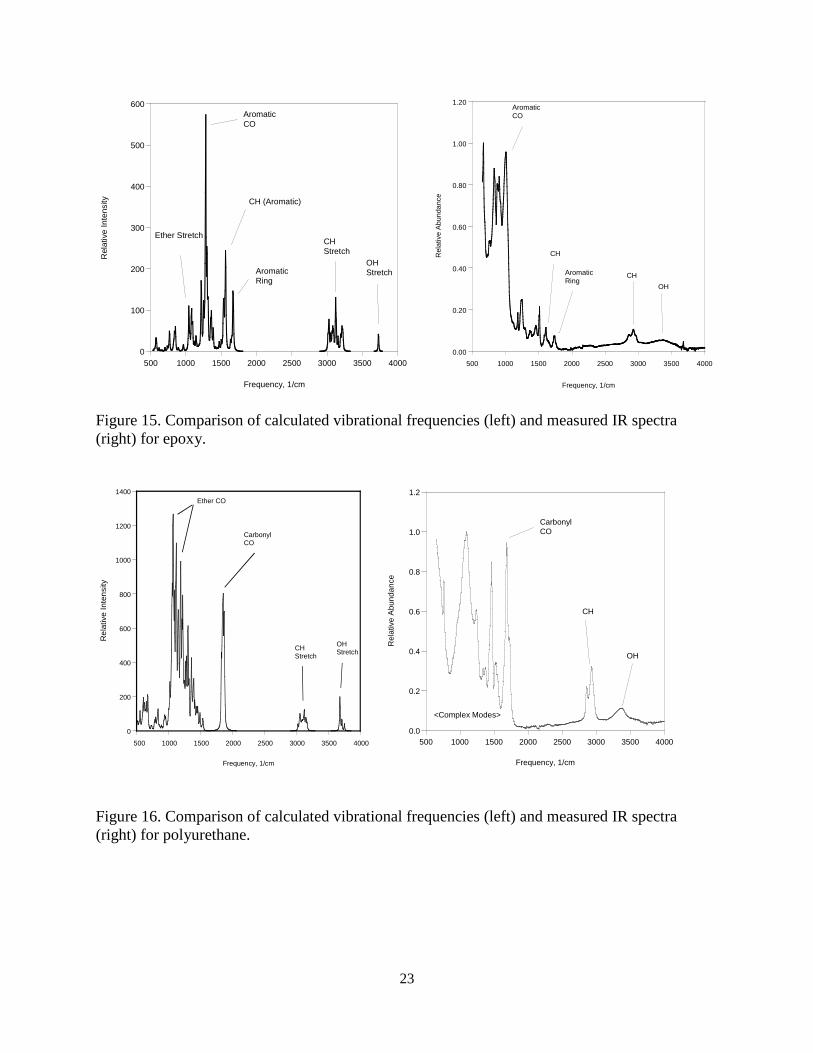
15. Comparison of calculated vibrational frequencies (left) and measured IR spectra (right) for epoxy .................................................................................................................23
16. Comparison of calculated vibrational frequencies (left) and measured IR spectra
(right) for polyurethane ......................................................................................................23 17. Epoxy-Phenol H-bonded complex: (a) double interaction, (b) single interaction ............24 18. Polyurethane fragment – Phenol H-bonded complexes .....................................................25 19. FTIR spectra in the region centered on 3300 cm-1 for the dry epoxy primer and
exposed to methylene chloride and 20 % phenol in methylene chloride. The spectrum for phenol is also shown .....................................................................................28
20. FTIR spectra in the region centered on 1100 cm-1 for the dry epoxy primer and
exposed to methylene chloride and 20 % phenol in methylene chloride. The spectrum for phenol is also shown .....................................................................................28
21. FTIR spectra in the region centered on 1700 cm-1 for the dry polyurethane topcoat
and exposed to 100% methylene chloride and 20 % phenol in methylene chloride. The spectrum for phenol is also shown ..............................................................29
22. FTIR spectra in the region centered on 3300 cm-1 for the dry polyurethane topcoat
and exposed to 100% methylene chloride and 20 % phenol in methylene chloride. The spectrum for phenol is also shown ..............................................................30 23. FTIR spectrum of the dry epoxy primer. Absorption peaks assigned to the primary groups of interest are marked ...............................................................................32 24. FTIR spectrum of the epoxy primer exposed to methylene chloride .................................33 25. FTIR spectrum of the epoxy primer exposed to 20% phenol in methylene chloride ........33 26. FTIR spectrum of the epoxy primer exposed to 20% phenol with 1% water in methylene chloride .............................................................................................................34 27. FTIR spectrum of the epoxy primer exposed to 20% benzyl alcohol in methylene
chloride ..............................................................................................................................34 28. FTIR spectrum of the epoxy primer exposed to 20% benzyl alcohol with 1% water
in methylene chloride .........................................................................................................35

v
List of Figures (Continued) Figure Page
29. Relative absorbance of the FTIR peak assigned to the Ph-(O-C) group in epoxy showing that the temporal behavior becomes very dynamic when water and phenol are present at the same time ...............................................................................................35
30. FTIR spectrum of the dry polyurethane topcoat. Absorption peaks assigned to the
primary groups of interest are marked ...............................................................................36 31. FTIR spectrum of the polyurethane topcoat exposed to methylene chloride ....................37 32. FTIR spectrum of the polyurethane topcoat exposed to 20% phenol in methylene
chloride ..............................................................................................................................37 33. FTIR spectrum of the polyurethane topcoat exposed to 20% phenol with 1% water
in methylene chloride .........................................................................................................38 34. FTIR spectrum of the polyurethane topcoat exposed to 20% benzyl alcohol in
methylene chloride .............................................................................................................38 35. FTIR spectrum of the polyurethane topcoat exposed to 20% benzyl alcohol with 1%
water in methylene chloride ...............................................................................................39 36. Relative absorbance of the FTIR peak assigned to the C-O-C group in the
polyurethane topcoat showing that the temporal behavior does not change when water is included in the solvent system..............................................................................39
37. Relative absorbance of the FTIR peak assigned to the C-O-C group in the
polyurethane topcoat showing that the temporal behavior becomes very dynamic when water and phenol are present at the same time .........................................................40
38. The normalized FTIR peaks assigned to C-O-C in the polyurethane topcoat showing
that the shoulder peak increases in intensity and shifts to lower frequency when phenol is present ................................................................................................................41
39. The ratio of the absorbance of the FTIR peak assigned to the parent C-O-C
group and a should peak associated with this group in the polyurethane topcoat showing that the relative size of the shoulder peak increases when phenol and phenol with water are added to the solvent system............................................................42
40. Summary of the solvents and molecular probes used in this study showing their
molecular structure and relative size. Key: carbon (gray), hydrogen (white), oxygen (red), nitrogen (blue), and chlorine (green ............................................................44

vi
List of Figures (Continued) Figure Page
41. Volume swell of the epoxy primer and polyurethane topcoat in methylene chloride blended with either phenol or hexadecane .........................................................................45
42. Volume swell of the epoxy primer and polyurethane topcoat in methylene chloride
blended with phenol, hexadecane, or styrene ....................................................................46 43. Volume swell of the epoxy primer and polyurethane topcoat in methylene chloride
blended with phenol, hexadecane, or toluene ....................................................................47 44. Volume swell of the epoxy primer and polyurethane topcoat in methylene chloride
blended with phenol, hexadecane, or benzene ...................................................................47 45. Volume swell of the epoxy primer and polyurethane topcoat in methylene chloride
blended with phenol, hexadecane, or benzyl alcohol ........................................................48 46. Volume swell of the epoxy primer and polyurethane topcoat in methylene chloride
blended with phenol, hexadecane, or cyclohexanol ...........................................................48 47. Volume swell of the epoxy primer and polyurethane topcoat in methylene chloride
blended with phenol, hexadecane, 1-butanol, 1-propanol, ethanol, or methanol ..............49 48. Volume swell of the epoxy primer and polyurethane topcoat in methylene chloride
blended with phenol, hexadecane, or acetone ....................................................................50 49. Volume swell of the epoxy primer and polyurethane topcoat in methylene chloride
blended with phenol, hexadecane, or acetonitrile ..............................................................50 50. Volume swell of the epoxy primer and polyurethane topcoat in methylene chloride
blended with phenol, hexadecane, or chloroform ..............................................................51 51. Volume swell of the epoxy primer and polyurethane topcoat in methylene chloride
blended with phenol, hexadecane, or carbon tetrachloride ................................................52 52. Volume swell of the epoxy primer and polyurethane topcoat in methylene chloride
blended with 20% phenol and 0-8% ethanol .....................................................................52 53. Volume swell of the epoxy primer and polyurethane topcoat in methylene chloride
blended with 20% phenol and 0-2% water ........................................................................53 54. Volume swell of the epoxy primer and polyurethane topcoat in methylene chloride
blended with 20% phenol, 8% ethanol, and 0-2.5% water ................................................54

vii
List of Figures (Continued) Figure Page
55. Aluminum panels after 30 minutes in selected neat solvents ............................................58 56. Aluminum panels after 30 minutes in methylene chloride with phenol ............................59 57. Aluminum panels after 30 minutes in methylene chloride with phenol and ethanol .........59 58. Aluminum panels after 30 minutes in methylene chloride with phenol, ethanol,
and water ............................................................................................................................60 59. Aluminum panels after 30 minutes in methylene chloride with ethanol and water,
and with phenol and water .................................................................................................60 60. Aluminum panels after 30 minutes in methylene chloride with benzyl alcohol and
water, and with cyclohexanol and water ............................................................................62 61. Aluminum panels after 30 minutes in methylene chloride with benzyl alcohol,
ethanol, anhydrous acetic acid, and water .........................................................................63 62. Aluminum panels after 30 minutes in methylene chloride with cyclohexanol,
ethanol, anhydrous acetic acid, and water .........................................................................64 63. Aluminum panels after 30 minutes in methylene chloride with cyclohexanol,
ethanol, anhydrous acetic acid, and water .........................................................................65 64. Example images of the epoxy primer/polyurethane topcoat system being removed
from a sapphire substrate as viewed from the underside. From left to right; the solvent arrives as the bonding interface, dimples form and grow, and the coating expands and separates from the surface .............................................................................65
65. Debonding as a function of time for 0-20% phenol in methylene chloride .......................66 66. Debonding as a function of time for 20% phenol and 0-8% ethanol in methylene
chloride ..............................................................................................................................67 67. Debonding as a function of time for 20% phenol with 8% ethanol and 0-2% water
in methylene chloride .........................................................................................................67 68. Debonding as a function of time for 20% phenol with 0-2% water in methylene
chloride ..............................................................................................................................68 69. Debonding as a function of time for 8% ethanol with 0-1% water in methylene
chloride ..............................................................................................................................69
viii
List of Tables Table Page
1 Solvent and Molecular Probes ............................................................................................ 4 2 Coating Materials ................................................................................................................ 4 3 MIL-R-81294D Control Formulation ................................................................................11 4 Primary Solvents and Molecular Probes Used in this Study .............................................12 5 Additional Molecular Probes Used in this Study ...............................................................13 6 Polymer-Solvent and Solvent-Solvent Interaction Energies and Bond Length .................26 7 Calculated and Measured Frequency Shifts (cm-1) of Epoxy OH and Ph-O-C Stretch Modes ....................................................................................................................27 8 Calculated and Measured Frequency Shifts (cm-1) of Polyurethane C=O and OH Stretch Modes ....................................................................................................................29 9 Summary of the Results of the 23 Factorial Study ............................................................55 10 Volume Swell of the Epoxy Primer and Polyurethane Topcoat in Methylene Chloride with Selected Phenols Blended at 10% v/v.........................................................56 11 Polymer/Fluid Partition Coefficients for Selected Solvents and Molecular Probes ..........71 12 Polymer/Fluid Partition Coefficients for the Components of a Model Solvent .................71

ix
List of Acronyms AFB Air Force Base APC Advanced Performance Coating® ATR Attenuated total reflectance BSSE Basis Set Superposition Error DFT Density Functional Theory FTIR Fourier transform infrared GC-MS Gas chromatograph-mass spectrometer HAP Hazardous air pollutant HSP Hansen solubility parameter HVLP High volume low pressure IR Infrared Ka Acid constant Kpf Polymer-fluid partition coefficient LED Light emitting diode MC/P Methylene chloride/phenol MEK Methyl ethyl ketone NESHAPS National missions Standards for Hazardous Air Pollutants Ph Phenyl R Generic organic group UDRI University of Dayton Research Institute VOC Volatile organic compound XPS X-ray photoelectron spectroscopy
x
Acknowledgements This work was supported by the U.S. Department of Defense Strategic Environmental Research and Development Program under Contract No. W912HQ-09-C-0023 (Technical Monitor: Mr. Bruce Sartwell). We would also like to acknowledge that the computational work was performed using supercomputing resources from the U.S. Environmental Protection Agency. We would also like to thank Mr. Bill Culhane, Coatings Group, University of Dayton Research Institute, for his assistance in this program.
Keywords Alternative, Chemical Paint Stripping, Coating, Depainting, Debonding, Environment, Methylene Chloride, Phenol, Solvent, Volume Swell

xi
Abstract Objectives The objective of this program was to obtain a sound understanding of how methylene chloride/phenol-based (MC/P) paint strippers function by understanding the specific roles of the primary paint stripping components; methylene chloride, phenol, ethanol, and water. Technical Approach This was accomplished through s series of tasks including sample selection, conceptual and computational molecular modeling, infrared spectroscopy, measurements of volume swell, the extent and rate of debonding and the analysis of the solvent absorbed by a model coating system. Results The results show that while methylene chloride is a major component of many paint stripping formulations, its interactions with the coatings themselves is relatively weak. However, its small size, its weak interactions with the bulk solvent and its ability to form weak hydrogen bonds with the coatings combine to make this an efficient penetrant that rapidly diffuses into the coatings, causing them to swell and soften, and as a carrier for other solvent components, most notably phenol. Phenol is a very unique molecule that is relatively small and capable of forming exceptionally strong hydrogen bonds with the coatings making it a powerful penetrant. However, unlike methylene chloride, phenol is a solid under normal conditions and requires a carrier solvent to be effective. The unique properties of phenol arise from a very special relationship between the aromatic ring and its hydroxyl group. Briefly, this group would ordinarily by itself form strong hydrogen bonds with the coatings, but it would also form strong hydrogen bonds with other phenol molecules in the solvent resulting in a relative poor penetrant. However, in phenol the hydroxyl oxygen shares electrons with the aromatic ring, delocalizing the oxygen’s electronegative charge, and making phenol a strong hydrogen bond donor, but a comparatively weak hydrogen bond acceptor. The result is that it penetrates the coatings with a solubility that is approximately 7 times higher than methylene chloride. However, this by itself is insufficient to effectively remove the coatings. For this phenol has another unique characteristic. The same molecular structure than makes phenol an efficient penetrant also makes it a weak organic acid. Specifically, the water present in the solvent reacts with the phenol to produce phenoxy (PhO-) and hydronium (H3O+) ions. These can then react with hydrogen bond donor and acceptor sites in the coatings, physically fracturing the coatings and cleaving the intermolecular bonds holding the coatings to the surface. Ethanol itself does not seem to participate in the paint stripping process, but instead serves to increase the solubility of water in the solvent phase. Benefits This study has shown that the two most significant functions of a paint stripping solvent are to penetrate the coating to deliver a weak organic acid to the bonding interface. In the near term it suggests that the performance of some alternative paint strippers may be improved by including a weak organic acid. In the long term, this provides a framework to developing new paint removal systems. Specifically, methylene chloride could be eliminated if an alternative means of accessing the bonding interface could be devised. This in turn would allow the use of a weak organic acid other than phenol, resulting in an environmentally acceptable paint stripping method.

1
Section 1
Objective The technical objective of this program was to achieve a fundamental understanding of how chemical paint strippers based on methylene chloride and phenol (MC/P) remove organic coatings, and by extension, build a general understanding of how other potential chemical paint strippers function. The specific objective was to develop an understanding how each of the major components of a typical MC/P system (methylene chloride, phenol, ethanol, and water) participate in the coating removal process. The original working hypothesis that formed the basis of the overall technical approach was that the paint stripping process was driven by the same processes that govern the interactions between solvents and polymers; that is, the solvent penetrates the coatings via the exchange of polymer-polymer intermolecular bonds with polymer-solvent intermolecular bonds and that the removal of the coating proceeds by a similar mechanism whereby the polymer-surface intermolecular bonds are replaced by polymer-solvent intermolecular bonds.

2
Section 2
Background It is common practice throughout the aerospace industry to apply protective coatings to finished parts, components, and even entire aircraft. These coatings provide environmental protection, reduce visual, infrared, or radar signature, and are used to control the visual appearance of an aircraft or subsystem. Throughout the useful life of a system many of these coatings must be periodically removed to conduct inspections, repairs, or the coating itself needs to be replaced. Historically, coatings have been removed through the use of solvents that aggressively interact with the coating, but not with the substrates, allowing the coating to be easily removed without damaging the underlying surface. Unfortunately, the solvents used in these operations often include components that are considered hazardous air pollutants (HAPs) as defined under the 1970 Clean Air Act (and as amended in 1990) and subsequently regulated through such standards as the Aerospace National Emissions Standards for Hazardous Air Pollutants (NESHAPS).1 Despite the problems associated with meeting strict air emission standards, chemical stripping remains one of the most favored options for removing coatings due in large part to its familiarity, effectiveness, and simplicity.2 Numerous efforts have been made to identify replacement solvents that offer the same level of technical and economic performance as traditional solvents but without the environmental burden. Several alternative solvent systems have been proposed but few have achieved the general acceptance and broad success of the more conventional solvent systems, most notably methylene chloride/phenol-based (MC/P) solvents. For example, Pepple describes in general terms the use of alternative paint strippers formulated with water, formic acids, benzyl alcohol, and peroxides. Facilities testing these alternatives reported concerns on the quality, time, expense and potential damage to aircraft resulting from the use of these chemicals.3 Bauer and Ruddy describe the use of non-HAP chemical strippers based on benzyl alcohol blended with an amine or ammonia compound (alkaline stripper) or formic acid (acid stripper). These were generally found to be effective, though they work more slowly and they were not able to completely remove some types of coatings. An additional problem with these formulations is that while they are considered non-HAP, they contain volatile organic compounds (VOCs) which must be controlled.4 Korish reports on tests conducted at the Oklahoma City Air Logistics Center (Tinker AFB) on the use of a mixture of dimethyl esters as an alternative to methyl ethyl ketone (MEK) for removing coatings from composite radomes. In this study it was found the alternative was in many ways easier to work with than the original MEK, primarily because of the lower vapor pressure of the dimethyl esters, though the alternative solvent was slower and somewhat less effective than MEK.2 Howell, Springer, and Marquis also describe the process by which a replacement was sought for the MEK being used at Tinker AFB.5 In this case the authors used Hildebrand and Hansen solubility parameters to establish initial formulations for replacement solvents. Subsequent testing revealed somewhat serendipitously that the addition of water to MEK improved its performance which in turn suggested the role of hydrogen bonding in the depainting application being studied. Newman describes an interesting chemical stripping system based on benzyl alcohol and peroxide.6 In this system the benzyl alcohol serves as a carrier to penetrate and soften the coating while the peroxide decomposes into oxygen and water which acts as a blowing agent to mechanically debond the coating. This system can work quite well, but

3
there concerns about the stability of the solvents as well as corrosion and embrittlement of some metals and alloys. The Newman paper is also one of the very few that discusses the mechanism of paint removal, at least in general terms. In this specific case the benzyl alcohol is described as serving as a carrier for the hydrogen peroxide. Once transported within the interstitial spaces of the polymer films the hydrogen peroxide decomposes into oxygen and water which mechanically debonding the film from the substrate. By their nature, paints and other protective coatings are robust materials that are difficult to remove. To overcome this inherent environmental resistance, coating removal solvents function through a combination of processes. First, the solvent must wet the surface and penetrate the coating, causing it to soften and swell; this imparts shear stress at the bonding interface which helps to separate the coating from the substrate. Second, the solvent must weaken the bond between the coating and substrate so it can be easily removed. Ideally, this combination of a softened and swollen coating and a weakened interfacial bond will result in the complete separation of the coating from the substrate. At its most fundamental level, the proposed mechanism of chemical paint stripping is one of exchanging intermolecular bonds between the solvent and coating, a process that is governed by the chemical physics of polymer solutions.7-10 Thermodynamically, this process can be described as a series of discrete steps beginning with the separation of the solvent molecules from the bulk fluid. Next, adjacent polymer strands at the polymer surface must be separated to open a cavity large enough to accept the solvent molecule. Finally, the solvent molecule is inserted into the polymer and creating polymer-solvent bonds. A similar process is repeated in the bulk coating until the solvent molecules reach the coating-substrate boundary where polymer-surface bonds must be exchanged with polymer-solvent bonds to form surface-solvent bonds. Energetically, this process can be expressed as the breaking of solvent-solvent intermolecular bonds (requiring energy), the separation of the polymer-polymer intermolecular bonds (requiring energy), and the making of polymer-solvent intermolecular bonds (releasing energy). Considering the overall energy balance of these processes, the strength of interaction between the solvent and polymer, and hence the effectiveness of the chemical stripper, depends on the intermolecular bonding of the polymer, the physical properties of the polymer, the intermolecular bonding of the solvent, and the molar volume and geometry of the solvent penetrant molecules. Based on this discussion a program was designed to investigate how the major components of a typical chemical paint stripper function to remove aerospace coatings. Briefly, this program included the selection of a model coating system and solvents, developing conceptual and computational molecular models for the various solvent and coating interactions, and measuring the strength of interaction between the solvent components and coatings in terms of cohesion (polymer-polymer interactions) and adhesion (polymer-surface interactions).
4
Section 3
Materials and Methods 3.1 List of Materials
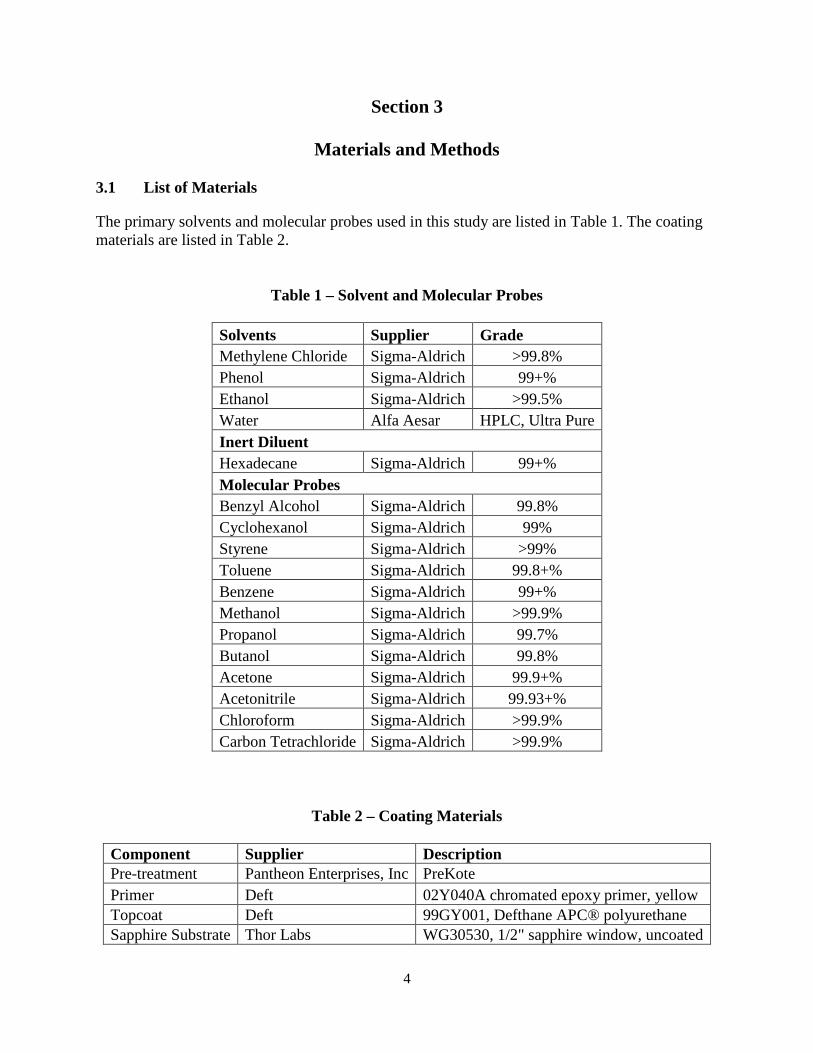
The primary solvents and molecular probes used in this study are listed in Table 1. The coating materials are listed in Table 2.
Table 1 – Solvent and Molecular Probes
Solvents Supplier Grade Methylene Chloride Sigma-Aldrich >99.8% Phenol Sigma-Aldrich 99+% Ethanol Sigma-Aldrich >99.5% Water Alfa Aesar HPLC, Ultra Pure Inert Diluent Hexadecane Sigma-Aldrich 99+% Molecular Probes Benzyl Alcohol Sigma-Aldrich 99.8% Cyclohexanol Sigma-Aldrich 99% Styrene Sigma-Aldrich >99% Toluene Sigma-Aldrich 99.8+% Benzene Sigma-Aldrich 99+% Methanol Sigma-Aldrich >99.9% Propanol Sigma-Aldrich 99.7% Butanol Sigma-Aldrich 99.8% Acetone Sigma-Aldrich 99.9+% Acetonitrile Sigma-Aldrich 99.93+% Chloroform Sigma-Aldrich >99.9% Carbon Tetrachloride Sigma-Aldrich >99.9%
Table 2 – Coating Materials
Component Supplier Description Pre-treatment Pantheon Enterprises, Inc PreKote Primer Deft 02Y040A chromated epoxy primer, yellow Topcoat Deft 99GY001, Defthane APC® polyurethane Sapphire Substrate Thor Labs WG30530, 1/2" sapphire window, uncoated

5
3.2 Preparation of Free-standing Films
The source materials for free-standing films of the epoxy primer (Deft 02Y040A, chromated epoxy primer, yellow) and polyurethane topcoat (Deft 99GY001, Defthane APC® polyurethane) were prepared and applied in accordance with the manufacturer’s instructions using a standard high-volume, low-pressure (HVLP) spray gun. The substrate for each coating was a smooth 12”x12” polystyrene sheet that had been cleaned with methyl ethyl ketone (MEK) to remove any dirt or oil. After applying a layer of the coating the sheet was allowed to dry for 1 or more days at room temperature, and then placed in a vacuum chamber for 2 hours at -25 inches of mercury pressure to enhance the removal of residual solvent. This process was repeated 6 times to give a final coating thickness of approximately 0.25 mm. The coated panels were then allowed to cure for 2 weeks at room temperature before removing the coatings from the backing sheets (see Figure 1). After removing the coatings from the polystyrene sheet small stock samples measuring approximately 2mm x 2mm were cut from each piece and placed in clean glass vials (see Figure 2). To reduce the residual solvent content and to advance the cure to the point where additional curing at room temperature would be minimal the prepared specimens were heated to 95°C for 2 hours in air, then cooled to room temperature and stored in closed glass vials.
Figure 1. Example of a free-standing sample of the epoxy primer being separated from its polystyrene backing sheet.

6
Figure 2. Examples of free-standing samples prepared for volume swell analysis; epoxy primer on the left, polyurethane topcoat on the right. 3.3 Preparation of Coated Samples
Coated samples were prepared in the form of coated aluminum panels (12”x12”x0.032” AA 2024-T3) and sapphire windows (Thor Labs, WG30530, 1/2" sapphire broadband precision window, uncoated). Prior to coating, the sapphire windows were roughened using #120 optical abrasive to improve the quality of the adhesion between the substrate and the coating. This condition also simulates the roughening of the aluminum panels that is part of the standard procedure for preparing these test specimens. The aluminum panels and sapphire windows were cleaned, treated with PreKote, and coated with the epoxy primer and polyurethane topcoat as per the manufacturer’s instructions. The freshly coated samples were then allowed to cure for 2 weeks prior to testing. After this curing period, the aluminum panels were cut into ½” square samples and stored in clean glass bottles. The sapphire windows were used as-received and stored in their original shipping containers. Examples of coated samples are shown in Figure 3. 3.4 FTIR Spectra of Free-standing Films
An ATR-FTIR (TravelIR, SensIR Technologies) was used to obtain FTIR spectra of the free-standing films used in this study. To accommodate these samples a pressure-plate was designed to hold the films against the FTIR’s diamond crystal lens and to allow solvents to be applied to the sample in situ. Specifically, the aluminum pressure plate had two ¼” holes spaced 1 inch apart that were connected with a groove etched into the bottom (coating) side of the panel. The groove ran directly over the FTIR’s diamond crystal lens and allowed solvent that was applied to the film through one of the ¼” holes to wick along the groove and directly over the lens. Sample spectra were taken as the average of 64 scans from 650-4000 cm-1 minus a background scan.

7
This process was repeated every 5 minutes for 1 hour with fresh solvent applied immediately prior to obtaining each spectrum.
Figure 3. Example coated test samples; ½” square aluminum panels (left) and ½” sapphire windows (right). 3.5 Volume Swell
Volume swell was measured using optical dilatometry. As illustrated in Figure 4, an optical dilatometer consists of an optical cell positioned over a small digital camera and illuminated from above with a small flat panel LED. For each analysis small samples measuring approximately 2mm x 2mm were placed in the optical cell along with 5 mL of solvent. The sample was then positioned near the center of the cell and the cell mounted over the camera on the optical stage. Starting at 30 seconds after being immersed in the solvent the sample was digitally photographed every 10 seconds for the next 30 minutes. After the aging period was complete the cross-sectional area of each sample was extracted from the digital images using ImageJ (National Institutes of Health) and taken as a characteristic dimension proportional to the volume. Specifically, the volume swell was taken as;
%1001(i) Swell Volume2/3
0
×
−
=
AAi
Where A0 and Ai are the cross sectional areas of the sample at time 0 and time i. The final volume swell for each sample was taken as the average of the last five data points in each set. The final volume swell for each condition was taken as the average of at least 2 samples.
8
Digital Camera
Oblique Illuminator(Debonding)
Sample
Optical CellSolvent
Optical Stage
Computer
0.3W Flat Panel LED Illuminator(Volume Swell)
Figure 4. Schematic of an optical dilatometer showing how the instrument can be configured for volume swell with a low-power flat panel LED and for debonding with an oblique LED illuminator. 3.6 Extent of Debonding
The extent of debonding was measured using a method based on the test procedures described in MIL-R-81294D. Specifically, for each analysis a coated ½” square test panel was immersed in the solvent for 30 minutes. Following the exposure, the panel was removed from the solvent, rinsed with deionized water, and wiped gently with a cotton swab to remove any of the coating that was removed by the solvent but still clinging to the sample. Care was taken not to physically remove any coating that was still bound to the panel. The panels were then allowed to air dry at room temperature for approximately 7 days and then photographed to record the condition of the panel. 3.7 Rate of Debonding
The rate of debonding was measured using a modified form of an optical dilatometer as shown in Figure 4. In this configuration the sample is placed in the optical cell with the coated face up being viewed from below using the camera. To enhance the appearance of any changes in the contact surface a bright LED illuminator is placed under the optical stage to illuminate the underside of the sample at an oblique angle. To further enhance subtle changes that occur in the sample the source images are normalized by the first image in the sequence. This process emphasizes differences in the images using the first image as a reference frame. For each analysis the sample is placed in a wire fixture that centers the sample in the optical cell. The optical cell is filled with 5 mL of the test solvent; the sample is placed in the cell, sealed, placed on the optical stage, and continuously photographed at a rate of approximately 1.7 seconds per

9
frame for the next 30 minutes. Following this exposure, the fraction of bound area as a function of time is measured as;
%100(i)Area Bound0
×=BBi
Where B0 and Bi are the bound areas of the sample at time 0 and time i as measured using ImageJ. 3.8 Polymer-Fluid Partition Coefficients
Polymer-fluid partition coefficients (Kpf) were used to measure the strength of interaction between the solvents and polymers in terms of their relative solubility. Specifically, Kpf is the ratio of the concentration of a solvent component in the polymer to its concentration in the overlying fluid;
f
ppf A
AK
][][
=
Where [A]p is the concentration of component A in the polymer and [A]f is the concentration of component A in the fluid. For simplicity, the concentration was measured in terms of the chromatographic peak area counts per unit volume of polymer or fluid. These values were measured for the solvent components and molecular probes and very low concentration (0.05 M) in hexadecane and at relatively high concentration in a model solvent formulation. For the dilute solutions Kpf values were measured using thermal desorption GC-MS. For the model solvent Kpf values were measured using solvent extraction GC-MS. Both analyses were conducted using the thermal desorption GC-MS outlined in Figure 5. Briefly, this system consists of an Agilent 5890/5970B GC-MS fitted with a heated inlet system through a cold trap. (The cold trap permits off-column trapping and was not used in this study.) Briefly, samples were prepared by immersing samples of each coating the test solvent for 7 days at room temperature. The volume of the swollen samples was determined from their initial dry weight, density, and measured volume swell in the test solvent. Thermal desorption samples were removed from the solvent, dabbed dry with a laboratory tissue, placed on a quartz probe, and sealed in the solids inlet where they were desorbed at 280°C for 5 minutes. Solvent extracted samples were removed from the solvent, dabbed dry with a laboratory tissue, placed in an amber vial along with 3 mL of N,N-dimethylacetamide for 24 hours at room temperature.

10
Gas Chromatograph
MSD
MSD Workstation
HeatedInjectionAssembly
CoolantSplit/Vent
Cold Trap
Solids Inlet/Probe
Liquids Inlet/Syringe
Figure 5. Schematic of a thermal desorption GC-MS system.

11
Section 4
Results and Discussion 4.1 Task 1 – Material Selection & Preparation
The purpose of this task was to select and prepare all of the samples used in this study. This included identifying the specific coating system to be examined along with the specific solvents and molecular probes. After consulting with UDRI’s Nonstructural Materials Division and the Coating Technology Integration Office at Wright Patterson Air Force Base a coating system composed of one epoxy-based primer and one polyurethane-based topcoat were selected. The primer selected was Deft 02Y040A chromated epoxy primer (yellow) and the topcoat was Deft 99GY001 Defthane APC® polyurethane. Samples of these two materials were prepared in two forms; one to provide free-standing monolithic samples for cohesion testing (volume swell) and spectroscopic analysis, and the other that closely mimics the coatings actually applied to aircraft in the form of coated aluminum panels. A subset of the later was applied to sapphire substrates to allow the debonding process to be observed from the underside of the coating. Details of the sample preparation may be found in Section 3. The primary solvents used in this study were selected based on those found in common paint stripping formulations. As an example depainting solvent the control formulation is described in section 4.6.6.2 of MIL-R-81294D was taken as a model system. The formulation, as described in this document based on the weight fraction of each component, is summarized in Table 3. Also given in this table is the formulation based on the volume fraction of each component as well as a description of the possible function of each component as considered prior to completing this study.
Table 3 - MIL-R-81294D Control Formulation
Component Possible Function %m/m %v/v Methylene Chloride Primary Solvent/Penetrant 60.6 54.1 Phenol Primary Active Solvent 15.8 17.5 Water Sodium Chromate Carrier 6.8 8.0 Ethanol Co-solvent to improve water solubility? 5.8 8.7 Sodium Petroleum Sulfonate Surfactant? 5.5 5.9 Paraffin Wax Thickener? Evaporation Cap? 1.9 2.5 Toluene Paraffin Wax Carrier 1.3 1.8 Hydroxypropyl Methylcellulose Thickener 1.3 1.1 Sodium Chromate Corrosion inhibitor 1.0 0.4
Gray indicates components of secondary interest

12
Based on the formulation described in Table 3 the primary components of interest include the methylene chloride, phenol, ethanol, and water. In addition to these solvents, additional components were selected to examine specific molecular functions including the roles of molar volume, polarity, and hydrogen bonding, The overall list of solvents selected for this program are summarized in Table 4 along with their respective Hansen solubility parameters (HSPs)11.
Table 4 – Primary Solvents and Molecular Probes Used in this Study
Component Solubility Parameters, MPa1/2 Molar Volume Dispersion Polarity H-Bonding mL/Mol
Primary Solvents Methylene Chloride 18.2 6.3 6.1 64 Phenol 18.0 5.9 14.9 88 Ethanol 15.8 8.8 19.4 59 Water 15.5 16.0 42.3 18 Inert Diluent Hexadecane 16.3 0.0 0.0 294 Molecular Probes Benzyl Alcohol 18.4 6.3 13.7 104 Cyclohexanol 17.4 4.1 13.5 106 Styrene 18.6 1.0 4.1 116 Toluene 18.0 1.4 2.0 107 Benzene 18.4 0.0 2.0 89 Methanol 15.1 12.3 22.3 41 Propanol 16.0 6.8 17.4 75 Butanol 16.0 5.7 15.8 92 Acetone 15.5 10.4 7.0 74 Acetonitrile 15.3 18.0 6.1 53 Chloroform 17.8 3.1 5.7 81 Carbon Tetrachloride 17.8 0.0 0.6 97
In addition to the primary solvent and molecular probes used in this study, and small number of molecular probes were selected to examine the effect of altering the acidity of the hydroxyl hydrogen of phenol. For this purpose the molecular probes along with the associated acid constants (Ka values) are summarized in Table 5. 4.2 Task 2 - Molecular Modeling
The purpose of this task was to establish a theoretical basis for the interactions between the primary solvent components and the selected coatings. This included proposing the basic molecular structures of the coatings based on the available information and developing conceptual and computational molecular models that describe how the solvent components may interact with these structures.

13
Table 5 – Additional Molecular Probes Used in this Study
Name Ka Molar Volume 10-10 mL/mol
Phenol 1.1 87.9 o-Fluorophenol 15 111.6 m-Fluorophenol 5.2 112.1 p-Fluorophenol 1.1 114.9 o-Chlorophenol 77 101.9 m-Chlorophenol 16 105.6 p-Chlorophenol 6.3 139.8
4.2.1 Proposed Molecular Structures
Information obtained from the manufacture’s material data safety sheets and product labeling suggests that the epoxy primer is a bisphenol A/epichlorohydrin based epoxy resin cured with a polyamide catalyst. Polyamide catalysts (epoxy crosslinkers) have the general formula of NH2-R-NH2. In a simple system R is an alkyl chain whose length is determined by the desired properties of the cured epoxy; the shorter the chain the harder the cured polymer. The proposed molecular structure of the cured epoxy resin and crosslinker are shown in Figure 6. To determine if the proposed structures of the epoxy primer and polyamide catalyst were reasonable a set of IR spectra were obtained on the epoxy resin and catalyst and compared with the predicted IR spectra based on the models described above. To isolate the epoxy resin and polyamide from the solvents and pigments present in the source material the samples were first extracted with acetone, and then blown to dryness on glass plates. The resulting spectra are shown in Figures 7 and 8 for the epoxy resin and catalyst, respectively. These show that all of the major absorption features in the sample spectra are accounted for by the model spectra indicating the proposed structures are reasonable.
C-- --
C
-- --
CO C
-- C
--
O-
H
C
-- O
n
C
-- C
-- C
-- C
-- C
-- C
-- NN
Epoxy Resin
Aliphatic Diamine Crosslinker
Figure 6. Proposed molecular structures for the epoxy primer resin and crosslinker.

14
0
20
40
60
80
1005001000150020002500300035004000
Tran
smis
sion
, %
Frequency, 1/cm
OH
CH
Aromatic Ring
CH
Aromatic CHAromatic CO Aromatic
Complex
< Complex Modes >
0
50
100
150
200
250
300
5001000150020002500300035004000
Rel
ativ
e In
tens
ity
Frequency, 1/cm
OH
CH
Aromatic Ring
CH
Aromatic CH
Aromatic CO
Aromatic
Complex
Figure 7. Measured (top) and model (bottom) IR spectrum of the extracted epoxy resin showing the peak assignments based on molecular modeling.

15
0
20
40
60
80
1005001000150020002500300035004000
Tran
smis
sion
, %
Frequency, 1/cm
CH
CH
CC,CN
NH?
< Complex Modes >
NH
0
50
100
150
200
250
300
350
5001000150020002500300035004000
Rel
ativ
e In
tens
ity
Frequency, 1/cm
CH
CH
CC,CNC H
CH
NH
Figure 8. Measured (top) and model (methyl terminated, bottom) IR spectrum of the extracted epoxy catalyst showing the peak assignments based on molecular modeling.

16
The polyurethane topcoat is a two-component polyurethane formulated with a fluorinated polyol resin cured with 1,6-hexamethylene diisocyanate homopolymer. The specific molecular structure of the fluorinated polyol resin is proprietary. However, an example fluorinated polyol system used as part of an advanced performance coating (APC) has been described by the Materials S&T Division at the Office of Naval Research as shown in Figure 9 along with the diisocyanate crosslinker. In a manner similar to that used in the analysis of the epoxy primer, FTIR spectra were obtained of the polyurethane resin and catalyst after acetone extraction as well as predicted spectra (see Figures 10 and 11) and these confirmed that the proposed molecular structures are reasonable.
O C
=OC
--- -
F
FC
-- C
=O-O-- - C
-- C
--- -
C- --- -
-
C
C- -F F-
O-
C=O--
-
- C-- C-C=O-
O-
H
-H C
-- -O C
=O- - C
-- C
--
F
F- -O C
=O- - C
--
C- -F F-- -
-C
--C
-
H
- C
-- -O C
=O- - C
-- C
--- - C
=O-O- C
-- C
--- -
C- --- -
-
C
C- --
O-
C=O--
-
- C-- C-C=O-
O-
H
C
--
FF
F
F-O C
=O- - C
-- C
--- - C
=O-O- C- C
--
C-- -
-
C
-F
-
F
--
C- -O-
H
-
C
--- -O- H
n
O
-
N C
C
CNN
- -
-
--
-
C
----
- - - - -
C
-- C
-- C
-- C
-- C
-- C -
- --
- - - - - =
C -- C -
- C -- C -
- C -- N C O=
C- --
--
--
--
=C
- -C
- -C
- -C
- -C
- -NC
O=
N==CO
=O
=O
=O
Polyurethane Resin
1,6-Hexamethylene Diisocyanate Crosslinker
Figure 9. Proposed molecular structures for the polyurethane topcoat resin and crosslinker.

17
0
20
40
60
80
1005001000150020002500300035004000
Tran
smis
sion
, %
Frequency, 1/cm
< Complex Modes >
OH
CH
CO
0
100
200
300
400
500
600
700
5001000150020002500300035004000
Rel
ativ
e In
tens
ity
Frequency, 1/cm
< Complex Modes >
OH
CH
CO
Figure 10. Measured (top) and model (bottom) IR spectrum of the extracted polyurethane resin showing the peak assignments based on molecular modeling.

18
0
20
40
60
80
1005001000150020002500300035004000
Tran
smis
sion
, %
Frequency, 1/cm
< Complex Modes >
CH
CONCO
0
200
400
600
800
1000
1200
1400
5001000150020002500300035004000
Rel
ativ
e In
tens
ity
Frequency, 1/cm
< Complex Modes >CH
CO
NCO
Figure 11. Measured (top) and model (bottom) IR spectrum of the extracted polyurethane catalyst showing the peak assignments based on molecular modeling.

19
The surfaces selected for the debonding task include aluminum (2024-T3) and sapphire. Sapphire was selected as a transparent substrate based on the fact that clean aluminum quickly oxidizes when exposed to air so that the actual bonding surface of aluminum is aluminum oxide while sapphire is essentially fully densified aluminum oxide. To illustrate that the composition of the two surfaces were similar an elemental analysis of both was conducted using X-ray photoelectron spectroscopy (XPS). This showed that the aluminum surface was composed of approximately 20 atom% aluminum and 42 atom% oxygen while the sapphire substrate consisted of approximately 16 atom% aluminum and 43 atom% oxygen (the balance being carbon and other minor components). This shows that both the aluminum and sapphire substrates can be modeled as metal oxide surfaces. 4.2.2 Conceptual Molecular Modeling
Conceptual molecular model consists of examining the molecular structures of the surfaces, coatings, and solvents and proposing how these structures interact with each other. Of particular interest is possible hydrogen bonding interactions as these are the strongest of the intermolecular bonding forces. Starting at the bonding surface, the oxygen atoms on the exposed surface of the substrate can serve as hydrogen bonding acceptor sites with the hydroxyl groups within the epoxy primer (see Figure 6) bonding to these sites. The aromatic hydrogens within the epoxy structure may also serve as weak hydrogen bonding donor sites. Within the epoxy primer itself, the cohesion is likely dominated by these same two groups (hydroxyl and aromatic hydrogens) serving as hydrogen bonding donor sites and the ether groups along the polymer backbone and the π electrons of the epoxy phenyl groups serving as hydrogen bonding acceptor sites. With respect to the adhesion between the topcoat and primer there may be some limited interdiffusion between the two coatings at the time of application, but at the molecular level there are abundant opportunities for hydrogen bonding between hydrogen bonding donor and acceptor sites within the epoxy primer and polyurethane topcoat (see Figure 9). Specifically, within the polyurethane the hydroxyl groups can serve as hydrogen bonding donor sites while the carbonyl and ether groups can serve as hydrogen bonding acceptor sites. Recalling that the solvent components that are of primary interest in this study include methylene chloride, phenol, ethanol, and water, hydrogen bonding likely plays a very important role in how these components participate in the paint stripping process. Specifically, based on this conceptual model, both the adhesion of the coatings to each other and cohesion of the coatings to themselves is dominated by strong hydrogen bonds between various hydrogen bonding donor and acceptor sites within the polymers. Furthermore, the adhesion of the epoxy primer is likely dominated by hydrogen bonding between hydrogen bonding donor sites within the epoxy and hydrogen bonding acceptor sites across the metal oxide surfaces. In a purely solvent model (no chemical reactions) it is proposed that methylene chloride serves primarily as a penetrant and carrier that penetrates the molecular structure of the coatings causing them to swell and soften. The methylene chloride also solvates the phenol, ethanol, and water, reducing the strength of solvent-solvent interactions making it energetically favorable for these components to partition into the polymer coatings where they can form strong hydrogen bonds with the polymer molecules, supplanting polymer-polymer and polymer-surface bonds resulting in the debonding of the coating from the surface.

20
4.2.3 Computational Molecular Modeling
The conceptual molecular model described above can serve as a basis for designing laboratory experiments, but by itself it is of limited value. However, this approach can also serve as the basis to build computational models to help determine if there is any validity to the proposed mechanism. Specifically, computational molecular modeling was used to estimate the strength of solvent-solvent, polymer-polymer, and polymer-solvent interactions in terms of the strength of the intermolecular bonding between the various model systems, the intermolecular bond length, and the shift in the functional group vibration frequency. The molecular interactions between paints and solvents and between solvents were investigated with Density Functional Theory (DFT) using Gaussian 03 and 09 ab initio computer codes.12 The properties calculated using DFT are atomic charge distribution, intermolecular bonding energy, vibrational frequency, and frequency shift due to the molecular interactions. All calculations were carried out using hybrid density functional theory, B3LYP, with 6-31G(d) basis set.13 Charge distribution was calculated using CHelp scheme, and used to predict most probable intermolecular bonding sites.14 It is assumed that the most negatively charged atom in coating forms the strongest molecular bond with the hydroxyl H in phenol, which is the most positively charged atom in phenol, and the most positively charged H atoms in each coating forms the strongest intermolecular bond with the hydroxyl O in phenol, which is the most negatively charged atom in phenol. The vibrational frequency of functional groups within the epoxy and polyurethane and their frequency shifts were compared with measured FTIR spectra. Intermolecular bond energies were calculated based on the enthalpies of reactions (ΔHrxn) at 298 K. The energy difference between reactants and complexes as expressed below: Bond Energy = ΔHf(298)(coating) + ΔHf(298)(phenol) – ΔHf(298)(coating-phenol complex) (1) The Basis Set Superposition Error (BSSE) corrections were taken into account using the counterpoise method. The origin of BSSE lies in the possibility that the unused basis functions of the second unit in the associated complex may augment the basis set of the first unit, thereby lowering its energy compared to a calculation of this unit alone. The first unit will cause a similar error on the second. The counterpoise correction proposed by Boys and Bernardi has been the most popular means of correcting for BSSE, and was applied in this study.15 To study epoxy and polyurethane interaction with phenol and other solvents their monomer was used. The epoxy used in this study was Bisphenol A / Epichlorohydrin based epoxy resin. The basic structure of the cured epoxy may be expressed as shown in Figure 6. For the purposes of this study right and left sides of the monomer were terminated with phenyl and methoxy groups, respectively, to maintain the neighboring environment of the terminal atoms (O on the right and phenyl C on the left side of monomer). The molecular structure of polyurethane used in this study is shown in Figure 9. Because of the size of this monomer, the interaction calculations with phenol were performed using 4 different fragments as shown in Figure 12. The places where phenol forms strong H-bond are carbonyl, ether, and hydroxyl groups. These 4 fragmented structures are necessary and sufficient to represent any part of polyurethane structure. The fragmented structures were also developed to conserve the neighboring environments of carbonyl, ether, and hydroxyl groups of the original polyurethane monomer.

21
H3C CH2C O
CH3
CH3
C CH3
O
H3C CF2C O
CH3
CH3
C CH3
O (a) (b)
H3C C C O
CH3
CH3
F2C CH3
O
H3C CH2C O
CH3
CH3
H
(c) (d) Figure 12. Fractions of Polyurethane that represent carbonyl, carboxyl, and hydroxyl groups of polyurethane Figures 13 shows optimized geometries and calculated atomic charge for key atoms for epoxy. Oxygen atoms in ether and hydroxyl groups are the most negatively charged atoms, ranging from -0.485 to -0.576. Hydrogen in hydroxyl group is the most positively charged terminal atom (+0.418). Hydrogen other than hydroxyl H are relatively neutral ranging from -0.051 to 0.054. Therefore, these atoms were not considered as significant intermolecular bonding sites. Atoms in the phenyl and methoxy groups that terminate the epoxy monomer are also not considered as significant intermolecular bonding as their primary functions are to terminate monomers while maintaining neighboring environment of monomer end atoms. Based on the charge distribution analysis it is expected that hydroxyl H in phenol forms an H-bond with ether and hydroxyl O in epoxy, and hydroxyl H in epoxy forms H-bond with hydroxyl O in phenol.
Figure 13. Optimized geometry of epoxy with charge distributions of key atoms. Key: gray = C, red = O, and white = H.

22
Figure 14 shows optimized geometries and calculated atomic charge range for key atoms for polyurethane. The charge for carbonyl, ether, and hydroxyl O ranges from -0.453 to -0.527, from -0.463 to -0.652, and from -0.631 to -0.707, respectively. Hydroxyl O is the most negatively charged atom in general. Hydroxyl H is the most positively charged hydrogen among terminal H that ranges from +0.362 to +0.438. Other terminal hydrogen is relatively neutral ranging from -0.086 to +0.201. The atomic charge for fluorine ranges from -0.259 to -0.355. In the polyurethane monomer the carboxyl groups are expected to form cross links and therefore these were not considered as significant intermolecular bonding sites.. Based on the charge distribution analysis it is expected that hydroxyl H in phenol forms H-bond with ether, carbonyl, and hydroxyl O in polyurethane, and hydroxyl H in polyurethane forms H-bond with hydroxyl O in phenol.
Figure 14. Optimized geometry of polyurethane. Key: gray = C, red = O, white = H, and blue = F. Figure 15 and 16 shows the comparison of calculated vibrational frequency and measured IR spectra for epoxy and polyurethane, respectively. Calculated and measured spectra agree relatively well. The calculated frequencies show approximately 10% higher numbers than the measured IR spectra. The overall good agreement between calculated and measured IR spectra indicates that the chemical structure used for the DFT calculations are reasonable. Intermolecular Bond Energies Epoxy-Phenol Interaction: Based on the atomic charge distribution analysis intermolecular bonding sites were predicted and H-bond complexes were optimized using B3LYP/6-31G(d) level of theory. For epoxy – phenol interactions, two H-bond complexes were identified as shown in Figure 17. For the complex (a) when the hydroxyl H in epoxy forms an H-bond with the hydroxyl O in phenol, the hydroxyl H in phenol also forms an H-bond with the ether O in epoxy. For the complex (b) the hydroxyl H in phenol interacts with the hydroxyl O in epoxy.
23
0
100
200
300
400
500
600
500 1000 1500 2000 2500 3000 3500 4000
Rel
ativ
e In
tens
ity
Frequency, 1/cm
OHStretch
CH Stretch
AromaticRing
CH (Aromatic)
AromaticCO
Ether Stretch
0.00
0.20
0.40
0.60
0.80
1.00
1.20
500 1000 1500 2000 2500 3000 3500 4000
Rel
ativ
e A
bund
ance
Frequency, 1/cm
OHCHAromatic
Ring
CH
AromaticCO
Figure 15. Comparison of calculated vibrational frequencies (left) and measured IR spectra (right) for epoxy.
0
200
400
600
800
1000
1200
1400
500 1000 1500 2000 2500 3000 3500 4000
Rel
ativ
e In
tens
ity
Frequency, 1/cm
OHStretchCH
Stretch
CarbonylCO
Ether CO
0.0
0.2
0.4
0.6
0.8
1.0
1.2
500 1000 1500 2000 2500 3000 3500 4000
Rel
ativ
e A
bund
ance
Frequency, 1/cm
OH
CH
CarbonylCO
<Complex Modes>
Figure 16. Comparison of calculated vibrational frequencies (left) and measured IR spectra (right) for polyurethane.

24
(a)
(b)
Figure 17 Epoxy – Phenol H-bonded complex: (a) double interaction, (b) single interaction. The optimization of the H-bond complex in which the hydroxyl H in phenol forms an H-bond with the 2nd ether O near the center of monomer was not successful. This is because the H-bond between the hydroxyl H in phenol and the ether O in epoxy is not strong enough without the 2nd simultaneous H-bond between the hydroxyl H in epoxy and the hydroxyl O in phenol. Table 6 shows the H-bond energy and intermolecular distance for epoxy – phenol complexes. Complex (a) showed weaker H-bond energy than complex (b), even though complex (a) has two bonding sites. The plausible reason of this weaker H-bond energy is that the carbon backbone chain of epoxy was twisted from the original structure which increases complex’s total energy. Therefore the energy difference between the reactants and the H-bond complex is smaller. It was not the case for complex (b) in which only the hydroxyl H of phenol forms an H-bond with the ether O of epoxy. Optimized epoxy geometry of the complex (b) is nearly identical to the optimized geometry of epoxy itself without phenol interaction. H-bond between phenols were also calculated and compared with coating-phenol interactions, and shown in Table 6. The calculation shows that the phenol-phenol H-bond energy is between 2 H-bond energies calculated for epoxy-phenol H-bond.

25
Polyurethane – Phenol Interactions: The H-bond energies between polyurethane and phenol were calculated using fragmented polyurethane structures due to the size of the monomer. The geometry optimization of polyurethane structure itself was successful: however, that of polyurethane-phenol complex was not. Figure 18 shows the optimized geometries of polyurethane fragment – phenol complexes for 4 different fragment structures. Geometries were successfully optimized for the complexes which the hydroxyl H in phenol interacted with the carbonyl O in the polyurethane fragments. Geometry optimizations for the interaction between the hydroxyl H in phenol and the ether O in the fragments were not successful due to the hindered position of the ether O in these fragments. There are two H-bond configurations for fragment 4 in which the hydroxyl H in phenol interacts with the hydroxyl O in the fragment and the hydroxyl H in fragment 4 interacts with the hydroxyl O in phenol as shown in Figure 18 (d) and (e), respectively. The calculated H-bond energy and intermolecular distance for each complex are summarized in Table 6.
Figure 18. Polyurethane fragment – Phenol H-bonded complexes. Intermolecular bonding energies and distances were also calculated for water and ethanol as summarized in Table 6. Intermolecular bonding energies and distances among solvents are also shown. Interactions between methylene chloride and other solvents are not shown except phenol because the interactions are too weak or repulsive based on the calculations.

26
Table 6 - Polymer-Solvent and Solvent-Solvent Interaction Energies and Bond Length
Interaction Bond Energy (kcal/mol) Bond Length (Å)
Epoxy – Phenol (1) (1) 3.02 1.914 Epoxy – Phenol (2) 4.54 1.926 Polyurethane Fraction 1 – Phenol 5.42 1.846 Polyurethane Fraction 2 – Phenol 3.79 2.007 Polyurethane Fraction 3 – Phenol 4.13 1.956 Polyurethane Fraction 4 – Phenol (i) 4.46 1.866 Polyurethane Fraction 4 – Phenol (ii) 2.28 2.003 Epoxy – Water(1) 3.64 1.844 Polyurethane Fraction 1 – Water 3.50 1.980 Polyurethane Fraction 2 – Water 2.38 2.115 Polyurethane Fraction 3 – Water 2.41 2.109 Polyurethane Fraction 4 – Water 4.25 1.913 Epoxy – Ethanol(1) 3.20 1.959 Polyurethane Fraction 1 – Ethanol 3.83 2.060 Polyurethane Fraction 2 – Ethanol 3.38 2.001 Polyurethane Fraction 3 – Ethanol 2.63 2.022 Polyurethane Fraction 4 – Ethanol 2.95 1.855 Phenol – Phenol 3.35 1.944 Phenol – Methylene Chloride 0.69 2.280 Phenol – Water 5.84 1.858 Phenol – Ethanol 5.49 1.858 Ethanol – Water 4.02 1.925 Ethanol – Ethanol 6.07 1.894 Water – Water 3.95 1.939
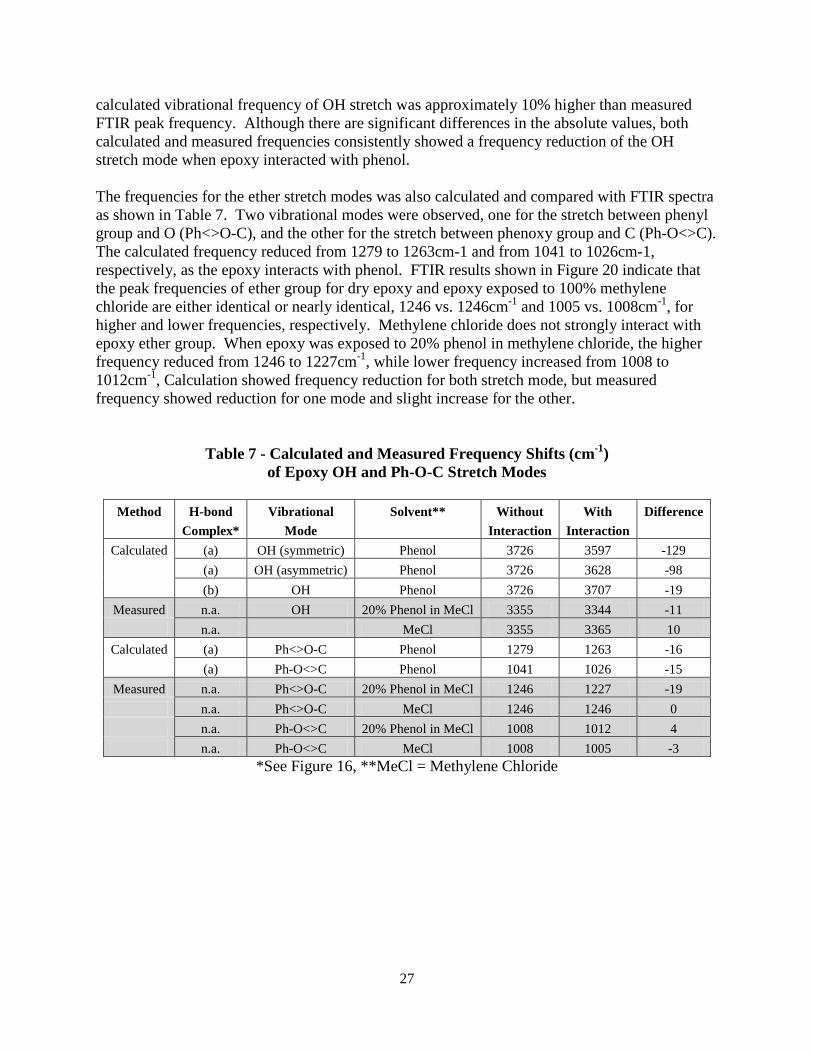
Vibrational Frequency Shifts- Epoxy-Phenol Interaction Table 7 summarizes the calculated and measured OH and ether stretch mode frequencies with and without phenol interaction. (The measured FTIR spectra are discussed in Section 4.3.) The calculated vibrational frequency of the OH stretch without interaction was 3726cm-1. When epoxy is interacts with phenol this frequency is reduced. For the epoxy-phenol complex (a) in Figure 17, two OH stretch frequencies which were synchronized between the epoxy and phenol OH were observed. Symmetric indicates the OH group of both the epoxy and phenol are in-phase with each other. Asymmetric indicates that the OH groups are out of phase with each other. These frequencies were 3597 and 3628cm-1, respectively. For the epoxy-phenol complex (b) in Figure 17, the calculated frequency was 3707cm-1. All of the calculations showed a frequency reduction when OH was interacted with phenol. FTIR spectra were measured for the dry epoxy and the epoxy exposed to 100% methylene chloride and 20% phenol in methylene chloride. The resulting FTIR spectra in the region centered on 3300 cm-1 (OH) are shown in Figure 19. For comparison the spectrum for phenol is also shown. FTIR peak frequencies are summarized in Table 7. FTIR results showed that the
27
calculated vibrational frequency of OH stretch was approximately 10% higher than measured FTIR peak frequency. Although there are significant differences in the absolute values, both calculated and measured frequencies consistently showed a frequency reduction of the OH stretch mode when epoxy interacted with phenol. The frequencies for the ether stretch modes was also calculated and compared with FTIR spectra as shown in Table 7. Two vibrational modes were observed, one for the stretch between phenyl group and O (Ph<>O-C), and the other for the stretch between phenoxy group and C (Ph-O<>C). The calculated frequency reduced from 1279 to 1263cm-1 and from 1041 to 1026cm-1, respectively, as the epoxy interacts with phenol. FTIR results shown in Figure 20 indicate that the peak frequencies of ether group for dry epoxy and epoxy exposed to 100% methylene chloride are either identical or nearly identical, 1246 vs. 1246cm-1 and 1005 vs. 1008cm-1, for higher and lower frequencies, respectively. Methylene chloride does not strongly interact with epoxy ether group. When epoxy was exposed to 20% phenol in methylene chloride, the higher frequency reduced from 1246 to 1227cm-1, while lower frequency increased from 1008 to 1012cm-1, Calculation showed frequency reduction for both stretch mode, but measured frequency showed reduction for one mode and slight increase for the other.
Table 7 - Calculated and Measured Frequency Shifts (cm-1) of Epoxy OH and Ph-O-C Stretch Modes
Method H-bond Vibrational Solvent** Without With Difference
Complex* Mode Interaction Interaction Calculated (a) OH (symmetric) Phenol 3726 3597 -129
(a) OH (asymmetric) Phenol 3726 3628 -98 (b) OH Phenol 3726 3707 -19
Measured n.a. OH 20% Phenol in MeCl 3355 3344 -11 n.a. MeCl 3355 3365 10
Calculated (a) Ph<>O-C Phenol 1279 1263 -16 (a) Ph-O<>C Phenol 1041 1026 -15
Measured n.a. Ph<>O-C 20% Phenol in MeCl 1246 1227 -19 n.a. Ph<>O-C MeCl 1246 1246 0 n.a. Ph-O<>C 20% Phenol in MeCl 1008 1012 4 n.a. Ph-O<>C MeCl 1008 1005 -3
*See Figure 16, **MeCl = Methylene Chloride

28
0.00
0.05
0.10
0.15
0.20
0.25
0.30
3000 3100 3200 3300 3400 3500 3600
PhenolEpoxy (100% MeCl)Epoxy (MeCl + 20% Phenol)Epoxy (Dry)
Rel
ativ
e A
bsor
banc
e
Frequency, 1/cm
Figure 19. FTIR spectra in the region centered on 3300 cm-1 for the dry epoxy primer and exposed to methylene chloride and 20 % phenol in methylene chloride. The spectrum for phenol is also shown.
0.0
0.2
0.4
0.6
0.8
1.0
900 950 1000 1050 1100 1150 1200 1250 1300
PhenolEpoxy (100% MeCl)Epoxy (MeCl + 20% Phenol)Epoxy (Dry)
Rel
ativ
e A
bsor
banc
e
Frequency, 1/cm
Figure 20. FTIR spectra in the region centered on 1100 cm-1 for the dry epoxy primer and exposed to methylene chloride and 20 % phenol in methylene chloride. The spectrum for phenol is also shown. Vibrational Frequency Shifts- Polyurethane-Phenol Interaction Table 8 summarizes calculated carbonyl CO and OH stretch mode frequencies with and without phenol interaction and comparison with measured FTIR spectra. FTIR spectra measured were

29
dry polyurethane and the polyurethane exposed to 100% methylene chloride and 20% phenol in methylene chloride. The regions of these spectra associated with the C=O and OH stretch are shown in Figures 21 and 22, respectively.
Table 8 - Calculated and Measured Frequency Shifts (cm-1) of Polyurethane C=O and OH Stretch Modes
Method Fragment* Vibrational Solvent Without Phenol With Phenol Difference
Mode Interaction Interaction Calculated 1 C=O Phenol 1832 1775 -57
2 C=O Phenol 1880 1830 -50 3 C=O Phenol 1860 1833 -27 4(i) OH Phenol 3760 3764 4 4(ii) OH Phenol 3760 3693 -67
Measured n.a. C=O 20% Phenol in MeCl 1716 1723 7 n.a. C=O MeCl 1716 1715 -1 n.a. OH 20% Phenol in MeCl 3376 3378 2 n.a. OH MeCl 3376 3375 -1
*See Figure 17
0.00
0.05
0.10
0.15
0.20
0.25
0.30
0.35
0.40
1600 1650 1700 1750 1800
PhenolPolyurethane (MeCl)Polyurethane (MeCl + 20% Phenol)Polyurethane (Dry)
Rel
ativ
e A
bsor
banc
e
Frequency, 1/cm
Figure 21. FTIR spectra in the region centered on 1700 cm-1 for the dry polyurethane topcoat and exposed to 100% methylene chloride and 20 % phenol in methylene chloride. The spectrum for phenol is also shown.

30
0.00
0.01
0.02
0.03
0.04
0.05
3000 3100 3200 3300 3400 3500 3600
PhenolPolyurethane (MeCl)Polyurethane (MeCl + 20% Phenol)Polyurethane (Dry)
Rel
ativ
e A
bsor
banc
e
Frequency, 1/cm
Figure 22. FTIR spectra in the region centered on 3300 cm-1 for the dry polyurethane topcoat and exposed to 100% methylene chloride and 20 % phenol in methylene chloride. The spectrum for phenol is also shown. The results summarized in Table 8 show that the calculated vibrational frequency of C=O stretch was again approximately 10% higher than measured FTIR peak frequency. The calculated vibrational frequencies of C=O stretch without interaction varied from 1832 to 1880 cm-1, depending on the fragments. When polyurethane is interacted with phenol the frequencies corresponding to C=O stretch mode were reduced by 27 to 57cm-1. The shoulder peaks centered on 1720cm-1 correspond to C=O stretch mode. Due to the difficulty to determine the peak frequencies of this C=O stretch mode located next to the large peak originated by polyurethane, which can be seen in Figure 20, the first derivative of the FTIR spectra was used to identify the peak. The peak frequencies for dry polyurethane and polyurethane exposed to 100% methylene chloride are nearly identical; 1715 and 1716 cm-1, respectively. There is no strong interaction between methylene chloride and polyurethane C=O group. When polyurethane was exposed to 20% phenol in methylene chloride frequency was increased by 7 cm-1 to 1723 cm-1. With respect to the interactions with the OH group, the calculated vibrational frequency of OH stretch without interaction was 3760cm-1 for the polyurethane fragment 4. When the hydroxyl H in phenol interacted with the hydroxyl O in polyurethane fragment (d), the peak frequency was slightly increased by 4 cm-1. When the hydroxyl H in polyurethane interacted with the hydroxyl O in phenol, the peak frequency was reduced to 3693cm-1. FTIR results showed that the peak frequency of OH stretch mode for dry polyurethane and polyurethane exposed to 100% methylene chloride are virtually identical; 3376 and 3375 cm-1, respectively. This indicates that methylene chloride does not strongly interact with polyurethane OH group. When polyurethane was exposed to 20% phenol in methylene chloride, the peak frequency increased by only 2 cm-1. The comparison of the peak frequency shift between calculated and measured indicates that interaction may occur mainly between the hydroxyl H in phenol and the hydroxyl O in polyurethane. Unlike epoxy-phenol interactions, calculated frequency shifts of carbonyl group

31
stretch mode due to the interactions did not agree with measured FTIR frequency shifts for polyurethane-phenol interactions. The calculation indicated frequency reduction, while FTIR measurement showed slight increase. 4.2.4 Conceptual and Computational Modeling Summary
Overall, the conceptual and computational modeling suggests that all of the solvent-solvent and solvent-polymer interactions involving methylene chloride are relatively weak, so weak that in most cases that the computational models failed to converge to a stable configuration. All of the other solvent-solvent and solvent-polymer interactions were comparatively strong. The most likely sites of solvent-polymer interactions includes the OH and Ph-O-C groups in the epoxy primer and the C=O and OH groups in the polyurethane topcoat. 4.3 Task 3 – FTIR of Thin Films
The purpose of this task was to directly observe the sites within the molecular structure of the coatings that are interacting with the model solvent components. Briefly, comparing FTIR spectra of thin films of the coatings before and after exposure to the solvents were used to determine if the interactions with the model solvents were sufficient to influence the vibrational frequencies of specific sites within the polymer and to identify those sites. The value of this approach is it can provide direct observation of the effects predicted by the molecular modeling and provide evidence that specific functional groups within the coatings are being strongly influenced by the solvent components. 4.3.1 FTIR of the Epoxy Primer
The FTIR spectrum of the dry epoxy primer is shown in Figure 23. The group assignments to the labeled peaks were made by comparison with the molecular models described in Section 4.2. The primary peak of interest is the aromatic ether group; Ph-(O-C). This group can serve as a hydrogen bond acceptor site and in the FTIR spectra it can be observed without interference from the solvents. (The OH group is also of primary importance, but the OH peak is poorly defined and suffers interference with the OH in the solvent.)

32
1000 1500 2000 2500 3000 3500
Rel
ativ
e A
bsor
banc
e
Frequency, 1/cm
Ph-(O-C)
(Ph-O)-C
OHCHPh-H
Ph-H
Figure 23. FTIR spectrum of the dry epoxy primer. Absorption peaks assigned to the primary groups of interest are marked. Figures 24, 25, and 26 show the FTIR spectra for the epoxy primer exposed to neat methylene chloride, methylene chloride with 20% phenol, and methylene chloride with 20% phenol and 1% water, respectively. Furthermore, Figures 27 and 28 show the FTIR spectra for the epoxy primer exposed to methylene chloride with 20% benzyl alcohol and methylene chloride with 20% benzyl alcohol and 1% water, respectively. Each of these spectra shows a rapid increase in the intensity of the Ph-(O-C) absorption peak, but none show a significant shift in the frequency of this peak. This suggests that this group is being solvated and can thus vibrate more freely, but that it is not interacting with the solvent with sufficient strength to affect its vibrational frequency. Alternatively, these results may show that the aromatic ether group in the cured epoxy is already in an environment with strong hydrogen bonds and the change in bonding when exposed to the solvents is not large enough to be detected using the methods employed here. However, close examination of the spectra taken with the methylene chloride with 20% phenol and 1% water shows that the overall intensity of the absorption spectra rises quickly, and then declines as a function of time as shown in Figure 29. Furthermore, this effect does not appear to be localized to the Ph-(O-C) suggesting that this is a general degradation of the coating and not specific to the Ph-(O-C) group. The interesting feature is that this behavior is observed only when phenol and water are present together suggesting an interaction that is unique to these two components.

33
1000 1500 2000 2500 3000 3500
0 min 20 min 40 min 60 min
Rel
ativ
e A
bsor
banc
e
Frequency, 1/cm
OHCHPh-H
Ph-H Ph-(O-C)
(Ph-O)-C
Figure 24. FTIR spectrum of the epoxy primer exposed to methylene chloride.
1000 1500 2000 2500 3000 3500
0 min 20 min 40 min 60 min
Rel
ativ
e A
bsor
banc
e
Frequency, 1/cm
Ph-(O-C)
OH
Figure 25. FTIR spectrum of the epoxy primer exposed to 20% phenol in methylene chloride.

34
1000 1500 2000 2500 3000 3500
0 min 20 min 40 min 60 min
Rela
tive
Abso
rban
ce
Frequency, 1/cm
Ph-(O-C)
OH
Figure 26. FTIR spectrum of the epoxy primer exposed to 20% phenol with 1% water in methylene chloride.
1000 1500 2000 2500 3000 3500
0 min 20 min 40 min 60 min
Rel
ativ
e A
bsor
banc
e
Frequency, 1/cm
Ph-(O-C)
OH
Figure 27. FTIR spectrum of the epoxy primer exposed to 20% benzyl alcohol in methylene chloride.

35
1000 1500 2000 2500 3000 3500
0 min 20 min 40 min 60 min
Rel
ativ
e Ab
sorb
ance
Frequency, 1/cm
Ph-(O-C)
OH
Figure 28. FTIR spectrum of the epoxy primer exposed to 20% benzyl alcohol with 1% water in methylene chloride.
0 10 20 30 40 50 60
Neat Methylene Chloride20% Phenol20% Phenol, 1% Water20% Benzyl Alcohol20% Benzyl Alcohol, 1% Water
Rel
ativ
e A
bsor
banc
e
Exopsure Time, min Figure 29. Relative absorbance of the FTIR peak assigned to the Ph-(O-C) group in epoxy showing that the temporal behavior becomes very dynamic when water and phenol are present at the same time.

36
4.3.2 FTIR of the Polyurethane Topcoat
The FTIR spectrum of the dry polyurethane topcoat is shown in Figure 30. The group assignments to the labeled peaks were made by comparison with the molecular models described in Section 4.2. The primary peaks of interest include the ether (C-O-C) and carbonyl groups (O=C). These groups can serve as a hydrogen bond acceptor sites and in the FTIR spectra they can be observed without interference from the solvents. (The OH group is also of primary importance, but the OH peak is poorly defined and suffers interference with the OH in the solvent.)
1000 1500 2000 2500 3000 3500
Rel
ativ
e Ab
sorb
ance
Frequency, 1/cm
C-O-CC=O
OH
Figure 30. FTIR spectrum of the dry polyurethane topcoat. Absorption peaks assigned to the primary groups of interest are marked. Figures 31, 32, and 33 show the FTIR spectra for the polyurethane exposed to neat methylene chloride, methylene chloride with 20% phenol, and methylene chloride with 20% phenol and 1% water, respectively. Furthermore, Figures 34 and 35 show the FTIR spectra for the polyurethane exposed to methylene chloride with 20% benzyl alcohol and methylene chloride with 20% benzyl alcohol and 1% water, respectively. Each of these spectra shows a rapid increase in the intensity of the overall spectrum which is thought to originate from the swelling of the polymer which allows the functional groups to vibrate more freely, hence and increase in intensity without necessarily a change in frequency. An improvement in the optical contact between the sample and the FTIR window as the sample swells and softens may also be a contributing factor. This behavior is summarized in Figures 36 and 37 which plot the relative absorbance as a function of time of the peaks assigned to the C-O-C and C=O groups, respectively. The temporal behavior of these peaks suggests that the solvent is absorbed quickly and the system rapidly comes to equilibrium without any obvious indications of a chemical reaction.
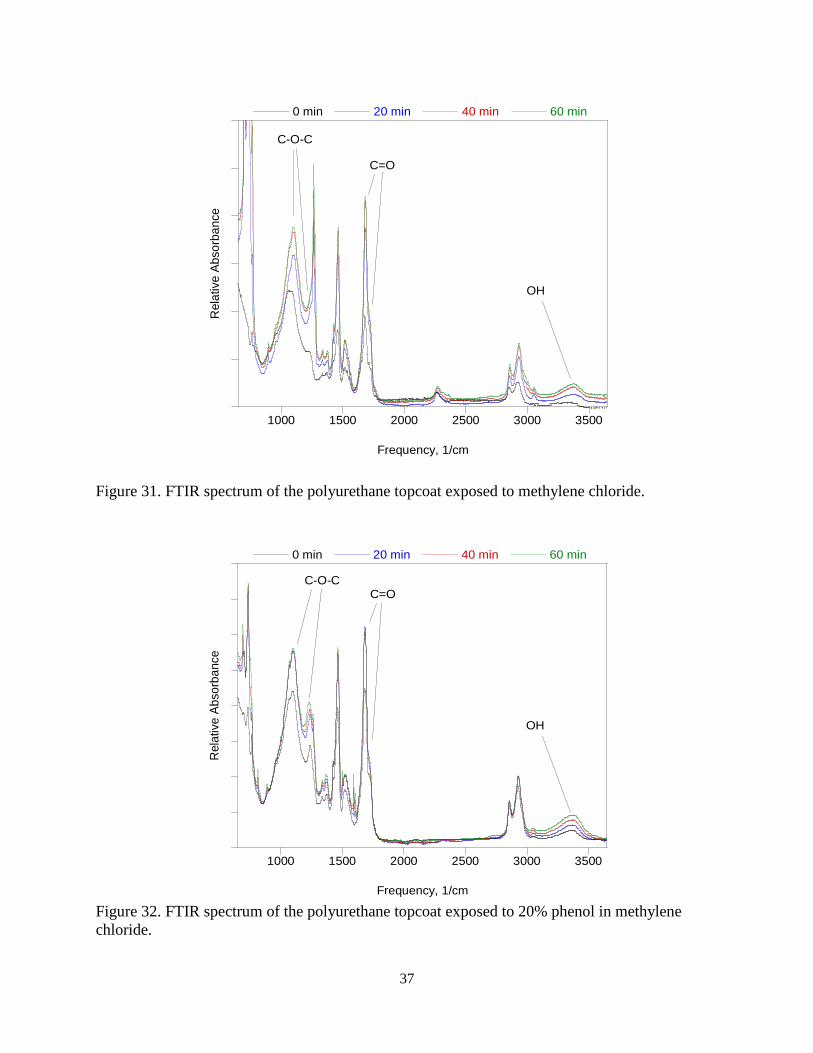
37
1000 1500 2000 2500 3000 3500
0 min 20 min 40 min 60 min
Rel
ativ
e Ab
sorb
ance
Frequency, 1/cm
C-O-C
C=O
OH
Figure 31. FTIR spectrum of the polyurethane topcoat exposed to methylene chloride.
1000 1500 2000 2500 3000 3500
0 min 20 min 40 min 60 min
Rel
ativ
e Ab
sorb
ance
Frequency, 1/cm
C-O-CC=O
OH
Figure 32. FTIR spectrum of the polyurethane topcoat exposed to 20% phenol in methylene chloride.

38
1000 1500 2000 2500 3000 3500
0 min 20 min 40 min 60 min
Rel
ativ
e Ab
sorb
ance
Frequency, 1/cm
C-O-C C=O
OH
Figure 33. FTIR spectrum of the polyurethane topcoat exposed to 20% phenol with 1% water in methylene chloride.
1000 1500 2000 2500 3000 3500
0 min 20 min 40 min 60 min
Rel
ativ
e Ab
sorb
ance
Frequency, 1/cm
C-O-CC=O
OH
Figure 34. FTIR spectrum of the polyurethane topcoat exposed to 20% benzyl alcohol in methylene chloride.

39
1000 1500 2000 2500 3000 3500
0 min 20 min 40 min 60 min
Rel
ativ
e Ab
sorb
ance
Frequency, 1/cm
C-O-CC=O
OH
Figure 35. FTIR spectrum of the polyurethane topcoat exposed to 20% benzyl alcohol with 1% water in methylene chloride.
0 10 20 30 40 50 60
Neat Methylene Chloride20% Phenol20% Phenol, 1% Water20% Benzyl Alcohol20% Benzyl Alcohol, 1% Water
Rel
ativ
e Ab
sorb
ance
Exopsure Time, min Figure 36. Relative absorbance of the FTIR peak assigned to the C-O-C group in the polyurethane topcoat showing that the temporal behavior does not change when water is included in the solvent system.

40
0 10 20 30 40 50 60
20% Phenol20% Phenol, 1% Water20% Benzyl Alcohol20% Benzyl Alcohol, 1% Water
Rela
tive
Abso
rban
ce
Exopsure Time, min Figure 37. Relative absorbance of the FTIR peak assigned to the C-O-C group in the polyurethane topcoat showing that the temporal behavior becomes very dynamic when water and phenol are present at the same time. Interferences with the solvents makes detailed analysis of the FTIR spectra challenging, however, close examination suggests that two regions respond to the presence of phenol. Specifically, the absorption peak assigned to the C-O-C group has a small shoulder peak on the high-frequency side of the major peak that responds to the presence of phenol as does a shoulder peak on the high-frequency side of the major peak assigned to the C=O group. Based on the computational modeling described in Section 4.2, these shoulder peaks are thought to be associated with groups that are not participating in a strong hydrogen bond, that is functional groups within the cured polymer that are not strongly bound to adjacent polymer groups. The region of the FTIR spectra assigned to the C-O-C and C=O groups for each of the solvent systems used here are shown in Figures 38 and 39. Note that these spectra have been normalized by the height of the parent peak to emphasize the relative changes in the spectra. The spectra for the C-O-C group (Figure 38) show that there is no apparent activity of the small shoulder peak located at 1238 cm-1 when the coating is exposed to neat methylene chloride, 20% benzyl alcohol in methylene chloride, or 20% benzyl alcohol and 1% water in methylene chloride. However, when the coating is exposed to the solvents consisting of 20% phenol in methylene chloride and 20% phenol and 1% water in methylene chloride this peak grows and shifts to lower frequencies. The relative growth of this peak is illustrated in Figure 39 which summarized the ratio of the absorbance of the shoulder peak the absorbance of the parent peak. This shows that phenol interacts with this site via a relatively slow process that continues throughout the period of observation and that this interaction in increased when water is present. In contract, this interaction does not occur when benzyl alcohol or benzyl alcohol and water are present.

41
900 950 1000 1050 1100 1150 1200 1250 1300
0 min 20 min 40 min 60 min
Rel
ativ
e A
bsor
banc
e
Frequency, 1/cm
Neat Methylene Chloride
900 950 1000 1050 1100 1150 1200 1250 1300
0 min 20 min 40 min 60 min
Rel
ativ
e A
bsor
banc
e
Frequency, 1/cm
Methylene Chloride + 20% Phenol
900 950 1000 1050 1100 1150 1200 1250 1300
0 min 20 min 40 min 60 min
Rel
ativ
e A
bsor
banc
e
Frequency, 1/cm
Methylene Chloride + 20% Phenol + 1% Water
900 950 1000 1050 1100 1150 1200 1250 1300
0 min 20 min 40 min 60 min
Rel
ativ
e A
bsor
banc
e
Frequency, 1/cm
Methylene Chloride + 20% Benzyl Alcohol
900 950 1000 1050 1100 1150 1200 1250 1300
0 min 20 min 40 min 60 min
Rel
ativ
e A
bsor
banc
e
Frequency, 1/cm
Methylene Chloride + 20% Benzyl Alcohol + 1% Water
Figure 38. The normalized FTIR peaks assigned to C-O-C in the polyurethane topcoat showing that the shoulder peak increases in intensity and shifts to lower frequency when phenol is present.

42
0.60
0.65
0.70
0.75
0.80
0 10 20 30 40 50 60 70
MeCl + 20% PhenolMeCl + 20% Phenol + 1% WaterMeCl + 20% Benzyl AlcoholMeCl + 20% Benzyl Alcohol + 1% Water
Abso
rban
ce R
atio
: (Sh
ould
er P
eak)
/(Par
ent P
eak)
Exposure Time
Figure 39. The ratio of the absorbance of the FTIR peak assigned to the parent C-O-C group and a should peak associated with this group in the polyurethane topcoat showing that the relative size of the shoulder peak increases when phenol and phenol with water are added to the solvent system. The spectra for the C=O group (39) show that there is no apparent activity of the small shoulder peak located at 1729 cm-1 when the coating is exposed to neat methylene chloride. However, there is a gradual loss of this shoulder when the coating is exposed to the solvent systems containing phenol and phenol with water. There is also a loss of this shoulder when the coating is exposed to the solvent systems containing benzyl alcohol and benzyl alcohol with water, however, in these systems the change occurs in a stepwise fashion. The reduction in the shoulder peak is thought to represent the loss of C=O which is not participating in a strong hydrogen bond. Specifically, since the C=O group can readily form hydrogen bonds with phenol, benzyl alcohol, and water, when these components are added to the methylene chloride this response is observed. Furthermore, the progression of the loss in the presence of phenol may indicate a slow reaction with this component, a phenomenon not observed in the presence of benzyl alcohol. Moreover, the growth in the peak associated with the C-O-C groups suggests that these spectra are showing a possible reaction between the polyurethane coating and the phenol that results in the loss of C=O and the formation of C-O-C groups in the form of C-O-Ph groups. This activity is not observed in the presence of the benzyl alcohol due to the low acidity, and hence the low reactivity, of this molecule.

43
4.3.3 FTIR of Thin Films Summary Overall, the FTIR of thin films suggests that the ether group in both the epoxy primer interacts with phenol as shown by an increase in the intensity of the IR absorption peak associated with this group, though a significant shift in frequency is not observed. Furthermore, an overall degradation of the epoxy primer is noted when water is present along with phenol, but not when water is present with benzyl alcohol indicating an interaction between water and phenol. Given that phenol may serve as a weak organic acid, this interaction may be in the form of a reaction between water and phenol. This would allow the formation of phenoxy (PhO-) and hydronium (H3O+) ions that may in turn react with the epoxy primer. There is also evidence for possible reactions between phenol and the polyurethane topcoat as shown by the loss of a shoulder peak associated with the C=O and the gain of a shoulder peak associated with C-O-C, though this behavior is not influenced by the presence of water. Finally, while the conceptual and computational models predict interactions involving the OH groups in both coatings, these could not be conclusively observed due to interferences with the OH groups present in the solvents. 4.4 Task 4 – Dynamic Volume Swell
Volume swell is basic expression of the overall strength of interaction between a solvent and polymer as well as an important function of the solvent as part of the paint stripping process. In this study, volume swell measurements were made using the method of optical dilatometry as described in Section 3.5 using series of model solvents and molecular probes. The model solvents (methylene chloride, phenol, ethanol, and water) were used to establish the baseline behavior of the primary solvent components while molecule probes (generally structural analogs of the primary solvents) were used to examine specific molecular characteristics including molar volume, polarity, and hydrogen bonding. A complete list of the solvents and molecular probes used in this study is given in Table 1. The Hansen solubility parameters of the primary solvents and molecular probes are listed in Table 4 and shown in Figure 40. 4.4.1 Methylene Chloride and Phenol Baseline Data
The original scope of work for this study was designed to investigate the specific roles of methylene chloride and phenol and the activity of these two key components serve as valuable reference points for the remainder of this study. The start of this investigation was to establish the baseline response of the epoxy primer and polyurethane topcoat to the methylene chloride and phenol. For this purpose methylene chloride was used as the base solvent to which either hexadecane or phenol was blended. In this example hexadecane (a large non-polar alkane) was taken as an example of an inert component while phenol was taken as the most active component to be used in this study, thus providing a reference set for the range of behavior against which the activity of other solvents and molecular probes could be compared. The volume swell results for these two systems are summarized in Figure 41. This shows that the strength of interaction between the coatings and the methylene chloride was stronger for the polyurethane (61% volume swell) versus the epoxy (30% volume swell). However, the response to the phenol was about the same with an increase in volume of about 60% for each of the coatings when exposed to 20% phenol in methylene chloride (an increase of 57% for the polyurethane and 61% for the epoxy). Both coatings showed little response to the neat hexadecane illustrating that this component is indeed inert with respect to its interaction with the coating materials

44
Figure 40. Summary of the solvents and molecular probes used in this study showing their molecular structure and relative size. Key: carbon (gray), hydrogen (white), oxygen (red), nitrogen (blue), and chlorine (green).

45
0
20
40
60
80
100
120
0 20 40 60 80 100
PhenolHexadecane
Volu
me
Sw
ell,
%
Concentration in Methylene Chloride, %v/v
Epoxy0
20
40
60
80
100
120
0 20 40 60 80 100
PhenolHexadecane
Volu
me
Sw
ell,
%
Concentration in Methylene Chloride, %v/v
Polyurethane
Figure 41. Volume swell of the epoxy primer and polyurethane topcoat in methylene chloride blended with either phenol or hexadecane. 4.4.2 Phenol
Phenol is an interesting organic molecule with unique molecular properties due in large part to the hydroxyl (OH) group bound to the aromatic ring. This group imparts polarity and hydrogen bonding to the molecule by virtue of the relatively high electronegativity of the hydroxyl oxygen. In most organic molecules, such as an alcohol, the oxygen withdraws electrons from neighboring atoms and in the case of the hydroxyl hydrogen exposes its positive nucleus. This establishes the condition for forming hydrogen bonds with neighboring molecules via the electrostatic attraction between the electronegative hydrogen bonding acceptor and electropositive hydrogen bonding donor sites. In this system this includes solvent-solvent interactions between the electronegative hydroxyl oxygen and electropositive hydroxyl hydrogen on neighboring phenol molecules. (The electrons localized in the pi electron structure of the aromatic ring and the aromatic hydrogens can also conceivably participate in weak hydrogen bonds.) Similar interactions can also occur between phenol’s hydroxyl group and hydroxyl groups within the epoxy and polyurethane. Furthermore, the ether (R-O-R) and carbonyl (C=O) groups within the polymers can serve as hydrogen bonding acceptor sites. Ordinarily, the strength of the hydrogen bond is limited by the electrostatic repulsion between the hydroxyl oxygen and the electronegative hydrogen bonding acceptor site. However, in the case of phenol, the hydroxyl oxygen can share lone-pair electrons with the pi electron structure of the aromatic ring, reducing the strength of this repulsion and allowing phenol to form exceptionally strong hydrogen bonds with other molecules, but comparatively weak hydrogen bonds with other phenol molecules. In theory, this would reduce the strength of solve-solvent interactions and increase solvent-polymer interactions resulting in phenol favorably partitioning into the polymers and imparting volume swell. To examine the unique molecular characteristics of phenol a series of molecular probes were selected as listed in Table 4 and shown in Figure 40.

46
The first characteristic to be examined was the importance of the hydroxyl group in the activity of this molecule using styrene as a structural analog. Styrene is structurally similar to phenol, but replaces the hydroxyl group with a vinyl group that is capable of forming weak hydrogen bonds. As shown in Figure 42, this molecule exhibits very low activity towards either coating. To complete this analysis, volume data was obtained using toluene, where the hydroxyl group has been replaced with an inert methyl group, and benzene, which is the smallest and generally the most active of the simple aromatics. As shown in Figures 43 (toluene) and 44 (benzene) neither of these molecules shows a significant level of activity towards either the epoxy or polyurethane coatings. This analysis illustrates the importance of the hydroxyl group in the activity of phenol. Next, the significance of the association of the hydroxyl group with the aromatic ring was examined using benzyl alcohol and cyclohexanol. Benzyl alcohol is structurally similar to phenol, but with the hydroxyl group isolated from the aromatic ring by a methyl group. As shown in Figure 45 the activity of this solvent is less than half that of phenol. Cyclohexanol preserves the association of the hydroxyl group with the ring, but removes the aromatic character of the ring and as shown in Figure 46 this reduced the activity of this molecule still farther as compared to phenol and benzyl alcohol.
0
20
40
60
80
100
120
0 20 40 60 80 100
PhenolHexadecaneStyrene
Volu
me
Sw
ell,
%
Concentration in Methylene Chloride, %v/v
Epoxy0
20
40
60
80
100
120
0 20 40 60 80 100
PhenolHexadecaneStyrene
Volu
me
Sw
ell,
%
Concentration in Methylene Chloride, %v/v
Polyurethane
Figure 42. Volume swell of the epoxy primer and polyurethane topcoat in methylene chloride blended with phenol, hexadecane, or styrene.
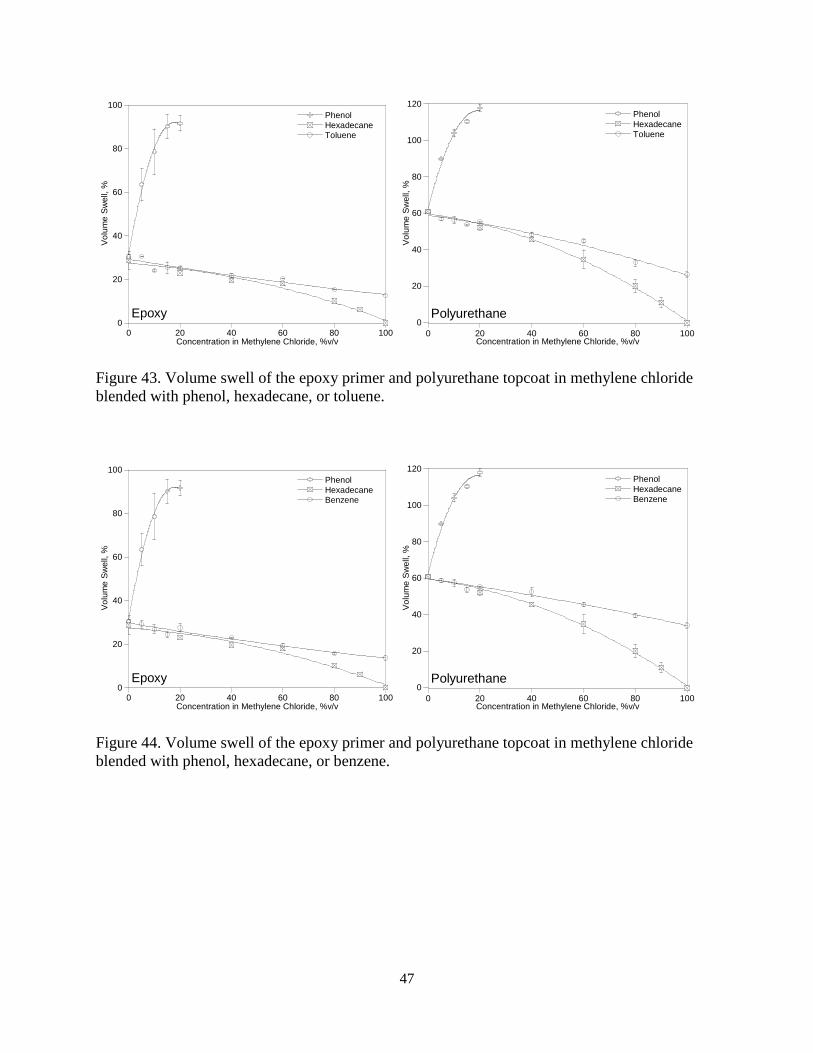
47
0
20
40
60
80
100
0 20 40 60 80 100
PhenolHexadecaneToluene
Volu
me
Sw
ell,
%
Concentration in Methylene Chloride, %v/v
Epoxy0
20
40
60
80
100
120
0 20 40 60 80 100
PhenolHexadecaneToluene
Volu
me
Sw
ell,
%
Concentration in Methylene Chloride, %v/v
Polyurethane
Figure 43. Volume swell of the epoxy primer and polyurethane topcoat in methylene chloride blended with phenol, hexadecane, or toluene.
0
20
40
60
80
100
0 20 40 60 80 100
PhenolHexadecaneBenzene
Volu
me
Sw
ell,
%
Concentration in Methylene Chloride, %v/v
Epoxy0
20
40
60
80
100
120
0 20 40 60 80 100
PhenolHexadecaneBenzene
Volu
me
Sw
ell,
%
Concentration in Methylene Chloride, %v/v
Polyurethane
Figure 44. Volume swell of the epoxy primer and polyurethane topcoat in methylene chloride blended with phenol, hexadecane, or benzene.

48
0
20
40
60
80
100
0 20 40 60 80 100
PhenolHexadecaneBenzyl Alcohol
Volu
me
Sw
ell,
%
Concentration in Methylene Chloride, %v/v
Epoxy0
20
40
60
80
100
120
0 20 40 60 80 100
PhenolHexadecaneBenzyl Alcohol
Volu
me
Sw
ell,
%
Concentration in Methylene Chloride, %v/v
Polyurethane
Figure 45. Volume swell of the epoxy primer and polyurethane topcoat in methylene chloride blended with phenol, hexadecane, or benzyl alcohol.
0
20
40
60
80
100
0 20 40 60 80 100
PhenolHexadecaneCyclohexanol
Volu
me
Sw
ell,
%
Concentration in Methylene Chloride, %v/v
Epoxy0
20
40
60
80
100
120
0 20 40 60 80 100
PhenolHexadecaneCyclohexanol
Volu
me
Sw
ell,
%
Concentration in Methylene Chloride, %v/v
Polyurethane
Figure 46. Volume swell of the epoxy primer and polyurethane topcoat in methylene chloride blended with phenol, hexadecane, or cyclohexanol. The last series of solvents used in this analysis were a group of aliphatic alcohols ranging from 1-butanol to methanol. This series was designed to show the effect of the hydroxyl group by itself by using a relatively inert aliphatic base structure and by reducing the molar volume of the molecule so that it can easily penetrate the molecular structure of the coatings. As shown in Figure 47 the activity of these molecules were similar to the cyclohexanol indicating that the activity is not a strong function of molar volume.

49
0
20
40
60
80
100
0 20 40 60 80 100
PhenolHexadecaneButanolPropanolEthanolMethanol
Volu
me
Sw
ell,
%
Concentration in Methylene Chloride, %v/v
Epoxy0
20
40
60
80
100
120
0 20 40 60 80 100
PhenolHexadecaneButanolPropanolEthanolMethanol
Volu
me
Sw
ell,
%
Concentration in Methylene Chloride, %v/v
Polyurethane
Figure 47. Volume swell of the epoxy primer and polyurethane topcoat in methylene chloride blended with phenol, hexadecane, 1-butanol, 1-propanol, ethanol, or methanol. This series of analyses shows that the activity of phenol lies in the hydroxyl group and the importance of the hydroxyl group’s close association with the aromatic ring. This is consistent with a model that describes the activity of phenol arising from the ability of its hydroxyl group to form exceptionally strong hydrogen bonds with the coatings (very strong polymer-solvent interactions) while at the same time forming relatively weak hydrogen bonds in the bulk solvent (weak solvent-solvent interactions) which in turn arises from the unique association of the hydroxyl group with the aromatic ring. 4.4.2 Methylene Chloride
In a manner similar to that described above for phenol, a series of structural analogs and molecular probes were used to examine the functionality of methylene chloride. Initially, it was proposed that the activity of methylene chloride arose from its small size and polar character resulting from the somewhat electronegative chlorine atoms. If this were the case then increasing the polarity of the molecule while maintaining its small size should increase its activity. The first molecular probe used was acetone, a molecule in which the hydrogens in the methylene chloride structure were replaced with inert methyl groups and the polarity of the molecule localized in a single oxygen in the form of a carbonyl. As shown in Figure 48, the activity of this solvent was not only lower than methylene chloride (as indicated by the decline in volume swell as the methylene chloride is displaced by acetone), but in the case of the epoxy the activity was less than that of the hexadecane when the concentration of acetone was between 20% and 60%. This molecular structure was examined further using acetonitrile, a molecule that is smaller than methylene chloride and with a very polar cyano group. As shown in Figure 49 the activity of this molecule is even lower than acetone.

50
0
20
40
60
80
100
0 20 40 60 80 100
PhenolHexadecaneAcetone
Volu
me
Sw
ell,
%
Concentration in Methylene Chloride, %v/v
Epoxy0
20
40
60
80
100
120
0 20 40 60 80 100
PhenolHexadecaneAcetone
Volu
me
Sw
ell,
%
Concentration in Methylene Chloride, %v/v
Polyurethane
Figure 48. Volume swell of the epoxy primer and polyurethane topcoat in methylene chloride blended with phenol, hexadecane, or acetone.
0
20
40
60
80
100
0 20 40 60 80 100
PhenolHexadecaneAcetonitrile
Volu
me
Sw
ell,
%
Concentration in Methylene Chloride, %v/v
Epoxy0
20
40
60
80
100
120
0 20 40 60 80 100
PhenolHexadecaneAcetonitrile
Volu
me
Sw
ell,
%
Concentration in Methylene Chloride, %v/v
Polyurethane
Figure 49. Volume swell of the epoxy primer and polyurethane topcoat in methylene chloride blended with phenol, hexadecane, or acetonitrile. The results of the tests with acetone and acetonitrile indicate that the activity of methylene chloride does not originate in the polar character of the chlorines, but in the hydrogens, suggesting a weak hydrogen bonding model similar to what was found for phenol. To test this model the hydrogens on the methylene chloride molecule were subsequently replaced by chlorines in the form of chloroform and carbon tetrachloride. As shown in Figure 50 the activity of chloroform is significantly higher than the inert hexadecane and even greater than methylene chloride (as indicated by the increase in volume swell as the methylene chloride is displaced by chloroform). (Note that the volume swell of the polyurethane could only be measured with up to

51
20% chloroform as the solvent density increased causing the samples to float in the optical dilatometer.) Finally, as shown in Figure 51 when the hydrogens are completely replaced by chlorine the activity of the solvent declines. These results are consistent with a model that describes the activity of methylene chloride arising from its small size and its ability to form weak hydrogen bonds with the coatings by virtue of the weakly electropositive hydrogens while at the same time forming comparatively weak hydrogen bonds in the solvent due to the electronegative charge of the chlorines being severely delocalized over the surface of these atoms. 4.4.3 Ethanol
Alcohols are often added to paint stripping formulations as a co-solvent and may also serve to reduce the vapor pressure of the solvent system (reducing the evaporation rate) and to improve water solubility.16 However, based on the results discussed above in Section 4.4.2 and shown in Figure 47, the activity of ethanol itself is relatively low. Furthermore, it is possible that ethanol can provide a hydrogen bonding site in the solvent that can compete with hydrogen bonding sites in the coatings, thereby reducing the effectiveness of the phenol by increasing its binding energy to the solvent and reducing its propensity to partition into the polyurethane and epoxy. To test this hypothesis the volume swell of the polyurethane topcoat and epoxy primer were measured using a solvent system consisting of 20% phenol in methylene chloride along with 0-8% ethanol. As shown in Figure 52, the volume swell of both coatings decreased as the concentration of ethanol increased indicating that the inclusion of ethanol reduces the activity of the solvent as expressed by the volume swell of the coatings. This suggests that ethanol is not necessarily included in depainting formulations due to its direct impact on the performance of the solvent, but possibly as a co-solvent or a system modifier to improve the physical properties of the solvent system.
0
20
40
60
80
100
0 20 40 60 80 100
PhenolHexadecaneChloroform
Volu
me
Sw
ell,
%
Concentration in Methylene Chloride, %v/v
Epoxy0
20
40
60
80
100
120
0 20 40 60 80 100
PhenolHexadecaneChloroform
Volu
me
Sw
ell,
%
Concentration in Methylene Chloride, %v/v
Polyurethane
Figure 50. Volume swell of the epoxy primer and polyurethane topcoat in methylene chloride blended with phenol, hexadecane, or chloroform.
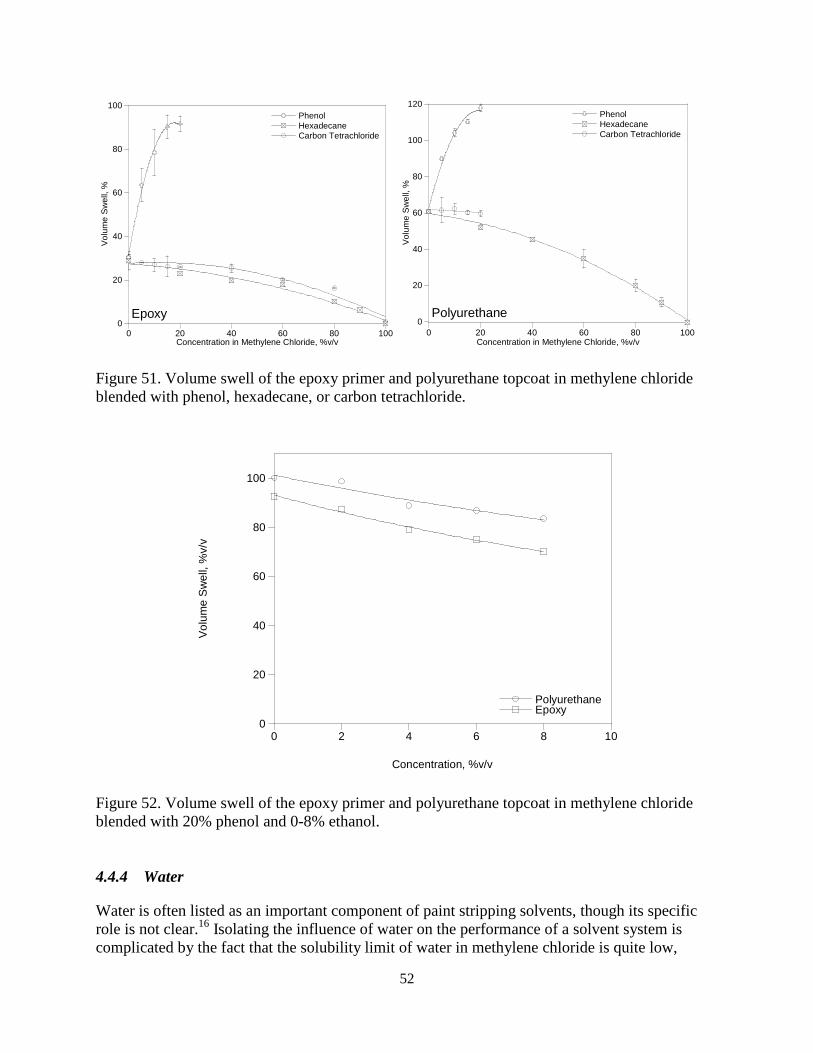
52
0
20
40
60
80
100
0 20 40 60 80 100
PhenolHexadecaneCarbon Tetrachloride
Volu
me
Sw
ell,
%
Concentration in Methylene Chloride, %v/v
Epoxy0
20
40
60
80
100
120
0 20 40 60 80 100
PhenolHexadecaneCarbon Tetrachloride
Volu
me
Sw
ell,
%
Concentration in Methylene Chloride, %v/v
Polyurethane
Figure 51. Volume swell of the epoxy primer and polyurethane topcoat in methylene chloride blended with phenol, hexadecane, or carbon tetrachloride.
0
20
40
60
80
100
0 2 4 6 8 10
PolyurethaneEpoxy
Volu
me
Sw
ell,
%v/
v
Concentration, %v/v
Figure 52. Volume swell of the epoxy primer and polyurethane topcoat in methylene chloride blended with 20% phenol and 0-8% ethanol. 4.4.4 Water
Water is often listed as an important component of paint stripping solvents, though its specific role is not clear.16 Isolating the influence of water on the performance of a solvent system is complicated by the fact that the solubility limit of water in methylene chloride is quite low,

53
0.24% at room temperature, and that water molecules tend to hydrogen bond to each other rather than being present as isolated, fully solvated molecules.17 Therefore, the activity of water was measured indirectly by observing its influence on selected solvent systems. For example, in a manner similar to that used for ethanol described above in Section 4.4.3, water was added to a mixture of 20% phenol in methylene chloride where it was found that the solubility limit for water was just over 2%. As shown in Figure 53 as water was added to this solvent system the volume swell of both the epoxy primer and the polyurethane topcoat increased. Although the absolute value of the volume change is relatively small, the volume change relative to the volume fraction of water added to the solvent is significant. Specifically, as the volume fraction of water increased from 0% to 2.0% in the solvent, the volume of the epoxy increased by 14.4% (92.7% to 106.8%) and the polyurethane increased by 5.4% (98.7% to 104.1%). This analysis was repeated using 20% phenol, 8% ethanol, and 0 to 2.5% water in methylene chloride to determine if the water continued to have a positive influence on the solvent in the presence of another hydrogen bonding component (ethanol). As shown in Figure 54 the volume swell increased for both materials as the water concentration increased and that the change in volume was disproportionate to the volume fraction of water in the solvent; an increase of 18.6% for the epoxy (70.3% to 88.9%) and 7.7% for the polyurethane (83.5% to 91.2%).
0
20
40
60
80
100
0.0 0.5 1.0 1.5 2.0 2.5
PolyurethaneEpoxy
Poly
uret
hane
Concentration, %v/v
Figure 53. Volume swell of the epoxy primer and polyurethane topcoat in methylene chloride blended with 20% phenol and 0-2% water.

54
0
20
40
60
80
100
0.0 0.5 1.0 1.5 2.0 2.5
PolyurethaneEpoxy
Poly
uret
hane
Concentration, %v/v
Figure 54. Volume swell of the epoxy primer and polyurethane topcoat in methylene chloride blended with 20% phenol, 8% ethanol, and 0-2.5% water. It is interesting to note that the addition of ethanol reduced the volume swell of each material while the addition of water increased the volume swell. The reduction in volume swell with the addition of ethanol was attributed to the ethanol serving as a hydrogen bonding component in the solvent, thereby increasing the solubility of the phenol in the solvent and shifting the polymer-solvent equilibrium towards the solvent and reducing the partitioning of the phenol into the polymers and reducing volume swell. Based on this model a similar effect should be observed for water. However, the effect may be offset by the ability of water to form strong hydrogen bonds with the coatings combined with the effect of solvating the water in the bulk solvent thereby reducing the binding energy of the water molecules to the solvent phase. In the case where the water molecules are not solvated, the water-water interactions are so strong that partitioning into the polymer is not energetically favorable. 4.4.5 Interactions between Phenol, Ethanol, and Water
As described above the addition of phenol, ethanol, and water to methylene chloride can increase or decrease the volume well of the coatings depending on the specific concentrations of each component. To determine whether there were interactions occurring between these components a full replicated 23 factorial study at two levels was conducted. Factorial designs are particularly useful in this application as they can provide an estimate of the main and interaction effects with the minimum number of measurements.18 For this study the concentration of phenol, ethanol, and water in methylene chloride were taken as the treatment factors A, B, and C, respectively. The low levels (- index) for the phenol, ethanol, and water were set at 10%, 4%, and 0.5%, respectively, and the high levels (+ index) were set at 15%, 8%, and 1%, respectively. The results from this study are summarized in Table 9. Briefly, it was found that all possible

55
interactions between the three components, both 2-way and 3-way, were statistically active at the 99% confidence interval. This means that all three components influence the volume swell of the coatings and that all three components interact with each other to some extent. This also means that the effect of the individual components on the volume swell must be interpreted with caution when the other components are present. Overall, the largest absolute effect was found for the phenol while the largest relative effect (the effect normalized by the change in concentration) was found for water. The overall effect of the ethanol was to reduce the volume swell of the solvent which is attributed to it providing a hydrogen bonding site within the bulk solvent thereby shifting the partitioning of the solvent in favor of the solvent over the coatings. Consequently, as shown in Table 9, this study suggests that an optimal composition for a paint stripper would be one that maximizes the concentration of phenol and water and minimizes the concentration of ethanol. 4.4.6 The Influence of Acidity on the Volume Swell of Phenol
A brief series of tests were performed to investigate the influence of the acidity of phenol’s hydroxyl hydrogen on the volume swell of the epoxy primer and polyurethane topcoat. Briefly, the volume swell of the two coatings was measured using the substituted phenols listed in Table 5 blended at 10% in methylene chloride (see Table 10). It was found that the relationship between the acidity of the hydroxyl hydrogen was not a simple one due to the limited range of the acidity studied and probable interferences with the pendant groups on the aromatic ring. For example, while the o-substituted phenols tended to have the highest acidity, the proximity of the substitution to the hydroxyl resulted in an unfavorable intramolecular interaction such that in each series the volume swell peaked with the m-substituted phenols. Excluding the o-substituted phenols from the data set shows a modest increase in the volume swell as the activity of the phenol increases.
Table 9 – Summary of the Results of the 23 Factorial Study
Phenol Ethanol Water Mean Polymer A B C Treatment Effect Comment Epoxy 10% 4% 0.5% A- B- C- 71.1% 10% 4% 1.0% A- B- C+ 75.6% 10% 8% 0.5% A- B+ C- 62.2% Lowest 10% 8% 1.0% A- B+ C+ 66.7% 15% 4% 0.5% A+ B- C- 85.0% 15% 4% 1.0% A+ B- C+ 85.6% Highest 15% 8% 0.5% A+ B+ C- 72.4% 15% 8% 1.0% A+ B+ C+ 77.2% Polyurethane 10% 4% 0.5% A- B- C- 83.8% 10% 4% 1.0% A- B- C+ 85.7% 10% 8% 0.5% A- B+ C- 78.0% Lowest 10% 8% 1.0% A- B+ C+ 82.7% 15% 4% 0.5% A+ B- C- 85.3% 15% 4% 1.0% A+ B- C+ 96.9% Highest 15% 8% 0.5% A+ B+ C- 83.9% 15% 8% 1.0% A+ B+ C+ 86.1%

56
Table 10 – Volume Swell of the Epoxy Primer and Polyurethane Topcoat in Methylene Chloride with Selected Phenols Blended at 10% v/v
Component Ka (1010) Epoxy Polyurethane
Phenol 1.1 72.5% 86.2% o-Fluorophenol 15.0 74.0% 81.3% m-Fluorophenol 5.2 86.1% 98.1% p-Fluorophenol 1.1 83.3% 97.2% o-Chlorophenol 77.0 41.5% 62.0% m-Chlorophenol 16.0 93.6% 98.3% p-Chlorophenol 6.3 84.8% 93.6%
4.4.7 Dynamic Volume Swell Summary
The overall behavior of the epoxy primer and polyurethane coatings were similar in each of the solvent systems used in this study, though the absolute response of the polyurethane was somewhat stronger than the epoxy. This characteristic should result in differential expansion between the two coatings which should contribute to the stripping process. With respect to the solvent components themselves, the greatest volume swell was imparted by the phenol followed by methylene chloride, ethanol, and water. However, it was found that when prepared as a blend these components interacted with each other such that the presence of ethanol actually reduced the activity of the solvent. However, ethanol also increased the solubility of water in the blend and this may be its primary function. Amongst all of these components the primary mechanism governing their solubility in the two coatings is hydrogen bonding balanced by their binding energy to the solvent (the strength of solvent-solvent interactions). In the case of methylene chloride these interactions are weak, but this factor is offset by its small molecular size and low binding energy to the solvent. The interaction with phenol is exceptionally strong, a characteristic that it attributed to the unique interaction between the hydroxyl group and the aromatic ring. Specifically, the sharing of lone-pair electrons between the hydroxyl oxygen and the aromatic ring weakens the ability of phenol to form hydrogen bonds with other phenol molecules in the solvent, but to also form exceptionally strong hydrogen bonds with hydrogen bonding acceptor sites in the polymer such as aliphatic hydroxyl groups and ether groups in epoxy and carbonyl and ether groups in polyurethane. 4.5 Task 5 – Surface Debonding
The volume swell results discussed in Section 4.4 reflect the strength of interaction between the solvent and the coatings in terms of how the coatings bond to themselves, that is, in terms of their cohesion. This is important as it reflects how the solvents penetrate the coatings causing them to swell and impart shear stress at the interface with the substrate. Furthermore, if the overall mechanism of cohesion is similar to that of the mechanism of adhesion then the volume swell should reflect the efficiency of the solvents in removing the coatings. Specifically, it was proposed that the mechanism of bonding between the topcoat and primer is similar to the mechanism of the cohesion within each coating in the form of limited interdiffusion and hydrogen bonding. Furthermore, recognizing that the substrate (the conversion coating) is largely an oxide surface with an abundance of hydrogen bonding acceptor sites, it was proposed that the

57
primary mechanism of bonding between the conversion coating and the epoxy primer was in the form of hydrogen bonding and therefore the adhesion interactions at this interface should be similar to the cohesion interactions occurring in the bulk phase. Consequently, the overall experimental approach to evaluating the debonding of the coatings from model substrates was similar to that used in the volume swell. Specifically, baseline data was obtained using model solvent systems which were then modified in ways to examine a specific molecular interaction. The substrates included aluminum (2024) panels and fully densified aluminum oxide (sapphire) prepared as described in Section 3.3. The aluminum panels were used to measure the overall efficiency of debonding from a representative substrate while the sapphire substrates were used to measure the rate of debonding at the primer/surface interface. 4.5.1 Analysis of the Bonding Surface
To assess the validity of the assumption that the bonding surfaces used in this study are primarily metal oxides examples of the aluminum and sapphire substrates were analyzed by X-ray photoelectron spectroscopy (XPS). This analysis showed that the surface of the prepared aluminum substrates are composed of approximately 20 atom% aluminum and 42 atom% oxygen while the prepared sapphire substrate consisted of approximately 16 atom% aluminum and 43 atom% oxygen (the balance being carbon and other minor components). For comparison an XPS analysis was performed on an aluminum substrate treated with Alodine 1600; this surface was found to consist of 13 atom% chromium and 59 atom% oxygen. This shows that these bonding interfaces can be modeled as metal oxide surfaces.
4.5.2 Extent of Debonding
The overall extent of debonding following an exposure to selected solvents was evaluated using a procedure described in Section 3.6. Briefly, for each analysis the test panel was immersed in the solvent for 30 minutes. Following the exposure, the panel was removed from the solvent, rinsed with deionized water, and wiped gently with a cotton swab to remove any of the coating that was removed by the solvent while also being careful not to physically remove any coating that was still bound to the panel. The panels were then allowed to air dry at room temperature for approximately 7 days and then photographed to record the condition of the panel. As shown in Figure 55, exposing the test panels to neat methylene chloride softened the coatings, but did not remove them to any great extent. Exposing the samples to neat chloroform removed most of the topcoat from the primer, but left much of the primer bound to the surface. Furthermore, the speckled appearance of the surface suggests a physical rather than a chemical mechanism. Specifically, it is proposed that this pattern results from the solvent penetrating the coating to the bonding surface where osmotic pressure lifts the coating from the surface forming a series of bubble-like cavities. The primer at the periphery of each cavity remains bound to the surface. Finally, exposing the panels to neat carbon tetrachloride has no effect. This series is consistent with the volume swell results discussed in Section 4.4 which showed that chloroform imparted somewhat greater swell than methylene chloride while carbon tetrachloride was relatively inert.

58
100% Methylene Chloride
100% Chloroform
100% Carbon Tetrachloride
Figure 55. Aluminum panels after 30 minutes in selected neat solvents. Figure 56 shows that blending 5-20% phenol with methylene chloride efficiently strips the topcoat from the primer, but leaves the primer virtually intact. It is proposed that stripping the topcoat from the primer limits the building of osmotic pressure under the coating and also limits the building of shear stress resulting from the differential volume swell between the topcoat and primer. This also illustrates this solvent system does not efficiently separate the intermolecular bonding between the primer and the surface. Figure 57 shows a slight improvement in the stripping efficiency when 4-8% ethanol is added to 20% phenol in methylene chloride. The pattern of removal (the speckled exposed surface) suggests a physical rather than chemical process and the primer is not cleanly removed from the surface. Figure 58 shows a significant improvement when 1-2% water is added to 8% ethanol and 20% phenol in methylene chloride. The exposed aluminum surface appears pristine showing that the primer was completely removed from the surface. Figure 59 shows that when phenol is removed from the system (8% ethanol with 1% water in methylene chloride) the speckled pattern of surface-bound primer returns. When ethanol is removed from the system (20% phenol with 1-2% water in methylene chloride) the primer is again effectively removed, leaving a pristine surface. It is proposed that this indicates a chemical process is taking place where the intermolecular bonds between the surface and that primer have been efficiently cleaved by the solvent system. Furthermore, this process results from an interaction between water and phenol. To further

59
5% Phenol in Methylene Chloride
10% Phenol in Methylene Chloride
15% Phenol in Methylene Chloride
20% Phenol in Methylene Chloride
Figure 56. Aluminum panels after 30 minutes in methylene chloride with phenol.
20% Phenol, 4% Ethanol in Methylene Chloride
20%Phenol, 8% Ethanol in Methylene Chloride
Figure 57. Aluminum panels after 30 minutes in methylene chloride with phenol and ethanol.

60
20% Phenol, 8% Ethanol, 1% Water in Methylene Chloride
20% Phenol, 8%Ethanol, 2% Water in Methylene Chloride
Figure 58. Aluminum panels after 30 minutes in methylene chloride with phenol, ethanol, and water.
8% Ethanol, 1% Water in Methylene Chloride
20% Phenol, 1 %Water in Methylene Chloride
20% Phenol, 2% Water in Methylene Chloride
Figure 59. Aluminum panels after 30 minutes in methylene chloride with ethanol and water, and with phenol and water.

61
explore this system, 1% water was added to 20% benzyl alcohol (where the hydroxyl is isolated from the aromatic ring by a single carbon) in methylene chloride and to 20% cyclohexanol (where the aromatic structure of the ring has been removed) in methylene chloride. As shown in Figure 60, the addition of water to these solvent greatly enhances their performance, but does not result in a clean surface. These results emphasize that an interaction occurs between water and phenol that results in the complete removal of the primer. It is proposed that this interaction is a result of phenol being a very weak organic acid. Specifically, as an acid, phenol can react with water to form phenoxy (PhO-) and hydronium (H3O+) ions. These ionic species can then react with the epoxy primer, and possibly the metal oxide surface, efficiently cleaving the polymer-surface intermolecular bonds. To test this hypothesis anhydrous acetic acid blended 1:1 with water was added to 20% benzyl alcohol and 8% ethanol as shown in Figure 61. This shows that as the acidity of the solvent is increased it effectively removes the coating, leaving a pristine surface similar to that found with the addition of phenol and water. This experiment was repeated using a base solvent consisting of 20% cyclohexanol and 8% ethanol, and as shown in Figure 62 this solvent did not significantly improve the performance of the solvent. Considering that the abundance of alcohol was providing a strong hydrogen bonding environment for the organic acid, thereby reducing its propensity to partition into the coating, the concentration of acetic acid was reduced while the total concentration of water plus acetic acid was kept at 2.5% as shown in Figure 63. In this environment the solvent was able to completely remove the coating indicating that the performance of the solvent does not necessarily increase with acid concentration and that a weak acid, such as phenol, may exhibit optimal performance. 4.5.3 Rate of Debonding
The overall rate of debonding during an exposure to selected solvents was evaluated using a procedure described in Section 3.7. Briefly, 1.2” sapphire disks were roughed on one side to mimic the rough surface of the aluminum panels, then prepared and coated in exactly the same manner as the aluminum panels. For each analysis the coated sample was placed, coated side up, in an optical cell along with 5 mL of solvent. The cell was then placed over a small digital camera and continuously photographed to record the debonding process. As shown in the example images given in Figure 64, the debonding process typically proceeds in three steps. First, a subtle change in contrast is observed as the solvent diffuses through the coating and arrives at the bonding interface. Next, voids, or “bubbles”, begin to form under the coating, lifting it from the substrate. As the debonding proceeds these voids grow and run together until the entire coating is removed. To quantify this process the fraction of bound surface is measured as a function of time. Figure 65 shows the removal of the coating as a function of time when exposed to methylene chloride with 0-20% phenol. This illustrates how methylene chloride by itself (0% phenol) does not remove the coating with an average of 97% of the coating remaining by the end of the 30 minute exposure period. As the phenol concentration is increase, the coating is removed with increasing efficiency with the average bound surface area decreasing from 66% to 41% as the phenol content is increase from 5% to 10%, respectively. With 20% phenol the coating is completely removed after approximately 25 minutes. It is interesting to note that the extent of removal approaches a constant value when the phenol concentration is below 20%. This suggests

62
that the removal process is physical rather than chemical. Specifically, a physical process would rely on osmotic pressure and differential expansion to lift and shear the coating from the surface whereas a chemical process would cleave the coating/surface intermolecular bonds.
20% Benzyl Alcohol in Methylene Chloride
20% Benzyl Alcohol, 1.0% Water in Methylene Chloride
20% Cyclohexanol in Methylene Chloride
20% Cyclohexanol, 1% Water in Methylene Chloride
Figure 60. Aluminum panels after 30 minutes in methylene chloride with benzyl alcohol and water, and with cyclohexanol and water.

63
20% Benzyl Alcohol, 8% Ethanol, 0.5% Acetic Acid, 0.5% Water in Methylene Chloride
20% Benzyl Alcohol, 8% Ethanol, 0.75% Acetic Acid, 0.75% Water in Methylene Chloride
20% Benzyl Alcohol, 8% Ethanol, 1% Acetic Acid, 1% Water in Methylene Chloride
20% Benzyl Alcohol, 8% Ethanol, 1.25% Acetic Acid, 1.25% Water in Methylene Chloride
Figure 61. Aluminum panels after 30 minutes in methylene chloride with benzyl alcohol, ethanol, anhydrous acetic acid, and water.

64
20% Cyclohexanol, 8% Ethanol, 0.5% Acetic Acid, 0.5% Water in Methylene Chloride
20% Cyclohexanol, 8% Ethanol, 0.75% Acetic Acid, 0.75% Water in Methylene Chloride
20% Cyclohexanol, 8% Ethanol, 1% Acetic Acid, 1% Water in Methylene Chloride
20% Cyclohexanol, 8% Ethanol, 1.25% Acetic Acid, 1.25% Water in Methylene Chloride
Figure 62. Aluminum panels after 30 minutes in methylene chloride with cyclohexanol, ethanol, anhydrous acetic acid, and water.

65
20% Cyclohexanol, 8% Ethanol, 1.25% Acetic Acid, 1.25% Water in Methylene Chloride
20% Cyclohexanol, 8% Ethanol, 0.63% Acetic Acid, 1.87% Water in Methylene Chloride
20% Cyclohexanol, 8% Ethanol, 0.25% Acetic Acid, 2.25% Water in Methylene Chloride
Figure 63. Aluminum panels after 30 minutes in methylene chloride with cyclohexanol, ethanol, anhydrous acetic acid, and water.
Figure 64. Example images of the epoxy primer/polyurethane topcoat system being removed from a sapphire substrate as viewed from the underside. From left to right; the solvent arrives as the bonding interface, dimples form and grow, and the coating expands and separates from the surface.

66
0
20
40
60
80
100
0 5 10 15 20 25 30
0% 5% 10% 20%
Boun
d A
rea
Rem
aini
ng, %
Exposure Time, minutes Figure 65. Debonding as a function of time for 0-20% phenol in methylene chloride. Figure 66 shows the removal of the coating as a function of time when exposed to methylene chloride with 20% phenol and 0-8% ethanol. This shows that when ethanol is added to the solvent the rate of removal slows. Specifically, although the coating is completely removed after 25 minutes with the addition of 4% ethanol, with 8% ethanol an average of 68% of the coating remains bound at the end of the 30 minute exposure. This is consistent with the volume swell analysis (Section 4.4.3) which showed that the volume swell decreases when ethanol is added to a solvent with methylene chloride and phenol. This is thought to result from the ethanol serving as a hydrogen bonding acceptor site in the solvent causing the polymer/solvent equilibrium to shift in favor of the solvent. Figure 67 shows the removal of the coating as a function of time when exposed to methylene chloride with 20% phenol, 8% ethanol and 0-2% water. This shows that when water is added to the system rate of removal greatly increases. Specifically, with the addition of 1-2% water the coating is completely removed in 13-15 minutes. This is consistent with the volume swell analysis (Section 4.4.4) which showed that as water was added to the solvent the volume swell increased. However, the effect on debonding is far greater than the modest increase in volume swell indicating that the influence of water on the coating adhesion is greater than its influence on the coating cohesion (volume swell).

67
0
20
40
60
80
100
0 5 10 15 20 25 30
0% 4% 8%
Boun
d A
rea
Rem
aini
ng, %
Exposure Time, minutes Figure 66. Debonding as a function of time for 20% phenol and 0-8% ethanol in methylene chloride.
0
20
40
60
80
100
0 5 10 15 20 25 30
0% 1% 2%
Boun
d A
rea
Rem
aini
ng,%
Exposure Time, minutes Figure 67. Debonding as a function of time for 20% phenol with 8% ethanol and 0-2% water in methylene chloride.

68
In the debonding analysis using the coated aluminum panels the addition of water was also found to increase the extent of the removal of the coating, leaving a pristine surface when phenol was present. This analysis was repeated here and as shown in Figure 68 when 0-2% water was added to methylene chloride with 20% phenol the rate of removal greatly increased with the full removal occurring after 7-10 minutes in the presence of water versus 25 minute without water. To determine whether the observed increase in efficiency is due to an interaction between water and phenol the rate of debonding was measured 0-1% water added to methylene chloride with 8% ethanol. As shown in Figure 69 the rate of removal for this system was also greatly increased with complete removal of the coating occurring in approximately 8 minutes. This suggests that the rapid debonding from the sapphire substrates in the presence of water does not arise from an interaction with phenol which is inconsistent with the debonding from aluminum substrates (Section 4.5.2). This suggests that the strength of adhesion between the coating and the sapphire substrates may not be as strong as the bonding with the aluminum substrates. Regardless, these results show how the presence of water, even at very low levels, can greatly increase the debonding process.
0
20
40
60
80
100
0 5 10 15 20 25 30
0% 1% 2%
Boun
d A
rea
Rem
aini
ng, %
Exposure Time, minutes Figure 68. Debonding as a function of time for 20% phenol with 0-2% water in methylene chloride.

69
0
20
40
60
80
100
0 5 10 15 20 25 30
0% 1%
Boun
d A
rea
Rem
aini
ng, %
Exposure Time, minutes Figure 69. Debonding as a function of time for 8% ethanol with 0-1% water in methylene chloride. 4.5.4 Surface Debonding Summary
Observing the debonding process from the underside using sapphire substrates has shown that the debonding process proceeds in three primary steps; penetration of the coating to the bonding interface, the formation of solvent-filled voids (bubbles) under the coating and begin to grow, finally the coating swells and separates from the surface as the voids continue to grow and join. This process is also reflected in the debonding of aluminum samples where in many cases much of the primer remains bound to the surface, but the surface is covered in small circular areas where the coating has been lifted from the surface from the underside. The perimeter of these voids often remain bound to the surface which is taken as an indication of a purely mechanical process in which the coating is lifted by osmotic pressure as the solvent diffuses to the surface through the coating. This is supported in cases where the topcoat is removed, leaving the primer nearly intact on the surface. In this case the loss of the topcoat prevents the building of osmotic pressure under the primer and the loss of a mechanism to lift the primer from the surface. The addition of water greatly increases the efficiency of the process. However, complete removal of the coating from the aluminum substrate occurs only when water is present along with a weak organic acid such as phenol or acetic acid. Furthermore, it appears that these acids are effective only at very low concentrations. As the concentration of the acid increases it is proposed that hydrogen bonding in the bulk solvent limits the ability of the acid to partition into the coating and hence to the bonding interface. The reaction at the bonding interface is not clear, though it may involve a combination of reactions with the coating and metal oxide surfaces resulting in the elimination of strong interfacial bonding forces and the release of the coating from the surface.

70
4.6 Task 6 - Solvent Absorption/Extraction
Volume swell and debonding are measures of the overall effect of the solvent systems on the cohesion and adhesion of the coatings. The purpose of this task was to observe how the primary solvent components partition between the bulk fluid and the polymer to as a means of measuring the relative strength of interaction between the solvent and polymer. This was accomplished in two ways. First, the strength of interaction was measured in the absence of solvent-solvent interactions by preparing selected solvents and molecular probes in dilute (0.05 molar) solutions in hexadecane. In this model the hexadecane serves as an inert diluent and the low concentration limits interactions between the probe molecules. Second, the strength of interaction was measured in the presence of solvent-solvent interactions by preparing nominal formations of the model solvents in methylene chloride. In both cases the strength of interaction is expressed in terms of the polymer/fluid partition coefficient, Kpf. Recall that the Kpf is the ratio of the concentration in the polymer to that in the overlying fluid. The method by which the Kpf was measured is described in Section 3.8. The polymer/fluid partition coefficients for selected solvent components and molecular probes are summarized in Table 11. From this analysis it was found that for the solvent components methylene chloride and phenol the Kpf values in the epoxy primer were 1.1 and 66.5, respectively, while in the polyurethane topcoat the Kpf values were found to be 1.7 and 76.3, respectively. This shows that in the absence of solvent-solvent interactions the coatings show an extremely high affinity towards the phenol and while there is limited affinity towards the methylene chloride indicating the strength of interaction between the coatings and solvents is much greater for the phenol as compared to the methylene chloride. As discussed in Section 4.4.2, the high activity of phenol is attributed to its ability to form strong hydrogen bonds with the polymer while forming relatively weak hydrogen bonds to other phenol molecules and that this characteristic arises from the association of the hydroxyl group with the aromatic ring. To test this hypothesis Kpf values were measured for benzyl alcohol (where the hydroxyl group is isolated from the ring by a methyl group), cyclohexanol (where the aromatic character has been removed from the ring), and n-butanol (a relatively small, linear alcohol). As shown in Table 11, the strength of interaction between the two coatings and benzyl alcohol is approximately half that of the phenol with Kpf values of 30.0 and 33.2 for the epoxy and polyurethane, respectively. The Kpf values for cyclohexanol drops to 0.13 and 0.28 for the epoxy and polyurethane, respectively, while the values for n-butanol are also comparatively low with values of 1.4 and 4.0 for the epoxy and polyurethane, respectively. While measuring the Kpf values in a dilute inert diluent reflects the relative affinity of each of the individual solvent components and molecular probes for the coatings, in a real solvent system the solvent-solvent interactions must also be considered. For this analysis the Kpf values were determined for the components of a model solvent consisting of 20% phenol, 8% ethanol, and 2% water in methylene chloride. As shown in Table 12 the solvent-solvent interactions greatly reduces the Kpf values, though the overall result is similar to what was observed from the dilute solutions. Specifically, the Kpf values for phenol were found to be 2.0 and 1.8 for the epoxy primer and polyurethane topcoat, respectively, as compared to 0.3 for methylene chloride in both coatings. This shows that under these conditions the coatings exhibit a degree of resistance to the methylene chloride whereas phenol is actually being accumulated by the coatings. The Kpf values for ethanol were found to be comparable to the methylene chloride, 0.6 and 0.4 for the

71
epoxy primer and polyurethane topcoat, respectively, which is consistent with the relative strength of interaction implied by the volume swell results discussed in Section 4.4.1. Unfortunately, the measuring the Kpf value for water proved problematic and could not be determined using the methods employed here.
Table 11 – Polymer/Fluid Partition Coefficients
for Selected Solvents and Molecular Probes
Solvent* Polymer Epoxy Polyurethane Methylene Chloride 1.1 1.7 Phenol 66.5 76.3 Benzyl Alcohol 30.0 33.2 Cyclohexanol 0.1 0.3 n-Butanol 1.4 4.0
*0.05M in hexadecane
Table 12 – Polymer/Fluid Partition Coefficients for the Components of a Model Solvent*
Component Polymer
Epoxy Polyurethane Methylene Chloride 0.3 0.3 Phenol 2.0 1.8 Ethanol 0.6 0.4 Water ** **
*20% Phenol, 8% ethanol, 2% water in methylene chloride. **The Kpf value for water could not be determined.
In addition to measuring the Kpf values, the GC-MS results were examined for the presence of species that may indicate chemical reactions occurring between the solvents and coatings. The only potential reaction products observed were a series of C2 to C16 carboxylic acids that were found when the epoxy primer is exposed to phenol at very low concentrations (0.05 molar) in hexadecane. These products are also observed in the presence of benzyl alcohol, though at much lower apparent yields. These products have also been noted when the epoxy primer was exposed to 20% phenol in methylene chloride, though the apparent absolute yield is similar to that seen from the very low concentration exposures suggesting that these products may not be the result of bond scission along the polymer backbone, but possible reactions involving unreacted epoxide end groups from the epoxy resin. No significant potential reaction products were observed from the polyurethane topcoat. This analysis shows that the two coatings used in this study have a very high affinity towards phenol and that this affinity declines as the hydroxyl group is isolated from the aromatic ring. Furthermore, alcohols show a comparatively low solubility even though they have the same basic hydroxyl functional group. This emphasizes that the relatively high activity of phenol originates

72
in the unique relationship between the hydroxyl group and the aromatic ring. Specifically, the sharing of electrons from the hydroxyl oxygen with the pi electron structure of the aromatic ring reduces the electronegative charge on this oxygen resulting the phenol forming comparatively weak hydrogen bonds with other phenol molecules, but being able to form very strong hydrogen bonds with hydrogen bond acceptor sites within the polymers such as the carbonyl sites in the polyurethane topcoat and the aliphatic hydroxyl sites in the epoxy primer. This analysis also shows that this solvent system is either non-reactive, the reactions do not produce products that can be analyzed by the GC-MS technique used here, or that the product yields are below the detection limit of the techniques used here.

73
Section 5
Conclusions and Implications for Future Research/Implementation The original goal of this study was to determine the specific roles of methylene chloride and phenol in methylene chloride/phenol-based (MC/P) paint strippers. This was later expanded to include the roles of ethanol and water as these are also common components in MC/P-based systems. As a system, it was determined that methylene chloride serves as the primary solvent both in terms of its interaction with the coatings and with the other solvent components. Specifically, methylene chloride is a small molecule that can easily penetrate the coatings causing them to swell and soften, but by itself it does not efficiently remove the coatings. However, swelling the coatings also serves to reduce the strength of polymer-polymer interactions which in turn enhances the ability of the other solvent components to penetrate the coating. Methylene chloride also serves as an efficient solvent for phenol and ethanol, but a poor solvent for water. Improving the solubility of water is likely the primary role of the ethanol, though in doing so it slightly reduces the solubility of the solvent components in the coatings by providing a hydrogen bonding characteristic in the bulk solvent. By itself phenol is also a powerful penetrant, though under normal conditions phenol is a solid so it requires a co-solvent such as methylene chloride to be useful as a paint stripping component. A contributing factor to phenol’s ability to penetrate the coatings is the unique relationship between the hydroxyl group and the aromatic ring. Briefly, the hydroxyl oxygen shares electrons with the aromatic ring, reducing the electronegative charge on the oxygen. This results in phenol forming comparatively weak hydrogen bonds with other phenol molecules, but also forming very strong hydrogen bonds to hydrogen bonding acceptor sites on other molecules, both in the solvent and in the coatings. This same intramolecular process gives phenol another very important characteristic; specifically, it makes phenol a very weak organic acid. This characteristic, combined with its ability to readily penetrate the coatings, is key to the efficiency of MC/P-based paint strippers. Furthermore, this characteristic is ‘activated’ by the presence of water, making water an activator in a very literal sense. Specifically, water can react to form phenoxy (PhO-) and hydronium (H3O+) ions which in turn can readily react with hydrogen bonding sites in the coatings and on the surface resulting in the fragmentation of the coating and the cleaving of polymer-surface intermolecular bonds resulting in the efficient release of the coatings from the substrate. The original experimental program was built around the hypothesis that the solvent system was non-reactive and was functioning by a purely solvent mechanism; that is the exchange of polymer-polymer and polymer-surface intermolecular bonds were being replaced by polymer-solvent intermolecular bonds. This approach was based on prior work with phenol and various elastomers which had shown that phenol was capable of forming exceptionally strong hydrogen bonds with these materials. Reactions with phenol were also considered unlikely given the high activation energy of typical reactions involving phenol making them unlikely at near-ambient temperature. However, the interaction between phenol and water forming reactive radicals at room temperature was unexpected and there were insufficient resources to pursue this mechanism in detail. The implications of this finding for future research are that it suggests the potential for chemical routes to paint stripping and that a detailed study of the reaction mechanisms may be beneficial. The scope of the original program was also somewhat limited, using only one coating system as a basis for the experimental program. This was done in part due

74
to the exploratory nature of the overall approach. Future research could focus on the components of this study that proved the most informative (for example the rate and extent of debonding) and include a greater variety of coating systems. With respect to implications for the near-term implementation of the results of this study, the limited tests using acetic acid as a weak organic acid suggest a possible approach. Specifically, there are alternative paint stripping formulations being considered, such as those based on benzyl alcohol, that may benefit from the inclusion of a weak organic acid. However, some caution must be taken in this approach as it has been shown that these acids may only function over a narrow concentration range; too low and the concentration of the reactive ions are also too low, too high and the organic acids may not partition into the coatings enough to be effective. Ideally, an organic acid that exhibits some of the characteristics of phenol (weak solvent-solvent interactions, strong polymer-solvent interactions, and low acidity) could be identified.

75
Section 6
Literature Cited
1. Aerospace Manufacturing and Rework Facilities; National Emissions Standards for Hazardous Air Pollutants for Source Categories, 40 CFR Parts 9 ad 63 [AD-FRL-5978-4], 1998.
2. Korish, S., “Depainting of Military Radomes; Elimination of HAP-Containing Solvents from Composite Repair Operations,” Metal Finishing, March, 2001.
3. Pepple, S.C., “The Depainting Dilemma,” Aircraft Maintenance Technology, March, 1998. 4. Bauer, J.P., Ruddy, E.N., “Options for Complying with the Aerospace MACT Standard for
Depainting,” Metal Finishing, April, 1996. 5. Howell, S.G., Springer, J., Marquis, E.T., “A Practical Approach to Choosing a Substitute
Solvent,” http://www.p2pays.org/ref/37/36854.pdf, accessed 2/1/2008. 6. Newman, P., “Peroxide-Activated Paint Removers in Aerospace Applications,” Metal
Finishing, March, 2004. 7. Miller-Chou, B.A., Koenig, J.L., “A Review of Polymer Dissolution,” Prog. Polym. Sci., 28,
pp. 1223-1270, 2003. 8. Flory, P.J., Principals of Polymer Chemistry, Cornell University Press, Ithaca, NY, 1953. 9. Hildebrand, J.H., Scott, R.L., The Solubility of Nonelectrolytes, 3rd edition, Dover
Publications, New York, N.Y., 1964. 10. Schwarzenbach, R.P., Gschwend, P.M., Imboden, D.M., Environmental Organic Chemistry,
John Wiley and Sons, Inc., New York, NY, 1993. 11. Hansen, C.M., Hansen Solubility Parameters: A Users Handbook, CRC Press LLC, New
York, NY, 2000. 12. M.J.T. Frisch et al., Gaussian 03 and 09, Wallingford, CT., 2004. 13. A.D. Becke, J. Chem. Phys. 98 (1993) 5648. 14. L.E. Chirlian, M.M. Francl, J. Comp. Chem. 8 (1987) 894-904. 15. S.F. Boys, F. Bernardi, Mol. Phys. 19 (1970) 553. 16. Wollbrink, T., “The Composition of Proprietary Paint Strippers,” Journal of the American
Institue for Conservation, Vol. 32, No.1, pp. 43-57, Spring, 1993. 17. High Purity Solvent Guide, 2nd Edition, P.A. Krieger, editor, Burdick & Jackson
Laboratories, Inc., 1984. 18. Box, G.E., Hunter, W.G., Hunter, J.S., Statistics for Experimenters, John Wiley & Sons, Inc.,
New York, NY, 1978.

76
Appendix
List of Scientific/Technical Publications
Graham, J., Yamada, T., Wolf, D., Vuong, V., “A Fundamental Study of How Methylene Chloride and Phenol Interact With Epoxy and Polyurethane Coatings,” poster presented at the SERDP-ESTCP Partners in Environmental Technology Technical Symposium & Workshop, Washington, D.C., December 1-3, 2009. Graham, J., Yamada, T., Culhane, W., Nyarko, E., “A Fundamental Study of the Activity of Selected Paint Stripping Components with Epoxy and Polyurethane Coatings,” poster presented at the SERDP-ESTCP Partners in Environmental Technology Technical Symposium & Workshop, Washington, D.C., November 30-Decmber 2, 2010. Graham, J., Yamada, T., Culhane, W., Nyarko, E., “The Relative Activity of Methylene Chloride, Phenol, Ethanol, and Water in the Removal of Epoxy and Polyurethane Coatings,” poster to be presented at the SERDP-ESTCP Partners in Environmental Technology Technical Symposium & Workshop, Washington, D.C., November 29-Decmber 1, 2011. Yamada, T, Graham, J., “Density Functional Theory Investigation of Interaction between Epoxy and Polyurethane Aircraft Coatings and Chemical Depainting Solvents,” Progress in Organic Coatings, submitted August, 2011. Graham, J., Yamada, T., Culhane, W., Nyarko, E., “The Effect of Selected Paint Stripping Components on the Removal of Epoxy and Polyurethane Aerospace Coatings,” publication in preparation, anticipated submission December, 2011. Nyarko, E., “Determination of the Relative Activity of Selected Paint Stripping Components with Epoxy and Polyurethane Aerospace Coatings,” M.S. Thesis, School of Engineering, University of Dayton, Dayton, Ohio, December, 2011.