sequencing the human genome in 1998, celera genomics announced plans to sequence the human genome…...
TRANSCRIPT

Sequencing the Human Genome
• In 1998, Celera Genomics announced plans to sequence the human genome…
• …175,000 sequence reads per day, operating 24 hours a day, 7 days a week
J. Craig Venter

Sequencing the Human Genome
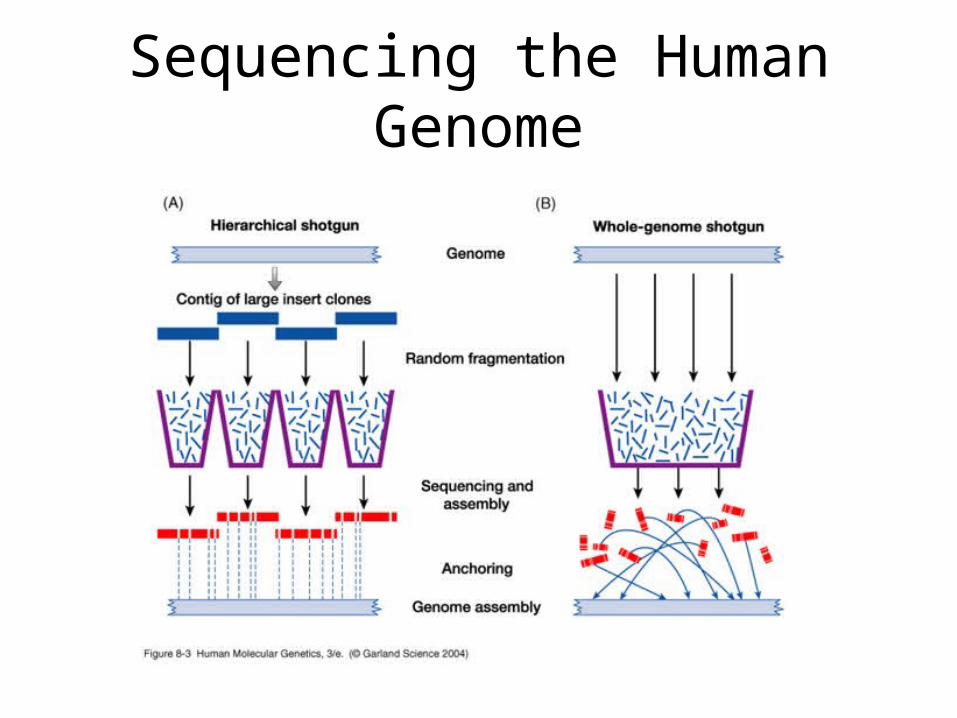
• Whole genome shotgun approach vs. Clone by Clone approach
• By-passes the initial work of ordering clones
• Celera performed about 32 million sequence reads, each 500 – 1000 bp
Sequencing the Human Genome
Sequencing the Human Genome
• IHGSC published sequence reads every 24 hours to prevent patenting of DNA
• Celera had access to IHGSC data
• Debate over whether Celera could have shotgun sequenced the genome without IHGSC data

Sequencing the Human Genome
• Both groups published results simultaneously
• Celera – Science
February 2001
• IHGSC – Nature
February 2001

Sequencing the Human Genome
Nature 409, 818 - 820 (15 February 2001)

Sequencing the Human Genome
• Controversy! Science published Celera’s sequence without requiring deposition to GenBank
• Celera provides full access, with a catch…
• Celera provided Science with a copy in escrow


Sequencing Your Human Genome
• For $500,000 you can have your DNA sequenced
• Sequence 1000 individual human genomes
• “Personalized” medicine
J. Craig Venter

Human Genome
• Legal considerations– Should DNA, or genes, be patentable?
• In the past, USPTO considered genes as man-made chemicals– Copy DNA region, splice it together, and
propagate it in bacteria, etc

Human Genome
• Celera >6500 genes
• Human Genome Sciences >7000
• Incyte >50,000
• Only a fraction may be awarded by USPTO, and only a fraction of these may be useful in treating human disease

Human Genome
• 1994 U. of Rochester scientists isolate mRNA for COX-2 and clone gene
• Suggest that compounds which inhibit COX-2 might provide pain relief from arthritis
• Submit patent application in 1995

Human Genome
• 1998 – Celebrex – inhibitor of cyclooxygenase-2 (COX-2) introduced as arthritis medication
• Developed by Pfizer/Searle
• Development began in early-90’s i.e. around time of U. of Rochester discovery

Human Genome
• April 2000, U. of Rochester awarded patent covering COX-2 gene and inhibition of the peptide product thereof
• The same day, U. of Rochester files lawsuit against Pfizer/Searle to block Celebrex sales
• Claims that Pfizer/Searle infringes on their patent
• They want royalties from the sale of the invention

Human Genome
• 2003 – U. of Rochester patent found invalid
• 2004 – Invalidation upheld by higher Court
• U. of Rochester patent did not provide sufficient example of what the inhibitor would be…i.e. claims too broad without a working example
• How will “basic science” performed by Universities be rewarded?

Human Genome
• Vioxx and Celebrex in news again this year: increased risk of “cardiovascular event” i.e. heart attacks

Human Genome
• Gene discovery– Methods for finding genes– Easy in prokaryotes

Human Genome
• Gene discovery– Difficult in eukaryotes

Human Genome
• Gene discovery– Average gene extends over 27 kb – Average 8.8 introns– Average 145 bp
• Extremes:– Dystrophin gene 2.4 Mb– Titin gene contains 178 introns, coding for a
80,780 bp mRNA
Human Genome
• Gene discovery– One approach is to examine “transcriptome”

Human Genome
• Conservation of chromosome/gene location between organisms
• Synteny
• Exons tend to be conserved between species

Human Genome
• Human vs. Pufferfish genome
• Pufferfish genome about 1/7th the size of the human genome with similar number of genes

Human Genome
• Predictive computer programs, e.g. GENSCAN
• GENSCAN predicts the location of genes based on splicing predictions, promoter regions and other criteria
Human Genome
• Online databases have formed to curate Human genome data
• Ensembl (www.ensemble.org)

Genetic Mapping of Mendelian Characters

Identifying Disease-Causing Gene Variations
• Linkage analysis and Positional Cloning
– Clone disease gene without knowing anything except the approximate chromosomal location

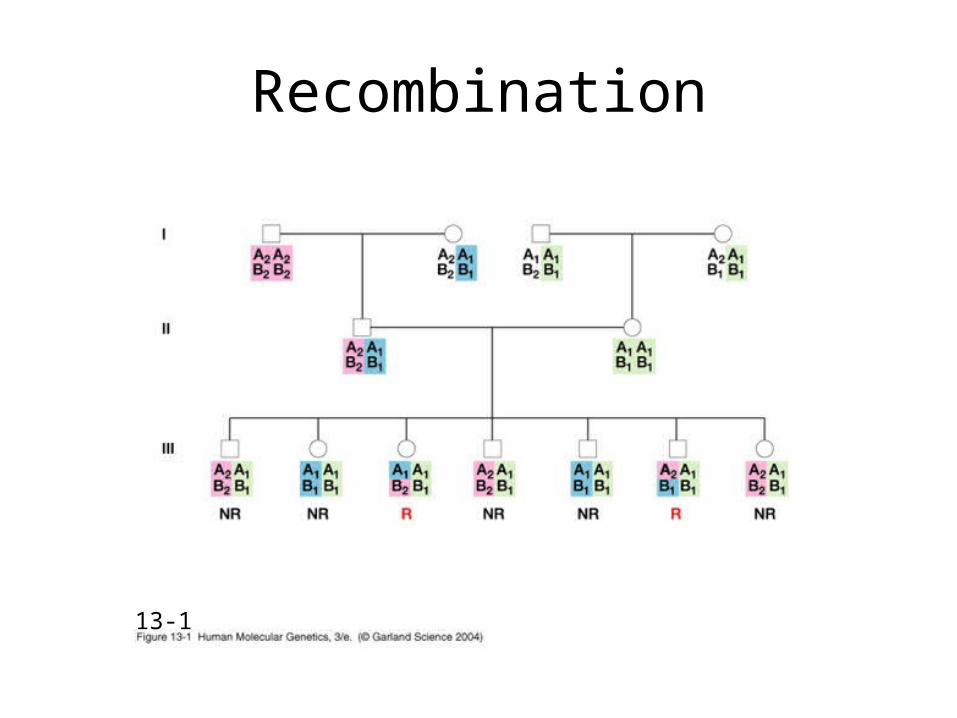
Recombination
• Recombination during meiosis separates loci– More often when they are farther apart– Less often when they are close
• Recall discussion of the Genetic Map– Loci on separate chromosomes segregate
independently– Loci on the same chromosome segregate as a
function of recombination
Recombination
13-1

13_06.jpg

Linkage analysis
• Linkage analysis locates the disease gene locus
– Linkage analysis requires• Clear segregation patterns in families• Informative markers close to the locus
– Utilize LOD analysis to verify linkage– Calculate cM distance between Loci

Positional Cloning
• Widely used strategy in human genetics for cloning disease genes
• No knowledge of the function of the gene product is necessary
• Strong for finding single-gene disorders

Positional Cloning
• Linkage analysis with polymorphic markers establishes location of disease gene
• LOD score analysis, and other methods are employed
• Once we know the approximate location…– The heavy molecular biology begins

Positional Cloning
• Example - Huntington’s disease
– CAG…
– Autosomal dominant– 100% penetrance– Fatal– Late onset means patients often have children

Finding the Huntington Gene – 1981-1983
• Family with Huntington's disease found in Venezuela
• Originated from a single founder - female
• Provided:– Traceable family pedigree– Informative meiosis
– Problem was… only a few polymorphic markers where known at the time

Finding the Huntington Gene
• Blood samples taken
• Check for disease symptoms
• Paternity verified

Finding the Huntington Gene
• By luck, one haplotype segregated very closely with Huntington disease
• Marker was an RFLP called G8 (later called D4S10)


Finding the Huntington Gene

Finding the Huntington Gene
• Locate the region to the tip of the short arm of chromosome 4 by linkage with G8 (D4S10)
• Maximum LOD score occurred at about 4 cM distance, i.e. 4 in 100 meiosis
Finding the Huntington Gene
• Together this started an international effort to generate YAC clones of the 4 Mb region
• More polymorphisms were found

Finding the Huntington Gene
• Next, find an unknown gene in an uncharacterized chromosome location
• Locate CpG islands
• Cross-species comparisons
• Further haplotype analysis suggested a 500 Kb region 3’ to D4S10

Finding the Huntington Gene
• Exon trapping was key
• Compare cloned exons between normal and Huntington disease patients

Finding the Huntington Gene

Finding the Huntington Gene
• One exon, called IT15, contained an expanded CAG repeat….
• Mapping to 4 cM – 1983
• Cloning of Huntington gene – 1993

Complex Disease and Susceptibility
Gene
Gene
Disease
Single gene disorders
Mendelian Inheritance
High penetrance
Low environmental influence (but sometimes significant)
LOD-based linkage analysis works great
Genetic heterogeneity
Low population incidence

Complex Disease and Susceptibility
Gene
Gene
Gene
Gene
Environment
Disease A Disease B Disease C
Multifactorial disorders

Complex Disease and Susceptibility
• Single gene disorders– Huntington’s– Fragile X– SCA1– DMD– Werner’s syndrome– Cystic fibrosis
• Multifactorial– Heart disease– Cancer– Stroke– Asthma– Diabetes– Alzheimer’s– Parkinson’s

Genetic Component in Complex Disorders
• Relative risk
r= frequency in relative of affected person
Population frequency

Genetic Component in Complex Disorders
• Family Studies
Class of relative Proportion of genes shared
Examples
First degree 50% Parent/child, siblings
Second degree 25% Grandparent/grand-child, aunt/niece
Third degree 12.5% Cousins

Genetic Component in Complex Disorders
• Problem of environmental impact
Congenital Malformations
Cleft lip Pyloric stenosis
General population 0.001 0.001
First degree relatives X40 (0.04) X10 (0.01)
Second degree relatives X7 X5
Third degree relatives X3 X1.5

Genetic Component in Complex Disorders
Disorder Monozygotic Dizygotic
Breast cancer 6.5 5.5
Type I diabetes 30 5
Type II diabetes 50 30
Multiple sclerosis 20 6
Peptic ulcer 64 44
Rheumatoid arthritis 50 8
Tuberculosis 51 22

Genetic Component in Complex Disorders
Disorder Monozygotic Dizygotic
Alcoholism 40 20
Autism 60 7
Schizophrenia 44 16
Alzheimer’s 58 26
Dyslexia 64 40
• In polygenic diseases, risk (susceptibility) alleles increase the phenotypic value
• Traits may appear continuously variable
• Traits may appear discontinuous
Genetic Component in Complex Disorders

Genetic Component in Complex Disorders
• How to find susceptibility gene?– Four main approaches
1. Candidate gene
2. Parametric linkage analysis
3. Non-parametric linkage analysis
4. Population association studies
Candidate gene
• Before searching the whole genome, think about what genes may be involved– Eg., Type I diabetes – Some genes involved in cell-mediated
immunity are located on chromosome 6 (Human leukocyte antigen region)
– Linkage between Type I diabetes and HLA was closely examined
• After a small genomic region is isolated, determine best candidate gene

Parametric Linkage Analysis
• Standard LOD score analysis, as used for single-gene disorders

Parametric Linkage Analysis
• Eg., breast cancer susceptibility genes• Collect family history of >1500 breast cancer
patients
– Some family histories showed multiple cases occurring at early ages – could be a Mendelian allele segregating
– Best model suggested a dominant single-gene allele with a population frequency of 0.0006 – this suggested about 5% of total breast cancers

Parametric Linkage Analysis
• Eg., breast cancer susceptibility genes• Collect family history of >1500 breast cancer
patients
– Now, look for families with multiple breast cancer cases with early onset
– Genotype family members and look for linkage
– Linkage (significant LOD score) to breast cancer was found to a marker on 17q21

Parametric Linkage Analysis
• Eg., breast cancer susceptibility genes• Collect family history of >1500 breast cancer
patients
– The gene involved was cloned, like other single-gene disorders
– Breast cancer (BRCA) 1 gene– tumor suppressor gene involved in genomic stability
– LOH leads to high penetrance of breast cancer, as well as ovarian cancer

Parametric Linkage Analysis
• Eg., breast cancer susceptibility genes• Collect family history of >1500 breast cancer
patients
– However, examination of BRCA1 mutations outside of affected families suggests lower penetrance

Parametric Linkage Analysis
• Other successes in finding Mendelian risk factors in polygenic diseases
– HNPCC – non-polyposis colon cancer• MSH1, MLH1, PMS1, PMS2
– FAP – familial polyposis colon cancer• APC
– Premature heart disease - hypercholesterolemia• Mutation of the LDL receptor

Parametric Linkage Analysis
• Familial hypercholesterolemia– Autosomal dominant

Parametric Linkage Analysis
• Familial hypercholesterolemia
• 200 mg/dl - 350 mg/dl - dietary, common
• 400 mg/dl - 600 mg/dl - heterozygous, uncommon
• >600 mg/dl - homozygous, rare

Parametric Linkage Analysis
• Familial hypercholesterolemia
• Autosomal dominant; allele frequency about 1:150

Parametric Linkage Analysis
• Spectacular misfires as well:– Bi-polar disease (manic depression)– Initial linkage to HRAS and INS on
chromosome 11– LOD scores of 4.08 and 2.63– Two individuals in extended family
misdiagnosed– Lowered LOD score to 1.03 and 1.75

Non-parametric Linkage Analysis
• Genomic regions surrounding risk alleles will be inherited from a common ancestor in affected individuals to a greater frequency than by chance – also called autozygosity mapping
• Search for commonly inherited regions by polymorphic microsatellites, SNP’s, etc.
• High throughput analysis critical
Non-parametric Linkage Analysis
• Common to use Affected Sib-Pairs (ASP)
• Collect genotypic data for 100’s of ASP
• 300+ microsatellite markers genotyped for 10cM coverage
• Look for significant IBD (>chance occurrence)

Non-parametric Linkage Analysis
• IBD: if parental alleles differ at locus, then sibs that have both alleles in common are identical by decent
• IBS: if parental alleles are not know, then we can only say sibs are identical by state

Population association studies
• Association studies are carried out on populations
• Look for alleles that segregate with the disease in a whole population– Direct causation– Natural selection– Linkage disequilibrium

Population association studies
• Linkage disequilibrium
• Combination of alleles at two closely linked loci occur more often than expected by chance from population frequencies
• Recombination reduces linkage disequilibrium

Population association studies
• Linkage disequilibrium vs. Linkage Mapping– Mapping is performed on families with few
informative meiosis; LD is determined on populations after many generations
– Mapping will show linkage over large distances; LD is visible only over short distances

Genetic Component in Complex Disorders
• How to find susceptibility genes?– Four main approaches
1. Candidate gene
2. Parametric linkage analysis
3. Non-parametric linkage analysis
4. Population association studies

Summary
• Family, adoption and twin studies provide evidence of genetic component to complex disease
• Risk of disease is the combined effect of polygenes influenced by environment, thus termed multifactorial
• Combined affect of many common alleles each providing a small effect, or of a few uncommon alleles with large effect
• Candidate gene, parametric and non-parametric linkage analysis, and population association analysis are used to find risk factors for multifactorial disease