sequence alignment of gdf15 from human, … figure 2 gdf15 decreases meal size but not meal ......
TRANSCRIPT

Supplementary Figure 1 Sequence alignment of GDF15 from human, cynomolgus monkey, and mouse. Sequence alignment of mature GDF15 from human (UniProt ID Q99988), cyno (RefSeq ID XP_005588497.1), and mouse (UniProt ID Q9Z0J7) and human GDNF (UniProt ID P39905) over a comparable region. Human sequence start site defined as in a previous report.36. Start for cyno and mouse sequences selected by similarity to human sequence. Alignment was colored with Jalview. Residues matching the consensus sequence are assigned a dark blue background; whereas residues differing from the consensus but with a positive Blosum62 score have a light blue background. Overall background intensity for a given column is adjusted based on the calculated conservation index at that position. Yellow boxes surround conserved cysteine residues. Similarity and identity matrices generated with the program MOE are shown to the right for the aligned GDF15 sequences. Black dots below the sequence of GDNF represent GDNF residues having any atom within 5 Å of GFRA1 in PDB 3FUB (chains B and A, respectively)28.
Nature Medicine: doi:10.1038/nm.4392

Supplementary Figure 2 GDF15 decreases meal size but not meal frequency in mice. (a) Meal number, (b) average amount consumed during each meal and the (c) average duration of meals in the six-hour period after a single subcutaneous administration of recombinant human or mouse GDF15 to lean mice (n = 7 per group). Data is reported as average ± s.e.m.. *P < 0.05 compared to PBS, one-way ANOVA with post hoc Tukey’s test.
Nature Medicine: doi:10.1038/nm.4392

Supplementary Figure 3 Serum concentration of HSA-GDF15 in male cynomolgus monkeys after a single subcutaneous administration. n = 8 per group. Data shown is average ± s.e.m..
Nature Medicine: doi:10.1038/nm.4392

Supplementary Figure 4 TGFβ receptor profiling upon GDF15 treatment using the PathHunterTM TGFβ family receptor dimerization assay. (a) Summary of receptor pairs tested for dimerization upon GDF15 treatment by PathHunterTM TGFβ family receptor dimerization assay (DiscoveRx). (b) Representative PathHunterTM TGFβ family receptor dimerization assay curve showing the dose dependent signal achieved when cells co-expressing ALK5 and TGFβII were treated with increasing concentrations of positive control TGFβ1 or GDF15. Data is shown as average ± s.d. of technical replicates.
Nature Medicine: doi:10.1038/nm.4392
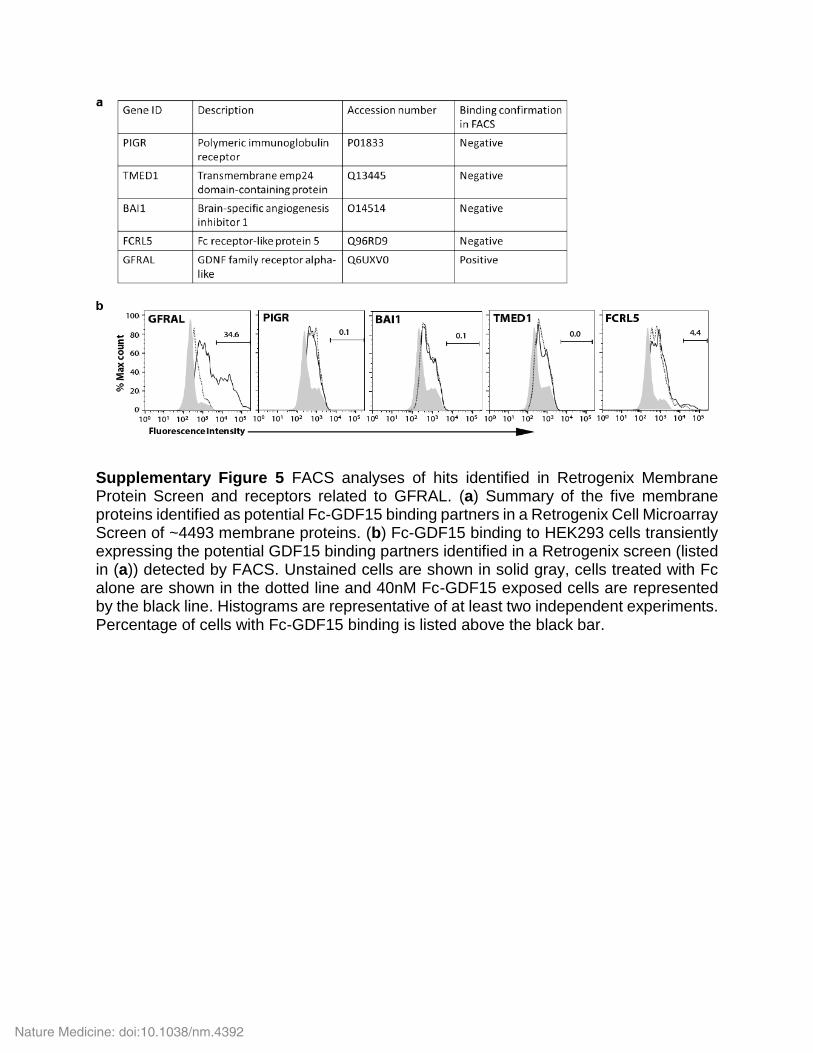
Supplementary Figure 5 FACS analyses of hits identified in Retrogenix Membrane Protein Screen and receptors related to GFRAL. (a) Summary of the five membrane proteins identified as potential Fc-GDF15 binding partners in a Retrogenix Cell Microarray Screen of ~4493 membrane proteins. (b) Fc-GDF15 binding to HEK293 cells transiently expressing the potential GDF15 binding partners identified in a Retrogenix screen (listed in (a)) detected by FACS. Unstained cells are shown in solid gray, cells treated with Fc alone are shown in the dotted line and 40nM Fc-GDF15 exposed cells are represented by the black line. Histograms are representative of at least two independent experiments. Percentage of cells with Fc-GDF15 binding is listed above the black bar.
Nature Medicine: doi:10.1038/nm.4392

Supplementary Figure 6 Assessment of GDF15 binding to GFRAL related GDNF family receptors. (a) Sequence alignment about GFRAL D2 domain from human (UniProt ID Q6UXV0), cyno (UniProt ID G7P2W4), and mouse (UniProt ID Q6SJE0) and rat GFRA1 (UniProt ID Q62997) over a comparable region. Alignment was colored with Jalview. Residues matching the consensus sequence are assigned a dark blue background; whereas residues differing from the consensus but with a positive Blosum62 score have a light blue background. Overall background intensity for a given column is adjusted based on the calculated conservation index at that position. Yellow boxes surround conserved cysteine residues. Similarity and identity matrices are shown to the right for the aligned GFRAL sequences. Black dots below the sequence of GFRA1 represent GFRA1 residues having any atom within 5 Å of GDNF in PDB 3FUB (chains A and B, respectively)28. (b) Fc-GDF15 binding to HEK293 cells transiently expressing GDNF family receptors, GFRA1-4 detected by FACS. Unstained cells are shown in solid gray, cells treated with Fc alone are shown in the dotted line and 40nM Fc-GDF15 exposed cells are represented by the black line. Histograms are representative of at least two independent experiments. Percentage of cells with Fc-GDF15 binding is listed above the black bar.
Nature Medicine: doi:10.1038/nm.4392

Supplementary Figure 7 Gfral expression in mice. (a) Gfral expression in the central nervous system of wild-type, Gfral+/- and Gfral-/- mice determined by qPCR. (n = 3 WT, 6 Gfral+/- and 5 Gfral-/-, data is shown as average ± s.e.m.). (b) In situ hybridization of Gfral in a sagittal section of mouse brain at postnatal day 56 reported in the Allen Mouse Brain Atlas39. Black arrow indicates area postrema. Image can be found at http://mouse.brain-map.org/gene/show/126377.
Nature Medicine: doi:10.1038/nm.4392
Nature Medicine: doi:10.1038/nm.4392

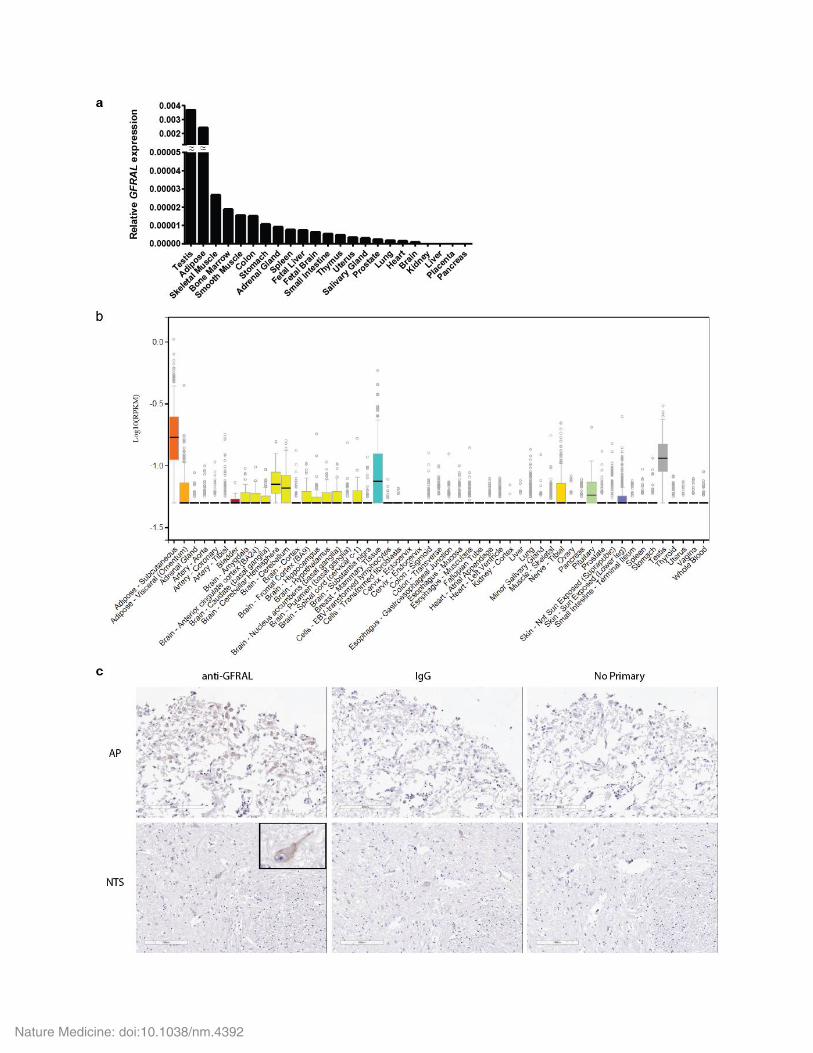
Supplementary Figure 8 Expression of Gfral in humans. (a) Gfral expression in a panel of human tissues determined by qPCR. Data is reflective of one pool of each tissue and is shown relative to PPIA. (b) Gfral expression determined by a query of publicly available RNAseq data at the GTEx Portal. (c) Anti-GFRAL antibody immuno-reactive neurons detected in the area postrema (AP) and nucleus of the solitary tract (NTS) of human medulla. Inset on bottom left shows a neuron in that panel at higher magnification. IgG and no primary incubation samples serve as negative controls.
Nature Medicine: doi:10.1038/nm.4392
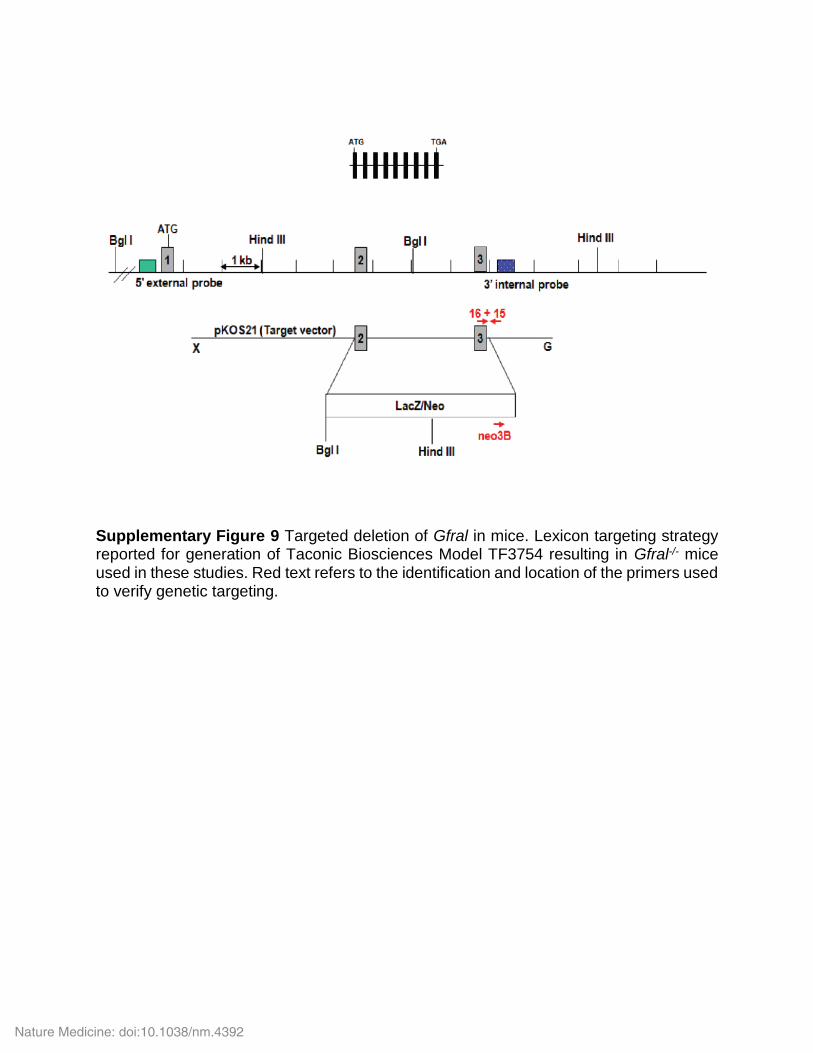
Supplementary Figure 9 Targeted deletion of Gfral in mice. Lexicon targeting strategy reported for generation of Taconic Biosciences Model TF3754 resulting in Gfral-/- mice used in these studies. Red text refers to the identification and location of the primers used to verify genetic targeting.
Nature Medicine: doi:10.1038/nm.4392
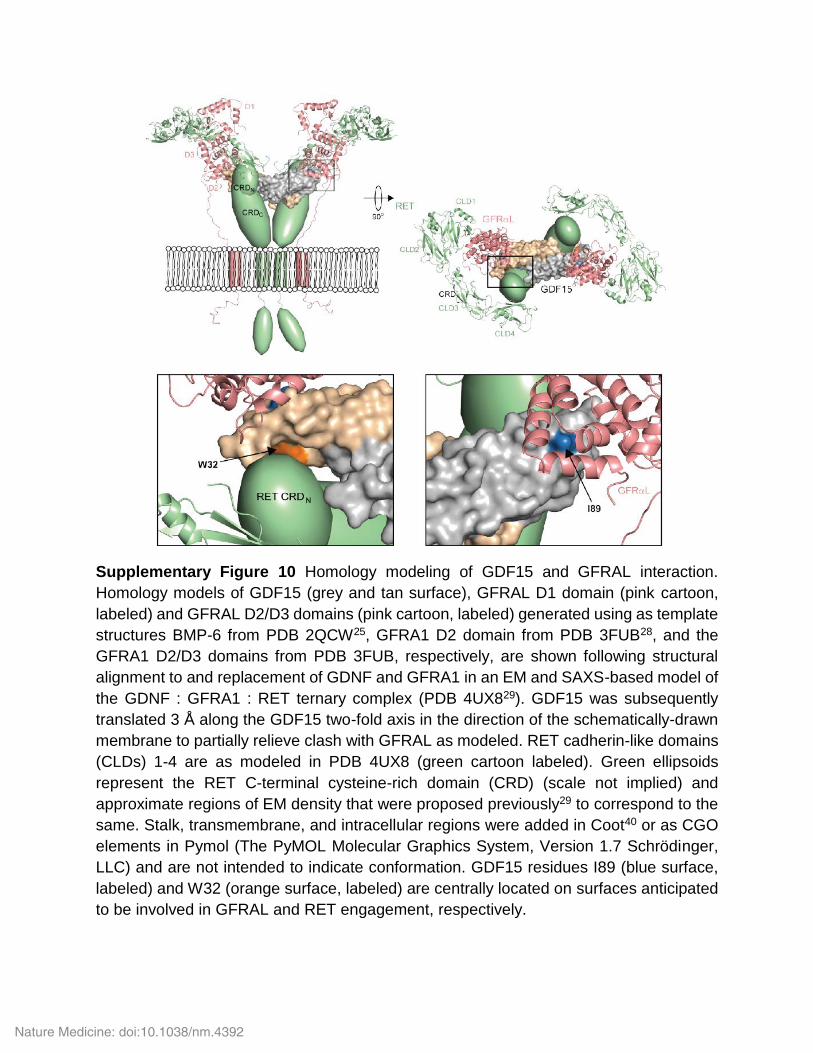
Supplementary Figure 10 Homology modeling of GDF15 and GFRAL interaction.
Homology models of GDF15 (grey and tan surface), GFRAL D1 domain (pink cartoon,
labeled) and GFRAL D2/D3 domains (pink cartoon, labeled) generated using as template
structures BMP-6 from PDB 2QCW25, GFRA1 D2 domain from PDB 3FUB28, and the
GFRA1 D2/D3 domains from PDB 3FUB, respectively, are shown following structural
alignment to and replacement of GDNF and GFRA1 in an EM and SAXS-based model of
the GDNF : GFRA1 : RET ternary complex (PDB 4UX829). GDF15 was subsequently
translated 3 Å along the GDF15 two-fold axis in the direction of the schematically-drawn
membrane to partially relieve clash with GFRAL as modeled. RET cadherin-like domains
(CLDs) 1-4 are as modeled in PDB 4UX8 (green cartoon labeled). Green ellipsoids
represent the RET C-terminal cysteine-rich domain (CRD) (scale not implied) and
approximate regions of EM density that were proposed previously29 to correspond to the
same. Stalk, transmembrane, and intracellular regions were added in Coot40 or as CGO
elements in Pymol (The PyMOL Molecular Graphics System, Version 1.7 Schrödinger,
LLC) and are not intended to indicate conformation. GDF15 residues I89 (blue surface,
labeled) and W32 (orange surface, labeled) are centrally located on surfaces anticipated
to be involved in GFRAL and RET engagement, respectively.
Nature Medicine: doi:10.1038/nm.4392

a.
b.
Supplementary Figure 11 Full scans of western blots in (a) Fig. 5d and (b) Fig. 5e.
Empty Vector GFRAL
198--
98--
62--
49--
38--
28--
14--
GFRAL Empty Vector GFRAL
198--
98--
62--
49--
38--
28--
14--
RET
Empty Vector GFRAL
198--
98--
62--
49--
38--
28--
14--
6--
pRET
Empty Vector GFRAL
198--
98--
62--
49--
38--
28--
14--
pERK1/2
Empty Vector GFRAL
198--
98--
62--
49--
38--
28--
14--
pAKTEmpty Vector GFRAL
198--
98--
62--
49--
38--
28--
14--
pPLCg
62--
49--
38--
28--
14--
Empty Vector GFRAL
b-actin
49--
38--
28--
14--
Empty Vector GFRAL
198--
98--
62--
RET
GFRAL
Empty Vector GFRAL
198--
98--
62--
49--
38--
28--
pRET
Empty Vector GFRAL
49--
38--
28--
14--
198--
98--
62--
pPLCg
pERK1/2
Empty Vector GFRAL
98--
62--
49--
38--
28--
14--
pAKT
62--
49--
38--
28--
Empty Vector GFRAL
b-actin
Nature Medicine: doi:10.1038/nm.4392
a.
b.
c.
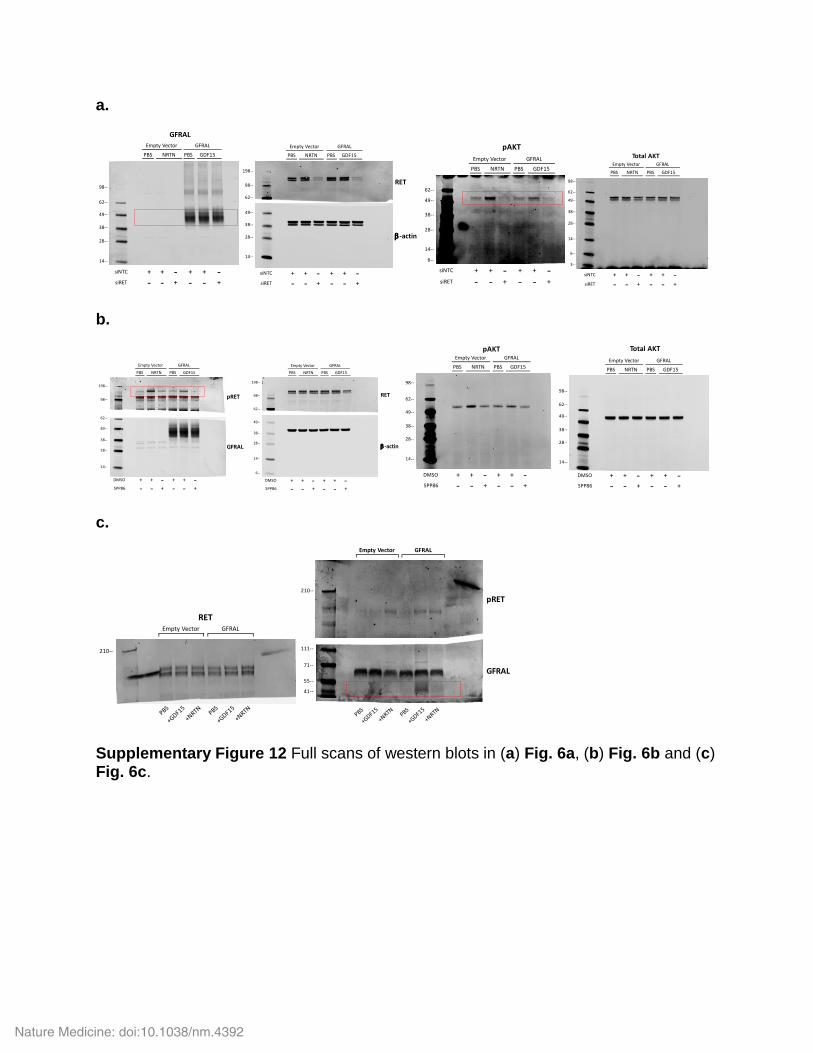
Supplementary Figure 12 Full scans of western blots in (a) Fig. 6a, (b) Fig. 6b and (c) Fig. 6c.
98--
62--
49--
38--
28--
14--
Empty Vector GFRAL
siNTC
siRET
+++ +- -- - - - ++
GFRAL
PBS NRTN PBS GDF15
62--
49--
38--
28--
198--
98--
14--
siNTC
siRET
+++ +- -- - - - ++
RET
b-actin
Empty Vector GFRAL
PBS NRTN PBS GDF15
62--
49--
38--
28--
14--
6--
siNTC
siRET
+++ +- -- - - - ++
pAKT
Empty Vector GFRAL
PBS NRTN PBS GDF15
62--
49--
38--
28--
98--
14--
6--
3--
siNTC
siRET
+++ +- -- - - - ++
Total AKTEmpty Vector GFRAL
PBS NRTN PBS GDF15
62--
49--
38--
28--
198--
98--
14--
DMSO
SPP86
+++ +- -- - - - ++
pRET
GFRAL
Empty Vector GFRAL
PBS NRTN PBS GDF15
62--
49--
38--
28--
198--
98--
14--
6--
DMSO
SPP86
+++ +- -- - - - ++
RET
b-actin
Empty Vector GFRAL
PBS NRTN PBS GDF15
62--
49--
38--
28--
98--
14--
DMSO
SPP86
+++ +- -- - - - ++
pAKTEmpty Vector GFRAL
PBS NRTN PBS GDF15
62--
49--
38--
28--
98--
14--
DMSO
SPP86
+++ +- -- - - - ++
Total AKT
Empty Vector GFRAL
PBS NRTN PBS GDF15
210--
Empty Vector GFRAL
RET
111--
210--
71--
55--
41--
Empty Vector GFRAL
pRET
GFRAL
Nature Medicine: doi:10.1038/nm.4392

Supplementary Figure 13 Summary of Gating Strategy used in flow cytometry experiments. (a) Cells were first selected based on size and cellular composition using forward (FSC-A) vs. side scatter pulse area (SSC-A) (gate P1), (b, c) aggregates and doublets were excluded based on forward (b) and side (c) scatter pulse height vs. their respective width parameters (FSC-H vs. FSC-W and SSC-H vs. SSC-W, gates P2 and P3), (d) dead cells were further excluded by 4’,6’-diamidino-2-phenylindole (DAPI) staining, and (e) Fc-GDF15 fusion protein binding positive population was gated based on the Alexa Fluor 647 signal of the isotype-matched Fc-alone protein as a negative control. Gating (a) to (e) was applied to all datasets, expect for datasets for Supplementary Fig. 5b where gating (d) was omitted because live/dead DAPI stain was not performed.
Nature Medicine: doi:10.1038/nm.4392
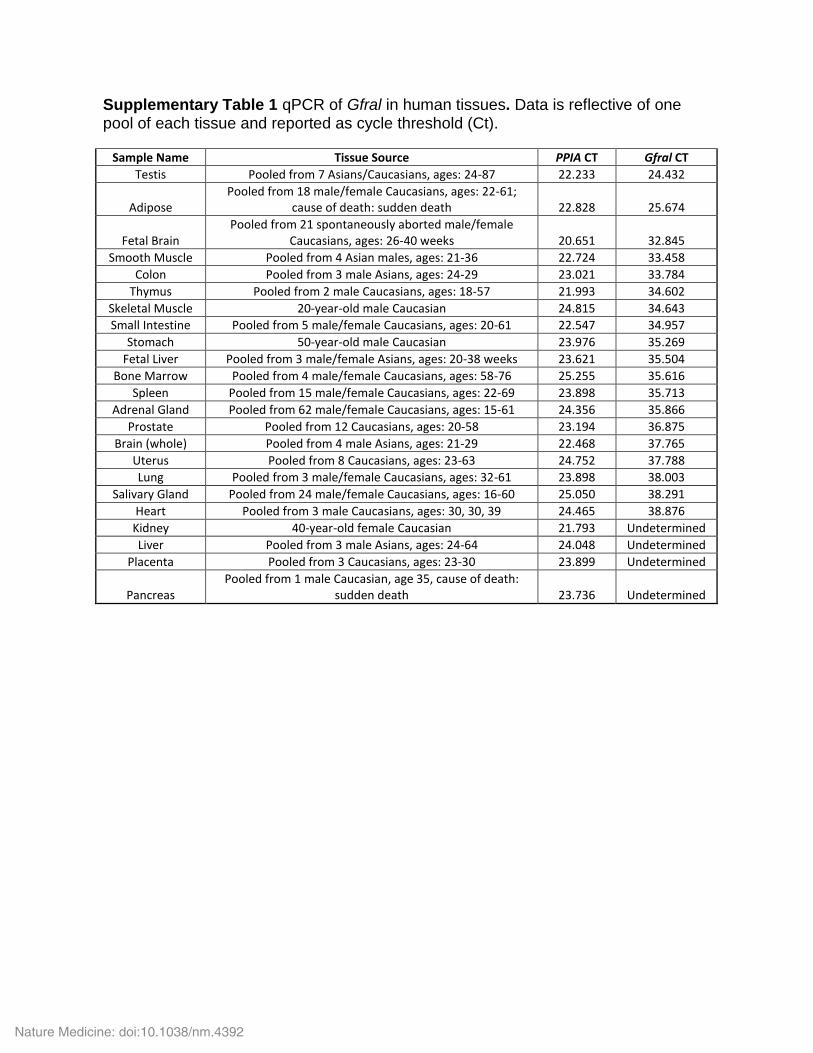
Supplementary Table 1 qPCR of Gfral in human tissues. Data is reflective of one pool of each tissue and reported as cycle threshold (Ct).
Sample Name Tissue Source PPIA CT Gfral CT
Testis Pooled from 7 Asians/Caucasians, ages: 24-87 22.233 24.432
Adipose Pooled from 18 male/female Caucasians, ages: 22-61;
cause of death: sudden death 22.828 25.674
Fetal Brain Pooled from 21 spontaneously aborted male/female
Caucasians, ages: 26-40 weeks 20.651 32.845
Smooth Muscle Pooled from 4 Asian males, ages: 21-36 22.724 33.458
Colon Pooled from 3 male Asians, ages: 24-29 23.021 33.784
Thymus Pooled from 2 male Caucasians, ages: 18-57 21.993 34.602
Skeletal Muscle 20-year-old male Caucasian 24.815 34.643
Small Intestine Pooled from 5 male/female Caucasians, ages: 20-61 22.547 34.957
Stomach 50-year-old male Caucasian 23.976 35.269
Fetal Liver Pooled from 3 male/female Asians, ages: 20-38 weeks 23.621 35.504
Bone Marrow Pooled from 4 male/female Caucasians, ages: 58-76 25.255 35.616
Spleen Pooled from 15 male/female Caucasians, ages: 22-69 23.898 35.713
Adrenal Gland Pooled from 62 male/female Caucasians, ages: 15-61 24.356 35.866
Prostate Pooled from 12 Caucasians, ages: 20-58 23.194 36.875
Brain (whole) Pooled from 4 male Asians, ages: 21-29 22.468 37.765
Uterus Pooled from 8 Caucasians, ages: 23-63 24.752 37.788
Lung Pooled from 3 male/female Caucasians, ages: 32-61 23.898 38.003
Salivary Gland Pooled from 24 male/female Caucasians, ages: 16-60 25.050 38.291
Heart Pooled from 3 male Caucasians, ages: 30, 30, 39 24.465 38.876
Kidney 40-year-old female Caucasian 21.793 Undetermined
Liver Pooled from 3 male Asians, ages: 24-64 24.048 Undetermined
Placenta Pooled from 3 Caucasians, ages: 23-30 23.899 Undetermined
Pancreas Pooled from 1 male Caucasian, age 35, cause of death:
sudden death 23.736 Undetermined
Nature Medicine: doi:10.1038/nm.4392
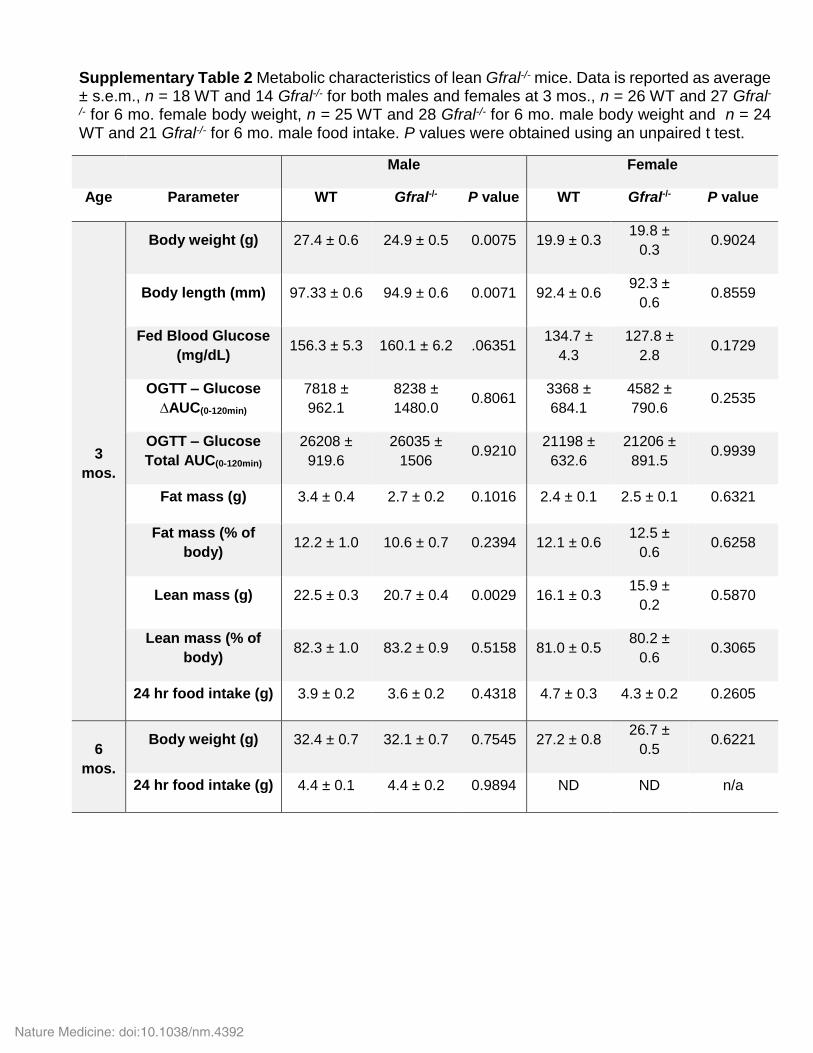
Supplementary Table 2 Metabolic characteristics of lean Gfral-/- mice. Data is reported as average ± s.e.m., n = 18 WT and 14 Gfral-/- for both males and females at 3 mos., n = 26 WT and 27 Gfral-/- for 6 mo. female body weight, n = 25 WT and 28 Gfral-/- for 6 mo. male body weight and n = 24 WT and 21 Gfral-/- for 6 mo. male food intake. P values were obtained using an unpaired t test.
Male Female
Age Parameter WT Gfral-/- P value WT Gfral-/- P value
3
mos.
Body weight (g) 27.4 ± 0.6 24.9 ± 0.5 0.0075 19.9 ± 0.3 19.8 ±
0.3 0.9024
Body length (mm) 97.33 ± 0.6 94.9 ± 0.6 0.0071 92.4 ± 0.6 92.3 ±
0.6 0.8559
Fed Blood Glucose
(mg/dL) 156.3 ± 5.3 160.1 ± 6.2 .06351
134.7 ±
4.3
127.8 ±
2.8 0.1729
OGTT – Glucose
∆AUC(0-120min)
7818 ±
962.1
8238 ±
1480.0 0.8061
3368 ±
684.1
4582 ±
790.6 0.2535
OGTT – Glucose
Total AUC(0-120min)
26208 ±
919.6
26035 ±
1506 0.9210
21198 ±
632.6
21206 ±
891.5 0.9939
Fat mass (g) 3.4 ± 0.4 2.7 ± 0.2 0.1016 2.4 ± 0.1 2.5 ± 0.1 0.6321
Fat mass (% of
body) 12.2 ± 1.0 10.6 ± 0.7 0.2394 12.1 ± 0.6
12.5 ±
0.6 0.6258
Lean mass (g) 22.5 ± 0.3 20.7 ± 0.4 0.0029 16.1 ± 0.3 15.9 ±
0.2 0.5870
Lean mass (% of
body) 82.3 ± 1.0 83.2 ± 0.9 0.5158 81.0 ± 0.5
80.2 ±
0.6 0.3065
24 hr food intake (g) 3.9 ± 0.2 3.6 ± 0.2 0.4318 4.7 ± 0.3 4.3 ± 0.2 0.2605
6
mos.
Body weight (g) 32.4 ± 0.7 32.1 ± 0.7 0.7545 27.2 ± 0.8 26.7 ±
0.5 0.6221
24 hr food intake (g) 4.4 ± 0.1 4.4 ± 0.2 0.9894 ND ND n/a
Nature Medicine: doi:10.1038/nm.4392
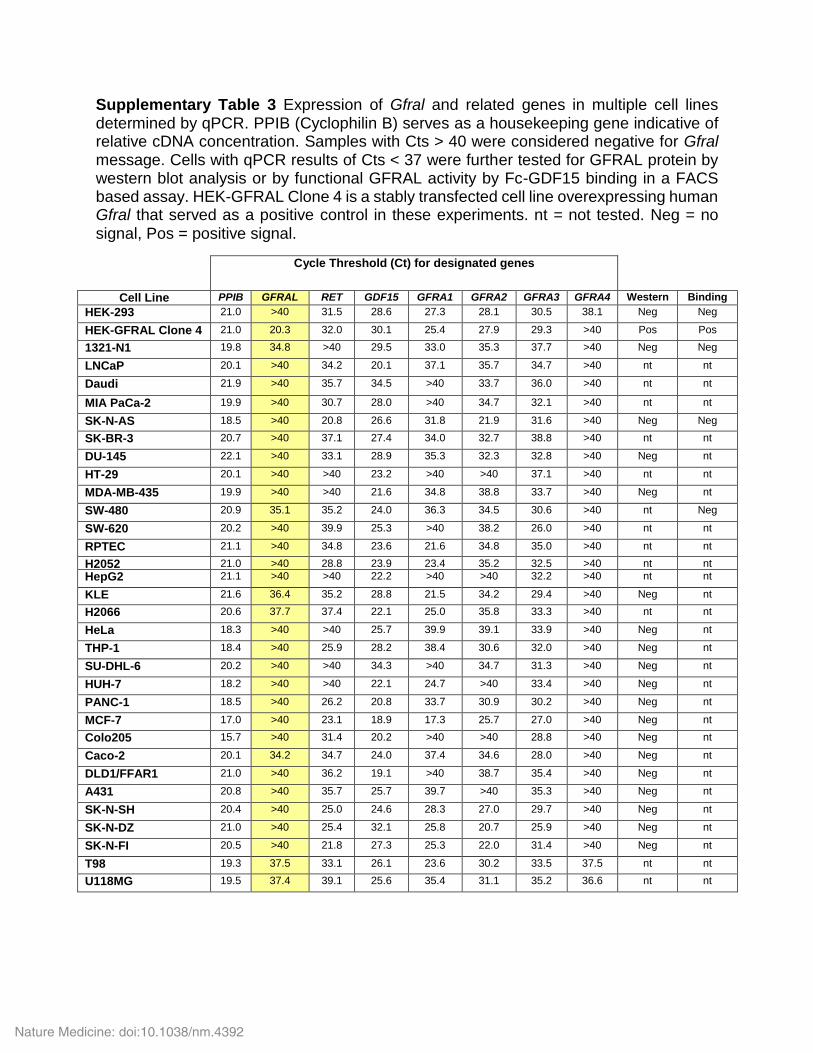
Supplementary Table 3 Expression of Gfral and related genes in multiple cell lines determined by qPCR. PPIB (Cyclophilin B) serves as a housekeeping gene indicative of relative cDNA concentration. Samples with Cts > 40 were considered negative for Gfral message. Cells with qPCR results of Cts < 37 were further tested for GFRAL protein by western blot analysis or by functional GFRAL activity by Fc-GDF15 binding in a FACS based assay. HEK-GFRAL Clone 4 is a stably transfected cell line overexpressing human Gfral that served as a positive control in these experiments. nt = not tested. Neg = no signal, Pos = positive signal.
Cycle Threshold (Ct) for designated genes
Cell Line PPIB GFRAL RET GDF15 GFRA1 GFRA2 GFRA3 GFRA4 Western Binding
HEK-293 21.0 >40 31.5 28.6 27.3 28.1 30.5 38.1 Neg Neg
HEK-GFRAL Clone 4 21.0 20.3 32.0 30.1 25.4 27.9 29.3 >40 Pos Pos
1321-N1 19.8 34.8 >40 29.5 33.0 35.3 37.7 >40 Neg Neg
LNCaP 20.1 >40 34.2 20.1 37.1 35.7 34.7 >40 nt nt
Daudi 21.9 >40 35.7 34.5 >40 33.7 36.0 >40 nt nt
MIA PaCa-2 19.9 >40 30.7 28.0 >40 34.7 32.1 >40 nt nt
SK-N-AS 18.5 >40 20.8 26.6 31.8 21.9 31.6 >40 Neg Neg
SK-BR-3 20.7 >40 37.1 27.4 34.0 32.7 38.8 >40 nt nt
DU-145 22.1 >40 33.1 28.9 35.3 32.3 32.8 >40 Neg nt
HT-29 20.1 >40 >40 23.2 >40 >40 37.1 >40 nt nt
MDA-MB-435 19.9 >40 >40 21.6 34.8 38.8 33.7 >40 Neg nt
SW-480 20.9 35.1 35.2 24.0 36.3 34.5 30.6 >40 nt Neg
SW-620 20.2 >40 39.9 25.3 >40 38.2 26.0 >40 nt nt
RPTEC 21.1 >40 34.8 23.6 21.6 34.8 35.0 >40 nt nt
H2052 21.0 >40 28.8 23.9 23.4 35.2 32.5 >40 nt nt
HepG2 21.1 >40 >40 22.2 >40 >40 32.2 >40 nt nt
KLE 21.6 36.4 35.2 28.8 21.5 34.2 29.4 >40 Neg nt
H2066 20.6 37.7 37.4 22.1 25.0 35.8 33.3 >40 nt nt
HeLa 18.3 >40 >40 25.7 39.9 39.1 33.9 >40 Neg nt
THP-1 18.4 >40 25.9 28.2 38.4 30.6 32.0 >40 Neg nt
SU-DHL-6 20.2 >40 >40 34.3 >40 34.7 31.3 >40 Neg nt
HUH-7 18.2 >40 >40 22.1 24.7 >40 33.4 >40 Neg nt
PANC-1 18.5 >40 26.2 20.8 33.7 30.9 30.2 >40 Neg nt
MCF-7 17.0 >40 23.1 18.9 17.3 25.7 27.0 >40 Neg nt
Colo205 15.7 >40 31.4 20.2 >40 >40 28.8 >40 Neg nt
Caco-2 20.1 34.2 34.7 24.0 37.4 34.6 28.0 >40 Neg nt
DLD1/FFAR1 21.0 >40 36.2 19.1 >40 38.7 35.4 >40 Neg nt
A431 20.8 >40 35.7 25.7 39.7 >40 35.3 >40 Neg nt
SK-N-SH 20.4 >40 25.0 24.6 28.3 27.0 29.7 >40 Neg nt
SK-N-DZ 21.0 >40 25.4 32.1 25.8 20.7 25.9 >40 Neg nt
SK-N-FI 20.5 >40 21.8 27.3 25.3 22.0 31.4 >40 Neg nt
T98 19.3 37.5 33.1 26.1 23.6 30.2 33.5 37.5 nt nt
U118MG 19.5 37.4 39.1 25.6 35.4 31.1 35.2 36.6 nt nt
Nature Medicine: doi:10.1038/nm.4392
Supplemental References:
39. Lein, E.S., et al. Genome-wide atlas of gene expression in the adult mouse brain. Nature
445, 168-176 (2007). 40. Emsley, P. & Cowtan, K. Coot: model-building tools for molecular graphics. Acta
crystallographica. Section D, Biological crystallography 60, 2126-2132 (2004).
Nature Medicine: doi:10.1038/nm.4392