seq’ing the cure: neuroscience edition
TRANSCRIPT
Case copyright held by the National Center for Case Study Teaching in Science, University at Buffalo, State University of New York. Originally published November 24, 2021. Please see our usage guidelines, which outline our policy concerning permissible reproduction of this work. Credit: Licensed image © Andrianocz | Dreamstime, id 108686085.
NATIONAL CENTER FOR CASE STUDY TEACHING IN SCIENCE
Learning Objectives• Define high-throughput (HT) technologies.• Discuss the molecular mechanism of CRISPR/Cas9. • Summarize the pathophysiology of neurological disorders.• Analyze clinical data.• Utilize Microsoft Excel to analyze RNA-seq data and identify differentially expressed genes.• Evaluate biochemical pathways enriched in differentially expressed genes using bioinformatic tools.• Interpret and analyze peer-reviewed high-throughput discovery scientific literature.
PreparationThe powerful and cutting-edge experimental techniques critical in this case study will be researched and taught by you! Therefore, it is imperative that you come prepared for the first day of the case study with your topic appropriately reviewed ahead of time. Your instructor will assign you into groups based on topic. As a group, you will research your topic using the resources provided below. Use as many of the listed resources or other sources as you like and answer the questions for your group. Using the questions as a guide, create a short (10–15 min) PowerPoint presentation with your group that you will present to the entire class to teach them about your topic and answer any questions. Each group member should have an active role in both the research and presentation of the assigned topic. Additionally, please be sure to include diagrams or other visuals to illustrate your topic.
Group 1 – What Is the Mechanism of CRISPR-Cas9?Tasks and Questions
1. Describe the CRISPR-Cas9 mechanism of genome editing. 2. Make a timeline that highlights key events in the discovery of this technology.3. Create a simplified diagram of this mechanism.4. Compare and contrast CRISPR-Cas9 to at least two other modulators of gene expression and genome editing
tools such as RNAi, TALEN, or Cas9 nuclease.5. What other scientific uses can CRISPR have outside of gene editing?
Resources• Radiolab Podcast
- Listen to the following podcast and learn about the controversy surrounding CRISPR: “Update: CRISPR.” February 24, 2017. Run time: 52:29 min. <https://www.wnycstudios.org/story/update-crispr>
• TED Talk- The following TEDTalk by the co-inventor of CRISPR, Jennifer Doudna, details how CRISPR-Cas9 works: “How CRISPR let us edit our DNA.” Run time: 15:44 min. <https://www.ted.com/talks/jennifer_doudna_how_crispr_lets_us_edit_our_dna>
Seq’ ing the Cure: Neuroscience EditionbyHeather B. Miller 1, Sabrina D. Robertson 2, and Melissa C. Srougi 1, 3
1 Department of Chemistry, High Point University 2 Department of Psychology and Neuroscience, University of North Carolina at Chapel Hill3 Department of Molecular Biomedical Sciences and the Biotechnology Program, North Carolina State University

NATIONAL CENTER FOR CASE STUDY TEACHING IN SCIENCE
Page 2“Seq’ing the Cure: Neuroscience Edition” by Miller, Robertson, & Srougi
• CRISPR-Cas9 Mechanism and Applications- Use the following interactive module from HHMI Biointeractive (~20 min) to visualize and interact with
the CRISP-Cas9 gene editing mechanism: <https://www.hhmi.org/biointeractive/crispr-cas-9-mechanism-applications>
Group 2 – What Is Next-Generation Sequencing (NGS)?Tasks and Questions
1. Discuss the clinical potential of RNA-seq technology.2. Compare and contrast RNA-seq and microarray technology.3. Compare and contrast Sanger sequencing and NGS technologies.4. Define sequencing by synthesis.5. Describe the scale, general chemistry, and applications of NGS.6. Compare and contrast the scale and general chemistry of ion torrent, SMRT sequencing, and nanopore
sequencing using visual aids.
Resources• The Potential of RNA-seq
- Watch the following short video (run time: 1:30 min) and read the article below the video about the potential of RNA-seq in precision medicine:
Buguliskis, J.S. 2015. Plowing through transcriptional variations by harnessing the powerful next-gen technique. Genetic Engineering and Biotechnology News 35(5). <https://www.genengnews.com/gen-articles/could-rna-seq-become-the-workhorse-of-precision-medicine/5435>
• Introduction to Next-Generation Sequencing- Read the section 2.3 Next-Generation Sequencing, pp. 45–51 (textbook page numbers, not the PDF) from
Molecular Medicine: An Introduction (2015) by J. Kurreck and C.A. Stein, Wiley-VCH Verlag GmbH. - Sequencing Learning Center from ThermoFisher Scientific: <https://www.thermofisher.com/us/en/home/life-
science/sequencing/sequencing-education.html>• Compare Sanger Sequencing and NGS Technology
- How Does Sanger Sequencing Work? – Seq It Out #1 [Video] Produced by Thermo Fisher Scientific, 2015. Run time: 3:27 min. <https://youtu.be/e2G5zx-OJIw>
- Illumina Sequencing by Synthesis. [Video] Produced by Illumina, 2016. Run time: 5:12 min. <https://youtu.be/fCd6B5HRaZ8>
• Explore the Variety of NGS Technologies- Ion Torrent Next-Generation Sequencing. [Video] Produced by Thermo Fisher Scientific, 2020. Run time:
3:23 min. <https://youtu.be/zBPKj0mMcDg>- Single Molecule Real Time Sequencing – Pacific Biosciences. [Videos] Produced by Pacific Biosciences, 2011.
Run time: 4:04 min. <https://youtu.be/v8p4ph2MAvI>- Nanopore DNA Sequencing [Video] Produced by Oxford Nanopore Technologies, 2016. Run time: 4:29 min.
<https://youtu.be/E9-Rm5AoZGw>

NATIONAL CENTER FOR CASE STUDY TEACHING IN SCIENCE
Page 3“Seq’ing the Cure: Neuroscience Edition” by Miller, Robertson, & Srougi
Part I – A Typical Day in the ClinicWhile waiting for her patient samples, Amy reminisced about her college days and the time she received a surprise package from her parents. She fondly recalled tearing open the package with such anticipation, but being disappointed to find a plain brown box labeled “CRISPR DIY kit” attached with a note from Mom and Dad. “Have fun, my bud-ding medical doctor!” What a letdown.
Oh, how she missed those carefree days back at Life Skills University as she reflected on the one gift that changed the trajectory of her life. Who knew that tinkering with a DIY science kit would one day lead her to become a budding expert in neurological genetic engineering?
Since graduating, Amy had obtained a coveted residency position at a prestigious medical school in the Department of Neurology and Neurological Sciences. Her advanced training was to begin that evening as she covered the last shift in the neurological disorders unit.
Buuuuzzz.... “Dr. Amy Li, you are requested for an emergency neuro consult.” Amy rushed down the hallway to meet a patient who had been brought to the ER a few minutes ago by his friend. The patient presented with blurred vision, slurred speech, uncontrollable laughing, difficulty swallowing and trouble walking. He reeked of alcohol. Since the at-tending physician, Dwayne, had run into the patient at a bar earlier that evening, he had assumed the patient was drunk and had ordered a blood alcohol test.
Triage Nurse ReportPatient Description:
• Gael R. Moreno • 41 years old, Hispanic male• patient transported from a bar to the ER after inability to communicate
Symptoms:• blurred vision, slurred speech, uncontrollable laughing, trouble walking, difficulty swallowing
Tests:• blood alcohol (0.01%)
Since the patient’s speech was still unclear, Amy asked to talk to Gael’s friend. He explained that Gael started com-plaining of blurred vision months ago. He also recalled a time when they were playing basketball and Gael could not control his running.
In fact, he recalled Gael complaining about a progressive deterioration in his basketball game and a feeling that he could not control his hands or feet like he used to when they had played basketball together years ago in the military.
Question1. Given Gael’s symptoms, blood alcohol level, and history described by his friend, what neurological disorders may
be at play here? Please explain your reasoning.

NATIONAL CENTER FOR CASE STUDY TEACHING IN SCIENCE
Page 4“Seq’ing the Cure: Neuroscience Edition” by Miller, Robertson, & Srougi
Part II – Uncovering the Patient’s Medical HistoryThe report of progressive deterioration in Gael’s voluntary motor actions troubled Dr. Li. Given the symptoms and surprisingly low blood alcohol level, she performed a routine physical exam and took a full medical history directly from the patient.
Results• Reports of blurred vision, progressive difficulty swallowing and playing basketball. • Military history in the Gulf War.• Family history reveals a grandmother with multiple sclerosis (MS) and great grandmother who had amyotrophic
lateral sclerosis (ALS).
Questions1. Define MS and ALS. Identify some symptoms in each.
2. How are these diseases similar? How are they different?
3. Could there be other causes (not MS or ALS) for these neurological symptoms? Identify diagnostic tests commonly used.

NATIONAL CENTER FOR CASE STUDY TEACHING IN SCIENCE
Page 5“Seq’ing the Cure: Neuroscience Edition” by Miller, Robertson, & Srougi
Part III – Neurological Test ResultsBased on family history and symptoms, Gael’s motor impairments could be the result of a variety of neurological conditions. To help decipher the exact cause of her patient’s ailments, Dr. Li ordered a complete battery of neurologi-cal tests. She shared the patient’s test results with the rest of the attending physicians in the neurological disorders unit, shown below:
Results• MRI
- no evidence of spinal cord tumors or cervical spondylosis- evidence of cortical atrophy
• EMG - abnormal, spontaneous electrical activity- tongue fasciculation and chronic partial denervation
• NCV- normal motor and sensory nerve conduction in legs
• Spinal tap- no evidence of infection or elevated IgGs
• Blood and urine tests for thyroid function- thyroid and parathyroid levels normal- electrolyte levels normal- higher than normal levels of p75ECD
• Muscle biopsy- abnormal; evidence of denervation, muscle fiber necrosis, excessive NADH stain, inflammatory cell infiltration,
and inclusions immunoreactive to TDP-43
Question1. After reviewing the results of Dr. Li’s diagnostic workup, what is the patient’s formal diagnosis? As a group, use
resources from reliable sources (e.g., professional journals like Neurology, or reputable associations like ALS or National MS Society) to come to a consensus diagnosis supported by written evidence. Be prepared to discuss your opinion with the class and to hand in your written rationale.

NATIONAL CENTER FOR CASE STUDY TEACHING IN SCIENCE
Page 6“Seq’ing the Cure: Neuroscience Edition” by Miller, Robertson, & Srougi
Part IV – DiagnosisThe results pointed to a diagnosis of ALS. Dr. Li, however, adhered to standard practice and requested that Gael get a second opinion to diagnose ALS from an ALS association certified center or ALS clinic. The second opinion also came to the same conclusion. The patient was diagnosed with ALS. Given the patient’s family history, Dr. Li raised the pos-sibility of genetic testing.
QuestionsUse the resources listed at the bottom of this page or from other credible sources to answer the following questions.
1. Summarize core clinical features and diagnosis of human ALS.
2. Compare familial versus sporadic forms of ALS.
3. List and describe a few genes that are associated with ALS.
4. Write out the conversation that Dr. Li should have with the patient about (a) the genetics of ALS and (b) the pros and cons of genetic testing in ALS. What can genetic tests for ALS tell you? What can they not tell you?
5. Briefly discuss cellular processes that are disrupted in ALS.
Resources• What is ALS? [Webpage]. ALS Association. <https://www.als.org/understanding-als/what-is-als> • Inside ALS: the neurons behind the disease. [Video]. Run time: 3:28 min. Nature Reviews Disease Primers.
<https://www.nature.com/nrdp/animations/als-17>• What Causes ALS? | Research Revealed | TDP-43 [Video]. The Patani Lab. Run time: 3:56 min. <https://youtu.
be/cKbyIZXv7k8>• Renton, A.E., A. Chiò, and B.J. Traynor. 2014. State of play in amyotrophic lateral sclerosis genetics. Nature
Neuroscience 17: 17–23. <https://doi.org/10.1038/nn.3584>
NATIONAL CENTER FOR CASE STUDY TEACHING IN SCIENCE
Page 7“Seq’ing the Cure: Neuroscience Edition” by Miller, Robertson, & Srougi
Part V – Back in the Transcriptomics LabWith this dire diagnosis, Dr. Li was desperate to help her patient, as there is no known cure for ALS. The patient’s genetic testing revealed that he had a common form of the disease characterized by alterations in the C9ORF72 gene. In particular, this gene contains a massive expansion of a six-nucleotide sequence (GGGGCC) called a hexanucleotide repeat. These repeats are found in a significant proportion of patients with familial forms of ALS and frontotemporal dementia (FTD), ranging from 22.5 to 46% and 12 to 29.3% respectively. When these repeats occur in the C9ORF72 gene, an unusual translation event happens. This can result in dipeptide protein repeat (DPR) products that tend to aggregate and lead to neuronal cell death (cytotoxicity).
Time was of the essence, so Dr. Li quickly turned to her lab for help, exploiting their area of specialty: CRISPR. This advancement in genomic editing had enabled her lab to quickly and accurately knock out human genes in a high-throughput fashion. So far, her team had used what is called a CRISPR screen to identify genes that help human cells survive in the presence of these repetitive sequences (suppressors of toxicity), as well as genes that lead to increased cell death (enhancers of toxicity) (Kramer et al., 2018). After knocking out over twenty-thousand genes in human K562 cells, half of these cells were exposed to neurotoxins (e.g., DPRs) and half were left untreated as a negative control group. The synthetic repetitive sequences were used to mimic DPR in human ALS patients. Finally, the surviving cells were analyzed to see which genes that were knocked out provided protective or sensitizing effects to the DPR treat-ment. Given this large data set, they next looked for commonalities among the genes to help make sense of the biology. Dr. Li’s lab found many genes whose products were involved in how cells respond to intracellular stress, such as when protein aggregates are formed by DPRs. Perhaps this was the key to unlocking an effective therapy for the disease?
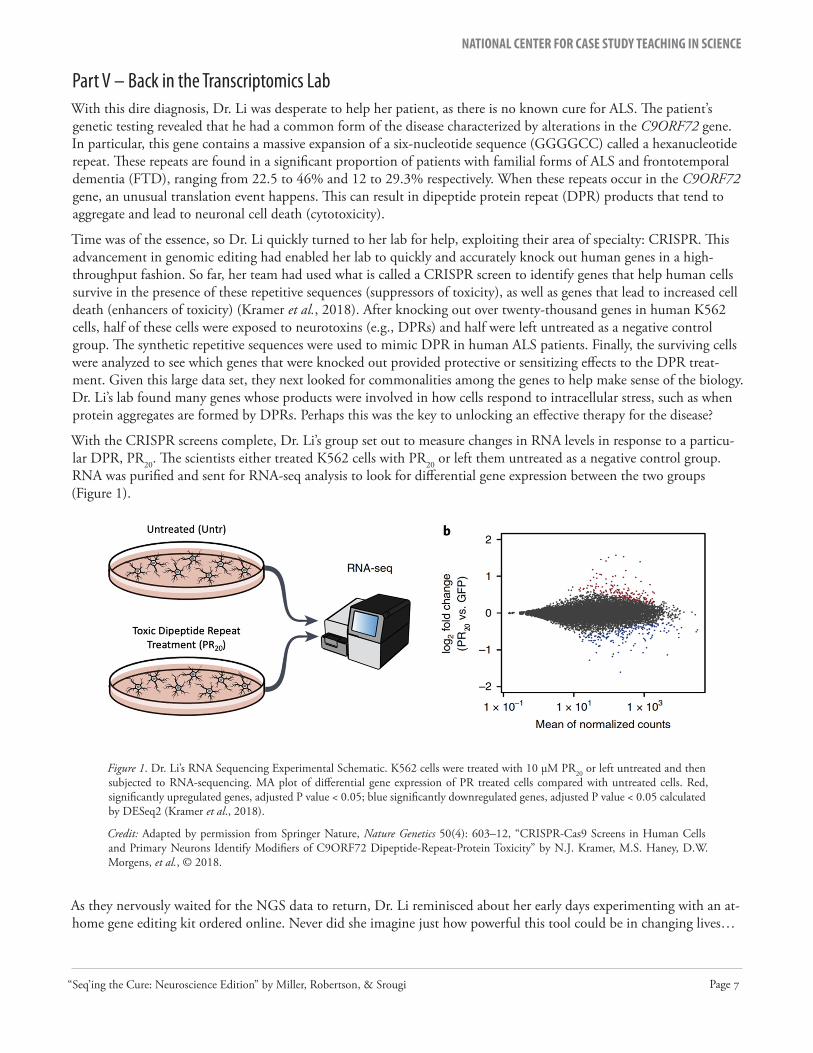
With the CRISPR screens complete, Dr. Li’s group set out to measure changes in RNA levels in response to a particu-lar DPR, PR20. The scientists either treated K562 cells with PR20 or left them untreated as a negative control group. RNA was purified and sent for RNA-seq analysis to look for differential gene expression between the two groups (Figure 1).
Figure 1. Dr. Li’s RNA Sequencing Experimental Schematic. K562 cells were treated with 10 µM PR20 or left untreated and then subjected to RNA-sequencing. MA plot of differential gene expression of PR treated cells compared with untreated cells. Red, significantly upregulated genes, adjusted P value < 0.05; blue significantly downregulated genes, adjusted P value < 0.05 calculated by DESeq2 (Kramer et al., 2018).
Credit: Adapted by permission from Springer Nature, Nature Genetics 50(4): 603–12, “CRISPR-Cas9 Screens in Human Cells and Primary Neurons Identify Modifiers of C9ORF72 Dipeptide-Repeat-Protein Toxicity” by N.J. Kramer, M.S. Haney, D.W. Morgens, et al., © 2018.
As they nervously waited for the NGS data to return, Dr. Li reminisced about her early days experimenting with an at-home gene editing kit ordered online. Never did she imagine just how powerful this tool could be in changing lives…
NATIONAL CENTER FOR CASE STUDY TEACHING IN SCIENCE
Page 8“Seq’ing the Cure: Neuroscience Edition” by Miller, Robertson, & Srougi
JUST IN: The results of the Li lab’s efforts have arrived, but the amount of differential gene expression (DGE) data is too great to interpret alone. They turn to their in-house transcriptomic experts (you) for help in deciphering their data. Will this be the next step in Seq’ing the Cure?!?
Tasks and Questions1. Open the Microsoft Excel file containing the RNA-seq data. Please note that the following instructions are
designed for using Microsoft Excel for Mac, Version 16.16.3. Your version of Excel may be different.
Be sure to save your Microsoft Excel sheet periodically during the data analysis procedure below. To do so, select “File,” then “Save As,” and rename the sheet as “RNAseqdata_[insert your last name].”
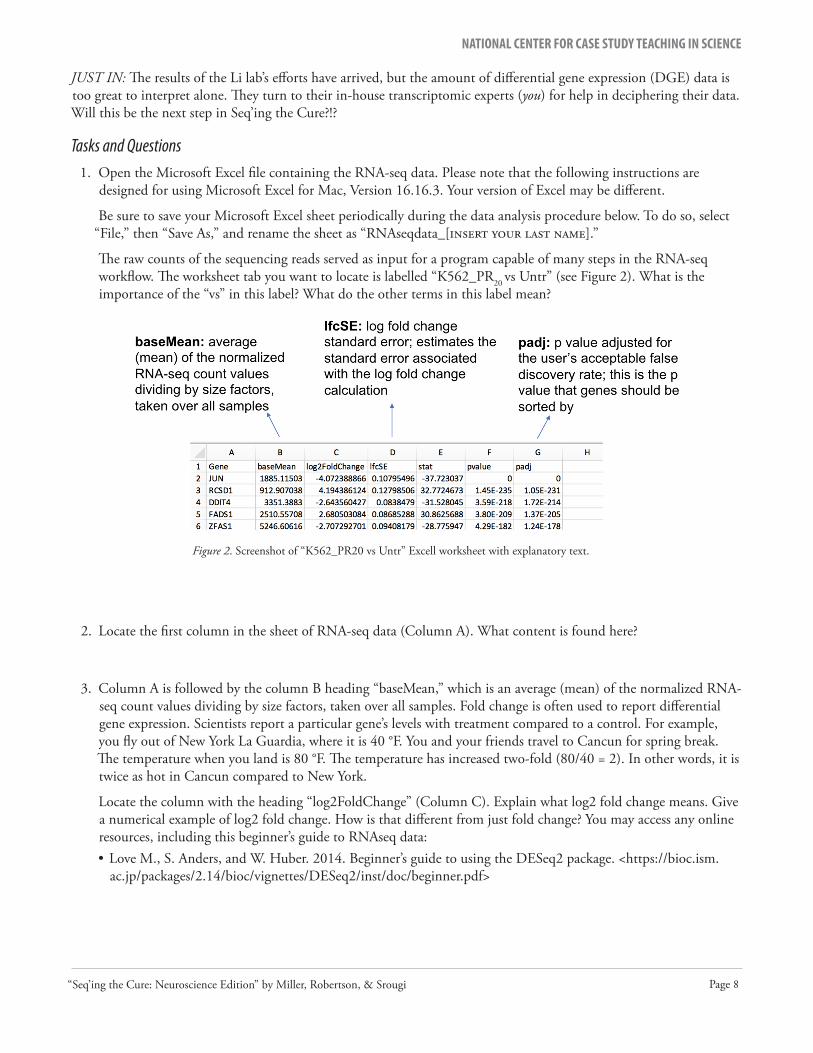
The raw counts of the sequencing reads served as input for a program capable of many steps in the RNA-seq workflow. The worksheet tab you want to locate is labelled “K562_PR20 vs Untr” (see Figure 2). What is the importance of the “vs” in this label? What do the other terms in this label mean?
Figure 2. Screenshot of “K562_PR20 vs Untr” Excell worksheet with explanatory text.
2. Locate the first column in the sheet of RNA-seq data (Column A). What content is found here?
3. Column A is followed by the column B heading “baseMean,” which is an average (mean) of the normalized RNA-seq count values dividing by size factors, taken over all samples. Fold change is often used to report differential gene expression. Scientists report a particular gene’s levels with treatment compared to a control. For example, you fly out of New York La Guardia, where it is 40 °F. You and your friends travel to Cancun for spring break. The temperature when you land is 80 °F. The temperature has increased two-fold (80/40 = 2). In other words, it is twice as hot in Cancun compared to New York.
Locate the column with the heading “log2FoldChange” (Column C). Explain what log2 fold change means. Give a numerical example of log2 fold change. How is that different from just fold change? You may access any online resources, including this beginner’s guide to RNAseq data: • Love M. , S. Anders, and W. Huber. 2014. Beginner’s guide to using the DESeq2 package. <https://bioc.ism.
ac.jp/packages/2.14/bioc/vignettes/DESeq2/inst/doc/beginner.pdf>

NATIONAL CENTER FOR CASE STUDY TEACHING IN SCIENCE
Page 9“Seq’ing the Cure: Neuroscience Edition” by Miller, Robertson, & Srougi
4. To gain a better understanding of the importance of these fold changes in the data, you will create a new column of log2 fold change. To do so:A. Select File→Insert→Column to the right of “log2 fold change.” B. Type “fold change” as the new column’s header. You can quickly transform all of the log2 fold changes into
basic fold changes. C. Enter the following formula in the empty cell for the top gene in the list by typing “=2^” and then click on
the cell that contains that gene’s log2 fold change value. D. Hit the enter key. You should see the result of your formula, which is the basic fold change observed.E. To apply that formula for all of the genes in the list, click on the cell, hover over the bottom right corner of
the cell until you see a black cross, then double-click to automatically apply that formula to the whole column. You should see calculated fold changes for every single gene.
Locate the column with the heading “lfcSE.” This stands for log fold change standard error. This value estimates the standard error associated with the log fold change calculation. It is important to report standard error due to the fact that the treated and untreated samples each consisted of biological triplicates (n = 3). Biological replicates are parallel measurements of distinct biological samples that are intended to identify random biological variation (i.e., three sets of treated cells versus three sets of untreated cells). Biological replicates are distinct from technical replicates, which are repeated measurements of a single sample to capture variability associated with the protocol or equipment.
The researchers used software to perform statistical tests on this differential gene expression data and generate p values. Locate the column with the heading “pvalue.” Explain what “pvalue” means. What does a large or small p value indicate? Explain fully.
5. When doing many comparisons, you have to consider that you will get some false positives. For example, p<0.05 will mean 1:20 will be a false positive. Not surprisingly, high-throughput (HT) methods are susceptible to both false positive and false negative results (i.e., false discoveries). Describe what a false positive and a false negative would be in this type of experiment.
6. Researchers using HT techniques must define how many false discoveries are acceptable in their experiments. Let’s say 10% of the genes are incorrectly identified as differentially expressed. The researcher determines this rate is acceptable, therefore we say the false discovery rate (FDR) is 10%. A p value can be adjusted to account for the FDR, thereby enriching for real changes in differential gene expression. If a 5% FDR is acceptable, then an adjusted p value (padj) of less than 0.05 is considered statistically significant. We will focus on adjusted p values to identify statistically significant differentially expressed genes.
To identify those genes with an adjusted p value of less than 0.05:

NATIONAL CENTER FOR CASE STUDY TEACHING IN SCIENCE
Page 10“Seq’ing the Cure: Neuroscience Edition” by Miller, Robertson, & Srougi
A. Locate the column labelled padj; notice the genes are already sorted in ascending order (low to high). B. Using the “find” function, identify the first row that contains the adjusted p value of 0.05. All the genes in the
list with adjusted p values <0.05 are the ones on which you will focus your analysis. Think of this as a subset of your original gene list.
C. Insert a new worksheet next to the one you are working on. D. Rename the worksheet tab “significant DGE.” E. Copy all of the cells containing data for genes with an adjusted p value < 0.05 (do not include values of 0.05
or greater) and paste it into your new “significant DGE” worksheet.
Without regard to upregulated vs. downregulated genes, how many statistically significant differentially expressed genes did you find?
7. Next, sort this DGE list based on log2 fold change. To do so, place the largest, positive log2 fold change values at the top:A. Highlight the entire log2 fold change column by clicking on the column header.B. Under the “home” tab at the top of the Excel window, select the “sort & filter” button.C. Choose “sort largest to smallest.”D. The sort warning window will pop up asking what you want to do. Choose to expand the selection. This
means that even though you are sorting based on one column, all of the other data in other columns will move with it accordingly.
E. Finally, click the “sort” button.
What is the value of the largest log2 fold change? What does that equal in terms of just fold change (reported to the hundredths place)? Which gene demonstrated this?
8. What is the value of the most negative log2 fold change? What does that equal in terms of just fold change (reported to the hundredths place)? Which gene demonstrated this? Explain why log2 fold changes in gene expression can be positive or negative, while fold changes always come out as positive numbers.
9. How many total genes were analyzed in this HT experiment? Hint: Consider which worksheet you should refer to. Find an empty cell and input “=COUNT” (select all cells you want to count) and then hit enter. You can also type in the range of cells instead of selecting them with the cursor.
10. Based on how many total genes were analyzed (answer from Question 9), what percentage showed DGE?
11. You may notice some genes have “NA” listed for log2 fold change. These genes had negligible read counts in this RNAseq experiment. What percentage of all the genes analyzed showed negligible read counts?
12. Is it always the case that fold changes that are high in magnitude will also be statistically significant? Explain your reasoning.
NATIONAL CENTER FOR CASE STUDY TEACHING IN SCIENCE
Page 11“Seq’ing the Cure: Neuroscience Edition” by Miller, Robertson, & Srougi
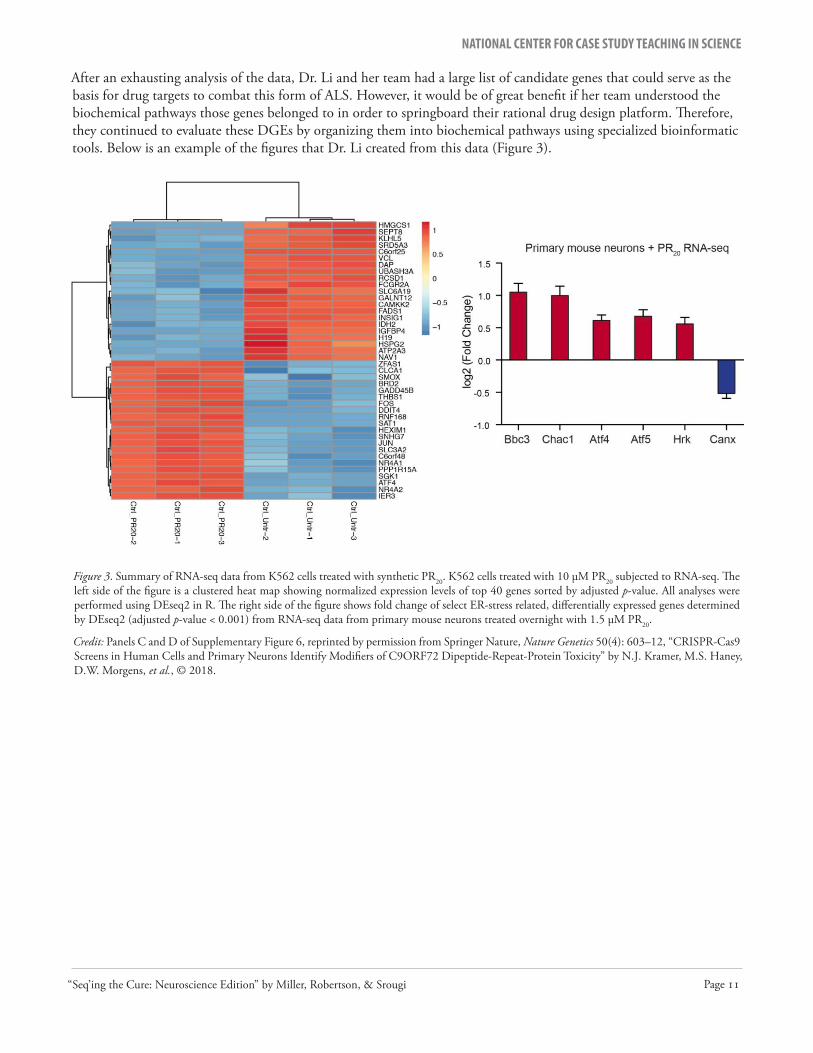
Figure 3. Summary of RNA-seq data from K562 cells treated with synthetic PR20. K562 cells treated with 10 µM PR20 subjected to RNA-seq. The left side of the figure is a clustered heat map showing normalized expression levels of top 40 genes sorted by adjusted p-value. All analyses were performed using DEseq2 in R. The right side of the figure shows fold change of select ER-stress related, differentially expressed genes determined by DEseq2 (adjusted p-value < 0.001) from RNA-seq data from primary mouse neurons treated overnight with 1.5 µM PR20.
Credit: Panels C and D of Supplementary Figure 6, reprinted by permission from Springer Nature, Nature Genetics 50(4): 603–12, “CRISPR-Cas9 Screens in Human Cells and Primary Neurons Identify Modifiers of C9ORF72 Dipeptide-Repeat-Protein Toxicity” by N.J. Kramer, M.S. Haney, D.W. Morgens, et al., © 2018.
After an exhausting analysis of the data, Dr. Li and her team had a large list of candidate genes that could serve as the basis for drug targets to combat this form of ALS. However, it would be of great benefit if her team understood the biochemical pathways those genes belonged to in order to springboard their rational drug design platform. Therefore, they continued to evaluate these DGEs by organizing them into biochemical pathways using specialized bioinformatic tools. Below is an example of the figures that Dr. Li created from this data (Figure 3).

NATIONAL CENTER FOR CASE STUDY TEACHING IN SCIENCE
Page 12“Seq’ing the Cure: Neuroscience Edition” by Miller, Robertson, & Srougi
Part VI – Bioinformatic Analysis of RNA-seq DataWhen scientists are faced with analyzing high-throughput data like Dr. Li’s RNA-seq data set, they must look for com-monalities and patterns to help make sense of it. There are many identified pathways that go awry in ALS. In order for Dr. Li and her team to determine if any cellular locations or processes are enriched with genes that came up in their hit list after treatment with the toxic dipeptide protein repeat, they turned to online bioinformatic tools.
Go back to the Excel worksheet generated from Part V above and locate the hits that showed an adjusted p value of less than 0.05 (labelled “significant”).
You must also determine a cut-off value for what makes a gene upregulated. In other words, how big of a change is considered a change? Copy the gene names only of all the significantly upregulated genes that have a fold change of 2.0 fold or more upon PR20 treatment.
Visit the following website to perform your bioinformatic analyses: • Analysis Wizard. DAVID Bioinformatics Resources 6.8, NIAID/NIH. <https://david.ncifcrf.gov/tools.jsp>
Click on “start analysis” at the top. You will enter gene names and adjust settings using the menu panel on the left. Make sure the “upload” tab is selected. You should see “step 1: enter gene list.” Paste the copied gene names into that window.
Further down on the left, you will see “step 2: select identifier.” Choose “official_gene_symbol” from the drop down list. That tells the program the format of the gene names you just pasted.
For “step 3: list type,” choose “gene list.” You just pasted a list of genes you are interested in analyzing because they showed DGE. Their identities may have something in common, so you are looking for that commonality. They do not represent “background” genes, where one would not expect to find any patterns or commonalities, except by chance.
For “step 4: submit list,” click the “submit” button. It will take a few seconds to a few minutes to analyze. A progress bar is shown at the top of the screen.
A screen will appear that says step 1 analysis was successful. The program may have also notified you that genes from multiple species were found, but you know that they were all human genes. To further adjust your settings, visit the panel on the left again. Now, the “list” tab should be selected.
Choose “homo sapien” and click “select species.”
Next, click the “background” tab on the left panel. This is where you can choose a background list of genes to com-pare to. Remember that the goal of this bioinformatic analysis is to determine if any processes or cellular location are enriched in genes that showed DGE. So, those genes must be compared to a separate list in order to apply statistics. In other words, were the genes that showed DGE enriched in any particular process more than would be expected due to chance alone? In the “select a background” window, choose “homo sapien” and click the “use” button.
Finally, you can progress to Step 2, which is displayed in the middle of the screen. You can choose one of many tools that the site has available. Click “functional annotation tool.” Then click “Gene_Ontology.” Several options under gene ontology (GO) are already selected as a default, so uncheck the “check defaults” check box at the top middle of the screen. That will remove the checks, and you can go in and select “GO term_CC_direct.” Click the chart button next to this term to reveal the data.
Much like the RNA-seq data, a table will display that contains a large amount of information. At the top of the table, click the “options” link and click to display “fold enrichment” then click the “rerun using options” button. Now you should see fold enrichment in addition to number of genes in each GO category and p values. Similar to using Excel, you can sort the data by a particular column. To do this, simply click on the header of the column you want to sort by first, sort by p value.

NATIONAL CENTER FOR CASE STUDY TEACHING IN SCIENCE
Page 13“Seq’ing the Cure: Neuroscience Edition” by Miller, Robertson, & Srougi
Tasks and Questions1. What do the most significantly enriched GO categories have in common? (You can click on any term to learn
more about it).
2. Which GO category showed the highest fold enrichment?
3. The lowest p value?
4. The largest number of genes?
Go back to the original DAVID window. Your list and settings should still remain in effect. Choose the “pathway” tool and check the “KEGG_PATHWAY” as the only option. You can click on any pathway’s name to visualize your genes mapped to that biochemical pathway. Try sorting the pathways by fold enrichment like in Step 1 above by choosing the option to display “fold enrichment.” Identify the pathway that has the highest fold enrichment in genes from your gene list. Click on that pathway’s name to reveal the map. Take a screenshot after letting it load and be sure to check the “stop blinking” box! You may need to zoom in or out on your internet browser to better visualize the genes (com-mand + / command -).
5. Provide the screen-shot to your instructor.
6. Where in the cell does this pathway occur? (Hint: you will want to use web resources to answer this question.)
7. Is the pathway analysis consistent with the GO category analysis?
8. In order to enrich for true positives, high-throughput results are usually accompanied by validation with a complementary technique. Name one validation technique that Dr. Li’s team could try.
9. Based on your results, what would you recommend to Dr. Li as her next course of action? How could she and her team utilize this data in treating her ALS patient?
For further reading, refer to the Kramer et al. (2018) paper.

NATIONAL CENTER FOR CASE STUDY TEACHING IN SCIENCE
Page 14“Seq’ing the Cure: Neuroscience Edition” by Miller, Robertson, & Srougi
ReferencesHuang, D.W., B.T. Sherman, and R.A. Lempicki. 2009(a). Systematic and integrative analysis of large gene lists using
DAVID bioinformatics resources. Nature Protocols 4(1): 44–57. <https://doi.org/10.1038/nprot.2008.211>Huang, D.W., B.T. Sherman, and R.A. Lempicki. 2009(b). Bioinformatics enrichment tools: paths toward
the comprehensive functional analysis of large gene lists. Nucleic Acids Research 37(1): 1–13. <https://doi.org/10.1093/nar/gkn923>.
Kramer, N.J., M.S. Haney, D.W. Morgens, et al. 2018. CRISPR-Cas9 screens in human cells and primary neurons identify modifiers of C9ORF72 dipeptide-repeat-protein toxicity. Nature Genetics 50(4): 603–12. <https://doi.org/10.1038/s41588-018-0070-7>
Renton, A.E., A. Chiò, and B.J. Traynor. 2014. State of play in amyotrophic lateral sclerosis genetics. Nature Neuroscience 17: 17–23. <https://doi.org/10.1038/nn.3584>
Taylor, J.P., R.H. Brown Jr., and D.W. Cleveland. 2016. Decoding ALS: from genes to mechanism. Nature 539(7628): 197–206. <https://doi.org/10.1038/nature20413>