septic system drain field investigation woodlawn … · the drain field do not pose a source of...
TRANSCRIPT

An Addendum to the Phase IV - AdditionalField Work Detailed Work Plan for
the Remedial Investigation/Feasibility StudyWoodlawn Landfill
Cecil County, Maryland
Septic System Drain Field InvestigationWoodlawn Transfer Station
Cecil County, Maryland
11 April 1991Revised
11 March 1992
Submitted To:
U.S. Environmental Protection AgencyRegion III
Philadelphia, Pennsylvania
Prepared. For:
Cecil County Department of Public WorksCecil County, Maryland
Prepared By:
Environmental Resources Management, Inc.Annapolis, Maryland
File: C64-01-00-01
flR305H6

TABLE OF CONTENTS
PageExecutive Summary i
Section 1 - Introduction . 1-11.1 Background 1-11.2 Site History 1-31.3 Purpose and Objectives 1-41.4 Technical Approach 1-7
1.4.1 Work Plan Addendum 1 Technical Approach 1-71.4.2 Work Plan Addendum 2 Technical Approach 1-7
1.5 Report Organization 1-8
Section 2 - Field Investigations 2-12.1 Review of Existing Data 2-1
2.1.1 Transfer Station Operations 2-12.1.2 Septic System Design and Modification 2-22.1.3 Septic System Use and Maintenance 2-3
2.2 Soil Sampling 2-42.2.1 Sampling Methods 2-52.2.2 Surface Sampling 2-82.2.3 Field Screening 2-82.2.4 Selection of Samples for Analysis 2-9
2.3 Ground Water Sampling 2-112.3.1 Monitoring Well Installation 2-112.3.2 Sampling Methods 2-12
2.4 Soil Boring and WeU Survey 2-13
Section 3 - Results of Field Investigation 3-13.1 Soil Characteristics of Original Drain Field 3-13.2 Analytical Results for Soil Samples 3-2
3.2.1 Sample Analyses ' 3-23.2.2 Data Validation 3-23.2.3 Results for Organic Analyses of Soils 3-33.2.4 Results for Inorganic Analyses of Soils 3-4
3.3 Analytical Results for Ground Water Samples 3-53.3.1 Sample Analyses 3-53.3.2 Data Validation 3-53.3.3 Results for Organic Analyses of Ground Water 3-63.3.4 Results for Inorganic Analyses of Ground 3-7
Water3.4 Ground Water Flow 3-7
Section 4 - Discussion of Results 4-14.1 Soils 4-14.2 Ground Water 4-3
Tht——
Group

TABLE OF CONTENTS(Continued)
Page
Section 5 - Summers Modeling Results 5-15.1 Methods . 5-1
5.1.1 Linear Partitioning Model 5-15.1.2 Dilution 5-25.1.3 Acceptable Groundwater Concentrations 5-4
5.2 Data 5-55.2.1 Total Organic Carbon 5-55.2.2 KOC. K. and Sources 5-55.2.3 Hydrology 5-6
5.3 Modeling Results 5-65.3.1 Concerns . 5-65.3.2 Results 5-7
Section 6 - Conclusions and Recommendations 6-16.1 Conclusions 6-16.2 Recommendations 6-2
References
Appendix A - USEPA Letter 30 May 1991
Appendix B - Material Safety Data Sheets for Cleaning Compounds Usedat the Woodlawn Transfer Station
Appendix C- Drilling Logs
Appendix D - Quality Assurance Reports
AR3Q5H8Group

List of Figures
FollowingPage
Figure 1-1 Location Map, Woodlawn Landfill, Cecil 1-1County, Maryland
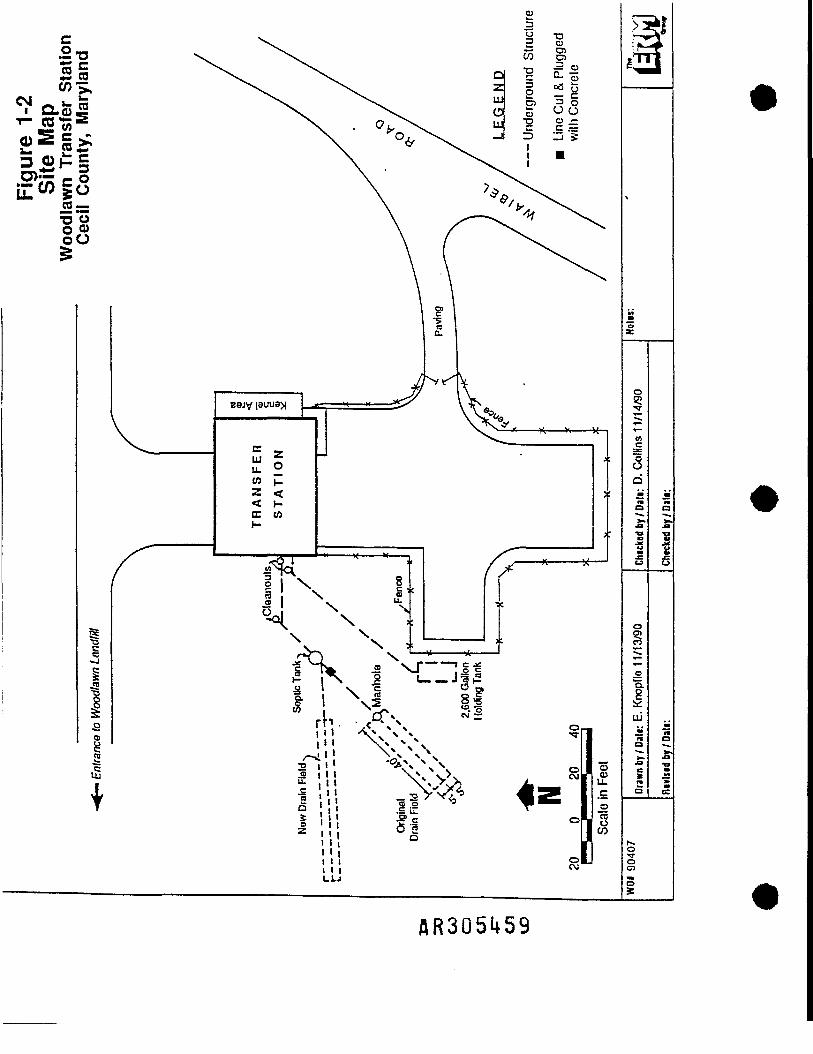
Figure 1-2 Site Map, Woodlawn Transfer Station, 1-5Cecil County, Maryland
Figure 2-1 Septic System Layout, Woodlawn Transfer 2-2Station, Cecil County, Maryland
Figure 3-1 Cross-Section of Original Drain Field Based on 3-1Soil Borings, Woodlawn Transfer Station,Cecil County, Maryland
Figure 3-2 Ground Water Elevation Contour Map, Woodlawn 3-7Transfer Station, Cecil County, Maryland
AR305H9Group

List of Tables
FollowingPage
Table 2-1 Summary of Soil Samples Selected for 2-7Chemical Analyses, Woodlawn Transfer Station
Table 2-2 Soil Sample OVA-PID Headspace Measurements, 2-9Woodlawn Transfer Station
Table 2-3 Results of ERM-FAST Field Screening, 2-9Woodlawn Transfer Station
Table 2-4 Summary of Survey Data for Soil Borings and 2-13Monitoring Well TSW-1, Woodlawn Transfer Station
Table 3-1 Laboratory Organic Analytical Results, Woodlawn 3-3Transfer Station
Table 3-2 Laboratory Inorganic Analytical Results, Woodlawn 3-4Transfer Station
Table 3-3 Summary of Organic and Inorganic Analyses of 3-6Ground Water Samples from Well TSW-1,Woodlawn Transfer Station
Table 3-4 Summary of Ground Water Elevations in the 3-7Vicinity of the Septic System Original Drain Field27 March 1991, Woodlawn Transfer Station
Table 4-1 Comparison of Analytical Results for Septic Tank 4-1Sample and Soils from the Original Drain Field,Woodlawn Transfer Station
Table 4-1 Comparison of Metal Concentrations in Soils from 4-2the Original Drain Field with ObservedConcentrations in Eastern U.S. Soils
Table 4-3 Comparison of Chemical Analyses for Well TSW-1 4-5and Wells F-l, F-2, F-3, F-5, F-6, and F-7,Woodlawn Transfer Station
Table 5-1 Summers Model Parameters, Woodlawn Transfer 5-5Station
Table 5-2 Results of Summers Model, Woodlawn Transfer 5-6Station
Group
flR305if50
EXECUTIVE SUMMARY
A Remedial Investigation/Feasibility Study (RI/FS) is currently beingconducted at the Woodlawn Landfill in Cecil County, Maryland in accordancewith a Consent Order entered into on 28 December 1988 betweenBridgestone/Firestone, Inc., Cecil County, Maryland, and the United StatesEnvironmental Protection Agency (USEPA). During the RI/FS, the septicsystem for the Woodlawn Transfer Station, which is located on theWoodlawn Landfill property, was identified as a potential source area.USEPA required that an investigation of the septic system be conducted, aspart of the RI/FS, to determine the nature and extent of potential soil andground water contamination due to the discharge of liquids from the septicsystem.Environmental Resources Management, Inc. (ERM) was retained to conductthe investigation of the septic system on behalf of Cecil County. Theinvestigation consisted of two parts: Work Addendum One addressed thesoils below the drain field; Work Plan Addendum 2 addressed surface soilsand soils above and/or within the drain field backfill. ERM prepared detailedwork plans to conduct the investigation. The work plans were reviewed andapproved by USEPA and Maryland Department of the Environment. Resultsof chemical analyses performed on soil and ground water samples were usedto evaluate the nature and extent of contamination attributable to the septicsystem. In addition, at the request of the USEPA soil chemical analyseswere used with the Summers Model to evaluate the likelihood andmagnitude of potential impacts that the drain field soils could have on theunderlying ground water quality.Data collected during the septic system investigation indicate the following:• soils above and/or within the drain field were found to be
contaminated with trace levels of VOCs, semivolatiles, and pesticides.The contamination was limited in extent and magnitude, and foundnot to extend below the drain field backfill.
• soils beneath the original drain field for the septic system are notcontaminated with hazardous constituents;
• the Summers Model results show that the soils above and/or withinthe drain field do not pose a source of ground water contamination.Furthermore, the analytical results for the soil below the drain fieldcoupled with the Summers Model results show that the drain field isnot a source of ground water contamination.
• ground water in the saturated soil zone beneath the original drain fieldcontains measurable concentrations of volatile and semivolatile organiccompounds, but these compounds cannot be attributed to discharges
Group
flR305l*5l

from the septic system since they were not observed in soils thatreceived discharges from the drain field;
• several of the contaminants observed in ground water from the septicsystem monitoring well have been observed in monitoring wellsthroughout the Woodlawn Landfill; and
• the septic system is hydraulically downgradient of source areas in theWoodlawn Landfill, with cells B and C, where Firestone disposed ofpolyvinyl chloride sludges, being the potential source area closest tothe septic system.
The results of the investigation of the Woodlawn Transfer Station septicsystem clearly indicate that the septic system is not a source area.Subsequently, no further investigation of the septic system is necessary andremediation will not be required.
ii ——— »—Gr5op
fiR305l*52

SECTION ONEINTRODUCTION
1.1 BackgroundA Remedial Investigation/Feasibility Study (RI/FS) is currently beingconducted at the Woodlawn Landfill near Woodlawn, Cecil County, Maryland(Figure 1-1) in accordance with a Consent Order entered into on 28December 1988 between Bridgestone/Firestone, Inc. (Firestone), CecilCounty, Maryland, and the United States Environmental Protection Agency(USEPA). The USEPA is the lead regulatory agency providing oversight forthe RI/FS. The Maryland Department of the Environment (MDE) Hazardousand Solid Waste Administration is also participating in regulatory oversightof the Woodlawn Landfill RI/FS.The RI/FS is being conducted by International Technology Corporation (ITCorp.) on behalf of Firestone and Cecil County. In general, the purpose ofthe RI/FS is two-fold:• to characterize on-site and off-site contamination of soils and ground
water resulting from past disposal operations at the landfill, includingthe disposal of polyvinyl chloride sludges throughout the site byFirestone; and
• to present suitable remedial alternatives for site remediationconsistent with the requirements of the ComprehensiveEnvironmental Response, Compensation, and Liability Act (CERCLA),as amended by the Superfund Amendments and Reauthorization Act(SARA) of 1986.
In 1988, IT Corp. began the phased RI/FS at the Woodlawn Landfill site.The remedial investigation portion of the RI/FS, which was presented by ITCorp. in a document titled Scope of Work, Remedial Investigation/FeasibilityStudy, Woodlawn Landfill, Cecil County, Maryland, dated 2 November 1988(Revision 01), has been organized into the following phases:• Phase I - Preliminary Investigations,• Phase II - Site Characterization,• Phase III - Ground Water Evaluation, and
Phase IV - Additional Field Work.Phases I and II have been completed, and Phase III is currently beingimplemented.
Th
1" 1 ——— —orSip
flR305«453

Figure 1-1Location Map
Woodlawn Landfill, Cecil County, Maryland
APPROXIMATE SZE ANDLOCAJTOW-OF CEOJ A |2
I
Source: Adapted from Figure 3 - Site Base Map prepared by ITCorporation and presented in Detailed Work Plan lor Phase III •Ground Water Evaluation Remedial Investigation/Feasibility StudyWoodlawn Landfill, Cecil County, Maryland, June 1990.
WO* 90407 Drawn by/Date: E. Knopfle 11/ia'90
Revised by/Dale: £• Knopfle 4/3/91
Checked by / Dale: D. Coliins 11/14/90
CheckeflbY/Dale: P-Collins 4/4/91

The Woodlawn Transfer Station (Transfer Station), which began operation in1977, is operated by Cecil County. In 1990, the Transfer Station septicsystem was identified by IT Corp. during Phase II of the RI/FS as a newsource area with potential for releasing contaminants into the environmentat the landfill site. Since the Transfer Station is located within theboundaries of the Woodlawn Landfill, USEPA determined that theinvestigation of the Transfer Station septic system must be conducted inconjunction with the Woodlawn Landfill RI/FS, specifically as part of PhaseIV activities. Subsequently, USEPA instructed Cecil County to conduct asoils investigation of the original drain field for the septic system of theTransfer Station. In August 1990, Cecil County retained EnvironmentalResources Management, Inc. (ERM) to conduct the soils investigation of theTransfer Station septic system as a task under Phase IV of the RI/FS.In December 1990, ERM prepared a scope of work to complete the soilsinvestigation as required by USEPA. The approved scope of work for thesoils investigation was presented as an addendum to the Phase IV DetailedWork Plan titled Phase IV - Additional Field Work, RemedialInvestigation/Feasibility Study, Woodlawn Landfill, Cecil County, Maryland,dated 5 September 1989 and revised 30 November 1989, which wasprepared by IT Corp. The addendum to the IT Corp. Phase IV work planwas prepared by ERM and included the following documents:• Work Plan Addendum, Soils Investigation, Woodlawn Transfer Station,
Cecil County, Maryland: An Addendum to the Phase TV - AdditionalField Work Detailed Work Plan for the Woodlawn Landfill Cecil County,Maryland, dated 21 December 1990 (referred to herein as Work PlanAddendum 1),
• Quality Assurance Project Plan Addendum to the IT CorporationQuality Assurance Project Plan for the Woodlawn Land/ill RI/FS, dated21 November 1990 (QAPP Addendum); and
• Health and Safety Plan Addendum to the IT Corporation Health andSafety Plan for the Woodlawn Landfill Cecil County, Maryland, Revision05, dated 30 November 1989 (Health and Safety Plan Addendum).
The work plan documents were initially submitted to USEPA in October1990 as an addendum to the USEPA/MDE-approved RI/FS Phase IV workplan that was originally submitted by IT Corp. Final USEPA/MDE approvalfor the 21 December 1990 ERM Work Plan Addendum 1 and relateddocuments was received in January 1991 after revisions were made toaddress USEPA and MDE comments.In April 1991 on behalf of Cecil County, ERM presented the results of theWork Plan Addendum 1 to the USEPA in a report titled Septic System Drain
Th.——
flR3051*55
Field Investigation Woodlawn Transfer Station, Cecil County: An Addendumto the Phase IV - Additional Field Work Detailed Work Plan for the RemedialInvestigation/ Feasibility Study Woodlawn Landfill Cecil County, Maryland,dated 11 April 1991. The April 1991 report- summarized the methods andresults of the soils investigation of the original drain field for the TransferStation septic system. Submission of the report completed the scope ofwork for the Transfer Station investigation as described in the USEPA/MDE-approved Work Plan Addendum 1.The USEPA provided comments to the April 1991 report by letter dated 30May 1991 (Appendix A). During a meeting on 24 July 1991 amongrepresentatives from the USEPA, MDE, Cecil County, ERM, Firestone, andIT Corp., the USEPA requested additional investigation of the TransferStation septic system. In response, on behalf of Cecil County ERMsubmitted to the USEPA Work Plan Addendum No. 2, Septic SystemInvestigation, Woodlawn Transfer Station, Cecil County, Maryland: AnAddendum to the Phase IV - Additional Field Work Detailed Work Plan forthe Woodlawn Landfill, Cecil County, Maryland, dated 8 November 1991(Work Plan Addendum 2). Supplements to the QAPP and Health and SafetyAddenda were incorporated into Work Plan Addendum 2. In December1991, ERM completed the work scope of Work Plan Addendum 2.ERM has prepared this report as a comprehensive document that presentsthe results from Work Plan Addendum 1 and Work Plan Addendum 2.Where appropriate, responses to USEPA comments of 30 May 1991 arepresented; the responses are identified by brackets.
1.2 Site HistoryThe Woodlawn Landfill, which is owned by Cecil County, was operated by thecounty as a municipal landfill from the 1960s through the early 1980s. Priorto purchase of the property by Cecil County in 1960, the site of the landfillwas a sand and gravel pit (Resource Applications, Inc. 1988). Municipalsolid wastes were disposed in the landfill from the 1960s until 1978 whenthe landfill reached capacity. During the 1970s, polyvinyl chloride sludgegenerated by Firestone was also disposed, throughout the landfill along withmunicipal wastes (Resource Applications, Inc. 1988). After the landfillceased disposal of municipal wastes, Firestone continued to dispose ofpolyvinyl chloride sludge in three specific locations identified as cells A, B,and C (Figure 1-1) from 1978 until 1981. Firestone' s disposal of polyvinylchloride sludge ceased in 1981.The Transfer Station, which is located in the northeast part of the landfillsite (Figure 1-1), began operating in 1977, and has continued to operate

since waste disposal activities at the landfill ceased. The Transfer Stationcompacts municipal solid waste for loading and shipment to another countylandfill. Prior to May 1990, liquids from the compaction of solid wasteswere originally collected and discharged through a floor drain into a septicsystem located southwest of the Transfer Station. The septic system andoriginal drain field are located approximately 100 - 125 feet east of formerlandfill cells B and C (Figure 1-1). The septic system also received sanitarywastes from bathrooms, floor drains, and a dog pound at the TransferStation.According to the Phase II report (IT Corp., 1990), ground water occursbeneath the landfill in perched zones, saturated soils, and a bedrock aquifer.Quantitative analyses of ground water samples collected from monitoringwells throughout the site by IT Corp. during Phase II of the RI/FS indicatethe presence of volatile organic compounds (VOCs), semi-volatile organiccompounds, metals, and pesticides. In the early and mid-1980s, siteinvestigations conducted by USEPA and MDE's predecessor agency, theMaryland Department of Health and Mental Hygiene, identified the presenceof organic compounds (i.e., vinyl chloride and benzene) and heavy metals(i.e., arsenic and chromium) in ground water samples collected frommonitoring wells at the site. The presence of vinyl chloride and benzene inground water are of particular concern since these compounds are classifiedas carcinogens and ground water is used as a source of drinking water in thevicinity of the landfill.During Phase II field activities, liquid was observed discharging onto theground surface from the manhole connected to the piping leading from theTransfer Station. This observed discharge raised concerns about thepotential degradation of soil and ground water in the vicinity of the TransferStation by liquid wastes disposed to the septic system and dischargedthrough the drain field. Subsequently, a sample of the liquid from the septictank was collected and analyzed by IT Corp. in February 1990. Analyticalresults for the septic tank sample analyses indicated the presence of VOCs,semivolatile organic compounds, and numerous metals. Vinyl chloride, acontaminant of concern from source areas within the adjacent landfill, wasnot detected in the sample from the septic tank.[Response to USEPA comments: (1) The manhole at the head of the drainfield is where the overflow occurred. No cleanouts were reported to haveoverflowed. (2) Presumably blockages occurred in the drain field since theoverflows occurred at the manhole at the head of the drain field.]The septic system was modified in May 1990 to prevent further dischargesof septic wastes through the original drain field. The original drain field wasdisconnected from the septic tank and the line between the tank and
1-4

original drain field was plugged with concrete (Figure 1-2). A new drainfield was installed directly to the west of the septic tank, and liquid wastesdisposed through the septic system have been limited to only sanitarywastes from the Transfer Station since the system was modified. A 2,600gallon underground holding tank was also installed at the Transfer Station tocollect liquids resulting from trash compaction at the facility. All liquidscollected from the compactor now flow directly into the holding tank andare periodically removed from the tank and transported to the Seneca PointWastewater Treatment Plant.[Response to USEPA comment: There is no evidence to suggest that a leakor overflow from the septic system components occurred upgradient of thedrain field. There have not been any water backups from drains in theTransfer Station.]
1.3 Purpose and ObjectivesThe purpose of the soils investigation described in Work Plan Addendum 1was to determine whether hazardous constituents were released to theenvironment from discharges of the original drain field of the TransferStation septic system. The Work Plan Addendum 1 investigation was theinitial effort to characterize the nature and extent of contaminantsassociated with the former use of the original drain field for the septicsystem. As such, Work plan Addendum 1 targeted the soils beneath thedrain field. The specific objectives for Work Plan Addendum 1 are bulletedbelow:• Work Plan Addendum 1 Objectives:
• collect and review available information to evaluate the design,construction and use of the septic system prior to modificationscompleted in May 1990;
• collect site-specific data to define the physical and chemicalcharacteristics of unsaturated soils in the vicinity of the original drainfield, including laboratory analyses of soil samples to identify the typesand concentrations of hazardous constituents, if any, present in thesoils potentially affected by discharges from the original drain field;
• based on data collected during the soils investigation, assess theextent of contamination, if any, from the Transfer Station septicsystem that may have affected soil and ground water quality;
• determine the need for additional investigation, if necessary, tofurther characterize the magnitude of soil and ground water
Th«
I'D
o <uoO
I ! \i IfLU
n_c
1d

contamination as a result of past septic system discharges via theoriginal drain field; and
• recommend a scope of work to conduct any additional investigationthat may be required.
During the course of implementing Work Plan Addendum 1, a decision wasmade to install a ground water monitoring well adjacent to the original drainfield. The well was installed to obtain a representative ground water sampleand to determine the ground water elevation below the original drain field.The purpose of Work Plan Addendum 2 was to obtain additional data forevaluating whether the septic system may have been a potential source ofcontaminants identified in ground water in the vicinity of the TransferStation, and to evaluate risks to potential receptors from direct contact withsurficial soils that may have been contaminated by septic system liquids thatoverflowed the manhole. As such, Work Plan Addendum 2 targeted thesurficial soils and soils above and within the drain field backfill material.The specific objectives for Work Plan Addendum 2 are bulleted below:• Work Plan Addendum 2 Objectives:
• collect additional site-specific chemical data for use in the RI/FS riskassessment to evaluate risks posed to potential receptors bycontamination, if any, present in surficial soils in the immediatevicinity of the septic system;
• evaluate using an empirical partitioning method (i.e the SummersModel) the potential for contaminants discharged from the septicsystem by the drain field to contaminate ground water; and
• determine through the Summers Model whether concentrations ofspecific chemical compounds detected in ground water in the vicinityof the septic system could have resulted from concentrations of thosecompounds observed in soils.
With the approval of the USEPA leak testing of the septic system lines andthe collection of a ground water sample from the ground water monitoringwell installed as part of Work Plan Addendum 1 were deleted from WorkPlan Addendum 2 and are not discussed further. The RI/FS risk assessmentis being performed by IT Corp. and is not submitted as part of this report.The validated data collected under Work Plan Addendum 2 was submitted tothe USEPA on 5 February 1992 in advance of this report. The USEPArequested this submission so that the data could be sent to IT Corp. forinclusion in the RI/FS Risk Assessment.
Tbt
AR305l*60
1.4 Technical Approach
1.4.1 Work Plan Addendum 1 Technical ApproachThe technical approach for Work Plan Addendum 1 was based on theassumption that in the event unsaturated soils in the original drain fieldwere contaminated, remediation of contaminated soils in the drain fieldcould be addressed independently from remediation of the landfill. It wasanticipated that the extent of any soil contamination associated with septicsystem discharges is relatively limited in area and confined to theimmediate vicinity of the Transfer Station. Furthermore, based on theresults of the Phase II RI/FS, the original drain field represents a smallsource area in comparison with the source areas within the adjacent landfillthat appear to have degraded ground water quality in the soil and bedrockaquifers beneath the landfill property. Subsequently, it was reasonable toaddress potential contamination within the drain field separately from theproblems within the adjacent landfill. This approach allowed for a moretimely investigation of the potential source area associated with theoperation of the Transfer Station.The technical approach for investigating the Transfer Station septic systemconsisted of an investigation to define the nature and extent ofcontamination associated with past discharges from the Transfer Stationseptic system. In general, the investigation of the Transfer Station septicsystem consisted of collection and chemical analyses of ten soil samplesfrom five soil borings located in and adjacent to the original drain field. Oneof the soil borings was completed as a ground water monitoring well to allowcollection of a representative ground water sample in the vicinity of theseptic system. Available information on the design and use of the septicsystem was also obtained and evaluated prior to completing the soil boringprogram. Analytical data from the soil samples provided informationnecessary to determine the need for additional investigation of soils andground water in the vicinity of the Transfer Station. Soil samples wereanalyzed for USEPA Target Compound List (TCL) and Target Analyte List(TAL) constituents using Contract Laboratory Program (CLP) protocols toidentify the presence of hazardous constituents.
1.4.2 Work Plan Addendum 2 Technical ApproachThe technical approach for completing the additional investigation of theTransfer Station septic system as described in Work Plan Addendum 2 wasagreed upon at the 24 July 1991 meeting among representatives of USEPA,MDE, Cecil County, ERM, Firestone, and IT Corp. The technical approachconsisted of the following components:
" '

• the collection of surficial soil samples for chemical analyses to providedata for the RI/FS risk assessment to be completed by IT Corp.;
• the collection and chemical analyses of soil samples above and/or withinthe drain field backfill to provide data for evaluating the potential forchemical compounds observed in soils to migrate through theunsaturated zone soils and contaminate ground water immediatelydowngradient of the septic system. The soil samples were collected inthe area suspected as potentially the most contaminated and thereforerepresents a "worst-case" source form the drain field to the groundwater.
Surficial soil samples were collected near the manhole at the head of thedrain field and down slope from the manhole. Subsurface samples werealso collected from the drain field backfill material to characterizecontaminant concentrations in the original drain field. The soil sampleswere submitted for chemical analyses of USEPA Target Compound List (TCL)and Target Analyte List (TAL) constituents using Contract LaboratoryProgram (CLP) protocols.The results of chemical analyses of soil samples collected from the originaldrain field backfill were used to determine the relationship betweenconcentrations of chemical constituents of concern in the drain field soilsand concentrations of those constituents in ground water immediatelydowngradient of the original drain field. Evaluation of this relationship wasaccomplished using the Summers et al. (1980) approach (the SummersModel), No attempt is made to model current conditions or to explain thepast and current transient movement of chemicals through the physicalsystem. The Summers Model is extremely conservative, combining linearpartitioning models and mass balance calculations to evaluate ground watercontamination from the leaching of chemical compounds in overlying soils.Consequently, the Summers model is likely to overestimate potentialimpacts.
1.5 Report OrganizationThe remainder of this report is organized into four sections as follows:• Section Two - Field Investigation;• Section Three - Results of Field Investigation;• Section Four - Discussion of Results;• Section Five - Summers Model Results;
1-8 —— v—- —^ Qfoup
flR305l»62

• Section Six - Conclusions and Recommendations.Section Two briefly describes the methods used during field activitiesassociated with the investigation of the Transfer Station septic system.Section Three presents the results of the field investigation. Section Fourdiscusses the data obtained during the field investigation. Section Fivepresents the methods and results of the Summer Model using theinformation generated during implementation of Work Plan Addendum 2.Section Six summarizes the conclusions and recommendations based on thedata collected during the Work Plan Addenda 1 and 2.
SECTION TWOFIELD INVESTIGATIONS
2.1 Review of Existing DataAvailable data on the design, maintenance and use of the septic system wasreviewed. Construction drawings for the Transfer Station providedinformation on the design of the septic system. Information on the use andmaintenance of the septic system was obtained through interviews withCecil County employees familiar with Transfer Station operations. Relativelylittle documentation of the types or quantities of liquids discharged to theseptic system was identified during the review of existing data.
2.1.1 Transfer Station OperationsThe Transfer Station serves as a collection point for municipal solid wastesfrom Cecil County residents and local waste hauling firms. The TransferStation is open for operation Monday through Saturday, 8:00 A.M. to 4:30P.M. County employees are present during operating hours. The buildinghas two levels. The main entrance to the building is on the upper level onthe north side. The compactors are located on the lower level on the southside of the building. The Transfer Station has a security alarm for thebuilding which is activated during nonoperating hours. The Transfer Stationis also patrolled by Cecil County law enforcement personnel.A total of approximately 12 to 14 waste hauling firms have typically used theTransfer Station in the past four years, about half of these firms use thefacility on a regular basis. Waste hauling firms are issued stickers by CecilCounty for display on vehicle windshields. The stickers are used to trackeach hauling firm's use of the Transfer Station for billing purposes.Municipal solid wastes brought to the Transfer Station are dumped directlyinto one of three bins located inside the building on the upper level. Eachbin feeds into a compactor on the lower level. The compactor pushes thewastes into a roll-off box positioned in the doorway of the compactor. Theroll-off boxes are then hauled to another Cecil County landfill for disposal ofthe wastes. Cecil County has maintained records of the quantity of municipalsolid wastes transported from the Transfer Station to a county landfillduring the past four years. Municipal solid wastes received at the TransferStation are not categorized as to waste types, consequently, there are norecords of the specific types, of wastes that have passed through the facility.
2-1

The Transfer Station also serves as a collection point for recyclablematerials, including glass, metal cans, plastics, and waste oil. Solidmaterials for recycling are collected in a roll-off box containing differentcompartments for each type of material. The roll-off box for recycling islocated adjacent to the front of the Transfer Station building. Waste oil iscollected in two aboveground metal storage tanks which are also locatednear the the front of the Transfer Station. Each waste oil collection tank hasa capacity of 275 gallons. The waste oil tanks are emptied on an "asneeded" basis. Cecil County also maintains a kennel on the lower level ofthe Transfer Station.
2.1.2 Septic System Design and ModificationFigure 2-1 shows the physical layout of the Transfer Station septic systemand related structures. The septic system layout presented in Figure 2-1was obtained from a scale construction drawing for the Transfer Stationprepared by Rummel, Klepper and Kahl Consulting Engineers in 1976-77.The construction drawing is the only document identified to date thatprovides information on the design and construction of the septic system.As shown in Figure 2-1, the main components of the septic system, locatedon the southwest side of the Transfer Station, originally included a septictank, a manhole at the head of the drain field, drain field tiles, and linesconnecting these structures. The original drain field consists of threeparallel drain lines constructed with four-inch diameter clay drain tilesplaced in an area 10 feet wide by 40 feet long. Drain lines in a septic systemare typically placed in a layer of stone or gravel fill to enhance discharge ofliquids into the unsaturated soils. However, no information on the backfillused for the drain lines was included on the construction diagram. Based onvisual examination of soil samples collected during the boring program, thebackfill for the drain lines consists of sand and gravel. The drain tiles wereconnected to the septic tank by a single four-inch diameter line which tiedinto the manhole at the upgradient end of the drain field. A four-inchdiameter line also connected the septic tank to the plumbing lines in theTransfer Station. The construction drawing indicated that the original drainfield was buried at a depth of seven feet below the ground surface.[Response to USEPA comment: The drain field located downgradient of themanhole was constructed with clay tile. Drain lines in all of the septicsystem upgradient of the drain field consist of four-inch HCISP, both underthe building and between the building and septic tank, manhole andbuilding.]
2-2AR305i*65

Figure 2-1Septic System LayoutWoodlawn Transfer StationCecil County, Maryland
— Entrance to Woodlawn Landfill
^
i- —————— Septic Line Section 1 ————— »-
TRANSFERD-Cleanoutsx STATION
/*- ~ *
New Drain Field \ ^ /\ — — — i (_) Seotic —
[~ __ _ _ —— • — —— — "? ~ ~Tank
// ^* 3 'Manhole/ ^o
ldB-£0l - *TCD C\
Original Drain Field v , / /± T5B"6^/ //**** —— ** ——— * ————
«/ " j.
~ \
LEGENP J:~ ~ — Underground Structure
TSW-1 ^. Ground Water Monitoring WellB Line Cut and Plugged with Concrete
Cleanout'
Paved Area
TSB-1 • Approximate Location of Soil Boring
SS-1 A Approximate Location of Surface Soil Sample ^^^ 20 10 0 20 40
W Scale In Feet\UQM f~*f\Ar\^ Ttw
' Drawn by / Date: E. Knopf le 8/20/9 1 Checked by / Date: D. Collins 8/21/91 f fw~T \i HLIM!Revised by / Date: E- Knopf le 3/9/92 Checked by / Date: D. Terry 3/1 0/92 —— *— o™*,
AR305^6o

In May 1990, the original septic system was modified. The four-inch linebetween the septic tank and the manhole was cut and plugged withconcrete. A separate four-inch polyvinyl chloride line was installed betweenthe septic tank and a newly installed drain field located to the west of theseptic tank. In addition, the line connecting the compactor floor drains tothe septic system was cut, and a separate line was installed between thecompactor floor drains and a newly installed 2,600 gallon undergroundholding tank used for temporary storage of liquids from the compactors.Liquids from the compactors are periodically removed from theunderground tank and hauled to the Seneca Point Wastewater TreatmentPlant.The location of the new drain field had been sketched by hand onto thescale construction drawing. However, the source of the information for thenew drain field that was sketched onto the original drawing could not bedetermined. The location of the new drain field as shown on theconstruction drawing appears to agree with the actual location based oncomponents of the septic system that are visible at the ground surface andinformation provided by Cecil County employees.
2.1,3 Septic System Use and MaintenanceThe original drain field for the septic system received liquid wastes fromthe Transfer Station bathroom (upper level), floor drains (lower level)adjacent to the compactors, and a floor drain and sink near the kennel(lower level). Prior to modification of the septic system in May 1990,liquids from the compactors combined with sanitary wastes in a commonline leading from the building to the septic tank. In May 1990, when thenew drain field was installed, the line from the compactor floor drains wasdisconnected from the line carrying sanitary wastes, and a new line wasinstalled between the compactor floor drains and a newly installedunderground storage tank. This storage tank is emptied as needed and theliquids transported to the Seneca Point Wastewater Treatment Plant. Thenew drain field receives only sanitary wastes from the Transfer Stationbathroom and the kennel area. Liquids from the compactor are carrieddirectly from the compactor floor drains to the underground holding tankvia a separate underground line.Interviews were conducted with Cecil County employees to identify potentialsources of hazardous constituents, such as chemical cleaners, that may havebeen introduced to the septic system as a result of cleaning activities at theTransfer Station or maintenance of the septic system. According to countypersonnel familiar with Transfer Station operations, the only chemical
2-3
AR305Lf67

cleaners used Included household-type bathroom cleaners for the restroomand two products for odor control and cleaning. The cleaners used in thekennel area include household cleaners (e.g., Clorox bleach and Ajaxcleanser). The odor control and cleaning' products used to clean theTransfer Station floor are named Super Fresh and Orange Odor ControlDegreaser. A Material Safety Data Sheet (MSDS) (Appendix B) for each odorcontrol and cleaning product was used as a source of information for thefollowing description of each product.[Response to USEPA comment: Interviews with site personnel indicatedthat there are no records of septic system operations and maintenanceduring ten years of Transfer Station operations. According to one employee,the only cleaning agents used at the Transfer Station were cleaning agentspreviously described in this document. Because there are no recordsavailable, it is not possible to identify cleaners used at the station.]The product type for the Super Fresh, which is manufactured by ChemtronIncorporated of Lorton, Virginia, is listed on the MSDS as an "institutionalmalodor counteractant", and the product is described as a "clear orangeliquid with distinctive fresh odor". According to the MSDS, the productdoes not contain any hazardous ingredients, but it does contain non-ionicsurfactants. The MSDS for the Orange Odor Control Degreaser,manufactured by Share Corporation of Milwaukee, Wisconsin, characterizesthe product as a clear water white liquid with an orange fragrance. TheMSDS indicates mineral spirits (approximately one percent) as the onlyhazardous ingredient.Septic system maintenance consisted of unclogging lines that periodicallybecame clogged and caused overflows from the system. The methods usedto unclog the lines included the use of either a plumbing snake or highpressure stream of water. According to Cecil County personnel, nochemicals have been used in the past four years to clear clogged lines. Noinformation was available on whether chemical cleaners were used for septicsystem maintenance prior to four years ago. Typically, when a clogged linewas cleared, the septic tank was also pumped out. These activities wereperformed by Cecil County employees. Clogged lines were cleared on thesame day that an overflow was reported. On a few occasions in the past fouryears, a commercial septic service firm may also have been used to pump outthe contents of the septic tank.
2.2 Soil SamplingThe soil sampling program for Work Plan Addendum 1 of the TransferStation was completed between 23 and 30 January 1991. Sampling
The
flR305<468

activities on 23 and 24 January 1991 were observed by two representativesof USEPA's oversight contractor, The Earth Technology Corporation. Thesoil sampling program inititated as Work Plan Addendum 2 was completedon 4 and 5 December 1991. During the field activities of Wok planAddendum 2, representatives of the USEPA, The Earth TechnologyCorporation, Black and Veatch, Inc., and IT. Corp. were present.
2.2.1 Sampling MethodsA total of six soil borings and one ground water monitoring well werecompleted in and adjacent to the original drain field for the Transfer Stationseptic system using hollow stem auger drilling methods: the ground watermonitoring well and four soil borings were completed as part of Work PlanAddendum 1; two soil borings were completed as part of Work PlanAddendum 2. Information contained in the scale construction drawing ofthe Transfer Station was used to determine the approximate location of theoriginal drain field prior to conducting the soil boring program. Usingdistances obtained from the scale construction drawing of the septic systemlayout, the location of the original drain field was determined using theseptic tank and the manhole, the tops of which are exposed at the groundsurface, as reference points. This approach provided sufficient accuracy todefine the location of the original drain field to meet the objectives of thesoil boring program. The locations of the soil borings in the drain field andthe one boring located topographically downgradient of the original drainfield were also determined relative to the location of the manhole.During Work Plan Addendum 1, five borings (TSB-1, TSB-2, TSB-3 and TSB-4 and borehole for monitoring well TSW-1) were completed along theapproximate boundaries of the drain field to obtain soil samples below theoriginal drain field that received septic system discharges. One boring wascompleted at each end of the drain field, and one along each side. The fifthboring (TSW-1) was located approximately 17 feet south of thedowngradient end of the original drain field. This boring was drilled a totaldepth of 65 feet to allow installation of a ground water monitoring well insaturated soils. Borings TSB-1 through TSB-4 were completed ten feetbelow the bottom of the drain field with total depths ranging from 16 to 20feet below the ground surface. The final depth of each boring wasdetermined as drilling progressed based on field observations, includingvisual observations of soils coupled with results of field screening of soilsamples with an organic vapor analyzer (OVA).During Work Plan Addendum 2, soil borings TSB-5 and TSB-6 werecompleted around the manhole within about five feet of TSB-1. These twosoil borings were completed to obtain soil samples from above and/or within
2"5 ———-—Groop

the backfill of the drain field. Boring locations are shown in Figure 2-1.Note that the locations of TSB-5 and 6 are approximate based on handmeasurements by ERM. Soil borings TSB-5 and 6 terminated at a depth ofeight feet in accordance with Work Plan Addendum 2.Soil samples from each soil boring (TSB-1 through TSB-6) were collectedusing the standard penetration test method (ASTM Method D-1586). Eachsoil sample was visually inspected in the field. Samples were examined forvisible evidence of contamination, and classified in the field to characterizesoil types and physical characteristics.Soil samples were also screened in the field using an OVA equipped with aphotoionization detector (PID) to indicate the presence of volatile organicvapors. In addition, soil samples from TSB-5 and 6 were screened in thefield using ERM's Field Analytical Services Technology (ERM-FAST).Descriptions of soil samples and OVA-PID measurements for each boringwere recorded in dedicated project fieldbooks and later transferred todrilling logs, which are presented in Appendix C.Soil samples were collected continuously over the entire depth of theborings using a split-spoon sampler. As described in the Work PlanAddendum 1, the criteria for determining the depth of borings TSB-1through TSB-4 were as follows:• if no VOCs were detected by field screening with the OVA-PID and no
visual evidence of contamination was observed, then the boring was tobe terminated ten feet below the depth of the first sample collectedfor laboratory analysis from immediately below the drain lines;
• if VOCs or visual evidence of contamination was observed in thesample collected ten feet below the drain lines, then the boring was tobe advanced until the indicators of contamination (i.e., visual evidenceor positive OVA-PID readings) were no longer observed, or to thewater table, whichever was encountered first.
Soil samples collected immediately below the drain field in borings TSB-1through TSB-4 did not show visual evidence of contamination or havepositive OVA-PID measurements. Subsequently, these four borings wereterminated ten feet below the drain field.'In boring TSW-1, continuous soil sampling was completed to a depth of 20feet. The soil samples selected from this boring for laboratory analysis wereobtained at depths of 4 to 6 feet and 18 to 20 feet. Below the 20 foot depth,soil samples were collected at five foot intervals only for the purpose of fieldclassification of soil characteristics and field screening with an OVA-PID.
flR305t*70

Immediately after each soil sample was collected, the soil was removed fromthe split spoon and placed in sample containers for field screening by theOVA-PID and/or ERM-FAST and storage pending selection of samples forlaboratory analysis. The portion of each' sample to be used for fieldscreening and laboratory analysis for VOCs was collected first, followed byportions of the sample for semivolatile analyses, pesticides andpolychlorinated biphenyls (PCBs), and metals. Sample containers wereimmediately placed in a cooler chilled to four degrees Centigrade pendingselection of samples for laboratory analysis. Samples were selected forlaboratory analysis and shipped daily to the laboratory via overnight delivery.Sample documentation procedures, including chain-of-custody and trafficreport forms, were used in accordance with procedures described in theQAPP Addendum and Supplement.Ten soil samples from soil borings TSB-1, 2, 3, 4 and TSW-1 (two from eachboring), plus appropriate quality assurance samples, were submitted to thelaboratory for chemical analyses based on the criteria presented in the WorkPlan Addendum 1. Three soil samples plus appropriate quality assurancesamples were submitted for laboratory analyses from soil borings TSB-5 and6. Table 2-1 summarizes which soil samples from each soil boring wereselected for chemical analyses.To minimize the potential for cross-contamination, all of the drillingequipment used to complete the soil borings, including the hollow stemaugers, drill rods, split spoons and other downhole tools, weredecontaminated prior to drilling each boring in accordance with thedecontamination procedures described in the QAPP Addendum andSupplement.After each soil boring was completed, the borehole was backfilled with acement/bentonite grout mixture (i.e., 95 percent cement with 5 percentbentonite) to seal the borehole. Cuttings from the soil borings anddecontamination water were contained in U. S. Department ofTransportation (DOT) approved 55-gallon steel drums, securely closed, andlabeled to indicate the date, source, and contents of each drum. The drumsare temporarily being stored on site until the analytical results for the soilsamples are evaluated to determine whether the cuttings anddecontamination water are hazardous or nonhazardous. After analyticalresults for the soil samples are evaluated, the proposed method fortreatment or disposal of the cuttings and decontamination water will besubmitted for USEPA approval.[Response to USEPA comments: (1) The soil borings were backfilled withgrout upon completion. ERM site visit in March 1991 noted that the grouthad settled in the soil borings but the grout was within one foot of the
Th9-7•* ' ———»—GrSip

Table 2-1
Summary of Soil SamplesSelected for Chemical AnalysesWoodlawn Transfer Station
TotalBoring Depth of Sample SubmittedDepth for Chemical Analysis
Boring No. (feet)__________(feet)________Sample DescriptionfalTSB-l 20 8-10 Tan sand, some silt, trace clay
18-20 Sand and fine gravel, some silt,trace clay
TSB-2 16 6-8 Red silt and clay, some sand,little gravel, and gray to yellowsilt, little sand
14-16 Sand and fine gravel, little silt
TSB-3 20 6-8 Orange, tan, and white silt, somesand, trace clay
18-20 Red, orange, and black sand,some silt, trace clay
TSB-4 16 4-6 Sand and gravel with red silt,some sand, little gravel
14-16 Red, white, and tan sand, somesilt, trace clay
TSW-1 65 4-6 Black stained silt and sand,trace gravel with red, tan, andwhite clay, some silt
18-20 Tan, orange, red silt, somesand, trace clay
SS-2 0.5 0-0.5 Not recorded
Group
AR305U.72

Table 2-1 (cont.)
TotalBoring Depth of Sample SubmittedDepth for Chemical Analysis
Boring No. (feet)__________(feet)________Sample Descrlptionfal
TSB-5 8 2-4 Wet, brown, gray stained silt,little, gravel, little sand.
4-6 Wet, brown, gray silt, somegravel, red silt in spoon tip.
TSB-6 8 4-6 Moist, brown, gray sand, somegravel, trace silt, odor observed{drain field materials)
(a) Sample descriptions based solely on visual observations and field classification.
flR305i*73
ground surface. (2) The drums containing the soil cuttings anddecontamaintion water have been moved by the County from the field towithin the fenced area.]
2.2.2 Surface SamplingDuring Work Plan Addendum 2, three surficial soil samples (SS-1, SS-2 andSS-3) were collected downslope of the manhole at the locations shown inFigure 2-1. Each sample was collected from a depth of zero to six inchesbelow the surface. Surficial sample SS-1 was collected immediately adjacentto the manhole on the down slope side; SS-2 was collected approximately10 feet down slope from the manhole; and SS-3 was collected approximately20 feet down slope. Each of these surficial samples was screened in thefield using ERM-FAST. The field screening results were used to selectsamples for laboratory analyses.Immediately upon collection of each surficial sample, the sample was placedin laboratory supplied sample containers for field screening by ERM-FASTand storage pending selection of samples for laboratory analysis. Theportion of each sample to be used for field screening and laboratory analysisfor VOCs was collected first, followed by portions of the sample forsemivolatile analyses, pesticides and polychlorinated biphenyls (PCBs), andmetals. Sample containers were immediately placed in a cooler chilled tofour degrees Centigrade pending selection of samples for laboratory analysis.Sample documentation procedures, including chain-of-custody and trafficreport forms, were used in accordance with procedures described in theQAPP Addendum and Supplement.
2.2.3 Field ScreeningField screening was an important part of Work Plan Addenda 1 and 2. Thefield screening methods were similar for both work plans. The OVA-PIDwas used as a preliminary screening method for VOCs. In WorkplanAddendum 2, ERM-FAST was used to augment the OVA-PID screening. Useof ERM-FAST is outlined in the QAPP Addendum and Supplement. ERM-FAST analyses included a Performance Evaluation (PE) sample prepared bythe USEPA. ERM-FAST results of the PE sample analyses were submitted byERM to the USEPA by letter dated 6 January 1992.Each soil sample was screened in the field using an OVA-PID to measure thetotal concentration of volatile organic vapors volatilizing from the soilsample. The detection of volatile organic vapors in soil samples using theOVA-PID was used to provide a preliminary indication of the presence of
2-8 ——— »—QrSop

volatile organic vapors in the soil. Field screening of soil samples wasperformed in accordance with the procedures described in the Work PlanAddendum 1. The instrument used to measure total vapor concentrations inthe jar headspace for each soil sample was a Photovac MicroTip™ equippedwith a PID and a 10.6 electron volt lamp.The field screening procedure for Work plan Addendum 2 was a two stepprocess. First, each soil sample from TSB-5 and TSB-6 was screened in thefield using the OVA-PID in the manner described above. The OVA-PIDresults are presented in Table 2-2. The second step of the process involvedthe use of ERM-FAST. Based on the results of the OVA-PID screening, foursamples from the soil borings were submitted to ERM-FAST for analyses ofTCL semivolatile and VOCs, TAL metals (not including beryllium), pesticidesand PCBs. In addition, each of the three surficial soil samples were alsoscreened by ERM-FAST. Due to catastrophic failure of the GasChromatograph/Mass Spectra (GC/MS), a low resolution GC probe was usedby ERM-FAST for the organic analyses. Use of the GC probe wasdocumented to the USEPA by letter dated 6 January 1992. The TALanalyses were by X-ray Flouresence (XRF). The results of ERM-FAST arepresented in Table 2-3.2.2.4 Selection of Samples for AnalysisThe locations and depths of soil samples selected for chemical analyses aresummarized in Table 2-1. Regarding Work Plan Addendum 1, the first soilsample obtained from the interval immediately below the fill surroundingthe drain lines was submitted for laboratory analysis from the four boringscompleted in the drain field. The criteria described in the Work PlanAddendum for selecting the second soil sample for laboratory analysis fromeach boring included the following:• any visual or readily observable evidence of potential contamination,
including unusual color, staining or odors; or• detection of VOCs above background concentrations based on field
screening with an OVA-PID, in which case the sample from thedeepest interval of the borehole that had the highest OVA-PIDmeasurement was to be submitted to the laboratory.
If both criteria were met, the sample from the deepest interval of the boringthat met one of these criteria was to be selected for laboratory analysis.However, during completion of the soil borings, visual observations coupledwith OVA-PID field measurements indicated a lack of potentialcontamination below the original drain field. Subsequently, the secondsample selected for laboratory analysis from each boring was collected from
2-9

TABLE 2-2
Soil Sample OVA-PID Headspace MeasurementsWoodlawn Transfer Station
Sample ID(a)
TSB-50' - 21
TSB-52' - 4'
TSB-541 - 6'
TSB-56' - 8'
TSB-60' - 2'
TSB-62' - 4'
TSB-64' - 6'
TSB-66' - 8'
Time ofMeasurement
10:42
10:55
11:03
11:18
12:35
12:47
12:53
13:03
Water bathTemperature
(degrees Centigrade)
25
28
24
25
28
26
25
24
OVA-PIDMeasurement (ppm)
66
160
108
48
10.5
10.5
62.3
19.6
(a) Soil samples from implementation of Work Plan Addendum 2.
AR305U76Group
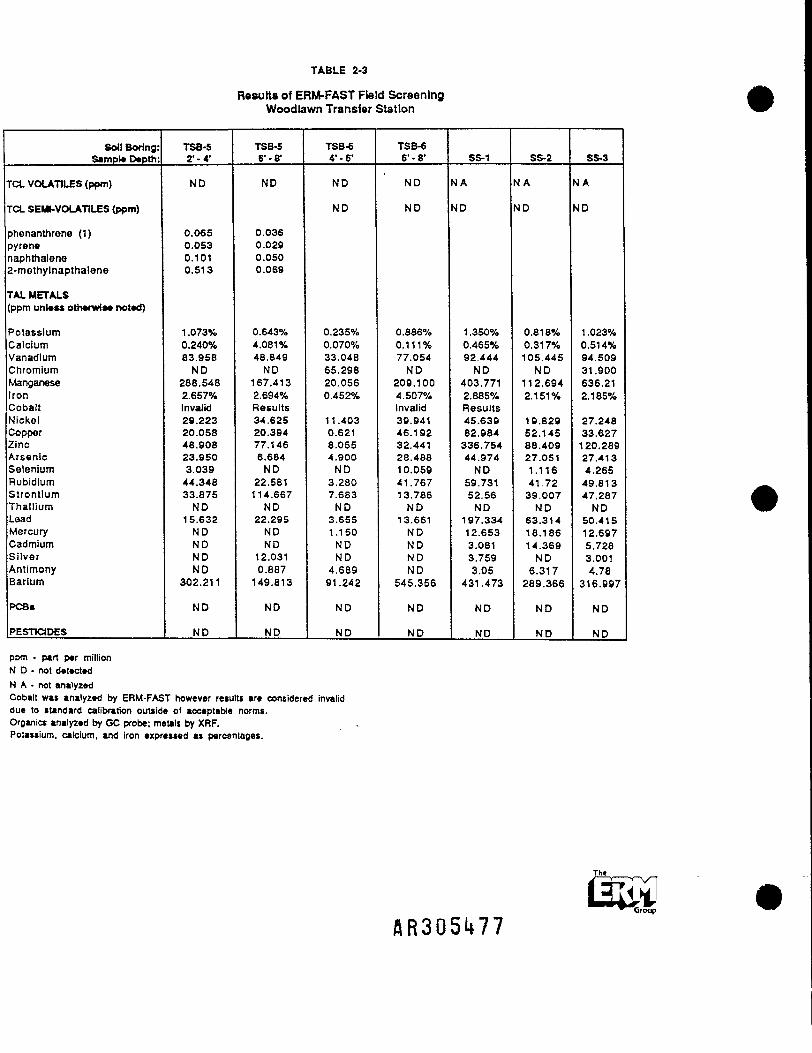
TABLE 2-3
Results of ERM-FAST Field ScreeningWoodlawn Transfer Station
Sol! Boring:Sample Depth:
TO. VOLATILES (ppm)
TCL SEW-VOLATILES (ppm)
phenanthrene (1)jyrenenaphthalene2-methylnapthalene
TAL METALS[ppm unless otherwise noted)
PotassiumCalciumVanadiumChromiumManganeseIronCobaltNickelCopperZincArsenicSeleniumRubidiumStrontiumThalliumLeadMercuryCadmiumSilverAntimonyBarium
peasPESTICIDES
TSB-52--41
ND
0.0650.0530.1010.513
1.073%0.240%83.956ND
288.5482.657%Invalid29.22320.05848.90823.9503.03944.34633.875ND
15.632NDNDNDND
302.211
ND
ND
TSB-5r-rND
0.0360.0290.0500.069
0.643%4.081%46.849ND
167.4132.694%Results34.62520.39477.1466.664ND
22.581114.667ND
22.295NDND
12.0310.887149.813
ND
ND
TSB-64'-0'
ND
ND
0.235%0.070%33.04865.29820.0560.452%
11.4030.6218.0554.900ND3.2807.683ND3.6551.150NDND4,68991.242
ND
ND
TSB-66'-8'
ND
ND
0.886%0.111%77.054ND
209.1004.507%Invalid39.94146.19232.44128.48810.05941.76713.786ND
13.661NDNDNDND
545.356
ND
ND
SS-1
NA
ND
1 .350%0.465%92.444ND
403.7712.885%Results45.63982.984336.75444.974ND
59.73152.56ND
197.33412.6533.0813.7593.05
431.473
ND
ND
SS-2
NA
ND
0.818%0.317%105.445ND
112.6942.151%
19.82952.14588.40927.0511.11641.7239.007ND
63.31418.18614.369ND
6.317289.366
ND
ND
SS-3
NA
ND
1 .023%0.514%94.50931.900636.212.185%
27.24833.627120.26927.4134.26549.81347.287ND
50.41512.6975.7283.0014.78
316.997
ND
ND
ppm - part per millionN D - not detectedN A • not analyzedCobalt was analyzed by ERM-FAST however results are considered invaliddue to standard calibration outside of acceptable norms.Oroanics analyzed by GC probe; metals by XRF.Potassium, calcium, and iron expressed as percentages.
Group

the last two foot interval of each soil boring, as stated in the Work PlanAddendum 1.[Response to USEPA comments: (1) At TSB-1, the six to eight foot samplewith black staining was interpreted to be part of the drain field. Therefore,the sample from eight to ten feet was interpreted to be the first sampleimmediately below the drain field. (2) The septic odor and black gravel atthe end of the split spoon depth interval was interpreted to be the top ofthe drain field. (3) The two to four foot sample was above the drain field,and therefore was not selected. Conceptually, it did not seem appropriate tosample above the drain field since the concern was whether or not potentialcontaminants entering the drain field were discharged from the septicsystem into the unsaturated zone soils that constitute the migration pathwaybetween the septic system and the ground water.]The fifth soil boring, TSW-1, was completed topographically downgradientof the drain field. The first soil sample for this boring was collected at adepth of four to six feet below the ground surface, which was estimated tobe a comparable depth to the sampling interval of the first sample selectedfor analysis from each of the four borings in the drain field. The secondsample from TSW-1 selected for analysis was collected at a depth of 18 to20 feet to correspond with the lowermost depth interval sampled in theother soil borings.Regarding Workplan Addendum 2, four soil samples were submitted forlaboratory analyses and are included in Table 2-1. The soil samples wereselected by the USEPA for laboratory analyses. The reasons for sampleselection by the USEPA were transmitted to ERM by telephone on 6December 1991 and summarized as follows:• TSB-5 2-4 feet - selected based on ERM-FAST detection of semivolatiles
and observed petroleum hydrocarbon odors;• TSB-5 4-6 feet - selected based on depth immediately below the 4-6 feet
sample and due to observed petroleum hydrocarbon odors;• TSB-6 4-6 feet - selected due to the detection of metals by ERM-FAST,
and to verify the non-detection of VOCs and semivolatiles by ERM-FAST.• SS-2 - USEPA selected this sample as the single surficial sample for
analyses.Note that sample TSB-5 4-6 feet was not field screened by ERM-FAST butselected by the USEPA due to its location immediately below the 2-4 footinterval.
The
flR305l»78
2.3 Ground Water SamplingPrior to completion of the soil sampling program, a ground watermonitoring well was installed in the soil boring located topographicallydowngradient of the original drain field. USEPA was verbally notified of thedecision to install the well, followed by written notification. The monitoringwell was installed to provide information on ground water quality and theelevation of ground water in the vicinity of the original drain field.Information related to ground water sampling, including well installationand development, sampling procedures, and results of chemical analyses ofthe ground water sample, are discussed below. Note that the wellinstallation and ground water sampling were completed as part of Work PlanAddendum 1 and were not part of Work Plan Addendum 2.2.3.1 Monitoring Well InstallationThe monitoring well, designated as TSW-1 (Transfer Station Well-1), islocated approximately 17 feet south of the original drain field (Figure 2-1).The well was installed on 30 and 31 January 1991 in accordance with wellinstallation procedures presented in the Work Plan Addendum 1. The wellwas installed to a depth of 63 feet below the ground surface. Monitoringwell installation was completed using hollow stem augers. The well wasconstructed in saturated soils. An "as built" diagram of well construction isshown on the drilling log for TSW-1 (see Appendix C).From the ground surface to a depth of 20 feet, soil samples were collectedfrom the borehole for the well in the same manner previously discussed forsampling the four borings completed in the original drain field. Two soilsamples, at depths of 4 to 6 feet and 18 to 20 feet, were submitted forchemical analyses based on the criteria stated in the Work Plan Addendum1. Below the 20 foot depth, split-spoon soil samples were collected at fivefoot intervals to the final depth of the borehole. The samples below the 20foot depth were collected only for visual examination, field classification,and field screening of soil samples. As indicated in the Work PlanAddendum 1, soil samples below the 20 foot depth of the borehole for themonitoring well were not to be submitted for chemical analyses.The monitoring well was constructed in accordance with the well designpresented in the Work Plan Addendum 1, using two-inch inner diameterthreaded flush-joint Schedule 40 polyvinyl chloride well screen and riserpipe. A ten-foot length of machine-slotted well screen, with a slot size of0.02 inches and a bottom cap, was placed in the lowermost ten feet of theborehole.The borehole annulus around the well screen was backfilled with clean silicasand sized appropriately for the slot size of the well screen. A two-foot thick
TlHf
2-11 ---«,AR305i*79

bentonite pellet seal was placed in the borehole annulus immediately abovethe top of the filter pack. After allowing at least two hours for the bentonitepellet seal to hydrate, a cement/bentonite grout (i.e., 95 percent cementwith 5 percent bentonite) was placed with a tremie pipe into the remainderof the borehole annulus from the top of the bentonite seal up to the groundsurface.A protective steel casing with a locking cap was installed over the stick-upof the riser pipe. The well tag with a Maryland well permit identificationnumber (CE-88-1641) was attached to the outside of the protective steelcasing. A concrete pad was installed around the base of the protective steelcasing to secure the casing in the ground and to provide a drainage collar.After well installation was completed, the well was developed to stabilize thefilter pack and to remove fine-grained sediments from the well screen andfilter pack. Well development was accomplished by surging the well usingthe air lift method. Approximately five wetted casing volumes of water wereremoved from the well during development. Based on observations madeduring well development, the well has a low yield and a very slow rate ofrecharge.Decontamination of drilling equipment used for monitoring well installationfollowed procedures described in the Work Plan Addendum and QAPPAddendum. Borehole cuttings and water from well development andequipment decontamination were contained in 55-gallon steel drums fortemporary on-site storage pending receipt of soil and ground wateranalytical results. Drums were labeled to indicate the date, source andcontents of the material in each drum. After review of the analytical results,appropriate disposal methods for these materials will be identified andsubmitted to USEPA for approval.[Response to USEPA comments: The drums containing the soil cuttings anddecontamaintion water have been moved by the County from the field towithin the fenced area.]2.3.2 Sampling MethodsGround water samples were collected on 14 February 1991, two weeks afterinstallation of the monitoring well. Ground water sampling was performedin accordance with the procedures for ground water sampling described inboth the Work Plan Addendum and the IT Corp. QAPP dated 30 November1989 (Revision 05).The depth-to-water was measured and the volume of water in the wellcalculated to determine the volume of water to be purged from the wellprior to sampling. Three wetted casing volumes of water were purged from
2-12 ———»—Group
flR305i*80
the well with a clean dedicated polyvinyl chloride bailer prior to sampling.Purge water was contained in a 55-gallon steel drum.The ground water sample was collected with a new, clean dedicatedpolyvinyl chloride bailer. With the exception of the portion of sample thatwas filtered for analysis of metals, the sample was placed from the bailerdirectly into laboratory-supplied sample containers containing appropriatepreservatives for the analyses to be performed. The portion of the sampleused for metals analysis was filtered in the field according to proceduresoutlined in the IT Corp. QAPP. The appropriate quality assurance samples(i.e., duplicate sample, trip blank, field blank, and equipment rinsate blank),as described in the IT Corp. QAPP, were incorporated into the ground wateranalytical program.Sample containers were labeled, placed in a cooler chilled to four degreesCentigrade, and packed for overnight delivery to the laboratory in the samemanner as previously described for the soil boring program. Chain-of-custody procedures were also implemented as described in the Work PlanAddendum.
2.4 Soil Boring and Well SurveyThe locations and elevations of soil borings and the monitoring wellcompleted as part of Work plan Addendum 1 were surveyed by a landsurveyor with the Cecil County Department of Public Works. The MarylandState Plane Coordinate System was used for horizontal control to determinethe locations of the borings and the monitoring well. Vertical control forthe elevation survey was made relative to the 1927 North American Datum.The coordinate system and vertical datum are the same as used by IT Corp.for the RI/FS. Benchmarks located on Firetower Road and at theintersection of Firetower Road and Waibel Road were used as referencepoints for the survey. Elevations were determined to the nearest 0.01 feet.Coordinates and elevations for the soil borings and the monitoring well arepresented in Table 2-4. The soil boring and surface sampling locationscompleted as part of Work plan Addendum 2 were hand measured by ERM,and are not included in Table 2-4.
9- ————*—Gr55p
AR3Q51*8i
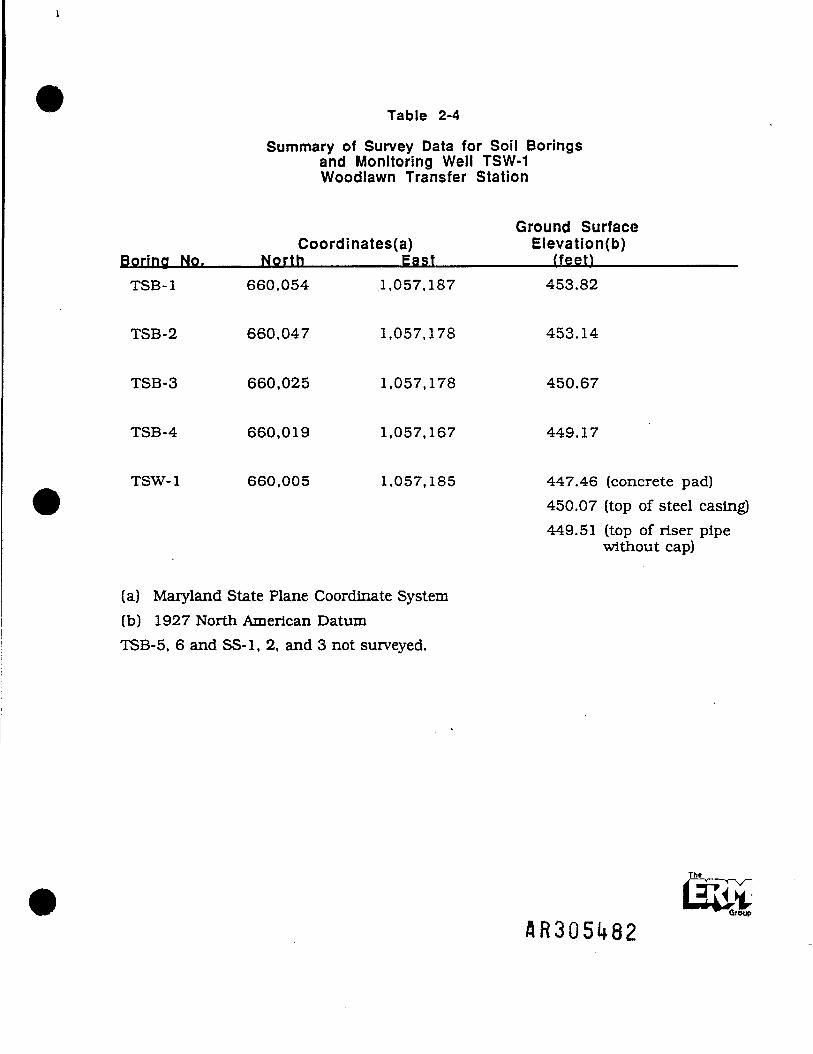
Table 2-4
Summary of Survey Data for Soil Boringsand Monitoring Well TSW-1Woodlawn Transfer Station
Ground SurfaceCoordinates(a) Elevation(b)
Boring No.____North_______East_________(feet)___________TSB-1 660,054 1,057,187 453.82
TSB-2 660,047 1,057,178 453.14
TSB-3 660,025 1,057,178 450.67
TSB-4 660,019 1,057,167 449.17
TSW-1 660,005 1,057,185 447.46 (concrete pad)450.07 (top of steel casing)449.51 (top of riser pipe
without cap)
(a) Maryland State Plane Coordinate System(b) 1927 North American DatumTSB-5. 6 and SS-1, 2, and 3 not surveyed.
flR305lf82Group
SECTION THREERESULTS OF FIELD INVESTIGATION
3.1 Soil Characteristics of Original Drain FieldDetailed descriptions of soils encountered in each soil boring are providedon the drilling logs in Appendix C. In general, the soils below the drain fieldwere saprolitic and consisted predominantly of silt with varying amounts ofsand, clay and fine gravel. Overall, the soils exhibited natural colors,including brown, tan, red, white, gray and orange. In some borings, soilsimmediately adjacent to the drain line backfill also exhibited black staining,however, the extent of the staining was limited to a few inches. No othervisual evidence of potential contamination of soils was observed during thesoil boring program.The sand and gravel backfill surrounding the drain lines of the original drainfield was encountered in borings TSB-1, TSB-3, TSB-4, TSB-5 and TSB-6.Figure 3-1 presents a cross section of the original drain field based onseveral of the soil borings. The drain line backfill was not encountered inTSB-2, probably because the boring was located just beyond the edge of thebackfill. The drain line backfill is approximately two feet thick, and wasobserved at depths of four to eight feet below the ground surface. The rangein the observed depth of the drain line backfill is likely due to the change inslope of the ground surface from the upper to lower end of the drain field. Aseptic odor was observed in the four to six foot soil sample interval fromTSB-1. An unknown odor was observed four to six foot soil sample intervalat TSB-6. The sample from TSB-1 was immediately above the drain linebackfill; the sample from TSB-6 was from within the drain field backfill. Noother odors were observed in any of the soil samples. Field screening of soilsamples from the borings with an OVA-PID did not indicate the presence ofVOCs in soils beneath the drain lines in TSB-1, 2, 3, and 4. As previouslypresented in Table 2-2 in Section Two, volatile organic vapors weredetected in the soil samples from soil borings TSB-5 and TSB-6.[Response to USEPA comments: (1) Black staining in the four to six footsample intervals of TSB-2 and TSB-3 was interpreted to indicate thepresence of the drain field. Because the stated intent of Work PlanAddendum 1 was to sample from below the drain field, these samples werenot submitted to the laboratory: (2) The black staining in the sand andgravel layer at the depth interval which the construction drawing indicatedthat the drain field was buried was the evidence used to identify the drainfield backfill.]
Tht
3-1 ——— »—Group
AR3Q5i*83
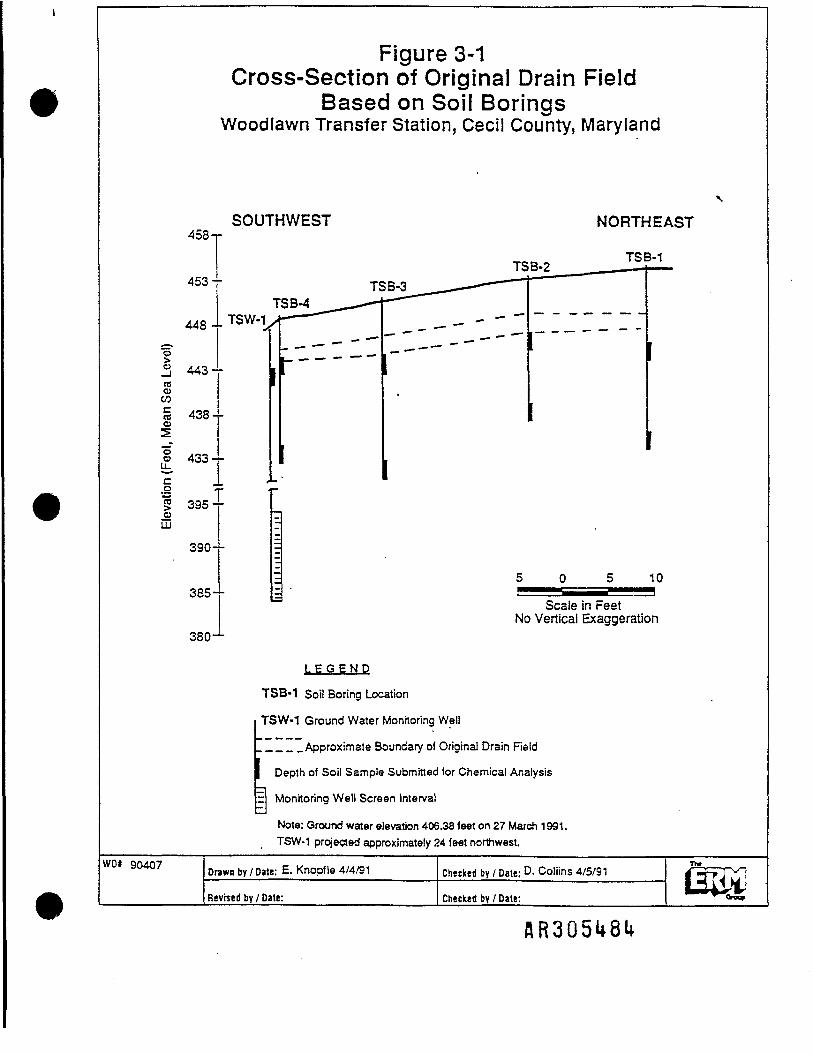
Figure 3-1Cross-Section of Original Drain Field
Based on Soil BoringsWoodlawn Transfer Station, Cecil County, Maryland
V
458-1
453-
448 -
f2 443-reo>
§ 438'
O f
§ 395-oHI
390-
385-
SOUTHWEST NORTHEAST
TSB.2_____I!fLTSB- ^ . — — - •"""""
_ TSW-I/I- — ___ - --------- H
IF- -:::r """"""'1
,
5E 5 0 5 10
Scale in FeetNo Vertical Exaggeration
380 ~L
L E G E N D
TSB-1 Soil Boring Location
TSW-1 Ground Water Monitoring Well
. __ _ _ Approximate Boundary of Original Drain Field
Depth of Soil Sample Submitted for Chemical Analysis
E Monitoring Well Screen Interval
Note: Ground water elevation 406.38 feet on 27 March 1991.TSW-1 projected approximately 24 feet northwest.
WO* 90407 Drawn by/ Date: E.Knopf le4/4/91 Checked by /Date: D. Coliins 4/5/91 {"'P'T'l
Revised by / Date: Checked by / Date: ^ ^ onar
3.2 Analytical Results for Soil Samples
3.2.1 Sample AnalysesSoil samples were submitted to Gulf States Analytical, Inc. (GSAI), theUSEPA-approved laboratory for chemical analyses of samples collectedduring the investigation of the Woodlawn Transfer Station septic system.Chemical analyses for each soil sample included the following:• Target Compound List (TCL) VOCs;• TCL semivolatile organic compounds;• TCL pesticides and PCBs; and• Target Analyte List (TAL) inorganic compounds.In addition, the soil samples from the surficial sample location (SS-2) andborings TSB-5 and TSB-6 included tentatively identified compounds (TICs)as part of the VOC and semivolatile analyses, and total organic carbon (TOC)content was also measured by the laboratory. Analyses were performed inaccordance with the USEPA Contract Laboratory Program (CLP) Statementof Work (SOW) for Organics (2/88) and the SOW for Inorganics (7/88) asstated in the QAPP Addendum and Supplement. Quality assurance sampleswere also incorporated into the analytical program including trip blanks andequipment rinsate blanks, blind duplicates, and matrix spike/matrix spikeduplicate samples.[Response to USEPA comment: GSAI subcontracted the metals andPCB/pesticide analyses to meet the project turnaround time requirementsand sample holding times. This was necessary due to a number of problemswith GSAI instrumentation and excessive analytical backlog. GSAIsubcontracted to Lancaster Laboratories, Inc (LLI). LLI is a CLP laboratorythat performs work in USEPA Region III. The holding times were met aspresented in the quality assurance reports in Appendix D.]
3.2.2 Data ValidationQuantitative analytical data for the soil samples were reviewed by an ERMQuality Assurance Chemist trained to evaluate laboratory data according toUSEPA protocols described in the document titled Laboratory DataValidation Functional Guidelines for the Evaluation of Organic (andInorganic) Analysis (USEPA Data Review Work Group, 2/88 for Organics and6/88 for Inorganics). The initial step of the data validation consisted of areview of sample documentation, including chain-of-custody forms, trafficreports, analytical reports, and CLP deliverables.
AR305i*85

A detailed quality assurance review was also performed by an ERM QualityAssurance Chemist to verify the quantitative and qualitative reliability of thedata as reported by the laboratory. The quality assurance review included adetailed review and Interpretation of all the data generated by GSAI. TheQAPP Addendum and Supplement provides a detailed list of items examinedduring the quality assurance review. A quality assurance report wasprepared by ERM based upon the review of organic arid inorganic datagenerated during chemical analyses of the soil and ground water samples.The quality assurance reports for Work Plan Addenda 1 and 2 are found inAppendix D. Appendix D also includes the trip, equipment and methodblanks for Work Plan Addendum 2.
3.2.3 Results for Organic Analyses of SoilsThe results for organic analyses of soil samples are summarized in Table 3-1.VOCs detected in the soil samples included acetone, 2-butanone. toluene,ethylbenzene, and xylenes. The detections were associated with the soilsamples submitted from TSB-5 and TSB-6. As shown in Table 3-1 anddiscussed in the quality assurance report (Appendix D), the reported resultsfor the remainder of the soil samples are invalid because the VOCs were alsodetected in associated blanks or are qualified as estimated values since theconcentrations were below the Contract Required Quantitation Limit (CRQL).VOCs were not detected in the surficial soil samples SS-2. Trace levels ofacetone, toluene, and ethylbenzene were detected in the soil samplingintervals of two to four feet and four to six feet from TSB-5 and TSB-6. Themaximum VOC concentration was total xylenes at 1,800 micrograms perkilogram (ng/Kg) In the four to six foot sample from TSB-5. Toluene,ethylbenzene, and xylenes are light fraction petroleum hydrocarbonscommonly associated with the presence of gasoline. Note that hereinafter,the surficial and soil boring samples collected as part of Work PlanAddendum 2 are collectively referred to as the shallow soils; the remainingsoils samples are collectively referred to as the deeper soils. Thiscategorization reflects the relative position with respect to the drain fieldbackfill. Specifically, the shallow soils are located above and/or within thedrain field backfill; the deeper soils are located below the drain field.In the deeper soil samples (TSB-1 through TSB-4, and TSW-1). VOCs werenot detected or not detected at concentrations significantly above associatedblank concentrations. These results indicate that trace levels of VOCs arepresent in the shallow soils; however, the extent is very localized andlimited vertically. The absence of VOCs at depth indicates clearly that soilsunderlying the drain field are not contaminated with VOCs.Several semivolatile organic compounds were detected in the shallow soilsamples. The majority of these compounds comprise the suite of copounds
Tht
3-3
AR305l*86

!&! lia S • £ • y
ijj! HIji I II
i \ \ Iin iM SM1 i J 1•j a '£ J
|lpf"i|!|I| iPf |i II flifPfi 1 i|f[ II Iff|1 1 11\\l\\ 1* Hill SSSmUSUmSSSiS = s = s s g ||
s S & : > B ' ' -' ' ci
s f 5 ; » ei
Si? i Si s a J =8 E!<_ I. t. 4. I, 4. I. V •
!! ! s ! ! : : sl8? i J 5 i s 5|t, t- t_ V
s S j i i s i J i J ^ c J
is J 5 J « E jI. t- •
£ k 5 ? ? 5 j « ii< - * . < - < . •
• M
5 J S J s 3 :
Il5l5 I? fli B5 .""g*!*!!***"!** 5I« JSS a »i
; j : j » E|
i u; isss; • sss;;:: 3333s; i sss : i i j
i S f i sss s g { |
cc c c
K1
?-
.
;
:,
;
;
.t; >
•
;
5
»i t
•5
,i>
^
•
i

known as the polycyclic aromatic hydrocarbons (PAHs). PAHs are typical ofpertorleum hydrocarbon products such as motor oil. These compounds arehighly immobile and easily adsorbed to organic matter present in soils.Below the drain field, only two semivolatile compounds, bis(2-ethylhexyDphthalate and phenanthrene, were identified in three of the soilsamples. Both compounds were identified in the soil sample from the 8 to10 foot depth in boring TSB-1. Bis(2-ethyhexyl)phthalate was also detectedin the sample from the 6 to 8 foot and 14 to 16 foot depths of boring TSB-2.However, the concentrations were below the CRQL and the results arereported as estimates. No other semivolatile organic compounds weredetected in the soil samples collected from beneath the original drain field.These results clearly indicate that soils affected by semivolatile compoundsare limited to localized areas above thedrin field backfill and are notpervasive in area or with depth. Based on this evidence, soils underlying theoriginal drain field are not contaminated with semivolatile organiccompounds.No PCBs were detected in any of the soil samples. Numerous pesticideswere detected. Pesticides were found at trace levels in the shallow soilsfrom TSB-5 and TSB-6. However, the pesticides detected in the soils belowthe drain field are qualified because the detected concentrations were belowthe CRQL. The lack of pesticides in the soil samples from below the drainfield clearly indicate that the soils underlying the original drain field are notcontaminated with pesticides and PCBs. Affected soils are limited in areaand extent to the shallow soils encountered in SS-2, TSB-5 and TSB-6.
3.2.4 Results for Inorganic Analyses of Soils
Most metals were quantitatively detected in at least one soil sample atconcentrations significantly above associated blank detections (Table 3-2).The shallow soils from SS-2 and TSB-5 and TSB-6 were similar incomposition to the soil samples collected from below the drain field. Thefollowing seven metals were detected in the shallow soils and not detectedbelow the drain field: arsenic, cadmium, calcium, copper, selenium, silver(in only one sample), and sodium (in only one sample TSB-5 two to fourfeet). However, the concentrations of metals detected in the soil samplesfrom above and below the original drain field do not indicate soilcontamination by metals.[Response to USEPA comment: The detection of lead at a concentration of31.8 mg/kg in TSB-2 six to eight foot sample and 23.1 mg/kg in TSB-3 18to 20 foot sample are not considered to be indicative of soil contamination.These concentrations fall within the range of soil lead concentrations foreastern soils (<7 to 300 ppm) (as discussed further in Section Four). ERMdoes not believe that these reported concentrations of lead constitute leadcontamination of the soils by the septic system.]
3-4
RR305U88

tlill
"II
i
!
i
i!
f u
*•
^p w
i
£
**
^
I
\*
••
I"
it
i |
• ft
1 g
! *
I
I
j
; z
393333333 3333333
-j B -, ->
3-113 -> -> 3
5
3 -i -i • 9 -> -»
§a s..«..Ss..9«8eS.s.
- ,i ;..i.. ,,,;....- s x _~
B
~ | ~ g = » » * e
5. g e o°«l « S 2] S Is »»=!= B S
B -»
i» i . ili i 5• B
C ** K S *
•
ih i I- « 2-) B ->
-» • ->
-» B -, ^
5 ?*""**aS«lft«>^«*-^*':'
1 11 1 ihitlllihiiih'E I iiiitZZSSgs-lSiii
•2. 1
333333 3
» O ^SI *
a ffi -> 3
"SB = -> =
~=~as~ 1
.-!•-„ 8«~-1 B
?s S
SI ^i
- s 5 *-1 B
e o «
-J B
C B
£5 S-» B B
2 R S ^
-1 BB
nee
PB3 -,
illlh! i* i.A
, II.3 1fi ; HIJi l.ili
I1 •il -pit1!-1 ^-1 l!|»Wtf
Group
Two of the shallow samples contained cyanide detected at theconcentrations of the Contract Required Detection Limit (CRDL); of thesetwo samples the presence of cyanide was not confirmed between sample SS-2 and its blind duplicate SS-4. Four of the ten deeper soil samplescontained concentrations of total cyanide. However, as indicated in Table 3-2, these results are reported as estimated values since the concentrationswere below the CRDL. The reported concentrations of cyanide detected inthe shallow and deep soil samples are not indicative of soil contaminationfrom this compound.
3.3 Analytical Results for Ground Water Samples
3.3.1 Sample AnalysesGround water samples collected from well TSW-1 were submitted forchemical analyses as indicated below:
TCLVOCs;• TCL semivolatile organic compounds;• TCL pesticides and PCBs; and• TAL inorganic compounds.Analyses were performed in accordance with the USEPA Contract LaboratoryProgram (CLP) Statement of Work (SOW) for Organics (2/88) and the SOWfor Inorganics (7/88).
3.3.2 Data ValidationQuantitative analytical data for the ground water samples were reviewed byan ERM Quality Assurance Chemist trained to evaluate laboratory dataaccording to USEPA protocols described in the document titled LaboratoryData Validation Functional Guidelines for the Evaluation of Organic (andInorganic) Analysis (USEPA Data Review Work Group, 2/88 for Organics and6/88 for Inorganics). The initial step of the data validation consisted of areview of sample documentation, including chain-of-custody forms, trafficreports, analytical reports, and CLP deliverables.A detailed quality assurance review was also performed by an ERM QualityAssurance Chemist to verify the quantitative and qualitative reliability of thedata as reported by the laboratory. The quality assurance review included adetailed review and interpretation of all the data generated by GSAI. TheQAPP Addendum provides a detailed list of items examined during thequality assurance review. A quality assurance report was prepared based
Ths
G5&UR305l(90
upon the review of organic and inorganic data generated during chemicalanalyses of the soil and ground water samples. The quality assurance report,which is presented in Appendix D, addresses both validated and qualifiedanalytical results for the ground water samples.
3.3.3 Results for Organic Analyses of Ground WaterThe results of organic analyses of ground water samples collected frommonitoring well TSW-1 are presented in Table 3-3, including volatile andsemivolatile compounds, pesticides and PCBs. VOCs detected in the twoground water samples collected from well TSW-1 include acetone, 2-butanone, chlorobenzene, 1,1-dichloroethane, 1,2-dichloroethane (total),ethylbenzene, methylene chloride, tetrachloroethene, toluene,trichloroethene, and xylenes. The concentrations for each of these VOCsranged from 3 to 410 micro grams per liter (|J.g/l) in either the sample orthe blind duplicate. Note that the reported results for acetone, 2-butanone,chlorobenzene, 1,2-dichloroethane, ethylbenzene, and xylenes, as indicatedin Table 3-3 and discussed in the quality assurance report (Appendix D), arequalified as quantitative estimates. A discussion of the significance of theVOCs detected in water samples from well TSW-1 relative to the originalseptic system drain field is presented in Section 4.1.A total of 11 semivolatile organic compounds were identified in the groundwater samples collected from well TSW-1. The reported concentrations ofthe individual semivolatile compounds range from 2 p.g/1 to 25 jig/1.However, as indicated in Table 3-3 and discussed in the quality assurancereport (Appendix D), concentrations for five of the semivolatile compoundsidentified in the ground water samples are estimated values at or below theCRQL. The total concentrations for all the semivolatile organic compoundsdetected in the ground water sample and blind duplicate are 113 (ig/1 and95 p.g/1. respectively. The significance of the presence of semivolatilecompounds in ground water relative to the original septic system drain fieldis discussed in Section 4.2.Table 3-3 also summarizes the results of analyses of the ground watersamples for pesticides and PCBs. PCBs were not detected in the groundwater samples collected from well TSW-1. Seven pesticides were detectedin the ground water samples, However, as indicated in Table 3-3 and thequality assurance report (Appendix D), the reported results for eachpesticide are estimated values because the concentrations were below theCRQL. The significance of the pesticides detected in the ground watersamples is discussed in Section 4.2.
3'6 ———— -Q,5op
HR305U9I
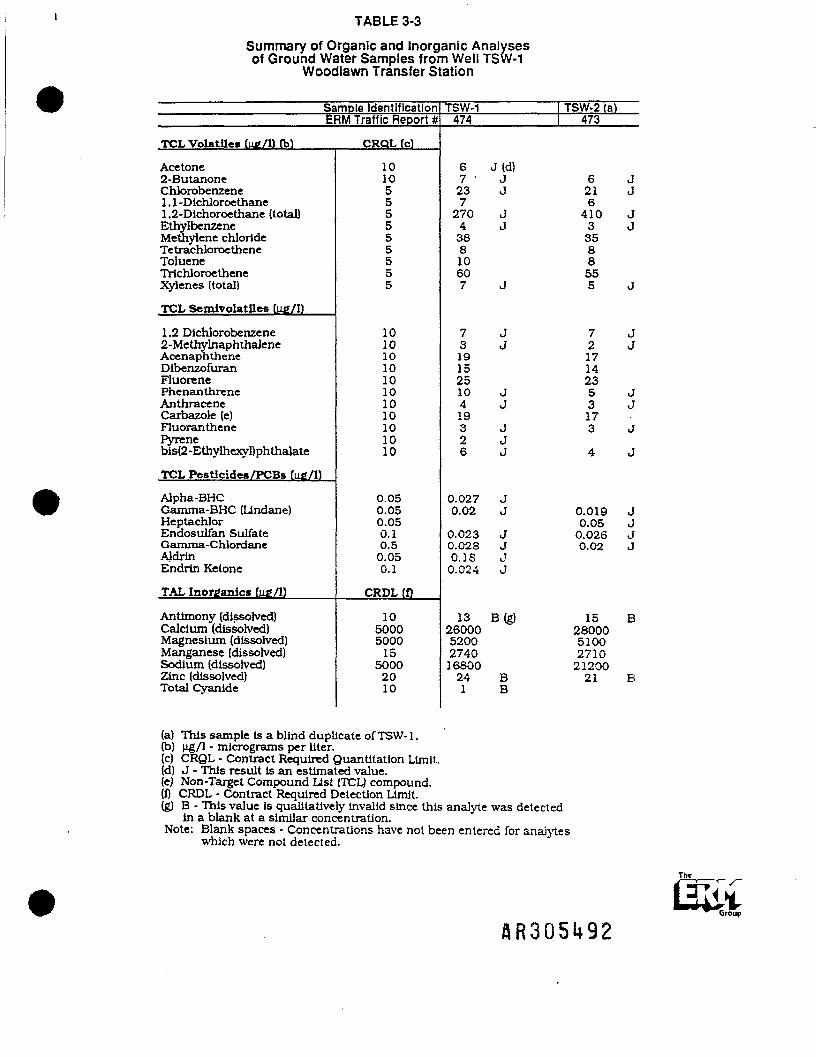
TABLE 3-3
Summary of Organic and Inorganic Analysesof Ground Water Samples from Well TSW-1
Woodlawn Transfer Station
Sample IdentificationERM Traffic Report #
TCL Volatile* (u£/l) (b) CRQL fc)
Acetone2-ButanoneChlorobenzene1 , 1 -Dichloroethane1,2-Dichoroethane (total)EthylbenzeneMethylene chlorideTetrachloroetheneTolueneTrichloroetheneXylenes (total)
TCL Semivolatiles Qifi/l)
1,2 Dichlorobenzene2-MethylnaphthaJeneAcenaphtheneDibenzofuranFluorenePhenanthreneAnthraceneCarbazole (e)FluoranthenePyrenebis(2-Ethylhexyl)phthalateTCL Pestieides/PCBs tuS/1)
Alpha-BHCGamma-BHC (Llndane)HeptachlorEndosulfan SulfateGamma-ChlordaneAldrinEndrin Ketone
TAL Inorganics (ufi/l)
Antimony (dissolved)Calcium (dissolved)Magnesium (dissolved)Manganese (dissolved)Sodium (dissolved)Zinc (dissolved)Total Cyanide
101O555555555
1010101010101010101010
0.050.050.050.10.50.050.1
CRDL (fl
10500050001550002010
TSW-1474
67 '237270438810607
7319152510419326
0.0270.02
0.0230.0280.180.024
13260005200274016800241
J(d)JJ
JJ
J
JJ
JJ
JJJ
JJ
JJJJ
B(g)
BB
TSW-2 (a)473
621641033588555
7217142353173
4
0.0190.050.0260.02
1528000510027102120021
JJ
JJ
J
JJ
JJ
J
J
JJJJ
B
B
(a) This sample is a blind duplicate of TSW-1.(b) |ig/l - micrograms per liter.(c) CRQL - Contract Required Quantltation Limit.(d) J - This result is an estimated value.(e) Non-Target Compound List {TCL) compound.(f) CRDL - Contract Required Detection Limit(g) B - This value is qualitatively invalid since this anaJyte was detected
in a blank at a similar concentration.Note: Blank spaces - Concentrations have not been entered for anaiytes
which were not detected.
Oroup

3.3.4 Results for Inorganic Analyses of Ground WaterThe results for inorganic analyses of ground water samples are presented inTable 3-3. The dissolved metals detected in the ground water samplesinclude calcium, magnesium, manganese, and sodium. Antimony, zinc, andtotal cyanide were also reported in the ground water samples, however, thereported concentrations were determined to be invalid since each of thesewere detected in the associated blank at a similar concentration. Theconcentrations of calcium, magnesium, manganese, and sodium detected inthe ground water samples from well TSW-1 do not indicate contamination ofground water and are considered to be background concentrations for theseanalytes.
3.4 Ground Water FlowOn 27 March 1991, representatives of ERM and IT Corp. measured groundwater levels in several monitoring wells in the vicinity of the original drainfield for the septic system. Wells selected for water level measurements arescreened in the saturated zone of soils overlying bedrock and included TSW-1, which was installed during the investigation of the septic system, andwells F-l, F-2, F-3, F-5, F-6, and F-7, which were previously installed by ITCorp. for Firestone. Ground water elevations calculated from the water levelmeasurements are presented in Table 3-4.Ground water elevation contours in the vicinity of the original drain fieldwere constructed based on the water level measurements from the sevenwells listed above and are presented in Figure 3-2. Based on the 27 March1991 water levels, the direction of ground water flow in the immediatevicinity of the original drain field is from northwest to southeast. Theground water contours indicate that the original drain field for the septicsystem is located hydraulically downgradient of cells B and C, wherepolyvinyl chloride sludge generated by Firestone was placed prior to closureof the Woodlawn Landfill.
The—5
3-7
flR305U93

CD 00 00 O N CO 0000 CS CD N N CO CO§CD 00 N N 00 COo o> o o o o
oCN CD O N CO ~i CO §•<t CN CN CN •* CD — -': CN C5 05 irf CO
CD CN CN CO CN CO •<?
o
&T~to o>
o£g£ CO £0.8
20>— — co •<* co CD in •?• «_ _ c N i n o o o c N 0 5 i n
O W {j to _
>— § =1»« » £
g,
tiOD.
• is CD ^ fe "
a ||f| |f
aJSO
•a wJD COTJ . fl?
3oO
05" -o^^2 o
|o
oer yii' ^ -
- < t o oN L 0c5 dcs cs
ON . m-cZl S7co - oo oo CD 05 in c;23S3CabN in in o o o oo c — Q. h w "o 2O O 0 5 O O 3 0 5 ^ «•£!>£ , J2 W g• » » • • • » ^^ JJ* M^ W ^\___ f^ ??" * CD t»- CD CD " ri.^TJi JJ'i-i 1-
7; £ t. X2 -c re t>?5 T^ CJ O O is P£5 O CC CO »P Q^ 3 .—I
i n i n i n m i n i n i n (u—^ —5 5 5 S 5 5 5 * s - •§! w. o -
g • Islilfi-il^w - co « 05 oo m Isyi^li^g-« 05 CD 05 O5 in O >>!=K>.2«>..£iots co in 05 oo co o b p *" v -; -r v -s wO 05 05 05 05 O5 Oco in in in in in CDCO CO CD CD CD CD CD
5 •? fc •S & '
^i M CO in CD N{i, ti, U, [i, fc< fc
Th<
E 2-0=0 - w e ? I 3T^ UIT" •—••—.—.—. *-, •—, ^^il^'M

Figure 3-2Ground Water Elevation Contour Map
Woodlawn Transfer Station, Cecil County, Maryland
• r-5 /TSW-1407.79 / 405.38
X
LEqENi:> 50 0 50 100 200F-7 ^ Soil Monitoring Well Installed by Firestorm whh 555iS35"''5S ^ ^ J
408.33 Ground Water Elevation (Feet) ——— ^ T~~~~ ^ ^ ^ ^i Scale in FeetTSTA-1 •<,>• Transfer Station Water Supply Well . -TSW-T Q Soil Monitoring Well Installed by Cecil County whh406.38 w Ground Water Elevation (Feet)
' i Original Drain Field for Septic System406"" "Ground Water Elevation Contour (Feet)
^^ . . Source: Adapted trom Fipurt 1 • Silt Base Mas prepares By IT<4f Ground Water Flow Direction Cirsoraoor, ma presents m Pr.ise ll- Site CMracttraation
. _ ,. _ c.;scr. (Revision 0"), fiemeau! InvesSigaaonfftzsiBiliiy Slusy.. 460 -•' Topographic Contour and elevation woosiawn laadfii:. c«=i:County. Maryana, noamtttt isso.
WOt 90407 Drawn by / Date: E. Knopfle 4/4/S1
Revised fay /Pile:
Checked by / Dale: D- Collins 4/5/91
Checked by / Dale:

SECTION FOURDISCUSSION OF RESULTS
4.1 SoilsThe results of the laboratory analyses show a distinct difference in soilquality between the soil samples collected from above and/or within thedrain field backfill (Work Plan Addendum 2) and the soil samples frombelow the drain field backfill (Work Plan Addendum 1). Table 4-1summarizes the results of the soil sampling. PCBs were not detected in anyof the soil samples and are not discussed further.Regarding the VOCs analyses, acetone, ethylbenzene, toluene and xyleneswere detected in the soils above and/or within the drain field backfill. Themaximum detection was total xylenes at a concentration of 1,800 jig/kg; theremaining VOCs were at or below a concentration of 200 |J.g/kg. Of theseVOCs, ethylbenzene, toluene and xylenes are hydrocarbons associated withfuel oils. Conversely, only ethylbenzene and xylenes were detected in thesoil samples collected from beneath the drain field. These two compoundswere detected at maximum concentrations of 1J and 2J, respectively,which are estimated values below the CRQL. No other VOCs were detectedin any of the soil samples.The predominant suite of semivolatiles in the soils above and/or within thedrain field backfill were PAHs of which the maximum detections were fornaphthalene and 2-methylnaphthalene at 560 and 680 M-g/kg. respectively.Below the drain field, however, only bis(2-ethylhexyl)phthaiate andphenanthrene were detected in the soil samples. However, theconcentrations of bis(2-ethylhexyl)phthalate and phenanthrene werereported as estimated values below the CRQL. No other semivolatile organiccompounds were detected in the ten soil samples submitted for laboratoryanalysis from beneath the drain field.Twelve pesticides were detected in the soil samples from the drain field. Ofthese, four were detected in the soils from above and/or within the drainfield backfill. The maximum concentration detected was associated withendosulfan I, which was detected in the range from ND to 490 jxg/kg. Thepesticide concentrations reported for the soil samples from below the drainfield were estimated values because the concentrations were below theCRQLs.The results of the soil organic analyses presented in Table 4-1 illustrate twopoints regarding the soil quality of the drain field. First, the detection ofVOCs. semivolatiles, and pesticides in the soil samples from above and/or
The
fiR305l*96

TABLE 4-1
Comparison of Analytical Results forSeptic Tank Sample and Soils from the Original Drain Field
Woodlawn Transfer Station
Septic Tank(a) Soils Above/Within Soils Beneath Original_____Anaylse*______February 1990 Original Drain Fieldfk)______Drain Field (I)
Organic AnalysesVolatile* (MC/ktfb)Methylene Chloride 4.200 B (c) ND{d) . ND (d)Acetone 3,800 ND-52 15B-105B1,1-Dichloroethane 1.100 ND ND2-Butanonc 2.400 ND 17 B1.1.1-Trichloroethane. 380 J (f) ND NDBenzene 160 J ND NDToluene 70.000 E (g) ND-200 NDEthylbcnzcne 15,000 ND-120 ND - UTetrachloroethylene 160J ND NDXvfcnes (total) 120.000 E ND-1800 ND-2JAcrolein 6.8OO ND ND
SemlTc-l2.4-Dlchlorophenol 4.4OOJ ND ND1.2.4-Trichlorobenzene ND ND-59J NDNaphthalene 13.000 J ND-560 ND2-Methylnaphthalene 3.OOOJ ND-680 NDAcenaphthene ND ND-84J NDFluorcne ND ND-110J NDDiethylphthalate ND ND-55J NDDi-n-butylphthalate 8,400 J ND-150J NDbls(2-Ethylhexyl)phthalate 8.000 J 830B-3000J ND-170JPbenanthrene ND ND-93J ND-41JFluoranthcne ND ND-53J NDPyrene. ND ND-380J NDChrysene ND ND-34OJ NDDi-n-octylphthalate ND ND-5OJ NDBenzD(b)fluoranthene ND • ND-32OJ NDIdcno(1.2.3cd)pyrene ND ND-350J NDBenzolghflpeiylene ND ND-520J NDBenzo(a)pyrene Nb ND-310J ND
Festlcides/PCBs (ni/k£)Aldrln ND ND ND - 1JAlpha-BHC ND ND-26 ND-4.1JBeta - BHC ND ND-32 ND • 6.0 JDelta-BHC ND ND ND-C.EJJGammn - BHC ND ND NT' • 2.€ JAlpha-Chlordane ND 51-140 ND-.<.7J4.4(1) - DOT ND ND ND • 3.2 J4.4(1) - ODD ND ND ND - 17 JDleldita ND ND ND-2.2JHeptachlor ND ND ND - 2.1 JHeptachlor Epoxide ND ND ND • 2.3 JEndosulfann ND 3.7-28OJ ND-16JEndosulfanI ND 4.6-490 NDEndosulfan Sulfate ND ND-150J NDGamma-Chlordane ND 38-230J ND
(a) Septic tank sample collected by IT Corp.. February 1990. and analyzed for modified TargetCompound Ll»t ai per IT Corp. Phaae II work plan. Source of analytical result* - IT Corp.memorandum from V. K. Snvastava to A. M. Jacobs. Project No. 3O3486. dated 6 April 1990.
(b) Mg/kg - mlcrograms per kilogram.(c) B - This value Is qualitatively Invalid since this analyte was detected In a blank.(d) ND - not detected at the detection limit.(e) mg/kg - milligrams per kilogram.(0 This result Is an estimated value.(g! E - Indicates estimated value for the analyte; reported concentration was out of Instrument calibration
range,(h) Duplicate out of control hrmu.(1) N - spike out of control limits.(kl Sod sampks from Work Plan Addendum 2.0} Soil samples from work plan Addendum 1.
AR305U97

TABLE 4-1 (continued)
Comparison of Analytical Results forSeptic Tank Sample and Soils from the Original Drain Field
Woodlawn Transfer Station
Septic Tank(a) Soils Above/Within Soil* Beneath OriginalAnayl«e»(a)_______February 1990_____Original Drain Reld(k)______Drain Reld(l)
Inorganic Analyse*TAL Inorganic. (mft/k«Xe)
Aluminum 9.710 (h) 7780-1O4OO 2.990 -16300Arsenic 133 B.N (i) 4.4J-22.1J NDBarium 313 B 28.9J-83.9J ND - 56Beryllium ND ND-0.6 ND - 2Cadmium ND 0.9-1.1 NDCalcium 31.600 B 370-985 NDChromium 40.7 B 10.2J-23J ND-10JCobalt ND 2.7-4.8 ND - 42Copper 576 (h) 6.4-52.4J ND - 11 BIron 32.000 (h) 10200-15700 3.750-25.600Lead 163 21-86.1 J 6.6-31.8Magnesium 5.540 B 742-1160 ND - 1.500Manganese 432 (h) 61.5J-204J 49 B-3.750 JMercury 272 N (h) 0.04-1.2J ND - 0.1Nickel 27.8 B 4.9-7.6 ND-115Potassium 3,680 B 501-684 ND - 3.630Selenium ND 0.5-0.8 NDSilver ND ND-2 NDSodium 4.110 B ND-691 NDThallium ND ND-1.2 ND-17Vanadium 14.4B 23.1-34.6 3.7 B-85.5 JZinc 1,360 E.N (h) 24.1J-77J 6 B - 138
Total Cyanide ND ND-2 ND-0.18B
(a) Septic tank cample collected by IT Corp.. February 1990. and analyzed for modified TargetCompound Ust as per IT Corp. Phase II work plan. Source of analytical results • IT Corp.memorandum from V. K. Srtvastava to A. M. Jacobs. Project No. 3O3486. dated 6 April 1990.
(b) ng/kg - mtcrograms per kilogram.(c) B - This value is qualitatively invalid since this anahle was detected in a blank.(d) ND - not detected at the detection limit.(e) mg/kg - milligrams per kilogram.(fi This result is an estimated value.(g) E • Indicates estimated value for the analyte: reported concentration was out of instrument calibration
range.(h) Dupbcate out of control kmttt.(1) N-spike out of control limits.(k) Soil samples from Work Plan Addendum 2.(I) Soil samples from work plan Addendum 1.
AR305l*98
within the drain field backfill indicates that the extent and level of affectedsoils is limited to the soils above and/or within the drain field and is notpervasive below the drain field. The absence of the organic compounds inthe soils below the drain field clearly indicates that these soils are notcontaminated. Second, the lack of detections in the soils below the drainfield is evidence of the relative immobility and soil retentive capacity of thecompounds detected in the soils above and/or within the drain field. Giventhe fact that the soil samples from above and/or within the drain field werecollected from areas expected to the most affected by overflows from themanhole, it is clear that any soil degradation is limited in extent andmagnitude.The concentrations of metals detected in the soil samples from above andbelow the drain field are similar in concentrations and range (Table 4-2).Most metals were detected; only arsenic, cadmium, calcium, selenium,silver, and sodium were not detected in the soil samples from below thedrain field. However, the metals concentrations are not indicative ofenvironmental contamination. This conclusion is based upon a comparisonof the concentrations of metals detected in the soil samples withconcentrations of these metals observed in soils throughout the eastern U.S.(Connor and Shacklette, 1975) and typical of native soils (Dragun, 1988)(Table 4-2). As shown in Table 4-2, the concentrations of metals detectedin soils from the drain field fall within the ranges of naturally occurringconcentrations.Table 4-2 also presents a comparison of the analytical results for the samplecollected from the septic tank by IT Corp. in February 1990 with thechemical analyses for the soil samples above and below the original drainfield. A total of 11 VOCs were detected in the septic tank sample. Of these11 VOCs, only acetone, ethylbenzene, toluene and xylenes were identified inthe soils of the original drain field. For the VOCs that were identified inboth the septic tank sample and drain field soils, the concentrations in thedrain field soils were very low relative to those concentrations detected inthe septic system sample.The greatest number of semivolatile and pesticide detections were foundwith the soil samples from above and/or within the drain field. Commonbetween the septic system and samples above and/or within the drain fieldwere naphthalene, 2-methylnaphthalene, bis(2-ethylhexyl)phthalate and di-n-butylphthalate. Pesticides were detected in drain field soils samples;however, no pesticides were detected in the septic tank sample. The metalconcentrations detected in the septic tank sample were much higher thanany of the metal concentrations in the soil samples. However, beryllium,cadmium, cobalt, selenium, silver, and thallium were not detected in theseptic tank sample but were detected in the soil samples. Based on the
Tht
4-2 _ ——— »—GrSiipfiR305l*99

.E « o
~ — C
EUS
n - 2 =
COcO *""* CS ' * CO Cv J* O ^-^ O lO CN CO *->T ' 05 **^^ rv3 n^ Q i C?) C*^ ' ,«o CO>r™^ lO t"1** __J CD i Q CD '
^_ co'MinZQ^^Qiotocp-H'co, • eo Q 2i g
t2-E" " 2 - i g K QV&* & coIV If: >- *•" O5 Q
05 2(N
,
O) QC QCO
O O O N IS O O O O O O O O «* O O (N ID O
*-* rS *-> CN X l Tt l r "• •* iZ i /-s Ui1 u>)O ^ °0 V 2 "?(N- °? 6°^^ •* "A v O ° V O w VV6 6 <i w v in t-.« 8 5 o
£5i §§,W 0> o S''"' O j O O | ICDt^-jO^OOCOcOO' ' ' ICDCO*" £ c 2E O i O X i i c o l O i — l O o i o i ' — i o ! ! ! 'Q. 5 o Q q co °p E ^ 5 co" io cs oo 2 i «o*-
c0>E_oUJ
So
Tht
UEt^ Cirnitn
flR305500

5 .* aC/J U
»s8 .8 •c .
oS a P-o Qcofi a, £< 2
0000
CJ
ow fcb -o o|U. O <T!°o £ a_ ca x « ElJ3 | 6^cj « "3 d0£ -o•a- -o -§» s fII I II
CM O) g to -S w
4 -.S 1 iss |§ § |s03 ,20 rt ° °
I >"cs s y€b rtE5 C HS "^ e•* t) 3u, ij So
C " o fO•2 a elfcS rn 8J Qfl P ^ «5 l« » asM M <4«J C4 *1<U tuO-O O g S°- 3 S £ «^« -a rt <u P >>•H S_ -a fc.jD
co ^ y 13 oTh«
AR30550I Group

analytical data from the septic tank sample it is inconclusive as to whetheroverflow of the manhole resulted in the observed levels of VOCs,semivolatiles, and pesticides in the soils above and/or within the drain field.The evidence presented clearly supports the conclusion that anycontamination is limited to soils above the drain field. The lack of VOCs,semivolatiles and pesticides in the deeper soils attests to the relativeimmobility of these compounds in the soil environment at the TransferStation. Additionally, the trace concentrations, lack of contaminants atdepth, the relatively immobility of pesticides and semivolatiles inunsaturated soils, and the fact that unsaturated soil zone beneath the drainfield is approximately 45 feet thick, supports the conclusion that the drainfield soils do not represent a source of ground water contamination. Theissue of contaminant immobility and lack potential ground water impact issupported by the application of the Summers Model as detailed in SectionFive.
4.2 Ground WaterThe following discussion on ground water quality focuses on the groundwater quality results in comparison to the septic tank sample and theanalytical results for the soil samples collected from beneath the drain field.As discussed in Section 4.1, the limited extent and magnitude of affectedsoils above and/or within the drain field is not pervasive below the drainfield. If the soils above and/or within the drain field did represent a source,it would be expected that the soils below the drain field would exhibitsimilar soil quality characteristics since migration would be vertical.Therefore it is reasonable to conclude that the soils above and/or within thedrain field do not present a source for ground water contamination.Chemical analyses of ground water samples from monitoring well TSW-1show the presence of numerous volatile and semivolatile organiccompounds. The VOCs detected in well TSW-1 include acetone, 2-butanone, chlorobenzene, 1,1-dichloroethane, 1,2-dichloroethane,ethylbenzene, niethylene chloride, tetrachloroethene, toluene,trichloroethene, and xylenes. Based on chemical analyses for ground watersamples that were presented in the Phase II site characterization report forthe remedial investigation (IT Corp., 1990), all of these VOCs have beendetected in ground water samples from well locations throughout thelandfill.The semivolatile compounds that were detected in well TSW-1 include 1,2dichlorobenzene, 2-methylnaphthalene, acenaphthene, dibenzofuran,fluorene, phenanthrene. anthracene, carbazole, fluoranthene, pyrene, and
AR305502
bis(2-ethylhexyl)phthalate. Of the 11 semivolatile compounds that weredetected in well TSW-1, five of the semivolatile compounds, including 2-methylnaphthalene, fluoranthene, phenanthrene, pyrene, and bis(2-ethylhexyl)phthalate, have also been detected in ground water samplescollected from other on-site wells during the remedial investigation. Thepresence of six semivolatile compounds in TSW-1 that were not detected inground water samples collected from other on-site wells cannot beexplained based on the data collected during the investigation of the septicsystem. However, the presence of the semivolatile compounds detected inwell TSW-1 indicates degradation of ground water flowing beneath theseptic system.[Response to USEPA comment: Second ground water sample for TSW-1 aspart of Work plan Addendum 2 was eliminated with the approval of theUSEPA.]All of the seven pesticides detected in the ground water samples from wellTSW-1 were detected at concentrations below the CRQL. Two of the sevenpesticides, namely alpha-BHC and heptachlor, were also detected in otheron-site wells during Phase II of the remedial investigation. The pesticides4,4'-DDT and endosulfan I were detected in other wells during Phase II ofthe remedial investigation, but not in well TSW-1.Four of the seven pesticides detected in TSW-1 (i.e., alpha-BHC, gamma-BHC, heptacnlor and aldrin) were also detected at very low concentrationsin soil samples from below the original drain field. However, three of thepesticides identified in the ground water samples from TSW-1 were notdetected in soils below the drain field. Although some of the samepesticides were identified in both soils and ground water below the septicsystem, it is unlikely that the drain field soils are the source of thepesticides observed in well TSW-1. This conclusion is based on thefollowing:
• the concentrations of pesticides identified in the soils beneath thedrain field were all below the CRQL:
• three of the pesticides identified in well TSW-1 were not found in thesoils samples from beneath the drain field;
• pesticides are relatively immobile in unsaturated soils;• the thickness of saturated soils between the drain field and the water
table is approximately 45 feet; and• several of the pesticides observed in well TSW-1 have also been
observed at other well locations in the landfill.
4-4 .__ . . ——^-Qr55pAR3Q5503
The ground water samples from TSW-1 did not show the presence of anyPCBs or dissolved metals of concern. Therefore, ground water in thevicinity of the original drain field for the. septic system has not beencontaminated by these analytes.A significant observation based on the chemical analyses of the ground watersamples from TSW-1 is that most of the volatile and semivolatile organiccompounds detected in well TSW-1 differ from the compounds detected inthe nearest monitoring wells that are also screened in the saturated zone ofsoils overlying bedrock. The nearest wells to TSW-1 include F-l, F-2, F-3,F-5, F-6, and F-7, which are all located within approximately 300 feet ofTSW-1. Table 4-3 presents a comparison of organic and inorganic analysesfor well TSW-1 and the referenced F-series wells. Based on the datacollected during the investigation of the septic system, it is not clear whythe water quality data for well TSW-1 and the referenced F-series wellsshow such significant differences in the organic compounds detected.However, it is clear that the differences in water quality are not due to soilsin the original drain field since those soils beneath the drain field were notcontaminated with the organic compounds detected in the landfillmonitoring wells.The conclusion that the organic compounds observed in ground waterthroughout the landfill are not the result of infiltration of liquids dischargedthrough the septic system is supported by the direction of ground waterflow in the vicinity of the septic system and the east side of cells B and C. Asshown previously in Figure 3-2, ground water flow in the vicinity of theseptic system is from northwest to southeast. This flow direction indicatesthat ground water is flowing from areas of the landfill that are hydraulicallyupgradient of the septic system. The nearest source area hydraulicallyupgradient of well TSW-1 includes cells B and C where Firestone disposed ofpolyvinyl chloride sludges. It is also possible that the ground water qualityobserved at well TSW-1 may reflect other possible source areas located tothe northwest of cells B and C.Furthermore, the thickness of unsaturated soils separating the drain fieldand the water table in the soil aquifer is approximately 45 feet.Consequently, the analytical results for the soil samples coupled with athickness of approximately 45 feet of unsaturated soils separating the drainfield and the water table in the soil aquifer indicate that the drain field soilsare not a source area for contaminants observed in ground water samplescollected throughout the Woodlawn Landfill during Phase II of the remedialinvestigation.
The
AR30550U

1. azz«5zzzzzz'zz$ac zzzzzzzzzzzzz
•5CCCCCOCCCC2O ccccaccccccccNZZZZZZZZZZ-.Z ZZZZZZZZZZZZZ
w £
_j e>r."2 203 " •*• "-
to -o>
"5—
ET
i
2z-zzzzzzzzzz
ZNZ-ZZZZZZZZZ ZZZZZZZZZZZZZ S 'g
znzzzzzzzzzzz •§.Eg
czzzzzzzzzzzz
~ N. 0 "5 «0 m 0 0 C -5N c e
•5.•i o
1 i
(0
III ill!51 8 I l^c .1^18.3 ^. "3 u£ o £ 5c2l!'^^i'e»>".. i - s J = e § »i — -Sis^E^S ^ " C " O ^ l'--"'^"*'"^! ^"H.*^5^J5 0 2
E wl^feif J'S'S •S-e -el'a" § = -»g J^S2j,"«&l^ !§Jii£l |!s llwfjl js?| Ifjsfl^jS«jgs^ig'o|S^i)£l5B I."3**! " >x 8 c " "^ "c 5 ~ • ' *• 5:^
Th«
AR305505<Group

N.LL
1i_ aSoo _
S" — a.-2 li-ej *""'~3
a3uj "OS=f e °>SZ2 CSSS2 P8 V|si *
"
ET
°. zzzzzz zzogzSzZcizE^icc2- S° 6 «
C Q.Q.2cccocca ccgSSSooSRS^Q Dzzzzzzz zz-^q^Saj^SK^z z
6 d°d
— a x gNg~-_OpOpO--.h.* S?— — £3P.£?P<s"S7?s53P PZZZZZZZ «20®2»ZQ-5S«2 2
0 d°d.un
zzzzzzzM a o
3 "o•a«=• "O
____ ^S^^ oj^He^^ Sizzzzzz zzo£ z^z^o^S^z z -3.
d q Ed 5
a
d
"• — ir Ui S — C=S2Sr£sPC?P Q
OJ o
s.1zzzzzzz zz — O.ZCH^RZZ^. z z ^j — c
P- cJ°d° - ^ "HJ?I ^fc
e a n a f f |8§»S c2QoeQQQg?PD^S r 2 | o 5.XX — S zSZ«2fcz".jZ2T:S5 X C 3 — Vl =O u •*
O O•33 3 *i" rt « J2 "o4| E re :>-, £ o.0.3 3236-
8 5 ^1 § I -s IIi=l lllih ,liHl ^ I1.Z-.MZB
Th
Group
AR305506

SECTION FIVESUMMERS MODELING RESULTS
5.1 Methods
5.1.1 Linear Partitioning Mode!A linear partitioning model was used to determine soil dependent leachableconcentrations for all chemical constituents detected in the soil samplescollected above and/or within the drain field as part of Workplan Addendum2. The linear partitioning model, referred to as the Summers Model,describes the mass transport of specific contaminants between phases (ie:soil and water) as a function of adsorption. In determining teachableconcentrations several conservative assumptions are made:
• The origin of detected pollutants is an infinite source;• No mass is lost via degradation, volatilization, or otherprocesses:• The water accounting for aquifer recharge beneath the transfersite has infiltrated and desorbed contaminants based onequilibrium soil:water partitioning.
The following equation was used to calculate teachable concentration:
Ci = Cs / KDwhere:
Q = contaminant concentration in groundwater (mg/1)Cs = contaminant concentration in soil (mg/kg)
= distribution coefficient (I/kg).
The distribution coefficient, KD, is used to account for contaminantretention due to sorption on to the soil matrix. KD is defined for specific
Thf
flR305507r p

pollutants as the ratio of concentration of pollutant sorbed onto the soilmatrix vs. concentration of pollutant in solution.
For organics and pesticides KD can be determined from KQC (the partitioningcoefficient for a contaminant normalized to the soil organic carbon content),and foe. the fractional percentage of organic carbon in the soil. The value offoc, is derived from the site-specific measured values for Total OrganicCarbon. The equation is as follows:
KOC * focwhere:
KOC = organic carbon partitioning coefficient (I/kg)foc = fraction of organic carbon in soil.
When dealing with inorganics, such as metals, KD * KoC * foc- Instead,values are dependent on preferential attractions between anions and cations.Because no direct correlation between organic carbon and KD can beidentified for inorganics it is necessary to use empirically derived KD valueswhich have been generalized for a certain range of soil types. Actual KDvalues are typically site-specific correlating most strongly with the amount ofsurface area present. Moreover, many metals in aqueous solution exhibit athreshold at which sorption increases sharply with increasing pH.Therefore, generalized values might not reflect accurately the leachingprocess at the site.
5.1.2 DilutionIn order to determine ground water concentrations at a downgradientlocation, it is necessary to consider the anticipated dilution of contaminantsentering groundwater via leaching. This is accounted for by combining thederived leachate concentrations with a dilution factor that has been derivedfor a particular site:
Cgw = Ci * DFwhere:
5-2
AR305508
Cgw = ground water concentration (mg/1)DF = dilution factor
The dilution factor is calculated from mass balance principles using flowrates for incoming leachate and groundwater:
DF = (Qgw + Qi) / Qi
where:Qgw = ground water flow (ft3/yr)Qi = leachate flow (ft3/yr).
To determine the rate at which groundwater, Qgw, and leachate, Qi, areflowing into the system a number of parameters describing the physicalcharacteristics of the site are taken into account. Assuming a unit width ofaquifer, horizontal groundwater flow is dependent on hydraulic conductivity,gradient, and saturated thickness of the aquifer. The introduction ofleachate moving vertically into groundwater depends on the length of thecontaminant site in the direction of groundwater flow and the leachategeneration rate. To determine the rate of groundwater flow the followingequation was used:
Qg^ = K * i * b * wwhere:
K = hydraulic conductivity (ft/yr)i = gradient (ft/ft)b = aquifer thickness (ft)w = site width (= 1 foot).
5-3
AR305509
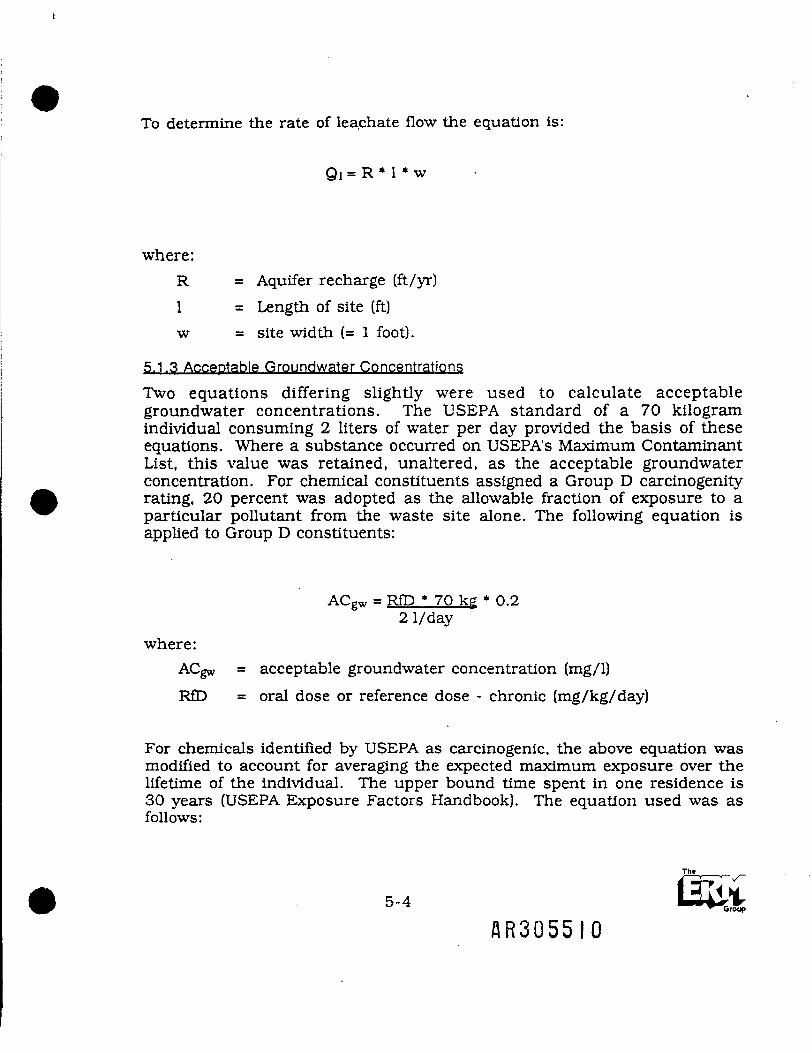
To determine the rate of leachate flow the equation is:
Qi= R* 1 * w
where:R = Aquifer recharge (ft/yr)1 = Length of site (ft)w = site width (= 1 foot).
5.1.3 Acceptable Groundwater ConcentrationsTwo equations differing slightly were used to calculate acceptablegroundwater concentrations. The USEPA standard of a 70 kilogramindividual consuming 2 liters of water per day provided the basis of theseequations. Where a substance occurred on USEPA's Maximum ContaminantList, this value was retained, unaltered, as the acceptable groundwaterconcentration. For chemical constituents assigned a Group D carcinogenityrating, 20 percent was adopted as the allowable fraction of exposure to aparticular pollutant from the waste site alone. The following equation isapplied to Group D constituents:
ACgw = RfD * 70 kg * 0.22 I/day
where:ACgw = acceptable groundwater concentration (mg/1)RfD = oral dose or reference dose - chronic (mg/kg/day)
For chemicals identified by USEPA as carcinogenic, the above equation wasmodified to account for averaging the expected maximum exposure over thelifetime of the individual. The upper bound time spent in one residence is30 years (USEPA Exposure Factors Handbook). The equation used was asfollows:
The
AR3055IO

= Oral Dose * 70 kg * 70 vrs2 I/day ' 30 yrs
For contaminants classified as carcinogenic it was necessary to calculate oraldose values from given slope factors. These factors, previously called cancerpotency factors, are estimated through the use of mathematicalextrapolation models. The risk is characterized as an upper-boundaryestimate with regard to human risk. The conversion to an oral dose value isas follows:
Oral dose = 1 .OOE -06CPF
where:CPF = cancer potency factor ((mg/kg/day)-1)
It must be noted that the acceptable ground water concentrations derivedherein represent worst case assumptions with regard to exposure, andshould be used for screening purposes only.
5.2 Data
5,2,1 Total Organic CarbonThe total organic carbon for the Woodlawn transfer site was derived fromthe Soil Analytical Results dated 20 February 1992. The TOC values for thefive soil samples were averaged and a value 0.014 or 1.4% was concluded.
5.2.2 Kg-. K . and SourcesFor organics and pesticides KQC values were taken from the Superfund PublicHealth Evaluation Manual (SPHEM). Where values were absent for particularcontaminants the Groundwater Chemicals Desk Reference was used tocalculate KOC- The KOC values were then used to calculate KD for eachorganic substance. When dealing with inorganics KD values were takendirectly from either the Oak Ridge National Laboratory (ORNL) paper no.5786 or Baes et al. 1984. Table 5-1 lists KOC values for organics and
Th«
5-5 ———»—Groop
fiR3055lI

Chemical Name
TABLE 5-1SUMMERS MODEL PARAMETERSWOODLAWN TRANSFER STATION
Koc
1 (ml/g)
Volatile Organic
Acetone
Toluene
Ethyfbenzene
Xylene (total)
Swnlvelatlle Organic
1 ,2,4-Trichlorobenzene
Naphthalene2-Methylnaphthalene*
DlmethylphthalateAcenaphtheneFluorine
DiethylphthalatePhenanthrene"
Di-n-butylphthalate
Fluoramhene
Pyrene
Chryiene
Bis(2-ethylhexyl)phthalateD!-n-ociylphthalate
Senzo(b)lluoranthene&enzo(a)pyrene
lndenon,2.3-cd)pyrene
Benzo(g,h.l)perylene*
Pesticide*
Alpha-BHC
Beta-BHCEndotultan I"EndoeuHan II"
Endosulfan Sulfale"
Alpha-Chlordane**'Gamma-Chlordane*"
2.20E.OO
3.00E-c02
1.10E»03
2.40Ef02
S.20E+03
1.28E»03
7.40E»03
4.07E+01
4.60Ef03
7.30E»03
1.«2E*081.40E»04
1.70E»05
3.80Et-04
3.80E*04
2.00E»05
1.00E+05
9.77E»06
5.50E*05
5.50E.06
1.60E.06
1.60E»06
3.80Ef03
3.80E»03
2.04E»03
2.34E1-03
2.34E»03
3.70E-05
3.70E»05
Kd
Source (ml/g) Source
Pl r>i
SPr
SR-B«
SPHEM
SPH9JI
avov
SPHEM
SPrBd
SP B«epL aji
SPr»l
SP B/
SPHB4
SPHEM
avQV
SPHEM
SPHEM
SPH=M
SPHEM
SPHSM
SPHEM
SWEM
ovavavavav
3.08E-02
4.20E«-00
1.S4E«01
3.36E->-00
1.29Ef02
1.80E»01
1.04E+02
S.70E-01
6.44E*01
1.C2E»02
1.99E-00
1.96E*02
2.38E*03
S.32E*02
5.32E»02
2.80E»03
1.40E»03
1.37E»07
7.70E*03
7.70E»04
2.24E-.-04
i.24E»04
5.32E*015.32E-01
2.86E»01
3.28E-01
3.28E.01
5.18E-C3
5.18E.03
Chemical Name Koc ! Kd
(ml/B) Source
Inorganic*
Aluminum
Antimony
Artenic
Barium
Beryllium
CadmiumCalciumChromium
CobaltCopperIronLeadMagnesium
ManganeseMercury
NicklePotatvium
Selenium
SilverSodium
i
(ml/g)
1.50E.03
4.SOE*012.00E»02
6.00E»01
6.50E*OJ
6.40E4.00
4.10E*00
8.50E»02
4.70E»01
3.50E»01
2.50E-01
4.00E+02
4,60EfOO
6.50E.01
1.00E-01
1.50E*02S.6CIE-OC
3.0CIE.02
4.60E.01
1.00E+02
Source
BAES
OflNL
MES
BAES
BAES
OHM.
OFN.
BAES
OHM.
OFN.
CfTL
OFN.
CRN.
cm.BAES
BAES
OFN.
BAES
OFN.
CfN.
Thallium 1.50E»03 ORN.
Vanadium ; 1.00E»03
Zinc | 4.00E»01
Cyanide (tree)
I
BAES
BAES
I i i i
Group
AR3055I2

Chemical Name
norganiea
Aluminum
Antimony
Arsenic3«rium
Beryllium
CadmiumCalcium
Chromium
Cobali
Copp«r
Iron
Lead
Magnesium
Manganese
Mercury
Nickle
PolaulumSelenium
Silver
Sodium
ThalliumVanadium
Zinc
Cyanide (1r»«)
Koc
(ml/8)
1
Sourc*
Table 5-1 (cont.)
Kd I
(ml'g) Source
1.50E*03
4.50E+01
Z.OOE»02
6.00E«01
6.50E»02
6>OE»00
4.10E+00
8.50E»02
4.70E*01
3.50E*01
2.50E-01
4.00E»02
4.60E-I-00
6.50E*01
LODE-cOl
1.50E.02
5.60E.OO
3.00E4.02
<.60E»01
1.00E»02
1.50E+03
1.00E»03
4.00E»01
BAES
CflN.
BAES
BAES
BAES
CRN-
Cm.
BAES
CRN.
CRN.
OFN.
CRN.
OfW.
ORNL
BAES
BAES
CRN.
BAES
CRN.
ORNLOflN.
BAES
EAES
Chemical Name Koc
(ml/0)
.
I
Source
Kd
(ml/B)
I
I
Source
flR3055!3Group

pesticides, KD values for all contaminants, and the sources from •which theywere derived.
5.2.3 HydrologyA number of parameters describing the physical characteristics of the sitewere necessary to our calculations.• Hydraulic conductivity - The K value for the Woodlawn Transfer site was
derived from data collected by IT Corp. A uniform value of 7254.61ft/year was calculated from min-max hydraulic conductivity estimatesfor the local aquifer. The reported estimates ranged from 27.9 ft/yr to14,481 ft/yr.
• Gradient - The i value was calculated based on ground water elevationmap presented in Section Three.
• Aquifer thickness - The saturated thickness of the aquifer, b, was takenfrom IT and approximated 'by ERM. The aquifer is comprised of twogeologic units, overlying unconsolidated saprolite and underlyingfractured gniessic granite and metadiorite, acting as one aquifer system.A conservative value of 65 feet was adopted as the uniform aquiferthickness. This b value, representative of the saprolite alone, suggests aworst case scenario involving a single, limited aquifer.
• Aquifer Recharge - The rate of recharge was taken from IT Corp. as 10inches/year.
• Site length - A conservative length of 100 feet was selected for theseptic system drain field.
The above values were used to calculate anticipated downgradient groundwater concentrations. These results are presented in Table 5-2.
5.3 Modeling Results
5.3.1 ConcernsThe purpose of the modeling exercise was twofold. The first objective wasto obtain additional data for the evaluation of the Transfer Station septicsystem as a potential source for contaminants detected in the local aquifersystem. Secondly, the exercise was conducted in an effort to evaluate thepotential risks to human receptors from ingestion of ground water that mayhave been contaminated as a result of liquid discharges from the septicsystem to surrounding soils.
The
5-6AR3055IU

TABLE 5-2RESULTS OF SUMMERS MODELWOODLAWN TRANSFER STATION
Chemical Name
Volatile Organic
Max. Detect Max. Detect Kd lAccept GW ConJ(mg/kg) (ml/g)
Acetone I 5.20E+01TolueneEthylbenzene
2.00E+021.20E+02
Xylene (total) 1.80E+03I
S»mlvol*tlle Organic
1 ,2,4-TrlchlorobenzeneNaphthalene2-MethylnaphthaleneDimethylphlhalateAcenaphtheneFluorineDlethylphthalate'henanthreneDl-n-butylphthalateFluoranthene
5.90E+015.60E+026.80E+024.80E+018.40E+011.10E+02
5.20E-02 3.08E-022.00E-01 4.20E+001.20E-011.80E+00
5.90E-02
1.54E+013.36E+00
1.29E+025.60E-01 1.80E-*-016.80E-014.80E-028.40E-021.10E-01
5.50E+01 5.50E-022.00E+021.50E+025.30E+01
2.00E-011.50E-015.30E-02
Pyrene 3.SOE+02 3.80E-01
1.04E+025.70E-016.44E+011.02E+021.99E+001.96E+022.38E+03
Calc. Cgw(mg/l) (mg/l)
7.00E-011.00E+007.00E-011.00E+01
9.17E-032.80E-02
1.48E-024.17E-046.82E-054.69E-03
4.01E-062.72E-04
2.80E-02 5.74E-055.60E+00 7.37E-044.20E-014.20E-015.60E+002.80E-02
1.14E-059.42E-062.42E-048.93E-06
7.00E-01 5.51E-075.32E+02 i 2.60E-01 ' 8.72E-07;.o£c- Jd 2.10E-01 i 6.25E-06
Chrysene 3.40E-02 3.40E-01 2.80E-r03 , 1.61E-03 • 1.C6E-06Bis(2-ethylhexyl)phthalateDl-n-octylphthalateBenzo(b)(!uorantheneBenzo(a)pyrenelndeno( 1 .2,3-cd)pyrene3enzo(g,h,l)perylene
Pesticides
Alpha-BHCBeta-BHCEndosulfan IEndosulfan IIEndosulfan SulfateAlpha-ChlordaneGamma-Chlordane
3.00E+03 S.OOEi-00 1.40E+03 1 7.00E-01 1.87E-055.00E+01 5.00E-02 1.37E+07 i 1.63E+00 3.20E-113.20E+02 | 3.20E-013.10E+02 3.10E-013.50E+02 3.50E-015.20E+02
2.60E+013.20E+014.90E+022.80E*021.50E*021.80E 02
5.20E-01
2.60E-023.20E-024.90E-012.80E-011.50E-011.80E-01
7.70E+03 I 5.07E-057.70E+04 7.10E-062.24E+042.24E+04
2.66E+013.92E+012.86E+013.28E+013.28E+01
3.06E-052.80E-02
2.00E-042.00E-043.50E-043.50E-043.50E-04
3.64E-073.52E-081.37E-072.03E-07
8.55E-067.14E-061.50E-047.47E-054.00E-05
5.18E+03 • 2.0CE-03 i 3.04E-072.30E+02 : 2.30E-01 5.18E+03 2.00E-03 ' 3.88E-07
,
AR3055I5 Group

Chemical Name
Inorganics
AluminumAntimonyArsenicBariumBerylliumCadmiumCalciumChromiumCobaltCopperIronLeadMagnesiumManganeseMercuryNlcklePotassiumSeleniumSilverSodiumThalliumVanadiumZinc
Table 5-2 (cont.)
Max. Detect Max. Detect Kd
i
Accept GW Con.(mg/kg) (ml/g) (mg/l)
Calc. Cgw(mg/l)
I :
1.04E+048.30E+002.21 E+018.39E+016.00E-011.10E+009.85E+02
1.04E+048.30E+002.21E+018.39E+016.00E-01 '1.10E+009.85E+02
2.30E+01 2.30E+014.80E+005.24E+011.57E+048.51 E+011.16E+032.04E+021.20E+007.60E+006.84E+028.00E-012.00E+006.91E+021.20E+003.46E->-01
4.80E+005.24E+011.57E+048.61E+011.16E+032.04E+021.20E+007.60E+006.84E+028.00E-012.00E+006.91 E+021.20E+00
1.50E+034.50E+012.00E+026.00E+016.50E+026.40E+004.10E+008.50E-r024.70E+013.50E+012.50E+014.00E+024.60E+006.50E+011.00E+011.50E+025.60E+003.00E+024.60E+011.00E+02
2.03E+012.80E-035.00E-021.00E+001.75E-015.00E-03
1.00E-017.00E-052.00E-01
5.00E-02
6.07E-021.61E-039.67E-041.22E-028.08E-061.50E-032.10E+002.37E-048.94E-041.31E-025.49E+00
' 1.88E-03i 2.21 E+00
7.00E-012.00E-031.40E-01
5.00E-025.00E-02
2.75E-021.05E-034.43E-041.07E+002.33E-053.80E-046.05E-02
1.50E+03 i 5.60E-043.46E-01 1. US-OS 4.PCE-02
7.70E*01 7.70E-01 4.C..i-01 1.40E-.-00
7.00E-063.03E-C41.68E-02
Cyanide 2.00E+00 2.00Ei-00 | 1.40E-02
Th«-
Group
AR3055I6

In modeling the transport of soil contaminants through the soil and waterphases a worst case scenario was applied. Wherever a range of values wasencountered or an expert opinion was required a decision was often made toadopt the most conservative value within reason. USEPA standards andmethodologies were applied to the modeling exercise whenever possible,and most certainly where required. The conservative approach was followedas a balance to the empirical uncertainties intrinsic to many of the variableswhich were employed. In certain cases, such as lateral dispersivity, valuescould be made to reflect a worse case by two and three times with nosignificant implications.The calculated maximum ground water contaminant levels which wereobtained from the modeling process were compared to the acceptableground water concentration for each of the chemical constituents identified.Acceptable ground water concentrations were calculated following standardUSEPA methods and conservative exposure assumptions.
5.3.2 ResultsContaminant concentrations reported by the model were significantly lowerthan the calculated acceptable groundwater concentrations, often by severalorders of magnitude. A comparison of these values are shown in Table 5-2.This suggests that the pollutants associated with the liquid discharged theWoodlawn Transfer station pose little risk to human health throughingestion of groundwater extracted off-site. Furthermore, many of thecontaminants detected in the monitoring well are not detected in the soilsamples. Inversely, a number of the chemicals noted in the soil sampleswere absent from the groundwater samples. The modeling resuiis indicatethat the soils in the drain field can not be explicitly cited as a significantcontributor to ground water contamination. In fact, the modeling resultsindicate that the drain field soils are unlikely to pose a threat resulting inground water contamination.
Tht
5-7flR3055!7
3511Group

SECTION SIXCONCLUSIONS AND RECOMMENDATIONS
6.1 Conclusions• Soils above the drain field are degraded of limited extent and
magnitude. Trace levels of VOCs, semivolatiles and pesticides werefound in soil samples from the surficial six inches, and from the two tosix foot sampling interval. All of these samples were from within orabove the drain field backfill.
• Soils below the original drain field for the Transfer Station septicsystem are not contaminated with volatile and semivolatile organiccompounds, pesticides, PCBs, or metals. Consequently, the septicsystem is not a source area for the organic and inorganic contaminantsobserved in ground water during Phase II of the Woodlawn Landfillremedial investigation.
• Contaminant concentrations projected by the Summers Model weresignificantly below calculated acceptable ground water concentrations,often by several orders of magnitude. Based on the modeling results itis unlikely that the drain field soils, either above or below the drainfield, are a potential source of ground water contamination.
• The direction of ground water flow in the vicinity of the TransferStation septic system is from northwest to southeast, whichdemonstrates that the septic system drain field is hycraulicallydowngradient of at least one known source area of the WoodlawnLandfill, specifically cells B and C.
• Some volatile and semivolatile organic compounds detected inrepresentative ground water samples from beneath the septic systemare different from those detected in other monitoring wells closest tothe septic system. However, the differences in the organiccompounds detected in the septic system well (i.e., TSW-1) versus theclosest monitoring wells (i.e., F-l, F-2, F-3, F-5, F-6, and F-7) cannotbe attributed to soils in the vicinity of the original drain field since thedrain field soils are not contaminated.
• Based on the chemical data obtained during the investigation of soilsthat formerly received discharges of liquids from the Transfer Stationseptic system, additional investigation of soils in the vicinity of theoriginal drain field for the septic system is not necessary.
"V"|3T<6-1
AR305518

6.2 RecommendationsBased on the results presented in this report, no further investigation orremediation of soils in the vicinity of the original drain field for the TransferStation septic system is necessary.
The
R-*7
AR3055I9

REFERENCES
Connor, J. J., and Schaklette, H. T., 1975.' Background Geochemistry ofSome Rocks, Soils, Plants, and Vegetables in the Conterminous UnitedStates, U. S. Geological Survey, Professional Paper 574-F.
IT Corporation, 1990. Phase II - Site Characterization Report, RemedialInvestigation/Feasibility Study, Woodlawn Landfill, Cecil County, Maryland.Revision 01, 19 November 1990.
Resource Applications, Inc., 1988. Potentially Responsible Party Search,Woodlawn Landfill Site, Cecil County, Maryland. Prepared for the U. S.Environmental Protection Agency, Region III. 15 December 1987,revised 13 January 1988.
Rummel, Klepper and Kahl Consulting Engineers, 1976. Layout Plan,Woodlawn Transfer Station, Cecil County Maryland. Contract Drawingsissued 1 February 1991, Sheet 1 of 13.
Rummel, Klepper and Kahl Consulting Engineers, 1976. Structural Plans,Woodlawn Transfer Station, Cecil County Maryland. Contract Drawingsissued 1 February 1991, Sheet 4 of 13.
USEPA, 1988. Laboratory Data Validation Functional Guidelines for theEvaluation of Organic (and Inorganic) Analysis. USEPA Data Review WorkGroup, 2/88 for Organics, and 6/88 for Inorganics.
AR305520
APPENDIX AUSEPA LETTER 30 MAY 1991
Group
AR30552I

UNITED STATES ENVIRONMENTAL PROTECTION AGENCY ,.REGION III ^ 1991
841 CHESTNUT BUILDINGPHILADELPHIA, PENNSYLVANIA 19107
May 30, 1991
Mr. Barry BelfordDirectorCecil County Department of Public WorksRoom 308 Court HouseElkton, Maryland 21921
Re: Woodlawn Transfer Station Septic System Drain FieldInvestigation (April 11, 1991), Cecil County, Maryland.
Dear Mr. Belford:
EPA has reviewed the Woodlawn Transfer Station Septic SystemDrain Field Investigation Report submitted by ERM on April 11,1991, and has concluded that additional investigation is requiredin order to adequately characterize the nature and extent ofcontamination in the vicinity of the septic system, and to attemptto verify the source of the contamination found in the ground watersamples collected from monitoring well TSW-l. Our conclusion isbased upon the following information:
Sampling conducted by EPA's oversight contractor on January24, 1991, showed elevated levels of seven semivolatile organiccompounds in a soil sample obtained from the 6-8' interval ofboring TSB-1 (head space analysis results: PID peak 6.2 ppm,sustained 5.7 ppm) (see attached Table 1.0). Boring TSB-1 wascompleted in close proximity to the manhole at the head of the olddrain field where alleged overflow of septic system fluids occurredprior to modification of the septic system in May 1990.
As documented in the drilling log presented in the Report,field screening of soil samples revealed substantially elevatedlevels of volatile organic compounds at the 2-4' interval of TSB-1 (head space analysis results: PID peak 29.8 ppm, sustained 28ppm); no sample from the 2-4' interval was submitted to thelaboratory for quantitative analysis.
Six of the seven volatile organic compounds detected in thesoil sample collected by EPA's oversight contractor (the samplefrom the 6-8' interval of TSB-1) were also detected in the groundwater samples obtained from monitoring well TSW-l. Only one of theseven compounds was detected in the soil sample selected by ERM forquantitative analysis, i.e., the sample from the 8-10' interval ofTSB-1 (head space analysis result: PID 0.0 ppm). These findings,results of head space analyses, and field observations noted in the
AR305522

drilling log suggest that samples from areas of significant soilcontamination were not submitted to the laboratory for quantitativeanalysis.
The comments that follow reflect EPA's concerns regardingfield procedures and execution of the Report:
According to the ERM's Work Plan Addendum dated December 21,1991, selection of soil samples for quantitative chemical analysiswas to be based upon the following criteria:
Two samples from each boring will be collected andsubmitted for laboratory analyses.
1. In each boring, the first soil sample from the two footinterval immediately below the sand or gravel fillsurrounding the drain lines will be submitted forlaboratory analysis. Since the landfill site wasformerly a sand and gravel operation,it is possible thatsome native soils beneath the drain lines may consistprimarily of sand and gravel. If sand and gravel isencountered below the drain lines, the first soil samplecollected for laboratory analysis will be obtained fromthe depth at which soils that consist predominantly ofsilt and/or clay are first encountered.
2. Selection of the second soil sample from each boring tobe submitted for laboratory analysis will be based uponeither of the following criteria:
a. any visual or readily observable evidence ofpotential contamination, including unusual color,staining, or odors; or
b. detection of VOCs above background soil conditionsbased upon field screening with an OVA, in whichcase the sample from the interval of the boreholethat has the highest OVA measurement will besubmitted to the laboratory.
If both criteria are met, the sample from the deepest intervalof the boring that meets one of these criteria will beselected for laboratory analysis.
In the event that visual observations or OVA fieldmeasurements indicate a lack of potential contamination belowthe drain lines, the sample obtained from the deepest intervalof the soil boring will be submitted as the second sample.
EPA is concerned that these criteria were not consistentlyapplied, in particular with respect to TSB-1. Application of thescreening criteria suggests selection of the following samples fromTSB-1 for quantitative chemica} analysis:
AR305523

First sample: 6-8' interval, based on criterion 1 above(assuming that the black gravel observed in the 4-6' intervalis indicative of drain line backfill).
Second sample: 4-6' interval, based on criterion 2a(observation of septic odor); or 2-4' interval based oncriterion 2b (elevated VOCs detected during field screening).
Both of the intervals selected for analysis appear to beundisturbed saprolite without evidence of staining or elevated headspace readings. However, since a lack of potential contaminationwas not indicated in soils from boring TSB-1, it is not clear whythe default sample, i.e., the sample from the deepest interval ofthe boring was submitted to the laboratory.
Similarly, black staining was evident at the 4-6' interval ofborings TSB-2 and TSB-3. No staining was recorded in the soilsbelow this interval and no elevated PID readings were recorded.samples from the 4-6" interval of each of these borings wouldreasonably be submitted to the laboratory based on the selectioncriteria.
Construction of the drain lines is discussed in the Report.However, the rest of the system's design specifications areunclear. Was clay tile used throughout the system?
The drilling logs do not make it clear whether the soilborings penetrated the drain field or natural sand and gravel. Howwas penetration of the drain field verified?
Two laboratories were used during the ERM effort; only theGulf States Analytical Laboratory had been approved by EPA foranalysis of site samples. What was the justification for using asecond laboratory for selected metals and pesticide/PCB analyses?Were any holding times exceeded during this effort?
Interviews with site personnel indicate that no chemicalcleaners have been used to clear clogged drain lines in the pastfour years. The transfer station has been in operation for morethan ten years, however. What cleaners/solvents have beenhistorically used for septic system maintenance? ->«• -4 ,-.
Metals concentrations did not seem to be elevated above thosepublished in "Element Concentrations in Soils and Other SurficialMaterials of the Conterminous United States", published by theUnited States Geological Survey, 1984, (Professional Paper 1270),with the exception of lead. The suggested range of soil leadconcentrations in the general vicinity of the site is 10-20 ppm.Levels of lead in one oversight sample and two samples collectedby ERM exceed the upper value. (Analytical results for inorganicsobtained for oversight samples will be provided followingvalidation.)
Results for TSW-1 ground water samples reveal the presence of

solvents such as trichloroethane, perchloroethylene and 1,2-dichloroethane (total) in quantities exceeding those found in theF-Series wells. The compound 1, 2-dichloroethane was not detectedin any F-Series well. In addition, no vinyl chloride was detectedin TSW-l but vinyl chloride was detected at elevated concentrationsin most of the F-Series wells cited. A second round of TSW-lsamples would provide a more complete data set for comparison.
The following questions should be answered before developingfinal conclusions:
Which cleanout(s) /manhole (s) were found to be overflowing?
Was there a possible leak or overflow from components of theseptic system that are upgradient of the drain field?
Where did the blockages requiring system maintenance occur?Could the repeated efforts to keep the drain open haveresulted in a system leak?
Soil borings TSB-1 through TSB-4 require regrouting inaccordance with State of Maryland requirements, as witnessed duringa site visit conducted by John Fairbank of the Maryland Departmentof the Environment and myself on May 24, 1991.
Drums containing well development water, borehole cuttings,etc., were also observed in the area of the old drain field. Theseshould be staged in an appropriate area, e.g., within the fencedarea behind the transfer station building.
The results of EPA's January 24, 1991, sampling effort and thefindings documented in ERM's Report indicate that additionalevaluation of the nature and extent of contamination in thevicinity of the septic system is warranted. Evaluation of theimpacts of potential leakage anywhere in the septic system (sewerline collections, septic tank, distribution box(es) or clean outconnections) should be included in the plans for additionalinvestigation .
Please call me at 215/597-9238 so that we may schedule ameeting to discuss the scope of the additional investigation.
Sincerely,
Debra RossiRemedial Project ManagerDE/MD Section
cc: John FairbankKevin GaynorJoseph LewandowskiGeorge Markert
AR305525

Table 1.0Split Sample Results - Organic*
Septic System Investigation, January 1991
CRQL(soil)
51010330330330330330330330
10
5
OrganicCompound
Methylene Chloride
Acetone2-Butanone
Naphthalene2-Methyl-napthalene
AcenaphtheneFluorene
Fluoranthene
Pyrenebis(2-EthyI-hexy!)phthalate
4-Methyl-2-pentanoneTotal Xylenes
TSB-16-8'mg/kgNT
220 J100 J100 J88 J86 J110 J790 B
1J
TSB-18-10' •mg/kgNT
330 B
TSB-24-6'mg/kg
160 B47 B
CRQL(water)
5101010101010101010
10
5
TripBlankug/L1 B94 B3B
2B
Equip.Blankug/L1 BHOB4B
Key:
NT = VOA samples were not collected for boring TSB-1 due to sample recovery and sample exposureissues. TSB-2 was analyzed for VOA, BNA and Pesticide/RGB suites. Organic data has been validated butnot formally reviewed and accepted by the EPA/CRL
Blank spaces = Sample results were below detection/quantitation limits.
J = Analyte present. Reported value may not be accurate or precise.
B — Not detected substantially above the level reported in laboratory or field blanks
AR305526

APPENDIX BMATERIAL SAFETY DATA SHEETS
flR305527Group

IU )<EM! ROM I Nf;LH;PORA I Ell> PRODUCT 1NFORWT 1 ON: 703-5!30-777!?;'6J H i.GCKPGRi PL«C:E=.LOm ON, VIRGINIA 2.:.-:O79 DATE OF JSsiUt: O1-O2-J3O
PRODUCT NUMBER:0361
SECTION 1 IDENTIFICATION
PRODUCT NAME: SUPER FRESHPRODUCT TYPE: INSTITUTIONAL MALODOR COUNTERACTANT
SECTION 2 HAZARDOUS INOREDIEN'I S
This product contains no ingredients considered hazardous by criteriaestablished by 03HA. CFR 29 19JO.120O . The product doss, however.contain non-ionic surfactants which may be? mi Idly irritating to the-sis in and eves.
SECTION 3 PHYSICAL DATA
APPEARANCE AND ODOR.. Clear or an at? liquid with distinctive -fresh odor,SOLUBILITY INWA'IER.. Camp] ete>l v"PH. .................. 9. U-9. ?,BLiIL. ING POINT. ....... 1 uu degrees CSPECIFIC GRAVnV..... 1.O1PERCEN1 VOLATILE..... 81 7.
SELC'llON 4 FIRE AND EX.PLUG1ON Hf,?fUvD DA IA
SPECIAL" HAZARDS." .". . . . Non-A ammab] eFJREFIBHT1NG METHODS.A]]. recogniEt'd methods acceptable.FXTINGU1SHING MEDIA..An v
SECTION 5 REACTIVITY DATA
STABILITY.i_. ._._...... StableCONDITIONS TO AVOID"." Stofe"" irT'cbol" dry" pi ace.
INCOMPATIBILITY. ..... .Avoid contact with strand oxidizinrj aaents.
HAZARDOUS DECOMPOSITION PRODUCTS: As with any organic compoundvery_h_i.gii temperatures_wil_l_decompose the_ product to carbon d_i^ox i de_andor carbon monoxide?. ~
SECTION 6 SPILL OR LEAK PROCEDURES
CLEANUP..For small spills mop up. For large spills soak up in anon-flammable absorbent material .
WASTE DISPOSAL.. Consult local authorities -for current restrictionson disposal o-f chemical wastes.
ft R3 OS'S 28"

*;'* HA FG HI At. SAFETY DATA SHEET * ** •'
I ' l J U ? HEAL'fH
ELCTS OF OVEREXPOSURE
l:in and ey_es_i_ _May reuse redness and i rrijtation^ _ __ ____ . _ •__
f swal 1 owed: Al though low in toxicity the product may causestomach distress, nausea and vomiting.
•f mist is inhaled: May cause irritation to nose and throat.
_f?3 ' 1 mmediateJ y flush with cool running wpter. Remove contact lenses.jiiiinuf -flushing with running water •for 15 minutes, ho] di no eyelidsu~<rt to insurn rinsing o-f the? wntirc eve.
.in: Immedi ate?] y •flush sl.'in with plenty o-f cool runn_ing water -for at
.:<r<:;i 15 mi nutos. Remove? contaminated clothing if necessary and launder
iowed: Rinse mouth at once. then drinh one or .better , two lsra««sses o-i water or mill: to dilute the deternent . L<0 NUT INDUCEJM1TING. Never give anvthing to the mouth of an unconscious person .•el medics-1 attention iciim&di i\t el y.
: inhaled : F"<emove to -fresh air. '
L^P'IRATORY. -_N/AIN. ....... Avoi d contact.rES. ....... Avoid contact.
:C I ION 10 F'RECAUT lOtJG AND SPECIAL INF-ORMAT ION
L'y : - f'-P product cool artd dry. To insure maximum»£!.-?. li-fe store^ at a temfierature above li.»0 degrees F.JT ciassiiicatign {Cleaning Compound unregulated - - -- -
n s i s an _indu5tr_: al ma] odor coLint.eractant do not ndjc wi^Jit" water and keep out o-f reach o-f^chi Idren. ~ - - -
10 above information is believed to b« correct with respect to the"— ~~^nu-factured -formula. An new data is developed standards and:>gul at.i ons_chariae a_nd tq-f course . use and handling are beyond ___.ir control. No warranty, expressed or implied, is made as to" the "~Dmpleteness or continuing accuracy o-f this information.
ftR30'5529"

U.S. DEPARTMENT OF LABOROccupation*) Safety and Haalth Adminiitration - •
MATERIAL SAFETY DATA SHEETK*II*U MM! U.«. Mtt. W UK« MftTt *0 MEALT* IMUUTICM FOt 9MIF KMIIIII, IMIF-ftMUMII MO WlfMUKlia (ft Cff Iftl, IMI, W7|. MB M MOTTO IffDCI OCCUFATIOUt.•Arm *«o MULTM ACT of wo. ttaio« ». U) HI. ittcrttfio). •
Manufacturer: '. . - . ' , • ' .Emergency phone:SHARE COEPORATIOH ' ' "(414) 355-4000P.O. BOX 23053MILWAUKEE, VISCOHSIH 53223
Product Code: OOCDDate of Input: 9/30/1987
1-SUGHTWNSWNIRCANT
HAZARD RATING4-DOJEME . /\ X\ ACTIVE
»»«****** SECTION I - PRODUCU IDENTIFICATION ******************
Trade names and synonyms;____ORABGE ODOR C01TBOL AHD PEGEEASER
Chemical name / synonyms: • N/AChemical family: ... SOLVENT BLEND.Formula: MIXTURE
********* SECTION II - HAZARDOUS INGREDIENTS ««*«»*«»«*»»»****»
Approx. OSHA Carcinogenicity GASSubstance % PEL NPT IARC OSHA ' No.
\Mineral Spirits 1.00 350 ppm H H H 803O-3O-6
«««»»«»*« SECTION III - PHYSICAL DATA ««»»**»«*»**«*»*»»»***»**
Boiling point(°F): 185-300 Specific gravity: 0.799 pH: I/AVapor pressure(mm Hg): HOT DET. jk volatile (volume %} : 97Vapor density(air-1): IOT DET. Evaporation rateSolubility in water: INSOLUBLE (_ETHER____-1): > 1.0Appearance and odor: CLEAR, WATER WHITE LIQUID, ORAI6E FRAGRANCE.
********* SECTION IV - FIRE AND EXPLOSION HAZARD DATA *********
Flash point (°F): 120 Flammable limits in air (volume?)(test method): CLOSED CUP Upper: 5-0 Lower: 1.0
Extinguishing media: FOAM..CAEBOH DIOXIDE, DEI CHEMICAL.Special fire fighting procedures: FIREFIGHTERS MUST USE FULL
PROTECTIVE GEAR AHD SELF-COITAI1ED BRBATHIIG APPARATUS.Unusual fire and explosion hazard: USE WATER SPRAT TO COOL PIRE-
EXPOSED COITAIIERS. SOLVEHT VAPORS EAT CAUSE FLASHBACK.VAPORS ARE HEAVIER THAH AIR AHD MAT TRAVEL ALOHG THE GROUID ORBE MOVED BI VEITILATIOH. '
flR305530

f*»««»««* • -SECTION V •- "HEALTH 'HAZARD 'DATA'-*' *********************
?hreshold limit value: HOT-ESTABLISHED .'•••;••".*''rimary Route(s).of Exposure: EYE| SKIH CONTACT; ..IHHALATIOHi
IIGESTION.Effects "Of overexposure: EYES: SEVERE " IRRITATIOH; BEDHESS;
TEABIIG; BLUBBED VISION. SKIH: IHBITATIOH WITH PROLOIGEDCOITACT. • • ' INHALATIOH: BESPIBATOBY " TBACT'-IBBITATIOH,DIZZIIESS, ¥EAKHESS, HEADACHE; IADSEA, UHCOHSCIOUSHESS.IHGESTIOI: GASTEOIITESTIHAL IBBITATIOH, HAUSEA, VOMITIIG,DIAEEHEA.
Smergency and first aid procedures: EYES: FLUSH ETES AHD UHDEEEYELIDS ¥IfH PLEITY OF COOL ¥ATEE FOB AT LEAST 15 MIHUTES.OBTAIH MEDICAL ATTENTION.SKIH: BEHOVE CONTAMINATED CLOTHIIG AHD LAUHDEE BEFORE EE-USE.WASH VITH SOAP AHD VATERIHGESTIOH: CALL PHYSICIAN OR POISOH CEITEB IMMEDIATELY. DO HOTIHDUCE TOMITIHG. IEVEE HIVE AIYTHIIG BY MOUTH TO ANUHCOHSCIODS PEESOH.IHHALATIOH: BEHOVE PEBSOI TO FEESH AIE. PEEFOBM AETIFICALRESPIRATION IF INDICATED. OBTAIH MEDICAL ASSISTAHCE.
***«»*««« SECTION VI - REACTIVITY DATA «»*»**»««««****»«»»«***«
Stability: STABLE Conditions to avoid: HOMEIncompatibility: STBOHG ACIDS AHD OXIDIZIHG AGEHTS.Hazardous decomposition products: THERMAL DECOMPOSITION MAY YIELD
CO AHD COp.hazardous polymerization WILL HOT OCCUE.Conditions to avoid: HOHE
********* SECTION VII - SPILL OR LEAK PROCEDURES **************
Steps to be taken if material is released or epillediVEITILATEABEA AHD EXTINGUSH ALL SOURCES OF IGHITIOH. SOAK UP OH IHEBTABSOEBAHT AHD PLACE IH CLOSED COITAIHEE FOR DISPOSAL.
rfaste disposal method: COHSULT LOCAL EHVIEOHHEHTAL AUTHORITIES.
********* SECTION viii - SPECIAL'PROIECTION INFORMATION *******Respiratory protection: USE VITH ADEQUATE VEHTILATIOH. IH AREAS
OF HIGH COHCEITEATIOH, AH IIOSH APPROVED EESPIBATOE MUST BEUSED.
Ventilation -Local exhaust: RECOMMENDED-Mechanical: BECOMMEHDED
Protective gloves: RUBBER GLOVESEye protection: CHEMICAL GOGGLES OB FACE SHIELDOther protective equipment: EMEEGEHCY SHOVEB AHD EYE WASH STATIOH
********* SECTION IX - SPECIAL PRECAUTIONS «»**«»»***«»»*»«*»»*
Precautions to be taken in handling and storage: STORE IH A COOL,DRY ABEA, AWAY FBOM HEAT OB OPEfl FLAME. ¥ASH IHBOUGHLY AFTEBHAHDLIIG. KEEP CONTAINEB TIGHTLY CLOSED ¥HEH HOT IH USB.
Other precautions: KEEP OUT OF BEACH OF CHILDEEH. DO IOT CUT OEVELD OH EMPTY COHTAIHEE AS THEY MAY CONTAIN FLAMMABLERESIDUES.
flR30553|

APPENDIX CDRILLING LOGS
}irGroup
AR305532

Drilling Log
ProjectIftfatif
Well hMJP.EScreerCasinjDrillirDrlllei
}- 0 -
- 2 -
- 4 -
- 6 -
•• O «
- 10 _
- 12-
Woodlawn Transfer Station Oimer Cecil Countvn Woodlawn, MD w n K« . 904-07-00-01ror TSB-1 IV IT I. 20' ,«_ _. r BoreholelevmtioE
T rurih CWC:«,
'DIB ..- T wrfli T«rrw»
ig Comp. Don 1
Hardin-orfy p«ivr inc. TtnUffi Mptho'i Hollow Stem Au,§ferilley T»rRv Dave Terry rw.*,. n_ni.~i 1/24/91
Graphic Log
v 4 •
* * »
* « *I • *• 1*
• *
"• -CT•v— •
ff>«
«
:;ti***
Veil
Construction
Sample
Number
81
82
S3
84
85
86
87
Sketch Map ' V
/,'?**'* ]' // W
PA*/*
Notes: Soil Boring
Description/Soil Classification(Color, Texture, Structures)
0' - 2' Moist, brown, SILT, little gravel, little sand, trace day(BC: 11-7-8-12), (Pro Peak: 4.0 ppm; Sustained 3.6 ppm).
2-4' Rec. 16" Wet, brown, SILT, some sand, little gravel, trace day,(BC: 3-4-4-5), (Pro Peak 29.8 ppm; Sustained 28 ppm).
4 - 6' Rec. 16"4.0 - 4.8' Wet, brown, SILT, some sand, trace gravel.4.8 - 5.3' Wet, tan, SAND, some silt, little gravel. Septic odor evident.Note: black gravel at end of spoon.(Pro Peak 0.9 ppm; Sustained 0.7 ppm).
6 - 8' Rec. 12" Moist, tan, SAND and GRAVEL, some silt, some blackstaining at 6 - 12". Note: water encountered at approx. 7.5 '. Probablyperched lens. (BC: 3-3-8-7) (Pro Peak 6.2 ppm; sustained 5.7 ppm).
8 - 10' Dry, tan, SAND, some silt, trace day, (saprolite) (BC: 9-10-13-17),(Pro 0.0 ppm).
10 - 12' Rec. 24" Dry, tan, SAND and SILT, trace day, trace red staining,(BC: 9-11-15-17), (Pro 0.0 ppm).
12 - 14' Rec. 20" Moist, tan with red and white, SAND and SILT,(saprolite), Note: No visual evidence of contamination, (Pro 0.0 ppm).
Page_J———of.
AR305533
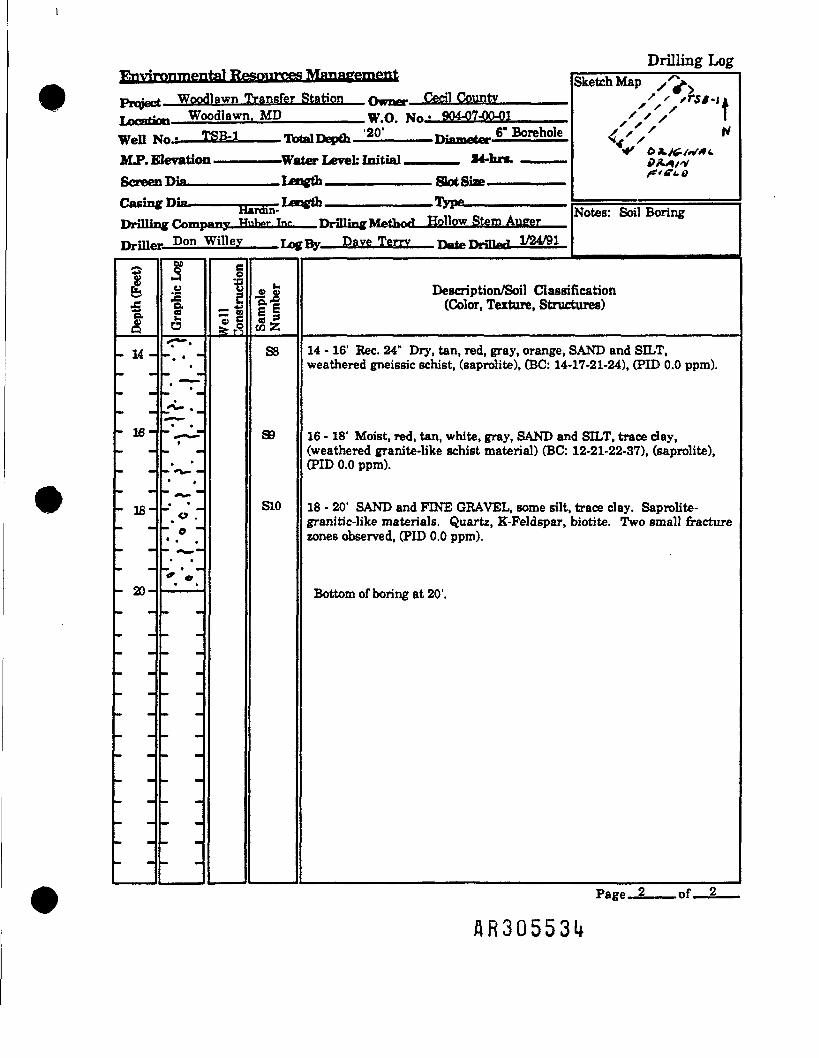
Drilling Log
Fk'fbact Woodlawn Transfer Station (Wmer Cecil Countvlocution Woodlawn, MD w n KT« • 904-07-00-01Well No- T85'1 Tr- 1 Depth '20< Dinmotcr 6" Borehole
CasinjTYri'llir
rpip, —————— — T«ngt)t Typpttardin-
.«> rv»«Tto««r WnKor Tnr n ii;n<rMAt)</wl Hollow Stem AufferDriller *)on w>Nev T"tf**K ^ave Terrv Dote Drilled 24/911A1T *"» J
®
£fa- 14-
-- 16---
- 18-
-
- 20-
^_o"g.5<*-•
".-7-"
-•-w'-
" **7 "• ** •- o "
* «• «
-
g
1= 1fer?
*11|cn 2
S3
89
S10
Sketch Map / >v' ' xr$/«j»''''/ \
s'/ ' H<f &&/ /,v*<.
% fL%
Notes: Soil Boring
Description/Soil Classification(Color, Texture, Structures)
14 - 16' Rec. 24" Dry, tan, red, gray, orange, SAND and SILT,weathered gneissic schist, (saprolite), (BC: 14-17-21-24), (PID 0.0 ppm).
16 - 18' Moist, red, tan, white, gray, SAND and SILT, trace day,(weathered granite-like schist material) (BC:(PID 0.0 ppm).
18 - 20' SAND and FINE GRAVEL, some silt,
12-21-22-37), (saprolite),
trace clay. Saprolite-granitic-like materials. Quartz, K-Feldspar, biotite. Two small fracturezones observed, (PID 0.0 ppm).
Bottom of boring at 20'.
Page_2———of—L
AR30553U
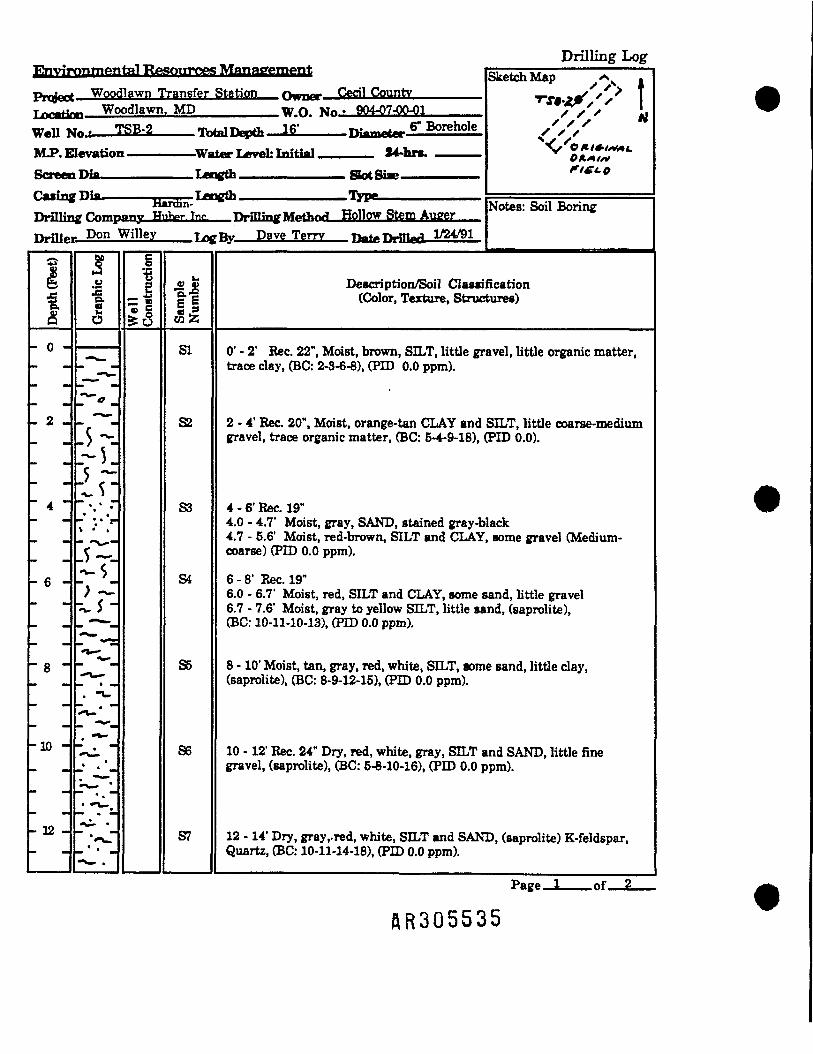
Drilling Log
Pnfcct Woodlawn Transfer Station <Vmr Cecil CountvJ J JP Woodlawn, MD w n K« • 904-07-00-01Well isMJP.EScreenCasingDrillinDrillei
J- 0 -
- 2 -
" 4 ~•• tun
- 6 -
" 8 -
-10 -
- 12 -
rot TSB-2 iw»iTv»«i. 16' »« —— t_ 6" Boreholelevmtioinio
• Wnt -T- VT'Vttai «4-fc»«-
Hmnfan- * J1Uf CVrnipumy Hu r Tnr Tvnim^MoA/wl Hollow Stem Aueer. Don Willey t ny Dave Terrv IfafrTHIkd 1/24y 1"
o
!
- : • vV .' .
. -v.mm « *"
™ • *""
» ^ ^
~ * •
• ^ v
*
Well
Construction
o> u"^ ECO 'Z
SI
S2
S3
S4
S5
86
S7
sitetcn Map ^s .TS+jjf/s* I' ' ' a///
0A*//v
Notes: Soil Boring
Description/Soil Classification(Color, Texture, Structures)
0' - 2' Rec. 22", Moist, brown, SILT, little gravel, little organic matter,trace clay, (BC: 2-3-6-8), (PID 0.0 ppm).
2 • 4' Rec. 20", Moist, orange-tan CLAY and SILT, little coarse-mediumgravel, trace organic matter, (BC: 5-4-9-18), (PID 0.0).
4 - 6' Rec. 19"4.0 - 4.7' Moist, gray, SAND, stained gray-black4.7 - 5.6' Moist, red-brown, SILT and CLAY, some gravel (Medium-coarse) (PID 0.0 ppm).
6 - 8' Rec. 19"6.0 - 6.7' Moist, red, SILT and CLAY, some sand, little gravel6.7 - 7.6' Moist, gray to yellow SILT, little sand, (saprolite),(BC: 10-11-10-13), (PTO 0.0 ppm).
8 - 10' Moist, tan, gray, red, white, SILT, some sand, little clay,(saprolite), (BC: 8-9-12-15), (PID 0.0 ppm).
10 - 12' Rec. 24" Dry, red, white, gray, SILT and SAND, little finegravel, (saprolite), (BC: 5-8-10-16), (PID 0.0 ppm).
12 - 14' Dry, gray,-red, white, SILT and SAND, (saprolite) K-feldspar,Quartz, (BC: 10-11-14-18), (PID 0.0 ppm).
Page—I———of.
flR305535

Drilling Log
Prefect Woodlawn Transfer Station fhmo- Cecil Countv ,_...,_ ,_, T*B-1lf''s>\'lsSf- Woodlawn. MD w n M« • 904-JD7-00-01 y / ' \
Well 1>MJ».EScreexCasingDriUiBDriDei
Depth (Feet)
-14-
- 16-
Jo. TSB-2 ow»ir»_* i. 16' «,_ _ 6" Borehole ^XxO' N
leratiozi Tlia
Martin- Notes: Soil Boringifif OompflniL— Jj«v»pr jnr >mijincf f tlnxi Hollow oteni Aufife ^r Don Willey T ftjr Dave Terry Date Drilled 4/91
Graphic Log
* • 0
-
— —- -
Well
Construction
!icc Z
S8
Description/Soil Classification(Color, Texture, Structures)
14 - 16' SAND and FINE GRAVEL, little silt, weathered bedrock,feldspar-rich, granitic-like, (BC: 6-12-15-15), (PID 0.0 ppm).
Bottom of boring at 16'.
Page.
AR305536

Drilling LogKTivironmentfli ftesources ivmrm emeni:Prqfcrt Woodlawn Transfer Station thmer Cecil County ———————Trxtrtin- Woodlawn, MD w n w« • 904-07-00-01Well isMJP.EScreesCasingDrillinDrillei
}- 0 -
- 2 -
- 4 -
- 6 -
- 8 -
- 10-
- 12 -
ro. TSB-3 iw«iT»»-rt. 20' ™ __ ._ 6" Borehole
levatioEOla
i Water LeveL Initial S4-lin.
iiardin- ^ff OoT/niy Wiihpr. inr. Tb-fllinff \fp£hnrf Hollow Stem Auper. Don Willey T/ Ry Dave Terrv Dnt PriUfrd 1'25/1
101
? '~
. o «.
* •
• * •
• * *^
* * •
§_! ^ i
SI
S2
S3
84
85
86
87
Sketch Map ^
/'/'' *V>,'
fitt.c
Notes: Soil Boring
Description/Soil Classification(Color, Texture, Structures)
0' - 2' Rec. 2", Dry, red SILT, little gravel, little sand, trace clay,(BC: 20-4-4-3), (PID 0.0 ppm).
2 - 41 Rec. 24"2.0 • 3.2' Moist, red, SILT, some clay, trace sand3.2 - 4.0' Moist, red, SILT, some gravel, little sand, trace clay,trace black staining, (BC: 15-21-53-48), (PID 0.0 ppm).
4 - 6' Rec. 12" Moist, red, with black, gray staining, SILT andGRAVEL, some sand, (PID 0.0 ppm).
6 - 8' Rec. 20" Dry, orange, tan, white, SILT, some sand, trace clay,(saprolite), (BC: 6-10-14-17), (PID 0.0 ppm).
8 - 10' Rec. 18" Dry, tan, red, white, SAND, some silt, trace clay,trace black staining, (saprolite), (BC: 8-14-15-23), (PID 0.0 ppm).
10 - 12' Rec. 21" Red, tan, white, gray, SAND, some silt, trace clay,(saprolite), (BC: 13-17-19-22), (PID 0.0 ppm).
12 - 14' Moist, orange, tan, white, gray, SAND, some silt, trace clay,(saprolite), (BC: 11-19-22-29), (PID 0.0 ppm).
Page—I———of.
AR305537

Drilling Log
Prqfcrt Woodlawn Transfer Station —— Qwaer Cttfl County ———————I mtion Woodlawn, MD w n M« . 904-07-00-01
Well No- TSP-3 Iton! Depth 20' Dinmotcr 6" BoreholeM P Klfftmtinn Water T<pwl: Initial _, S4J«*.
CasinjDrillii
tnift, —————— n — T — 1f**ff&* TjT*tlardin-,cr rVvmnon» Wn>v.r Tnr TWHISncr Mofhnfl Hollow Stem AuffCr
Driller on ^iNev T«»Ry Dave Terrv Date Drilled 25/91•"» .0
If- 14-
•» •
- 16-.
- 18-
AJ
tm mm
• ••
¥
.a1» t
« _ ,
• '• f
*
* •
* **
•• * •
:V-
-
g!— « $||88
39
S10
Sketch Map
''-> t/• ' ,' \/£' »
**«/* ***"ffti-O
Notes: Soil Boring
Description/Soil Classification(Color, Texture, Structures)
14-16' Bee. 24" Dry, orange, tan, white, SAND and SILTJittleclay (saprolite), (BC: 12-15-18-20), (PID 0.0 ppm).
•
16 - 18* Bee. 18" Dry, red, orange, white, black, SAND, some silt, traceclay. One small fracture with black-orangemineralization (saprolite), (BC: 13-16-19-24),
staining from(PID 0.0 ppm).
18 - 20' Bee. 20" Dry, red, orange, black, SAND, some silt, trace clay.One small fracture stained black from apparent mineralization(saprolite), (BC: 15-16-24-28), (PID 0.0 ppm).
Bottom of boring at 20'.
Page-Js——of.
AR305538

Drilling LogRnvfronmpnta! ResouiYffr MPn afteTnent
I rtio- Woodlawn, MD w n Nn • 904-07-00-01Well >MJP.EScreenCasingDrfflinDrillei
}- 0 -
- 2 -
- 4 -
_ 6 _
- 8-
- 10-
- 12-
ro. TSB-4 IW-IT O. 16' ~ —— ._ 6" Borehole
levatioc|"lia T iiMLrrtii oi«* c:-«
rrUfl ——————— —— T*mgfli TyppHmnlin- ~
O p ny HuJrr Tnp TvniingM»*:i»~* Hollow Stem Aueer. Don Willey inaTty Dave Terrv PntrPrilkrl 1/ 5/91^ J
1.a1
* * C?
•v% .
* *^^^t
** •
". * r
"• * ••
"" • »*"• »
Well
Construction
IISI
82
S3
S4
85
86
S7
Sketch Map ,*">.
/<? \/// M
ntt.6
Notes: Soil Boring
Description/Soil Classification(Color, Texture, Structures)
0' - 2' Rec. 15" Moist, brown, SILT and CLAY, trace gravel, littieorganic matter (BC: 2-1-3-4), (PID 0.0 ppm).
2 - 4' Rec. 24"2.0 - 3.25' Wet, brown, SILT and CLAY, little gravel.3.25 - 4.0' Wet, orange, SAND and GRAVEL, trace silt, (BC: 10-19-23-30),(PTO 0.0 ppm).
4 - 6' Rec. 15"4.0 - 4.6' Wet, tan, SAND and GRAVEL.4.6 - 5.3' Moist, red, SILT, some sand, little gravel (BC: 10-21-33-17),(PTO 0.0 ppm).
6 - 8' Rec. 23" Moist, tan, white, red, SILT and SAND, little gravel,trace clay, (saprolite) (BC: 6-8-11-10), (PID 0.0 ppm).
8 - 10' Dry, red, white, tan, SAND, some silt, trace day, (saprolite)(BC: 5-9-12-11), (PID 0.0 ppm).
10 - 12' Rec. 22" Dry, orange, red, white, SAND and SILT, (saprolite)(Biotite, quartz, feldspar) (BC: 7-16-16-22), (Pro 0.0 ppm).
12 • 14' Rec. 21" Dry, red, orange, white, tan, SAND, some silt, traceday, (saprolite), (BC: 8-17-25-29), (Pro 0.0 ppm).
Page_J___of.
AR305539

Drilling Log
Project Woodlawn Transfer Station Qrrnrr Cecil Countv f'' / TJJXB&-. Woodlawn, MD w n w« • 904-07-W-O.J S '' ' \Well !MJ>.IScreeiCasinjDrilliiDrille
Depth (Feet)
- 14-
- 16-
,T0. TSB-4 iw«iTv«rt. 16' «,. -. 6" Borehole X/XX' ^
levatioi,n;«, tanaAt ca«*a;~. fft.6
H*rdin- ~ • • Notes* Soil Boring«er-ftinpnny Huber Inc. nrillingMofVmH Hollow Stem Auger ' *. Don Willey Tof% Dave Terrv Dote Drilled l 2 1-
Grraphic Log
_. * •__
-
Well
Construction
« «
t|FTJ 2
S8
Description/Soil Classification(Color, Texture, Structures)
14 - 16' Dry, red, white, tan, SAND, some silt, trace clay, (saprolite),(BC: 7-18-21-22), (FED 0.0 ppm).
Bottom of boring at 16'.
Page.
flR305-5l*0

Drilling Log
Project Woodlawn Transfer Station Owner Cecil Co., MDT ««,««« Woodlawn. MD w n N« . C6401-00-01
BormtfNorf —— TSB'5 —— Total Depth _,.,„. JL — Diameter £U?-D. _Surfnsv TOetmtinn ————— \yater Level
CasinfiT>r511m
r Dia. ———————— Length —————————— Type ——————————rrn«m«o«xrHardin-Huber, Inc.:,,,.,., „„*,,_, Hollow Stem Auge
Driller Royce Keenan Tin£Pr Dave Terry Date Drilled 12/5/91
"
1faj=
fi- 0 -
-- 2 -
—
_ 4 __
-
- 6 -
—— «•——
- 8 -_ _ ,
__
^.0
o.
O
-_
—
-
-_
-
"
™" ""
-
— —
-
cotgg
"" to g-gCO 12SI
S2
S3
S4
OKeicn map
Notes:r
Description/Soil Classification(Color, Texture, Structures)
0' - 2' Rec. = 12"Wet, brown, SILT some gravel (medium), little sand (medium),trace clay (BC: 1-3-3-3), (PID: 66.0 ppm).
2' - 4' Rec. = 18"Wet, brown, tan, gray stained, SILT, little gravel (medium),little sand (medium to fine), (BC: 3-2-2-3), (PID: 160 ppm).
4' - 61 Rec. « 13"Wet, brown, gray, SILT, some gravel (medium), bottom 1" of spoonis red silt, (BC: 1-2-2-8), (PID: 108 ppm).
6' - 8' Rec. = 18"0" - 14" Wet, black stained, GRAVEL (medium to coarse), (drainfield materials)14" - 18" Moist, tan, white, orange, SILT, some sand, (Saprolite),(BC: 22-6-4-10), (PID: 48 ppm).
Bottom of boring at 8'.
Page—i——of_JL
flR305"5M

Drilling Log
Prnjprt Woodlawn Transfer Station Owner Cecil Co., MDTnooHra Woodlawn. MD w n Kn • C6401-00-01
Boring MM —— TSB-6 —— Total Depth 8....... Diameter 6" °-D-fiui-fiw Rlmnitwin ————— Water LevelScreen Dia. ————————— Length ——————————— Slot Size ————————
TVi^gr^mppnyHardin-Huber, Inc-Tvniin£ Method Hollow StemAuper °tes'Driller Royce Keenan T~jp.r Dave Terry p~te jvin-j 12/5/91* *
d>
-C0.(5
- 0 -
-- 2 -
-
- 4 -
" ~
™ ^™
- 6 -
—
- 8 -
-
$i— i0
•§.£O
--
-
-
" "
™ ™
^ ^^
-
_ _
-
§
2"oj C^6
V.Q) C)
§"*£9
COS
SI
S2
S3
S4
Description/Soil Classification(Color, Texture, Structures)
0' - 2' Rec. = 23"Moist, brown, SILT, some clay, little gravel (coarse to medium),(BC: 4-6-7-8), (PID: 10.5 ppm).
2' - 4' Rec. = 24"Moist, tan, brown, CLAY, some silt, little gravel (coarse to medium),(trace grey staining in bottom 1" of spoon), (BC: 4-4-7-15),(PID: 10.5 ppm).
4' - 6' Rec. = 16"Moist, brown, gray, SAND (medium to coarse), some gravel (mediumto coarse) trace silt, oder-observed, (drain field materials), v(BC: 14-32-21-20), (PID: 62.3 ppm).
6' - 8' Rec. = 18"Moist, tan, red, SILT, some sand (fine to medium), trace gravel,top 1" of spoon stained gray, (Saprolite), (BC: 9-12-12-12),(PID: 19.6 ppm).
Bottom of boring at 8'.
Page—I——of—L
AR3055U2
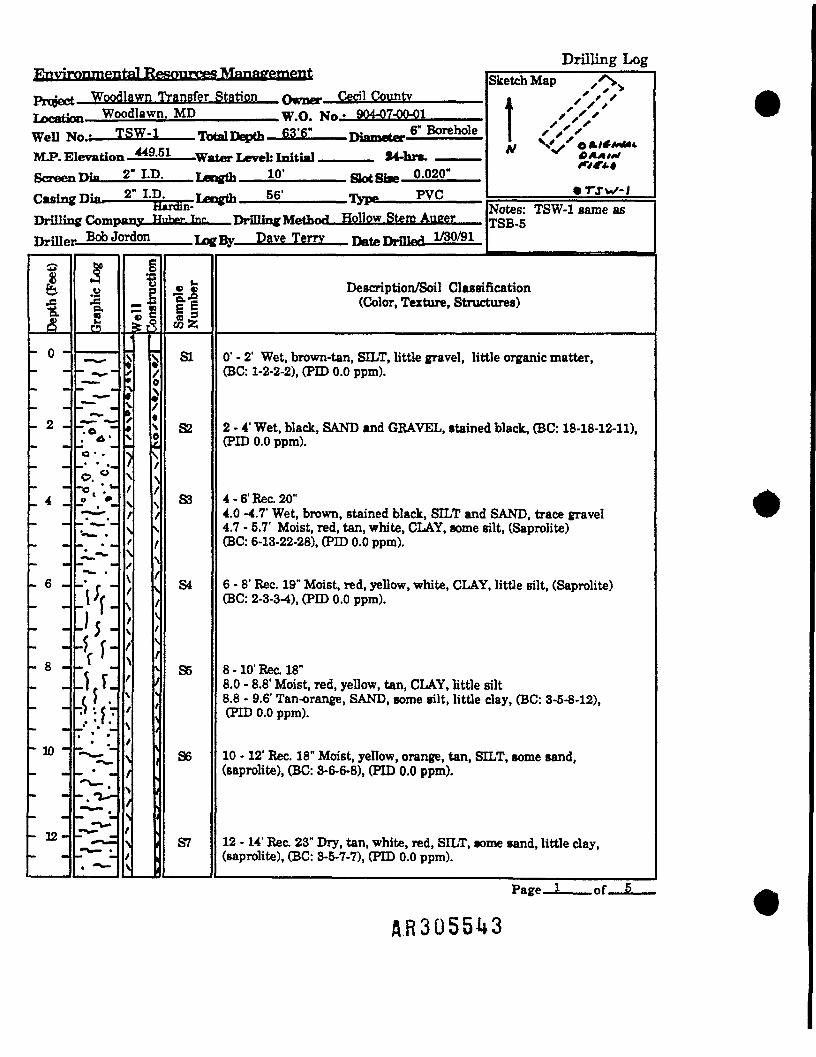
Drilling LogEnvironmental Resourpp$ J JpnufenientPrqjprt Woodlawn Transfer Station p —— Cecil CountyLfrfnfinn Woodlawn, MD WON*. 904-07-00-01WcI1Ntf. TSW-1 tv ipqrth 63'6" Diameter 6" Borehole
JAQ E-f
Screep nil. 2" I.D. T— «rrt, 10' ewe:-. 0.020"
Cmsini,pitl 2" I.D. T—gfl, 56' Typ» PVC' tiardin-<r r^mnanxr Pn>vr Tnr ni-flKmrMothnri HollOW Stem Auger
jij.}]!-- Bob Jordon ina-Ry Dave Terrv Date Drilled l O/91•• j « !_**«•3?
fl
ffi
- o -— -
•" "•
•** "•
. 2 -
.
Ml •
- 4 _
"* ™"
Ml ••
M. M.
- 6 ---Ml •
- 8 -^ — .
-- 10 -_
_-
- 12--
1O•«•>fa
_-w--_J --" j-"~ _ ~r1 "*S.' A'f .""o. f"™W **
O *^ *
* •
"xiT" "• * MI
* •%•M^" .
~ { f "
-^• 5 •? f ••-. i"c "isV-i-'* . • -
• ._
•» * ••
•?*i--J7**" •_rvXJ"*" L• "
§Si— i *
_ jM
S
\
t
ft
\
1H
^
1
\
1
\
t
\
/
\
/
\
\
S/^'\
'\
\/S
N
\/\
^fe
1|<» 2:
81
S2
S3
84
S5
86
S7
Sketch Map .'VX ' 't / > /
*<Cr>*>«•«•• rj-w-/
Notes: TSW-1 same asmQ-rj riOO-o
Description/Soil Classification(Color, Texture, Structures)
0' - 2' Wet, brown-tan, SILT, little gravel, little organic matter,(BC: 1-2-2-2), (PID 0.0 ppm).
2 - 4' Wet, black, SAND and GRAVEL, stained black, (BC: 18-18-12-11),(PID 0.0 ppm).
4 - 6' Rec. 20"4.0 -4.7' Wet, brown, stained black, SILT andSAND, trace gravel4.7 - 5.7' Moist, red, tan, white, CLAY, some silt, (Saprolite)(BC: 6-13-22-28), (PID 0.0 ppm).
6 - 8' Rec. 19" Moist, red, yellow, white, CLAY, little silt, (Saprolite)(BC: 2-3-3-4), (PID 0.0 ppm).
8 - 10' Rec. 18"8.0 - 8.8' Moist, red, yellow, tan, CLAY, little silt8.8 - 9.6' Tan-orange, SAND, some silt, little clay, (BC: 3-5-8-12),(PID 0.0 ppm).
10 - 12' Rec. 18" Moist, yellow, orange, tan, SILT, some sand,(saprolite), (BC: 3-6-6-8), (PID 0.0 ppm).
12 - 14' Rec. 23" Dry, tan, white, red, SILT, some sand, little day,(saprolite), (BC: 3-5-7-7), (PID 0.0 ppm).
Pago 1 nf 5

Drilling Log•nvirf>TITriPnt:ftl R fiwiirr* nTlftfffflTT*fynt'Pmirrt Woodlawn Transfer Station Oumn* Cecil CountvTrmrfinn Woodlawn, MD w n v« • 904-07-00-01nrAiiic*i. TSW-1 IW.ITV.**, 63'6" TV-—.*.-. 6" BoreholeMJ>. Elevation 449.51 Wo «- T «, M«HJol ,,.._. «4.hl-L
gcreerni. 2* I.D. T~«rrt, 10' owe:— 0.020"
Casin] JUmrdin-icrrVimnanv Hntwr. Inc. TWHlincr Mathnri HollOW Stem AuETBr
TW.JJI--. BobJordon r/v% Dave Terry Pnte Prilled J 0 1_ . ru
3.
^ffi- 14 -
-
- 16 -
-_ _- 18 -• ••
-
- 20 --
- 22 -- —-
_- 24 -
—_
- 26 -
g>su1
. ~+~-T-_— "
XT"
I~ I^ ^ J~T-*~
_ ? — _
_ — '_
H B
~ _ ~
~%-j r-*"1 -* * *™ * »"^_ • _x__-•^ <-
* ._I"T!•S I .
"• _"- -i
?~" -_•***"._^ "' ff _f•• , •"
< 1 'V-«J"• %- r-*"">—X- "
§1= 1£5\
/V
'/\/\/\/\/\/\f
\
v/\V1\f\*V
y/
^
\
'
^
\
/
/
V/\1\I\/\r\r\\'\'\Nf
V
* i1§ro 2
S8
SB
810
Sll
Sketch Map '>v* 4 '. s / '
<#' .' 0A4/*
"**•*
• rjw-«Notes: TSW-1 same asrpCTl EIbx>-o
Description/Soil Classification(Color, Texture, Structures)
14 - 16' Dry, tan, orange, SILT, little sand, (saprolite), (BC: 5-8-12-23),(PID 0.0 ppm).
16-18' Rec. 24" Dry, tan, orange, red, white, SILT, some sand, traceclay, (saprolite) (BC: 9-12-16-18), (PID 0.0 ppm).
18 - 20' Dry, tan, orange, red, SILT, some sand, trace clay, (saprolite),(BC: 9-11-11-14), (PDJ 0.0 ppm).
23 - 25' Dry, white, gray, orange, red, SILT, some sand, trace clay,(saprolite), (BC: 6-8-18-22), (PID 0.0 ppm).
Pago 2 nf

Drilling Log
Prqfcrt Woodlawn Transfer Station Qm r Cecil County ———————TcttrtVm Woodlawn, MD w n m« . 904-07-00-01Well No- TSW-1 TrrtnlPejifli 6S'6" Dinmotcr 6" BoreholeMJP. Elevation 449-51 Water Level: Initial *4-hr«.Screen ™« 2" I.D. r afh 10' ca_*c:«> 0.020"
Cuin|TVilTir
„>.„ 2"LD. r- rt, 57 Ty PVCii&rdin-
<r rVimnoTiv Wuter. Tnr TWHlSncrMAi tAfl Hollow Stem AllZer
n,nia. Bob Jordan T«rR^ Dave Terrv TV.*. rt_ni<~i 1/30/91
©H
-23 -_ __
•" " '
- 30 -
- —_- 32 -
_
— —-
- 34 -- -^ ^
- 36 -- -
-- 38 ~
-- --40 -
-
IMu1«
mm • MM
-
*
- — w~_i__ ~"
'— r"~ w".~- j~- ' -— ' _*»- ."?*" r- -w-
-'T -_ .
". <-fc_™r>-" *_• ^
*
•• * ^
" , ~
i L
J*" * _
.-'_
"" *_J"• ^^_ ~
••f-C
§
1= 1_^ 5)\;
sf\[r\f\\f\tN/S/V/\,
\
\
^/\
/v/\/\
\
\/N/V/^/\/si\/V/N/\
\
\/
/
0 fc
11co !3
812
813
814
Sketch Map ,*)v
u€~*"«*'• TS W- /
Notes: TSW-1 same asmQTJ E1D.D-O
Description/Soil Classification(Color, Texture, Structures)
28 - 30' Dry, red, brown, white, SILT, some sand, trace clay, (saprolite)(BC: 8-15-18-20), (PID 0.0 ppm).
.
33 - 35' Rec. 24" Moist, red, orange, gray, SILT and SAND, trace day,(saprolite) (BC: 8-14-14-22), (PID Peak 7.2 ppm; Sustained 6.7 ppm).
38 - 40' Rec. 24" Moist, red, yellow, white, gray, SILT and SAND, traceclay, (saprolite) (BC: 9-11-11-14), (PID 0.0 ppm).
.
Page.
AR3055U5

Drilling LogEnvimnTriOTitnl Resf irrnesf TVTaT» agement
Prqjcrt Woodlawn Transfer Station ^ —— Cecil Countylonrfinn Woodlawn, MD w n K« • 904-07-00-01«v~ii xi~ . TSW-1 Tw iTVnfh P3' 6" f|inil — t_ 6" Borehole.-_ «. . 44QK1 . ... ~.M i_
Screen n;.. 2" I.D. T oth 10' ca e:-. 0.020"
CasinjTVillir
-p|n 2" I.D. frtlEtl, 56' Typo PVCHardin-
««Pnmnonv TTiihpr Tnr TVnllincr McrfKnrl Hollow Stem AuPCr
IViUe- BobJordon TnpRy Dave Terrv TV,*- rwii-r-i 1/30/91^B. j **-mmtrrr A* «_»
53.sf- 42 -_ _-• ^
-44 •-_
• ^- 46 -B ^
-
- 48 -_
-
- 50 -
- 82 -
--- 54 -
fepSU
|• *
* *
*
-
r*- .» * ••
^ * % ^ *^^ *_»*"*""•%- ^ _. . ..- -u-"
:-_•-
*
Jr-~ *v-T"• * •
§1
^ 1
\
\/\/V/\'\/\f\
)
\1%/S/\'fy1>/\
I/I I/ILJ bl
—•Ml
h
11
815
816
S17
Sketch Map , X,* ///T ' ' '\ <;//
*•' y£%ri'W.O
• r w-iNotes: TSW-1 same as'pOTJ C
Description/Soil Classification(Color, Texture, Structures)
43 - 45' Bee. 24" Wet, red, yellow, black SILT, some sand, trace clay,(BC: 13-18-22-27), (PID 0.0 ppm) (saprolite). Note: Water encounteredat approximately 45'.
48 -50' Wet, orange, black, white, SILT, some(BC: 7-19-20-24). (PID 0.0 ppm).
sand (saprolite)
53 - 55' Rec. 24" Wet, white, black, orange, SILT, little sand, traceclay, (saprolite) (BC: 17-19-22-24), (PID 0.0 ppm).
Page_i———of.

Drilling LogJJnyfmTiTnfintal Reso'm'pffi TvTnTi agemcntPrqjert Woodlawn Transfer Station Pirnr- Cecil Countyl itVwi Woodlawn, MD wn K« • 904-07-00-01tr.ii xi« . TSW-l TW.ITVWU 63'6" T« _ _t_ 6" Borehole
MJP. Elevation 449-51 Water Level: Initial »4-hr«.Screes? "5" 2" I.D. i afh 10' cwe:_ 0.020"Casinf O** T T^ KT > TAI'Pifli ^ M' H Tmcth w ^ T* rVOMmrefan- —
trnnmnaniT Wti>»r Tnp TWnlUncrMatluwl Hollow Stem AuBCr
p-ni_r Bob Jordon T^Ry Dave Terrv Datr TVfllnl 1/80/91*» J
IofS
-56 -
- 58 -
: ;- 60 -
-
- 62 -
-™ ™
- 64 -
-
- 66 -
-
-- -
*.air"3
1~~I
3- IE- ;W * «i
•> » m
"
'"-."
^ * ••
-
_
-
--
§
§
s|fe t5—
--—
^
—
• M
""*
~
V.:|
«fe
I.Ico !Z
SIS
S19
Sketch Map X'V. s ' /
/<''/1 s ' 'U *.{ ' o <•./**•*•«.
• rsw-iNotes: TSW-l same asTOTl KloD-o
Description/Soil Classification(Color, Texture, Structures)
58 - 60' Wet, black, white, yellow, SILT, «ome §and, (saprolite)(BC: 12-20-28-41), (PID 0.0 ppm).
•
63-65' Wet, orange, white, black, SILT, some sand, fa-ace clay,(saprolite) (BC: 7-14-20-27), (PID 0.0 ppm).
Bottom of boring at 65'.
Well Construction Summary:0' - 25 Cement25' - 485 Portland, Bentonite Grout485-505 Bentonite Seal505-635 Silica635-535 PVC 0
Well Pack020" Slot Well Screen
53.5' - 2.5' above surface PVC Riser Pipe
Page_2———of.
flR3055l»7
APPENDIX DQUALITY ASSURANCE REPORTS
Ths
Group

ANALYTICAL QUALITY ASSURANCEREPORT
WOODLAWN TRANSFER STATIONSOIL AND GROUND WATER SAMPLINGJANUARY THROUGH FEBRUARY'1991
11 April 1991
* Kyi Clay "/S3ba!wne/M. RodgersQuality Assurance Chemist Senior Quality Assurance Chemist
Prepared For:
Cecil County Department of Public WorksCecil County Maryland
Prepared By:Environmental Resources Management, Inc.
855 Springdale DriveExton, Pennsylvania 19341
File No.: 904.07.00.01
AR3Q55U9
TABLE OF CONTENTS
PageSection 1 Introduction 1-1
Section 2 Organic Data 2-12.1 General Data Qualifiers 2-12.2 Aqueous Data Qualifiers 2-22.3 Soil Data Qualifiers 2-3
Sections Inorganic Data 3-13.1 Aqueous Data Qualifiers 3-13.2 Soil Data Qualifiers 3-2
Section 4 Summary 4-1
Attachment 1 Methodology Summary
Attachment 2 Data Summary Tables
flR305550

LIST OF TABLES
FollowingTable Page1-1 Summary of Sample Data Reviewed 1-1
AR30555I
SECTION 1INTRODUCTION
This quality assurance report is based upon the review of analyticaldata generated for one ground water sample and ten soil boringsamples and their associated field QC samples The samples werecollected from the Woodlawn Transfer Station located in Cecil county.Maryland. A summary of the sample locations, ERM traffic reportnumbers, sample collection dates, sample matrices and the analysesperformed is presented in Table 1-1. The methods used arediscussed and referenced in Attachment 1. Data summary tablespresenting the validated and/or qualified analytical results areprovided in Attachment 2.All data for the analyses were reviewed for adherence to the specifiedanalytical protocols. These reported results have been validated orqualified using general guidance from the "Laboratory Data ValidationFunctional Guidelines for Evaluating Organic (and Inorganic) Analyses"US EPA 2/88 (and 6/88).
AR305552
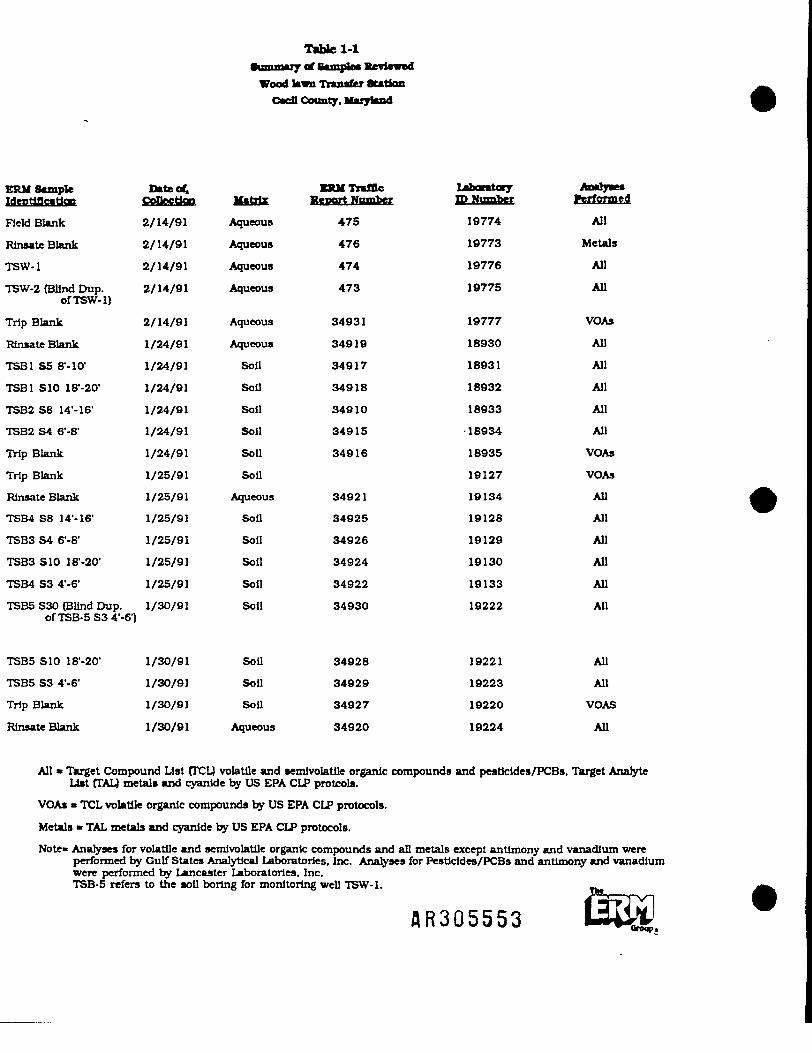
Table 1-1
Wood lawn Transfer StationlT, Karyla&d
ERM Sample Date o4 ERU Traffic Laboratorycollection Matrix Report yumtor IP Number Performed
Field Blank 2/14/91 Aqueous 475 19774 All
RInsate Blank 2/14/91 Aqueous 476 19773 Metals
TSW-1 2/14/91 Aqueous 474 19776 All
TSW-2 (Blind Dup. 2/14/91 Aqueous 473 19775 Allof TSW-1)
Trip Blank 2/14/91 Aqueous 34931 19777 VOAs
Rlnsate Blank 1/24/91 Aqueous 34919 18930 All
TSB1 S5 8'-10' 1/24/91 Soil 34917 18931 All
TSB1 S10 18'-20' 1/24/91 Soil 34918 18932 All
TSB2 S8 14'-16' 1/24/91 Soil 34910 18933 All
TSB2 S4 6--81 1/24/91 Soil 34915 -18934 All
Trip Blank 1/24/91 Soil 34916 18935 VOAs
Trip Blank 1/25/91 Soil 19127 VOAs
Rinsate Blank 1/25/91 Aqueous 34921 19134 All
TSB4 S8 14'-16' 1/25/91 Soil 34925 19128 All
TSB3S46f-8' 1/25/91 Soil 34926 19129 All
TSB3 S10 18--201 1/25/91 Soil 34924 19130 All
TSB4 S3 4'-6' 1/25/91 Soil 34922 19133 All
TSB5 S30 (Blind Dup. 1/30/91 Soil 34930 19222 AllofTSB-5S34'-6')
TSB5 S10 18'-20' 1/30/91 Soil 34928 19221 All
TSB5 S3 4f-6' 1/30/91 Soil 34929 19223 All
Trip Blank 1/30/91 Soil 34927 19220 VOAS
Rinsate Blank 1/30/91 Aqueous 34920 19224 All
All * Target Compound List fTCL) volatile and semivolatik organic compounds and pesticides/PCBs, Target AnaryteList (TAL) metals and cyanide by US EPA CLP protcols.
VOAs • TCL volatile organic compounds by US EPA CLP protocols.
Metals » TAL metals and cyanide by US EPA CLP protocols.
Note* Analyses for volatile and semivolatlle organic compounds and all metals except antimony and vanadium wereperformed by Gulf States Analytical Laboratories, Inc. Analyses for Pesticides/PCBs and antimony and vanadiumwere performed by Lancaster Laboratories. Inc.TSB-5 refers to the soil boring for monitoring well TSW-1.
AR3Q5553
SECTION 2ORGANIC DATA
The organic analyses were performed by Gulf States AnalyticalLaboratories Inc. (GSAI) of Houston, Texas and Lancaster LaboratoriesInc. (LLI) of Lancaster, Pennsylvania. The samples were analyzed forUS EPA Contract Laboratory Program (CLP) Target Compound List(TCL) volatile and semivolatile organic compounds, pesticides, andPCBs, as indicated in Table 1-1. The TCL volatile and semivolatileorganic analyses were performed by GSAI while the pesticides/PCBswere analyzed by LLI. Analyses for TCL volatile and semivolatileorganic compounds, pesticides, and PCBs were performed accordingto procedures specified in the US EPA 2/88 "CLP Statement of Work(SOW) for Organic Analyses".The findings of this quality assurance report are based upon theevaluation of data reported according the US EPA CLP deliverablesformat. Chain-of custody, holding times, blank analyses, surrogatecompound recoveries, matrix spike compound recoveries,bromofiuorobenzene (BFB) and decafluorotriphenylphosphine (DFTPP)mass tuning results, initial and continuing calibration data, internalstandard performance, target compound mass spectral match quality,DDD/endrin breakdown, pesticide/PCB linearity checks, DECretention time shifts, and the quantitation of results were evaluated forconformance with criterion.The organic analyses were performed acceptably, but require severalqualifying statements. It is recommended that the analytical data beused only with the qualifying statements provided below. Any aspectsof the data which are not discussed in this report should beconsidered qualitatively and quantitatively valid as reported based onthe deliverables reviewed.
2.1 General Data Qualifiers• As required by US EPA protocols, quantitative results for volatile
and semivolatile organic compounds and pesticides/PCBsdetected at levels below their respective contract requiredquantitation limits (CRQLs) have been marked with "J" qualifierson the data summary tables to indicate that they are quantitativeestimates.
2-1HR3Q555U

2.2 Aqueous Data Qualifiers• The relative percent differences (RPD) in the results for total
xylenes and phenanthrene for the analyses of sample TSW-1 andits blind field duplicate, TSW-2 exceeded ERM's quality controlcriteria. Poor precision between field duplicate samples may bedue to nonhomogeneity of these samples. The positive results fortotal xylenes in TSW-1 and TSW-2 and the positive result forphenanthrene in TSW-1 should be considered quantitativeestimates. This has been indicated by placing "J" qualifiers nextto the positive quantitative results for total xylenes andphenanthrene in these samples on the data summary tables. ERMconservatively recommends use of the highest concentrationsreported for these compounds.
• The reported results for total 1,2-dichloroethene in samplesTSW-1 and TSW-2 should be considered quantitative estimates.The standard used by the laboratory for standardization for total1,2-dichloroethene only contained the trans isomer of thiscompound. Standards containing the cis isomer were notavailable to the laboratory.The retention time (determined through calibration withstandards) for the elution of the trans isomer of this compound onthe gas chromatographic column is approximately five minutes.The laboratory maintains that through experimentation, they havedetermined the retention time for cis-1,2-dichloroethene to beapproximately eight minutes, and that the relative response factor(RRF) is nearly identical to that of the trans isomer. Therefore,the laboratory felt that the trans-1,2-dichloroethene RRF could beused to quantitate results for the cis isomer. Additionally, themass spectra are nearly identical for the two isomers.Review of the raw data for these samples indicates that thelaboratory has reported the results for total 1,2-dichloroethenefrom the peak eluting at eight minutes (cis-1,2-dichloroethene).Because the laboratory did not standardize for cis-1,2-dichloroethene, the results reported for this compound insamples TSW-1 and TSW-2 should be considered estimatedconcentrations. This has been indicated by placing "J" qualifiersnext to the positive quantitative results for total 1,2-dichloroethene in these samples on the data summary tables.
2-2&R3Q5555 —--WUP,

2.3 Soil Data Qualifiers• Positive results reported for acetone, 2-butanone, and
ethylbenzene are qualitatively invalid for the samples listed belowdue to the levels at which these analytes were detected inassociated blanks. US EPA protocol requires positive sampleresults for common laboratory contaminants, such as acetone and2-butanone that are less than ten times the level detected inassociated laboratory method blanks to be qualified as qualitativelyinvalid. Results for uncommon contaminants such asethylbenzene that are less than five times the level detected inassociated blanks are also qualitatively invalid. This has beenindicated by placing "B" qualifiers next to the quantitative resultsfor acetone, 2-butanone, and ethylbenzene in these samples onthe data summary tables.
Compound
Acetone All soil samples2-Butanone TSB-2 S4 (6'-8')Ethylbenzene TSB-5 S3 (4'-6()
The positive results and quantitation limits reported by thelaboratory for semivolatile organic compounds In the soil sampleswere on an "as received" basis. ERM has corrected these resultsfor dry weight and has reported the dry weight corrected resultson the data summary tables.
2-3AR305556

SECTION 3INORGANIC DATA
The inorganic analyses of the ground water and soil samples werewere performed by Gulf States Analytical Laboratories Inc. (GSAI) ofHouston, Texas and Lancaster Laboratories Inc. (LLI) of Lancaster,Pennsylvania. The samples were analyzed for CLP Target Analyte List(TAL) metals and cyanide as indicated in Table 1-1. Analyses for themetals and cyanide were performed following the proceduresspecified in the 7/88 CLP SOW for Inorganic Analyses. The analysis forantimony and vanadium was performed by LLI, while the remainder ofthe inorganic analyses were performed by GSAI.The findings of this quality assurance report are based upon theevaluation of data deliverables reported according to US EPA CLPdeliverables format. Chain-of-custody, holding times, blank analyses,matrix spike recoveries, duplicate analyses, initial and continuingcalibration verifications, graphite furnace single spike recovery andduplicate injection reproducibility, and the quantitation of positiveresults were evaluated for all samples for conformance with criterion.The inorganic analyses were performed acceptably, but require thefollowing qualifying statements. Any aspects of the data which are notdiscussed in this report should be considered qualitatively andquantitatively valid as reported based on the deliverables reviewed.
3.1 Aqueous Data Qualifiers• Positive results reported for antimony, zinc, and cyanide in the
samples listed below are qualitatively invalid due to the levels atwhich these analytes were detected in associated laboratorymethod blanks. US EPA protocol requires positive results that areless than five times the level detected in an associated laboratorymethod blank to be qualified as qualitatively invalid. This has beenindicated by placing "B" qualifiers next to the quantitative resultsfor antimony, zinc, and cyanide in these samples on the datasummary tables.
3-1AR305557
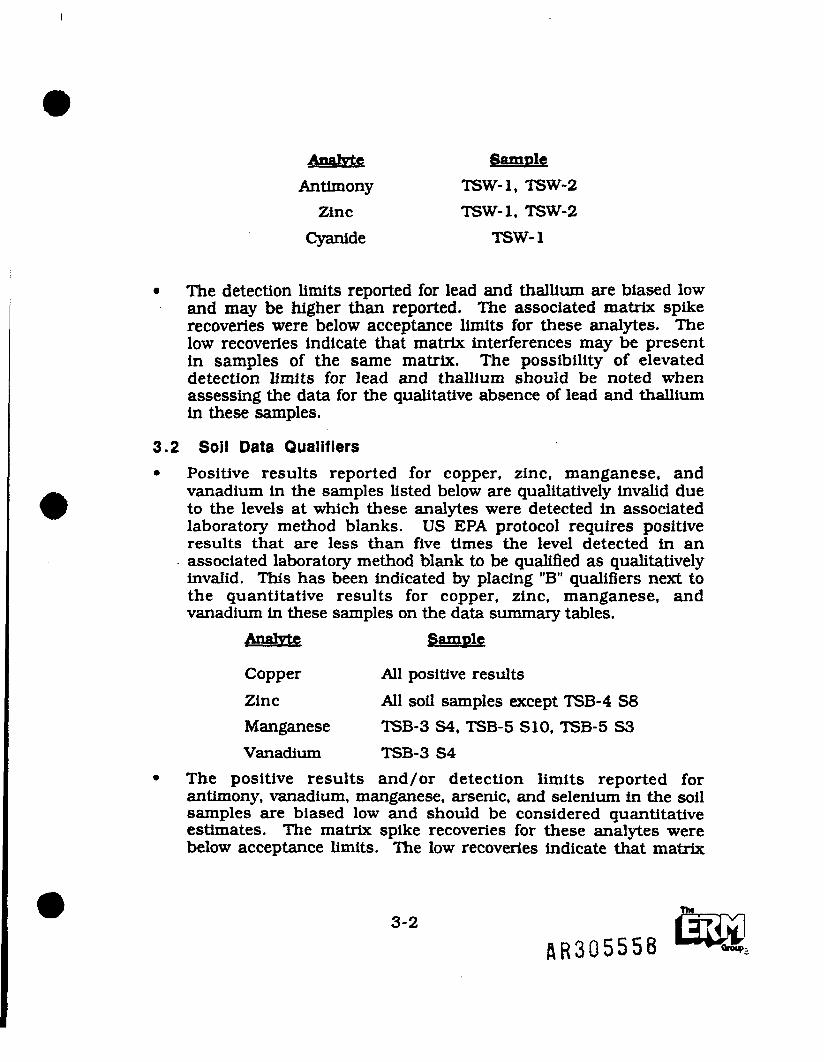
Anahrte SampleAntimony TSW-1, TSW-2Zinc TSW-1, TSW-2
Cyanide TSW-1
• The detection limits reported for lead and thallium are biased lowand may be higher than reported. The associated matrix spikerecoveries were below acceptance limits for these analytes. Thelow recoveries indicate that matrix interferences may be presentin samples of the same matrix. The possibility of elevateddetection limits for lead and thallium should be noted whenassessing the data for the qualitative absence of lead and thalliumin these samples.
3.2 Soil Data Qualifiers• Positive results reported for copper, zinc, manganese, and
vanadium in the samples listed below are qualitatively invalid dueto the levels at which these analytes were detected in associatedlaboratory method blanks. US EPA protocol requires positiveresults that are less than five times the level detected in anassociated laboratory method blank to be qualified as qualitativelyinvalid. This has been indicated by placing "B" qualifiers next tothe quantitative results for copper, zinc, manganese, andvanadium in these samples on the data summary tables.
Analyte Sample
Copper All positive resultsZinc All soil samples except TSB-4 S8Manganese TSB-3 S4, TSB-5 S10, TSB-5 S3Vanadium TSB-3 S4
• The positive results and/or detection limits reported forantimony, vanadium, manganese, arsenic, and selenium in the soilsamples are biased low and should be considered quantitativeestimates. The matrix spike recoveries for these analytes werebelow acceptance limits. The low recoveries indicate that matrix
3-2AR305558

interferences may be present In samples of the same matrix.Positive soil sample results for antimony, vanadium, manganese,arsenic, and selenium that are free from blank contamination havebeen marked with "J" qualifiers on the data summary tables toindicate that they are quantitative estimates. Detection limits maybe elevated in samples where antimony, vanadium, manganese,arsenic, and selenium were not detected. This should be notedwhen assessing the data for the qualitative absence of antimony,vanadium, manganese, arsenic, and selenium.The positive results reported for chromium in the soil samplesare biased high and should be considered quantitative estimates.The chromium matrix spike recoveries associated with thesesamples were above acceptance limits. The high recoveriesindicate that matrix interferences may be present in samples ofthe same matrix. Positive sample results for chromium in the soilsamples have been marked with "J" .qualifiers on the datasummary tables to indicate that they are quantitative estimates.The results for potassium, aluminum, and iron in the sampleslisted below were incorrectly reported by the laboratory as not -detected. Review of the raw data indicated the presence of theseanalytes at concentrations greater than the instrument detectionlimit for potassium, aluminum, and iron in these samples. CLPprotocols require that inorganic analytes detected in samples atconcentrations greater than their respective instrument detectionlimits be reported by the laboratory. ERM has calculated theresults for potassium, aluminum, and iron in these samples themon the data summary tables.
Aoalyte Concentration SamplePotassium 3630 mg/Kg TSB-1 S10Aluminium 7330 mg/Kg TSB-5 S10Iron 15500 mg/Kg TSB-4 S3
Ba3-3
flR305559

SECTION 4SUMMARY
The organic and inorganic analyses described in this analytical qualityassurance report were performed acceptably, but required qualifyingstatements. The aspects of the data which required qualification areidentified in this report. All documentation in support of thevalidation and qualification of the data has been filed with theWoodlawn Transfer Station - Cecil County, Maryland project.
AR305560
ATTACHMENT 1METHODOLOGY SUMMARY
AR30556I

Volatile and Semivolatile Organic Compound AnalysesProcedures specified in the 2/88 CLP SOW for Organic Analyses wereused for volatile and semivolatile analyses.A 5-milliliter sample aliquot was purged with helium at ambienttemperature for aqueous volatile organic analyses. Purgeablecompounds were transferred from the aqueous to the vapor phase, andtrapped onto a sorbent column. After purging, the column was heatedand backflushed to desorb the purgeable compounds onto a gaschromatographic column. The gas chromatograph was temperatureprogrammed to separate the sample components, which were thendetected with a mass spectrometer.Five-gram soil sample aliquots were mixed with 5- millilitersdeionized (DI) water and taken through the purging process. Sampleswere then analyzed as described above.Aqueous samples analyzed for semivolatile organic compounds wereextracted prior to sample analysis. A 500-milliliter sample aliquot wasextracted with a separatory funnel using dichloromethane. Thebase/neutral and acid fractions were dried separately and thencombined for concentration to a final volume 1- milliliter. Sampleswere then injected onto a gas chromatographic column and analyzedbyGC/MS.Thirty grams of soil sample was extracted with 1:1dichloromethane/acetone using a sonication technique. Samples werethen injected onto a gas chromatographic column and analyzed byGC/MS.
Analyses for Pesticides/PCBsProcedures specified in the 2/88 CLP SOW for Organic Analyses wereused for pesticide/PCB analyses.Aqueous samples analyzed for pesticide/PCBs were extracted prior tosample analysis. Samples were then analyzed by gas chromatographywith an electron capture detector.Thirty grams of soil sample was extracted using a sonicationtechnique for soil pesticide/PCB analyses. The resulting extract wasanalyzed by gas chromatography using an electron capture detector.
AR305562

Analysis for MetalsProcedures specified in the 7/88 CLP SOW for Inorganic Analyseswere modified for metals analyses.Prior to analysis 100- milliliter aqueous sample aliquots or two gramsoil aliquots were digested with nitric and hydrochloric acid. Thesolution resulting from the metals digestion is analyzed by InductivelyCoupled Plasma (ICP) Emission Spectroscopy, Flame AtomicAbsorption Spectroscopy (FAA), or by Graphite Furnace AtomicAbsorption Spectroscopy (GFAA).
AR305563

ATTACHMENT 2SUMMARY DATA TABLES
AR305561*

TABLE 9-1
Summary of Organic and Inorganic Analysesof Soil Samples from Below the Original Septic System Drain RekJ
Woodlawn Tranafvr Station
•ample LseattMiDepth
KXH Traffic Kcpcrt*
If •totvre Ceatsat (%)
TCLVektUs«(n*/ki)
Acetone2-BuUDOocEtbyJbenzcneXytene* (total)
TO, SesdroktUe* (M/kX)
bUQ-EthylhexyDphthalatePbenanthrene
TCL PwtlcldM/POU (M/k«3
AJdrtnAlpha-BHCBeU-BHCDelU-BHCGamms-BHCAlpha-Chlordane4.4'-DDT4,4'-DDDDieMrinHeptachlorHeptachlor EpoxideEndosullknn
TAL iBOTfinlc* («H/kt)
Antimony*AluminumAnenlcBariumBerylliumf?ly I'mdum
CobaltCopperIronMagnesiumManganeseMercuryNickelPoUMlumSeleniumVmadtum*ZincLCMlTbafflumTotilCyirdde
ray
10105S
330330
88888801616168816
CRDL
12402401210520100030.048
10001104122
TSB-1 SSr-10"S4017
18.8
41 B
1 J2 J
123 J41 J
1.0 J
4.7 J32 J
2.2 J
8840
7 J
10 B17900
269 J
1770
22.8 J49 B11.7
o.n B
TSB-1 S10ir-zo*S4818
222
105 B
ND
ND
16200
6 J
8 B199001500526 J
3630
19.8 J44 B19.9
O.O6 B
TSB4S4r-rS401S
18.9
105 B17 B
76 J
6.0 ' J0.72 J
1.9 J
0.87 J1.4 J2.3 J
10900
6 J
11 B25600
268 J
28.1 J29 B31.8
0.18 B
TSB-2S8i4'-ir•4910
15.5
31 B
170 J
035 J
0.39 J
13 J
0.93 J23 J
12600
14400
257 J
2120
12.7 J39 B92
0.11 B
TSB-3S4r-rS4B36
172
se B
ND
3.6 J
0.81 J2.6 J
2990
3 J
3570
63 B
3.7 B6 B9.6
TSB-3S10ir-2ff•4024
14.9
79 B
ND
0.66 J1.4 J
13 J17 J1.8 J
16 J
10800
49
8 B14800
546 J
2320
11.1 J30 B23.1
ND - This amJyte was not detected.J - Tbi» result ibculd be cccutdered a quantitative estimate.B - This vahie to qualitatively invalid since this anatyte was detected in a blank at a similar concentration.• - This sampk: is a btod field duplicate of TSB-5 S3 (4'-61.• • DetermlnaUons for tots anaryte were performed by UJ.Note: AD results are reported OD a dry weight basis. CRQLs and CRDLs are on a wet weight basis and should beadjusted for moisture contentBlank Spaces - Concentrations have not been entered for anatytes which were not detected.
AR305565

TABLE 3-Keontinuad)
Summary of Organic and Inorganic Analyaaaof Soil SamplM from th« Original S»ptic Syatem Drain Raid
Woodlawn Transfer Station
•••pie L*e*ti«*Deptk
BUf Traffic Report f
lf«tetueC«Btaat(*)
TCLV»latU«sGif/kD
AcetoneEtbybemene
TO, aemlroktllo* (we/kg
TGL. PwtiddM/KS* Ot/kx)
AldrtaAlpha-BHCBeU-BHCDdU-BHCGamoi-BHCAlpha-Cnlordane4.4--DDT4.4--DDDHepUchlorHeptachlor EpcnddeEndosulian H
TAL laoifuric* (mf/W
KntimoEy*Uuiirii HJIIPAnode3arhiniBeryflhunChromiumCobaltCopperTonMagnesiumManganeseMemnyNickelPotassiumSeleniumVuiBdtum*ZincLrad•IHllTOT
TbUl Cyanide
CBQT.
105
8
8
16
8
CBHI.
1240240121052010OO30.04810001104122
T8B-4S34--rM822
18.8
26 B
ND
4.1 J
1.9 J
6500
7 B15700
131 J
14 J19 B12.3
TSB-4M1«MrS4B2S
17.6
58 B
ND
0.64 J
0.71 J
1.6 J
2.1 J
10400
56
5 J4211 B
21800
3750 J
2490
18.5 J1381217
TSB-SS34'-r94S29
21.5
23 B2 B
ND
ND
13800
210 J
11 B16700
49 B0.1
85.5 J18 B10.5 J
TSB-6 810ir-ao194828
17.7
15 B
ND
ND
7330
1
16300
328 B
2O60
16.3 J30 B12.6
TSB-6 330°w-aff34030
2O3
21 B
ND
ND
9620
10 J
9 B14200
75 J0.1115
64.4 J17 B6.6 J
ND - Itts auaJyte was not detected.J - lids result should be considered a quantitative estimate.B - This value ta quaUtattvety tavaHd since this ana)yte was detected in a blank at a similar concentration.• - ibis sample is a blind field duplicate of TSB-5 S3 (4'-6%* - Determinations for tbis analyte were performed by LLI.Note: AD results are reported on a dry weight basis. CRQLs and CRDLs are on a wet weight basis and should beadjusted for moisture contentBlank Spaces - Concentrations have not been entered for anarytes which were not detected.
UR305566

TABLIS-2
•ummarj of Organic and InorganicW Ground Water Sample* from Well TSW-1
Woodlawn Transfer Station
Sample IdentificationKRM Traffic Reoort «
TCL Volatile. (U«/D
Acetone2-ButanoneChlorobenzene1,1-Dichloroethane1.2-Dlchoroethane (total)EthylbenzeneMethylene chlorideTetrachloroetheneTolueneTrlchloroetheneXylenes (total)
TCL Bemjvolatiles bigJU
1,2 Dichlorobenzene2-MethylnaphthaleneAcenaphtheneDibenzofuranFluorenePhenanthreneAnthraceneCarbazole"FluoranthenelyreneW*(2-Ethy]hexyl)phthalate
TCL Peiticidec/FCB* fu*/L)
Alpha-BHCGamma-BHC (Lindane)HeptachlorEndosulfan SulfateGamma -ChlordaneAldrlnEndrinKetone
TAL Isorf anle» (uc/U
Antimony (diacolved)Calcium (dissolved)Magnesium (dissolved)Manganese (dissolved)Sodium (dissolved)Zinc (dissolved)Total Cyanide
CRQL
1010555555555
1010101010101010101010
0.050.05O.O5O.IO.50.050.1
CRDL
105OOO5OOO15
5OOO201O
TSW-1474
6 J7 J23 J7270 J4 J388106O7 J
7 J3 J19152510 J4 J193 J2 J6 J
O.027 JO.O2 J
0.023 JO.028 J0.18 JO.O24 J
13 B26000520027401680024 B1 B
T8W-2*473
6 J21 J6410 J3 J3588555 J
7 J2 J1714235 J3 J173 J
4 J
0.019 J0.05 J0.026 JO.O2 J
15 B28OOO510027102120021 B
J - This result should be considered a quantitative estimate.B - This value is qualitatively invalid since this analyte was detected in a blank
at a similar concentration.• - This sample Is a blind duplicate of TSW-1*• - Non-Target Compound List fTCLJ compoundBlank Spaces - Concentrations have not been entered for analytes whichwere not detected.
AR305567