september 7, 2017 fcc fact sheet twentieth mobile wireless ... · september 7, 2017 fcc fact sheet*...
TRANSCRIPT
September 7, 2017
FCC FACT SHEET*
Twentieth Mobile Wireless Competition Report
WT Docket No. 17-69
Background: The Communications Act requires the Commission to report annually to Congress on the
state of competition in mobile wireless services and to include an analysis of whether there is effective
competition. The 20th Mobile Wireless Competition Report fulfills the Commission’s obligation,
presenting a variety of data from 2016, as well as certain information for early 2017 and additional
supporting information from prior years. The Report conducts an analysis of that data and an assessment
of various generally-accepted metrics of competition for mobile wireless services.
What the Report Would Do:
Analyze a number of facts, trends, and characteristics that taken together indicate there is effective
competition in the marketplace for mobile wireless services.
Among other factors, consider:
o Service options and pricing. Providers continue to expand and adjust data plans and pricing;
including adding new plans and reintroducing unlimited data plans to the marketplace.
o Network speeds. The mean LTE download speed increased well over 60 percent from the
first half of 2014 to the first half of 2017.
o Access and availability. A substantial majority of consumers have access to four nationwide
service providers, and there are numerous smaller providers that play an important
competitive role in local and regional markets.
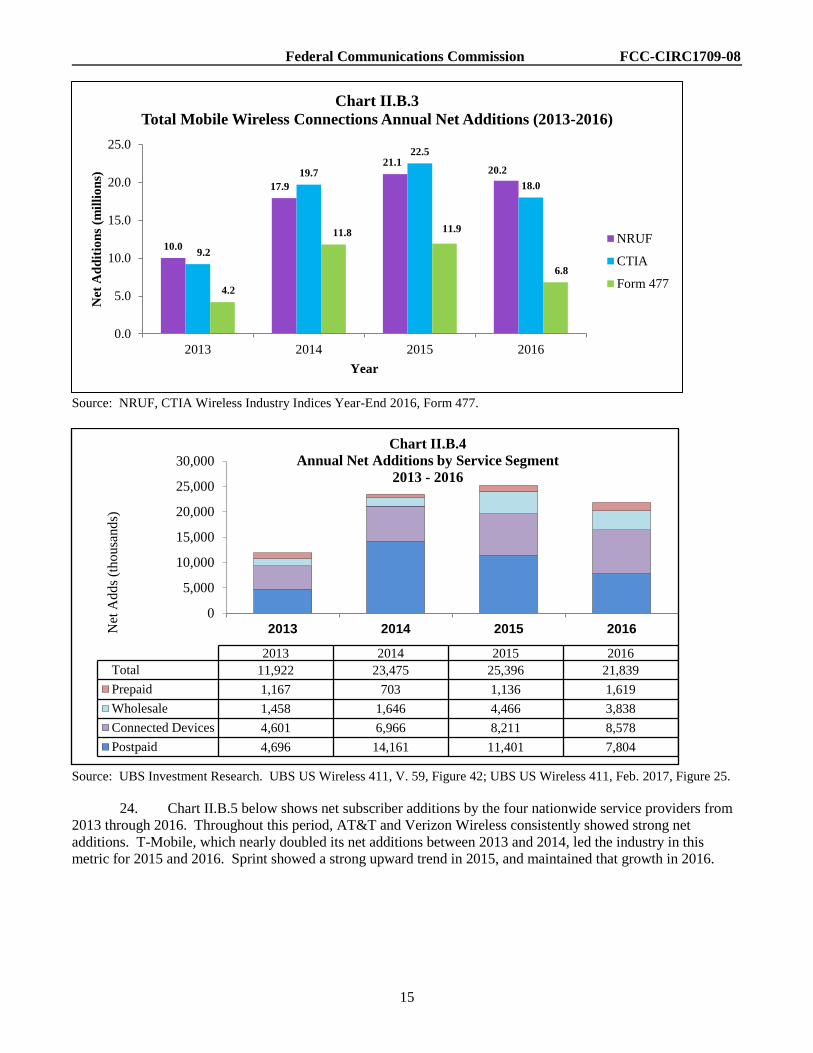
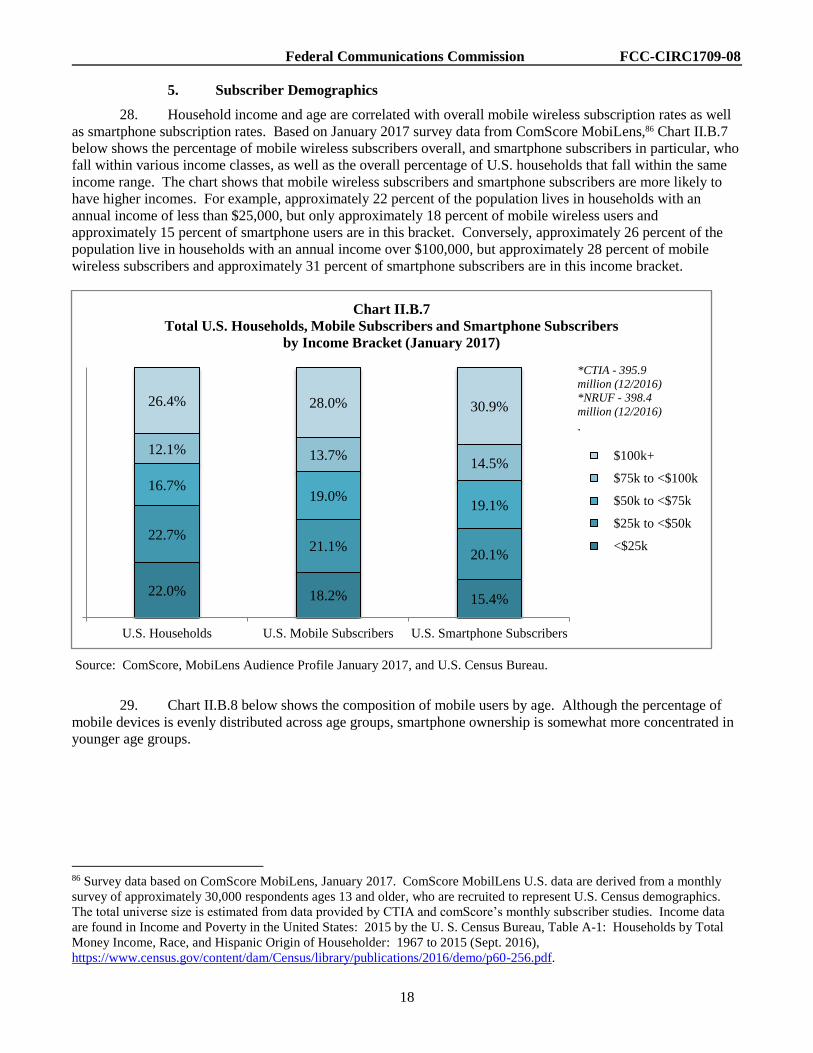
o Network investment. Wireless service providers in the United States have made capital
investments of more than $200 billion over the past seven years; although investment
declined approximately 9% from 2015 to 2016.
Cover other industry developments, including rising consumer demand and increased data output,
falling prices, and access to additional spectrum.
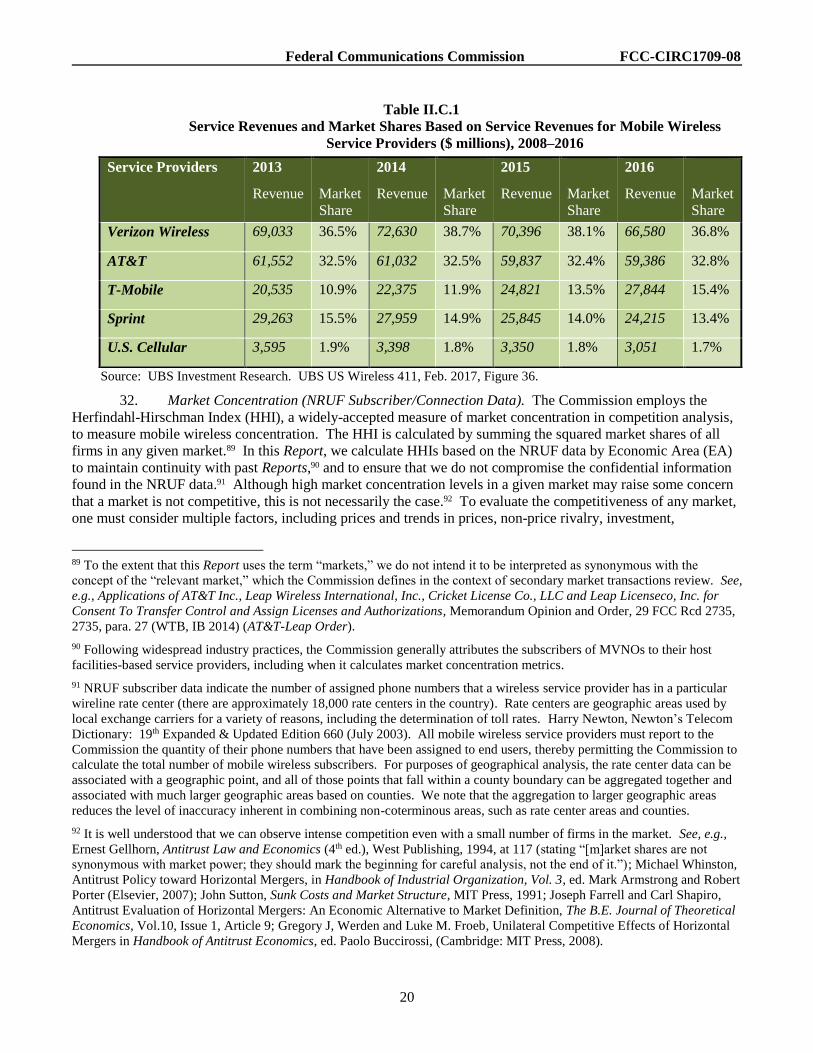
* This document is being released as part of a “permit-but-disclose” proceeding. Any presentations or views on the
subject expressed to the Commission or its staff, including by email, must be filed in WT Docket No. 17-69, which
may be accessed via the Electronic Comment Filing System (https://www.fcc.gov/ecfs/). Before filing, participants
should familiarize themselves with the Commission’s ex parte rules, including the general prohibition on
presentations (written and oral) on matters listed on the Sunshine Agenda, which is typically released a week prior to
the Commission’s meeting. See 47 CFR § 1.1200 et seq.

Federal Communications Commission FCC-CIRC1709-08
* This document has been circulated for tentative consideration by the Commission at its [XX] open meeting. The issues
referenced in this document and the Commission’s ultimate resolutions of those issues remain under consideration and
subject to change. This document does not constitute any official action by the Commission. However, the Chairman has
determined that, in the interest of promoting the public’s ability to understand the nature and scope of issues under
consideration, the public interest would be served by making this document publicly available. The Commission’s ex parte
rules apply and presentations are subject to “permit-but-disclose” ex parte rules. See, e.g., 47 CFR §§ 1.1206, 1.1200(a).
Participants in this proceeding should familiarize themselves with the Commission’s ex parte rules, including the general
prohibition on presentations (written and oral) on matters listed on the Sunshine Agenda, which is typically released a week
prior to the Commission’s meeting. See 47 CFR §§ 1.1200(a), 1.1203. The draft document makes several references to a
website containing web appendices. These “Web Appendix” documents are provided in draft form at the end of this
document.
Before the
FEDERAL COMMUNICATIONS COMMISSION
WASHINGTON, D.C. 20554
In the Matter of
Implementation of Section 6002(b) of the Omnibus
Budget Reconciliation Act of 1993
Annual Report and Analysis of Competitive Market
Conditions With Respect to Mobile Wireless,
Including Commercial Mobile Services
)
)
)
)
)
)
)
)
WT Docket No. 17-69
TWENTIETH REPORT*
Adopted: [] Released:[]
By the Commission:
TABLE OF CONTENTS
Heading Paragraph #
I. INTRODUCTION .................................................................................................................................. 1 II. CHARACTERISTICS OF THE MOBILE WIRELESS INDUSTRY ................................................. 11
A. Service Providers ............................................................................................................................ 12 1. Facilities-Based Service Providers .......................................................................................... 13 2. Resellers/Mobile Virtual Network Operators and Other Service Providers ............................ 15
B. Connections and Subscribers .......................................................................................................... 19 1. Total Connections and Subscribers .......................................................................................... 19 2. Net Additions ........................................................................................................................... 23 3. Churn ....................................................................................................................................... 25 4. Penetration Rates by Geographic Area .................................................................................... 27 5. Subscriber Demographics ........................................................................................................ 28
C. Market Shares and Concentration .................................................................................................. 30 D. Profitability ..................................................................................................................................... 33 E. Facilitating Access to Spectrum ..................................................................................................... 34
1. Service Providers’ Spectrum Holdings .................................................................................... 40 F. Wireless Infrastructure ................................................................................................................... 42
III. ELEMENTS OF INTER-FIRM RIVALRY ......................................................................................... 47 A. Pricing Levels and Trends .............................................................................................................. 48
1. Postpaid Service ....................................................................................................................... 49 a. Pricing Trends and “Unlimited” Data Plans ...................................................................... 50 b. Video Content Not Counted Towards Data Limits ........................................................... 52

Federal Communications Commission FCC-CIRC1709-08
2
2. Prepaid Service ........................................................................................................................ 53 3. Price Indicators for Mobile Wireless Services ......................................................................... 57
B. Differentiation in Mobile Wireless Devices/Services and Advertising/Marketing ........................ 62 1. Differentiation in Mobile Wireless Devices and Services ....................................................... 62 2. Advertising and Marketing ...................................................................................................... 66
C. Investment ...................................................................................................................................... 68 D. Nationwide Network Coverage and Technology Upgrades ........................................................... 69
1. Overall Mobile Wireless Network Coverage (Any Technology) ............................................ 74 a. Overall Coverage By A Certain Number of Service Providers ......................................... 74 b. Overall Coverage By Individual Service Provider ............................................................ 76
2. LTE Mobile Broadband Coverage ........................................................................................... 77 a. LTE Coverage By A Certain Number of Service Providers ............................................. 77 b. LTE Coverage By Individual Service Provider ................................................................. 78
3. Rural/Non-Rural Comparisons ................................................................................................ 79 a. Rural and Non-Rural Overall Coverage By A Certain Number of Service Providers ...... 81 b. Rural and Non-Rural Overall Network Coverage By Individual Service Provider .......... 82 c. Rural and Non-Rural LTE Coverage By A Certain Number of Service Providers ........... 83 d. Rural and Non-Rural LTE Coverage By Individual Service Provider .............................. 84
4. Coverage and Technology Upgrades by Service Provider ...................................................... 85 E. Speed of Service ............................................................................................................................. 87
1. Ookla ........................................................................................................................................ 90 2. RootMetrics ............................................................................................................................. 91 3. CalSPEED ................................................................................................................................ 92
IV. CONCLUSION ..................................................................................................................................... 93 V. PROCEDURAL MATTERS ................................................................................................................ 94 APPENDIX I: TRENDS IN CONSUMER USAGE
APPENDIX II: CHARACTERISTICS OF THE MOBILE WIRELESS INDUSTRY
APPENDIX III: ELEMENTS OF INTER-FIRM RIVALRY
I. INTRODUCTION
1. Mobile wireless services are an essential and ubiquitous part of Americans’ daily lives, and
competition in the provision of mobile wireless services drives innovation and investment to the ultimate benefit
of the American people and economy. In this Twentieth Mobile Wireless Competition Report (Twentieth Report
or Report), we fulfill our obligation, pursuant to Section 332(c)(1)(C) of the Communications Act (the Act), to
report annually to Congress on “competitive market conditions with respect to commercial mobile services.”1 In
particular, the Section states: “The Commission shall review competitive market conditions with respect to
commercial mobile services and shall include in its annual report an analysis of those conditions. Such analysis
shall include an identification of the number of competitors in various commercial mobile services, an analysis of
whether or not there is effective competition, an analysis of whether any of such competitors have a dominant
share of the market for such services, and a statement of whether additional providers or classes of providers in
those services would be likely to enhance competition.”2
1 47 U.S.C. § 332(c)(1)(C).
2 47 U.S.C. § 332(c)(1)(C).
Federal Communications Commission FCC-CIRC1709-08
3
2. This Twentieth Report presents and reviews available 2016 data for all mobile wireless services,
including voice, messaging, and broadband,3 and presents certain information, where available, for early 2017.4
As discussed below, our assessment of various characteristics of the mobile wireless industry described in Section
II: Characteristics of the Mobile Wireless Industry and various indicators of how service providers compete as
described in Section III: Elements of Inter-Firm Rivalry indicates that there is effective competition in the mobile
wireless service marketplace.
3. As an initial matter, we note that Section 332(c)(1)(C) does not define “effective competition” or
dictate a way to measure effective competition. In addition, there is no single definition of effective competition
that is generally accepted by economists or competition policy authorities.5 In the Eighth Report through the
Twelfth Report, the Commission, without defining the phrase “effective competition,” made a finding that the
provision of mobile wireless services was effectively competitive based on an assessment of several “structural
and performance measures of competition” over the relevant time periods.6 Beginning with the Fourteenth
Report and continuing through the Sixteenth Report, the Commission expanded its assessment of competition in
the provision of mobile wireless services to analyze a broader “mobile wireless ecosystem” that included
“upstream” and “downstream” market segments, such as network equipment, operating systems, and
applications.7 In those three Reports, the Commission concluded that, because of the complexity of the mobile
wireless ecosystem, it would not be meaningful to try to make a single, all-inclusive finding regarding effective
3 Our analysis in this Report is data-centric; it combines short discussions with substantial use of tables and charts in
accessible data formats. We also are providing many of the charts and tables in the Twentieth Report, on a dedicated website
that we intend to update before the release of the next Report as new data become available. Additional data and maps are
also available on this website. FCC, Commercial Mobile Radio Services Competition Reports, https://www.fcc.gov/reports-
research/reports/commercial-mobile-radio-services-competition-reports.
4 Some of the data are only published at year-end and are publicly available only in the middle of the following year.
Quarterly and annual SEC filings for the public wireless service providers are available soon after the release of their
financial releases; however, aggregate industry data for public and non-public service providers tend only to be available
after they have been compiled by analysts and trade associations based on their set releases. For example, all CTIA–The
Wireless Association (CTIA) data are now released based on year-end data available in its annual report published after the
close of its industry survey. For these CTIA data, we are able to present only annualized numbers with no mid-year updates.
5 Implementation of Section 6002(b) of the Omnibus Budget Reconciliation Act of 1993; Annual Report and Analysis of
Competitive Market Conditions With Respect to Mobile Wireless, Including Commercial Mobile Services, Nineteenth Report,
31 FCC Rcd 10534, 10537, para. 4 (WTB 2016) (Nineteenth Report); Implementation of Section 6002(b) of the Omnibus
Budget Reconciliation Act of 1993; Annual Report and Analysis of Competitive Market Conditions With Respect to
Commercial Mobile Services, Sixteenth Report, 28 FCC Rcd 3700, 3733-34, para. 15 (2013) (Sixteenth Report); see also Ex
Parte Submission of the United States Department of Justice, GN Docket No. 09-51, at 11 (filed Jan. 4, 2010) (“[t]he
operative question in competition policy is whether there are policy levers that can be used to produce superior outcomes, not
whether the market resembles the textbook model of perfect competition.”); Amanda B. Delp and John W. Mayo, The
Evolution of “Competition”: Lessons for 21st Century Telecommunications Policy, Review of Industrial Organization,
50:393-416 (2017) (discussing evolving and varying definitions of “effective competition” and “workable competition”).
6 See, e.g., Implementation of Section 6002(b) of the Omnibus Budget Reconciliation Act of 1993; Annual Report and
Analysis of Competitive Market Conditions With Respect to Commercial Mobile Services, Eighth Report, 18 FCC Rcd 14783,
14796-98, para. 23 (2003). Prior to the Eighth Report, the Commission observed various degrees of evolving competition in
the mobile wireless marketplace. See, e.g., Implementation of Section 6002(b) of the Omnibus Budget Reconciliation Act of
1993; Annual Report and Analysis of Competitive Market Conditions With Respect to Commercial Mobile Services, Fourth
Report, 14 FCC Rcd 10145, 10206-207, Section III (1999). The Wireless Telecommunications Bureau adopted a similar
approach in the Thirteenth Report. Implementation of Section 6002(b) of the Omnibus Budget Reconciliation Act of 1993;
Annual Report and Analysis of Competitive Market Conditions With Respect to Commercial Mobile Services, Thirteenth
Report, 24 FCC Rcd 6185 (2009).
7 See, e.g., Implementation of Section 6002(b) of the Omnibus Budget Reconciliation Act of 1993; Annual Report and
Analysis of Competitive Market Conditions With Respect to Mobile Wireless, Including Commercial Mobile Services,
Fourteenth Report, 25 FCC Rcd 11407, 11411, 11433, para. 2, Figure 1 (2010) (Fourteenth Report).

Federal Communications Commission FCC-CIRC1709-08
4
competition, and instead it presented an analysis of the competitive metrics and trends within the ecosystem.8 The
Wireless Telecommunications Bureau, acting on delegated authority, followed this same approach in the
Seventeenth Report through the Nineteenth Report.9
4. In this Twentieth Report, we conclude that the better way to fulfill our statutory obligation to
report to Congress on competition with respect to “commercial mobile services” and to analyze “whether or not
there is effective competition”10 is to return to the narrower, more well-defined scope of inquiry that the
Commission adopted in the Eighth Report through the Twelfth Report, rather than the broader inquiry that the
Commission utilized in the Fourteenth Report through the Sixteenth Report. Specifically, in this Twentieth
Report, we focus only on competition in the provision of mobile wireless services, rather than attempting to
examine the broader “mobile wireless ecosystem,” which the Commission previously found to be too complex to
make a meaningful finding regarding effective competition.11 We do not attempt to do a full market definition or
market power analysis, however, as this would involve an extremely detailed analysis of supply and demand
factors at the national and local level.12 Instead, we consider a number of facts and characteristics of the provision
of mobile wireless services, which taken together, indicate that there is effective competition.
5. Rising consumer demand and increased output. Both the number of wireless connections and
average data usage per connection have been rising in recent years.13 For example, based on CTIA data, the total
number of mobile wireless subscriber connections grew by approximately five percent, from approximately 378
million at year-end 2015 to approximately 396 million at year-end 2016.14 In addition, according to CTIA,
reported wireless data volumes totaled 13.7 trillion MB in 2016, an increase of approximately 42 percent from 9.6
trillion MB in 2015, and an increase of approximately 238 percent from the 4.1 trillion MB reported in 2014.15
Further, CTIA reports that monthly data usage per smartphone subscriber rose to an average of 3.9 GB, an
increase of approximately 39 percent from year-end 2015 to year-end 2016.16
8 See, e.g., Sixteenth Report, 28 FCC Rcd 3700, 3733, para. 14; Fourteenth Report, 25 FCC Rcd at 11411, para. 3.
9 See, e.g., Nineteenth Report, 31 FCC Rcd 10534, 10537, para. 4.
10 47 U.S.C. § 332(c)(1)(C).
11 See, e.g., Fourteenth Report, 25 FCC Rcd at 11411, 11433, para. 2, Figure 1. We note that, in Sections II.E: Facilitating
Access to Spectrum and II.F: Wireless Infrastructure, we do focus on access to spectrum and infrastructure because they can
be key indicators regarding ease of market entry and are facilitated in part by Commission policies. We also discuss devices
in Section III.B: Differentiation in Mobile Wireless Devices/Services and Advertising/Marketing in the context of how
mobile wireless service providers differentiate themselves from their rival competitors.
12 We note that in the context of Competition Report proceedings, we generally have access only to publicly available data,
unlike the circumstances in our review of proposed secondary market transactions. As noted in previous Reports, any
individual proceeding in which the Commission defines relevant product and geographic markets, such as an application for
approval of a license transfer, may lead to narrower or broader market(s) than any used, suggested, or implied in this
Twentieth Report. See, e.g., Nineteenth Report, 31 FCC Rcd at 10537, paras. 3-4; Sixteenth Report, 28 FCC Rcd at 3729-30,
para. 4. Further, as with previous Reports, this Twentieth Report does not address the merits of any license transfer
applications that are currently pending before the Commission or that may be filed in the future, which will be decided based
on the record collected in each proceeding. See, e.g., Nineteenth Report, 31 FCC Rcd 10534 (2016); Sixteenth Report, 28
FCC Rcd 3700.
13 See infra Section II.B.1: Total Connections and Subscribers; Appendix 1: Trends in Consumer Usage, Chart 2.
14 See infra Section II.B.1: Total Connections and Subscribers.
15 CTIA Wireless Industry Indices Year-End 2016, at 96. Appendix 1: Trends in Consumer Usage, Chart 1 shows annual
minutes, messages, and megabytes of wireless traffic from 2008 through 2016.
16 CTIA Wireless Industry Indices Year-End 2016, at 97. Appendix 1: Trends in Consumer Usage, Chart 2 shows average
data usage per subscriber from 2010 to 2016 for both data-capable devices and smartphones. Section II.B.1: Differentiation
in Mobile Wireless Devices/Services provides information on smartphone penetration rates.
Federal Communications Commission FCC-CIRC1709-08
5
6. Falling prices. Various measures of Average Revenue per User (ARPU) are frequently used as a
proxy for price, particularly in industries with multiple pricing plans and complex rate structures.17 In recent
years, both average revenue per connection and average revenue per MB have been falling.18 According to CTIA,
the industry ARPU per subscriber unit fell sharply during 2016 from $44.65 to $41.50, a decline of approximately
7 percent.19 According to analysis by Recon Analytics, the cost per MB has fallen significantly over the past
decade, from $1.37 per MB in 2007 to less than half a cent per MB in 2016.20 Further, from year-end 2012
through year-end 2016, while the overall CPI increased by 4.5 percent, the annual Wireless Telephone Services
CPI decreased by approximately 8 percent and the Telephone Services CPI decreased by approximately 3
percent.21
7. Network investment. Service providers have made significant investments in their networks,
which have resulted in higher broadband deployment, expanded network coverage, and increased network
densification. For example, according to CTIA, between 2010 and 2016, U.S. wireless service providers invested
$200 billion,22 and they are expected to invest over $275 billion over the next several years.23 Considering
network coverage, as of January 2017, at least four service providers covered approximately 92 percent of the
U.S. population with 3G technology or better as compared to 82 percent at the beginning of 2014.24 Further, as of
December 2016, at least four service providers covered approximately 89 percent of American consumers with
LTE.25 While more limited than in non-rural areas, LTE coverage in rural areas has also increased: As of January
2017, at least four service providers covered approximately 55 percent of the population in rural areas, an increase
from approximately 41 percent as of July 2015.26 Finally, service providers have also been densifying their
17 Implementation of Section 6002(b) of the Omnibus Budget Reconciliation Act of 1993; Annual Report and Analysis of
Competitive Market Conditions With Respect to Mobile Wireless, Including Commercial Mobile Services, Seventeenth
Report, 29 FCC Rcd 15311, 15328, para. 35 & n.52 (WTB 2014) (Seventeenth Report); Patrick McCloughan and Sean
Lyons, Accounting for ARPU: New evidence from international panel data, Telecommunications Policy 30, 521-32 (2006);
Eun-A Park, Krishna Jayakar, Competition between Standards and the Prices of Mobile Telecommunication
Services: Analysis of Panel Data, TPRC 2015 (Aug. 15, 2015). See infra Section III.A.3: Price Indicators for Mobile
Wireless Services.
18 See infra Section III.A.3: Price Indicators for Mobile Wireless Services, Charts III.A.3 and III.A.4.
19 CTIA reported an industry average measure of “Average Revenue per Reported (subscriber) Unit,” or ARPU, which is
based “upon total revenues divided by the average total reported active units per survey period, divided by the number of
months in the survey period,” i.e., an annualized monthly ARPU.
20 FierceWireless, Industry Voices—Entner: Consumer ‘Surplus’ in Wireless Rises $192B in 2 Years (Aug. 14, 2017),
http://www.fiercewireless.com/wireless/industry-voices-entner-consumer-surplus-wireless-rises-192b-2-years.
21 See infra Section III.A.3: Price Indicators for Mobile Wireless Services.
22 CTIA, Wireless Snapshot 2017, https://www.ctia.org/docs/default-source/default-document-library/ctia-wireless-
snapshot.pdf.
23 Letter from Scott K. Bergmann, Vice President, Regulatory Affairs, CTIA, to Marlene H. Dortch, Secretary, FCC, WC
Docket No. 17-84, at 1 (filed Apr. 7, 2017). The U.S. Census Bureau estimated total annual capital expenditures by wireless
service providers to be around $32.7 billion for 2015 (approximately 37% of all capital expenditures in the
telecommunications industry). U.S. Census Bureau, Annual Capital Expenditures Survey, [NAICS code 5172]
https://www.census.gov/library/publications/2017/econ/2015-aces-summary.html (last visited Sept. 1, 2017). See infra
Section III.C: Investment.
24 Web Appendix III: Elements of Inter-Firm Rivalry, https://www.fcc.gov/20th-cmrs-report-web-appendices; Seventeenth
Report, 29 FCC Rcd 15311, 15336, Chart III.A.2.
25 See infra Section III.D: Nationwide Network Coverage and Technology Upgrades.
26 Web Appendix III: Elements of Inter-Firm Rivalry, https://www.fcc.gov/20th-cmrs-report-web-appendices;
Implementation of Section 6002(b) of the Omnibus Budget Reconciliation Act of 1993; Annual Report and Analysis of
Competitive Market Conditions With Respect to Mobile Wireless, Including Commercial Mobile Services, Eighteenth Report,
30 FCC Rcd 14515, 14544, Chart III.A.5 (WTB 2015) (Eighteenth Report).

Federal Communications Commission FCC-CIRC1709-08
6
networks: Between 2013 and 2016, almost 4,000 new cell sites were added,27 and according to CTIA, there has
been an approximate 57 percent growth in the number of cell sites over the last ten years.28
8. Service quality and speed. These network investments have resulted in improved network quality
as measured by download speed. For example, the mean LTE download speed increased from 14.4 Mbps for the
first half of 2014 to 23.5 Mbps for the first half of 2017, an increase of well over 60 percent, while the median
LTE download speed increased from 11.0 Mbps to 15.5 Mbps, an increase of approximately 40 percent, over the
same time period.29
9. Access to Spectrum. Competition depends critically upon the availability of sufficient suitable
spectrum, both for new entrants and for incumbents wishing to expand their coverage and/or increase capacity.
While demand for spectrum continues to increase, reflecting increased reliance on mobile broadband usage, in
recent years the Commission has made available a significant amount of additional spectrum across a range of
frequencies.30 For example, 65 megahertz of AWS-3 spectrum was won at auction in 2015, while 70 megahertz
of 600 MHz spectrum was won in the recently concluded broadcast television incentive auction.31 In addition, in
2016, the Commission made available an additional 3250 megahertz of millimeter (mmW) spectrum, and is
considering additional mmW spectrum bands that might be made available.32 Last month, the Commission sought
input on potential opportunities in spectrum bands between 3.7 GHz and 24 GHz.33
10. Innovation and new technologies. Finally, service providers compete strongly on the
development and implementation of innovative technologies, as evidenced by the rapid deployment of LTE across
the nation, and the upgrades made since to LTE. Moreover, the mobile wireless services marketplace is on the
brink of a major technological transformation that is likely to be both competitively disruptive and transformative.
Although fifth generation (5G) cellular networking standards have yet to be finalized, several wireless service
providers already have begun 5G trials.34
II. CHARACTERISTICS OF THE MOBILE WIRELESS INDUSTRY
11. In our analysis of the mobile wireless industry, it is important to look at a variety of
characteristics, including the number and type of connections, service providers’ market shares and industry
concentration; industry revenues and profitability; and spectrum holdings and infrastructure.
27 See infra Appendix II.F: Wireless Infrastructure.
28 CTIA, Wireless Snapshot 2017, https://www.ctia.org/docs/default-source/default-document-library/ctia-wireless-
snapshot.pdf. CTIA asserts that that the number of cell sites will significantly increase as the mobile wireless industry
densifies networks and prepares for 5G. Id.
29 See infra Section III.E: Speed of Service, Chart III.E.1.
30 See infra Section II.E: Facilitating Access to Spectrum.
31 Auction Of Advanced Wireless Services (AWS-3) Licenses Closes, Winning Bidders Announced For Auction 97, Public
Notice, 30 FCC Rcd 630 (2015); Incentive Auction Closing and Channel Reassignment Public Notice; The Broadcast
Television Incentive Auction Closes; Reverse Auction and Forward Auction Results Announced; Final Television Band
Channel Assignments Announced; Post-Auction Deadlines Announced, Public Notice, 32 FCC Rcd 2786 (MB, WTB 2017)
(Closing and Channel Reassignment Public Notice).
32 Use of Spectrum Bands Above 24 GHz for Mobile Radio Services, et. al., Report and Order and Further Notice of Proposed
Rulemaking, 31 FCC Rcd 8014 (2016) (Spectrum Frontiers Order).
33 Expanding Flexible Use in Mid-Band Spectrum Between 3.7 and 24 GHz, Notice of Inquiry, FCC 17-104 (Aug. 3, 2017)
(Mid-Band Spectrum NOI).
34 See infra Section III.D.4: Coverage and Technology Upgrades by Service Provider.
Federal Communications Commission FCC-CIRC1709-08
7
A. Service Providers
12. Providers of mobile wireless services typically offer an array of mobile voice and data services,
such as interconnected mobile voice services, text and multimedia messaging, and mobile broadband services.35
Facilities-based mobile wireless service providers offer services primarily using their own network facilities,
although they sometimes rely on roaming agreements to provide service outside their coverage areas. These
facilities-based service providers may operate nationwide, multi-regional, regional, or local networks. In this
Section, we present information and available data on all mobile wireless service offerings, as well as on
individual services and segments where appropriate.
1. Facilities-Based Service Providers
13. Nationwide Service Providers. As of year-end 2016, there were four facilities-based mobile
wireless service providers in the United States that industry observers typically describe as “nationwide”: AT&T,
Sprint, T-Mobile, and Verizon Wireless. Although none of these four nationwide service providers has a network
that covers the entire land area or population of the United States, all four service providers have networks that
cover a significant portion of both. Therefore, this Report will refer to these four service providers as “nationwide
service providers.”36 Collectively, these four service providers account for over 411 million connections, over 98
percent of the nationwide total.37
14. Multi-Regional, Regional, and Local Service Providers. U.S. Cellular, currently the fifth largest
service provider in the United States, is best characterized as a multi-regional service provider. It has developed
wireless networks and customer service operations in portions of 23 states.38 As of December 31, 2016, U.S.
Cellular provided services to its customers with approximately five million connections.39 C Spire, the sixth
largest service provider nationwide, provides service in the Southeastern United States to nearly one million
subscribers.40 There are also dozens of other facilities-based service providers throughout the United States,41
35 For purposes of this Report, mobile wireless services also include certain machine-to-machine (M2M) connections, in-
vehicle connectivity, smart grid devices, home security systems, and other telematics services. We note that fixed wireless
services currently are not included in our analysis of mobile wireless services. Nineteenth Report, 31 FCC Rcd at 10538,
para. 6.
36 According to AT&T, it covers over 325 million people with its voice and data service, and over 317 million people with its
LTE network. AT&T, AT&T Has the Nation’s Largest Network to Connect with Friends and Family,
https://www.att.com/offers/network.html (last visited Sept. 1, 2017). According to Sprint, its LTE network now covers
nearly 300 million people, and it has also deployed its “LTE Plus Network” in 250 markets across the nation. Sprint, Our
Network, http://newsroom.sprint.com/about-us/our-network/ (last visited Sept. 1, 2017). According to T-Mobile, its LTE
network now covers 311 million people. T-Mobile, the Un-Carrier Fact Sheet (August 2016), https://newsroom.t-
mobile.com/doc_download.cfm?doc_id=210 (last visited Sept. 1, 2017). According to Verizon Wireless, it covers
approximately 322 million people and 2.4 million square miles with LTE. Verizon Wireless, We Have Coverage Where It
Counts, https://www.verizonwireless.com/featured/better-matters/ (last visited Sept. 1, 2017).
37 See infra Section II.B.1: Total Connections and Subscribers, Table II.B.1.
38 United States Cellular Corp., 2016 SEC Form 10-K, at 1 (filed Feb. 24, 2017),
https://www.sec.gov/Archives/edgar/data/821130/000082113017000010/USMform10k.htm. U.S. Cellular is a majority-
owned (83%) subsidiary of Telephone and Data Systems, Inc. Id.
39 Id. at 1. According to U.S. Cellular, its LTE network reached 99 percent of its customers. U.S. Cellular, U.S. Cellular
Announces 2015 Statewide Investment in Iowa, https://www.uscellular.com/about/press-room/2016/USCELLULAR-
ANNOUNCES-2015-STATEWIDE-INVESTMENT-IN-IOWA.html (last visited Sept. 1, 2017).
40 C Spire, About C Spire, https://www.cspire.com/company_info/about/more_info.jsp (last visited Sept. 1, 2017).
41 Examples of regional facilities-based service providers include Appalachian Wireless, Bluegrass Cellular, Carolina West
Wireless, Cellcom, Choice Wireless, GCI, Nex-Tech Wireless, and Sagebrush Cellular.
Federal Communications Commission FCC-CIRC1709-08
8
many of which provide service in a single, often rural, geographic area.42 These non-nationwide service providers
increase choice for consumers and help to promote deployment in rural areas.43
2. Resellers/Mobile Virtual Network Operators and Other Service Providers
15. Resellers/MVNOs. Resellers and mobile virtual network operators (MVNOs) do not own any
network facilities, but instead purchase mobile wireless services wholesale from facilities-based service providers
and resell these services to consumers.44 Agreements between an MVNO and a facilities-based service provider
may occur when the MVNO has better access to some market segments than the host facilities-based service
provider and can better target specific market segments, such as low-income consumers or consumers with lower
data-usage needs.45
16. In 2016, the largest MVNO, with approximately 26 million subscribers at year-end, was
TracFone Wireless (TracFone), an America Movil subsidiary.46 In 2015, Google launched “Project Fi,” an
MVNO in partnership with T-Mobile and Sprint. Google Fi subscribers switch between Wi-Fi networks and
42 Verizon Wireless’s LTE in Rural America (LRA) program allows Verizon Wireless to offer its customers 4G LTE
coverage in the rural areas of its rural partners, and the program allows customers of participating companies to roam on
Verizon Wireless’s 4G LTE network throughout the U.S., including Alaska. Verizon, Verizon’s LTE in Rural America
(LRA) Program Celebrates Five Years of Delivering Advanced Wireless Services to Rural Customers,
http://www.verizonwireless.com/news/article/2015/05/verizons-lte-in-rural-america-lra-program-celebrates-five-years-of-
delivering-advanced-wireless-services-to-rural-customers.html (last visited Sept. 1, 2017); Verizon, Verizon: All 21 LTE in
Rural America Carrier Partners Have Launched Service, http://www.fiercewireless.com/story/verizon-all-21-lte-rural-
america-carrier-partners-have-launched-service/2015-10-15 (last visited Sept. 1, 2017).
43 Policies Regarding Mobile Spectrum Holdings Expanding the Economic and Innovation Opportunities of Spectrum
Through Incentive Auctions, 29 FCC Rcd 6133, 6207, paras. 179-80 (2014) (Mobile Spectrum Holdings Report and Order).
44 Nineteenth Report, 31 FCC Rcd at 10540, para. 9; Sixteenth Report, 28 FCC Rcd at 3738, para. 29. See also Sprint,
Launching a Wireless Brand–Seven Things You Need to Know, http://wholesale.sprint.com/docs/default-library/seven-
requirements-of-a-successful-mvno.pdf (last visited Sept. 1, 2017) (defining an MVNO and noting that an MVNO is
“responsible for its own retail pricing, customer service, billing support systems, marketing and sales personnel”).
45 Philip Kalmus and Lars Wiethaus, On the Competitive Effects of Mobile Virtual Network Operators, Telecommunications
Policy, Vol. 34 (2010); Aniruddha Banerjee and Christian Dippon, Voluntary Relationships Among Mobile Network
Operators and Mobile Virtual Network Operators: An Economic Explanation, Information Economics and Policy, Vol. 21
(2009); see also The Yankee Group, Jason Armitage, Yankee Group’s 2011 Predictions: 4G Fuels the Decade of Disruption,
at 7 (stating, “[I]t’s critical the MVNO does not compete to any meaningful degree with the host.”).
46 TracFone, TracFone Home, http://www.tracfone.com/ (last visited Sept. 1, 2017); Prepaid Phone News, Fourth Quarter
2016 Prepaid Mobile Subscriber Numbers by Operator (Feb. 14, 2017), http://www.prepaidphonenews.com/2017/02/fourth-
quarter-2016-prepaid-mobile.html. TracFone currently operates the Straight Talk, NET 10, TracFone, Simple Mobile, Page
Plus, Total Wireless, Telcel America, and SafeLink Wireless MVNO brands, http://www.tracfonewirelessinc.com/en/brands/
(last visited Sept. 1, 2017).

Federal Communications Commission FCC-CIRC1709-08
9
these two service providers’ LTE networks.47 In 2016, both Comcast48 and Charter Communications,49 the
nation’s two largest cable providers, activated MVNO options they held with Verizon Wireless. The services
offered will utilize a combination of Wi-Fi hotspots and the Verizon Wireless network.50 Comcast launched its
service in the spring of 2017 as Xfinity Mobile,51 and Charter anticipates offering its service in 2018.52
17. Mobile Satellite Service Providers. Mobile Satellite Services (MSS) providers offer satellite-
based communications to mobile devices. Traditionally, MSS has involved voice and narrowband data services.
MSS services generally are targeted at users who require communications and asset tracking in remote areas, in
disaster response situations, or other places where terrestrial mobile wireless network access may be limited.
Examples of MSS customers include the oil industry, maritime users, public safety agencies, and other
government/military operations. In 2016, the Commission modified its rules so as to allow Globalstar, Inc.
(Globalstar) to seek authorization to use some of its MSS spectrum for low-powered terrestrial broadband
service,53 and in 2017, the Commission’s International Bureau granted Globalstar’s request to modify its
authorization pursuant to the new rules.54
18. Narrowband Data Service Providers. Narrowband data and paging services comprise a
specialized market segment within the mobile wireless industry. These services include two-way messaging, as
well as machine-to-machine (M2M) and other telemetry communications. They are consumed primarily by
businesses, government users, and other institutions.55
47 FierceWireless, Google Unveils “Project Fi” MVNO with Sprint and T-Mobile as Partners (Apr. 22, 2015),
http://www.fiercewireless.com/story/google-unveils-project-fi-mvno-sprint-and-t-mobile-partners/2015-04-22. In June 2016,
Google added U.S. Cellular as a partner. FierceWireless, Google’s Project Fi to Add U.S. Cellular to Partner Network (June
8, 2016), http://www.fiercewireless.com/story/googles-project-fi-add-us-cellular-partner-network/2016-06-08. Google
requires a Google phone (Pixel, Nexus 5X, 6, or 6P for the service). Similar Wi-Fi/Cellular hybrid services such as Republic
Wireless, Ting, and RingPlus offer their subscribers a wide range of calling plans that feature both Wi-Fi and cellular calling
along with text and data plans. Republic Wireless, Republic Wireless Home, https://republicwireless.com/ (last visited Sept.
1, 2017); Ting, Ting Home, https://ting.com/ (last visited Sept. 1, 2017); RingPlus, RingPlus Home, https://ringplus.net/ (last
visited Sept. 1, 2017).
48 FierceWireless, Comcast to Launch Wireless Service in 2017 with Verizon MVNO, 15M Wi-Fi Hotpots (Sept. 20, 2016),
http://www.fiercewireless.com/wireless/comcast-to-launch-wireless-service-2017-verizon-mvno-15m-wi-fi-hotspots.
49 FierceCable, Rutledge: Charter Has Asked Verizon to Activate MVNO Agreement (Sept. 21, 2016),
http://www.fiercecable.com/cable/rutledge-charter-has-asked-verizon-to-activate-mvno-agreement.
50 FierceCable, Rutledge: Charter Has Asked Verizon to Activate MVNO Agreement (Sept. 21, 2016),
http://www.fiercecable.com/cable/rutledge-charter-has-asked-verizon-to-activate-mvno-agreement.
51 WirelessWeek, Comcast Opens Enrollment For Its Mobile Plans With $45 Unlimited Offer (May 23, 2017),
https://www.wirelessweek.com/news/2017/05/comcast-opens-enrollment-its-mobile-plans-45-unlimited-offer.
52 FierceCable, Charter’s Rutledge: T-Mobile Doesn’t Understand Our MVNO Deal (Feb. 16, 2017),
http://www.fiercecable.com/cable/charter-s-rutledge-t-mobile-doesn-t-understand-our-mvno-deal.
53 Terrestrial Use of the 2473.5-2495 MHz Band for Low-Power Mobile Broadband Networks; Amendments to Rules for the
Ancillary Terrestrial Component of Mobile Satellite Service Systems, Report and Order, 31 FCC Rcd 13801 (2016).
54 FCC Satellite Policy Branch Information, Actions Taken, Report No. SAT-01260, Public Notice, DA 17-756 (IB Aug. 11,
2017).
55 There are approximately 7 megahertz of spectrum allocated to narrowband and paging services, and there are hundreds of
licensees for these services, including private individuals, firms, and local and state governments.

Federal Communications Commission FCC-CIRC1709-08
10
B. Connections and Subscribers
1. Total Connections and Subscribers
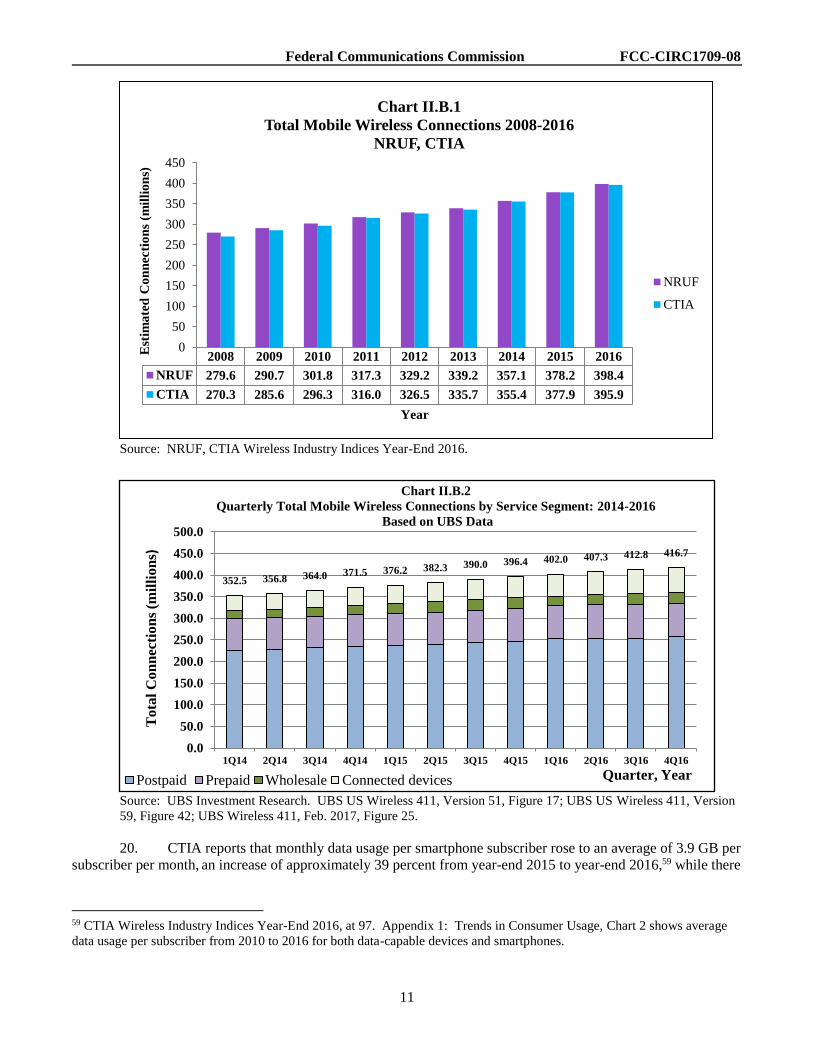
19. This Report uses several data sources to estimate the number of mobile wireless subscribers and
connections.56 One such source, Numbering Resource Utilization Forecast (NRUF), tracks the quantity of phone
numbers that have been assigned to mobile wireless devices.57 As shown in Chart II.B.1 below, the number of
mobile wireless connections in December 2015, based on NRUF, was approximately 378 million, and during
2016, that number grew by approximately five percent to reach approximately 398 million by year-end 2016,
while CTIA and UBS estimates were relatively similar.58 Chart II.B.2 presents data on total connections by
service segment based on UBS data. It shows that, in 2016, the postpaid segment accounted for more than 60
percent of the total connections, the prepaid segment accounted for approximately 20 percent of the total
connections, while wholesale connections and connected devices accounted for the remaining approximately 20
percent of total mobile wireless connections.
56 Different sources refer to their data as connections or subscribers, and they may have changed the terminology they use
during the periods in which we present their data. When discussing the different data, we will use the terminology most
currently used by the source, and where possible, provide a definition of this term. For example, CTIA explains their use of
the terms “subscribers” and “connections” as follows: “‘Subscribers’ is used as a term of art, and reflects the number of
revenue-generating units, equally describable as ‘wireless connections’ – the equivalent of wireline ‘lines.’ The terms
‘subscriber’ and ‘subscribership’ do not denote unique individual subscribers. Indeed, the growing categories of non-
traditional devices and machine-to-machine applications mean that the term ‘subscribers’ is increasingly less descriptive of a
growing share of the universe of active units. Nonetheless, individual users still number in the hundreds of millions.” CTIA
Wireless Industry Indices Year-End 2016, at 12. Appendix II: Characteristics of the Mobile Wireless Industry, Tables II.B.i-
ii provide detailed data on total mobile wireless connections, and total mobile wireless connections by service segment.
57 When all mobile wireless devices were assigned telephone numbers and subscribers generally carried one mobile device
for making voice calls, NRUF data were a reasonably accurate measure of subscribership. Currently, however, consumers
frequently use more than one mobile device that has been assigned a telephone number, particularly non-voice devices, such
as Internet access devices (e.g., wireless modem cards and mobile Wi-Fi hotspots), e-readers, tablets, and telematics systems.
In addition, certain service providers do not assign telephone numbers to at least some of the devices on their networks.
Therefore, rather than measuring the number of individual subscribers, NRUF provides a measure of the number of mobile
wireless connections or connected devices that have assigned telephone numbers. As the number of mobile wireless devices
that lack telephone numbers increases, the NRUF data will become less accurate.
58 CTIA estimated that the total number of mobile wireless subscriber connections grew by approximately 5%, from
approximately 378 million at year-end 2015 to approximately 396 million at year-end 2016. According to another data
source, UBS, the total number of wireless connections rose from approximately 397 million in the 4Q2015 to approximately
417 million in 4Q2016, an increase of approximately 5%. UBS US Wireless 411, February 2017, Figure 25.
Federal Communications Commission FCC-CIRC1709-08
11
Source: NRUF, CTIA Wireless Industry Indices Year-End 2016.
Source: UBS Investment Research. UBS US Wireless 411, Version 51, Figure 17; UBS US Wireless 411, Version
59, Figure 42; UBS Wireless 411, Feb. 2017, Figure 25.
20. CTIA reports that monthly data usage per smartphone subscriber rose to an average of 3.9 GB per
subscriber per month, an increase of approximately 39 percent from year-end 2015 to year-end 2016,59 while there
59 CTIA Wireless Industry Indices Year-End 2016, at 97. Appendix 1: Trends in Consumer Usage, Chart 2 shows average
data usage per subscriber from 2010 to 2016 for both data-capable devices and smartphones.
2008 2009 2010 2011 2012 2013 2014 2015 2016
NRUF 279.6 290.7 301.8 317.3 329.2 339.2 357.1 378.2 398.4
CTIA 270.3 285.6 296.3 316.0 326.5 335.7 355.4 377.9 395.9
0
50
100
150
200
250
300
350
400
450
Est
ima
ted
Co
nn
ecti
on
s (m
illi
on
s)
Year
Chart II.B.1
Total Mobile Wireless Connections 2008-2016
NRUF, CTIA
NRUF
CTIA
352.5 356.8 364.0 371.5 376.2 382.3 390.0 396.4 402.0 407.3 412.8 416.7
0.0
50.0
100.0
150.0
200.0
250.0
300.0
350.0
400.0
450.0
500.0
1Q14 2Q14 3Q14 4Q14 1Q15 2Q15 3Q15 4Q15 1Q16 2Q16 3Q16 4Q16
Tota
l C
on
nec
tion
s (m
illi
on
s)
Quarter, Year
Chart II.B.2
Quarterly Total Mobile Wireless Connections by Service Segment: 2014-2016
Based on UBS Data
Postpaid Prepaid Wholesale Connected devices
Federal Communications Commission FCC-CIRC1709-08
12
was a slight drop in total annual minutes of voice use (MOUs).60 In addition, total messaging traffic amounted to
around 1.94 trillion messages for 2016, down from around 2.11 trillion messages in December 2015, a decrease of
approximately 8 percent, and attributable to a sharp decrease in SMS/text messaging traffic of approximately 12
percent.61 Cisco’s Visual Networking Index (VNI) reported that as of September 2016, average data usage in
North America was approximately 3.2 GB a month for an Android user and approximately 4.8 GB per month for
an iOS user.62 Ericsson, in its November 2016 North American Mobility report, indicated that data traffic per
active smartphone user equaled approximately 5.1 GB per month in 2016,63 while Cisco reported that
smartphones in the United States consumed an average of 4.4 GB of mobile data per month in 2016.64 This trend
in increasing data use appears due to multiple factors, including the increased adoption of smartphones and
tablets, growth in streaming video, and the development of faster networks. According to Pew’s survey, by the
end of 2016, smartphone and tablet ownership were 77 percent and 51 percent, respectively, up from 35 percent
and 10 percent, in 2011.65 As of January 2017, Pew reported that just over one in ten American adults are
“smartphone-only” Internet users—they own a smartphone, but do not have traditional home broadband service.66
According to preliminary data from the Centers for Disease Control and Prevention (CDC), from December 2013
to December 2016, the percentage of U.S. households that were identified as wireless-only increased from
approximately 41 percent to approximately 51 percent, making 2016 the first year in which a majority of U.S.
households were wireless-only households.67
21. In addition to providing mobile wireless services directly to consumers and businesses, service
providers may also provide M2M services.68 There are limited statistics on M2M communications.69 Many
60 CTIA Wireless Industry Indices Year-End 2016, at 91. Total annual minutes of voice use (MOUs) dropped slightly to 2.75
trillion in 2016, a decrease of approximately 5% compared to year-end 2015. Id.
61 CTIA Wireless Industry Indices Year-End 2016, at 96, 99.
62 Cisco, Cisco Visual Networking Index: Global Mobile Data Traffic Forecast Update, 2016-2021 White Paper, at 29 (Feb.
7, 2017), http://www.cisco.com/c/en/us/solutions/collateral/service-provider/visual-networking-index-vni/mobile-white-
paper-c11-520862.html. Global mobile data traffic is predicted to grow at a Compound Annual Growth Rate (CAGR) of
47% from 2016 to 2021, resulting in 49 exabytes per month by 2021. Id. at 3.
63 Ericsson, Ericsson Mobility Report, On the Pulse of the Networked Society, at 2 (November 2016),
https://www.ericsson.com/assets/local/mobility-report/documents/2016/ericsson-mobility-report-november-2016.pdf.
64 Cisco, VNI Mobile Forecast Highlights 2016-2021,
http://www.cisco.com/assets/sol/sp/vni/forecast_highlights_mobile/#~Country (last visited Sept. 1, 2017).
65 Pew Research Center, Mobile Fact Sheet (Jan. 12, 2017), http://www.pewinternet.org/fact-sheet/mobile/ (last visited Sept.
1, 2017).
66 Pew Research Center, Mobile Fact Sheet (Jan. 12, 2017), http://www.pewinternet.org/fact-sheet/mobile/ (last visited Sept.
1, 2017).
67 CDC, NCHS, Stephen J. Blumberg and Julian V. Luke, Wireless Substitution: Early Release of Estimates from the
National Health Interview Survey, July-December 2016, National Center for Health Statistics (May 2017),
https://www.cdc.gov/nchs/data/nhis/earlyrelease/wireless201705.pdf.
68 M2M is a subset of the larger Internet-of-Things (IoT), and due to differing definitions, researchers may be including or
excluding connections that are not specifically defined by the industry as M2M. These variations make it difficult to
compare data from multiple reported sources. The IoT is seen by some commentators as the next major opportunity for
providing advanced connections among devices, and many industries such as healthcare are beginning to use M2M networks
to connect their numerous smart devices and machines. The Ericsson Mobility Report predicts that between 2016 and 2022,
IoT will rapidly increase at a CAGR of 21%, making up over 18 billion of the total forecast of 29 billion connected devices in
2022. Ericsson, Ericsson Mobility Report, On the Pulse of the Networked Society, at 33 (November 2016),
https://www.ericsson.com/assets/local/mobility-report/documents/2016/ericsson-mobility-report-november-2016.pdf.
69 As of 1Q2017, Chetan Sharma Consulting reports that connected devices for the U.S. accounted for 63% of net subscriber
additions. Chetan Sharma, Industry Research (Q1 2017), http://www.chetansharma.com/consulting/market-research. For
2016, Cisco reports 109 million U.S. M2M connections, an increase of 58% from 2015. Cisco, VNI Mobile Highlights 2016-
Federal Communications Commission FCC-CIRC1709-08
13
research firms forecast that the overall trends for M2M will become more significant as new and existing network
service providers continue to deliver connectivity between devices, sensors, monitors, etc., and their networks.70
5G networks and services71 are expected to usher in an era of explosive growth for M2M.72
22. Table II.B.1 presents data on total mobile wireless connections for the largest service providers
operating in the United States.73
2021 (M2M Connections and Traffic), http://www.cisco.com/assets/sol/sp/vni/forecast_highlights_mobile/.
70 See, e.g., McKinsey & Company, McKinsey Global Institute, The Internet of things: Mapping the Value Beyond the Hype
(June 2015),
http://www.mckinsey.com/~/media/McKinsey/Business%20Functions/McKinsey%20Digital/Our%20Insights/The%20Intern
et%20of%20Things%20The%20value%20of%20digitizing%20the%20physical%20world/Unlocking_the_potential_of_the_I
nternet_of_Things_Executive_summary.ashx; see generally Thierer, A. and Castillo, A., Mercatus Center at George Mason
University, Projecting the Growth and Economic Impact of the Internet of Things (June 15, 2015),
https://www.mercatus.org/system/files/IoT-EP-v3.pdf.
71 We do not intend to define what qualifies as “5G” in this Report. Standard bodies like the Third Generation Partnership
Project (3GPP) and the International Telecommunication Union (ITU) plan to develop requirements for 5G by the middle of
2018. 3GPP, 5G-NR Workplan for eMBB (Mar. 9, 2017), http://www.3gpp.org/news-events/3gpp-news/1836-
5g_nr_workplan.
72 See, e.g., Cisco, VNI Mobile Highlights, 2016-2021, http://www.cisco.com/assets/sol/sp/vni/forecast_highlights_mobile/.
“In the United States, the number of mobile-connected M2M modules will grow 5.4-fold between 2016 and 2021, reaching
587 million in number.”
73 We note that C Spire’s total number of connections is not reflected in Table II.B.1. C Spire is the largest privately held
service provider in the U.S., and states that it has nearly one million subscribers. C Spire, About C Spire,
http://www.cspire.com/company_info/about/more_info.jsp (last visited Sept. 1, 2017).

Federal Communications Commission FCC-CIRC1709-08
14
Table II.B.1
Estimated Total Connections for Publicly Traded Facilities–Based Mobile
Wireless Service Providers (in thousands): 2013–201674
Nationwide Service Providers EOY 2013 EOY 2014 EOY 2015 EOY 2016 EOY 2016
(%)
Verizon Wireless 125,535 134,612 140,924 145,859 35.0
AT&T 110,276 120,620 128,679 134,875 32.4
T-Mobile 46,684 55,018 63,282 71,455 17.1
Sprint 54,622 55,929 58,578 59,515 14.3
Nationwide Service Provider Total 337,117 366,179 391,463 411,704
Regional Service Providers EOY 2013 EOY 2014 EOY 2015 EOY 2016 EOY 2016
(%)
U.S. Cellular 4,774 4,760 4,876 5,079 1.2
Leap Wireless 4,551 * * * *
NTELOS 465 449 306 * *
Cincinnati Bell 340 82 * * *
Regional Service Provider Total 10,130 5,291 5,182 5,079 1.2
Total Estimated Connections 347,247 371,470 396,645 416,783
Source: UBS US Wireless 411, Version 51, Table 21; Version 59, Figure 53; UBS Wireless 411, Feb. 2017, Figure 33.
Total estimated connections figure includes data only for the service providers reported in this table.
2. Net Additions
23. As shown in Chart II.B.3 below, for 2016, there were approximately 20 million net additions
based on NRUF data, compared with 18 million based on CTIA data. Preliminary subscriber data as reported by
service providers on Form 477 show that for 2016, net subscriber additions totaled approximately seven million.75
Chart II.B.4 below shows net additions broken down by service segment: It shows that postpaid net additions
peaked during 2014, and have declined through 2016. Chart II.B.4 further shows that the net number of
connected device additions was consistently higher than prepaid additions, from 2013 through 2016.76 Finally, it
indicates that, during 2013 through 2016, prepaid additions did not make up a significant percentage of total net
additions.
74 Asterisks (*) indicate that the service provider is no longer separately reporting financial results. Shentel, a Sprint affiliate,
acquired nTelos in 2016; AT&T acquired Leap Wireless in 2014; and Cincinnati Bell shut down its mobile operations in
February 2015.
75 Based on Form 477, the preliminary total number of mobile voice telephone subscriptions at year-end 2016 was 341.3
million, as compared to 334.6 million at year-end 2015. We again note that the year-end Form 477 data are preliminary only,
and the final data will be published in due course by the agency. See, e.g., FCC, Wireline Competition Bureau, Voice
Telephone Services: Status as of December 31, 2015 (November 2016),
https://apps.fcc.gov/edocs_public/attachmatch/DOC-342357A1.pdf.
76 Appendix II: Characteristics of the Mobile Wireless Industry, Table II.B.iii provides detailed data on quarterly net
additions by service segment.
Federal Communications Commission FCC-CIRC1709-08
15
Source: NRUF, CTIA Wireless Industry Indices Year-End 2016, Form 477.
Source: UBS Investment Research. UBS US Wireless 411, V. 59, Figure 42; UBS US Wireless 411, Feb. 2017, Figure 25.
24. Chart II.B.5 below shows net subscriber additions by the four nationwide service providers from
2013 through 2016. Throughout this period, AT&T and Verizon Wireless consistently showed strong net
additions. T-Mobile, which nearly doubled its net additions between 2013 and 2014, led the industry in this
metric for 2015 and 2016. Sprint showed a strong upward trend in 2015, and maintained that growth in 2016.
10.0
17.9
21.120.2
9.2
19.7
22.5
18.0
4.2
11.8 11.9
6.8
0.0
5.0
10.0
15.0
20.0
25.0
2013 2014 2015 2016
Net
Ad
dit
ion
s (m
illi
on
s)
Year
Chart II.B.3
Total Mobile Wireless Connections Annual Net Additions (2013-2016)
NRUF
CTIA
Form 477
0
5,000
10,000
15,000
20,000
25,000
30,000
2013 2014 2015 2016Net
Adds
(thousa
nds)
2013 2014 2015 2016
Total 11,922 23,475 25,396 21,839
Prepaid 1,167 703 1,136 1,619
Wholesale 1,458 1,646 4,466 3,838
Connected Devices 4,601 6,966 8,211 8,578
Postpaid 4,696 14,161 11,401 7,804
Chart II.B.4
Annual Net Additions by Service Segment
2013 - 2016

Federal Communications Commission FCC-CIRC1709-08
16
Source: UBS Investment Research. UBS US Wireless 411, Version 51, Figure 14; UBS US Wireless 411, Version 59,
Figure 62; UBS Wireless 411 Feb. 2017, Figure 35.
3. Churn
25. Churn measures the number of connections that are disconnected from mobile wireless service
during a given period time period; it is usually expressed as a percentage.77 A service provider’s churn rate
depends on many factors, including the distribution of its customers between postpaid and prepaid service plans,
customer satisfaction with their service provider, and switching costs.78 High levels of industry churn can indicate
that consumers are not only willing but are also able to readily switch between service providers.
26. According to UBS, the industry weighted average monthly churn rates from the first quarter of
2013 to the fourth quarter of 2016 have ranged from 1.42 percent to 1.85 percent.79 For 2016, CTIA calculated an
annual industry-wide churn rate of 26.3 percent, and a monthly rate of 2.21 percent,80 while for prepaid services,
CTIA reported an annual industry-wide churn rate of 57.5 percent and a monthly churn rate of 4.79 percent.81 For
the fourth quarter of 2016, churn rates of the nationwide service providers, as shown in Chart II.B.6 below, were
77 Churn is calculated by dividing the aggregate number of wireless subscriber connections who canceled service during a
time period by the total number of wireless subscriber connections at the beginning of that time period. The churn rate for a
time period that is longer than a month is equal to the weighted average of the churn rate for each month of that period (e.g.,
the three months in a quarter or the twelve months for an annual churn rate). Thus, a monthly churn rate of 1% averaged over
the three-month reporting period would also be reported as 1%. For an annual calculation, if a service provider has an
average monthly churn rate of 2%, the service provider would lose 24% of its subscribers over the course of a year. Service
providers publish their monthly churn rate information as part of their quarterly filings with the SEC.
78 Nineteenth Report, 31 FCC Rcd at 10546-47, para. 18; Sixteenth Report, 28 FCC Rcd at 3865, para. 260.
79 UBS Investment Research. UBS US Wireless 411, February 2017, Figure 35.
80 CTIA Wireless Industry Indices Year-End 2016, at 40.
81 Id. at Appendix C, 11.
2013 2014 2015 2016
Verizon 8,868 9,235 6,276 4,955
AT&T 2,721 5,608 8,059 6,196
Sprint (2,500) 575 2,649 2,411
T-Mobile 4,300 8,334 8,264 8,173
(4,000)
(2,000)
-
2,000
4,000
6,000
8,000
10,000
Net
Su
bsc
rib
er A
dd
itio
ns
(Th
ou
san
ds)
Chart II.B.5
Annual Net Additions by Service Provider: 2013-2016

Federal Communications Commission FCC-CIRC1709-08
17
1.3 percent for Verizon Wireless, 1.7 percent for AT&T and T-Mobile, and 2.2 percent for Sprint. In the fourth
quarter of 2016, industry weighted monthly churn was 1.61 percent, its highest in two years.82
Source: UBS Investment Research. UBS US Wireless 411, Version 49, Table 16. UBS US Wireless 411, Version 51,
Figure 28. UBS US Wireless 411, Version 59, Figure 60; UBS US Wireless 411 Feb. 2017, Figure 35.
4. Penetration Rates by Geographic Area
27. To better understand the number of connections across geographic areas, for this Report we have
estimated penetration rates (the number of mobile wireless connections per 100 people), using NRUF
subscriber/connection data, for the 172 EAs of the United States. Our estimates suggest that 2016 regional
penetration rates range from a low of 97 percent in Fayetteville-Springdale-Rogers, AR-MO to a high of 174
percent in Detroit-Ann Arbor-Flint, MI.83 That NRUF-based penetration rates can exceed 100 percent (including
the nationwide penetration rate) is not surprising,84 since NRUF identifies the number of connected devices that
have associated telephone numbers, and a single subscriber may have multiple connected devices.85
82 UBS Investment Research, Wireless Telecommunications Wireless 411: A Difficult Market Asking for Repair?, at 19
(Feb. 2017).
83 Web Appendix II: Characteristics of the Mobile Wireless Industry (EA Penetration Rates: 2013-2016),
https://www.fcc.gov/20th-cmrs-report-web-appendices provides more details.
84 At the end of 2016, the penetration rate was at least 100 percent in 160 of 172 EAs.
85 According to the U.S. Census Bureau, the combined population of the 50 states, the District of Columbia, and Puerto Rico,
as of July 1, 2016, was estimated to be 326.5 million. U.S. Census Bureau, American FactFinder,
https://factfinder.census.gov/faces/tableservices/jsf/pages/productview.xhtml?pid=PEP_2016_PEPANNRES&src=pt (last
visited Sept. 1, 2017). We note that, if NRUF is used to calculate a mobile wireless penetration rate (of a population), then
that penetration rate is overstated due to the number of individuals who have more than one mobile wireless device.
1Q13 2Q13 3Q13 4Q13 1Q14 2Q14 3Q14 4Q14 1Q15 2Q15 3Q15 4Q15 1Q16 2Q16 3Q16 4Q16
AT&T 1.4% 1.4% 1.3% 1.4% 1.4% 1.5% 1.4% 1.6% 1.4% 1.3% 1.3% 1.5% 1.4% 1.4% 1.5% 1.7%
Verizon Wireless 1.3% 1.2% 1.3% 1.2% 1.2% 1.2% 1.3% 1.4% 1.3% 1.2% 1.2% 1.2% 1.2% 1.2% 1.3% 1.3%
Sprint 2.5% 3.2% 2.3% 2.2% 3.2% 2.4% 2.3% 2.4% 2.1% 2.3% 2.2% 2.5% 2.3% 2.1% 2.1% 2.2%
T-Mobile 3.3% 2.6% 2.5% 2.5% 2.6% 2.1% 2.2% 2.5% 2.0% 2.0% 1.9% 1.9% 1.7% 1.7% 1.7% 1.7%
0.0%
0.5%
1.0%
1.5%
2.0%
2.5%
3.0%
3.5%
Ch
urn
Ra
te
Chart II.B.6
Quarterly Churn Rate for Nationwide Mobile Wireless Providers
1st Quarter 2013- 4th Quarter 2016
Federal Communications Commission FCC-CIRC1709-08
18
5. Subscriber Demographics
28. Household income and age are correlated with overall mobile wireless subscription rates as well
as smartphone subscription rates. Based on January 2017 survey data from ComScore MobiLens,86 Chart II.B.7
below shows the percentage of mobile wireless subscribers overall, and smartphone subscribers in particular, who
fall within various income classes, as well as the overall percentage of U.S. households that fall within the same
income range. The chart shows that mobile wireless subscribers and smartphone subscribers are more likely to
have higher incomes. For example, approximately 22 percent of the population lives in households with an
annual income of less than $25,000, but only approximately 18 percent of mobile wireless users and
approximately 15 percent of smartphone users are in this bracket. Conversely, approximately 26 percent of the
population live in households with an annual income over $100,000, but approximately 28 percent of mobile
wireless subscribers and approximately 31 percent of smartphone subscribers are in this income bracket.
Source: ComScore, MobiLens Audience Profile January 2017, and U.S. Census Bureau.
29. Chart II.B.8 below shows the composition of mobile users by age. Although the percentage of
mobile devices is evenly distributed across age groups, smartphone ownership is somewhat more concentrated in
younger age groups.
86 Survey data based on ComScore MobiLens, January 2017. ComScore MobilLens U.S. data are derived from a monthly
survey of approximately 30,000 respondents ages 13 and older, who are recruited to represent U.S. Census demographics.
The total universe size is estimated from data provided by CTIA and comScore’s monthly subscriber studies. Income data
are found in Income and Poverty in the United States: 2015 by the U. S. Census Bureau, Table A-1: Households by Total
Money Income, Race, and Hispanic Origin of Householder: 1967 to 2015 (Sept. 2016),
https://www.census.gov/content/dam/Census/library/publications/2016/demo/p60-256.pdf.
22.0% 18.2% 15.4%
22.7%21.1%
20.1%
16.7%19.0%
19.1%
12.1% 13.7%14.5%
26.4% 28.0% 30.9%
U.S. Households U.S. Mobile Subscribers U.S. Smartphone Subscribers
Chart II.B.7
Total U.S. Households, Mobile Subscribers and Smartphone Subscribers
by Income Bracket (January 2017)
$100k+
$75k to <$100k
$50k to <$75k
$25k to <$50k
<$25k
*CTIA - 395.9
million (12/2016)
*NRUF - 398.4
million (12/2016)
.

Federal Communications Commission FCC-CIRC1709-08
19
Source: ComScore MobiLens, 3-Month Average, January 2017.
C. Market Shares and Concentration
30. Revenues and customers (or in the case of wireless, subscribers and/or connections) are often
used to measure the size of an industry and a company. In turn, the size of a company relative to the total size of
the industry determines its market share. In general, changes in market share may provide a signal of the relative
competitiveness of a company's products or services. In 2016, total wireless service revenues were approximately
$189 billion, a year-over-year decrease of $3.4 billion (or approximately two percent).87 Providers’ service
revenues and market shares by service revenues are shown in Table II.C.1 below. In addition, Table II.B.1 above
shows market shares by connections/subscribers for year-end 2016.
31. By year-end 2016, the four nationwide service providers accounted for approximately 98 percent
of the nation’s mobile wireless service revenue, up from approximately 96 percent in 2013. As shown in Table
II.C.1, AT&T and Verizon Wireless continued to maintain the largest market shares in 2016, while Sprint’s
market share declined from approximately 15 percent in 2014 to approximately 13 percent in 2016, and T-
Mobile’s market share increased from approximately 12 percent to approximately 15 percent over that same time
period.88
87 CTIA Wireless Industry Indices Year-End 2016, at 45. Total wireless service providers’ revenues, as reported by CTIA,
include monthly service fees, usage-related charges, activation charges, vertical services (voicemail, enhanced calling
features, and other services), out-collect roaming revenues, and data service revenues. Prepaid revenues increased
approximately six percent to $27.1 billion in 2016, and accounted for slightly more than 14 percent of total wireless
industry revenues. CTIA Wireless Industry Indices Year-End 2016, Appendix C, at 15.
88 Based on service revenues, the market share for regional service providers fell from close to 5 percent in 2013 to under 2
percent by year-end 2016. These estimates are based on UBS US Wireless 411 Reports, which do not provide subscriber
numbers for C Spire, a privately held regional service provider that has approximately one million subscribers.
6.9% 7.7%
12.2% 14.1%
17.0%19.6%
16.0%
17.8%
16.9%
17.3%
15.7%
13.7%
15.4%9.9%
U.S. Mobile Phone Subscribers U.S. Smartphone Subscribers
Per
cen
t o
f S
ub
scrib
ers
Chart II.B.8
Total Mobile Subscribers Compared to Smartphone Subscribers, by
Age
January 2017
65+ yrs old
55-64 yrs old
45-54 yrs old
35-44 yrs old
25-34 yrs old
18-24 yrs old
13-17 yrs old
Federal Communications Commission FCC-CIRC1709-08
20
Table II.C.1
Service Revenues and Market Shares Based on Service Revenues for Mobile Wireless
Service Providers ($ millions), 2008–2016
Source: UBS Investment Research. UBS US Wireless 411, Feb. 2017, Figure 36.
32. Market Concentration (NRUF Subscriber/Connection Data). The Commission employs the
Herfindahl-Hirschman Index (HHI), a widely-accepted measure of market concentration in competition analysis,
to measure mobile wireless concentration. The HHI is calculated by summing the squared market shares of all
firms in any given market.89 In this Report, we calculate HHIs based on the NRUF data by Economic Area (EA)
to maintain continuity with past Reports,90 and to ensure that we do not compromise the confidential information
found in the NRUF data.91 Although high market concentration levels in a given market may raise some concern
that a market is not competitive, this is not necessarily the case.92 To evaluate the competitiveness of any market,
one must consider multiple factors, including prices and trends in prices, non-price rivalry, investment,
89 To the extent that this Report uses the term “markets,” we do not intend it to be interpreted as synonymous with the
concept of the “relevant market,” which the Commission defines in the context of secondary market transactions review. See,
e.g., Applications of AT&T Inc., Leap Wireless International, Inc., Cricket License Co., LLC and Leap Licenseco, Inc. for
Consent To Transfer Control and Assign Licenses and Authorizations, Memorandum Opinion and Order, 29 FCC Rcd 2735,
2735, para. 27 (WTB, IB 2014) (AT&T-Leap Order).
90 Following widespread industry practices, the Commission generally attributes the subscribers of MVNOs to their host
facilities-based service providers, including when it calculates market concentration metrics.
91 NRUF subscriber data indicate the number of assigned phone numbers that a wireless service provider has in a particular
wireline rate center (there are approximately 18,000 rate centers in the country). Rate centers are geographic areas used by
local exchange carriers for a variety of reasons, including the determination of toll rates. Harry Newton, Newton’s Telecom
Dictionary: 19th Expanded & Updated Edition 660 (July 2003). All mobile wireless service providers must report to the
Commission the quantity of their phone numbers that have been assigned to end users, thereby permitting the Commission to
calculate the total number of mobile wireless subscribers. For purposes of geographical analysis, the rate center data can be
associated with a geographic point, and all of those points that fall within a county boundary can be aggregated together and
associated with much larger geographic areas based on counties. We note that the aggregation to larger geographic areas
reduces the level of inaccuracy inherent in combining non-coterminous areas, such as rate center areas and counties.
92 It is well understood that we can observe intense competition even with a small number of firms in the market. See, e.g.,
Ernest Gellhorn, Antitrust Law and Economics (4th ed.), West Publishing, 1994, at 117 (stating “[m]arket shares are not
synonymous with market power; they should mark the beginning for careful analysis, not the end of it.”); Michael Whinston,
Antitrust Policy toward Horizontal Mergers, in Handbook of Industrial Organization, Vol. 3, ed. Mark Armstrong and Robert
Porter (Elsevier, 2007); John Sutton, Sunk Costs and Market Structure, MIT Press, 1991; Joseph Farrell and Carl Shapiro,
Antitrust Evaluation of Horizontal Mergers: An Economic Alternative to Market Definition, The B.E. Journal of Theoretical
Economics, Vol.10, Issue 1, Article 9; Gregory J, Werden and Luke M. Froeb, Unilateral Competitive Effects of Horizontal
Mergers in Handbook of Antitrust Economics, ed. Paolo Buccirossi, (Cambridge: MIT Press, 2008).
Service Providers 2013 2014 2015 2016
Revenue Market
Share
Revenue Market
Share
Revenue Market
Share
Revenue Market
Share
Verizon Wireless 69,033 36.5% 72,630 38.7% 70,396 38.1% 66,580 36.8%
AT&T 61,552 32.5% 61,032 32.5% 59,837 32.4% 59,386 32.8%
T-Mobile 20,535 10.9% 22,375 11.9% 24,821 13.5% 27,844 15.4%
Sprint 29,263 15.5% 27,959 14.9% 25,845 14.0% 24,215 13.4%
U.S. Cellular 3,595 1.9% 3,398 1.8% 3,350 1.8% 3,051 1.7%

Federal Communications Commission FCC-CIRC1709-08
21
innovation, and any barriers to entry.93 As of year-end 2013, the weighted average HHI (weighted by population
across the 172 EAs in the United States) for mobile wireless services was 3,027. As of year-end 2016, the
weighted average HHI for mobile wireless services was 3,101.94 Chart II.C.1 shows the relationship between the
HHI by EA and EA population densities. This chart indicates that HHI values tend to decline as the population
density increases. The most concentrated EAs tend to be more rural, while major metropolitan areas lie in the
least concentrated EAs. This likely reflects greater demand and greater cost efficiencies (per-user mobile wireless
network deployment costs tend to decrease with increases in the population density) in more densely-populated
areas.95
93 Applications of AT&T Inc. and DIRECTV For Consent to Assign or Transfer Control of Licenses and Authorizations,
Memorandum Opinion and Order, 30 FCC Rcd 9131, 9140, paras. 19-20 (2015); AT&T-Leap Order, 29 FCC Rcd at 2756-
57, para. 49; Applications of AT&T Wireless Services, Inc. and Cingular Wireless Corporation, Memorandum Opinion and
Order, 19 FCC Rcd 21522, 21544-45, paras. 41-42 (2004).
94 Antitrust authorities in the United States generally classify markets into three types: Unconcentrated (HHI < 1500),
Moderately Concentrated (1500 < HHI < 2500), and Highly Concentrated (HHI > 2500). U.S. Department of Justice and the
Federal Trade Commission, Horizontal Merger Guidelines (Aug. 19, 2010),
http://www.justice.gov/atr/public/guidelines/hmg-2010.pdf. The Commission’s initial HHI screen identifies, for further case-
by-case market analysis, those markets in which, post-transaction: (1) the HHI would be greater than 2800 and the change in
HHI would be 100 or greater; or (2) the change in HHI would be 250 or greater, regardless of the level of the HHI. See, e.g.,
Sprint-Shentel-NTELOS Order, 31 FCC Rcd at 3639, para. 17 & n.50; AT&T-Leap Order, 29 FCC Rcd at 2753, para. 41 &
n.140.
95 Relatively high fixed costs in relation to the number of customers may limit the number of firms that can enter and survive
in a market. See, e.g., John Sutton, Sunk Costs and Market Structure, MIT Press, 1991; Luis Cabral, Introduction to
Industrial Organization, MIT Press, 2000, Chapter 14; Dennis W. Carlton and Jeffrey M. Perloff, Modern Industrial
Organization (4th ed.), Addison, Wesley, Longman, Inc., 2005, at 41; George S. Ford, et al., Competition After Unbundling:
Entry, Industry Structure, and Convergence, Federal Communications Law Journal, 2007, 59:2, at 332, 337.
0
1,000
2,000
3,000
4,000
5,000
6,000
7,000
8,000
0 200 400 600 800 1,000 1,200
HH
I
Population per Square Mile
Chart II.C.1
2016 HHIs Plotted Against 2010 EA Population Density
Source: NRUF, Census

Federal Communications Commission FCC-CIRC1709-08
22
D. Profitability
33. In the absence of the data necessary to estimate economic profits,96 accounting profits can instead
be estimated using various metrics available to wireless industry observers,97 though we note that economists have
questioned the use of accounting profits.98 One such common accounting profits metric, based on company data
reported to the Securities and Exchange Commission (SEC), is EBITDA (Earnings before Interest, Taxes,
Depreciation, and Amortization). As shown in Table II.D.1 below, for the five largest facilities-based mobile
wireless service providers in 2016, EBITDA per subscriber ranged from a low of $11.05 (U.S. Cellular) to a high
of $22.71 (Verizon Wireless). A second indicator of mobile wireless profitability is the EBITDA margin, which
expresses EBITDA as a percentage of service revenue. Dividing EBITDA by service revenues facilitates cross-
provider comparisons. The EBITDA margin of seven publicly reported mobile service providers for the past four
years is shown in Chart II.D.1. As of year-end 2016, the EBITDA margins of the four nationwide service
providers ranged from approximately 35 percent for T-Mobile to approximately 53 percent for Verizon Wireless.
Table II.D.1
Annual EBITDA per Subscriber ($/month), 2013–2016
Mobile Wireless Service
Providers 2013 2014 2015 2016
Verizon Wireless 23.56 22.67 23.70 22.71
AT&T 19.55 18.39 18.74 18.30
Sprint 7.53 9.14 11.01 13.00
T-Mobile 10.08 9.20 10.39 11.80
U.S. Cellular 7.34 6.01 11.74 11.05
Source: UBS US Wireless 411, Feb. 22, 2017, Figure 37. Annual figures are calculated by taking the
average of each quarter for each year.
96 Economic profit is defined as total revenue minus total costs including opportunity costs. One of the main distinctions
between economic profit and accounting profit is capital costs, which reflect a firm’s opportunity costs. Dennis Carlton and
Jeffrey Perloff, pp. 247-52, Modern Industrial Organization, 2005. A true measure of economic profit, especially in a capital
intensive industry such as the mobile wireless industry, would reflect cash flows over a period of time that is long enough to
recoup investment costs, and would account for a firm’s weighted average cost of capital. Because limitations on data
availability make it difficult to measure true economic profit, we consider EBITDA as a crude proxy measure. Fourteenth
Report, 25 FCC Rcd at 11544, para. 215.
97 Measures of profitability are widely used by industry observers and analysts, and can provide useful indicators of absolute
and relative provider performance. Fourteenth Report, 25 FCC Rcd at 11544, para. 214.
98 See e.g., Franklin Fisher and John McGowan, On the Misuse of Accounting Rates of Return to Infer Monopoly Profits,
American Economic Review, 1983, Vol. 73, Issue 1, 82-97 (stating “accounting rates of return, even if properly and
consistently measured, provide almost no information about economic rates of return”); Dennis Carlton and Jeffrey Perloff,
pp. 247-52, Modern Industrial Organization, 2005.

Federal Communications Commission FCC-CIRC1709-08
23
Chart II.D.1
Reported EBITDA Margins (%) for Selected Publicly Traded
Facilities-Based Wireless Service Providers, 2013–2016
Source: UBS US Wireless 411, Feb. 22, 2017, Figure 37.
E. Facilitating Access to Spectrum
34. Spectrum is a critical input in the provision of mobile wireless services.99 It can affect whether,
when, and where existing service providers and potential entrants will be able to expand capacity or deploy
networks.100 Incumbent service providers may need additional spectrum to increase their coverage or capacity,
while new entrants need access to spectrum to enter a geographic area.101 In addition, increasing consumer
demand for mobile data is expected to continue increasing service providers’ need for spectrum.102
99 Non-spectrum inputs in the provision of mobile wireless services include cellular base stations and towers to carry
transmissions and backhaul, which routes voice and data traffic from base stations to mobile switching centers. Backhaul
may be provided via wireless spectrum, copper, or fiber, though copper may lack sufficient capacity for current data
demands.
100 Mobile Spectrum Holdings Report and Order, 29 FCC Rcd at 6134, para. 2; see also Nineteenth Report, 31 FCC Rcd at
10572, para. 49; Sixteenth Report, 28 FCC Rcd at 3769, para. 85.
101 Nineteenth Report, 31 FCC Rcd at 10572, para. 49; Sixteenth Report, 28 FCC Rcd at 3769, para. 86.
102 Mid-Band Spectrum NOI, at 3-4, paras. 5-6.
1Q13 2Q13 3Q13 4Q13 1Q14 2Q14 3Q14 4Q14 1Q15 2Q15 3Q15 4Q15 1Q16 2Q16 3Q16 4Q16
Verizon Wireless 50.4 49.8 51.1 47 52.14 50.29 49.5 42 55.8 56.1 56.4 52.9 60.5 61.5 59.5 52.8
AT&T 43.2 42.4 42 37.4 45.92 42.64 43.1 36.7 45.3 48.5 49.4 43.2 49.5 49.8 50.1 45.4
Sprint 19.2 17.6 16.2 14.4 25.34 25.30 19.9 15.4 25.6 31.7 30.8 29.9 34.7 40 38.6 40.3
T-Mobile 28.9 24.7 26.2 24 20.39 26.46 23.7 29.8 23.9 29.6 30.3 34.8 32.1 35.8 34.1 35.2
Metro PCS 27.2 32.1 28.9 31.9 22.6 41.1 41.5 27.9
Leap (Cricket) 16.1 21.8 21.4 18 17 24.8 18 20.8 17.4 21.5 11.1 9.1
US Cellular 20.4 19.9 18.3 -7.8 9.27 11.19 11.2 8.2 20.2 19.7 23.2 17.1 20.7 22 21.3 22.6
52.8
45.4
40.3
35.2
9.1
22.6
-10
0
10
20
30
40
50
60
70
Per
cen
tage

Federal Communications Commission FCC-CIRC1709-08
24
35. Spectrum bands vary in their propagation characteristics, and these variations have implications
for how spectrum is deployed.103 Spectrum below 1 GHz (low-band spectrum) has certain propagation
advantages for network deployment over long distances, and for penetrating buildings and urban canyons, while
spectrum above 1 GHz (mid- or high-band spectrum) allows for the better transmission of large amounts of
information.104 In the Spectrum Frontiers Order, the Commission noted that technological advances have made
possible the use of ultra-high frequency bands above 24 GHz, or mmW bands, for the provision of mobile
broadband.105 In the Mid-Band Spectrum NOI, the Commission observed that bands between 3.7 GHz and 24
GHz could yield a balance of coverage and capacity that could provide a critical input to operators to deploy new
and improved wireless services to rural, remote, and underserved areas of the country.106
36. Recognizing the importance of spectrum in the provision of mobile wireless services, Congress,
under the Communications Act, requires that the Commission implement spectrum policies that promote
competition, innovation, and the efficient use of spectrum to serve the public interest, convenience, and
necessity.107 Consistent with this statutory mandate, the Commission has established policies to make spectrum
available to existing mobile service providers and potential new entrants through initial licensing, primarily by
competitive bidding, and through secondary market transactions.108
37. On March 30, 2017, for example, bidding concluded in the broadcast television spectrum
incentive auction,109 which made available 70 megahertz of low-band spectrum in the 600 MHz band for
commercial use.110 In the 3.5 GHz proceeding,111 the Commission established a three-tiered spectrum
103 Service providers deploy their spectrum bands differently depending on the nature of the service, geography, density, or
other factors in their network build-out. Nineteenth Report, 31 FCC Rcd at 10572, para. 50 & n.103; Sixteenth Report, 28
FCC Rcd at 3789, para. 119.
104 Mobile Spectrum Holdings Report and Order, 29 FCC Rcd at 6135, para. 3; Nineteenth Report, 31 FCC Rcd at 10572,
para. 50. In this sense, low-band spectrum may be thought of as “coverage” spectrum, and higher band spectrum may be
thought of as “capacity” spectrum.
105 Spectrum Frontiers Order, 31 FCC Rcd at 8020, paras. 6-7.
106 Mid-Band Spectrum NOI, at 3-4, para. 6.
107 47 U.S.C. § 309(j)(3)(B).
108 Mobile Spectrum Holdings Report and Order, 29 FCC Rcd at 6143-44, 6167-68, 6190, 6193, 6221-22, 6223-24, paras. 17,
67-69, 135, 144, 225-27, 231-32. The Commission generally has adopted “flexible use” policies, thereby allowing licensees
to decide which services to offer and what technologies to deploy on spectrum used for the provision of mobile wireless
services.
109 The incentive auction was composed of a reverse auction component in which eligible broadcasters voluntarily offered to
relinquish some or all of their spectrum usage rights and a forward auction component where mobile wireless providers could
bid for new, flexible-use licenses suitable for providing mobile broadband services. Expanding the Economic and Innovation
Opportunities of Spectrum Through Incentive Auctions, Report and Order, 29 FCC Rcd 6567 (2014) (Incentive Auction
Report and Order).
110 Broadcast Auction Scheduled to Begin March 29, 2016; Procedures for Competitive Bidding in Auction 1000, Including
Initial Clearing Target Determination, Qualifying to Bid, and Bidding in Auctions 1001 (Reverse) and 1002 (Forward),
Public Notice, 30 FCC Rcd 8975 (2015). The incentive auction generated approximately $19.8 billion in (gross) bids for 70
megahertz of licensed spectrum nationwide, and as a result of this auction, the 600 MHz Band Plan includes 70 megahertz, or
seven paired five megahertz blocks, of licensed spectrum and 14 megahertz of spectrum available for unlicensed use and
wireless microphones. Incentive Auction Closing and Channel Reassignment Public Notice; The Broadcast Television
Incentive Auction Closes; Reverse Auction and Forward Auction Results Announced; Final Television Band Channel
Assignments Announced; Post-Auction Deadlines Announced, Public Notice, 32 FCC Rcd 2786, 2793, para. 15 & n.19 (MB,
WTB 2017) (Closing and Channel Reassignment Public Notice).
111 The 3.5 GHz Band encompasses 3550-3700 MHz. Amendment of the Commission’s Rules with Regard to Commercial
Operations in the 3550-3650 MHz Band, Report and Order and Second Further Notice of Proposed Rulemaking, 30 FCC Rcd
3959, 3961, para. 1 (2015) (3.5 GHz Order and 2nd FNPRM); Amendment of the Commission’s Rules with Regard to
Commercial Operations in the 3550-3650 MHz Band, Order on Reconsideration and Second Report and Order, 31 FCC Rcd
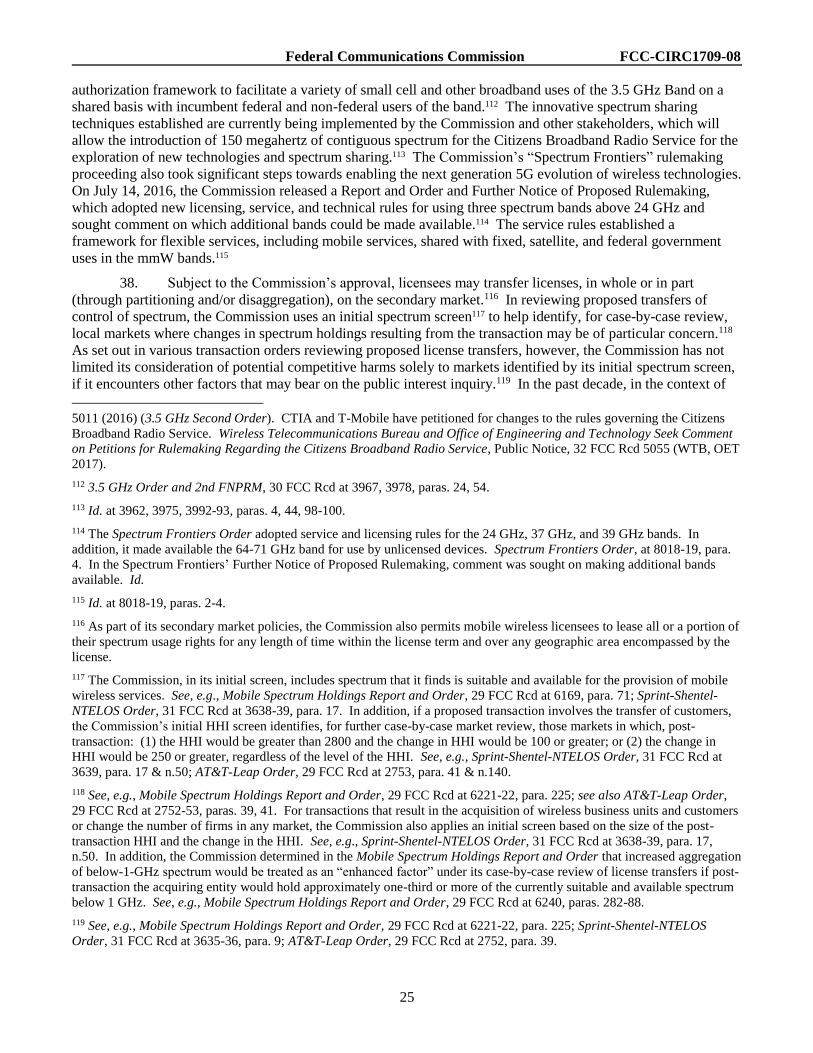
Federal Communications Commission FCC-CIRC1709-08
25
authorization framework to facilitate a variety of small cell and other broadband uses of the 3.5 GHz Band on a
shared basis with incumbent federal and non-federal users of the band.112 The innovative spectrum sharing
techniques established are currently being implemented by the Commission and other stakeholders, which will
allow the introduction of 150 megahertz of contiguous spectrum for the Citizens Broadband Radio Service for the
exploration of new technologies and spectrum sharing.113 The Commission’s “Spectrum Frontiers” rulemaking
proceeding also took significant steps towards enabling the next generation 5G evolution of wireless technologies.
On July 14, 2016, the Commission released a Report and Order and Further Notice of Proposed Rulemaking,
which adopted new licensing, service, and technical rules for using three spectrum bands above 24 GHz and
sought comment on which additional bands could be made available.114 The service rules established a
framework for flexible services, including mobile services, shared with fixed, satellite, and federal government
uses in the mmW bands.115
38. Subject to the Commission’s approval, licensees may transfer licenses, in whole or in part
(through partitioning and/or disaggregation), on the secondary market.116 In reviewing proposed transfers of
control of spectrum, the Commission uses an initial spectrum screen117 to help identify, for case-by-case review,
local markets where changes in spectrum holdings resulting from the transaction may be of particular concern.118
As set out in various transaction orders reviewing proposed license transfers, however, the Commission has not
limited its consideration of potential competitive harms solely to markets identified by its initial spectrum screen,
if it encounters other factors that may bear on the public interest inquiry.119 In the past decade, in the context of
5011 (2016) (3.5 GHz Second Order). CTIA and T-Mobile have petitioned for changes to the rules governing the Citizens
Broadband Radio Service. Wireless Telecommunications Bureau and Office of Engineering and Technology Seek Comment
on Petitions for Rulemaking Regarding the Citizens Broadband Radio Service, Public Notice, 32 FCC Rcd 5055 (WTB, OET
2017).
112 3.5 GHz Order and 2nd FNPRM, 30 FCC Rcd at 3967, 3978, paras. 24, 54.
113 Id. at 3962, 3975, 3992-93, paras. 4, 44, 98-100.
114 The Spectrum Frontiers Order adopted service and licensing rules for the 24 GHz, 37 GHz, and 39 GHz bands. In
addition, it made available the 64-71 GHz band for use by unlicensed devices. Spectrum Frontiers Order, at 8018-19, para.
4. In the Spectrum Frontiers’ Further Notice of Proposed Rulemaking, comment was sought on making additional bands
available. Id.
115 Id. at 8018-19, paras. 2-4.
116 As part of its secondary market policies, the Commission also permits mobile wireless licensees to lease all or a portion of
their spectrum usage rights for any length of time within the license term and over any geographic area encompassed by the
license.
117 The Commission, in its initial screen, includes spectrum that it finds is suitable and available for the provision of mobile
wireless services. See, e.g., Mobile Spectrum Holdings Report and Order, 29 FCC Rcd at 6169, para. 71; Sprint-Shentel-
NTELOS Order, 31 FCC Rcd at 3638-39, para. 17. In addition, if a proposed transaction involves the transfer of customers,
the Commission’s initial HHI screen identifies, for further case-by-case market review, those markets in which, post-
transaction: (1) the HHI would be greater than 2800 and the change in HHI would be 100 or greater; or (2) the change in
HHI would be 250 or greater, regardless of the level of the HHI. See, e.g., Sprint-Shentel-NTELOS Order, 31 FCC Rcd at
3639, para. 17 & n.50; AT&T-Leap Order, 29 FCC Rcd at 2753, para. 41 & n.140.
118 See, e.g., Mobile Spectrum Holdings Report and Order, 29 FCC Rcd at 6221-22, para. 225; see also AT&T-Leap Order,
29 FCC Rcd at 2752-53, paras. 39, 41. For transactions that result in the acquisition of wireless business units and customers
or change the number of firms in any market, the Commission also applies an initial screen based on the size of the post-
transaction HHI and the change in the HHI. See, e.g., Sprint-Shentel-NTELOS Order, 31 FCC Rcd at 3638-39, para. 17,
n.50. In addition, the Commission determined in the Mobile Spectrum Holdings Report and Order that increased aggregation
of below-1-GHz spectrum would be treated as an “enhanced factor” under its case-by-case review of license transfers if post-
transaction the acquiring entity would hold approximately one-third or more of the currently suitable and available spectrum
below 1 GHz. See, e.g., Mobile Spectrum Holdings Report and Order, 29 FCC Rcd at 6240, paras. 282-88.
119 See, e.g., Mobile Spectrum Holdings Report and Order, 29 FCC Rcd at 6221-22, para. 225; Sprint-Shentel-NTELOS
Order, 31 FCC Rcd at 3635-36, para. 9; AT&T-Leap Order, 29 FCC Rcd at 2752, para. 39.

Federal Communications Commission FCC-CIRC1709-08
26
its review of secondary market transactions, the Commission periodically has determined that additional spectrum
was suitable and available, and therefore subject to inclusion in the spectrum screen.120 The current suitable and
available spectrum included in the spectrum screen is as follows:
Table II.E.1
Spectrum Included in the Spectrum Screen121
Spectrum Band Megahertz
(Amount)
600 MHz 70
700 MHz122 70
Cellular 50
SMR 14
Broadband PCS 130
AWS-1 90
AWS-3 65
AWS-4 40
H Block 10
WCS 20
BRS 67.5
EBS 89
Total Amount of Spectrum 715.5
39. In reviewing proposed transactions, the Commission generally conducts further competitive
review to determine whether a particular proposed transaction would result in an increased incentive or ability for
the assignee or transferee to behave in an anticompetitive manner for those markets identified by the spectrum or
120 Incentive Auction Closing and Channel Reassignment, Public Notice, 32 FCC Rcd 2786 (WTB 2017); Sprint-Shentel-
NTELOS Order, 31 FCC Rcd at 3637-38, paras. 15-16; Mobile Spectrum Holdings Report and Order, 29 FCC Rcd at 6172-
87, 6187-90, paras. 82-125, 126-34; Applications of AT&T Mobility Spectrum LLC, New Cingular Wireless PCS, LLC,
Comcast Corporation, Horizon Wi-Com, LLC, NextWave Wireless, Inc., and San Diego Gas & Electric Company for
Consent To Assign and Transfer Licenses, Memorandum Opinion and Order, 27 FCC Rcd 16459, 16470-71, para. 31 (2012)
(AT&T WCS Order); Sprint Nextel-Clearwire Order, 23 FCC Rcd at 17598-99, para. 70; Amendment of Part 27 of the
Commission’s Rules to Govern the Operation of Wireless Communications Services in the 2.3 GHz Band, Report and Order,
25 FCC Rcd 11710, 11711, para. 1 (2010); Applications of Sprint Nextel Corporation and Clearwire Corporation for
Consent To Transfer Control of Licenses, Leases, and Authorizations, Memorandum Opinion and Order, 23 FCC Rcd 17570,
17599, para. 72 (2008) (Sprint Nextel-Clearwire Order); Applications of AT&T Inc. and Dobson Communications
Corporation for Consent To Transfer Control of Licenses and Authorizations, Memorandum Opinion and Order, 22 FCC Rcd
20295, 20307-08, para. 17 (2007).
121 We note that we consider AWS-1 and BRS spectrum as available on a nationwide basis. While 15 megahertz of AWS-3
spectrum are available on a nationwide basis (1695-1710 GHz), we will evaluate the availability of the remaining 50
megahertz of AWS-3 spectrum (1755-1780 GHz and 2155-2180 GHz) on a market-by-market basis. Further, while 112.5
megahertz of EBS spectrum are available, we discount this spectrum such that 89 megahertz is included in the screen for
review of proposed transactions. Mobile Spectrum Holdings Report and Order, 29 FCC Rcd at 6177-79, 6184-6187, paras.
100-102, 118-25.
122 This does not include the 20 megahertz of 700 MHz spectrum allocated to public safety. In March 2017, AT&T was
selected by FirstNet to build a nationwide public safety broadband network. AT&T Newsroom, AT&T Selected By FirstNet
To Build And Manage America’s First Nationwide Public Safety Broadband Network Dedicated To First Responders (Mar.
30, 2017), http://about.att.com/story/firstnet_selects_att_to_build_network_supporting_first_responders.html.

Federal Communications Commission FCC-CIRC1709-08
27
HHI screen, or that implicate enhanced factor review,123 or where the Commission encounters other factors that
may bear on the public interest inquiry.124 The case-by-case review that the Commission undertakes considers
factors that are important in predicting the incentives and ability of service providers to successfully reduce
competition in relevant product and geographic markets,125 and then evaluates any public interest benefits to
determine whether the proposed transaction, on balance, serves the public interest. In addition, the Commission
can condition approval of a license transfer on the divestiture of licenses or certain other commitments where
necessary to find that an application serves the public interest.126
1. Service Providers’ Spectrum Holdings
40. Table II.E.2 and Table II.E.3 below present spectrum holdings by service provider. As of May
2017, the four nationwide service providers, Verizon Wireless, AT&T, Sprint, and T-Mobile, together, held
approximately 76 percent of all spectrum, measured on a MHz-POPs basis.
123 Mobile Spectrum Holdings Report and Order, 29 FCC Rcd at 6233, 6240, paras. 267, 286-88.
124 For example, the Commission also considered whether harms in numerous local markets may result in nationwide harms
and has considered potential harms from concentration in a particular band with an important ecosystem. See, e.g.,
Applications of Cellco Partnership d/b/a Verizon Wireless and SpectrumCo LLC and Cox TMI, LLC for Consent To Assign
AWS-1 Licenses, Memorandum Opinion and Order, 27 FCC Rcd 10698, 10721-22, 10727, paras. 64, 76 (2012) (Verizon
Wireless-SpectrumCo Order).
125 These competitive variables include, but are not limited to: the total number of rival service providers; the number of rival
firms that can offer competitive service plans; the coverage by technology of the firms’ respective networks; the rival firms’
market shares; the combined entity’s post-transaction market share and how that share changes as a result of the transaction;
the amount of spectrum suitable for the provision of mobile telephony/broadband services controlled by the combined entity;
and the spectrum holdings of each of the rival service providers. See, e.g., Sprint-Shentel-NTELOS Order, 31 FCC Rcd at
3640-41, para. 21; AT&T-Leap Order, 29 FCC Rcd at 2745-46, para. 21.
126 See, e.g., Sprint-Shentel-NTELOS Order, 31 FCC Rcd at 3651-53, paras. 45-49; AT&T-Leap Order, 29 FCC Rcd at 2743-
44, para. 16; Verizon Wireless-SpectrumCo Order, 27 FCC Rcd at 10711, para. 30.
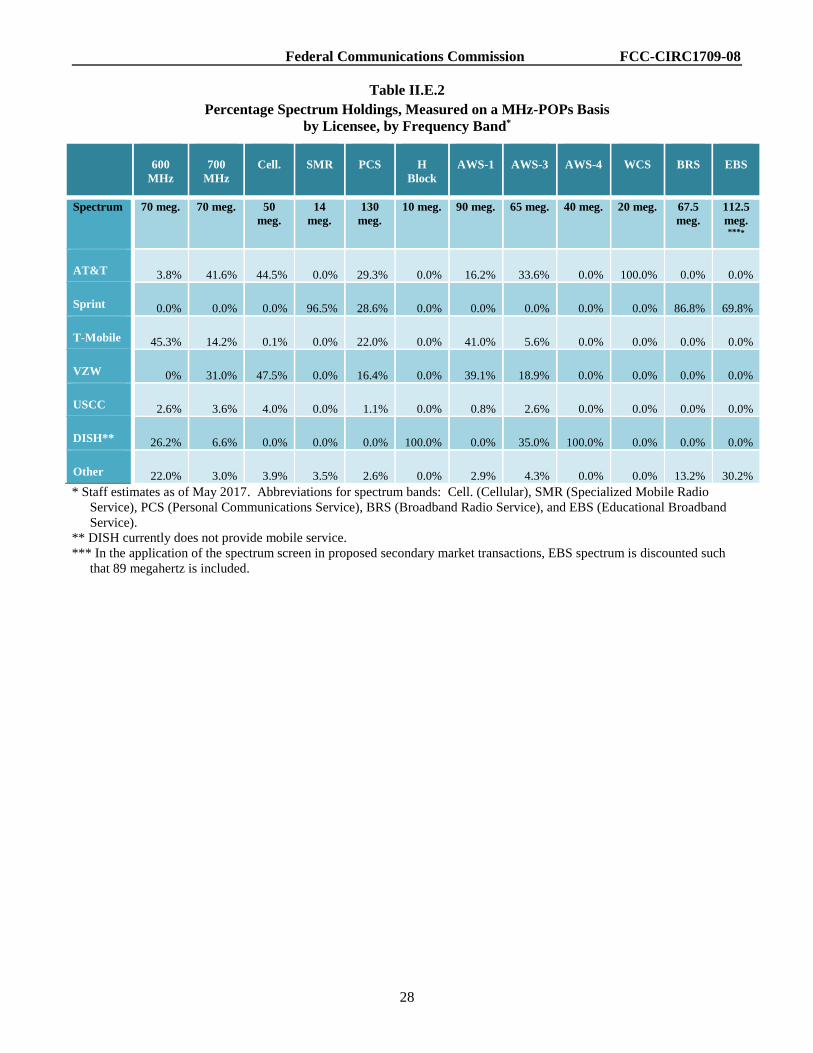
Federal Communications Commission FCC-CIRC1709-08
28
Table II.E.2
Percentage Spectrum Holdings, Measured on a MHz-POPs Basis
by Licensee, by Frequency Band*
600
MHz
700
MHz
Cell.
SMR
PCS
H
Block
AWS-1
AWS-3
AWS-4
WCS
BRS
EBS
Spectrum 70 meg. 70 meg. 50
meg.
14
meg.
130
meg.
10 meg. 90 meg. 65 meg. 40 meg. 20 meg. 67.5
meg.
112.5
meg.
****
AT&T 3.8% 41.6% 44.5% 0.0% 29.3% 0.0% 16.2% 33.6% 0.0% 100.0% 0.0% 0.0%
Sprint 0.0% 0.0% 0.0% 96.5% 28.6% 0.0% 0.0% 0.0% 0.0% 0.0% 86.8% 69.8%
T-Mobile 45.3% 14.2% 0.1% 0.0% 22.0% 0.0% 41.0% 5.6% 0.0% 0.0% 0.0% 0.0%
VZW 0% 31.0% 47.5% 0.0% 16.4% 0.0% 39.1% 18.9% 0.0% 0.0% 0.0% 0.0%
USCC 2.6% 3.6% 4.0% 0.0% 1.1% 0.0% 0.8% 2.6% 0.0% 0.0% 0.0% 0.0%
DISH** 26.2% 6.6% 0.0% 0.0% 0.0% 100.0% 0.0% 35.0% 100.0% 0.0% 0.0% 0.0%
Other 22.0% 3.0% 3.9% 3.5% 2.6% 0.0% 2.9% 4.3% 0.0% 0.0% 13.2% 30.2%
* Staff estimates as of May 2017. Abbreviations for spectrum bands: Cell. (Cellular), SMR (Specialized Mobile Radio
Service), PCS (Personal Communications Service), BRS (Broadband Radio Service), and EBS (Educational Broadband
Service).
** DISH currently does not provide mobile service.
*** In the application of the spectrum screen in proposed secondary market transactions, EBS spectrum is discounted such
that 89 megahertz is included.
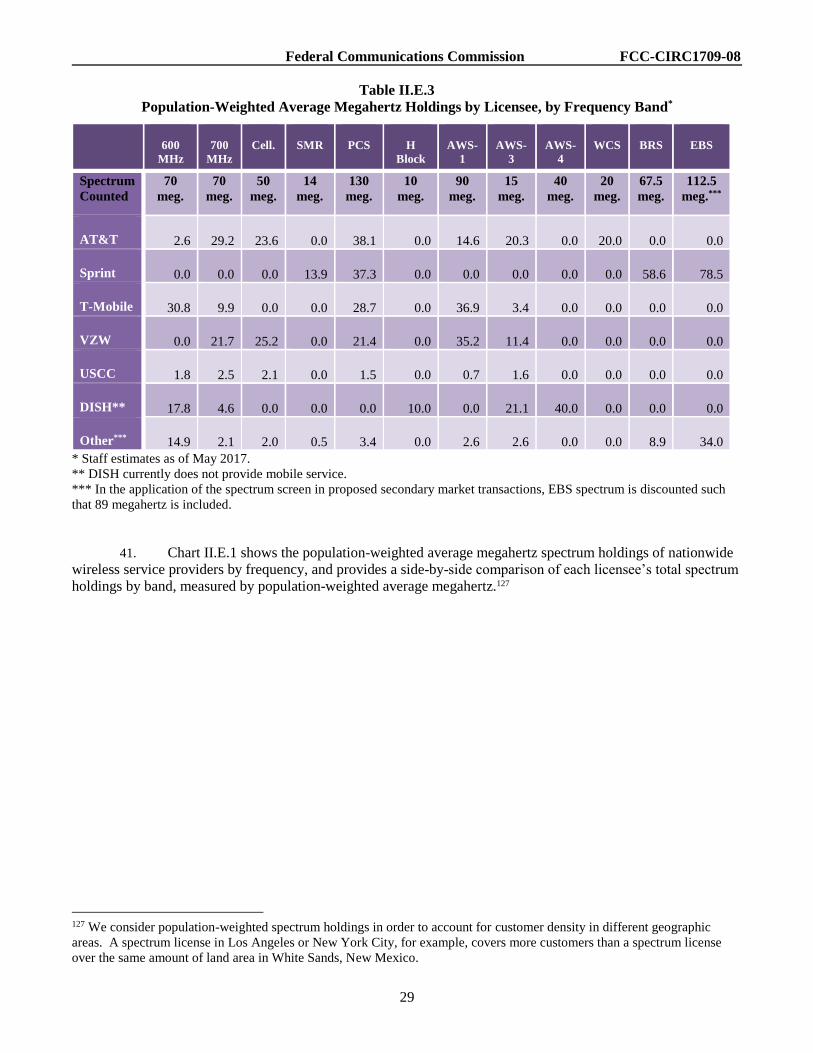
Federal Communications Commission FCC-CIRC1709-08
29
Table II.E.3
Population-Weighted Average Megahertz Holdings by Licensee, by Frequency Band*
600
MHz
700
MHz
Cell.
SMR
PCS
H
Block
AWS-
1
AWS-
3
AWS-
4
WCS
BRS
EBS
Spectrum
Counted
70
meg.
70
meg.
50
meg.
14
meg.
130
meg.
10
meg.
90
meg.
15
meg.
40
meg.
20
meg.
67.5
meg.
112.5
meg.***
AT&T 2.6 29.2 23.6 0.0 38.1 0.0 14.6 20.3 0.0 20.0 0.0 0.0
Sprint 0.0 0.0 0.0 13.9 37.3 0.0 0.0 0.0 0.0 0.0 58.6 78.5
T-Mobile 30.8 9.9 0.0 0.0 28.7 0.0 36.9 3.4 0.0 0.0 0.0 0.0
VZW 0.0 21.7 25.2 0.0 21.4 0.0 35.2 11.4 0.0 0.0 0.0 0.0
USCC 1.8 2.5 2.1 0.0 1.5 0.0 0.7 1.6 0.0 0.0 0.0 0.0
DISH** 17.8 4.6 0.0 0.0 0.0 10.0 0.0 21.1 40.0 0.0 0.0 0.0
Other*** 14.9 2.1 2.0 0.5 3.4 0.0 2.6 2.6 0.0 0.0 8.9 34.0
* Staff estimates as of May 2017.
** DISH currently does not provide mobile service.
*** In the application of the spectrum screen in proposed secondary market transactions, EBS spectrum is discounted such
that 89 megahertz is included.
41. Chart II.E.1 shows the population-weighted average megahertz spectrum holdings of nationwide
wireless service providers by frequency, and provides a side-by-side comparison of each licensee’s total spectrum
holdings by band, measured by population-weighted average megahertz.127
127 We consider population-weighted spectrum holdings in order to account for customer density in different geographic
areas. A spectrum license in Los Angeles or New York City, for example, covers more customers than a spectrum license
over the same amount of land area in White Sands, New Mexico.
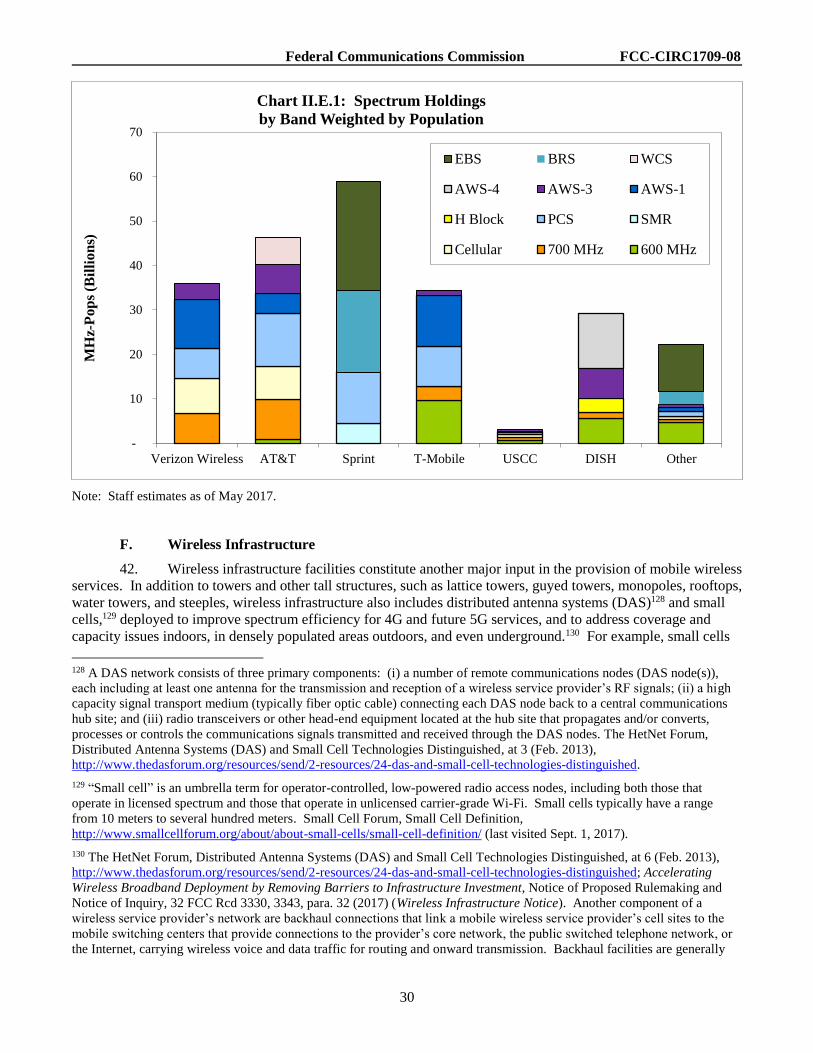
Federal Communications Commission FCC-CIRC1709-08
30
Note: Staff estimates as of May 2017.
F. Wireless Infrastructure
42. Wireless infrastructure facilities constitute another major input in the provision of mobile wireless
services. In addition to towers and other tall structures, such as lattice towers, guyed towers, monopoles, rooftops,
water towers, and steeples, wireless infrastructure also includes distributed antenna systems (DAS)128 and small
cells,129 deployed to improve spectrum efficiency for 4G and future 5G services, and to address coverage and
capacity issues indoors, in densely populated areas outdoors, and even underground.130 For example, small cells
128 A DAS network consists of three primary components: (i) a number of remote communications nodes (DAS node(s)),
each including at least one antenna for the transmission and reception of a wireless service provider’s RF signals; (ii) a high
capacity signal transport medium (typically fiber optic cable) connecting each DAS node back to a central communications
hub site; and (iii) radio transceivers or other head-end equipment located at the hub site that propagates and/or converts,
processes or controls the communications signals transmitted and received through the DAS nodes. The HetNet Forum,
Distributed Antenna Systems (DAS) and Small Cell Technologies Distinguished, at 3 (Feb. 2013),
http://www.thedasforum.org/resources/send/2-resources/24-das-and-small-cell-technologies-distinguished.
129 “Small cell” is an umbrella term for operator-controlled, low-powered radio access nodes, including both those that
operate in licensed spectrum and those that operate in unlicensed carrier-grade Wi-Fi. Small cells typically have a range
from 10 meters to several hundred meters. Small Cell Forum, Small Cell Definition,
http://www.smallcellforum.org/about/about-small-cells/small-cell-definition/ (last visited Sept. 1, 2017).
130 The HetNet Forum, Distributed Antenna Systems (DAS) and Small Cell Technologies Distinguished, at 6 (Feb. 2013),
http://www.thedasforum.org/resources/send/2-resources/24-das-and-small-cell-technologies-distinguished; Accelerating
Wireless Broadband Deployment by Removing Barriers to Infrastructure Investment, Notice of Proposed Rulemaking and
Notice of Inquiry, 32 FCC Rcd 3330, 3343, para. 32 (2017) (Wireless Infrastructure Notice). Another component of a
wireless service provider’s network are backhaul connections that link a mobile wireless service provider’s cell sites to the
mobile switching centers that provide connections to the provider’s core network, the public switched telephone network, or
the Internet, carrying wireless voice and data traffic for routing and onward transmission. Backhaul facilities are generally
-
10
20
30
40
50
60
70
Verizon Wireless AT&T Sprint T-Mobile USCC DISH Other
MH
z-P
op
s (B
illi
on
s)Chart II.E.1: Spectrum Holdings
by Band Weighted by Population
EBS BRS WCS
AWS-4 AWS-3 AWS-1
H Block PCS SMR
Cellular 700 MHz 600 MHz

Federal Communications Commission FCC-CIRC1709-08
31
and DAS antennas can be placed on utility poles, buildings, or traffic signal poles in areas where constructing
towers is not feasible or wireless traffic demands are too great to be met solely with large cells.131
43. In order to expand or to improve coverage in existing service areas, and to accommodate newer
technologies, mobile service providers historically have deployed additional cell sites. According to CTIA, there
were 308,334 cell sites in use at year-end 2016, up from 307,626 as of year-end 2015 (approximately 0.2 percent
increase).132 Mobile service providers increasingly have started to deploy small cells and DAS sites to fill local
coverage gaps, to densify networks and to increase local capacity, or to prepare for their 5G network.133
According to one analyst, between 100,000 and 150,000 small cells could be installed nationwide by the end of
2018.134 Rather than building their own DAS deployments, some service providers share neutral host systems
owned by third-party operators.135
44. A specialized communications tower industry has developed to provide and manage the support
structures for the cell sites. Today, there are more than 120 tower and DAS operators in the United States,136 and
a majority of towers are now owned or operated by independent companies rather than by mobile wireless service
provided by incumbent local exchange carriers (ILECs), competitive local exchange carriers (CLECs), competitive fiber and
microwave wholesalers, cable providers, and independent backhaul operators. Nineteenth Report, 31 FCC Rcd at 10589,
para. 75; Sixteenth Report, 28 FCC Rcd at 3912, para. 336.
131 Because DAS sites are less visible than tower structures, they may be particularly desirable in areas with stringent siting
regulations, such as in historic districts.
132 CTIA Wireless Industry Indices Year-End 2016, at 72. Because multiple cell sites can be co-located in the same “tower”
site, the reported cell sites should not be equated with “towers.” The reported cell sites include repeaters and other cell-
extending devices (e.g., femtocells or distributed antenna systems). Id. at 72. Appendix II: Characteristics of the Mobile
Wireless Industry, Table II.F.i provides information on year-end cell site counts by service provider.
133 See, e.g., Sprint Q2 2016 Earnings Call transcript, at 4,
http://s21.q4cdn.com/487940486/files/doc_financials/quarterly/2016/Q2/S-US-20161025-1881741-C.pdf; see also
FierceWireless, Sprint Exec Acknowledges Small Cell ‘Misunderstandings,’ Promises Expanded Rollout in 2017 (Jan. 19,
2017), http://www.fiercewireless.com/wireless/sprint-exec-acknowledges-small-cell-misunderstandings-promises-expanded-
rollout-2017; Verizon 2016 Annual Report, at 39; RCR Wireless, Verizon Claims 'Largest Small Cell Deployment' in the U.S
(Mar. 17, 2017), http://www.fiercewireless.com/wireless/verizon-claims-largest-small-cell-deployment-any-u-s-carrier; CTIA
Comment, at 38; RCR Wireless, AT&T Explains Small Cell Siting Strategy (Nov. 10, 2016),
http://www.rcrwireless.com/20161110/network-infrastructure/att-explains-small-cell-siting-strategy-tag4-tag99; New
Network Technologies Coming for Our Customers in 2017, Verizon Blog (Jan. 23, 2017),
http://www.verizon.com/about/news/new-network-technologies-coming-our-customers-2017-building-2016-
accomplishments; see also RCR Wireless, Carrier small cells appear slowly but surely (May 24, 2016),
http://www.rcrwireless.com/20160524/carriers/carrier-small-cells-tag4.
134 S&P Global Market Intelligence, John Fletcher, Small Cell and Tower Projections through 2026, SNL Kagan Wireless
Investor (Sept. 27, 2016); see also CTIA Comments at 43 (“Charter intends to eventually extend its own network, including
densification via small cells”); RCR Wireless, Crown Castle: Small Cell Revenue Could Equal Tower Revenue (Oct. 25,
2016), http://www.rcrwireless.com/20161025/network-infrastructure/crown-castle-small-cell-revenue-could-rival-tower-
revenue-tag4.
135 Wireless Infrastructure Association, Distributed Antenna Systems (DAS) in Mid-Tier Markets, at 4, http://wia.org/wp-
content/uploads/Distributed-Antenna-Systems-DAS-in-Mid-Tier-Markets.pdf; RCR Wireless, Sprint network expanding in
New England thanks to GNW and ExteNet (July 6, 2016), http://www.rcrwireless.com/20160706/carriers/sprint-network-
expanding-in-rural-new-england-thanks-to-gnw-and-extenet-tag4; RCR Wireless, Crown Castle spends more on small cells
than on new towers (Dec. 15, 2015), http://www.rcrwireless.com/20151216/network-infrastructure/crown-castle-spends-
more-on-small-cells-than-on-new-towers-tag4.
136 Wireless Estimator, Top 100 Tower Companies in the U.S., http://wirelessestimator.com/top-100-us-tower-companies-list/
(last visited Sept. 1, 2017).
Federal Communications Commission FCC-CIRC1709-08
32
providers.137 Independent tower operators own, operate and lease shared wireless communications and
broadcasting towers, manage other tall structure sites (such as rooftops and water towers), and to a lesser extent,
own and operate neutral facilities to host small cells and DAS networks for mobile service providers.138 In most
cases, tower operators and property owners lease antenna, rooftop and other site space to multiple wireless service
providers.139
45. As of December 2016, according to one estimate, the three largest publicly-traded neutral host
providers (Crown Castle, American Tower, and SBA Communications) owned or operated approximately 95,000
towers (not including DAS and small cells).140 At the end of December 2016, the top three tower operators had
1.8 to 2.2 tenants per tower site and had significant capacity available for additional antennas or tenants.141 Chart
II.F.1 shows that, as of April 2017, there were three or more tower operators in 91 percent of counties nationwide,
and six or more tower operators in 53 percent of counties based on tower site data collected from 44 tower
providers.142 As shown in Chart II.F.2, tower operators tend to build and operate more towers in more densely
populated areas. For example, as of June 2017, the average number of tower sites per county was 45 for counties
with a population density between 75 and 100 people per square mile, compared to 781 per county for counties
with a population density between 2000 and 4000 people per square mile. Between April 2016 and April 2017,
the average number of tower sites per county increased from 584143 to 815 in the most densely-populated counties,
with a population density of over 4000 people per square mile. This likely reflects both network densification
efforts by mobile service providers and the inclusion of more tower operators in the sample.
137 Some major wireless service providers have sold their tower business to third party tower operators. See, e.g., American
Tower, American Tower Corporation Closes Verizon Transaction (Mar. 30, 2015),
http://www.americantower.com/corporateus/investor-relations/press-releases/news-item.htm?id=2030383.
138 American Tower 2016 Annual Report (10-K), at 1 & 27; Crown Castle 2016 Annual Report (10-K), Part 1, at 1 & 4; SBA
Communications 2016 Annual Report (10-K), Part 1, at 1; see also Crown Castle, Crown Castle Announces Agreement to
Acquire Lightower (July 18, 2017), http://investor.crowncastle.com/phoenix.zhtml?c=107530&p=irol-
newsArticle&ID=2287220.
139 See, e.g., American Tower 2016 Annual Report, at 1, http://www.verizonwireless.com/b2c/realestate/ (last visited Sept. 1,
2017).
140 Wireless Estimator, Top 100 Tower Companies in the U.S. (Crown Castle at 40,039, American Tower at 39,989, SBA at
14,873, and as of December 2016, not including rooftop sites, DAS and small cells),
http://www.wirelessestimator.com/t_content.cfm?pagename=US-Cell-Tower-Companies-Complete-List (last visited Sept. 1,
2017).
141 American Tower 2016 Annual Report, Part I, at 4 (1.9 tenants per tower), Crown Castle 2016 Annual Report, at 18 (2.2
tenants per tower), and SBA 2016 Annual Report, Item 1, at 4 (1.8 tenants per tower).
142 Tower site information was downloaded from 44 tower providers’ websites in April 2017. Wireless Estimator, Top 100
Tower Companies in the U.S., http://www.wirelessestimator.com/t_content.cfm?pagename=US-Cell-Tower-Companies-
Complete-List (last visited Sept. 1, 2017). The 44 tower providers are American Tower Corporation, AT&T, Arcadia
Towers, Badger Towers, Branch Communications/Branch Towers, Crown Castle, Communication Enhancement, Clearview
Tower Company, Central States Tower Holdings, Day Wireless Systems, ForeSite, Grain Management, Hayes Towers,
Heartland Towers, Hemphill Tower, Horizon Tower, Horvath Communications, Industrial Communications, K2 Towers,
KGI Wireless, Message Center Management, MidAmerica Towers, Milestone Communications, Municipal Communications,
Nsight Tower Holdings, Performance Development Group, Phoenix Tower International, Prime Tower Development, RG
Towers, SBA Communications Corporation, Skyway Towers, Sprint, Subcarrier Communications, T-Mobile, Tarpon
Towers, Telecom Tower Group, TowerCo, TowerCom, Tower King, Tower Sites Inc., Tower Ventures, Unison Site
Management, Vertical Bridge Holdings, and Wireless Access Group.
143 Nineteenth Report, 31 FCC Rcd at 10587, Chart IV.B.2.
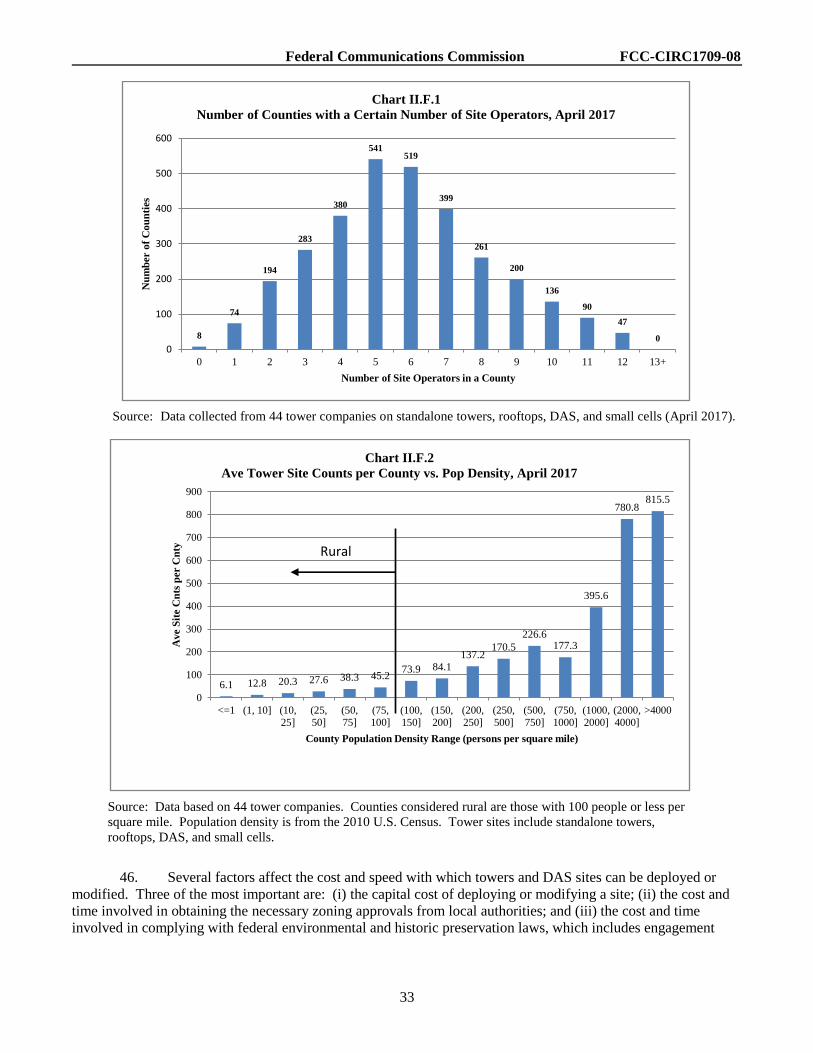
Federal Communications Commission FCC-CIRC1709-08
33
Source: Data collected from 44 tower companies on standalone towers, rooftops, DAS, and small cells (April 2017).
Source: Data based on 44 tower companies. Counties considered rural are those with 100 people or less per
square mile. Population density is from the 2010 U.S. Census. Tower sites include standalone towers,
rooftops, DAS, and small cells.
46. Several factors affect the cost and speed with which towers and DAS sites can be deployed or
modified. Three of the most important are: (i) the capital cost of deploying or modifying a site; (ii) the cost and
time involved in obtaining the necessary zoning approvals from local authorities; and (iii) the cost and time
involved in complying with federal environmental and historic preservation laws, which includes engagement
8
74
194
283
380
541519
399
261
200
136
90
47
0
0
100
200
300
400
500
600
0 1 2 3 4 5 6 7 8 9 10 11 12 13+
Nu
mb
er o
f C
ou
nti
es
Number of Site Operators in a County
Chart II.F.1
Number of Counties with a Certain Number of Site Operators, April 2017
6.1 12.8 20.3 27.6 38.3 45.273.9 84.1
137.2170.5
226.6177.3
395.6
780.8815.5
0
100
200
300
400
500
600
700
800
900
<=1 (1, 10] (10,
25]
(25,
50]
(50,
75]
(75,
100]
(100,
150]
(150,
200]
(200,
250]
(250,
500]
(500,
750]
(750,
1000]
(1000,
2000]
(2000,
4000]
>4000
Ave S
ite C
nts
per
Cn
ty
County Population Density Range (persons per square mile)
Chart II.F.2
Ave Tower Site Counts per County vs. Pop Density, April 2017
Rural
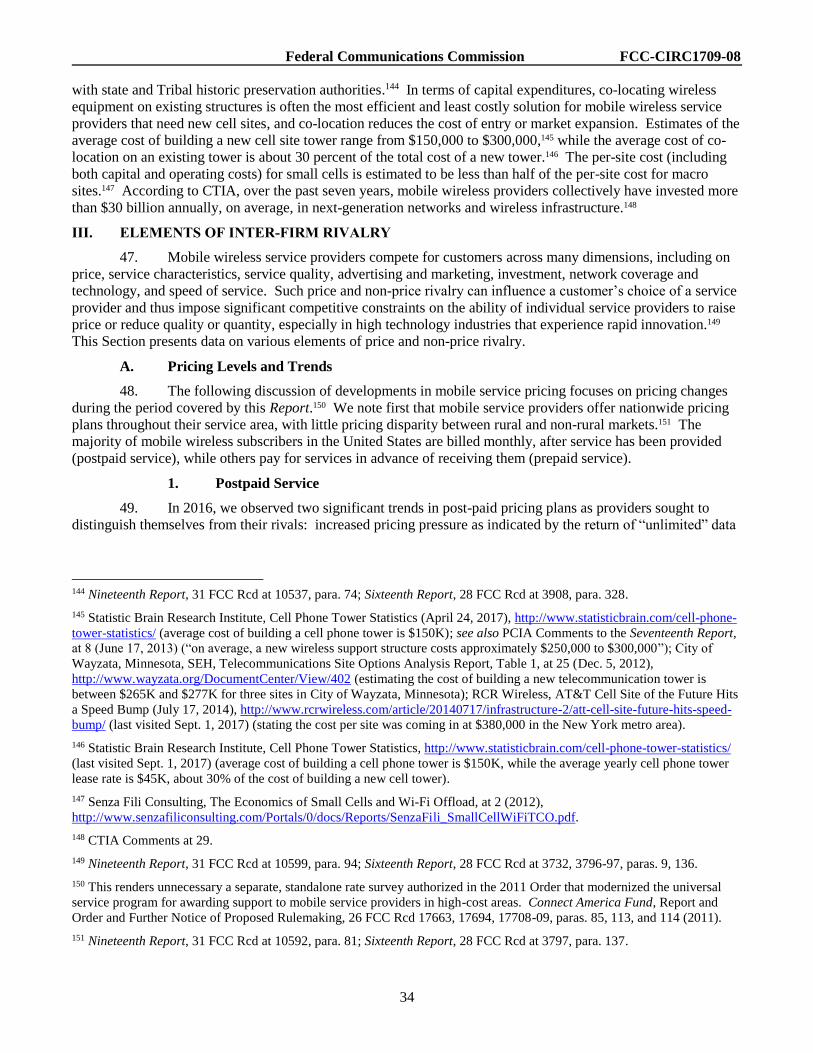
Federal Communications Commission FCC-CIRC1709-08
34
with state and Tribal historic preservation authorities.144 In terms of capital expenditures, co-locating wireless
equipment on existing structures is often the most efficient and least costly solution for mobile wireless service
providers that need new cell sites, and co-location reduces the cost of entry or market expansion. Estimates of the
average cost of building a new cell site tower range from $150,000 to $300,000,145 while the average cost of co-
location on an existing tower is about 30 percent of the total cost of a new tower.146 The per-site cost (including
both capital and operating costs) for small cells is estimated to be less than half of the per-site cost for macro
sites.147 According to CTIA, over the past seven years, mobile wireless providers collectively have invested more
than $30 billion annually, on average, in next-generation networks and wireless infrastructure.148
III. ELEMENTS OF INTER-FIRM RIVALRY
47. Mobile wireless service providers compete for customers across many dimensions, including on
price, service characteristics, service quality, advertising and marketing, investment, network coverage and
technology, and speed of service. Such price and non-price rivalry can influence a customer’s choice of a service
provider and thus impose significant competitive constraints on the ability of individual service providers to raise
price or reduce quality or quantity, especially in high technology industries that experience rapid innovation.149
This Section presents data on various elements of price and non-price rivalry.
A. Pricing Levels and Trends
48. The following discussion of developments in mobile service pricing focuses on pricing changes
during the period covered by this Report.150 We note first that mobile service providers offer nationwide pricing
plans throughout their service area, with little pricing disparity between rural and non-rural markets.151 The
majority of mobile wireless subscribers in the United States are billed monthly, after service has been provided
(postpaid service), while others pay for services in advance of receiving them (prepaid service).
1. Postpaid Service
49. In 2016, we observed two significant trends in post-paid pricing plans as providers sought to
distinguish themselves from their rivals: increased pricing pressure as indicated by the return of “unlimited” data
144 Nineteenth Report, 31 FCC Rcd at 10537, para. 74; Sixteenth Report, 28 FCC Rcd at 3908, para. 328.
145 Statistic Brain Research Institute, Cell Phone Tower Statistics (April 24, 2017), http://www.statisticbrain.com/cell-phone-
tower-statistics/ (average cost of building a cell phone tower is $150K); see also PCIA Comments to the Seventeenth Report,
at 8 (June 17, 2013) (“on average, a new wireless support structure costs approximately $250,000 to $300,000”); City of
Wayzata, Minnesota, SEH, Telecommunications Site Options Analysis Report, Table 1, at 25 (Dec. 5, 2012),
http://www.wayzata.org/DocumentCenter/View/402 (estimating the cost of building a new telecommunication tower is
between $265K and $277K for three sites in City of Wayzata, Minnesota); RCR Wireless, AT&T Cell Site of the Future Hits
a Speed Bump (July 17, 2014), http://www.rcrwireless.com/article/20140717/infrastructure-2/att-cell-site-future-hits-speed-
bump/ (last visited Sept. 1, 2017) (stating the cost per site was coming in at $380,000 in the New York metro area).
146 Statistic Brain Research Institute, Cell Phone Tower Statistics, http://www.statisticbrain.com/cell-phone-tower-statistics/
(last visited Sept. 1, 2017) (average cost of building a cell phone tower is $150K, while the average yearly cell phone tower
lease rate is $45K, about 30% of the cost of building a new cell tower).
147 Senza Fili Consulting, The Economics of Small Cells and Wi-Fi Offload, at 2 (2012),
http://www.senzafiliconsulting.com/Portals/0/docs/Reports/SenzaFili_SmallCellWiFiTCO.pdf.
148 CTIA Comments at 29.
149 Nineteenth Report, 31 FCC Rcd at 10599, para. 94; Sixteenth Report, 28 FCC Rcd at 3732, 3796-97, paras. 9, 136.
150 This renders unnecessary a separate, standalone rate survey authorized in the 2011 Order that modernized the universal
service program for awarding support to mobile service providers in high-cost areas. Connect America Fund, Report and
Order and Further Notice of Proposed Rulemaking, 26 FCC Rcd 17663, 17694, 17708-09, paras. 85, 113, and 114 (2011).
151 Nineteenth Report, 31 FCC Rcd at 10592, para. 81; Sixteenth Report, 28 FCC Rcd at 3797, para. 137.
Federal Communications Commission FCC-CIRC1709-08
35
plans, and the offering of content (particularly video) that does not count against a customer’s data limit.152 Also,
service providers have offered various promotions designed to partially or fully compensate consumers’ switching
costs.153
a. Pricing Trends and “Unlimited” Data Plans
50. Service providers frequently revise their pricing plans to attract customers. For example, in
February 2016, Sprint introduced the Sprint Better Choice Plan, which included unlimited voice and text and a
choice of six tiers of data, including one plan with unlimited data.154 In July 2016, Verizon launched the New
Verizon Plan, which revised the previously existing five data tiers by adding 30 percent to 50 percent more data
per tier for only a moderate increase in price.155 In August 2016, AT&T launched the AT&T Mobile Share
Advantage Plan, which started at $30 per month for 1 GB of data–up from $20 a month for 300 MB of data.
AT&T further offered a plan with 3 GB of data at $40 per month, while 30 GB of data was $135 per month.156 In
late August 2016, T-Mobile introduced the One+ Plan, which added unlimited tethering, 3G international
roaming, and unlimited GOGO in-flight Wi-Fi, to their One Plan for an additional $25 fee.157 In August 2016, US
Cellular launched the Data Shared Connect Plan, which included unlimited talk and text and 2 GB of data for $30
per month, and up to 24 GB for $100 per month.158 According to analysis by Recon Analytics and CTIA,
presented in FierceWireless, the cost per MB has fallen from $1.37 in 2007 to less than half a cent in 2016.159
51. One significant trend that has developed recently is the return of “unlimited” data plans.160 In
January 2016, AT&T introduced the AT&T Unlimited Plan for DIRECTV (or U-Verse). While that plan was
made available only to DIRECTV subscribers,161 it signaled a shift towards service providers again offering
152 Zero-rating is the exempting of certain data uses or content from counting towards a subscriber’s monthly limit. Fifteenth
Report, 26 FCC Rcd at 10594, para. 85.
153 Nineteenth Report, 31 FCC Rcd at 10595-96, para. 87.
154 FierceWireless, Sprint Takes Aim at Verizon with Data-heavy ‘Better Choice’ Family Plans (Feb. 18, 2016),
http://www.fiercewireless.com/wireless/sprint-takes-aim-at-verizon-data-heavy-better-choice-family-plans.
155 PC Mag, Verizon’s New Plans Offer Higher Rates But More Data (July 6, 2016),
http://www.pcmag.com/news/345869/verizons-new-plans-offer-more-data-higher-rates.
156 FierceWireless, AT&T Follows Verizon’s Lead, Introduces Pricier Plans, More Data and Removes Overage Charges
(Aug. 17, 2016), http://www.fiercewireless.com/wireless/at-t-follows-verizon-s-lead-introduces-pricier-plans-and-more-data.
157 PC Mag, T-Mobile Adds ‘One Plus’ Plan for ‘Power Users’ (Aug. 29, 2016), http://www.pcmag.com/news/347392/t-
mobile-boosts-one-plan-video-streaming-speeds.
158 U.S. Cellular, U.S. Cellular Adding Customer Value With New Shared Connect Pricing Plans (Aug. 25, 2016),
https://www.uscellular.com/about/press-room/2016/USCELLULAR-ADDING-CUSTOMER-VALUE-WITH-NEW-
SHARED-CONNECT-PRICING-PLANS.html.
159 FierceWireless, Industry Voices—Entner: Consumer ‘Surplus’ in Wireless Rises $192B in 2 Years (Aug. 14, 2017),
http://www.fiercewireless.com/wireless/industry-voices-entner-consumer-surplus-wireless-rises-192b-2-years.
160 The terms of service of various providers’ Unlimited Plans indicate that subscribers who exceed a certain amount (e.g., 22
GB) per month may have their speeds reduced to address network congestion. See, e.g., Verizon Wireless, Verizon Plan,
https://www.verizonwireless.com/plans/verizon-plan/ (last visited Sept. 1, 2017); AT&T, Unlimited Data Plans,
https://www.att.com/plans/unlimited-data-plans.html (last visited Sept. 1, 2017); T-Mobile, Plans, https://www.t-
mobile.com/cell-phone-plans?icid=WMM_TM_Q117TMO1PL_H85BRNKTDO37510 (last visited Sept. 1, 2017); Sprint,
Unlimited Cellphone Plans, https://www.sprint.com/en/shop/plans/unlimited-cell-phone-
plan.html?INTNAV=TopNav:Shop:UnlimitedPlans (last visited Sept. 1, 2017).
161 FierceWireless, AT&T Resurrects Unlimited Data Offering at $100/Month, But Only for Its DIRECTV Subscribers, (Jan.
11, 2016), http://www.fiercewireless.com/wireless/at-t-resurrects-unlimited-data-offering-at-100-month-but-only-for-its-
directv-subscribers. In addition, AT&T, for a limited time, offered DIRECTV or U-Verse customers, who did not subscribe
to its wireless service, $500 if they switched to the AT&T Unlimited Plan with an eligible trade-in, and bought a smartphone
Federal Communications Commission FCC-CIRC1709-08
36
unlimited data plans. In August 2016, T-Mobile launched the T-Mobile ONE Plan offering unlimited voice, text
and high-speed 4G LTE smartphone data.162 The next day, Sprint introduced its Unlimited Freedom plan, which
offered two lines of unlimited talk, text and data for $100 a month.163 In February 2017, Verizon launched its
Unlimited Data Plan offering unlimited data on smartphones and tablets for $80 a month.164 AT&T then
introduced the Unlimited Choice plan, which offered unlimited data for $60 per month for a single line ($155 for
four lines), but which capped network speeds at 3 Mbps and streamed video at a maximum of 1.5 Mbps.165 In late
February 2017, U.S. Cellular introduced its own unlimited data offering.166
b. Video Content Not Counted Towards Data Limits
52. T-Mobile introduced its Binge On feature in November 2015, which exempted streaming video
from participating content providers from subscribers’ monthly data allowance. Other service providers
introduced their own offerings throughout 2016.167 For example, in January 2016, Verizon Wireless introduced
FreeBee 360, which allowed content providers to provide some or all of their mobile content to consumers –
whether in an app or mobile website – without having the content count against their data plans.168 In September
2016, AT&T launched the “Data Free TV” feature, which allowed zero-rated streaming of AT&T’s U-verse and
DIRECTV content via a DIRECTV App.169 In November 2016, AT&T launched DIRECTV NOW, an over-the-
top video product seeded from its existing satellite TV service,170 and made the content available to its own
subscribers without counting against their data limits. In December 2016, T-Mobile offered DIRECTV NOW for
1 year to AT&T customers who switched to T-Mobile’s ONE plan.171 And in March 2017, Verizon Wireless
on AT&T Next. For those AT&T customers that have the provider’s wireless service but not DIRECTV, the carrier offered a
TV package beginning at $19.99 per month for 12 months, with a 24-month agreement.
162 T-Mobile, Hello Un-carrier 12 ... R.I.P. Data Plans T-Mobile Goes All In on Unlimited (Aug. 18, 2016),
https://newsroom.t-mobile.com/news-and-blogs/rip-data-plans.htm.
163 BusinessWire, Sprint Launches Unlimited Freedom: Two Lines of Unlimited Talk, Text and Data for Just $100–All on a
Great Network–and the Best Price Among All National Carriers (Aug. 18, 2016),
http://www.businesswire.com/news/home/20160818005742/en/.
164 Verizon, Get Unlimited Data On the Network You Deserve: Verizon (Feb. 12, 2017),
http://www.verizon.com/about/news/get-unlimited-data-network-you-deserve-verizon.
165 FierceWireless, AT&T Knocks $10 Off Unlimited Service, Adds $60 Unlimited Option with 3 Mbps Speeds (Feb. 27,
2017), http://www.fiercewireless.com/wireless/at-t-knocks-10-off-unlimited-service-adds-60-unlimited-option-3-mbps-
speeds. After 22 GB of data usage per line in a bill cycle, AT&T may slow data speeds on that line during periods of
network congestion, for the remainder of the bill cycle. AT&T, Plans,
https://www.att.com/esupport/article.html#!/wireless/KM1182926 (last visited Sept. 1, 2017).
166 U.S. Cellular, U.S. Cellular Introduces Unlimited Data Offering Among Its New Total Plans With No Hidden Fees (Feb.
24, 2017), https://www.uscellular.com/about/press-room/2017/USCELLULAR-INTRODUCES-UNLIMITED-DATA-
OFFERING-AMONG-ITS-NEW-TOTAL-PLANS-WITH-NO-HIDDEN-FEES.html.
167 T-Mobile, T-Mobile Makes Netflix, Hulu and Other Streaming Video Data Free with Binge On (Nov. 10, 2015),
http://www.fiercewireless.com/wireless/t-mobile-makes-netflix-hulu-and-other-streaming-video-data-free-binge. T-Mobile
Unleashes Mobile Video with Binge On (Nov. 10, 2015), https://newsroom.t-mobile.com/media-kits/un-carrier-x.htm.
168 Verizon, Introducing FreeBee Data: The New Sponsored Data Service from Verizon (Jan. 19, 2016),
http://www.verizon.com/about/news/introducing-freebee-data-new-sponsored-data-service-verizon.
169 AT&T, Watch It Anywhere with AT&T DIRECTV (Sept. 7, 2016),
http://about.att.com/story/watch_it_anywhere_with_att_directv.html.
170 AT&T, The Revolution is Here: AT&T Offers 3 Ways to Stream Premium Video Content (Nov. 28, 2016),
http://about.att.com/story/att_offers_three_ways_to_stream_premium_video_content.html.
171 FierceWireless, T-Mobile Offers Year of DirecTV Now to Users Who Switch from AT&T (Dec. 15, 2016),
http://www.fiercewireless.com/wireless/t-mobile-offers-year-directv-now-to-users-who-switch-from-at-t.

Federal Communications Commission FCC-CIRC1709-08
37
allowed its wireless customers who subscribe to its internet and TV services to watch FiOS programming without
incurring data charges by using Verizon Wireless’s FiOS Mobile App.172
2. Prepaid Service
53. The four nationwide service providers also offer prepaid service under their own prepaid brands,
in addition to selling mobile wireless service wholesale to MVNOs, which then resell service on the nationwide
networks under a variety of prepaid brands. According to certain analysts, “T-Mobile and AT&T maintained
their co-leadership in prepaid, reflecting the expansion and strength of their MetroPCS and Cricket brands, largely
at the expense of Sprint.”173 Verizon Wireless has the smallest share of prepaid subscribers among the nationwide
service providers, with only one prepaid brand, Verizon Wireless Prepaid. To varying degrees, the other three
nationwide service providers pursue a multi-brand prepaid strategy.174 TracFone, the largest MVNO reseller, also
has multiple prepaid brands, including Straight Talk, telcel AMERICA, and SafeLink, which target different
market and demographic segments such as premium, Hispanic, or low-income subscribers.175
54. As postpaid offerings have shifted away from term contracts and equipment subsidies, service
providers have adopted pricing plans and promotions for their high-end prepaid monthly service offerings that are
similar to those they have for postpaid offerings. For example, in April 2017, Verizon Wireless introduced an
$80-a-month plan for prepaid users that included unlimited talk, text and data, as well as unlimited text to more
than 200 international markets and unlimited talk to Mexico and Canada.176 The move followed the launch of
unlimited-data prepaid plans by Verizon Wireless’s three main competitors. T-Mobile’s MetroPCS updated its
$50/month 8 GB plan to include unlimited data. However, hotspot and tethering are not allowed on the $50 plan
and videos are degraded to 480p quality.177 In March 2017, AT&T’s Cricket reduced the price of its unlimited
plan from $70 to $60 a month,178 while Sprint’s Boost Mobile in February 2017 began offering four lines of
unlimited data for $100 a month for users who switch service providers.179
55. Generally, prepaid subscribers who reach the limit of their high-speed data allowance in a given
month may continue to use their handsets for data service on an unlimited basis, but at reduced speeds. For
example, Cricket Wireless reduces data download speeds to a maximum of 128 Kbps after the customer’s high
speed data allowance is used.180 In comparison, postpaid subscribers who use up their plan’s data allowance in a
given month generally experience data deprioritization only during network congestion.181 In addition, AT&T
172 FierceWireless, Verizon Extends Zero-rated Mobile Video to Fios Users (Mar. 9, 2017),
http://www.fiercewireless.com/wireless/verizon-extends-zero-rated-mobile-video-to-fios-users.
173 Paul de Sa, Bernstein Research, U.S. Telecom: Eight Takeaways from 1Q16 Retail Mobile (May 13, 2016).
174 Sprint prepaid brands include Boost Mobile and Virgin Mobile.
175 TracFone Wireless Inc., Brands, http://www.tracfonewirelessinc.com/en/brands/ (last visited Sept. 1, 2017).
176 Verizon, Verizon Introduces Unlimited to Prepaid (Apr. 25, 2017), http://www.verizon.com/about/news/verizon-
introduces-unlimited-prepaid.
177 MetroPCS, $50 Period, https://www.metropcs.com/shop/plans?icid=home%7Chero%7Cplans (last visited Sept. 1, 2017).
178 Cricket Wireless, Cricket Wireless’ Unlimited Plan Now Just $60 Plus Switch to Cricket and Choose from 4 FREE
Smartphones (Mar. 1, 2017), http://cricketwireless.mediaroom.com/news-releases?item=122578.
179 Boost Mobile, 4 Lines for $100/mo., https://www.boostmobile.com/?#!/4for100/ (last visited Sept. 1, 2017).
180 Cricket Wireless, Mobile Broadband Information, https://www.cricketwireless.com/legal-info/mobile-broadband-
information.html (last visited Sept. 1, 2017).
181 See, e.g., Sprint, Sprint Unlimited Data, Talk and Text Cell Phone Plans, https://www.sprint.com/landings/unlimited-cell-
phone-plans/?id16=unlimited%20Freedom%20%7CAll&question_box=unlimited%20Freedom%20%7CAll (last visited
Sept. 1, 2017); Verizon Wireless, The New Verizon Plan Unlimited FAQs, https://www.verizonwireless.com/support/new-
verizon-plan-unlimited-faqs/ (last visited Sept. 1, 2017).
Federal Communications Commission FCC-CIRC1709-08
38
offers zero overages, as well as “Rollover Data,” which allows its postpaid subscribers to roll over their unused
data at no additional cost.182
56. The prepaid and postpaid versions of a given pricing plan or promotion still differ somewhat,183
largely because prepaid subscribers may lack the credit background or income necessary to qualify for postpaid
service. To prevent credit losses,184 and mitigate the credit risk associated with the prepaid segment, service
providers require advance payment for both prepaid service and handsets.185
3. Price Indicators for Mobile Wireless Services
57. As discussed earlier, and in previous Reports, it is difficult to compare prices of mobile wireless
service plans because providers offer a variety of plans, frequently under multipart pricing schemes, which also
vary in non-price terms and features, such as early termination fees and the consequences of reaching usage
limits.186 The many pricing plans offered by mobile wireless service providers vary in several dimensions, and
these plans frequently change.187 Chart III.A.1 below presents monthly postpaid prices for the four nationwide
service providers, including discounts for auto-pay, which are now a feature of all major plans.188 Chart III.A.2
below shows the current monthly prices for major prepaid service providers. As discussed above, plans with
“unlimited” LTE data, whether postpaid or prepaid, are now the primary offering of the four nationwide providers
(though postpaid users frequently are given priority over prepaid users on a given network during times of peak
congestion). Further, the heaviest postpaid users may also experience deprioritized speeds during periods of peak
network congestion after they have exceeded certain monthly data thresholds.189
182 AT&T, Mobile Share Advantage, https://www.att.com/shop/wireless/data-plans.html (last visited Sept. 1, 2017); AT&T,
Rollover Data, https://www.att.com/shop/wireless/rollover-data.html (last visited Sept. 1, 2017).
183 Nineteenth Report, 31 FCC Rcd at 10596, para. 90.
184 Both Sprint and T-Mobile have changed or modified their policies regarding credit checks to subscribers most at risk of
defaulting on new purchases of higher end devices. FierceWireless, Sprint Using Progressive Finance to Provide Loans to
Customers for Devices Without a Credit Check (Mar. 23, 2016), http://www.fiercewireless.com/story/sprint-using-
progressive-finance-provide-loans-customers-devices-without-cr/2016-03-23.
185 AT&T, AT&T GoPhone, Unlimited Talk, Text, and Data Usage, https://www.att.com/shop/wireless/gophone-plans.html
(last visited Sept. 1, 2017); Sprint, More Data, More Data, More Data (July 28, 2015), http://newsroom.sprint.com/news-
releases/more-data-more-data-more-dataeveryone-wants-more-high-speed-data-so-boost-mobile-and-virgin-mobile-usa-
offer-more-high-speed-data-with-5-and-10-data-pack-add-ons.htm.
186 As discussed in previous Reports, it is therefore difficult to identify sources of information that track mobile wireless
service prices in a comprehensive and consistent manner. In addition, data on subscribership is not available at the plan
level and any average price comparison implicitly assumes uniform subscribership of all plans. See, e.g., Nineteenth
Report, 31 FCC Rcd at 10554-55, para. 26; Sixteenth Report, 28 FCC Rcd at 3797, para. 137.
187 Appendix III: Elements of Inter-Firm Rivalry provides additional information, based on data from RBC Capital Markets,
on pricing over the time period covered by this Report for the four nationwide service providers.
188 In addition, T-Mobile incorporates taxes and fees into its advertised prices. As these fees vary by locality, there is no way
to fully account for the differences in pricing in Chart III.A.1.
189 As noted above, the average consumer uses about 4 GB of data per month, and after a certain level of data consumption
(around 20 GB or so), data may be deprioritized.

Federal Communications Commission FCC-CIRC1709-08
39
Note: The prices for unlimited data plans were taken from service providers’ websites on May 2, 2017.
Prices include any per line charges indicated by the service provider. Prices do not include any additional
charges such as for equipment installment plans, insurance, international use, or mobile hotspots. If a
service provider includes any such feature as part of its unlimited data plan without extra charge, the above
price would include this feature. Further, the above prices do not include any one-time charges paid, such
as activation fees and termination fees. Prices and the specifics of the plans are subject to change.
Note: The prices were taken from service providers’ websites on May 17, 2017. Prices include any per
line changes indicated by the service provider. Except where noted, prices are for unlimited data quantities.
Prices and the specifics of the plans are subject to change.
FL
AT
PR
ICE
FL
AT
PR
ICE
FL
AT
PR
ICE
$0
$20
$40
$60
$80
$100
$120
$140
$160
$180
$200
AT&T Sprint T-Mobile Verizon
Chart III.A.1
Monthly "Unlimited" Postpaid Prices for
Top 4 Service Providers
1 Line 2 Lines 4 Lines
5 G
B
5 G
B 5 G
B
$0
$20
$40
$60
$80
$100
$120
$140
$160
$180
$200
Cricket (AT&T) Boost (Sprint) Metro PCS (T-Mobile) Straight Talk
Chart III.A.2
Monthly "Unlimited" Prepaid Prices for Major Service Providers
1 Line 2 Lines 4 Lines
Federal Communications Commission FCC-CIRC1709-08
40
58. CPI. The Consumer Price Index (CPI) is a measure of the average change over time in the prices
paid by consumers for a fixed market basket of consumer goods and services.190 As documented in previous
Reports, two different pricing indicators–the Wireless Telephone Services CPI and the per-minute price of voice
service–show that mobile wireless prices have declined significantly since the launch of Personal
Communications Service (PCS) service in the mid-1990s.191 The wireless telephone services’ component of the
CPI (Wireless Telephone Services CPI) is published by the U.S. Department of Labor’s Bureau of Labor
Statistics (BLS) on a national basis.192 According to CPI data, the price (in constant dollars) of mobile wireless
services has continued to decline. From year-end 2015 to year-end 2016, the annual Wireless Telephone Services
CPI decreased by 1.0 percent while the overall CPI increased by 1.3 percent, and the Telephone Services CPI fell
by 0.5 percent.193 Further, from year-end 2012 through year-end 2016, the annual Wireless Telephone Services
CPI decreased by approximately 8 percent and the Telephone Services CPI decreased by approximately 3 percent,
while the overall CPI increased by 4.5 percent.
59. Average Revenue Per Unit. ARPU can be used as a reasonable proxy for understanding pricing
changes, particularly where there are multiple pricing plans and/or pricing structures are complicated as is the
case for mobile wireless services.194 As shown in Chart III.A.3 below, according to CTIA, the industry ARPU fell
sharply during 2016 from $44.65 to $41.50, a decline of approximately 7 percent.195 Recent changes by service
providers, such as the removal of overage charges, the move toward unlimited data plans, and EIPs have all
contributed to the reported decline in ARPU.196 Chart III.A.3 also shows subscribers/connections and ARPU for
the past 20 years.
190 The basket of goods includes over 200 categories, such as food and beverages, housing, apparel, transportation, medical
care, recreation, education, and communications. The CPI allows consumers to compare the price of the basket of goods
and services this month with the price of the same basket a month or a year ago.
191 See, e.g., Nineteenth Report, 31 FCC Rcd at 10557-58, para. 29; Sixteenth Report, 28 FCC Rcd at 3875, 3877, para. 265,
Table 38.
192 Starting in December 1997, the basket included a category for cellular/wireless telephone services. All CPI figures
discussed above were taken from BLS databases: Bureau of Labor Statistics, http://www.bls.gov (last visited Sept. 1,
2017. The index used in this analysis, the CPI for All Urban Consumers (CPI-U), represents about 87% of the total U.S.
population. Bureau of Labor Statistics, Consumer Price Index: Frequently Asked Questions,
http://www.bls.gov/cpi/cpifaq.htm (last visited Sept. 1, 2017). The CPI category “Telephone Services” has two components:
wireless telephone services and landline telephone services. Wireless telephone services include “all service charges,
applicable per-plan charges or per-minute call charges, and other charges normally included in a cellular plan are eligible for
pricing. Internet access is also eligible.” Landline telephone services include “charges for all types of local and long-distance
residential services are eligible for collection, including charges for dial tone services, line maintenance and access, 911
services, directory assistance, touch-tone service, and other special features and mandatory charges and
installation.” Additional information can be found at Bureau of Labor Statistics, Consumer Price Index: How the Consumer
Price Index Measures Price Change for Telephone Services, https://www.bls.gov/cpi/factsheet-telephone-services.htm (last
visited Sept. 1, 2017).
193 Appendix III: Elements of Inter-Firm Rivalry, Table III.A.i provides more details.
194 Seventeenth Report, 29 FCC Rcd 15311, 15328, para. 35 & n.52; Patrick McCloughan, Sean Lyons, Accounting for
ARPU: New evidence from international panel data, Telecommunications Policy 30, 521-32 (2006); Eun-A Park, Krishna
Jayakar, Competition between Standards and the Prices of Mobile Telecommunication Services: Analysis of Panel Data,
TPRC 2015 (Aug. 15, 2015).
195 CTIA reported an industry average measure of “Average Revenue per Reported (subscriber) Unit,” or ARPU, which is
based “upon total revenues divided by the average total reported active units per survey period, divided by the number of
months in the survey period,” i.e., an annualized monthly ARPU.
196 In 2012, CTIA started reporting an alternative ARPU measure which is calculated on revenue generating devices and
replaced the original Average Local Monthly Bill (ALMB). The methodology change contributed to different calculations.
CTIA Wireless Industry Indices Year-End 2016, at 85.
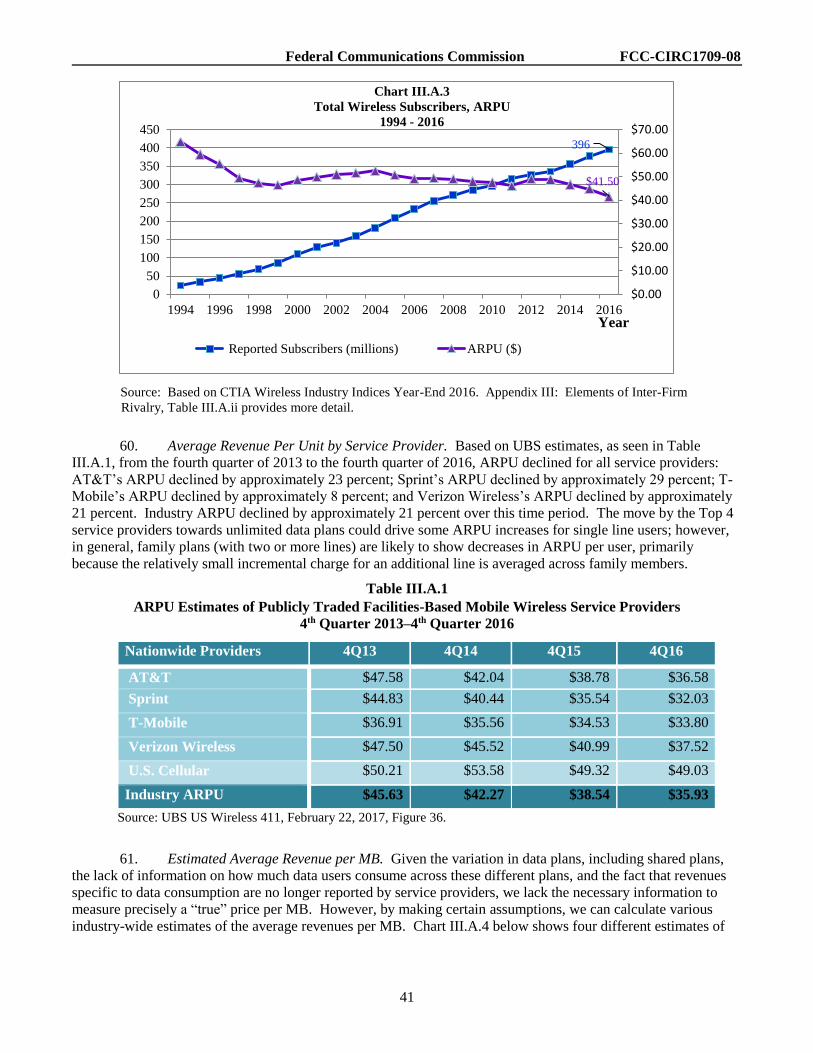
Federal Communications Commission FCC-CIRC1709-08
41
Source: Based on CTIA Wireless Industry Indices Year-End 2016. Appendix III: Elements of Inter-Firm
Rivalry, Table III.A.ii provides more detail.
60. Average Revenue Per Unit by Service Provider. Based on UBS estimates, as seen in Table
III.A.1, from the fourth quarter of 2013 to the fourth quarter of 2016, ARPU declined for all service providers:
AT&T’s ARPU declined by approximately 23 percent; Sprint’s ARPU declined by approximately 29 percent; T-
Mobile’s ARPU declined by approximately 8 percent; and Verizon Wireless’s ARPU declined by approximately
21 percent. Industry ARPU declined by approximately 21 percent over this time period. The move by the Top 4
service providers towards unlimited data plans could drive some ARPU increases for single line users; however,
in general, family plans (with two or more lines) are likely to show decreases in ARPU per user, primarily
because the relatively small incremental charge for an additional line is averaged across family members.
Table III.A.1
ARPU Estimates of Publicly Traded Facilities-Based Mobile Wireless Service Providers
4th Quarter 2013–4th Quarter 2016
Nationwide Providers 4Q13 4Q14 4Q15 4Q16
AT&T $47.58 $42.04 $38.78 $36.58
Sprint $44.83 $40.44 $35.54 $32.03
T-Mobile $36.91 $35.56 $34.53 $33.80
Verizon Wireless $47.50 $45.52 $40.99 $37.52
U.S. Cellular $50.21 $53.58 $49.32 $49.03
Industry ARPU $45.63 $42.27 $38.54 $35.93
Source: UBS US Wireless 411, February 22, 2017, Figure 36.
61. Estimated Average Revenue per MB. Given the variation in data plans, including shared plans,
the lack of information on how much data users consume across these different plans, and the fact that revenues
specific to data consumption are no longer reported by service providers, we lack the necessary information to
measure precisely a “true” price per MB. However, by making certain assumptions, we can calculate various
industry-wide estimates of the average revenues per MB. Chart III.A.4 below shows four different estimates of
396
$41.50
$0.00
$10.00
$20.00
$30.00
$40.00
$50.00
$60.00
$70.00
0
50
100
150
200
250
300
350
400
450
1994 1996 1998 2000 2002 2004 2006 2008 2010 2012 2014 2016Year
Chart III.A.3
Total Wireless Subscribers, ARPU
1994 - 2016
Reported Subscribers (millions) ARPU ($)

Federal Communications Commission FCC-CIRC1709-08
42
the average revenue per MB, based on data from CTIA and the U.S. Census,197 and all four estimates indicate that
average revenue per MB has been declining. Specifically, as of 2016, these estimates show a decrease of
approximately 28 to approximately 33 percent compared to 2015, and a decrease of approximately 85 percent to
approximately 89 percent compared to 2012.
Source: Based on data from the CTIA Wireless Industry Indices Year-End 2016 and the U.S. Census.
B. Differentiation in Mobile Wireless Devices/Services and Advertising/Marketing
1. Differentiation in Mobile Wireless Devices and Services
62. In addition to competing on price and network quality, service providers compete by offering
consumers innovative mobile wireless devices and differentiated services at a variety of prices.198 Wireless
providers increasingly are also offering mobile video and content, virtual reality, wearable devices such as
197 To derive $/MB (Total Rev) we divide the Total Service Revenues by the Total Wireless Data Traffic, assuming that
100% of service revenues are attributable to data. CTIA Wireless Industry Indices Year-End 2016, at 8, 45. To derive $/MB
(All Users) and $/MB (Smartphones) we divide ARPU by the monthly average GB data usage, and we calculate this metric
both with all users and with smartphone users only. Again, this assumes that 100% of revenues are attributable to data and
that average revenue is the same for both smartphone users and non-smartphone users. CTIA Wireless Industry Year-End
2016, at 53, 97. Finally, for $/MB (Est. Data Rev), we estimate the percentage of total revenues that are attributable to data
by dividing Internet Access Service Revenues by Total Revenues for NAICS 5172, U.S. Census Bureau, 2015 Annual
Service Survey, Table 4: Estimated Sources of Revenue for Employer Firms: 2010 through 2015,
https://www.census.gov/services/index.html (last visited Sept. 1, 2017). The 2016 data percentage was estimated based on
the average growth rate across 2012 to 2015. We then applied these percentages to the CTIA data (Total Service
Revenues/Total Wireless Data Traffic). CTIA Wireless Industry Indices Year-End 2016, at 8, 45. This does not take into
account the fraction of revenues that are made up of messaging.
198 CTIA Comments at vi.
$0.00
$0.02
$0.04
$0.06
$0.08
$0.10
$0.12
$0.14
2012 2013 2014 2015 2016
Est
ima
ted
Rev
enu
e p
er M
B
Chart III.A.4
Estimates of Average Revenue per MB: 2012-2016
$/MB (Total Rev)
$/MB (All Users)
$/MB
(Smartphones)
$/MB (Est. Data
Rev)

Federal Communications Commission FCC-CIRC1709-08
43
smartwatches,199 smart home devices, and other connected IoT devices.200 There has been significant growth in
the variety of networked devices over the past year, 201 and there also have been improvements and innovations in
device functionality across platforms and technologies. For example, smartphone operating systems such as the
Android and Apple iOS are more integrated with other mobile and wireless-enabled devices, including tablets,
wearable devices, PCs, and over-the-top (OTT) streaming devices,202 while handsets may now include features
such as touch screens, mobile web browsing capabilities, current-generation operating systems, faster processors,
improved cameras, and better battery performance.203
63. Smartphone device penetration in the U.S. increased between 2015 and 2016 from 70 percent to
77 percent.204 During 2016, the number of active smartphones in the U.S. increased from 228.3 million to 261.9
million.205 UBS estimates that internet device net adds (including tablets) increased between 2015 and 2016,
although growth has slowed in this category. In 2015, there were 8.2 million net adds of internet devices, which
increased by four percent in 2016 to 8.6 million.206 CTIA estimates that, in total, the 309.8 million smartphones
and other data-heavy devices amount to roughly 78 percent of all connections.207 CTIA also estimates that 105.7
million devices were data-only at year-end 2016, up from 85.7 million at year-end 2015.208 Although the use of
data-only devices with mobile network connectivity has grown, “phablets,” a class of mobile device combining
the form and technical capabilities of smartphones and tablets, are replacing the use of tablets in some cases.209 In
addition, machine-to-machine modules represented approximately 23 percent of device connections in 2016.210
64. Examples of mobile providers trying to differentiate their offerings include AT&T’s installment
plan device charges of $5 per month for an LG K10 device, and $32 per month for an iPhone 7 Plus with 256 GB
199 CNET, Wearables Market Expected to Hit 213 Million Units Shipped in 2020 (June 15, 2016),
http://www.cnet.com/news/wearables-market-expected-to-hit-213-million-units-shipped-in-2020/.
200 The large array of IoT products includes both consumer and business devices and applications, such as wearables,
connected cars, smart home devices, manufacturing systems, and remote monitoring of products like Verizon Wireless’s
Hum device, which plugs into a vehicle and offers monitoring, roadside and emergency assistance, and stolen vehicle
tracking. Verizon Wireless Comments at 16. It is predicted that the widespread availability of 5G services will fuel the
growth of the IoT. See, e.g., Mobile Future Comments at 7.
201 CTIA Comments at 7. The devices offered include a range of traditional handsets, smartphones, phablets, tablets made by
different manufacturers with different operating systems, e-readers, wireless data cards, mobile WiFi hotspots, and netbook
computers with embedded modems.
202 For example, Verizon Wireless claims that to meet the demand for data usage, Wi-Fi is now integrated into nearly all of
their devices. Verizon Wireless Comments at 8.
203 CTIA Comments at vi. In April 2017, Apple introduced the iPhone7 in September 2016, with improvements to the
display, processor, stereo speakers, and camera. Samsung introduced the Galaxy S8, with improved camera and processor,
and iris scanning security functions. In addition, HTC offered the U Ultra phablet that includes a personal assistant program
(the HTC Sense Companion). CTIA Comments at 18-19.
204 Deloitte, 2016 Global Mobile Consumer Survey: U.S. Edition at 6.
205 CTIA Comments at 8.
206 UBS US Wireless 411: Version 56, at 11 (May 14, 2015); Version 57, at 20 (Aug. 17, 2015); Version 59, at 22 (Mar. 2,
2016); UBS US Wireless 411, at 13, Feb. 2017.
207 CTIA Comments at 8.
208 CTIA Comments at 8.
209 The phablet has been defined as a handset with a screen size of 5.5 to 6.9 inches that can be held while making phone
calls, but not necessarily for an extended period of time. CNET, Phablets to Flood Smartphone Market in Coming Years
(Jan. 28, 2015), http://www.cnet.com/news/phablets-to-flood-smartphone-market-in-coming-years-report/.
210 Verizon Wireless Comments at 16 (citing Cisco, VNI Mobile Forecast Highlights 2016-2021).
Federal Communications Commission FCC-CIRC1709-08
44
of storage capacity,211 and U.S. Cellular’s offering of a low-cost LG smartphone for $19.99.212 In addition,
MVNOs may use specialized customer care and content to differentiate their service plan offerings.213 Another
strategy is one of exclusive arrangements with device manufacturers. During the past several years, AT&T has
been the exclusive provider of devices ranging from the Lumia 1020 from Nokia to the Amazon Fire phone.214
Verizon Wireless also has exclusive distribution arrangements for certain Motorola models, and is the exclusive
provider of Google’s Pixel phone (besides Google itself through its Project Fi mobile wireless plan).215 Smaller
service providers have asserted that exclusive agreements between handset manufacturers and the larger service
providers put them at a competitive disadvantage because they are sometimes unable to obtain the newest
handsets.216 The percentage of NTCA survey respondents indicating that handset availability remained a major
barrier to their ability to provide wireless service to their customers declined from 42 percent in 2015 to 33
percent in 2016.217
65. With respect to OTT video streaming and content, some service providers have offered video-
streaming plans that do not count against their monthly data allowance.218 For example, AT&T offered
DIRECTV NOW which allowed data free streaming of video using the DIRECTV application.219 AT&T also has
offered content such as HBO as part of certain service packages.220 Verizon Wireless launched an unlimited plan
for $80 a month which includes HD video.221 In response, T-Mobile has offered HD video with its $70/month
unlimited plan.222 In addition, certain cable companies have announced they will use hybrid Wi-Fi/cellular
connectivity223 to build wireless networks.224
211 AT&T, Smartphones, https://www.att.com/shop/wireless/devices/smartphones.html (last visited Sept. 1, 2017).
212 CTIA Comments at 19.
213 Verizon Wireless Comments at 22.
214 FierceWireless, With Shrinking Handset Lineup, AT&T Shifting Focus from Gadgets to Services (Mar. 23, 2017),
http://www.fiercewireless.com/wireless/shrinking-handset-lineup-at-t-shifting-focus-from-gadgets-to-services.
215 FierceWireless, With Shrinking Handset Lineup, AT&T Shifting Focus from Gadgets to Services (Mar. 23, 2017),
http://www.fiercewireless.com/wireless/shrinking-handset-lineup-at-t-shifting-focus-from-gadgets-to-services.
216 Nineteenth Report, 31 FCC Rcd at 10615, para. 113.
217 NTCA 2015 Wireless Survey Report (Jan. 2016); NTCA 2016 Wireless Survey Report (Jan. 2017).
218 See supra Section III.A.1: Facilities-Based Service Providers.
219 FierceWireless, AT&T's Stephenson: DirecTV Now to Offer 100-Plus Channels of Zero-rated Video for Wireless Subs
(Sept. 21, 2016), http://www.fiercewireless.com/wireless/at-t-s-stephenson-directv-now-to-offer-100-plus-channels-zero-
rated-video-for-wireless. AT&T also offers customers an option called “Stream Saver.” This option allows customers to
watch more video while using less data by streaming video content at Standard Definition quality, similar to DVD (about
480p). The customer has the option of turning this feature on or off. AT&T, Stream Saver,
https://www.att.com/offers/streamsaver.html (last visited Sept. 1, 2017).
220 Fortune, How to Get Free HBO With AT&T’s Unlimited Mobile Plan (Apr. 5, 2017), http://fortune.com/2017/04/05/hbo-
free-att-mobile/.
221 FierceWireless, T-Mobile Fires Back at Verizon, Adds HD Video to Unlimited (Feb. 13, 2017),
http://www.fiercewireless.com/wireless/t-mobile-fires-back-at-verizon-adds-hd-video-to-unlimited.
222 FierceWireless, T-Mobile Fires Back at Verizon, Adds HD Video to Unlimited (Feb. 13, 2017),
http://www.fiercewireless.com/wireless/t-mobile-fires-back-at-verizon-adds-hd-video-to-unlimited.
223 See supra Section II.A.2: Resellers/Mobile Virtual Network Operators and Other Service Providers.
224 Comcast.com, Comcast Introduces Xfinity Mobile: Combining America’s Largest, Most Reliable 4G LTE Network and
the Largest Wi-Fi Network (Apr. 6, 2017), http://corporate.comcast.com/news-information/news-feed/comcast-xfinity-
mobile.
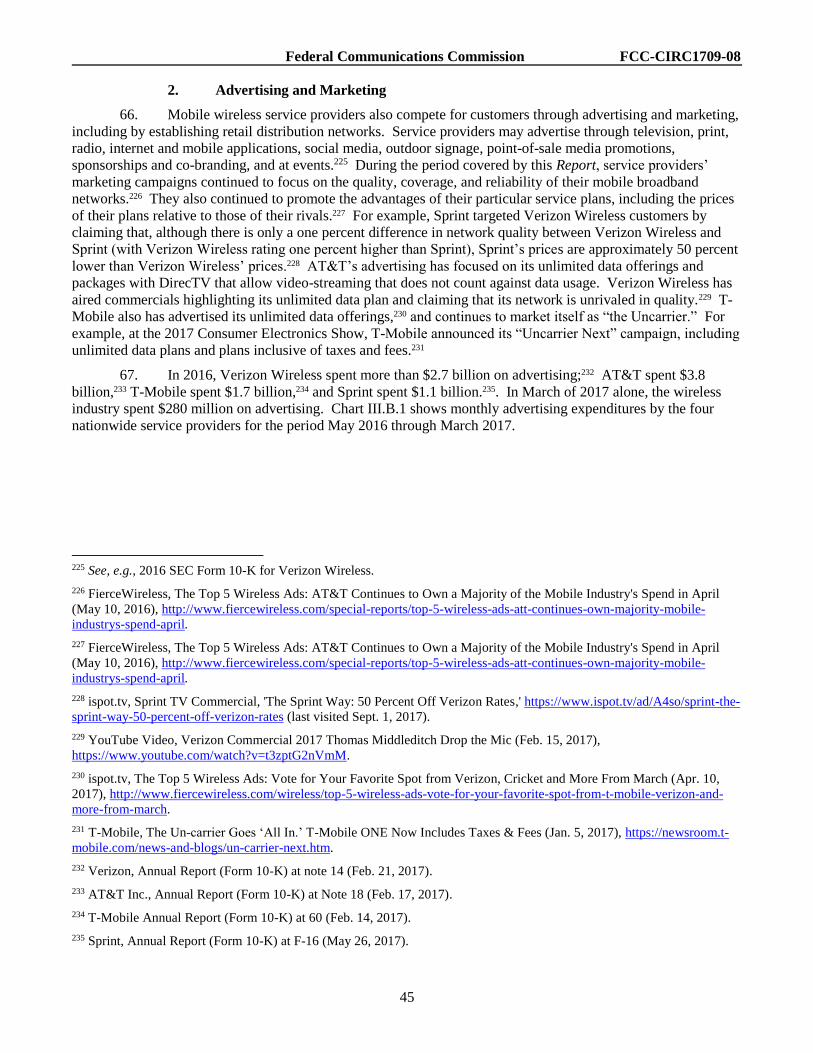
Federal Communications Commission FCC-CIRC1709-08
45
2. Advertising and Marketing
66. Mobile wireless service providers also compete for customers through advertising and marketing,
including by establishing retail distribution networks. Service providers may advertise through television, print,
radio, internet and mobile applications, social media, outdoor signage, point-of-sale media promotions,
sponsorships and co-branding, and at events.225 During the period covered by this Report, service providers’
marketing campaigns continued to focus on the quality, coverage, and reliability of their mobile broadband
networks.226 They also continued to promote the advantages of their particular service plans, including the prices
of their plans relative to those of their rivals.227 For example, Sprint targeted Verizon Wireless customers by
claiming that, although there is only a one percent difference in network quality between Verizon Wireless and
Sprint (with Verizon Wireless rating one percent higher than Sprint), Sprint’s prices are approximately 50 percent
lower than Verizon Wireless’ prices.228 AT&T’s advertising has focused on its unlimited data offerings and
packages with DirecTV that allow video-streaming that does not count against data usage. Verizon Wireless has
aired commercials highlighting its unlimited data plan and claiming that its network is unrivaled in quality.229 T-
Mobile also has advertised its unlimited data offerings,230 and continues to market itself as “the Uncarrier.” For
example, at the 2017 Consumer Electronics Show, T-Mobile announced its “Uncarrier Next” campaign, including
unlimited data plans and plans inclusive of taxes and fees.231
67. In 2016, Verizon Wireless spent more than $2.7 billion on advertising;232 AT&T spent $3.8
billion,233 T-Mobile spent $1.7 billion,234 and Sprint spent $1.1 billion.235. In March of 2017 alone, the wireless
industry spent $280 million on advertising. Chart III.B.1 shows monthly advertising expenditures by the four
nationwide service providers for the period May 2016 through March 2017.
225 See, e.g., 2016 SEC Form 10-K for Verizon Wireless.
226 FierceWireless, The Top 5 Wireless Ads: AT&T Continues to Own a Majority of the Mobile Industry's Spend in April
(May 10, 2016), http://www.fiercewireless.com/special-reports/top-5-wireless-ads-att-continues-own-majority-mobile-
industrys-spend-april.
227 FierceWireless, The Top 5 Wireless Ads: AT&T Continues to Own a Majority of the Mobile Industry's Spend in April
(May 10, 2016), http://www.fiercewireless.com/special-reports/top-5-wireless-ads-att-continues-own-majority-mobile-
industrys-spend-april.
228 ispot.tv, Sprint TV Commercial, 'The Sprint Way: 50 Percent Off Verizon Rates,' https://www.ispot.tv/ad/A4so/sprint-the-
sprint-way-50-percent-off-verizon-rates (last visited Sept. 1, 2017).
229 YouTube Video, Verizon Commercial 2017 Thomas Middleditch Drop the Mic (Feb. 15, 2017),
https://www.youtube.com/watch?v=t3zptG2nVmM.
230 ispot.tv, The Top 5 Wireless Ads: Vote for Your Favorite Spot from Verizon, Cricket and More From March (Apr. 10,
2017), http://www.fiercewireless.com/wireless/top-5-wireless-ads-vote-for-your-favorite-spot-from-t-mobile-verizon-and-
more-from-march.
231 T-Mobile, The Un-carrier Goes ‘All In.’ T-Mobile ONE Now Includes Taxes & Fees (Jan. 5, 2017), https://newsroom.t-
mobile.com/news-and-blogs/un-carrier-next.htm.
232 Verizon, Annual Report (Form 10-K) at note 14 (Feb. 21, 2017).
233 AT&T Inc., Annual Report (Form 10-K) at Note 18 (Feb. 17, 2017).
234 T-Mobile Annual Report (Form 10-K) at 60 (Feb. 14, 2017).
235 Sprint, Annual Report (Form 10-K) at F-16 (May 26, 2017).
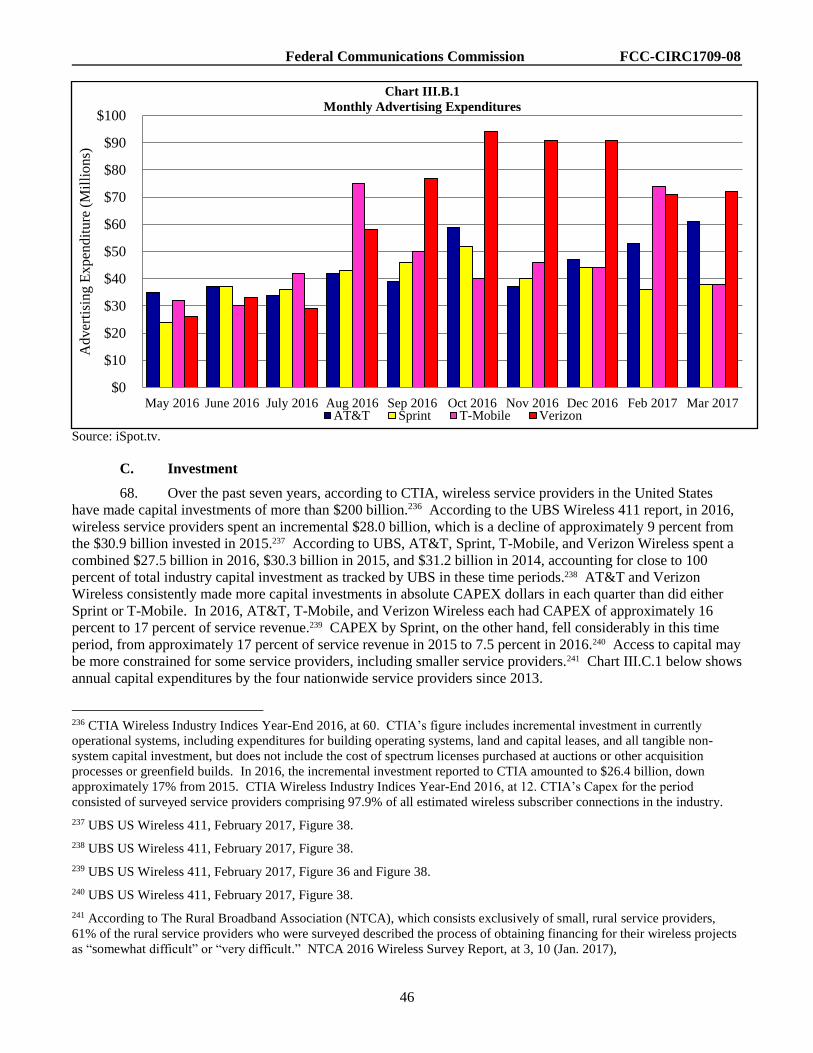
Federal Communications Commission FCC-CIRC1709-08
46
Source: iSpot.tv.
C. Investment
68. Over the past seven years, according to CTIA, wireless service providers in the United States
have made capital investments of more than $200 billion.236 According to the UBS Wireless 411 report, in 2016,
wireless service providers spent an incremental $28.0 billion, which is a decline of approximately 9 percent from
the $30.9 billion invested in 2015.237 According to UBS, AT&T, Sprint, T-Mobile, and Verizon Wireless spent a
combined $27.5 billion in 2016, $30.3 billion in 2015, and $31.2 billion in 2014, accounting for close to 100
percent of total industry capital investment as tracked by UBS in these time periods.238 AT&T and Verizon
Wireless consistently made more capital investments in absolute CAPEX dollars in each quarter than did either
Sprint or T-Mobile. In 2016, AT&T, T-Mobile, and Verizon Wireless each had CAPEX of approximately 16
percent to 17 percent of service revenue.239 CAPEX by Sprint, on the other hand, fell considerably in this time
period, from approximately 17 percent of service revenue in 2015 to 7.5 percent in 2016.240 Access to capital may
be more constrained for some service providers, including smaller service providers.241 Chart III.C.1 below shows
annual capital expenditures by the four nationwide service providers since 2013.
236 CTIA Wireless Industry Indices Year-End 2016, at 60. CTIA’s figure includes incremental investment in currently
operational systems, including expenditures for building operating systems, land and capital leases, and all tangible non-
system capital investment, but does not include the cost of spectrum licenses purchased at auctions or other acquisition
processes or greenfield builds. In 2016, the incremental investment reported to CTIA amounted to $26.4 billion, down
approximately 17% from 2015. CTIA Wireless Industry Indices Year-End 2016, at 12. CTIA’s Capex for the period
consisted of surveyed service providers comprising 97.9% of all estimated wireless subscriber connections in the industry.
237 UBS US Wireless 411, February 2017, Figure 38.
238 UBS US Wireless 411, February 2017, Figure 38.
239 UBS US Wireless 411, February 2017, Figure 36 and Figure 38.
240 UBS US Wireless 411, February 2017, Figure 38.
241 According to The Rural Broadband Association (NTCA), which consists exclusively of small, rural service providers,
61% of the rural service providers who were surveyed described the process of obtaining financing for their wireless projects
as “somewhat difficult” or “very difficult.” NTCA 2016 Wireless Survey Report, at 3, 10 (Jan. 2017),
$0
$10
$20
$30
$40
$50
$60
$70
$80
$90
$100
May 2016 June 2016 July 2016 Aug 2016 Sep 2016 Oct 2016 Nov 2016 Dec 2016 Feb 2017 Mar 2017
Ad
ver
tisi
ng E
xp
end
itu
re (
Mil
lio
ns)
Chart III.B.1
Monthly Advertising Expenditures
AT&T Sprint T-Mobile Verizon

Federal Communications Commission FCC-CIRC1709-08
47
Source: UBS US Wireless 411, Version 59, Figure 72; Wireless 411, February 2017, Figure 38.
D. Nationwide Network Coverage and Technology Upgrades
69. We measure network coverage in this Report based on Form 477 data,242 which contains
information on deployment submitted by service providers in the form of polygons representing detailed coverage
areas.243 We first apply a centroid methodology to the Form 477 data, and we then analyze the Form 477 data on
a sub-census-block level, calculating the percentage of each census block covered by each technology.
https://www.ntca.org/images/stories/Documents/Advocacy/SurveyReports/2016wirelessurveryreport.pdf. See also NTCA
Comments (May 8, 2017).
242 Currently, Form 477 collects data from facilities-based service providers of (1) internet service with information transfer
rates exceeding 200 kbps in at least one direction; and (2) mobile service to at least one subscriber. This excludes providers
of terrestrial wireless “hot spot” services, like local-area Wi-Fi or Wi-Fi within public places, but includes facilities-based
network providers that provide resale of mobile services. Facilities-based service providers of mobile wireless service
submitted polygons in an ESRI shapefile format representing geographic coverage nationwide (including U.S. territories) for
each transmission technology (e.g., EV-DO, WCDMA, HSPA+, LTE, WiMAX) deployed in each frequency band (e.g., 700
MHz, Cellular, AWS, PCS, BRS/EBS). Modernizing the FCC Form 477 Data Program, WC Docket No. 11-10, Report and
Order, 28 FCC Rcd 9887, 9908, para. 42 (2013) (Modernizing Form 477 Order); FCC Form 477, Local Telephone
Competition and Broadband Reporting, Instructions 24 (2016) (Form 477 Instructions),
https://transition.fcc.gov/form477/477inst.pdf. In addition, service providers submit information on the geographic areas in
which users should expect to receive the minimum speed advertised by the service provider for the used spectrum and
deployed technologies. Modernizing Form 477 Order, 28 FCC Rcd at 9888, 9897, 9908 paras. 3, 20, 42; FCC Form 477,
Form 477 Instructions at 24. Service providers are also required to certify as to the accuracy of the data submitted. Id., 28
FCC Rcd at 9897-98, paras. 23-24 (noting that the certification obligation will help promote complete and accurate data).
243 In addition, on the Twentieth Report’s website, we present overall wireless and LTE coverage information based on data
received by the Commission through a contract with Mosaik Solutions. Web Appendix III: Elements of Inter-Firm Rivalry,
https://www.fcc.gov/20th-cmrs-report-web-appendices. Mosaik Solutions is an independent consulting firm that tracks
coverage footprints of mobile voice and mobile data networks and provides data on facilities-based service providers in the
form of coverage boundary maps based on the coverage boundaries provided to them by mobile wireless network operators.
Mosaik, About Us, http://www.mosaik.com/about-us/ (last visited Sept. 1, 2017). Mosaik reports advertised coverage as
$9,425
$10,515
$11,725$11,240$11,191 $11,383
$9,400$9,750
$6,833
$4,886
$4,026
$1,797
$4,241 $4,317$4,724 $4,702
$0
$2,000
$4,000
$6,000
$8,000
$10,000
$12,000
$14,000
$16,000
2013 2014 2015 2016
Cap
ital
Ex
pen
dit
ure
s ($
Mil
lio
ns)
Chart III.C.1
Yearly Capital Expenditures by Service Provider
2013 - 2016
Verizon Wireless AT&T Sprint T-Mobile
Federal Communications Commission FCC-CIRC1709-08
48
70. As the Commission has stated, having accurate and reliable mobile broadband deployment data is
critical to policymakers as well as to consumers.244 We observe that, while the current Form 477 deployment data
is an improvement over the deployment data previously available on a national scale, questions have arisen in
various contexts regarding the bases for certain filings.245 For example, in the context of the MF-II proceeding,
the Commission determined that a separate, one-time data collection was necessary to ensure that all Form 477
filers were using a consistent standard when reporting their deployment of 5 Mbps 4G LTE services.246 In
addition, the Commission has initiated a rulemaking to consider improvements in the Form 477 data collection
process.247
71. The centroid methodology is applied to U.S. census blocks overlaid on service provider coverage
maps. Under this methodology, if the geometric center point, or centroid,248 of a census block is within the
coverage boundary of a coverage map,249 then we consider that block to be “covered” by that service provider
and/or technology.250 We then aggregate the population, land area, and road miles of the covered census blocks to
generate our total coverage estimates. We note that these coverage estimates represent deployment of mobile
networks and do not indicate the extent to which service providers affirmatively offer service to residents in the
covered areas. While we recognize that this analysis likely overstates the coverage experienced by some
reported to it by service providers, each of which uses a different definition or determination of coverage, which means that
its data are not collected under a consistent methodology across geographic areas and service providers, and its coverage
estimates likely overstate the coverage actually experienced by consumers. In addition, the data do not expressly account for
factors such as signal strength, bit rate, or in-building coverage, and may convey a false sense of consistency across
geographic areas and service providers. Nineteenth Report, 31 FCC Rcd at 10559-60, para. 33; Sixteenth Report, 28 FCC
Rcd at 3743-44, para. 42.
244 Modernizing the FCC Form 477 Data Program, Further Notice of Proposed Rulemaking, 32 FCC Rcd 6329, 6331-32,
para. 8 (2017) (Modernizing the FCC Form 477 Data Program).
245 Modernizing the FCC Form 477 Data Program, 32 FCC Rcd at 6332-33, para. 10.
246 Connect America Fund, Universal Service Reform—Mobility Fund, Order on Reconsideration and Second Report and
Order, 32 FCC Rcd 6282, 6286, 6287, 6298, paras. 7, 10, 34 (2017) (the Commission reconsidered its decision to use the
Form 477 data given the various challenges with respect to the accuracy of the Form 477 deployment data, and determined
that there would be a new one-time data collection).
247 See generally Modernizing the FCC Form 477 Data Program, 32 FCC Rcd 6329.
248 In this Report, we use the term “centroid” to describe what the Census Bureau calls the “internal point,” which is at or
near the geographic center of the entity (i.e., the internal point latitude/longitude of a census block polygon). For some
irregularly-shaped entities (such as those shaped like a crescent), the calculated geographic center may be located outside the
boundaries of the entity. In such instances, the internal point is identified as a point inside the entity boundaries nearest to the
calculated geographic center and, if possible, within a land polygon. U.S. Census Bureau, Geography,
https://www.census.gov/geo/reference/gtc/gtc_area_attr.html (last visited Sept. 1, 2017). The latitude and longitude of the
centroid of each block are available in the census block map files. U.S. Census Bureau, 2010 TIGER/Line Shapefiles,
https://www.census.gov/cgi-bin/geo/shapefiles2010/main/ (last visited Sept. 1, 2017). In our analysis, we have taken the
centroids directly from the U.S. Census bureau website. For use of the centroid methodology, see, e.g., Connect America
Fund; A National Broadband Plan for Our Future; Establishing Just and Reasonable Rates for Local Exchange Carriers;
High-Cost Universal Service Support; Developing an Unified Intercarrier Compensation Regime; Federal-State Joint Board
on Universal Service; Lifeline and Link-Up; Universal Service Reform –Mobility Fund, Report and Order and Further Notice
of Proposed Rulemaking, 26 FCC Rcd 17663, 17786, n.576 (2011) (USF/ICC Transformation Order).
249 A census block is the smallest geographic unit for which the Census Bureau tabulates decennial census data. There are
11,166,336 blocks designated in the 2010 Census, and they range in population from zero to several hundred. U.S. Census
Bureau, 2010 Census Tallies of Census Tracts, Block Groups & Blocks, https://www.census.gov/geo/maps-
data/data/tallies/tractblock.html (last visited Sept. 1, 2017).
250 Nineteenth Report, 31 FCC Rcd at 10560-61, para. 34; Sixteenth Report, 28 FCC Rcd at 3743-44, para. 42.
Federal Communications Commission FCC-CIRC1709-08
49
consumers,251 especially in large or irregularly shaped census blocks,252 we find that it is nonetheless useful
because estimated coverage can be compared across network technologies and service providers.253
72. In addition to the centroid methodology, we also analyze the Form 477 data on a sub-census-
block level, by estimating the percentage of each census block covered by each technology. Unlike the centroid
methodology where a particular census block is either covered or not, the actual area coverage methodology
estimates the area of the census block covered by each service provider by technology.254 Because we currently
do not know the distribution of the population at the sub-census-block level, however, we must approximate the
population covered by each technology. To do this, we assume, for purposes of this Report, that the population of
a census block is uniformly distributed such that the fraction of the population covered in a block is proportional
to the fraction of the actual area covered. We then sum the estimated covered population across blocks to
estimate the total covered population within the United States. Likewise, we assume that the fraction of the road
miles covered in a block is proportional to the fraction of the actual area covered. At the aggregate national level,
the results should be similar whether the centroid methodology or the actual area coverage methodology is
utilized and therefore, at that aggregate level, the centroid approach is a reasonable one. The actual area coverage
methodology does yield more precise estimates, however, and differences in the coverage results are expected to
show more clearly at the disaggregated geographic level, particularly in rural areas.255
73. In this Section, we first present our overall mobile wireless coverage estimates based on any
technology of the percentage of the U.S. population, land area, and road miles covered by a certain number of
facilities-based service providers.256 We then present our estimates of overall mobile wireless coverage by
individual service provider. Secondly, we present our LTE coverage estimates for the percentage of the U.S.
population, land area, and road miles covered, where LTE is now the baseline industry standard for the marketing
of mobile broadband service. Again, we consider LTE coverage nationwide by a certain number of service
251 “[A]lthough most census blocks are small, some can be large, particularly in low-density rural areas, and … coverage at
the centroid might result, incorrectly, in the entirety of those large areas being deemed served.” Connect America Fund, et
al., Report and Order and Further Notice of Proposed Rulemaking, 26 FCC Rcd 17663, 17787, para. 344 (2011); see also
Nineteenth Report, 31 FCC Rcd at 10560, n.77; Sixteenth Report, 28 FCC Rcd at 3743-44, para. 42.
252 Nineteenth Report, 31 FCC Rcd at 10560-61, para. 34. The centroid methodology may also understate coverage for
certain blocks, such as those that have a small partial area coverage, and for which the centroid of the block does not fall
within the coverage boundary.
253 Service providers often offer coverage outside of their network coverage areas through roaming arrangements, which
allow their customers to automatically receive service from other service providers’ networks when they are in areas that are
covered by their roaming partners’ networks but not by their own network. In contrast to the purchase of capacity wholesale
to provide resale or MVNO services, a provider uses roaming services to market extended coverage to consumers residing
within the provider’s network coverage area, but not to acquire customers where a service provider does not have network
coverage.
254 This sub-census-block analysis can tell us the unique combination of service providers serving a particular percentage of
the area in a census block with a certain technology. As this analysis was done at each technology level, the set of unique
combinations that it produces are valid for each individual technology but not across multiple technologies. Essentially, we
can distinguish the unique percentages covered by various service providers at the sub-census-block level using a particular
technology (e.g., LTE), but we do not currently know how this interplays with other technologies (e.g., with 2G or 3G
technologies). Therefore, we can calculate the areas served and not served by all wireless technologies (LTE, non-LTE 4G,
3G, and 2G technologies) only at the national level.
255 In order to fully exploit the increase in precision offered by the actual area coverage methodology, spatially accurate
representations of population and road miles would be necessary. We do not have access to such information at this point in
time for the current Report, however.
256 Appendix III: Elements of Inter-Firm Rivalry, Tables III.D.i-xxi provide more detailed information. In addition, Web
Appendix III: Elements of Inter-Firm Rivalry, https://www.fcc.gov/20th-cmrs-report-web-appendices, presents our estimates
of overall mobile wireless coverage, 3G or better (EV-DO, EV-DO Rev A, WCDMA/HSPA, HSPA+, LTE, and mobile
WiMAX), and LTE coverage based on Mosaik data. Further, it presents our estimates of overall mobile wireless coverage
and LTE coverage by census block excluding Federal land based on both Form 477 and Mosaik data.

Federal Communications Commission FCC-CIRC1709-08
50
providers, before turning to LTE coverage by individual service providers. Finally, we present our estimates of
overall mobile wireless and LTE coverage in rural and non-rural areas, first by a certain number of service
providers, and then by individual service providers.
1. Overall Mobile Wireless Network Coverage (Any Technology)
a. Overall Coverage By A Certain Number of Service Providers
74. Chart III.D.1 presents overall mobile wireless coverage (any technology) based on centroid
analysis of December 2016 Form 477 data by a certain number of service providers. It shows that approximately
93 percent of the population is covered by at least four service providers, while approximately 34 percent of the
total land area of the United States, and approximately 59 percent of total U.S. road miles are covered by at least
four service providers.
Source: Based on centroid analysis of December 2016 Form 477 and 2010 Census data. Note that the number of service
providers in a census block represents network coverage only. Network coverage does not necessarily reflect the number
of service providers that actively offer service to individuals located in a given area.
75. In order to estimate the number of service providers serving a particular CMA, we include a
service provider if it has a greater than two percent market share (or alternatively, a five percent market share
which provides greater assurance of a meaningful choice for consumers) of mobile wireless connections in the
CMA based on NRUF data.257 Table III.D.1 presents the data for December 2013 and December 2016, and shows
that, using either market share threshold, the number of CMAs with three service providers has decreased since
2013 while the number of CMAs with four service providers has increased substantially.258
257 Nineteenth Report, 31 FCC Rcd at 10563, para. 38; Sixteenth Report 28 FCC Rcd at 3751, para. 50.
258 Because NRUF includes data on the number of telephone numbers that have been assigned to end-user devices by mobile
wireless service providers, this analysis does not include service providers whose data-only devices are not assigned a mobile
telephone number.
100.0%
99.7%
98.2%
93.3%
97.0%
92.2%
79.8%
58.6%
80.5%
71.9%
55.7%
34.3%
0% 10% 20% 30% 40% 50% 60% 70% 80% 90% 100%
1 or more
2 or more
3 or more
4 or more
Wireless CoverageNu
mb
er o
f S
ervic
e P
rovid
ers
wit
h C
over
ag
e
(Dec
emb
er 2
016)
Chart III.D.1
Estimated Wireless Coverage by Census Block Including Federal Land
Form 477, Centroid Method, December 2016
% of U.S. Population % of U.S. Road Miles % of U.S. Square Miles
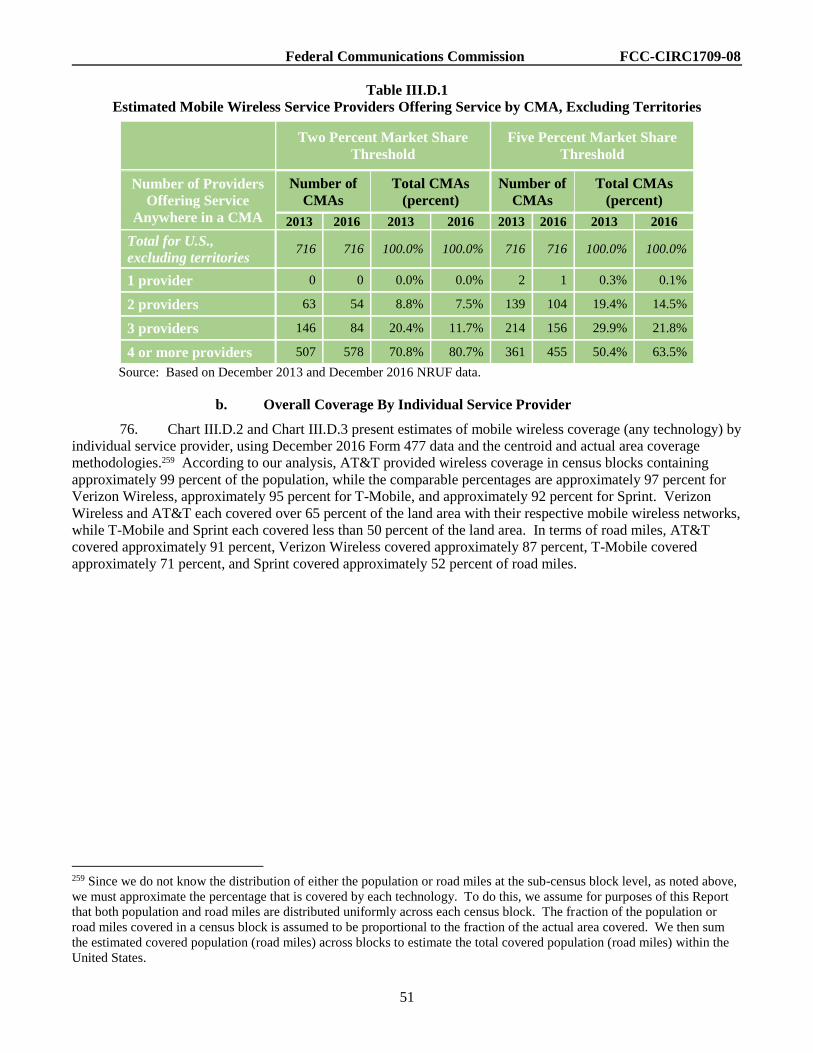
Federal Communications Commission FCC-CIRC1709-08
51
Table III.D.1
Estimated Mobile Wireless Service Providers Offering Service by CMA, Excluding Territories
Two Percent Market Share
Threshold
Five Percent Market Share
Threshold
Number of Providers
Offering Service
Anywhere in a CMA
Number of
CMAs
Total CMAs
(percent)
Number of
CMAs
Total CMAs
(percent)
2013 2016 2013 2016 2013 2016 2013 2016
Total for U.S.,
excluding territories 716 716 100.0% 100.0% 716 716 100.0% 100.0%
1 provider 0 0 0.0% 0.0% 2 1 0.3% 0.1%
2 providers 63 54 8.8% 7.5% 139 104 19.4% 14.5%
3 providers 146 84 20.4% 11.7% 214 156 29.9% 21.8%
4 or more providers 507 578 70.8% 80.7% 361 455 50.4% 63.5%
Source: Based on December 2013 and December 2016 NRUF data.
b. Overall Coverage By Individual Service Provider
76. Chart III.D.2 and Chart III.D.3 present estimates of mobile wireless coverage (any technology) by
individual service provider, using December 2016 Form 477 data and the centroid and actual area coverage
methodologies.259 According to our analysis, AT&T provided wireless coverage in census blocks containing
approximately 99 percent of the population, while the comparable percentages are approximately 97 percent for
Verizon Wireless, approximately 95 percent for T-Mobile, and approximately 92 percent for Sprint. Verizon
Wireless and AT&T each covered over 65 percent of the land area with their respective mobile wireless networks,
while T-Mobile and Sprint each covered less than 50 percent of the land area. In terms of road miles, AT&T
covered approximately 91 percent, Verizon Wireless covered approximately 87 percent, T-Mobile covered
approximately 71 percent, and Sprint covered approximately 52 percent of road miles.
259 Since we do not know the distribution of either the population or road miles at the sub-census block level, as noted above,
we must approximate the percentage that is covered by each technology. To do this, we assume for purposes of this Report
that both population and road miles are distributed uniformly across each census block. The fraction of the population or
road miles covered in a census block is assumed to be proportional to the fraction of the actual area covered. We then sum
the estimated covered population (road miles) across blocks to estimate the total covered population (road miles) within the
United States.
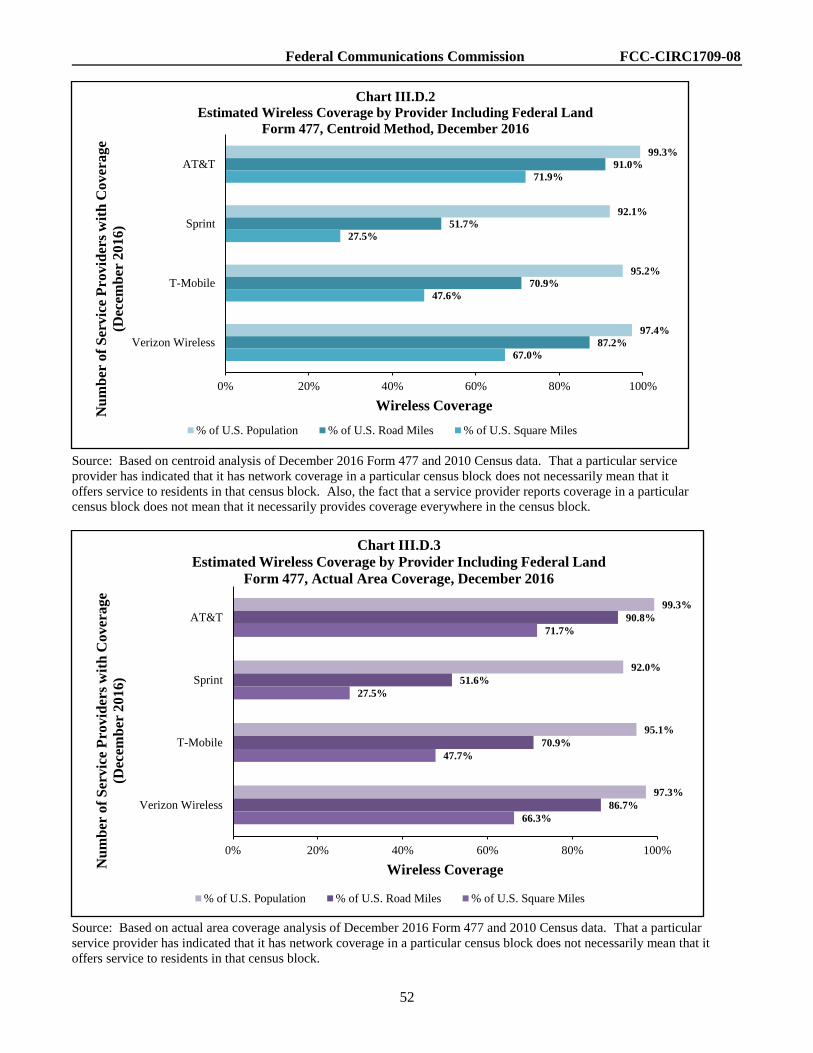
Federal Communications Commission FCC-CIRC1709-08
52
Source: Based on centroid analysis of December 2016 Form 477 and 2010 Census data. That a particular service
provider has indicated that it has network coverage in a particular census block does not necessarily mean that it
offers service to residents in that census block. Also, the fact that a service provider reports coverage in a particular
census block does not mean that it necessarily provides coverage everywhere in the census block.
Source: Based on actual area coverage analysis of December 2016 Form 477 and 2010 Census data. That a particular
service provider has indicated that it has network coverage in a particular census block does not necessarily mean that it
offers service to residents in that census block.
99.3%
92.1%
95.2%
97.4%
91.0%
51.7%
70.9%
87.2%
71.9%
27.5%
47.6%
67.0%
0% 20% 40% 60% 80% 100%
AT&T
Sprint
T-Mobile
Verizon Wireless
Wireless Coverage
Nu
mb
er o
f S
erv
ice
Pro
vid
ers
wit
h C
ov
era
ge
(Dec
emb
er 2
01
6)
Chart III.D.2
Estimated Wireless Coverage by Provider Including Federal Land
Form 477, Centroid Method, December 2016
% of U.S. Population % of U.S. Road Miles % of U.S. Square Miles
99.3%
92.0%
95.1%
97.3%
90.8%
51.6%
70.9%
86.7%
71.7%
27.5%
47.7%
66.3%
0% 20% 40% 60% 80% 100%
AT&T
Sprint
T-Mobile
Verizon Wireless
Wireless CoverageNu
mb
er o
f S
erv
ice
Pro
vid
ers
wit
h C
over
age
(Dec
emb
er 2
016)
Chart III.D.3
Estimated Wireless Coverage by Provider Including Federal Land
Form 477, Actual Area Coverage, December 2016
% of U.S. Population % of U.S. Road Miles % of U.S. Square Miles
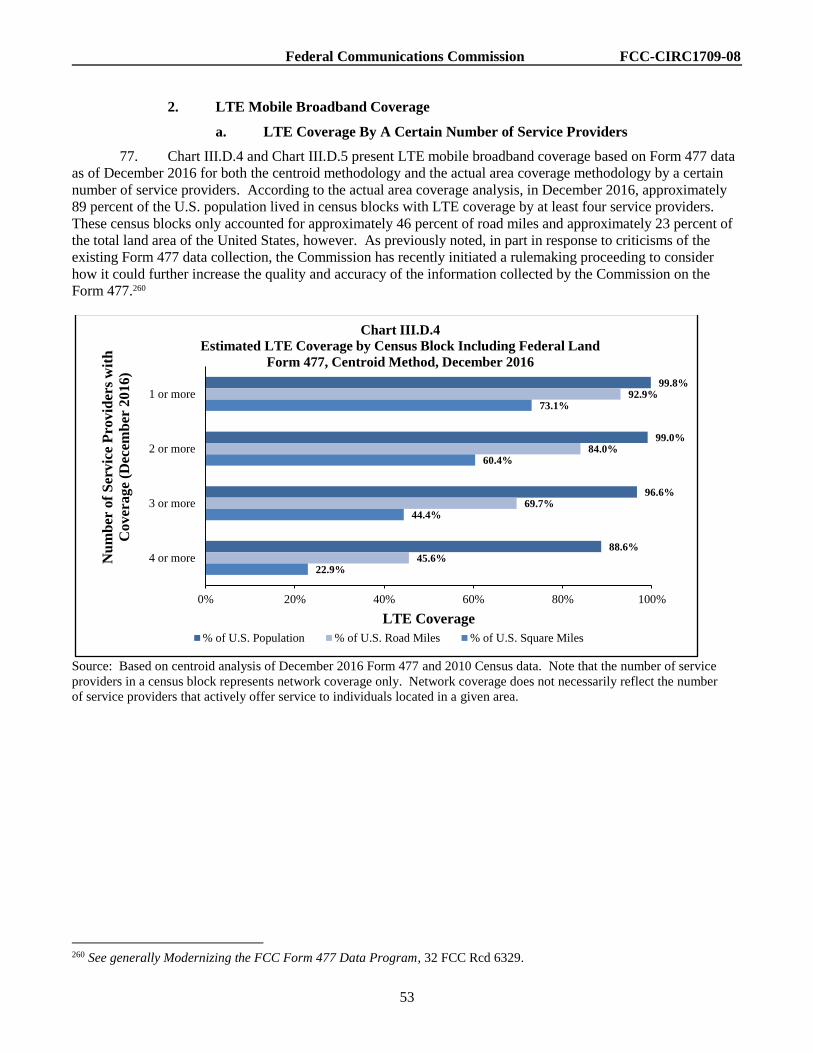
Federal Communications Commission FCC-CIRC1709-08
53
2. LTE Mobile Broadband Coverage
a. LTE Coverage By A Certain Number of Service Providers
77. Chart III.D.4 and Chart III.D.5 present LTE mobile broadband coverage based on Form 477 data
as of December 2016 for both the centroid methodology and the actual area coverage methodology by a certain
number of service providers. According to the actual area coverage analysis, in December 2016, approximately
89 percent of the U.S. population lived in census blocks with LTE coverage by at least four service providers.
These census blocks only accounted for approximately 46 percent of road miles and approximately 23 percent of
the total land area of the United States, however. As previously noted, in part in response to criticisms of the
existing Form 477 data collection, the Commission has recently initiated a rulemaking proceeding to consider
how it could further increase the quality and accuracy of the information collected by the Commission on the
Form 477.260
Source: Based on centroid analysis of December 2016 Form 477 and 2010 Census data. Note that the number of service
providers in a census block represents network coverage only. Network coverage does not necessarily reflect the number
of service providers that actively offer service to individuals located in a given area.
260 See generally Modernizing the FCC Form 477 Data Program, 32 FCC Rcd 6329.
99.8%
99.0%
96.6%
88.6%
92.9%
84.0%
69.7%
45.6%
73.1%
60.4%
44.4%
22.9%
0% 20% 40% 60% 80% 100%
1 or more
2 or more
3 or more
4 or more
LTE Coverage
Nu
mb
er o
f S
erv
ice
Pro
vid
ers
wit
h
Cover
age
(Dec
emb
er 2
016)
Chart III.D.4
Estimated LTE Coverage by Census Block Including Federal Land
Form 477, Centroid Method, December 2016
% of U.S. Population % of U.S. Road Miles % of U.S. Square Miles
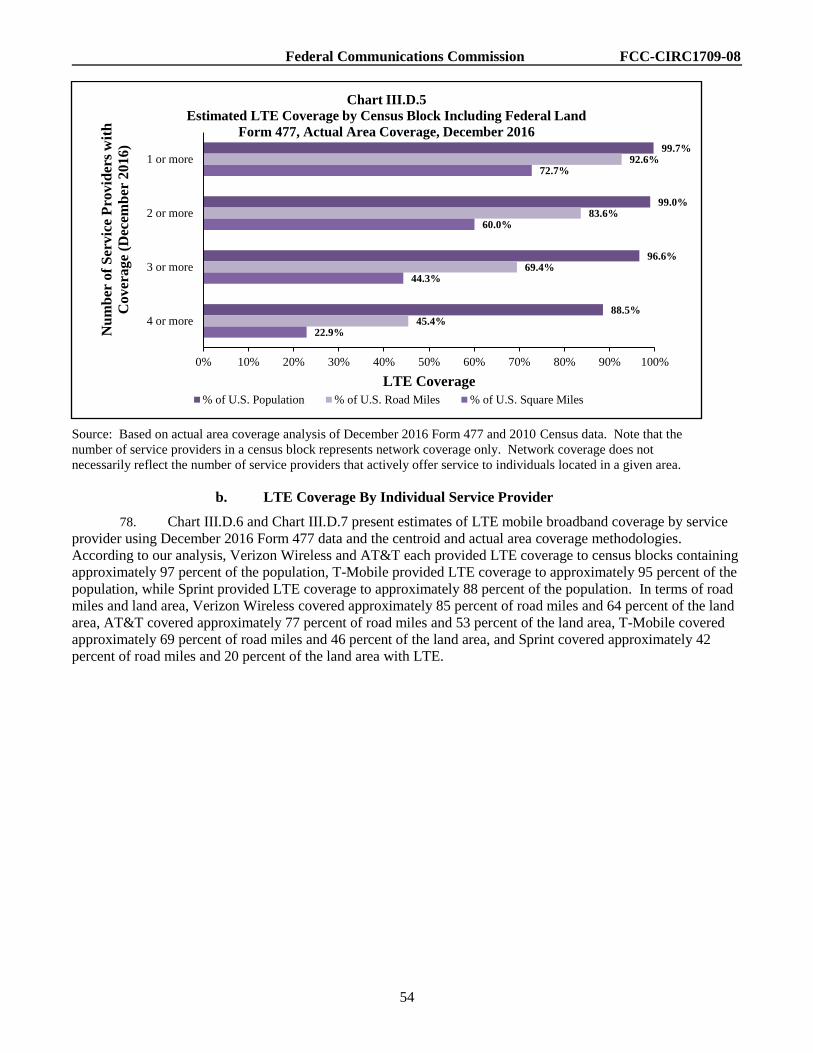
Federal Communications Commission FCC-CIRC1709-08
54
Source: Based on actual area coverage analysis of December 2016 Form 477 and 2010 Census data. Note that the
number of service providers in a census block represents network coverage only. Network coverage does not
necessarily reflect the number of service providers that actively offer service to individuals located in a given area.
b. LTE Coverage By Individual Service Provider
78. Chart III.D.6 and Chart III.D.7 present estimates of LTE mobile broadband coverage by service
provider using December 2016 Form 477 data and the centroid and actual area coverage methodologies.
According to our analysis, Verizon Wireless and AT&T each provided LTE coverage to census blocks containing
approximately 97 percent of the population, T-Mobile provided LTE coverage to approximately 95 percent of the
population, while Sprint provided LTE coverage to approximately 88 percent of the population. In terms of road
miles and land area, Verizon Wireless covered approximately 85 percent of road miles and 64 percent of the land
area, AT&T covered approximately 77 percent of road miles and 53 percent of the land area, T-Mobile covered
approximately 69 percent of road miles and 46 percent of the land area, and Sprint covered approximately 42
percent of road miles and 20 percent of the land area with LTE.
99.7%
99.0%
96.6%
88.5%
92.6%
83.6%
69.4%
45.4%
72.7%
60.0%
44.3%
22.9%
0% 10% 20% 30% 40% 50% 60% 70% 80% 90% 100%
1 or more
2 or more
3 or more
4 or more
LTE Coverage
Nu
mb
er o
f S
erv
ice
Pro
vid
ers
wit
h
Co
ver
ag
e (D
ecem
ber
20
16
)
Chart III.D.5
Estimated LTE Coverage by Census Block Including Federal Land
Form 477, Actual Area Coverage, December 2016
% of U.S. Population % of U.S. Road Miles % of U.S. Square Miles
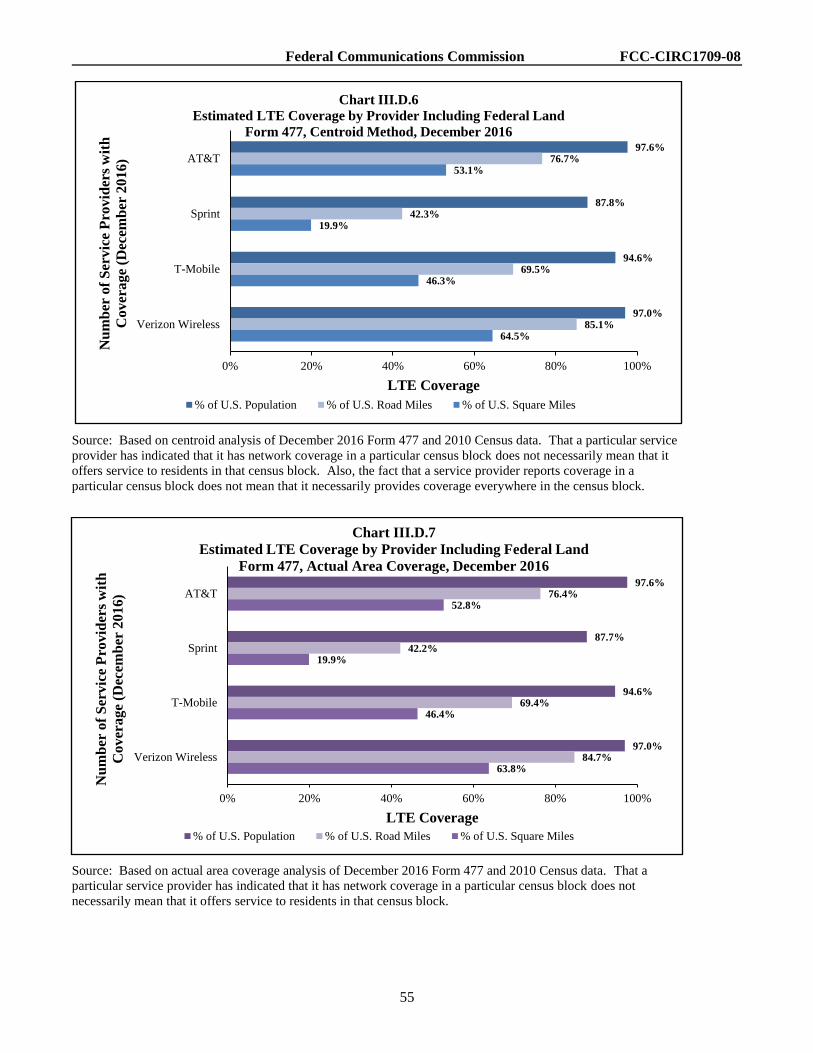
Federal Communications Commission FCC-CIRC1709-08
55
Source: Based on centroid analysis of December 2016 Form 477 and 2010 Census data. That a particular service
provider has indicated that it has network coverage in a particular census block does not necessarily mean that it
offers service to residents in that census block. Also, the fact that a service provider reports coverage in a
particular census block does not mean that it necessarily provides coverage everywhere in the census block.
Source: Based on actual area coverage analysis of December 2016 Form 477 and 2010 Census data. That a
particular service provider has indicated that it has network coverage in a particular census block does not
necessarily mean that it offers service to residents in that census block.
97.6%
87.8%
94.6%
97.0%
76.7%
42.3%
69.5%
85.1%
53.1%
19.9%
46.3%
64.5%
0% 20% 40% 60% 80% 100%
AT&T
Sprint
T-Mobile
Verizon Wireless
LTE Coverage
Nu
mb
er o
f S
erv
ice
Pro
vid
ers
wit
h
Co
ver
ag
e (D
ecem
ber
20
16
)
Chart III.D.6
Estimated LTE Coverage by Provider Including Federal Land
Form 477, Centroid Method, December 2016
% of U.S. Population % of U.S. Road Miles % of U.S. Square Miles
97.6%
87.7%
94.6%
97.0%
76.4%
42.2%
69.4%
84.7%
52.8%
19.9%
46.4%
63.8%
0% 20% 40% 60% 80% 100%
AT&T
Sprint
T-Mobile
Verizon Wireless
LTE Coverage
Nu
mb
er o
f S
ervic
e P
rovid
ers
wit
h
Co
ver
ag
e (D
ecem
ber
2016)
Chart III.D.7
Estimated LTE Coverage by Provider Including Federal Land
Form 477, Actual Area Coverage, December 2016
% of U.S. Population % of U.S. Road Miles % of U.S. Square Miles
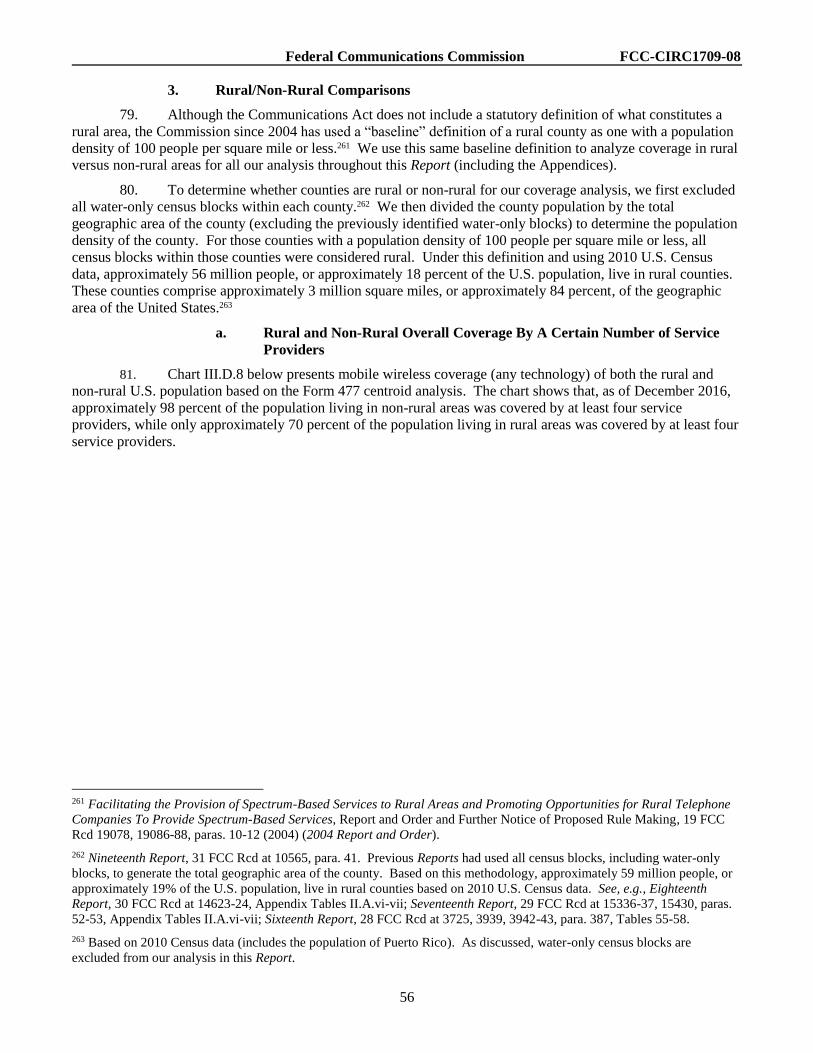
Federal Communications Commission FCC-CIRC1709-08
56
3. Rural/Non-Rural Comparisons
79. Although the Communications Act does not include a statutory definition of what constitutes a
rural area, the Commission since 2004 has used a “baseline” definition of a rural county as one with a population
density of 100 people per square mile or less.261 We use this same baseline definition to analyze coverage in rural
versus non-rural areas for all our analysis throughout this Report (including the Appendices).
80. To determine whether counties are rural or non-rural for our coverage analysis, we first excluded
all water-only census blocks within each county.262 We then divided the county population by the total
geographic area of the county (excluding the previously identified water-only blocks) to determine the population
density of the county. For those counties with a population density of 100 people per square mile or less, all
census blocks within those counties were considered rural. Under this definition and using 2010 U.S. Census
data, approximately 56 million people, or approximately 18 percent of the U.S. population, live in rural counties.
These counties comprise approximately 3 million square miles, or approximately 84 percent, of the geographic
area of the United States.263
a. Rural and Non-Rural Overall Coverage By A Certain Number of Service
Providers
81. Chart III.D.8 below presents mobile wireless coverage (any technology) of both the rural and
non-rural U.S. population based on the Form 477 centroid analysis. The chart shows that, as of December 2016,
approximately 98 percent of the population living in non-rural areas was covered by at least four service
providers, while only approximately 70 percent of the population living in rural areas was covered by at least four
service providers.
261 Facilitating the Provision of Spectrum-Based Services to Rural Areas and Promoting Opportunities for Rural Telephone
Companies To Provide Spectrum-Based Services, Report and Order and Further Notice of Proposed Rule Making, 19 FCC
Rcd 19078, 19086-88, paras. 10-12 (2004) (2004 Report and Order).
262 Nineteenth Report, 31 FCC Rcd at 10565, para. 41. Previous Reports had used all census blocks, including water-only
blocks, to generate the total geographic area of the county. Based on this methodology, approximately 59 million people, or
approximately 19% of the U.S. population, live in rural counties based on 2010 U.S. Census data. See, e.g., Eighteenth
Report, 30 FCC Rcd at 14623-24, Appendix Tables II.A.vi-vii; Seventeenth Report, 29 FCC Rcd at 15336-37, 15430, paras.
52-53, Appendix Tables II.A.vi-vii; Sixteenth Report, 28 FCC Rcd at 3725, 3939, 3942-43, para. 387, Tables 55-58.
263 Based on 2010 Census data (includes the population of Puerto Rico). As discussed, water-only census blocks are
excluded from our analysis in this Report.

Federal Communications Commission FCC-CIRC1709-08
57
Source: Based on centroid analysis of December 2016 Form 477 and 2010 Census data. Note that the number of
service providers in a census block represents network coverage only. Network coverage does not necessarily reflect
the number of service providers that actively offer service to individuals located in a given area.
b. Rural and Non-Rural Overall Network Coverage By Individual Service
Provider
82. Chart III.D.9 and Chart III.D.10 present mobile wireless coverage (any technology) of the rural
and non-rural U.S. population, based on centroid and actual area coverage analysis of December 2016 Form 477
data.264 Our analysis indicates that all four nationwide service providers covered at least 98 percent of the non-
rural population with mobile wireless service. Rural wireless coverage by service provider is more limited:
AT&T covered approximately 97 percent, Verizon Wireless covered approximately 93 percent, T-Mobile covered
approximately 79 percent, and Sprint covered approximately 64 percent of the rural population with wireless
service.
264 As noted above, the Commission’s “baseline” definition of rural is a county with a population density of 100 people or
less per square mile. 2004 Report and Order, 19 FCC Rcd 19078, 19087-88, paras. 11-12.
100.0%
100.0%
99.7%
98.2%
99.8%
98.6%
91.0%
70.5%
0% 20% 40% 60% 80% 100%
1 or more
2 or more
3 or more
4 or more
Wireless CoverageNu
mb
er o
f S
erv
ice
Pro
vid
ers
wit
h C
ov
era
ge
(Dec
emb
er 2
01
6)
Chart III.D.8
Estimated Wireless Coverage by Census Block Including Federal Land in
Rural vs. Non-Rural Areas
Form 477, Centroid Method, December 2016
% of U.S. Non-Rural POPs % of U.S. Rural POPs
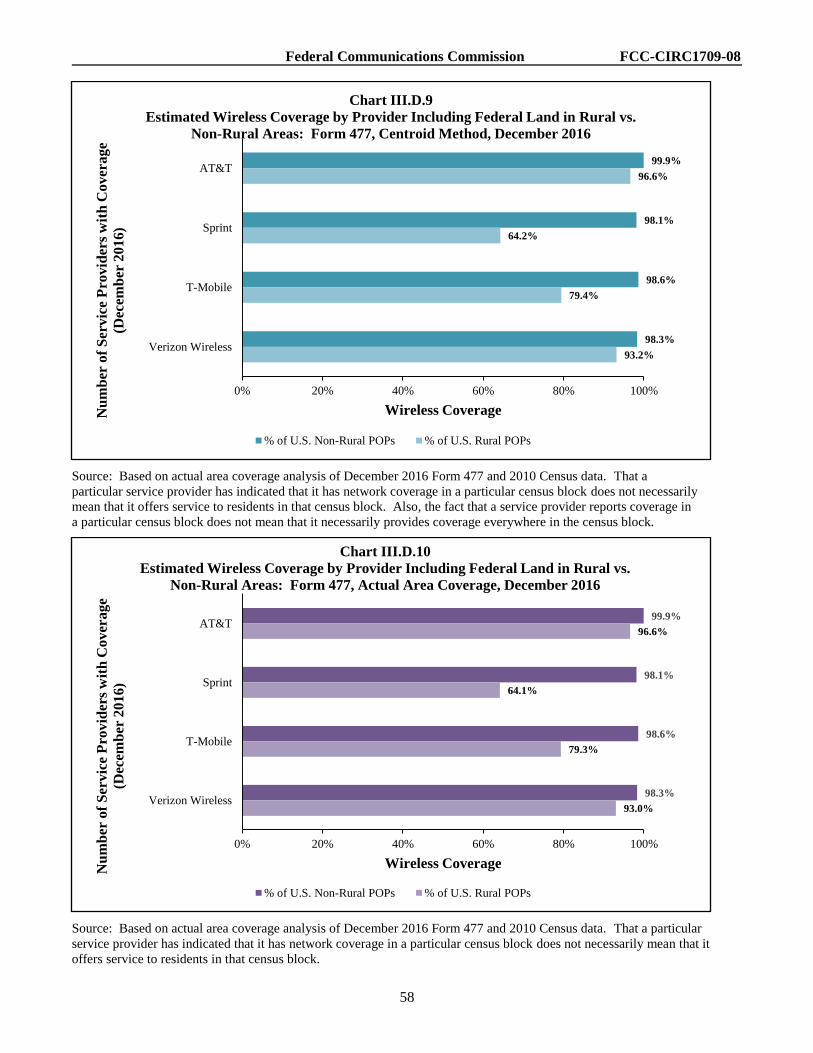
Federal Communications Commission FCC-CIRC1709-08
58
Source: Based on actual area coverage analysis of December 2016 Form 477 and 2010 Census data. That a
particular service provider has indicated that it has network coverage in a particular census block does not necessarily
mean that it offers service to residents in that census block. Also, the fact that a service provider reports coverage in
a particular census block does not mean that it necessarily provides coverage everywhere in the census block.
Source: Based on actual area coverage analysis of December 2016 Form 477 and 2010 Census data. That a particular
service provider has indicated that it has network coverage in a particular census block does not necessarily mean that it
offers service to residents in that census block.
99.9%
98.1%
98.6%
98.3%
96.6%
64.2%
79.4%
93.2%
0% 20% 40% 60% 80% 100%
AT&T
Sprint
T-Mobile
Verizon Wireless
Wireless CoverageNu
mb
er o
f S
erv
ice
Pro
vid
ers
wit
h C
ov
era
ge
(Dec
emb
er 2
01
6)
Chart III.D.9
Estimated Wireless Coverage by Provider Including Federal Land in Rural vs.
Non-Rural Areas: Form 477, Centroid Method, December 2016
% of U.S. Non-Rural POPs % of U.S. Rural POPs
99.9%
98.1%
98.6%
98.3%
96.6%
64.1%
79.3%
93.0%
0% 20% 40% 60% 80% 100%
AT&T
Sprint
T-Mobile
Verizon Wireless
Wireless CoverageNu
mb
er o
f S
erv
ice
Pro
vid
ers
wit
h C
over
age
(Dec
emb
er 2
016)
Chart III.D.10
Estimated Wireless Coverage by Provider Including Federal Land in Rural vs.
Non-Rural Areas: Form 477, Actual Area Coverage, December 2016
% of U.S. Non-Rural POPs % of U.S. Rural POPs

Federal Communications Commission FCC-CIRC1709-08
59
c. Rural and Non-Rural LTE Coverage By A Certain Number of Service
Providers
83. Chart III.D.11 and Chart III.D.12 present LTE population coverage in rural and non-rural census
blocks by a certain number of service providers, based on the Form 477 centroid and actual area methodologies
respectively. Similar to overall mobile wireless coverage, the LTE coverage gap between the population living in
rural versus non-rural census blocks also increases as the threshold for number of service providers covering the
area increases. Our estimates show that approximately 99 percent of the non-rural population was covered by at
least three LTE service providers, while approximately 84 percent of the rural population had the same network
coverage. Approximately 95 percent of the non-rural American population had LTE coverage from four or more
service providers, while only approximately 57 percent of the rural population was covered by at least four LTE
service providers.
Source: Based on centroid analysis of December 2016 Form 477 and 2010 Census data. Note that the number of service
providers in a census block represents network coverage only. Network coverage does not necessarily reflect the number
of service providers that actively offer service to individuals located in a given area.
100.0%
99.9%
99.4%
95.5%
98.8%
95.3%
84.2%
57.0%
0% 20% 40% 60% 80% 100%
1 or more
2 or more
3 or more
4 or more
LTE Coverage
Nu
mb
er o
f S
ervic
e P
rovid
ers
wit
h
Cover
age
(Dec
emb
er 2
016)
Chart III.D.11
Estimated LTE Coverage by Census Block Including Federal Land in Rural vs. Non-
Rural Areas: Form 477, Centroid Method, December 2016
% of U.S. Non-Rural POPs % of U.S. Rural POPs
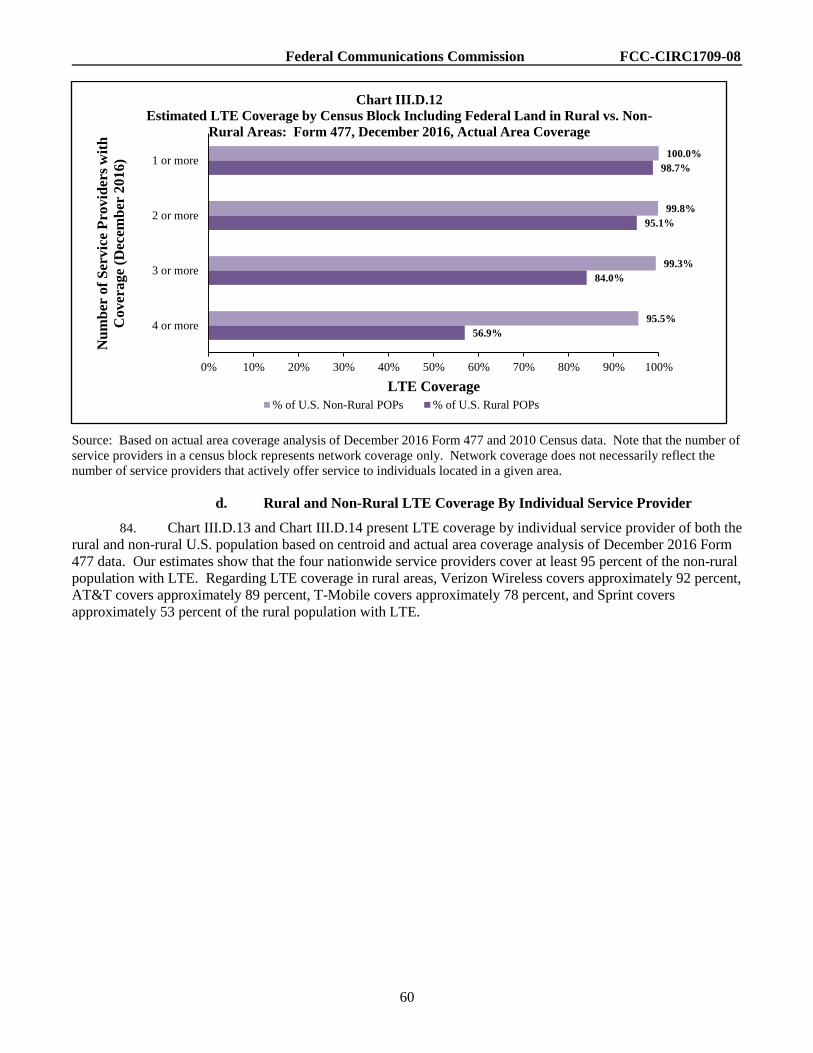
Federal Communications Commission FCC-CIRC1709-08
60
Source: Based on actual area coverage analysis of December 2016 Form 477 and 2010 Census data. Note that the number of
service providers in a census block represents network coverage only. Network coverage does not necessarily reflect the
number of service providers that actively offer service to individuals located in a given area.
d. Rural and Non-Rural LTE Coverage By Individual Service Provider
84. Chart III.D.13 and Chart III.D.14 present LTE coverage by individual service provider of both the
rural and non-rural U.S. population based on centroid and actual area coverage analysis of December 2016 Form
477 data. Our estimates show that the four nationwide service providers cover at least 95 percent of the non-rural
population with LTE. Regarding LTE coverage in rural areas, Verizon Wireless covers approximately 92 percent,
AT&T covers approximately 89 percent, T-Mobile covers approximately 78 percent, and Sprint covers
approximately 53 percent of the rural population with LTE.
100.0%
99.8%
99.3%
95.5%
98.7%
95.1%
84.0%
56.9%
0% 10% 20% 30% 40% 50% 60% 70% 80% 90% 100%
1 or more
2 or more
3 or more
4 or more
LTE Coverage
Nu
mb
er o
f S
erv
ice
Pro
vid
ers
wit
h
Co
ver
ag
e (D
ecem
ber
20
16
)
Chart III.D.12
Estimated LTE Coverage by Census Block Including Federal Land in Rural vs. Non-
Rural Areas: Form 477, December 2016, Actual Area Coverage
% of U.S. Non-Rural POPs % of U.S. Rural POPs
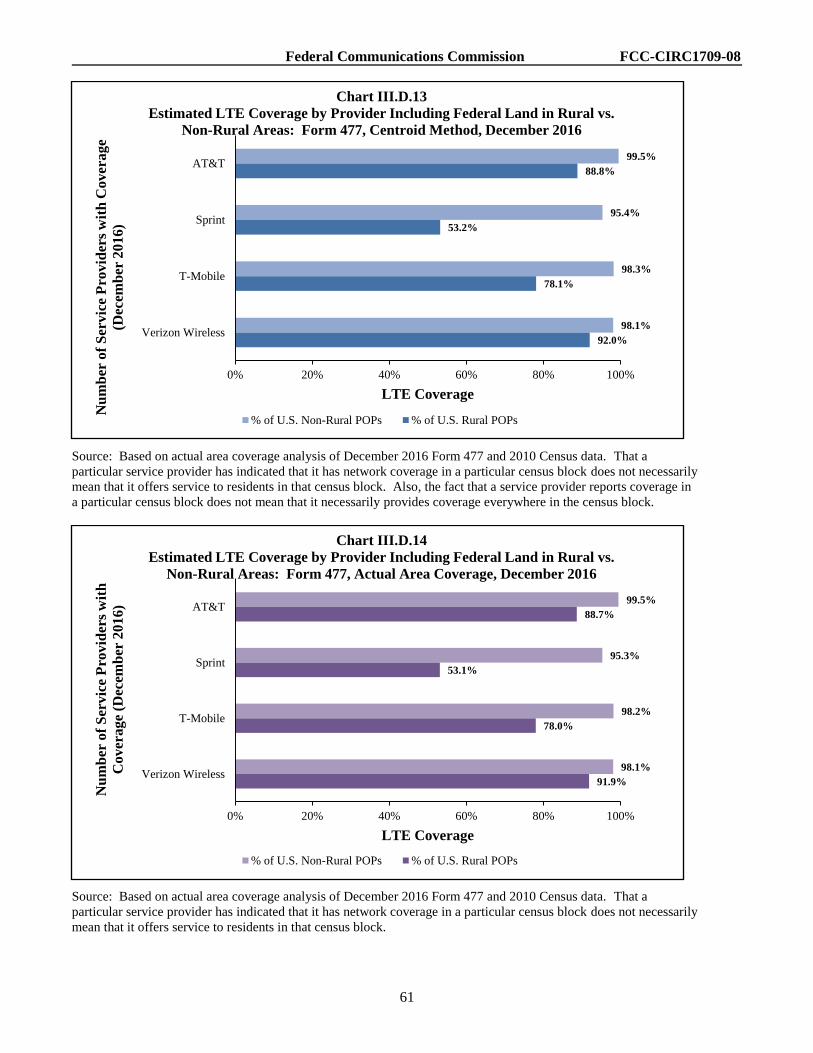
Federal Communications Commission FCC-CIRC1709-08
61
Source: Based on actual area coverage analysis of December 2016 Form 477 and 2010 Census data. That a
particular service provider has indicated that it has network coverage in a particular census block does not necessarily
mean that it offers service to residents in that census block. Also, the fact that a service provider reports coverage in
a particular census block does not mean that it necessarily provides coverage everywhere in the census block.
Source: Based on actual area coverage analysis of December 2016 Form 477 and 2010 Census data. That a
particular service provider has indicated that it has network coverage in a particular census block does not necessarily
mean that it offers service to residents in that census block.
99.5%
95.4%
98.3%
98.1%
88.8%
53.2%
78.1%
92.0%
0% 20% 40% 60% 80% 100%
AT&T
Sprint
T-Mobile
Verizon Wireless
LTE Coverage
Nu
mb
er o
f S
erv
ice
Pro
vid
ers
wit
h C
ov
era
ge
(Dec
emb
er 2
01
6)
Chart III.D.13
Estimated LTE Coverage by Provider Including Federal Land in Rural vs.
Non-Rural Areas: Form 477, Centroid Method, December 2016
% of U.S. Non-Rural POPs % of U.S. Rural POPs
99.5%
95.3%
98.2%
98.1%
88.7%
53.1%
78.0%
91.9%
0% 20% 40% 60% 80% 100%
AT&T
Sprint
T-Mobile
Verizon Wireless
LTE Coverage
Nu
mb
er o
f S
ervic
e P
rovid
ers
wit
h
Co
ver
ag
e (D
ecem
ber
2016)
Chart III.D.14
Estimated LTE Coverage by Provider Including Federal Land in Rural vs.
Non-Rural Areas: Form 477, Actual Area Coverage, December 2016
% of U.S. Non-Rural POPs % of U.S. Rural POPs

Federal Communications Commission FCC-CIRC1709-08
62
4. Coverage and Technology Upgrades by Service Provider
85. LTE is a type of wireless technology–defined by a set of 3GPP standards–that is characterized by
fast upload and download data transfer speeds and low latency, with high spectral efficiency as well as flexible
spectrum utilization.265 Service providers have deployed LTE using their differing spectrum portfolios.266 LTE
has evolved beyond standard LTE (Release 8/9) to LTE-Advanced (LTE-A, Release 10/+).267 LTE-A uses carrier
aggregation with up to four bands and enhanced multiple input, multiple output (MIMO) technology to increase
the maximum speed and capacity compared to standard LTE.268 Currently, all four nationwide service providers,
Verizon Wireless,269 Sprint,270 T-Mobile,271 and AT&T272 offer LTE-A in a significant number of markets. While
LTE and LTE-A initially were used for data service, providers also are offering Voice over LTE (VoLTE) service
which allows high-quality voice calls to be made over their LTE networks, and consumers can access voice and
data services simultaneously.273 Verizon Wireless, T-Mobile, and AT&T currently offer VoLTE service within
their LTE footprints, while U.S. Cellular has made it available in limited areas.274 Sprint has not announced a
launch date for VoLTE.275
86. In the future, 5G cellular networking technology is expected to deliver significantly faster
download and upload speeds, lower latency, with more carrier aggregations across different types of spectrum,
265 PCWorld, FAQ: How is LTE-Advanced different from Regular LTE? (Jan. 21, 2004),
http://www.pcworld.com/article/2083981/faq-how-is-lte-advanced-different-from-regular-lte.html; 3GPP: LTE,
http://www.3gpp.org/technologies/keywords-acronyms/98-lte (last visited Sept. 1, 2017).
266 Verizon Wireless, XLTE: America’s Best Network Gets Even Better (Oct. 20, 2014),
http://www.verizon.com/about/news/vzw/2014/05/verizon-wireless-xlte. In 2014, Verizon Wireless launched XLTE on their
AWS spectrum, with the goal of faster peak data speeds, increased bandwidth, and more available LTE capacity on their 700
MHz spectrum; Sprint Newsroom, Introducing the Sprint LTE Plus Network - Faster, Stronger, More Reliable Than Ever
Before (Nov. 17, 2015), http://newsroom.sprint.com/introducing-the-sprint-lte-plus-network--faster-stronger-more-reliable-
than-ever-before.htm. In 2015, Sprint launched LTE Plus (previously Sprint Spark), which employed techniques such as
3/4/5-channel carrier aggregation, higher order MIMO to increase LTE speeds, capacity, and reliability; T-Mobile News, T-
Mobile Extended Range LTE coming to Chicago in the first half of 2017 (Dec. 1, 2016),
http://www.tmonews.com/2016/12/t-mobile-extended-range-lte-chicago-first-half-2017/; T-Mobile, The Fastest, Most
Advanced LTE Network, https://www.t-mobile.com/coverage/4g-lte-network (last visited Sept. 1, 2017). T-Mobile offers
Extended Range LTE on their 700 MHz band, promising a larger coverage range and better building penetration.
267 3GPP: LTE-Advanced, http://www.3gpp.org/technologies/keywords-acronyms/97-lte-advanced (last visited Sept. 1,
2017).
268 FierceWireless, What’s So Great About LTE Advanced? (Lots, Actually), http://www.fiercewireless.com/special-
report/what-s-so-great-about-lte-advanced-lots-actually (last visited Sept. 1, 2017); FierceWireless, XLTE, 5G Evolution,
Extended Range LTE and LTE Plus: Explaining carriers' network marketing terms (June 20, 2017),
http://www.fiercewireless.com/wireless/xlte-5g-evolution-extended-range-lte-and-lte-plus-explaining-carrier-s-network-
marketing; 3GPP, 3GPP Release 14 allows up to four bands carrier aggregation, http://www.3gpp.org/release-14 (last visited
Sept. 1, 2017).
269 Verizon Wireless, Verizon LTE Advanced FAQs, https://www.verizonwireless.com/support/verizon-lte-advanced-faqs/
(last visited Sept. 1, 2017).
270 Wireless Week, Sprint Enables 3-Carrier Aggregation on More Devices (Jan. 31, 2017),
https://www.wirelessweek.com/news/2017/01/sprint-enables-3-carrier-aggregation-more-devices?linkId=34065767.
271 T-Mobile, LTE Advanced is So 2014. We’re Already On to the Next Big Thing. Verizon is Now 50% Faster … and Still
Slower Than T-Mobile! (Sept. 6, 2016), https://newsroom.t-mobile.com/news-and-blogs/lte-advanced.htm.
272 AT&T, LTE Advanced Outperforms 4G LTE, https://www.att.com/offers/network.html (last visited Sept. 1, 2017).
273 AndroidCentral, What are VoLTE and HD Voice, and Why Should You Use Them? (Sep. 25, 2016),
https://www.androidcentral.com/volte.
274 AndroidCentral, What are VoLTE and HD Voice, and Why Should You Use Them? (Sep. 25, 2016); Verizon Wireless,
HD Voice and Video Calling, https://www.verizonwireless.com/solutions-and-services/hd-voice/ (last visited Sept. 1, 2017);
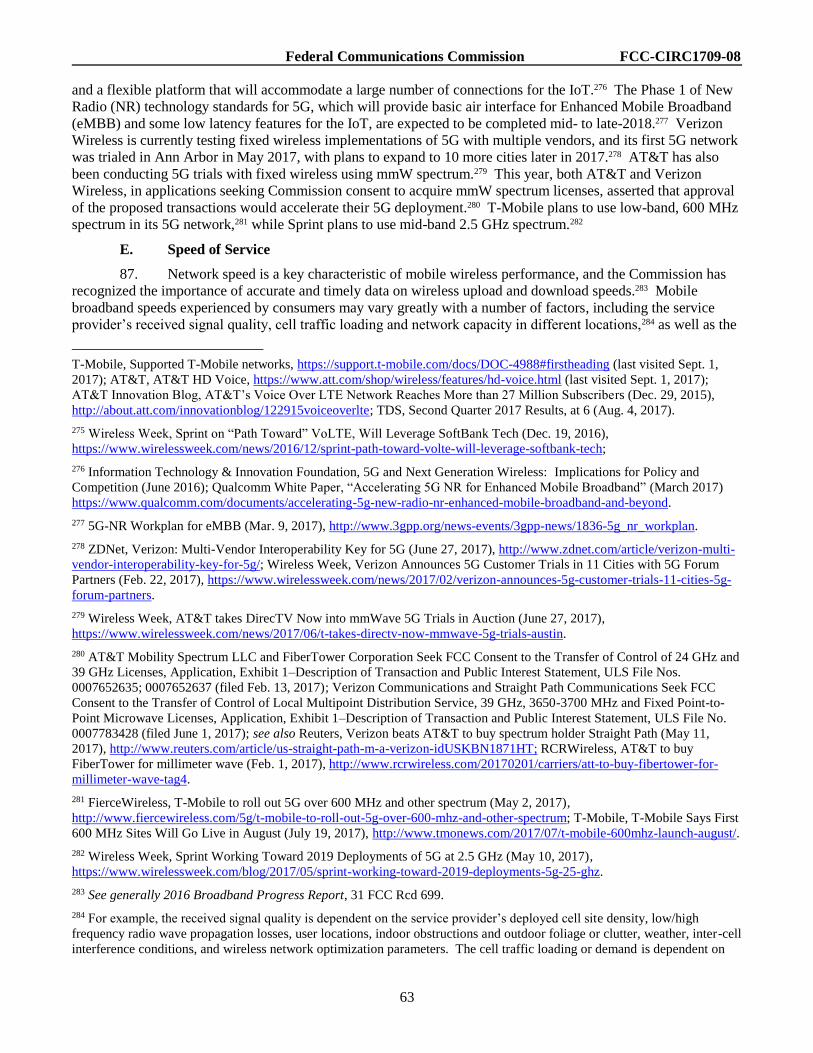
Federal Communications Commission FCC-CIRC1709-08
63
and a flexible platform that will accommodate a large number of connections for the IoT.276 The Phase 1 of New
Radio (NR) technology standards for 5G, which will provide basic air interface for Enhanced Mobile Broadband
(eMBB) and some low latency features for the IoT, are expected to be completed mid- to late-2018.277 Verizon
Wireless is currently testing fixed wireless implementations of 5G with multiple vendors, and its first 5G network
was trialed in Ann Arbor in May 2017, with plans to expand to 10 more cities later in 2017.278 AT&T has also
been conducting 5G trials with fixed wireless using mmW spectrum.279 This year, both AT&T and Verizon
Wireless, in applications seeking Commission consent to acquire mmW spectrum licenses, asserted that approval
of the proposed transactions would accelerate their 5G deployment.280 T-Mobile plans to use low-band, 600 MHz
spectrum in its 5G network,281 while Sprint plans to use mid-band 2.5 GHz spectrum.282
E. Speed of Service
87. Network speed is a key characteristic of mobile wireless performance, and the Commission has
recognized the importance of accurate and timely data on wireless upload and download speeds.283 Mobile
broadband speeds experienced by consumers may vary greatly with a number of factors, including the service
provider’s received signal quality, cell traffic loading and network capacity in different locations,284 as well as the
T-Mobile, Supported T-Mobile networks, https://support.t-mobile.com/docs/DOC-4988#firstheading (last visited Sept. 1,
2017); AT&T, AT&T HD Voice, https://www.att.com/shop/wireless/features/hd-voice.html (last visited Sept. 1, 2017);
AT&T Innovation Blog, AT&T’s Voice Over LTE Network Reaches More than 27 Million Subscribers (Dec. 29, 2015),
http://about.att.com/innovationblog/122915voiceoverlte; TDS, Second Quarter 2017 Results, at 6 (Aug. 4, 2017).
275 Wireless Week, Sprint on “Path Toward” VoLTE, Will Leverage SoftBank Tech (Dec. 19, 2016),
https://www.wirelessweek.com/news/2016/12/sprint-path-toward-volte-will-leverage-softbank-tech;
276 Information Technology & Innovation Foundation, 5G and Next Generation Wireless: Implications for Policy and
Competition (June 2016); Qualcomm White Paper, “Accelerating 5G NR for Enhanced Mobile Broadband” (March 2017)
https://www.qualcomm.com/documents/accelerating-5g-new-radio-nr-enhanced-mobile-broadband-and-beyond.
277 5G-NR Workplan for eMBB (Mar. 9, 2017), http://www.3gpp.org/news-events/3gpp-news/1836-5g_nr_workplan.
278 ZDNet, Verizon: Multi-Vendor Interoperability Key for 5G (June 27, 2017), http://www.zdnet.com/article/verizon-multi-
vendor-interoperability-key-for-5g/; Wireless Week, Verizon Announces 5G Customer Trials in 11 Cities with 5G Forum
Partners (Feb. 22, 2017), https://www.wirelessweek.com/news/2017/02/verizon-announces-5g-customer-trials-11-cities-5g-
forum-partners.
279 Wireless Week, AT&T takes DirecTV Now into mmWave 5G Trials in Auction (June 27, 2017),
https://www.wirelessweek.com/news/2017/06/t-takes-directv-now-mmwave-5g-trials-austin.
280 AT&T Mobility Spectrum LLC and FiberTower Corporation Seek FCC Consent to the Transfer of Control of 24 GHz and
39 GHz Licenses, Application, Exhibit 1–Description of Transaction and Public Interest Statement, ULS File Nos.
0007652635; 0007652637 (filed Feb. 13, 2017); Verizon Communications and Straight Path Communications Seek FCC
Consent to the Transfer of Control of Local Multipoint Distribution Service, 39 GHz, 3650-3700 MHz and Fixed Point-to-
Point Microwave Licenses, Application, Exhibit 1–Description of Transaction and Public Interest Statement, ULS File No.
0007783428 (filed June 1, 2017); see also Reuters, Verizon beats AT&T to buy spectrum holder Straight Path (May 11,
2017), http://www.reuters.com/article/us-straight-path-m-a-verizon-idUSKBN1871HT; RCRWireless, AT&T to buy
FiberTower for millimeter wave (Feb. 1, 2017), http://www.rcrwireless.com/20170201/carriers/att-to-buy-fibertower-for-
millimeter-wave-tag4.
281 FierceWireless, T-Mobile to roll out 5G over 600 MHz and other spectrum (May 2, 2017),
http://www.fiercewireless.com/5g/t-mobile-to-roll-out-5g-over-600-mhz-and-other-spectrum; T-Mobile, T-Mobile Says First
600 MHz Sites Will Go Live in August (July 19, 2017), http://www.tmonews.com/2017/07/t-mobile-600mhz-launch-august/.
282 Wireless Week, Sprint Working Toward 2019 Deployments of 5G at 2.5 GHz (May 10, 2017),
https://www.wirelessweek.com/blog/2017/05/sprint-working-toward-2019-deployments-5g-25-ghz.
283 See generally 2016 Broadband Progress Report, 31 FCC Rcd 699.
284 For example, the received signal quality is dependent on the service provider’s deployed cell site density, low/high
frequency radio wave propagation losses, user locations, indoor obstructions and outdoor foliage or clutter, weather, inter-cell
interference conditions, and wireless network optimization parameters. The cell traffic loading or demand is dependent on
Federal Communications Commission FCC-CIRC1709-08
64
capability of consumers’ devices.285 First, upload and download speeds will vary based on the location of the
consumer’s receiving device relative to the transmitting device, which is often a cellular tower.286 Second, the
performance of the broadband connection degrades over distance to the tower, even with a clear line of sight.287
Third, cellular signals are shared by many users–the greater the number of simultaneous users, the lower the
potential performance of any one connection.288
88. Because the above factors cause variations in mobile network performance, various
methodologies are used to measure mobile network speeds. The two most prevalent rely on crowdsourced data or
structured sample data. Crowdsourced data are user-generated data produced by consumers who voluntarily
download speed test applications on their mobile devices.289 Generally, crowdsourced data can bring the benefits
of generating a large volume of data at a very low cost and of measuring actual consumer experience on a network
in a wide variety of locations, indoor and outdoor. Crowdsourced data are not collected pursuant to statistical
sampling techniques, and may require adjustments to construct a representative sample from the raw data. In
particular, crowdsourced mobile data come from a self-selected group of users, and there often is little control
regarding such parameters as when people implement the test, whether the test is performed indoors or outdoors,
the geographic location of the tester, and the age or type of the consumer’s device.290 Some of these issues can be
mitigated by creating default settings that run the test at random times, and not only when the consumer initiates
the test. Structured sample data, by contrast, are generated from tests that control for the location and time of the
tests as well as for the devices used in the test. Structured sample data may be collected using stationary indoor or
outdoor tests, or drive tests. However, these tests are more expensive to conduct, involve significant judgment
about when and where the tests are run, often involve insufficient testing at indoor locations or in many rural
areas, and typically produce datasets that are not as rich as crowdsourced data–all of which are likely to have
some effects on reported results.
89. Subject to the limitations described above, this Report presents, speed data using the Ookla Net
Index data (crowdsourced), RootMetrics data (largely based on drive test data across the United States, but which
the overall number of concurrent active mobile broadband users sharing the same cell, which in turn depends on user
locations, the day of the week, and the time of the day. The capacity of a service provider’s wireless network is dependent on
the deployed mobile wireless technology, sites and equipment, available bandwidth, and the capacity of backhaul
connections. Nineteenth Report, 31 FCC Rcd at 10608, para. 104; Sixteenth Report, 28 FCC Rcd at 3895, para. 293.
285 Differences in consumer devices (e.g., smartphones, tablets, USB dongles, and laptops) also can result in users
experiencing different data speeds on the same mobile wireless broadband network. Moreover, differing capabilities within
each device category, such as smartphone processing power and memory, can result in different user experiences on the same
mobile wireless broadband network. Based on current and past promotions and partnerships, each wireless service provider
may have a customer base with a different smartphone age-profile, which can directly affect speed measurements. In
addition, for data services, network quality as perceived by the customer may also depend on how, where and/or when the
consumer uses their device (e.g., a consumer who solely uses e-mail may view the quality of the network differently than one
who streams video regularly).
286 If the receiving device (and the person using it) is behind a wall, blocked by terrain or otherwise has an impaired
connection with the tower, service will be degraded or not available.
287 Performance at the edge of a tower’s coverage is not equal to performance close to the tower.
288 The FCC Omnibus Broadband Initiative (OBI); Broadband Performance: OBI Technical Paper No. 4, at 19,
https://apps.fcc.gov/edocs_public/attachmatch/DOC-300902A1.pdf. Note that “dead zones” and loss of signal reduce
wireless effectiveness. Analysts estimate that an available and reliable connection may only be accessed 80% to 95% of the
time. Id. at 19-20.
289 These apps commonly collect data on the service provider, location of device, download and upload speeds, latency, and
packet loss, which are then transmitted to the company or entity that developed the app. In some cases, the apps
automatically schedule these tests to run at certain times during the day, while in others, the user has to choose to run the
tests.
290 Crowdsourced speed test results may also rely on the phone’s connection to the server, factors such as congestion, location
of the server, proximity and access to a cell tower, and phone quality.
Federal Communications Commission FCC-CIRC1709-08
65
also incorporate results of some crowdsourced data), and the CalSPEED drive-test data gathered by the California
Public Utility Commission (CPUC) (structured sample).291 In addition to the three speed metrics discussed below,
speed measurements are also performed by a variety of other entities.292
1. Ookla
90. Table III.E.1 presents the nationwide mean and median LTE download speeds based on Ookla
data by service provider for the second half of 2015 through the second half of 2016.293 Chart III.E.1 presents the
increase over time for mean and median LTE download speeds for all providers, from the first half of 2014
through the first half of 2017.
291 While speed metrics based on the FCC Speed Test (available for both Android phones and the iPhone) were reported in
the Seventeenth Report through the Nineteenth Report, we do not report these metrics in the Twentieth Report due to certain
anomalies found in the underlying data. We anticipate that we will continue to report these metrics in the future. An in-
depth discussion of the Measuring Broadband America Program’s FCC Speed test is available in the Seventeenth Report.
Seventeenth Report, 29 FCC Rcd at 15467, Appendix VI., paras. 7-9; See also FCC, Measuring Mobile Broadband
Performance, http://www.fcc.gov/measuring-broadband-america/mobile (last visited Sept. 1, 2017).
292 For example, OpenSignal gathers crowdsourced mobile speed data through the use of its mobile app. This app is available
free of charge to Android and iOs users, and it is designed to collect data about cell phone towers and cell phone signal
strength. OpenSignal, https://opensignal.com/reports/2016/08/usa/state-of-the-mobile-network (last visited Sept. 1, 2017).
OpenSignal uses these data to generate a publicly available interactive map. OpenSignal, https://opensignal.com/networks
(last visited Sept. 1, 2017). Another open source application for measuring network performance on mobile platforms is
MobiPerf by M-Lab. MobiPerf, https://sites.google.com/site/mobiperfdev/ (last visited Sept. 1, 2017). This application is
available for Android phones only, and data collected via the application are used to generate a publicly available interactive
map. Open Mobile Data, http://openmobiledata.appspot.com/visualization (last visited Sept. 1, 2017). Anonymized data are
also available for download. MobiPerf, For Researchers, https://sites.google.com/site/mobiperfdev/for-researchers (last
visited Sept. 1, 2017). Other entities that perform speed tests include Nielsen and Mosaik. Nielson,
http://www.nielsen.com/us/en/solutions/measurement/mobile.html (last visited Sept. 1, 2017); Mosaik Solutions,
https://www.mosaik.com/network-experience-solutions/cellmaps/ (last visited Sept. 1, 2017).
293 Ookla gathers crowdsourced mobile speed data through the use of its Speedtest mobile app. Ookla Speedtest Mobile
Apps, http://www.speedtest.net/mobile/ (last visited Sept. 1, 2017). This app is available free of charge to smartphone users,
and is designed to test the performance of mobile cellular connections. Once the app is downloaded, with access to wireless
service, users can measure the speed of their wireless connection whenever and wherever they choose. Ookla LTE upload
speeds by service provider for the second half of 2015 through the second half of 2016 can be found in Appendix III:
Elements of Inter-Firm Rivalry.
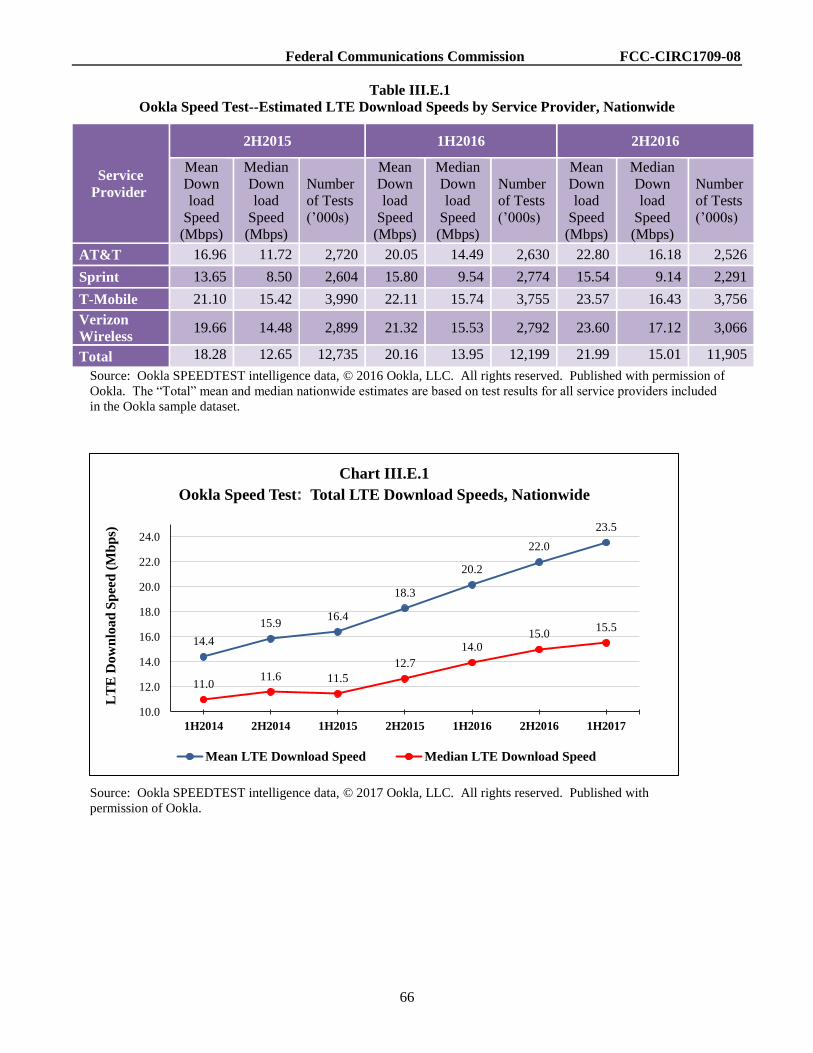
Federal Communications Commission FCC-CIRC1709-08
66
Table III.E.1
Ookla Speed Test--Estimated LTE Download Speeds by Service Provider, Nationwide
Service
Provider
2H2015 1H2016 2H2016
Mean
Down
load
Speed
(Mbps)
Median
Down
load
Speed
(Mbps)
Number
of Tests
(’000s)
Mean
Down
load
Speed
(Mbps)
Median
Down
load
Speed
(Mbps)
Number
of Tests
(’000s)
Mean
Down
load
Speed
(Mbps)
Median
Down
load
Speed
(Mbps)
Number
of Tests
(’000s)
AT&T 16.96 11.72 2,720 20.05 14.49 2,630 22.80 16.18 2,526
Sprint 13.65 8.50 2,604 15.80 9.54 2,774 15.54 9.14 2,291
T-Mobile 21.10 15.42 3,990 22.11 15.74 3,755 23.57 16.43 3,756
Verizon
Wireless 19.66 14.48 2,899 21.32 15.53 2,792 23.60 17.12 3,066
Total 18.28 12.65 12,735 20.16 13.95 12,199 21.99 15.01 11,905
Source: Ookla SPEEDTEST intelligence data, © 2016 Ookla, LLC. All rights reserved. Published with permission of
Ookla. The “Total” mean and median nationwide estimates are based on test results for all service providers included
in the Ookla sample dataset.
Source: Ookla SPEEDTEST intelligence data, © 2017 Ookla, LLC. All rights reserved. Published with
permission of Ookla.
14.4
15.916.4
18.3
20.2
22.0
23.5
11.011.6 11.5
12.7
14.015.0
15.5
10.0
12.0
14.0
16.0
18.0
20.0
22.0
24.0
1H2014 2H2014 1H2015 2H2015 1H2016 2H2016 1H2017
LT
E D
ow
nlo
ad
Sp
eed
(M
bp
s)
Chart III.E.1
Ookla Speed Test: Total LTE Download Speeds, Nationwide
Mean LTE Download Speed Median LTE Download Speed
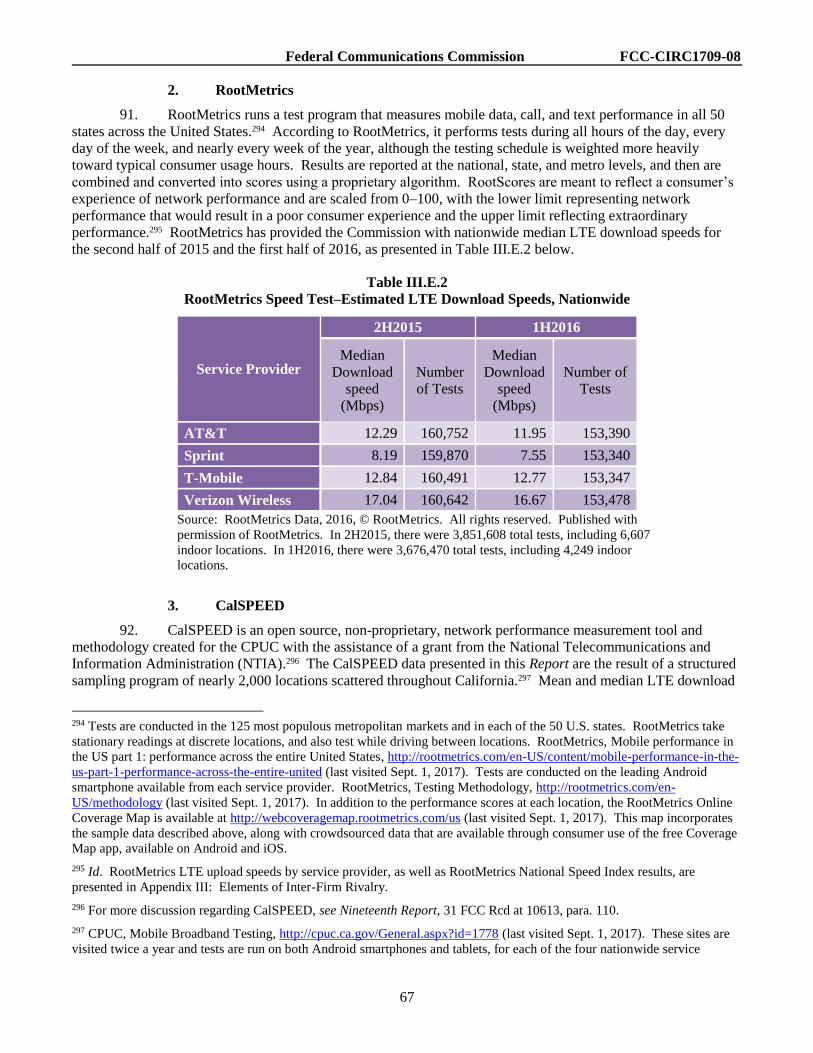
Federal Communications Commission FCC-CIRC1709-08
67
2. RootMetrics
91. RootMetrics runs a test program that measures mobile data, call, and text performance in all 50
states across the United States.294 According to RootMetrics, it performs tests during all hours of the day, every
day of the week, and nearly every week of the year, although the testing schedule is weighted more heavily
toward typical consumer usage hours. Results are reported at the national, state, and metro levels, and then are
combined and converted into scores using a proprietary algorithm. RootScores are meant to reflect a consumer’s
experience of network performance and are scaled from 0–100, with the lower limit representing network
performance that would result in a poor consumer experience and the upper limit reflecting extraordinary
performance.295 RootMetrics has provided the Commission with nationwide median LTE download speeds for
the second half of 2015 and the first half of 2016, as presented in Table III.E.2 below.
Table III.E.2
RootMetrics Speed Test–Estimated LTE Download Speeds, Nationwide
Service Provider
2H2015 1H2016
Median
Download
speed
(Mbps)
Number
of Tests
Median
Download
speed
(Mbps)
Number of
Tests
AT&T 12.29 160,752 11.95 153,390
Sprint 8.19 159,870 7.55 153,340
T-Mobile 12.84 160,491 12.77 153,347
Verizon Wireless 17.04 160,642 16.67 153,478
Source: RootMetrics Data, 2016, © RootMetrics. All rights reserved. Published with
permission of RootMetrics. In 2H2015, there were 3,851,608 total tests, including 6,607
indoor locations. In 1H2016, there were 3,676,470 total tests, including 4,249 indoor
locations.
3. CalSPEED
92. CalSPEED is an open source, non-proprietary, network performance measurement tool and
methodology created for the CPUC with the assistance of a grant from the National Telecommunications and
Information Administration (NTIA).296 The CalSPEED data presented in this Report are the result of a structured
sampling program of nearly 2,000 locations scattered throughout California.297 Mean and median LTE download
294 Tests are conducted in the 125 most populous metropolitan markets and in each of the 50 U.S. states. RootMetrics take
stationary readings at discrete locations, and also test while driving between locations. RootMetrics, Mobile performance in
the US part 1: performance across the entire United States, http://rootmetrics.com/en-US/content/mobile-performance-in-the-
us-part-1-performance-across-the-entire-united (last visited Sept. 1, 2017). Tests are conducted on the leading Android
smartphone available from each service provider. RootMetrics, Testing Methodology, http://rootmetrics.com/en-
US/methodology (last visited Sept. 1, 2017). In addition to the performance scores at each location, the RootMetrics Online
Coverage Map is available at http://webcoveragemap.rootmetrics.com/us (last visited Sept. 1, 2017). This map incorporates
the sample data described above, along with crowdsourced data that are available through consumer use of the free Coverage
Map app, available on Android and iOS.
295 Id. RootMetrics LTE upload speeds by service provider, as well as RootMetrics National Speed Index results, are
presented in Appendix III: Elements of Inter-Firm Rivalry.
296 For more discussion regarding CalSPEED, see Nineteenth Report, 31 FCC Rcd at 10613, para. 110.
297 CPUC, Mobile Broadband Testing, http://cpuc.ca.gov/General.aspx?id=1778 (last visited Sept. 1, 2017). These sites are
visited twice a year and tests are run on both Android smartphones and tablets, for each of the four nationwide service

Federal Communications Commission FCC-CIRC1709-08
68
speed measurements for the state of California, estimated using CalSPEED data collected from the second half of
2015 through the second half of 2016, are presented in Table III.E.3 below.
Table III.E.3
CalSPEED--Estimated LTE Download Speeds by Service Provider, California Only
Service
Provider
Fall 2015 Spring 2016 Fall 2016
Mean
LTE
Down
load
Speed
(Mbps)
Median
LTE
Down
load
Speed
(Mbps)
Number
of Tests
Mean
LTE
Down
load
Speed
(Mbps)
Median
LTE
Down
load
Speed
(Mbps)
Number
of Tests
Mean
LTE
Down
load
Speed
(Mbps)
Median
LTE
Down
load
Speed
(Mbps)
Number
of Tests
AT&T 12.26 11.18 3,044 14.01 11.76 1,554 14.04 14.40 1,517
Sprint 9.78 7.87 1,970 9.68 6.74 1,087 9.54 8.11 1,045
T-Mobile 11.84 11.93 2,220 13.11 10.63 1,257 11.97 11.27 1,216
Verizon 14.36 15.49 3,124 16.41 16.09 1,583 16.69 18.43 1,626
Total 12.33 12.17 10,358 13.64 11.47 5,481 13.50 13.70 5,404
Source: The estimated speeds are based on the CalSPEED data. Fall 2015 tests were taken between the dates of Dec. 3,
2015 to Jan. 22, 2016. Spring 2016 tests were taken between the dates of Apr. 14, 2016 through May 25, 2016. Fall 2016
tests were taken between the dates of Sept. 29, 2016 to Nov. 4, 2016.
IV. CONCLUSION
93. Competition continues to play an essential role in the mobile wireless marketplace–leading to
lower prices, more innovation, and higher quality service for American consumers. In this Twentieth Report, we
analyze competition in the mobile wireless marketplace pursuant to Section 332(c)(1)(C) of the Communications
Act, and our assessment of various generally accepted metrics of competition indicates that there is effective
competition in the marketplace for mobile wireless services.
V. PROCEDURAL MATTERS
94. This Twentieth Report is issued pursuant to authority contained in Section 332(c)(1)(C) of the
Communications Act of 1934, as amended, 47 U.S.C. § 332(c)(1)(C).
95. It is ORDERED that copies of this Twentieth Report be sent to the appropriate committees and
subcommittees of the United States House of Representatives and the United States Senate.
providers. Data can be downloaded from CPUC Mobile Broadband Testing. FCC staff downloaded the complete raw data
set for use in this Report. In our presentation of CalSPEED data, we have dropped any observation that was not in the
provider’s coverage area, or any observation that was terminated by the tester, which corresponds to the method used by
CPUC. If the test was terminated for any other reason, we followed CPUC guidance and assumed a download speed of zero
Mbps for that particular test. Tests were not included if the testing device was not a smartphone. Finally, results from each
site and for each provider were averaged across all east coast and west coast servers, and the top 1% of resulting speed
observations were trimmed from the dataset, by provider and separately for each time period. This is a surveyed test and not
crowdsourced, and therefore some of the cleaning criteria differ from other speed tests. CPUC LTE upload speeds by service
provider for the second half of 2015 through the second half of 2016 can be found in Appendix III: Elements of Inter-Firm
Rivalry.
Federal Communications Commission FCC-CIRC1709-08
69
96. It is FURTHER ORDERED that the proceeding in WT Docket No. 17-69 IS TERMINATED.
FEDERAL COMMUNICATIONS COMMISSION
Marlene H. Dortch
Secretary
Federal Communications Commission
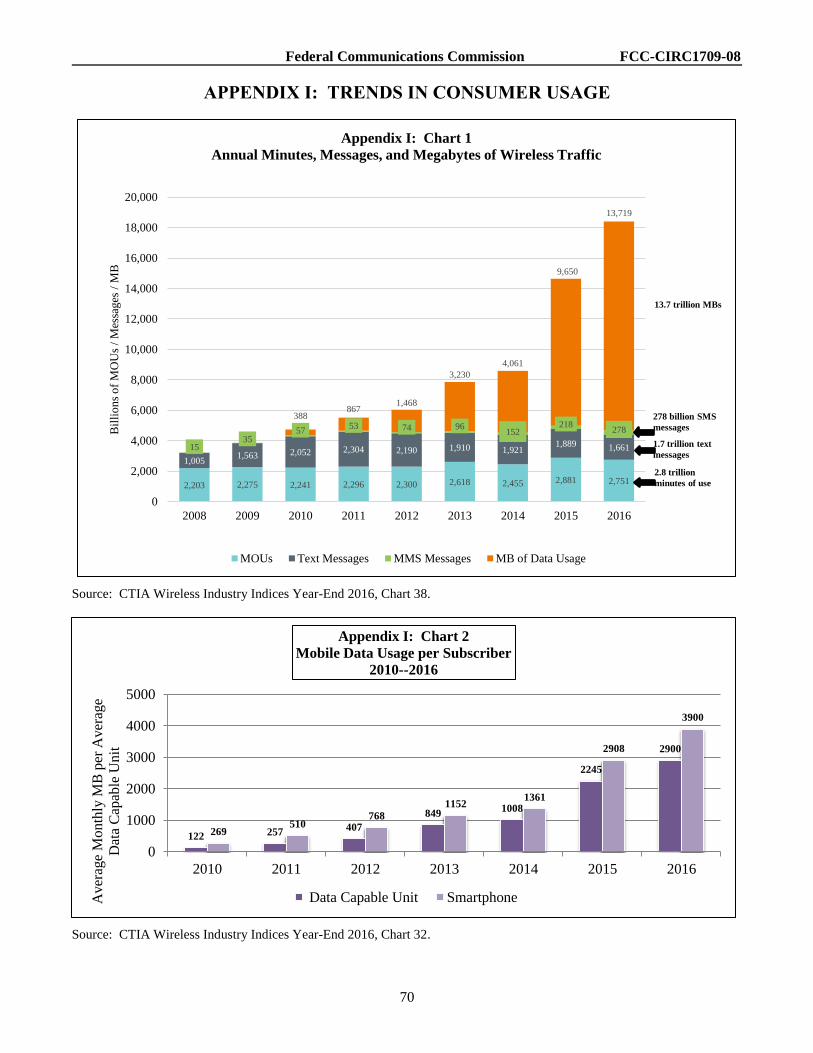
Federal Communications Commission FCC-CIRC1709-08
70
APPENDIX I: TRENDS IN CONSUMER USAGE
Source: CTIA Wireless Industry Indices Year-End 2016, Chart 38.
Source: CTIA Wireless Industry Indices Year-End 2016, Chart 32.
2,203 2,275 2,241 2,296 2,300 2,618 2,455 2,881 2,751
1,0051,563 2,052 2,304 2,190 1,910 1,921
1,889 1,6611535
5753 74 96
152218
278
388867
1,468
3,230
4,061
9,650
13,719
0
2,000
4,000
6,000
8,000
10,000
12,000
14,000
16,000
18,000
20,000
2008 2009 2010 2011 2012 2013 2014 2015 2016
Bil
lio
ns
of
MO
Us
/ M
essa
ges
/ M
B
Appendix I: Chart 1
Annual Minutes, Messages, and Megabytes of Wireless Traffic
MOUs Text Messages MMS Messages MB of Data Usage
2.8 trillion
minutes of use
1.7 trillion text
messages
278 billion SMS
messages
13.7 trillion MBs
122 257 407
8491008
2245
2900
269510
768
11521361
2908
3900
0
1000
2000
3000
4000
5000
2010 2011 2012 2013 2014 2015 2016
Aver
age
Month
ly M
B p
er A
ver
age
Dat
a C
apab
le U
nit
Appendix I: Chart 2
Mobile Data Usage per Subscriber
2010--2016
Data Capable Unit Smartphone
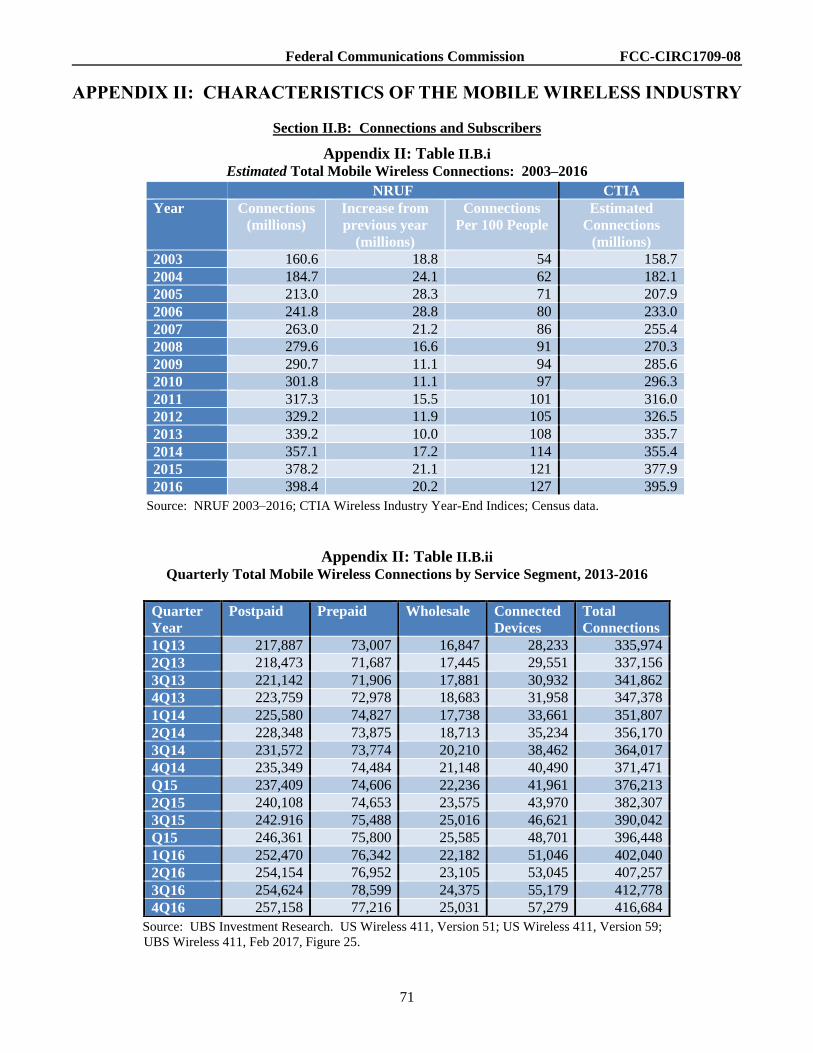
Federal Communications Commission FCC-CIRC1709-08
71
APPENDIX II: CHARACTERISTICS OF THE MOBILE WIRELESS INDUSTRY
Section II.B: Connections and Subscribers
Appendix II: Table II.B.i
Estimated Total Mobile Wireless Connections: 2003–2016
Source: NRUF 2003–2016; CTIA Wireless Industry Year-End Indices; Census data.
Appendix II: Table II.B.ii
Quarterly Total Mobile Wireless Connections by Service Segment, 2013-2016
Source: UBS Investment Research. US Wireless 411, Version 51; US Wireless 411, Version 59;
UBS Wireless 411, Feb 2017, Figure 25.
NRUF CTIA
Year Connections
(millions)
Increase from
previous year
(millions)
Connections
Per 100 People
Estimated
Connections
(millions)
2003 160.6 18.8 54 158.7
2004 184.7 24.1 62 182.1
2005 213.0 28.3 71 207.9
2006 241.8 28.8 80 233.0
2007 263.0 21.2 86 255.4
2008 279.6 16.6 91 270.3
2009 290.7 11.1 94 285.6
2010 301.8 11.1 97 296.3
2011 317.3 15.5 101 316.0
2012 329.2 11.9 105 326.5
2013 339.2 10.0 108 335.7
2014 357.1 17.2 114 355.4
2015 378.2 21.1 121 377.9
2016 398.4 20.2 127 395.9
Quarter
Year
Postpaid Prepaid Wholesale Connected
Devices
Total
Connections
1Q13 217,887 73,007 16,847 28,233 335,974
2Q13 218,473 71,687 17,445 29,551 337,156
3Q13 221,142 71,906 17,881 30,932 341,862
4Q13 223,759 72,978 18,683 31,958 347,378
1Q14 225,580 74,827 17,738 33,661 351,807
2Q14 228,348 73,875 18,713 35,234 356,170
3Q14 231,572 73,774 20,210 38,462 364,017
4Q14 235,349 74,484 21,148 40,490 371,471
Q15 237,409 74,606 22,236 41,961 376,213
2Q15 240,108 74,653 23,575 43,970 382,307
3Q15 242.916 75,488 25,016 46,621 390,042
Q15 246,361 75,800 25,585 48,701 396,448
1Q16 252,470 76,342 22,182 51,046 402,040
2Q16 254,154 76,952 23,105 53,045 407,257
3Q16 254,624 78,599 24,375 55,179 412,778
4Q16 257,158 77,216 25,031 57,279 416,684
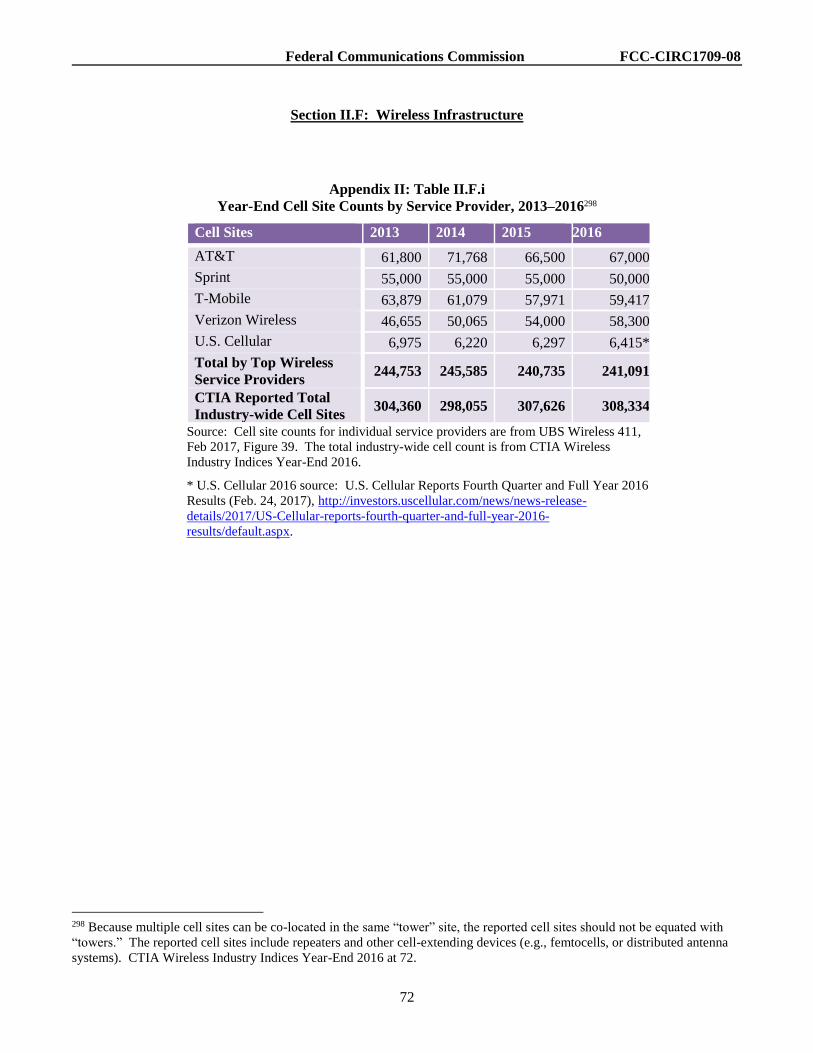
Federal Communications Commission FCC-CIRC1709-08
72
Section II.F: Wireless Infrastructure
Appendix II: Table II.F.i
Year-End Cell Site Counts by Service Provider, 2013–2016298
Cell Sites 2013 2014 2015 2016
AT&T 61,800 71,768 66,500 67,000
Sprint 55,000 55,000 55,000 50,000
T-Mobile 63,879 61,079 57,971 59,417
Verizon Wireless 46,655 50,065 54,000 58,300
U.S. Cellular 6,975 6,220 6,297 6,415*
Total by Top Wireless
Service Providers 244,753 245,585 240,735 241,091
CTIA Reported Total
Industry-wide Cell Sites 304,360 298,055 307,626 308,334
Source: Cell site counts for individual service providers are from UBS Wireless 411,
Feb 2017, Figure 39. The total industry-wide cell count is from CTIA Wireless
Industry Indices Year-End 2016.
* U.S. Cellular 2016 source: U.S. Cellular Reports Fourth Quarter and Full Year 2016
Results (Feb. 24, 2017), http://investors.uscellular.com/news/news-release-
details/2017/US-Cellular-reports-fourth-quarter-and-full-year-2016-
results/default.aspx.
298 Because multiple cell sites can be co-located in the same “tower” site, the reported cell sites should not be equated with
“towers.” The reported cell sites include repeaters and other cell-extending devices (e.g., femtocells, or distributed antenna
systems). CTIA Wireless Industry Indices Year-End 2016 at 72.

Federal Communications Commission FCC-CIRC1709-08
73
APPENDIX III: ELEMENTS OF INTER-FIRM RIVALRY
Section III.A: Pricing Levels and Trends
The charts below show pricing changes for various plans across the four nationwide service providers, sourced
from RBC Capital Markets, for the time period April 2016 through March 2017.299
299 Jonathan Atkin, Bora Lee, and Brajesh Mishra, RBC Capital Markets, Equity Research, Wireless Telecommunications
Services, (Mar. 16, 2017).
Source: RBC Capital Markets estimates, company data
Source: RBC Capital Markets estimates, company data
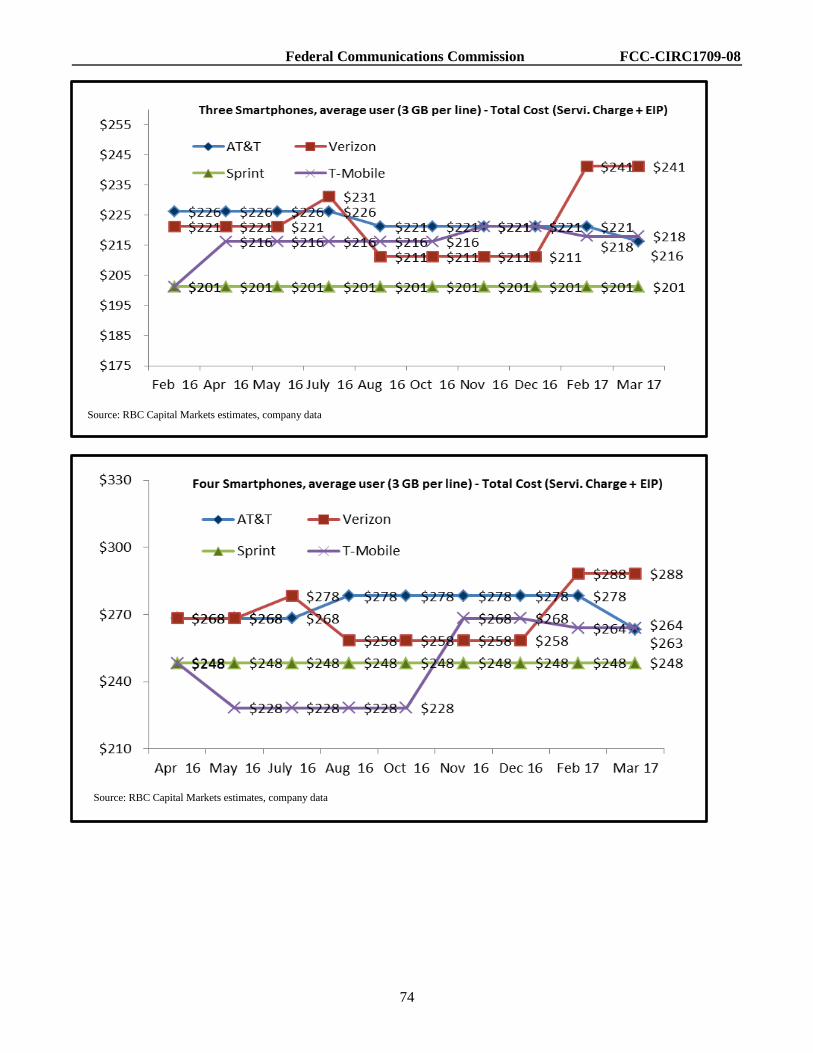
Federal Communications Commission FCC-CIRC1709-08
74
Source: RBC Capital Markets estimates, company data
Source: RBC Capital Markets estimates, company data

Federal Communications Commission FCC-CIRC1709-08
75
Appendix III: Table III.A.i
Change in CPI, 1997-2016
Year CPI Wireless Telephone
Services CPI
Telephone Services CPI Land-line Telephone
Services CPI
Annual
Index
Average
Annual
Change
Annual
Index
Average
Annual
Change
Annual
Index
Average
Annual
Change
Annual
Index
Average
Annual
Change
1997 100.0 100.0 100.0
1998 101.6 1.6% 95.1 100.7
1999 103.8 2.2% 84.9 -10.7% 100.1 -0.6%
2000 107.3 3.4% 76.0 -10.5% 98.5 -1.6%
2001 110.3 2.8% 68.1 -10.4% 99.3 0.8%
2002 112.1 1.6% 67.4 -1.0% 99.7 0.4%
2003 114.6 2.3% 66.8 -0.9% 98.3 -1.4%
2004 117.7 2.7% 66.2 -0.9% 95.8 -2.5%
2005 121.7 3.4% 65.0 -1.8% 94.9 -0.9%
2006 125.6 3.2% 64.6 -0.6% 95.8 0.9%
2007 129.2 2.9% 64.4 -0.3% 98.2 2.6%
2008 134.1 3.8% 64.2 -0.2% 100.5 2.2%
2009 133.7 -0.4% 64.3 0.0% 102.4 1.9% 100.0
2010 135.8 1.6% 62.4 -2.9% 102.4 0.0% 101.6
2011 140.1 3.2% 60.1 -3.6% 101.2 -1.1% 103.3 1.7%
2012 143.0 2.1% 59.7 -0.8% 101.7 0.5% 105.6 2.2%
2013 145.1 1.5% 58.6 -1.8% 101.6 -0.1% 108.1 2.4%
2014 147.5 1.6% 57.4 -2.1% 101.1 -0.4% 111.1 2.7%
2015 147.7 0.1% 55.2 -3.8% 99.3 -1.8% 113.4 2.1%
2016 149.5 1.3% 54.7 -1.0% 98.8 -0.5% 114.5 1.0%
1997 to
2016
49.5% -45.3% -1.2% 12.7%
Source: Data from Bureau of Labor Statistics. All CPI figures were taken from BLS databases. Bureau of Labor
Statistics, http://www.bls.gov (last visited Sept. 1, 2017). Beginning in January 2010, the CPIs for local telephone
service and long-distance telephone service were discontinued and replaced by a new CPI for land-line telephone
services.300
300 Starting in December 1997, the basket included a category for cellular/wireless telephone services. The index used in this
analysis, the CPI for All Urban Consumers (CPI-U), represents about 87% of the total U.S. population. Bureau of Labor
Statistics, Consumer Price Index: Frequently Asked Questions, http://www.bls.gov/cpi/cpifaq.htm (last visited Sept. 1, 2017).
The CPI category “Telephone Services” has two components: wireless telephone services and landline telephone
services. Wireless telephone services include “all service charges, applicable per-plan charges or per-minute call charges,
and other charges normally included in a cellular plan are eligible for pricing. Internet access is also eligible.” Landline
telephone services include “charges for all types of local and long-distance residential services are eligible for collection,
including charges for dial tone services, line maintenance and access, 911 services, directory assistance, touch-tone service,
and other special features and mandatory charges and installation.” Additional information can be found at Bureau of Labor
Statistics, Consumer Price Index: How the Consumer Price Index Measures Price Change for Telephone Services,
https://www.bls.gov/cpi/factsheet-telephone-services.htm (last visited Sept. 1, 2017).
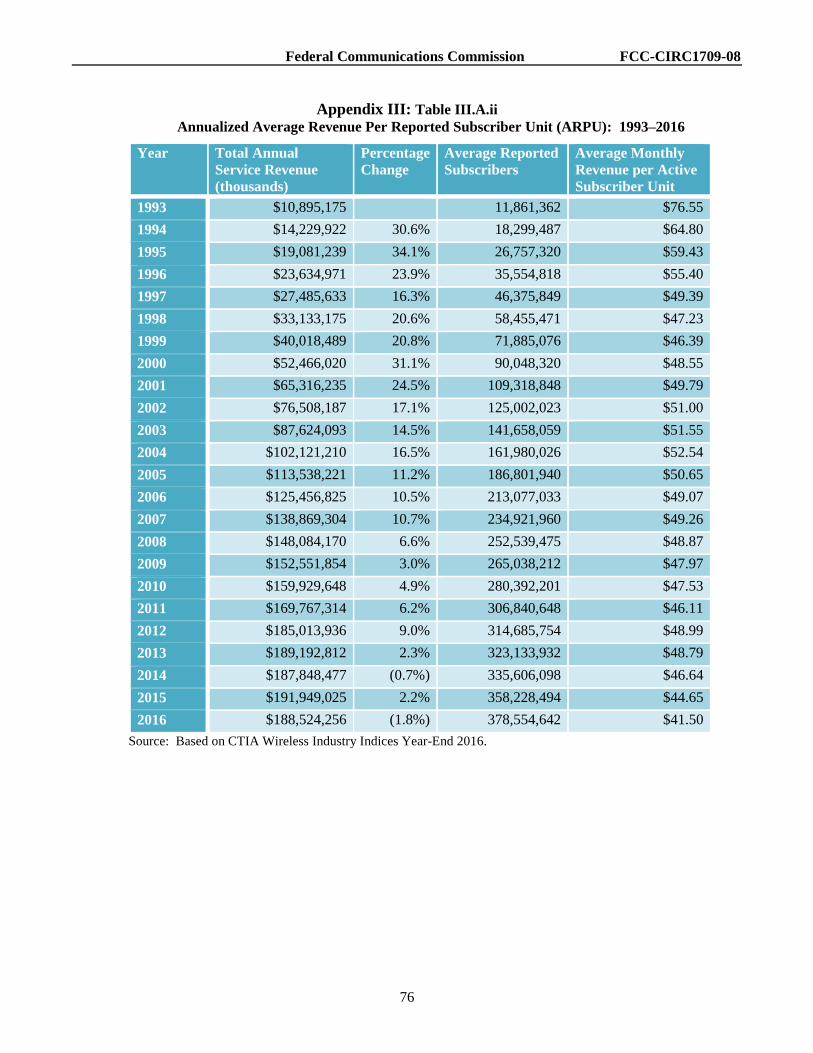
Federal Communications Commission FCC-CIRC1709-08
76
Appendix III: Table III.A.ii
Annualized Average Revenue Per Reported Subscriber Unit (ARPU): 1993–2016
Year Total Annual
Service Revenue
(thousands)
Percentage
Change
Average Reported
Subscribers
Average Monthly
Revenue per Active
Subscriber Unit
1993 $10,895,175 11,861,362 $76.55
1994 $14,229,922 30.6% 18,299,487 $64.80
1995 $19,081,239 34.1% 26,757,320 $59.43
1996 $23,634,971 23.9% 35,554,818 $55.40
1997 $27,485,633 16.3% 46,375,849 $49.39
1998 $33,133,175 20.6% 58,455,471 $47.23
1999 $40,018,489 20.8% 71,885,076 $46.39
2000 $52,466,020 31.1% 90,048,320 $48.55
2001 $65,316,235 24.5% 109,318,848 $49.79
2002 $76,508,187 17.1% 125,002,023 $51.00
2003 $87,624,093 14.5% 141,658,059 $51.55
2004 $102,121,210 16.5% 161,980,026 $52.54
2005 $113,538,221 11.2% 186,801,940 $50.65
2006 $125,456,825 10.5% 213,077,033 $49.07
2007 $138,869,304 10.7% 234,921,960 $49.26
2008 $148,084,170 6.6% 252,539,475 $48.87
2009 $152,551,854 3.0% 265,038,212 $47.97
2010 $159,929,648 4.9% 280,392,201 $47.53
2011 $169,767,314 6.2% 306,840,648 $46.11
2012 $185,013,936 9.0% 314,685,754 $48.99
2013 $189,192,812 2.3% 323,133,932 $48.79
2014 $187,848,477 (0.7%) 335,606,098 $46.64
2015 $191,949,025 2.2% 358,228,494 $44.65
2016 $188,524,256 (1.8%) 378,554,642 $41.50
Source: Based on CTIA Wireless Industry Indices Year-End 2016.

Federal Communications Commission FCC-CIRC1709-08
77
Section III.D: Nationwide Network Coverage and Technology Upgrades
The maps, tables, and charts presented below are based on Commission estimates derived from census block
analysis of December 2016 Form 477 coverage maps, using both the centroid301 and the actual area coverage
methodologies.302
LTE Coverage Nationwide by Number of Service Providers
Form 477, Centroid Method, December 2016
Source: Based on centroid analysis of December 2016 Form 477 and 2010 Census data. Note that the number of service
providers in a census block represents network coverage only. Network coverage does not necessarily reflect the number
of service providers that actively offer service to individuals located in a given area.
301 The centroid methodology provides estimates of the percentage of the population located in census blocks with a certain
number of service providers and represents network coverage. That a particular service provider has indicated that it has
network coverage in a particular census block does not necessarily mean that it offers service to residents in that census
block. In addition, the fact that a service provider reports coverage in a particular census block does not mean that it
necessarily provides coverage everywhere in the census block. This is likely to be particularly relevant in larger rural census
blocks. For both these reasons, the number of service providers in a census block does not necessarily reflect the number of
choices available to a particular individual or household.
302 Since we do not know the distribution of either the population or road miles at the sub-census block level, as noted above,
we must approximate the percentage that is covered by each technology. To do this, we assume that both population and
road miles are distributed uniformly across each census block. The fraction of the population or road miles covered in a
census block is assumed to be proportional to the fraction of the actual area covered. We then sum the estimated covered
population (road miles) across blocks to estimate the total covered population (road miles) within the United States.

Federal Communications Commission FCC-CIRC1709-08
78
Appendix III: Table III.D.i
Estimated Overall Wireless Coverage by Census Block Including Federal Land
Form 477, Centroid Method, December 2016
Number of
Providers with
Coverage in a
Block
Number of
Blocks
POPs in
those Blocks
% Total
US POPs
Square
Miles in
those
Blocks
% Total
US Square
Miles
Road Miles
in those
Blocks
% Total
US Road
Miles
U.S. Total 10,609,302 312,471,327 100.0% 3,550,852 100.0% 6,817,734 100.0%
1 or more 10,495,816 312,318,080 100.0% 2,860,209 80.5% 6,616,224 97.0%
2 or more 10,289,924 311,578,912 99.7% 2,552,228 71.9% 6,285,795 92.2%
3 or more 9,610,063 306,733,376 98.2% 1,976,189 55.7% 5,437,258 79.8%
4 or more 8,122,859 291,384,672 93.3% 1,217,636 34.3% 3,997,894 58.6%
Source: Based on centroid analysis of December 2016 Form 477 and 2010 Census data. Note that the number of service
providers in a census block represents network coverage only. Network coverage does not necessarily reflect the number of
service providers that actively offer service to individuals located in a given area.
Appendix III: Table III.D.ii
Estimated Overall Wireless Coverage in the U.S. by Service Provider
Form 477, Centroid Method, December 2016
Provider Number
of Blocks
POPS in
those
Blocks
% Total
US
POPs
Square
Miles in
those
Blocks
% Total
US
Square
Miles
Road
Miles in
those
Blocks
% Total
US Road
Miles
U.S. Total 10,609,30
2
312,471,3
27 100.0% 3,550,852 100.0% 6,817,734 100.0%
AT&T 10,158,46
9
310,402,4
40 99.3% 2,553,426 71.9% 6,204,988 91.0%
Sprint 7,654,799 287,660,6
31 92.1% 976,639 27.5% 3,525,826 51.7%
T-Mobile 8,849,655 297,340,3
37 95.2% 1,690,976 47.6% 4,834,578 70.9%
Verizon Wireless 9,859,047 304,313,3
14 97.4% 2,377,385 67.0% 5,945,348 87.2%
Source: Based on centroid analysis of December 2016 Form 477 and 2010 Census data. That a particular service provider
has indicated that it has network coverage in a particular census block does not necessarily mean that it offers service to
residents in that census block. Also, the fact that a service provider reports coverage in a particular census block does not
mean that it necessarily provides coverage everywhere in the census block.
Appendix III: Table III.D.iii
Estimated Overall Wireless Coverage in the U.S. by Service Provider
Form 477, Actual Area Coverage Method, December 2016
Provider Covered
POPs
% Total
US POPs
Covered
Square
Miles
% Total
US
Square
Miles
Covered
Road
Miles
% Total
US Road
Miles
U.S. Total 312,471,327 100.0% 3,550,852 100.0% 6,817,734 100.0%
AT&T 310,325,279 99.3% 2,546,087 71.7% 6,187,858 90.8%
Sprint 287,524,311 92.0% 977,391 27.5% 3,520,150 51.6%
T-Mobile 297,234,855 95.1% 1,695,206 47.7% 4,830,828 70.9%
Verizon Wireless 304,153,186 97.3% 2,353,257 66.3% 5,913,414 86.7%
Source: Based on actual area analysis of December 2016 Form 477 and 2010 Census data. Unlike the centroid
methodology where each block is either covered or not, the actual area coverage methodology acknowledges that
many blocks are only partially covered. Because it is unclear which census blocks should be considered covered or
not, we do not report the number of blocks covered in these results.
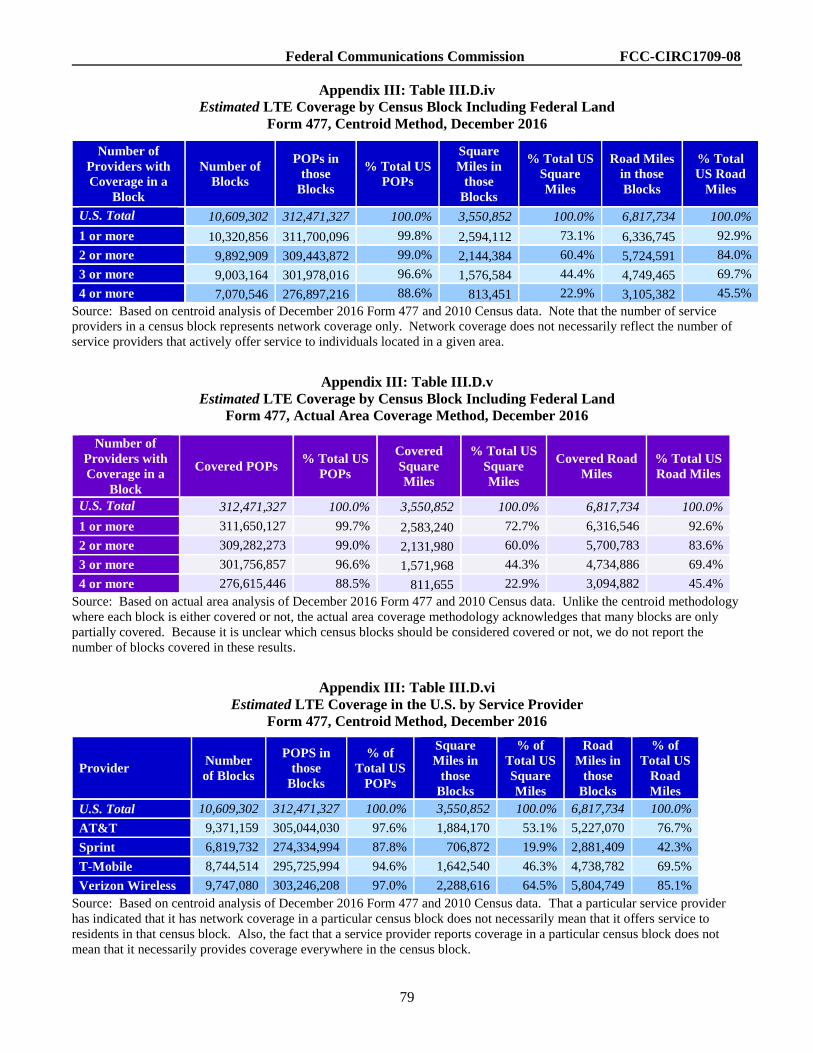
Federal Communications Commission FCC-CIRC1709-08
79
Appendix III: Table III.D.iv
Estimated LTE Coverage by Census Block Including Federal Land
Form 477, Centroid Method, December 2016
Number of
Providers with
Coverage in a
Block
Number of
Blocks
POPs in
those
Blocks
% Total US
POPs
Square
Miles in
those
Blocks
% Total US
Square
Miles
Road Miles
in those
Blocks
% Total
US Road
Miles
U.S. Total
(actual) 10,609,302 312,471,327 100.0% 3,550,852 100.0% 6,817,734 100.0%
1 or more 10,320,856 311,700,096 99.8% 2,594,112 73.1% 6,336,745 92.9%
2 or more 9,892,909 309,443,872 99.0% 2,144,384 60.4% 5,724,591 84.0%
3 or more 9,003,164 301,978,016 96.6% 1,576,584 44.4% 4,749,465 69.7%
4 or more 7,070,546 276,897,216 88.6% 813,451 22.9% 3,105,382 45.5%
Source: Based on centroid analysis of December 2016 Form 477 and 2010 Census data. Note that the number of service
providers in a census block represents network coverage only. Network coverage does not necessarily reflect the number of
service providers that actively offer service to individuals located in a given area.
Appendix III: Table III.D.v
Estimated LTE Coverage by Census Block Including Federal Land
Form 477, Actual Area Coverage Method, December 2016
Number of
Providers with
Coverage in a
Block
Covered POPs % Total US
POPs
Covered
Square
Miles
% Total US
Square
Miles
Covered Road
Miles
% Total US
Road Miles
U.S. Total
(actual) 312,471,327 100.0% 3,550,852 100.0% 6,817,734 100.0%
1 or more 311,650,127 99.7% 2,583,240 72.7% 6,316,546 92.6%
2 or more 309,282,273 99.0% 2,131,980 60.0% 5,700,783 83.6%
3 or more 301,756,857 96.6% 1,571,968 44.3% 4,734,886 69.4%
4 or more 276,615,446 88.5% 811,655 22.9% 3,094,882 45.4%
Source: Based on actual area analysis of December 2016 Form 477 and 2010 Census data. Unlike the centroid methodology
where each block is either covered or not, the actual area coverage methodology acknowledges that many blocks are only
partially covered. Because it is unclear which census blocks should be considered covered or not, we do not report the
number of blocks covered in these results.
Appendix III: Table III.D.vi
Estimated LTE Coverage in the U.S. by Service Provider
Form 477, Centroid Method, December 2016
Provider Number
of Blocks
POPS in
those
Blocks
% of
Total US
POPs
Square
Miles in
those
Blocks
% of
Total US
Square
Miles
Road
Miles in
those
Blocks
% of
Total US
Road
Miles
U.S. Total 10,609,302 312,471,327 100.0% 3,550,852 100.0% 6,817,734 100.0%
AT&T 9,371,159 305,044,030 97.6% 1,884,170 53.1% 5,227,070 76.7%
Sprint 6,819,732 274,334,994 87.8% 706,872 19.9% 2,881,409 42.3%
T-Mobile 8,744,514 295,725,994 94.6% 1,642,540 46.3% 4,738,782 69.5%
Verizon Wireless 9,747,080 303,246,208 97.0% 2,288,616 64.5% 5,804,749 85.1%
Source: Based on centroid analysis of December 2016 Form 477 and 2010 Census data. That a particular service provider
has indicated that it has network coverage in a particular census block does not necessarily mean that it offers service to
residents in that census block. Also, the fact that a service provider reports coverage in a particular census block does not
mean that it necessarily provides coverage everywhere in the census block.
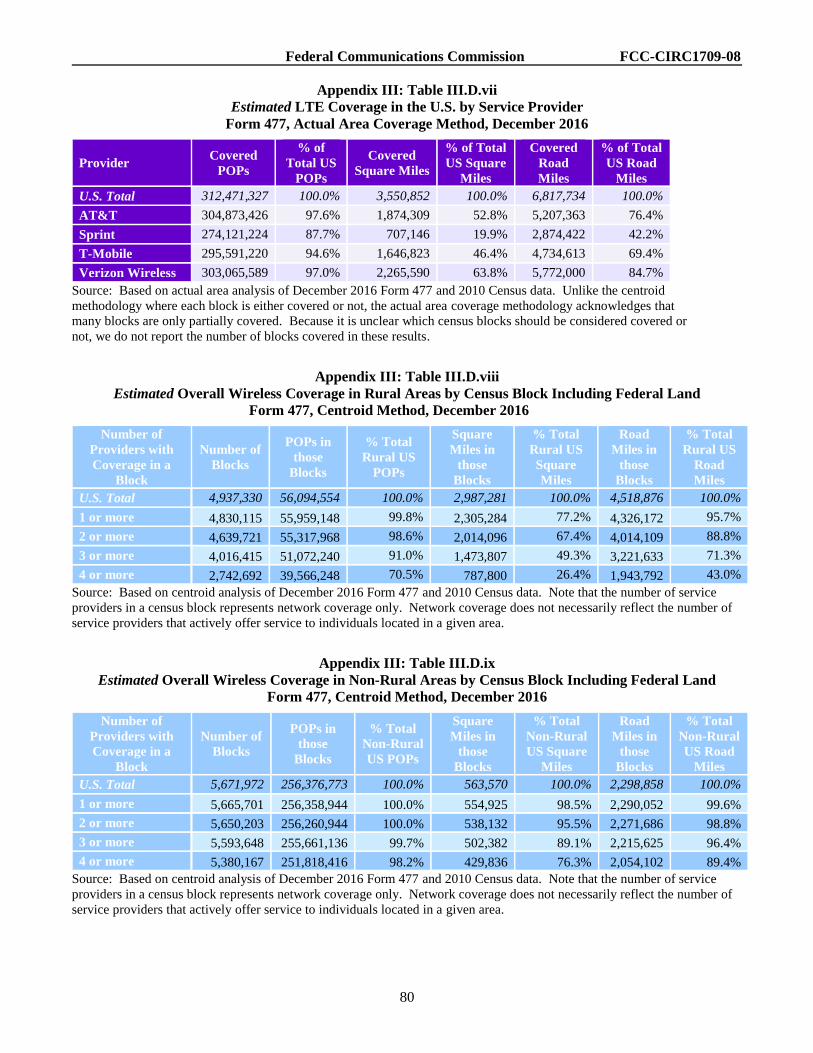
Federal Communications Commission FCC-CIRC1709-08
80
Appendix III: Table III.D.vii
Estimated LTE Coverage in the U.S. by Service Provider
Form 477, Actual Area Coverage Method, December 2016
Provider Covered
POPs
% of
Total US
POPs
Covered
Square Miles
% of Total
US Square
Miles
Covered
Road
Miles
% of Total
US Road
Miles
U.S. Total 312,471,327 100.0% 3,550,852 100.0% 6,817,734 100.0%
AT&T 304,873,426 97.6% 1,874,309 52.8% 5,207,363 76.4%
Sprint 274,121,224 87.7% 707,146 19.9% 2,874,422 42.2%
T-Mobile 295,591,220 94.6% 1,646,823 46.4% 4,734,613 69.4%
Verizon Wireless 303,065,589 97.0% 2,265,590 63.8% 5,772,000 84.7%
Source: Based on actual area analysis of December 2016 Form 477 and 2010 Census data. Unlike the centroid
methodology where each block is either covered or not, the actual area coverage methodology acknowledges that
many blocks are only partially covered. Because it is unclear which census blocks should be considered covered or
not, we do not report the number of blocks covered in these results.
Appendix III: Table III.D.viii
Estimated Overall Wireless Coverage in Rural Areas by Census Block Including Federal Land
Form 477, Centroid Method, December 2016
Number of
Providers with
Coverage in a
Block
Number of
Blocks
POPs in
those
Blocks
% Total
Rural US
POPs
Square
Miles in
those
Blocks
% Total
Rural US
Square
Miles
Road
Miles in
those
Blocks
% Total
Rural US
Road
Miles
U.S. Total 4,937,330 56,094,554 100.0% 2,987,281 100.0% 4,518,876 100.0%
1 or more 4,830,115 55,959,148 99.8% 2,305,284 77.2% 4,326,172 95.7%
2 or more 4,639,721 55,317,968 98.6% 2,014,096 67.4% 4,014,109 88.8%
3 or more 4,016,415 51,072,240 91.0% 1,473,807 49.3% 3,221,633 71.3%
4 or more 2,742,692 39,566,248 70.5% 787,800 26.4% 1,943,792 43.0%
Source: Based on centroid analysis of December 2016 Form 477 and 2010 Census data. Note that the number of service
providers in a census block represents network coverage only. Network coverage does not necessarily reflect the number of
service providers that actively offer service to individuals located in a given area.
Appendix III: Table III.D.ix
Estimated Overall Wireless Coverage in Non-Rural Areas by Census Block Including Federal Land
Form 477, Centroid Method, December 2016
Number of
Providers with
Coverage in a
Block
Number of
Blocks
POPs in
those
Blocks
% Total
Non-Rural
US POPs
Square
Miles in
those
Blocks
% Total
Non-Rural
US Square
Miles
Road
Miles in
those
Blocks
% Total
Non-Rural
US Road
Miles
U.S. Total 5,671,972 256,376,773 100.0% 563,570 100.0% 2,298,858 100.0%
1 or more 5,665,701 256,358,944 100.0% 554,925 98.5% 2,290,052 99.6%
2 or more 5,650,203 256,260,944 100.0% 538,132 95.5% 2,271,686 98.8%
3 or more 5,593,648 255,661,136 99.7% 502,382 89.1% 2,215,625 96.4%
4 or more 5,380,167 251,818,416 98.2% 429,836 76.3% 2,054,102 89.4%
Source: Based on centroid analysis of December 2016 Form 477 and 2010 Census data. Note that the number of service
providers in a census block represents network coverage only. Network coverage does not necessarily reflect the number of
service providers that actively offer service to individuals located in a given area.
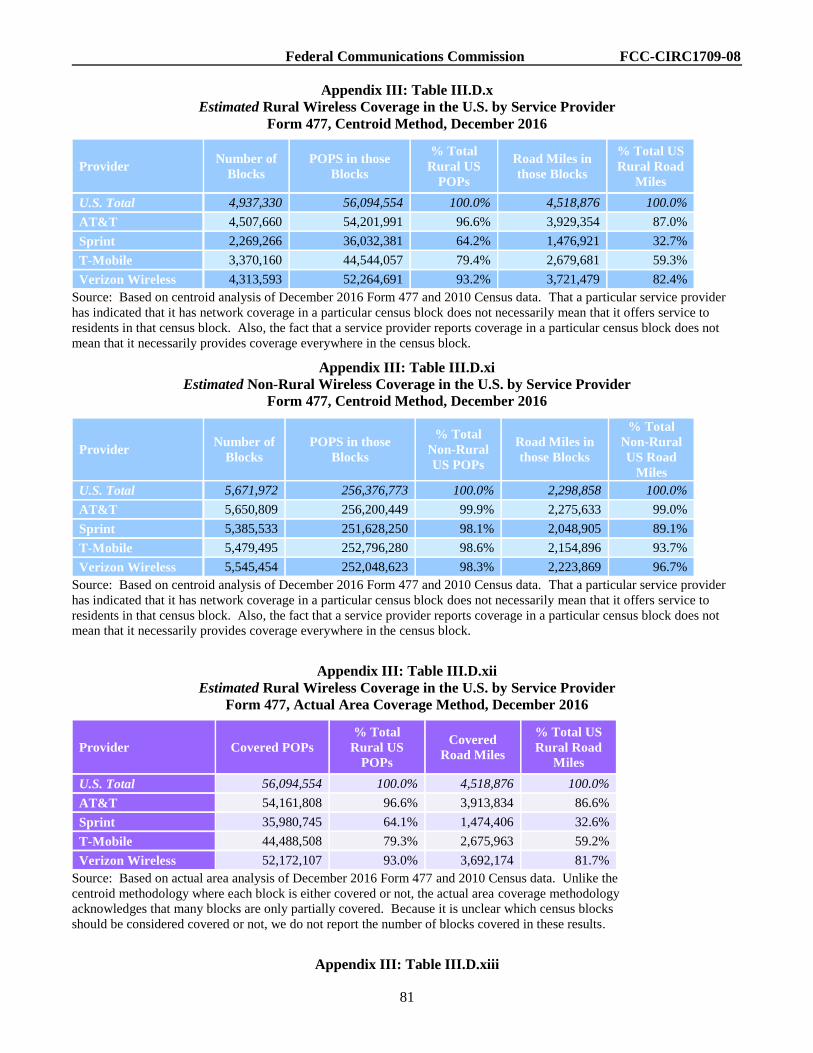
Federal Communications Commission FCC-CIRC1709-08
81
Appendix III: Table III.D.x
Estimated Rural Wireless Coverage in the U.S. by Service Provider
Form 477, Centroid Method, December 2016
Provider Number of
Blocks
POPS in those
Blocks
% Total
Rural US
POPs
Road Miles in
those Blocks
% Total US
Rural Road
Miles
U.S. Total 4,937,330 56,094,554 100.0% 4,518,876 100.0%
AT&T 4,507,660 54,201,991 96.6% 3,929,354 87.0%
Sprint 2,269,266 36,032,381 64.2% 1,476,921 32.7%
T-Mobile 3,370,160 44,544,057 79.4% 2,679,681 59.3%
Verizon Wireless 4,313,593 52,264,691 93.2% 3,721,479 82.4%
Source: Based on centroid analysis of December 2016 Form 477 and 2010 Census data. That a particular service provider
has indicated that it has network coverage in a particular census block does not necessarily mean that it offers service to
residents in that census block. Also, the fact that a service provider reports coverage in a particular census block does not
mean that it necessarily provides coverage everywhere in the census block.
Appendix III: Table III.D.xi
Estimated Non-Rural Wireless Coverage in the U.S. by Service Provider
Form 477, Centroid Method, December 2016
Provider Number of
Blocks
POPS in those
Blocks
% Total
Non-Rural
US POPs
Road Miles in
those Blocks
% Total
Non-Rural
US Road
Miles
U.S. Total 5,671,972 256,376,773 100.0% 2,298,858 100.0%
AT&T 5,650,809 256,200,449 99.9% 2,275,633 99.0%
Sprint 5,385,533 251,628,250 98.1% 2,048,905 89.1%
T-Mobile 5,479,495 252,796,280 98.6% 2,154,896 93.7%
Verizon Wireless 5,545,454 252,048,623 98.3% 2,223,869 96.7%
Source: Based on centroid analysis of December 2016 Form 477 and 2010 Census data. That a particular service provider
has indicated that it has network coverage in a particular census block does not necessarily mean that it offers service to
residents in that census block. Also, the fact that a service provider reports coverage in a particular census block does not
mean that it necessarily provides coverage everywhere in the census block.
Appendix III: Table III.D.xii
Estimated Rural Wireless Coverage in the U.S. by Service Provider
Form 477, Actual Area Coverage Method, December 2016
Provider Covered POPs
% Total
Rural US
POPs
Covered
Road Miles
% Total US
Rural Road
Miles
U.S. Total 56,094,554 100.0% 4,518,876 100.0%
AT&T 54,161,808 96.6% 3,913,834 86.6%
Sprint 35,980,745 64.1% 1,474,406 32.6%
T-Mobile 44,488,508 79.3% 2,675,963 59.2%
Verizon Wireless 52,172,107 93.0% 3,692,174 81.7%
Source: Based on actual area analysis of December 2016 Form 477 and 2010 Census data. Unlike the
centroid methodology where each block is either covered or not, the actual area coverage methodology
acknowledges that many blocks are only partially covered. Because it is unclear which census blocks
should be considered covered or not, we do not report the number of blocks covered in these results.
Appendix III: Table III.D.xiii

Federal Communications Commission FCC-CIRC1709-08
82
Estimated Non-Rural Wireless Coverage in the U.S. by Service Provider
Form 477, Actual Area Coverage Method, December 2016
Provider Covered POPs
% Total Non-
Rural US
POPs
Covered
Road Miles
% Total Non-
Rural US
Road Miles
U.S. Total 256,376,773 100.0% 2,298,858 100.0%
AT&T 256,163,470 99.9% 2,274,025 98.9%
Sprint 251,543,566 98.1% 2,045,744 89.0%
T-Mobile 252,746,348 98.6% 2,154,865 93.7%
Verizon Wireless 251,981,080 98.3% 2,221,240 96.6%
Source: Based on actual area analysis of December 2016 Form 477 and 2010 Census data. Unlike the
centroid methodology where each block is either covered or not, the actual area coverage methodology
acknowledges that many blocks are only partially covered. Because it is unclear which census blocks
should be considered covered or not, we do not report the number of blocks covered in these results.
Appendix III: Table III.D.xiv
Estimated LTE Coverage in Rural Areas by Census Block Including Federal Land
Form 477, Centroid, December 2016
Number of
Providers with
Coverage in a
Block
Number of
Blocks
POPs in
those
Blocks
% Total
Rural US
POPs
Square Miles
in those
Blocks
% Total
Rural US
Square
Miles
Road
Miles in
those
Blocks
% Total
Rural US
Road
Miles
U.S. Total 4,937,330 56,094,554 100.0% 2,987,281 100.0% 4,518,876 100.0%
1 or more 4,665,551 55,399,592 98.8% 2,053,426 68.7% 4,060,830 89.9%
2 or more 4,273,937 53,444,832 95.3% 1,632,801 54.7% 3,488,415 77.2%
3 or more 3,477,248 47,207,160 84.2% 1,105,642 37.0% 2,594,464 57.4%
4 or more 1,983,516 31,975,876 57.0% 457,334 15.3% 1,252,201 27.7%
Source: Based on centroid analysis of December 2016 Form 477 and 2010 Census data. Note that the number of service
providers in a census block represents network coverage only. Network coverage does not necessarily reflect the number of
service providers that actively offer service to individuals located in a given area.
Appendix III: Table II.D.xv
Estimated LTE Coverage in Non-Rural Areas by Census Block Including Federal Land
Form 477, Centroid Method, December 2016
Number of
Providers with
Coverage in a Block
Number of
Blocks
POPs in
those
Blocks
% Total
Non-
Rural US
POPs
Square
Miles in
those
Blocks
% Total
Non-Rural
US Square
Miles
Road
Miles in
those
Blocks
% Total
Non-Rural
US Road
Miles
U.S. Total 5,671,972 256,376,773 100.0% 563,570 100.0% 2,298,858 100.0%
1 or more 5,655,305 256,300,480 100.0% 540,687 95.9% 2,275,915 99.0%
2 or more 5,618,972 255,999,024 99.9% 511,583 90.8% 2,236,175 97.3%
3 or more 5,525,916 254,770,864 99.4% 470,942 83.6% 2,155,001 93.7%
4 or more 5,087,030 244,921,344 95.5% 356,118 63.2% 1,853,181 80.6%
Source: Based on centroid analysis of December 2016 Form 477 and 2010 Census data. Note that the number of service
providers in a census block represents network coverage only. Network coverage does not necessarily reflect the number of
service providers that actively offer service to individuals located in a given area.
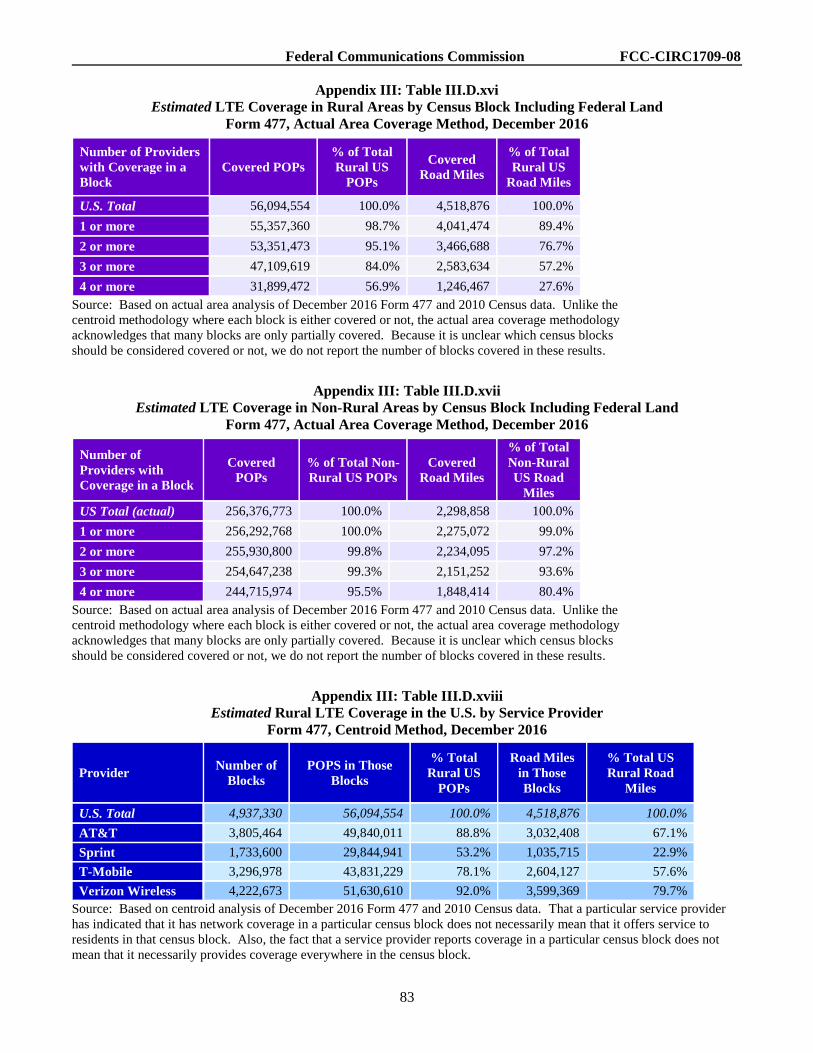
Federal Communications Commission FCC-CIRC1709-08
83
Appendix III: Table III.D.xvi
Estimated LTE Coverage in Rural Areas by Census Block Including Federal Land
Form 477, Actual Area Coverage Method, December 2016
Number of Providers
with Coverage in a
Block
Covered POPs
% of Total
Rural US
POPs
Covered
Road Miles
% of Total
Rural US
Road Miles
U.S. Total 56,094,554 100.0% 4,518,876 100.0%
1 or more 55,357,360 98.7% 4,041,474 89.4%
2 or more 53,351,473 95.1% 3,466,688 76.7%
3 or more 47,109,619 84.0% 2,583,634 57.2%
4 or more 31,899,472 56.9% 1,246,467 27.6%
Source: Based on actual area analysis of December 2016 Form 477 and 2010 Census data. Unlike the
centroid methodology where each block is either covered or not, the actual area coverage methodology
acknowledges that many blocks are only partially covered. Because it is unclear which census blocks
should be considered covered or not, we do not report the number of blocks covered in these results.
Appendix III: Table III.D.xvii
Estimated LTE Coverage in Non-Rural Areas by Census Block Including Federal Land
Form 477, Actual Area Coverage Method, December 2016
Number of
Providers with
Coverage in a Block
Covered
POPs
% of Total Non-
Rural US POPs
Covered
Road Miles
% of Total
Non-Rural
US Road
Miles
US Total (actual) 256,376,773 100.0% 2,298,858 100.0%
1 or more 256,292,768 100.0% 2,275,072 99.0%
2 or more 255,930,800 99.8% 2,234,095 97.2%
3 or more 254,647,238 99.3% 2,151,252 93.6%
4 or more 244,715,974 95.5% 1,848,414 80.4%
Source: Based on actual area analysis of December 2016 Form 477 and 2010 Census data. Unlike the
centroid methodology where each block is either covered or not, the actual area coverage methodology
acknowledges that many blocks are only partially covered. Because it is unclear which census blocks
should be considered covered or not, we do not report the number of blocks covered in these results.
Appendix III: Table III.D.xviii
Estimated Rural LTE Coverage in the U.S. by Service Provider
Form 477, Centroid Method, December 2016
Provider Number of
Blocks
POPS in Those
Blocks
% Total
Rural US
POPs
Road Miles
in Those
Blocks
% Total US
Rural Road
Miles
U.S. Total 4,937,330 56,094,554 100.0% 4,518,876 100.0%
AT&T 3,805,464 49,840,011 88.8% 3,032,408 67.1%
Sprint 1,733,600 29,844,941 53.2% 1,035,715 22.9%
T-Mobile 3,296,978 43,831,229 78.1% 2,604,127 57.6%
Verizon Wireless 4,222,673 51,630,610 92.0% 3,599,369 79.7%
Source: Based on centroid analysis of December 2016 Form 477 and 2010 Census data. That a particular service provider
has indicated that it has network coverage in a particular census block does not necessarily mean that it offers service to
residents in that census block. Also, the fact that a service provider reports coverage in a particular census block does not
mean that it necessarily provides coverage everywhere in the census block.
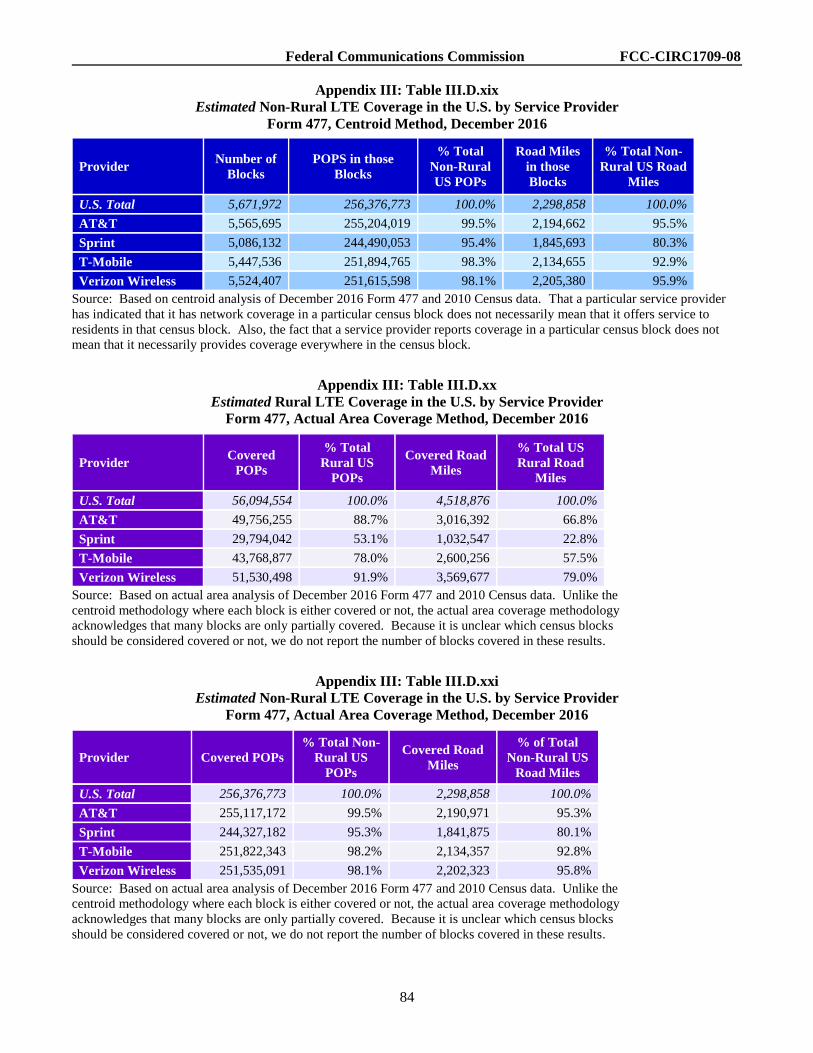
Federal Communications Commission FCC-CIRC1709-08
84
Appendix III: Table III.D.xix
Estimated Non-Rural LTE Coverage in the U.S. by Service Provider
Form 477, Centroid Method, December 2016
Provider Number of
Blocks
POPS in those
Blocks
% Total
Non-Rural
US POPs
Road Miles
in those
Blocks
% Total Non-
Rural US Road
Miles
U.S. Total 5,671,972 256,376,773 100.0% 2,298,858 100.0%
AT&T 5,565,695 255,204,019 99.5% 2,194,662 95.5%
Sprint 5,086,132 244,490,053 95.4% 1,845,693 80.3%
T-Mobile 5,447,536 251,894,765 98.3% 2,134,655 92.9%
Verizon Wireless 5,524,407 251,615,598 98.1% 2,205,380 95.9%
Source: Based on centroid analysis of December 2016 Form 477 and 2010 Census data. That a particular service provider
has indicated that it has network coverage in a particular census block does not necessarily mean that it offers service to
residents in that census block. Also, the fact that a service provider reports coverage in a particular census block does not
mean that it necessarily provides coverage everywhere in the census block.
Appendix III: Table III.D.xx
Estimated Rural LTE Coverage in the U.S. by Service Provider
Form 477, Actual Area Coverage Method, December 2016
Provider Covered
POPs
% Total
Rural US
POPs
Covered Road
Miles
% Total US
Rural Road
Miles
U.S. Total 56,094,554 100.0% 4,518,876 100.0%
AT&T 49,756,255 88.7% 3,016,392 66.8%
Sprint 29,794,042 53.1% 1,032,547 22.8%
T-Mobile 43,768,877 78.0% 2,600,256 57.5%
Verizon Wireless 51,530,498 91.9% 3,569,677 79.0%
Source: Based on actual area analysis of December 2016 Form 477 and 2010 Census data. Unlike the
centroid methodology where each block is either covered or not, the actual area coverage methodology
acknowledges that many blocks are only partially covered. Because it is unclear which census blocks
should be considered covered or not, we do not report the number of blocks covered in these results.
Appendix III: Table III.D.xxi
Estimated Non-Rural LTE Coverage in the U.S. by Service Provider
Form 477, Actual Area Coverage Method, December 2016
Provider Covered POPs
% Total Non-
Rural US
POPs
Covered Road
Miles
% of Total
Non-Rural US
Road Miles
U.S. Total 256,376,773 100.0% 2,298,858 100.0%
AT&T 255,117,172 99.5% 2,190,971 95.3%
Sprint 244,327,182 95.3% 1,841,875 80.1%
T-Mobile 251,822,343 98.2% 2,134,357 92.8%
Verizon Wireless 251,535,091 98.1% 2,202,323 95.8%
Source: Based on actual area analysis of December 2016 Form 477 and 2010 Census data. Unlike the
centroid methodology where each block is either covered or not, the actual area coverage methodology
acknowledges that many blocks are only partially covered. Because it is unclear which census blocks
should be considered covered or not, we do not report the number of blocks covered in these results.
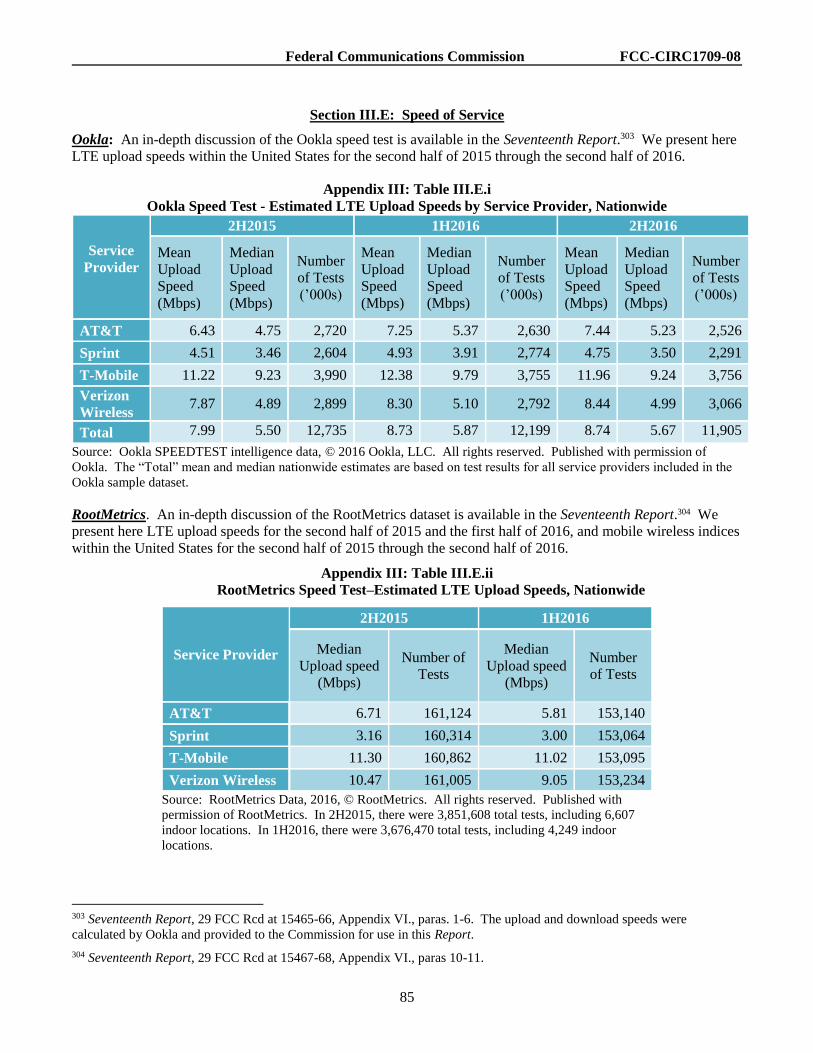
Federal Communications Commission FCC-CIRC1709-08
85
Section III.E: Speed of Service
Ookla: An in-depth discussion of the Ookla speed test is available in the Seventeenth Report.303 We present here
LTE upload speeds within the United States for the second half of 2015 through the second half of 2016.
Appendix III: Table III.E.i
Ookla Speed Test - Estimated LTE Upload Speeds by Service Provider, Nationwide
Service
Provider
2H2015 1H2016 2H2016
Mean
Upload
Speed
(Mbps)
Median
Upload
Speed
(Mbps)
Number
of Tests
(’000s)
Mean
Upload
Speed
(Mbps)
Median
Upload
Speed
(Mbps)
Number
of Tests
(’000s)
Mean
Upload
Speed
(Mbps)
Median
Upload
Speed
(Mbps)
Number
of Tests
(’000s)
AT&T 6.43 4.75 2,720 7.25 5.37 2,630 7.44 5.23 2,526
Sprint 4.51 3.46 2,604 4.93 3.91 2,774 4.75 3.50 2,291
T-Mobile 11.22 9.23 3,990 12.38 9.79 3,755 11.96 9.24 3,756
Verizon
Wireless 7.87 4.89 2,899 8.30 5.10 2,792 8.44 4.99 3,066
Total 7.99 5.50 12,735 8.73 5.87 12,199 8.74 5.67 11,905
Source: Ookla SPEEDTEST intelligence data, © 2016 Ookla, LLC. All rights reserved. Published with permission of
Ookla. The “Total” mean and median nationwide estimates are based on test results for all service providers included in the
Ookla sample dataset.
RootMetrics. An in-depth discussion of the RootMetrics dataset is available in the Seventeenth Report.304 We
present here LTE upload speeds for the second half of 2015 and the first half of 2016, and mobile wireless indices
within the United States for the second half of 2015 through the second half of 2016.
Appendix III: Table III.E.ii
RootMetrics Speed Test–Estimated LTE Upload Speeds, Nationwide
Service Provider
2H2015 1H2016
Median
Upload speed
(Mbps)
Number of
Tests
Median
Upload speed
(Mbps)
Number
of Tests
AT&T 6.71 161,124 5.81 153,140
Sprint 3.16 160,314 3.00 153,064
T-Mobile 11.30 160,862 11.02 153,095
Verizon Wireless 10.47 161,005 9.05 153,234
Source: RootMetrics Data, 2016, © RootMetrics. All rights reserved. Published with
permission of RootMetrics. In 2H2015, there were 3,851,608 total tests, including 6,607
indoor locations. In 1H2016, there were 3,676,470 total tests, including 4,249 indoor
locations.
303 Seventeenth Report, 29 FCC Rcd at 15465-66, Appendix VI., paras. 1-6. The upload and download speeds were
calculated by Ookla and provided to the Commission for use in this Report.
304 Seventeenth Report, 29 FCC Rcd at 15467-68, Appendix VI., paras 10-11.

Federal Communications Commission FCC-CIRC1709-08
86
Appendix III: Table III.E.iii
RootMetrics National Speed Index Data, 2nd Half 2015--2st Half 2016305
2nd Half 2015 1st Half 2016 2nd Half 2016
Service
Provider
Speed
Index
Data
Index
Text
Index
Speed
Index
Data
Index
Text
Index
Speed
Index
Data
Index
Text
Index
AT&T 86.8 93.2 96.5 86.1 92.8 95.6 89.6 94.4 95.3
Sprint 73.1 83.1 95.8 72.2 84.3 94.1 72.3 82.5 95.0
T-Mobile 84.7 87.1 92.2 85.8 89.9 90.8 87.1 90.6 89.1
Verizon
Wireless 92.0 95.9 97.0 91.0 95.6 96.9 93.3 96.5 96.5
Source: RootMetrics Data, © RootMetrics. All rights reserved. Published with permission of RootMetrics. In 2H2015, there
were 3,851,608 total tests, including 6,607 indoor locations. In 1H2016, there were 3,676,470 total tests, including 4,249
indoor locations. In 2H2016, there were 3,690,123 total tests, including 4,283 indoor locations.
CalSPEED. An in-depth discussion of the CalSPEED dataset is available in the Seventeenth Report.306 We
present here LTE upload speeds within California for the fall of 2015 through the fall of 2016.307
Appendix III: Table III.E.iv
CalSPEED - Estimated LTE Upload Speeds by Service Provider, California Only
Service
Provider
Fall 2015 Spring 2016 Fall 2016
Mean
LTE
Upload
Speed
(Mbps)
Median
LTE
Upload
Speed
(Mbps)
Number
of Tests
Mean
LTE
Upload
Speed
(Mbps)
Median
LTE
Upload
Speed
(Mbps)
Number
of Tests
Mean
LTE
Upload
Speed
(Mbps)
Median
LTE
Upload
Speed
(Mbps)
Number
of Tests
AT&T 5.88 5.41 3,044 5.78 5.46 1,554 6.89 6.44 1,516
Sprint 4.14 3.60 1,968 3.65 3.14 1,088 3.95 3.20 1,045
T-Mobile 7.92 9.07 2,220 6.96 7.80 1,257 7.93 8.40 1,216
Verizon
Wireless
7.59 8.16 3,124 7.28 7.80 1,583 8.16 8.77 1,626
Source: The estimated speeds are based on the CalSPEED data. Fall 2015 tests were taken between the dates of Dec. 3,
2015 and Jan. 22, 2016. Spring 2016 tests were taken between the dates of Apr. 14, 2016 and May 25, 2016. Fall 2016 tests
were taken between the dates of Sept. 29, 2016 and Nov. 4, 2016.
305 RootMetrics, Methodology, http://rootmetrics.com/en-US/methodology (last visited Sept. 1, 2017). RootMetrics performs
drive tests and stationary tests in specific locations, using the leading Android-based smartphone for each network. They
measure network reliability and speed performance across a range of activities, like checking email, browsing webpages,
using apps, making calls, and sending texts. These tests measure both download and upload speeds. The results are then
aggregated by RootMetrics, using a proprietary formula, to calculate the Speed Index.
306 Seventeenth Report, 29 FCC Rcd at 15469-70, Appendix VI., paras. 12-16.
307 In our presentation of CalSPEED data, we have dropped any observation that was not in the provider’s coverage area, or
any observation that was terminated by the tester, which corresponds to the method used by CPUC. If the test was
terminated for any other reason, we followed CPUC guidance and assumed a download speed of zero Mbps for that particular
test. Results from each site and for each provider were averaged across all east coast and west coast servers, and the top 1%
of resulting speed observations were trimmed from the dataset, by provider and separately for each time period. This is a
surveyed test and not crowdsourced, and therefore some of the cleaning criteria may be different from the other speed tests.

FCC-CIRC1709-08
1
WEB APPENDICES
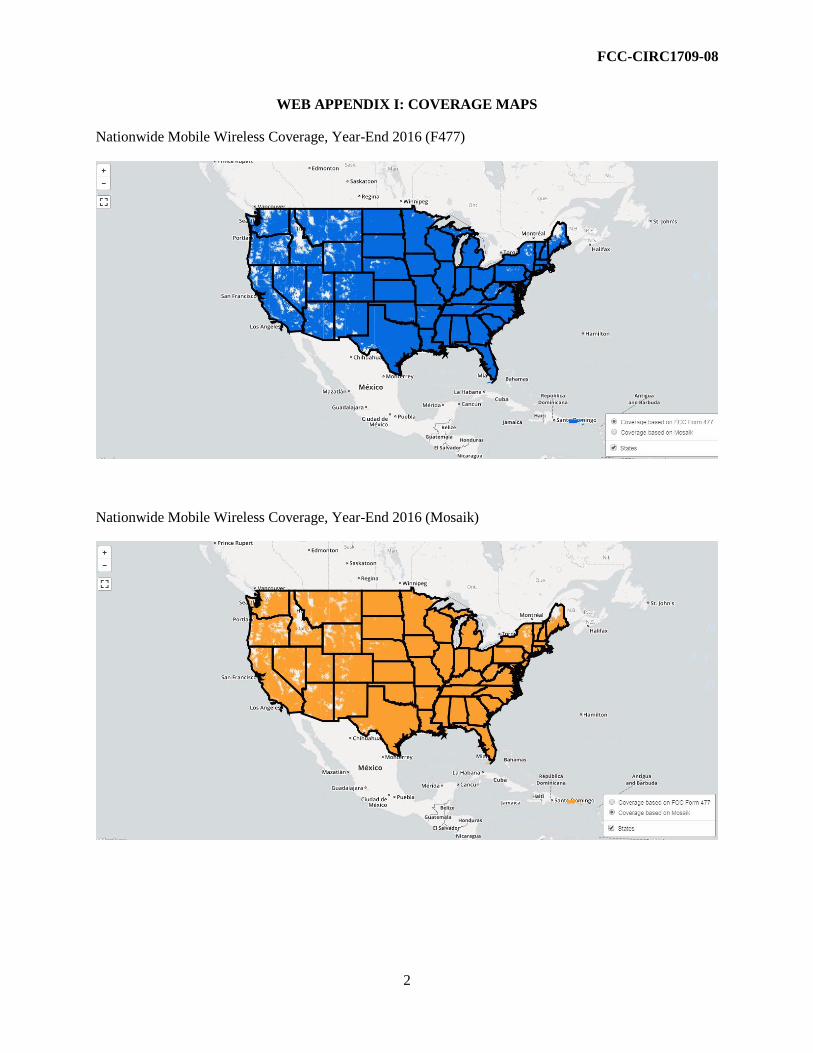
FCC-CIRC1709-08
2
WEB APPENDIX I: COVERAGE MAPS
Nationwide Mobile Wireless Coverage, Year-End 2016 (F477)
Nationwide Mobile Wireless Coverage, Year-End 2016 (Mosaik)
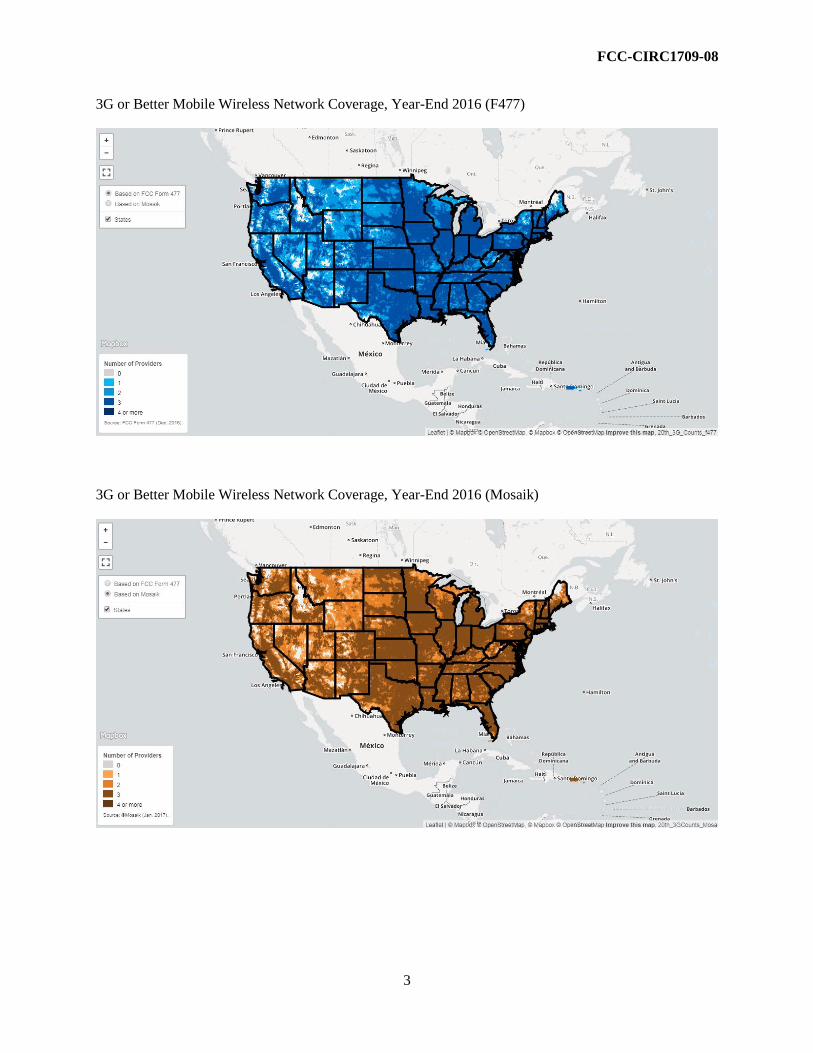
FCC-CIRC1709-08
3
3G or Better Mobile Wireless Network Coverage, Year-End 2016 (F477)
3G or Better Mobile Wireless Network Coverage, Year-End 2016 (Mosaik)

FCC-CIRC1709-08
4
Nationwide LTE Coverage, Year-End 2016 (F477)
Nationwide LTE Coverage, Year-End 2016 (Mosaik)

FCC-CIRC1709-08
5
LTE Coverage by Number of Providers, Year-End 2016 (F477)
LTE Coverage by Number of Providers, Year-End 2016 (Mosaik)
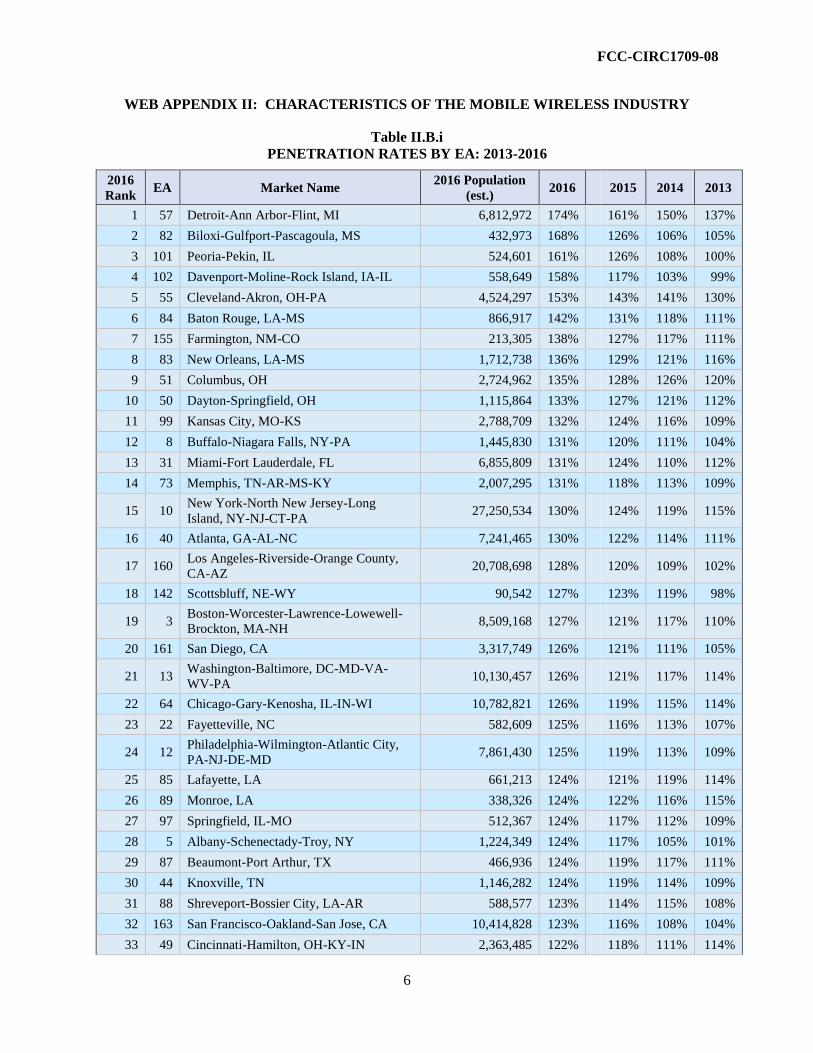
FCC-CIRC1709-08
6
WEB APPENDIX II: CHARACTERISTICS OF THE MOBILE WIRELESS INDUSTRY
Table II.B.i
PENETRATION RATES BY EA: 2013-2016
2016
Rank EA Market Name
2016 Population
(est.) 2016
2015 2014 2013
1 57 Detroit-Ann Arbor-Flint, MI 6,812,972 174% 161% 150% 137%
2 82 Biloxi-Gulfport-Pascagoula, MS 432,973 168% 126% 106% 105%
3 101 Peoria-Pekin, IL 524,601 161% 126% 108% 100%
4 102 Davenport-Moline-Rock Island, IA-IL 558,649 158% 117% 103% 99%
5 55 Cleveland-Akron, OH-PA 4,524,297 153% 143% 141% 130%
6 84 Baton Rouge, LA-MS 866,917 142% 131% 118% 111%
7 155 Farmington, NM-CO 213,305 138% 127% 117% 111%
8 83 New Orleans, LA-MS 1,712,738 136% 129% 121% 116%
9 51 Columbus, OH 2,724,962 135% 128% 126% 120%
10 50 Dayton-Springfield, OH 1,115,864 133% 127% 121% 112%
11 99 Kansas City, MO-KS 2,788,709 132% 124% 116% 109%
12 8 Buffalo-Niagara Falls, NY-PA 1,445,830 131% 120% 111% 104%
13 31 Miami-Fort Lauderdale, FL 6,855,809 131% 124% 110% 112%
14 73 Memphis, TN-AR-MS-KY 2,007,295 131% 118% 113% 109%
15 10 New York-North New Jersey-Long
Island, NY-NJ-CT-PA 27,250,534 130%
124% 119% 115%
16 40 Atlanta, GA-AL-NC 7,241,465 130% 122% 114% 111%
17 160 Los Angeles-Riverside-Orange County,
CA-AZ 20,708,698 128%
120% 109% 102%
18 142 Scottsbluff, NE-WY 90,542 127% 123% 119% 98%
19 3 Boston-Worcester-Lawrence-Lowewell-
Brockton, MA-NH 8,509,168 127%
121% 117% 110%
20 161 San Diego, CA 3,317,749 126% 121% 111% 105%
21 13 Washington-Baltimore, DC-MD-VA-
WV-PA 10,130,457 126%
121% 117% 114%
22 64 Chicago-Gary-Kenosha, IL-IN-WI 10,782,821 126% 119% 115% 114%
23 22 Fayetteville, NC 582,609 125% 116% 113% 107%
24 12 Philadelphia-Wilmington-Atlantic City,
PA-NJ-DE-MD 7,861,430 125%
119% 113% 109%
25 85 Lafayette, LA 661,213 124% 121% 119% 114%
26 89 Monroe, LA 338,326 124% 122% 116% 115%
27 97 Springfield, IL-MO 512,367 124% 117% 112% 109%
28 5 Albany-Schenectady-Troy, NY 1,224,349 124% 117% 105% 101%
29 87 Beaumont-Port Arthur, TX 466,936 124% 119% 117% 111%
30 44 Knoxville, TN 1,146,282 124% 119% 114% 109%
31 88 Shreveport-Bossier City, LA-AR 588,577 123% 114% 115% 108%
32 163 San Francisco-Oakland-San Jose, CA 10,414,828 123% 116% 108% 104%
33 49 Cincinnati-Hamilton, OH-KY-IN 2,363,485 122% 118% 111% 114%
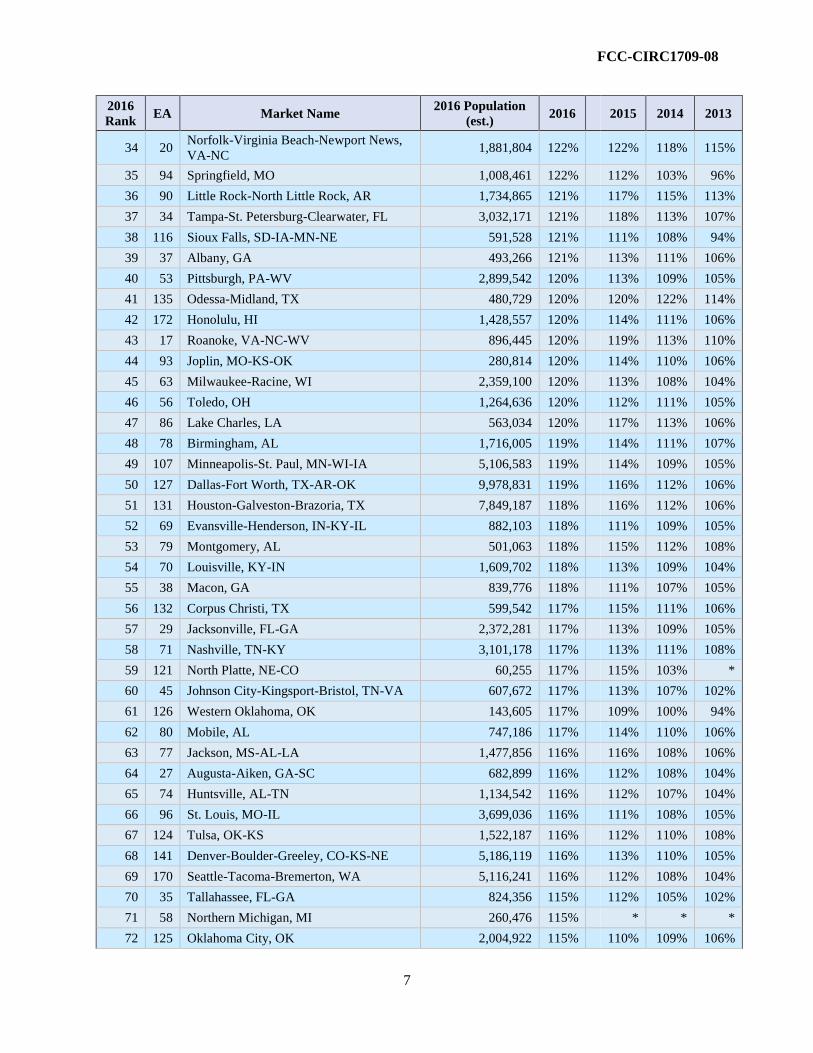
FCC-CIRC1709-08
7
2016
Rank EA Market Name
2016 Population
(est.) 2016
2015 2014 2013
34 20 Norfolk-Virginia Beach-Newport News,
VA-NC 1,881,804 122%
122% 118% 115%
35 94 Springfield, MO 1,008,461 122% 112% 103% 96%
36 90 Little Rock-North Little Rock, AR 1,734,865 121% 117% 115% 113%
37 34 Tampa-St. Petersburg-Clearwater, FL 3,032,171 121% 118% 113% 107%
38 116 Sioux Falls, SD-IA-MN-NE 591,528 121% 111% 108% 94%
39 37 Albany, GA 493,266 121% 113% 111% 106%
40 53 Pittsburgh, PA-WV 2,899,542 120% 113% 109% 105%
41 135 Odessa-Midland, TX 480,729 120% 120% 122% 114%
42 172 Honolulu, HI 1,428,557 120% 114% 111% 106%
43 17 Roanoke, VA-NC-WV 896,445 120% 119% 113% 110%
44 93 Joplin, MO-KS-OK 280,814 120% 114% 110% 106%
45 63 Milwaukee-Racine, WI 2,359,100 120% 113% 108% 104%
46 56 Toledo, OH 1,264,636 120% 112% 111% 105%
47 86 Lake Charles, LA 563,034 120% 117% 113% 106%
48 78 Birmingham, AL 1,716,005 119% 114% 111% 107%
49 107 Minneapolis-St. Paul, MN-WI-IA 5,106,583 119% 114% 109% 105%
50 127 Dallas-Fort Worth, TX-AR-OK 9,978,831 119% 116% 112% 106%
51 131 Houston-Galveston-Brazoria, TX 7,849,187 118% 116% 112% 106%
52 69 Evansville-Henderson, IN-KY-IL 882,103 118% 111% 109% 105%
53 79 Montgomery, AL 501,063 118% 115% 112% 108%
54 70 Louisville, KY-IN 1,609,702 118% 113% 109% 104%
55 38 Macon, GA 839,776 118% 111% 107% 105%
56 132 Corpus Christi, TX 599,542 117% 115% 111% 106%
57 29 Jacksonville, FL-GA 2,372,281 117% 113% 109% 105%
58 71 Nashville, TN-KY 3,101,178 117% 113% 111% 108%
59 121 North Platte, NE-CO 60,255 117% 115% 103% *
60 45 Johnson City-Kingsport-Bristol, TN-VA 607,672 117% 113% 107% 102%
61 126 Western Oklahoma, OK 143,605 117% 109% 100% 94%
62 80 Mobile, AL 747,186 117% 114% 110% 106%
63 77 Jackson, MS-AL-LA 1,477,856 116% 116% 108% 106%
64 27 Augusta-Aiken, GA-SC 682,899 116% 112% 108% 104%
65 74 Huntsville, AL-TN 1,134,542 116% 112% 107% 104%
66 96 St. Louis, MO-IL 3,699,036 116% 111% 108% 105%
67 124 Tulsa, OK-KS 1,522,187 116% 112% 110% 108%
68 141 Denver-Boulder-Greeley, CO-KS-NE 5,186,119 116% 113% 110% 105%
69 170 Seattle-Tacoma-Bremerton, WA 5,116,241 116% 112% 108% 104%
70 35 Tallahassee, FL-GA 824,356 115% 112% 105% 102%
71 58 Northern Michigan, MI 260,476 115% * * *
72 125 Oklahoma City, OK 2,004,922 115% 110% 109% 106%

FCC-CIRC1709-08
8
2016
Rank EA Market Name
2016 Population
(est.) 2016
2015 2014 2013
73 15 Richmond-Petersburg, VA 1,716,080 115% 115% 110% 107%
74 81 Pensacola, FL 752,743 115% 112% 108% 106%
75 111 Minot, ND 147,113 114% 115% 121% 113%
76 128 Abilene, TX 229,781 114% 111% 108% 102%
77 133 McAllen-Edinburg-Mission, TX 1,357,910 114% 111% 104% 99%
78 159 Tucson, AZ 1,187,961 114% 114% 111% 102%
79 76 Greenville, MS 199,048 114% 113% 99% 97%
80 23 Charlotte-Gastonia-Rock Hill, NC-SC 2,797,076 114% 109% 106% 102%
81 115 Rapid City, SD-MT-ND-NE 229,334 113% 105% 95% 87%
82 157 El Paso, TX-NM 1,154,406 113% 110% 103% 95%
83 91 Fort Smith, AR-OK 354,083 113% 108% 107% 96%
84 152 Salt Lake City-Ogden, UT-ID 2,818,226 113% 109% 106% 105%
85 134 San Antonio, TX 2,972,197 113% 111% 107% 103%
86 67 Indianapolis, IN-IL 3,461,232 113% 108% 104% 100%
87 171 Anchorage, AK 733,845 113% 111% 107% 109%
88 100 Des Moines, IA-IL-MO 1,813,380 112% 106% 100% 96%
89 153 Las Vegas, NV-AZ-UT 2,637,727 112% 108% 107% 104%
90 95 Jonesboro, AR-MO 314,002 112% 106% 102% 100%
91 24 Columbia, SC 1,102,452 112% 106% 104% 104%
92 129 San Angelo, TX 219,437 112% 104% 101% 98%
93 42 Asheville, NC 542,388 112% 106% 102% 99%
94 165 Redding, CA-OR 361,748 112% 103% 97% 93%
95 137 Lubbock, TX 426,746 112% 109% 104% 99%
96 72 Paducah, KY-IL 229,619 111% 107% 102% 98%
97 164 Sacramento-Yolo, CA 2,881,371 111% 107% 99% 96%
98 106 Rochester, MN-IA-WI 348,987 111% 106% 101% 97%
99 16 Staunton, VA-WV 368,594 111% 112% 104% 100%
100 30 Orlando, FL 5,069,124 111% 107% 104% 100%
101 6 Syracuse, NY-PA 1,889,278 111% 105% 101% 98%
102 43 Chattanooga, TN-GA 830,836 111% 106% 103% 99%
103 7 Rochester, NY-PA 1,498,428 111% 107% 103% 99%
104 28 Savannah, GA-SC 862,109 110% 104% 103% 98%
105 110 Grand Forks, ND-MN 226,400 110% 104% 98% 94%
106 130 Austin-San Marcos, TX 2,176,328 110% 108% 104% 99%
107 162 Fresno, CA 1,744,834 110% 103% 94% 87%
108 18 Greensboro-Winston-Salem-High Point,
NC-VA 2,096,200 110%
106% 103% 101%
109 75 Tupelo, MS-AL-TN 634,551 110% 107% 101% 99%
110 48 Charleston, WV-KY-OH 1,158,260 110% 107% 100% 97%
111 66 Fort Wayne, IN 759,828 110% 104% 100% 97%
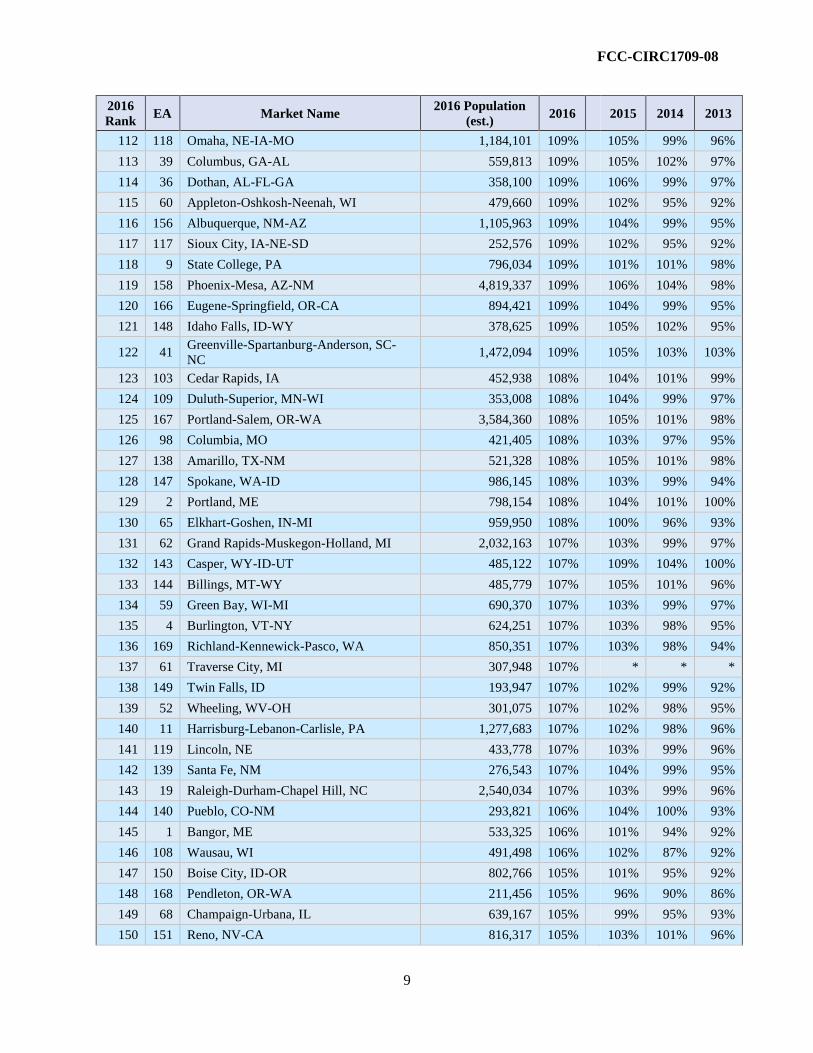
FCC-CIRC1709-08
9
2016
Rank EA Market Name
2016 Population
(est.) 2016
2015 2014 2013
112 118 Omaha, NE-IA-MO 1,184,101 109% 105% 99% 96%
113 39 Columbus, GA-AL 559,813 109% 105% 102% 97%
114 36 Dothan, AL-FL-GA 358,100 109% 106% 99% 97%
115 60 Appleton-Oshkosh-Neenah, WI 479,660 109% 102% 95% 92%
116 156 Albuquerque, NM-AZ 1,105,963 109% 104% 99% 95%
117 117 Sioux City, IA-NE-SD 252,576 109% 102% 95% 92%
118 9 State College, PA 796,034 109% 101% 101% 98%
119 158 Phoenix-Mesa, AZ-NM 4,819,337 109% 106% 104% 98%
120 166 Eugene-Springfield, OR-CA 894,421 109% 104% 99% 95%
121 148 Idaho Falls, ID-WY 378,625 109% 105% 102% 95%
122 41 Greenville-Spartanburg-Anderson, SC-
NC 1,472,094 109%
105% 103% 103%
123 103 Cedar Rapids, IA 452,938 108% 104% 101% 99%
124 109 Duluth-Superior, MN-WI 353,008 108% 104% 99% 97%
125 167 Portland-Salem, OR-WA 3,584,360 108% 105% 101% 98%
126 98 Columbia, MO 421,405 108% 103% 97% 95%
127 138 Amarillo, TX-NM 521,328 108% 105% 101% 98%
128 147 Spokane, WA-ID 986,145 108% 103% 99% 94%
129 2 Portland, ME 798,154 108% 104% 101% 100%
130 65 Elkhart-Goshen, IN-MI 959,950 108% 100% 96% 93%
131 62 Grand Rapids-Muskegon-Holland, MI 2,032,163 107% 103% 99% 97%
132 143 Casper, WY-ID-UT 485,122 107% 109% 104% 100%
133 144 Billings, MT-WY 485,779 107% 105% 101% 96%
134 59 Green Bay, WI-MI 690,370 107% 103% 99% 97%
135 4 Burlington, VT-NY 624,251 107% 103% 98% 95%
136 169 Richland-Kennewick-Pasco, WA 850,351 107% 103% 98% 94%
137 61 Traverse City, MI 307,948 107% * * *
138 149 Twin Falls, ID 193,947 107% 102% 99% 92%
139 52 Wheeling, WV-OH 301,075 107% 102% 98% 95%
140 11 Harrisburg-Lebanon-Carlisle, PA 1,277,683 107% 102% 98% 96%
141 119 Lincoln, NE 433,778 107% 103% 99% 96%
142 139 Santa Fe, NM 276,543 107% 104% 99% 95%
143 19 Raleigh-Durham-Chapel Hill, NC 2,540,034 107% 103% 99% 96%
144 140 Pueblo, CO-NM 293,821 106% 104% 100% 93%
145 1 Bangor, ME 533,325 106% 101% 94% 92%
146 108 Wausau, WI 491,498 106% 102% 87% 92%
147 150 Boise City, ID-OR 802,766 105% 101% 95% 92%
148 168 Pendleton, OR-WA 211,456 105% 96% 90% 86%
149 68 Champaign-Urbana, IL 639,167 105% 99% 95% 93%
150 151 Reno, NV-CA 816,317 105% 103% 101% 96%

FCC-CIRC1709-08
10
2016
Rank EA Market Name
2016 Population
(est.) 2016
2015 2014 2013
151 123 Topeka, KS 478,357 105% 100% 96% 93%
152 54 Erie, PA 500,905 104% 100% 96% 92%
153 113 Fargo-Moorhead, ND-MN 430,488 104% 101% 98% 92%
154 25 Wilmington, NC-SC 1,150,287 104% 101% 100% 98%
155 136 Hobbs, NM-TX 221,618 104% 103% 99% 101%
156 26 Charleston-North Charleston, SC 799,078 103% 100% 98% 98%
157 21 Greenville, NC 949,466 102% 98% 93% 90%
158 104 Madison, WI-IA-IL 1,064,098 102% 99% 94% 91%
159 154 Flagstaff, AZ-UT 500,725 102% 101% 101% 99%
160 32 Fort Myers-Cape Coral, FL 1,087,472 102% 98% 95% 93%
161 33 Sarasota-Bradenton, FL 1,002,722 100% 98% 96% 92%
162 47 Lexington, KY-TN-VA-WV 1,946,119 99% 96% 93% 90%
163 46 Hickory-Morganton, NC-TN 558,182 98% 94% 90% 89%
164 14 Salisbury, MD-DE-VA 445,286 98% 95% 92% 89%
165 105 La Crosse, WI-MN 263,568 97% 94% 89% 85%
166 145 Great Falls, MT 165,307 97% 96% 92% 90%
167 92 Fayetteville-Springdale-Rogers, AR-MO-
OK 588,728 97%
91% 88% 86%
112 Bismarck, ND-MT-SD * * * 101% *
114 Aberdeen, SD * * * * *
120 Grand Island, NE * * * * *
122 Wichita, KS-OK * * * * *
146 Missoula, MT * * * * *
Source: Based on NRUF and 2016 Census Population Estimates; EAs as defined in 1995. Asterisks are
used to withhold data to maintain firm confidentiality or where there are concerns about data reliability.

FCC-CIRC1709-08
11
WEB APPENDIX III: ELEMENTS OF INTER-FIRM RIVALRY
3G+ COVERAGE BASED ON FORM 477
BY A CERTAIN NUMBER OF SERVICE PROVIDERS
Source: Based on centroid analysis of December 2016 Form 477 and 2010 Census data. Note that the number of
service providers in a census block represents network coverage only. Network coverage does not necessarily
reflect the number of service providers that actively offer service to individuals located in a given area. The 3G/4G
technologies included are the following: EV-DO, EV-DO Rev A, WCDMA/HSPA, HSPA+, LTE, and mobile
WiMAX.
Web Table III.D.i
Estimated 3G+ Coverage by Census Block Including Federal Land
Form 477, Centroid Method, December 2016
# of
Providers
in a Block
Number of
Blocks
POPs in
Those
Blocks
% of
Total US
POPs
Square
Miles in
Those
Blocks
% of Total
US Square
Miles
Road
Miles in
Those
Blocks
% of Total
US Road
Miles
US Total 10,609,302 312,471,320 100.0% 3,550,852 100.0% 6,817,734 100.0%
1 or more 10,482,136 312,280,436 99.9% 2,823,417 79.5% 6,593,394 96.7%
2 or more 10,254,553 311,453,160 99.7% 2,506,243 70.6% 6,232,458 91.4%
3 or more 9,528,926 306,135,944 98.0% 1,911,252 53.8% 5,333,945 78.2%
4 or more 7,861,961 288,072,444 92.2% 1,096,850 30.9% 3,751,828 55.0%
Source: Based on centroid analysis of December 2016 Form 477 and 2010 Census data. Note that the number of
service providers in a census block represents network coverage only. Network coverage does not necessarily
reflect the number of service providers that actively offer service to individuals located in a given area. The 3G/4G
technologies included are the following: EV-DO, EV-DO Rev A, WCDMA/HSPA, HSPA+, LTE, and mobile
WiMAX.
99.9%
99.7%
98.0%
92.2%
96.7%
91.4%
78.2%
55.0%
79.5%
70.6%
53.8%
30.9%
0% 20% 40% 60% 80% 100%
1 or more
2 or more
3 or more
4 or more
3G+ Coverage
Nu
mb
er o
f S
erv
ice
Pro
vid
ers
wit
h
Cover
age
(Dec
emb
er 2
01
6)
Web Chart III.D.i
Estimated 3G+ Coverage by Census Block Including Federal Land
Form 477, Centroid Method, December 2016
% of U.S. Population % of U.S. Road Miles % of U.S. Square Miles
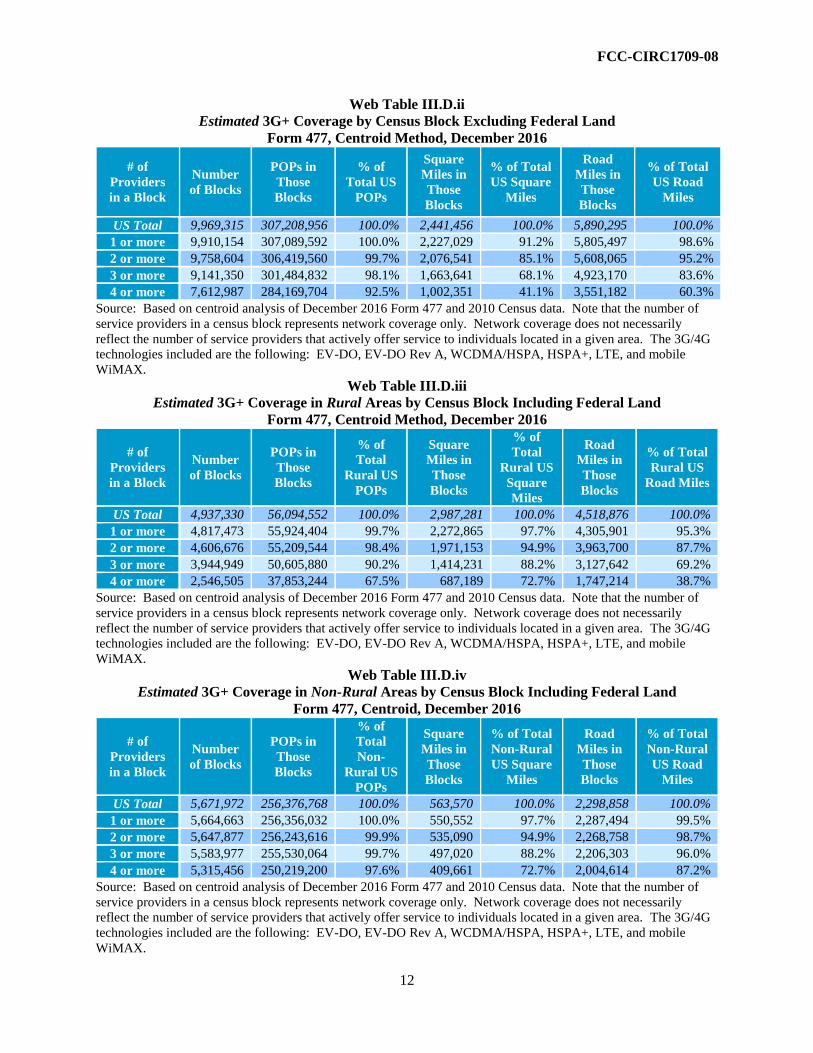
FCC-CIRC1709-08
12
Web Table III.D.ii
Estimated 3G+ Coverage by Census Block Excluding Federal Land
Form 477, Centroid Method, December 2016
# of
Providers
in a Block
Number
of Blocks
POPs in
Those
Blocks
% of
Total US
POPs
Square
Miles in
Those
Blocks
% of Total
US Square
Miles
Road
Miles in
Those
Blocks
% of Total
US Road
Miles
US Total 9,969,315 307,208,956 100.0% 2,441,456 100.0% 5,890,295 100.0%
1 or more 9,910,154 307,089,592 100.0% 2,227,029 91.2% 5,805,497 98.6%
2 or more 9,758,604 306,419,560 99.7% 2,076,541 85.1% 5,608,065 95.2%
3 or more 9,141,350 301,484,832 98.1% 1,663,641 68.1% 4,923,170 83.6%
4 or more 7,612,987 284,169,704 92.5% 1,002,351 41.1% 3,551,182 60.3%
Source: Based on centroid analysis of December 2016 Form 477 and 2010 Census data. Note that the number of
service providers in a census block represents network coverage only. Network coverage does not necessarily
reflect the number of service providers that actively offer service to individuals located in a given area. The 3G/4G
technologies included are the following: EV-DO, EV-DO Rev A, WCDMA/HSPA, HSPA+, LTE, and mobile
WiMAX.
Web Table III.D.iii
Estimated 3G+ Coverage in Rural Areas by Census Block Including Federal Land
Form 477, Centroid Method, December 2016
# of
Providers
in a Block
Number
of Blocks
POPs in
Those
Blocks
% of
Total
Rural US
POPs
Square
Miles in
Those
Blocks
% of
Total
Rural US
Square
Miles
Road
Miles in
Those
Blocks
% of Total
Rural US
Road Miles
US Total 4,937,330 56,094,552 100.0% 2,987,281 100.0% 4,518,876 100.0%
1 or more 4,817,473 55,924,404 99.7% 2,272,865 97.7% 4,305,901 95.3%
2 or more 4,606,676 55,209,544 98.4% 1,971,153 94.9% 3,963,700 87.7%
3 or more 3,944,949 50,605,880 90.2% 1,414,231 88.2% 3,127,642 69.2%
4 or more 2,546,505 37,853,244 67.5% 687,189 72.7% 1,747,214 38.7%
Source: Based on centroid analysis of December 2016 Form 477 and 2010 Census data. Note that the number of
service providers in a census block represents network coverage only. Network coverage does not necessarily
reflect the number of service providers that actively offer service to individuals located in a given area. The 3G/4G
technologies included are the following: EV-DO, EV-DO Rev A, WCDMA/HSPA, HSPA+, LTE, and mobile
WiMAX.
Web Table III.D.iv
Estimated 3G+ Coverage in Non-Rural Areas by Census Block Including Federal Land
Form 477, Centroid, December 2016
# of
Providers
in a Block
Number
of Blocks
POPs in
Those
Blocks
% of
Total
Non-
Rural US
POPs
Square
Miles in
Those
Blocks
% of Total
Non-Rural
US Square
Miles
Road
Miles in
Those
Blocks
% of Total
Non-Rural
US Road
Miles
US Total 5,671,972 256,376,768 100.0% 563,570 100.0% 2,298,858 100.0%
1 or more 5,664,663 256,356,032 100.0% 550,552 97.7% 2,287,494 99.5%
2 or more 5,647,877 256,243,616 99.9% 535,090 94.9% 2,268,758 98.7%
3 or more 5,583,977 255,530,064 99.7% 497,020 88.2% 2,206,303 96.0%
4 or more 5,315,456 250,219,200 97.6% 409,661 72.7% 2,004,614 87.2%
Source: Based on centroid analysis of December 2016 Form 477 and 2010 Census data. Note that the number of
service providers in a census block represents network coverage only. Network coverage does not necessarily
reflect the number of service providers that actively offer service to individuals located in a given area. The 3G/4G
technologies included are the following: EV-DO, EV-DO Rev A, WCDMA/HSPA, HSPA+, LTE, and mobile
WiMAX.

FCC-CIRC1709-08
13
Source: Based on centroid analysis of December 2016 Form 477 and 2010 Census data. Note that the number of
service providers in a census block represents network coverage only. Network coverage does not necessarily
reflect the number of service providers that actively offer service to individuals located in a given area. The 3G/4G
technologies included are the following: EV-DO, EV-DO Rev A, WCDMA/HSPA, HSPA+, LTE, and mobile
WiMAX.
100.0%
99.9%
99.7%
97.6%
99.7%
98.4%
90.2%
67.5%
0% 20% 40% 60% 80% 100%
1 or more
2 or more
3 or more
4 or more
3G+ Coverage
Nu
mb
er o
f S
erv
ice
Pro
vid
ers
wit
h C
ov
era
ge
(Dec
emb
er 2
016)
Web Chart III.D.ii
Estimated 3G+ Coverage by Census Block Including Federal Land in
Rural vs. Non-Rural Areas
Form 477, Centroid Method, December 2016
% of U.S. Non-Rural POPs % of U.S. Rural POPs
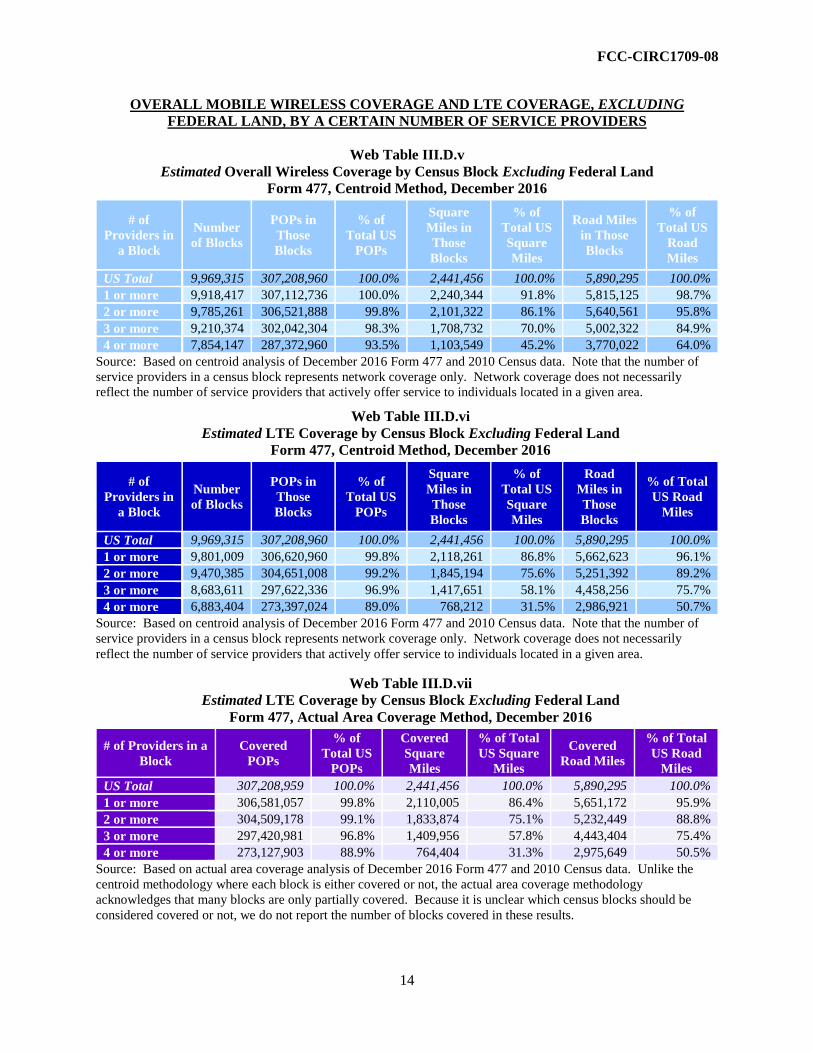
FCC-CIRC1709-08
14
OVERALL MOBILE WIRELESS COVERAGE AND LTE COVERAGE, EXCLUDING
FEDERAL LAND, BY A CERTAIN NUMBER OF SERVICE PROVIDERS
Web Table III.D.v
Estimated Overall Wireless Coverage by Census Block Excluding Federal Land
Form 477, Centroid Method, December 2016
# of
Providers in
a Block
Number
of Blocks
POPs in
Those
Blocks
% of
Total US
POPs
Square
Miles in
Those
Blocks
% of
Total US
Square
Miles
Road Miles
in Those
Blocks
% of
Total US
Road
Miles
US Total 9,969,315 307,208,960 100.0% 2,441,456 100.0% 5,890,295 100.0%
1 or more 9,918,417 307,112,736 100.0% 2,240,344 91.8% 5,815,125 98.7%
2 or more 9,785,261 306,521,888 99.8% 2,101,322 86.1% 5,640,561 95.8%
3 or more 9,210,374 302,042,304 98.3% 1,708,732 70.0% 5,002,322 84.9%
4 or more 7,854,147 287,372,960 93.5% 1,103,549 45.2% 3,770,022 64.0%
Source: Based on centroid analysis of December 2016 Form 477 and 2010 Census data. Note that the number of
service providers in a census block represents network coverage only. Network coverage does not necessarily
reflect the number of service providers that actively offer service to individuals located in a given area.
Web Table III.D.vi
Estimated LTE Coverage by Census Block Excluding Federal Land
Form 477, Centroid Method, December 2016
# of
Providers in
a Block
Number
of Blocks
POPs in
Those
Blocks
% of
Total US
POPs
Square
Miles in
Those
Blocks
% of
Total US
Square
Miles
Road
Miles in
Those
Blocks
% of Total
US Road
Miles
US Total 9,969,315 307,208,960 100.0% 2,441,456 100.0% 5,890,295 100.0%
1 or more 9,801,009 306,620,960 99.8% 2,118,261 86.8% 5,662,623 96.1%
2 or more 9,470,385 304,651,008 99.2% 1,845,194 75.6% 5,251,392 89.2%
3 or more 8,683,611 297,622,336 96.9% 1,417,651 58.1% 4,458,256 75.7%
4 or more 6,883,404 273,397,024 89.0% 768,212 31.5% 2,986,921 50.7%
Source: Based on centroid analysis of December 2016 Form 477 and 2010 Census data. Note that the number of
service providers in a census block represents network coverage only. Network coverage does not necessarily
reflect the number of service providers that actively offer service to individuals located in a given area.
Web Table III.D.vii
Estimated LTE Coverage by Census Block Excluding Federal Land
Form 477, Actual Area Coverage Method, December 2016
# of Providers in a
Block
Covered
POPs
% of
Total US
POPs
Covered
Square
Miles
% of Total
US Square
Miles
Covered
Road Miles
% of Total
US Road
Miles
US Total 307,208,959 100.0% 2,441,456 100.0% 5,890,295 100.0%
1 or more 306,581,057 99.8% 2,110,005 86.4% 5,651,172 95.9%
2 or more 304,509,178 99.1% 1,833,874 75.1% 5,232,449 88.8%
3 or more 297,420,981 96.8% 1,409,956 57.8% 4,443,404 75.4%
4 or more 273,127,903 88.9% 764,404 31.3% 2,975,649 50.5%
Source: Based on actual area coverage analysis of December 2016 Form 477 and 2010 Census data. Unlike the
centroid methodology where each block is either covered or not, the actual area coverage methodology
acknowledges that many blocks are only partially covered. Because it is unclear which census blocks should be
considered covered or not, we do not report the number of blocks covered in these results.
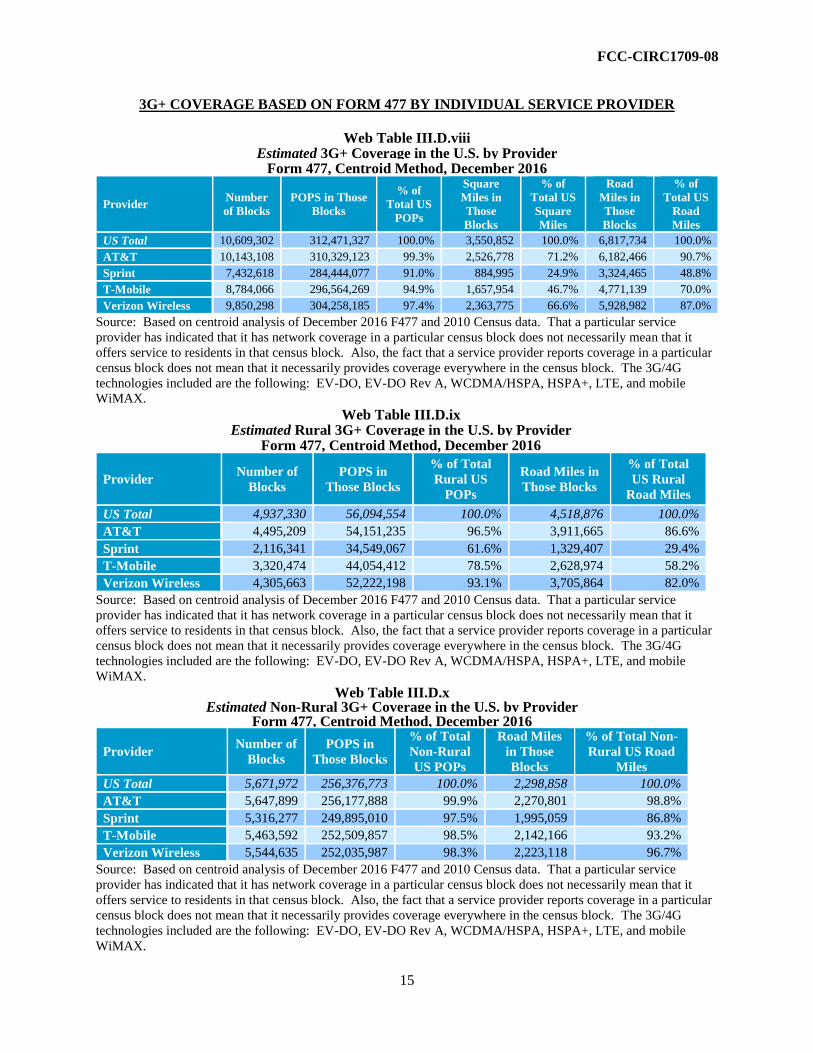
FCC-CIRC1709-08
15
3G+ COVERAGE BASED ON FORM 477 BY INDIVIDUAL SERVICE PROVIDER
Web Table III.D.viii Estimated 3G+ Coverage in the U.S. by Provider
Form 477, Centroid Method, December 2016
Provider Number
of Blocks
POPS in Those
Blocks
% of
Total US
POPs
Square
Miles in
Those
Blocks
% of
Total US
Square
Miles
Road
Miles in
Those
Blocks
% of
Total US
Road
Miles
US Total 10,609,302 312,471,327 100.0% 3,550,852 100.0% 6,817,734 100.0%
AT&T 10,143,108 310,329,123 99.3% 2,526,778 71.2% 6,182,466 90.7%
Sprint 7,432,618 284,444,077 91.0% 884,995 24.9% 3,324,465 48.8%
T-Mobile 8,784,066 296,564,269 94.9% 1,657,954 46.7% 4,771,139 70.0%
Verizon Wireless 9,850,298 304,258,185 97.4% 2,363,775 66.6% 5,928,982 87.0%
Source: Based on centroid analysis of December 2016 F477 and 2010 Census data. That a particular service
provider has indicated that it has network coverage in a particular census block does not necessarily mean that it
offers service to residents in that census block. Also, the fact that a service provider reports coverage in a particular
census block does not mean that it necessarily provides coverage everywhere in the census block. The 3G/4G
technologies included are the following: EV-DO, EV-DO Rev A, WCDMA/HSPA, HSPA+, LTE, and mobile
WiMAX.
Web Table III.D.ix Estimated Rural 3G+ Coverage in the U.S. by Provider
Form 477, Centroid Method, December 2016
Provider Number of
Blocks
POPS in
Those Blocks
% of Total
Rural US
POPs
Road Miles in
Those Blocks
% of Total
US Rural
Road Miles
US Total 4,937,330 56,094,554 100.0% 4,518,876 100.0%
AT&T 4,495,209 54,151,235 96.5% 3,911,665 86.6%
Sprint 2,116,341 34,549,067 61.6% 1,329,407 29.4%
T-Mobile 3,320,474 44,054,412 78.5% 2,628,974 58.2%
Verizon Wireless 4,305,663 52,222,198 93.1% 3,705,864 82.0%
Source: Based on centroid analysis of December 2016 F477 and 2010 Census data. That a particular service
provider has indicated that it has network coverage in a particular census block does not necessarily mean that it
offers service to residents in that census block. Also, the fact that a service provider reports coverage in a particular
census block does not mean that it necessarily provides coverage everywhere in the census block. The 3G/4G
technologies included are the following: EV-DO, EV-DO Rev A, WCDMA/HSPA, HSPA+, LTE, and mobile
WiMAX.
Web Table III.D.x Estimated Non-Rural 3G+ Coverage in the U.S. by Provider
Form 477, Centroid Method, December 2016
Provider Number of
Blocks
POPS in
Those Blocks
% of Total
Non-Rural
US POPs
Road Miles
in Those
Blocks
% of Total Non-
Rural US Road
Miles
US Total 5,671,972 256,376,773 100.0% 2,298,858 100.0%
AT&T 5,647,899 256,177,888 99.9% 2,270,801 98.8%
Sprint 5,316,277 249,895,010 97.5% 1,995,059 86.8%
T-Mobile 5,463,592 252,509,857 98.5% 2,142,166 93.2%
Verizon Wireless 5,544,635 252,035,987 98.3% 2,223,118 96.7%
Source: Based on centroid analysis of December 2016 F477 and 2010 Census data. That a particular service
provider has indicated that it has network coverage in a particular census block does not necessarily mean that it
offers service to residents in that census block. Also, the fact that a service provider reports coverage in a particular
census block does not mean that it necessarily provides coverage everywhere in the census block. The 3G/4G
technologies included are the following: EV-DO, EV-DO Rev A, WCDMA/HSPA, HSPA+, LTE, and mobile
WiMAX.
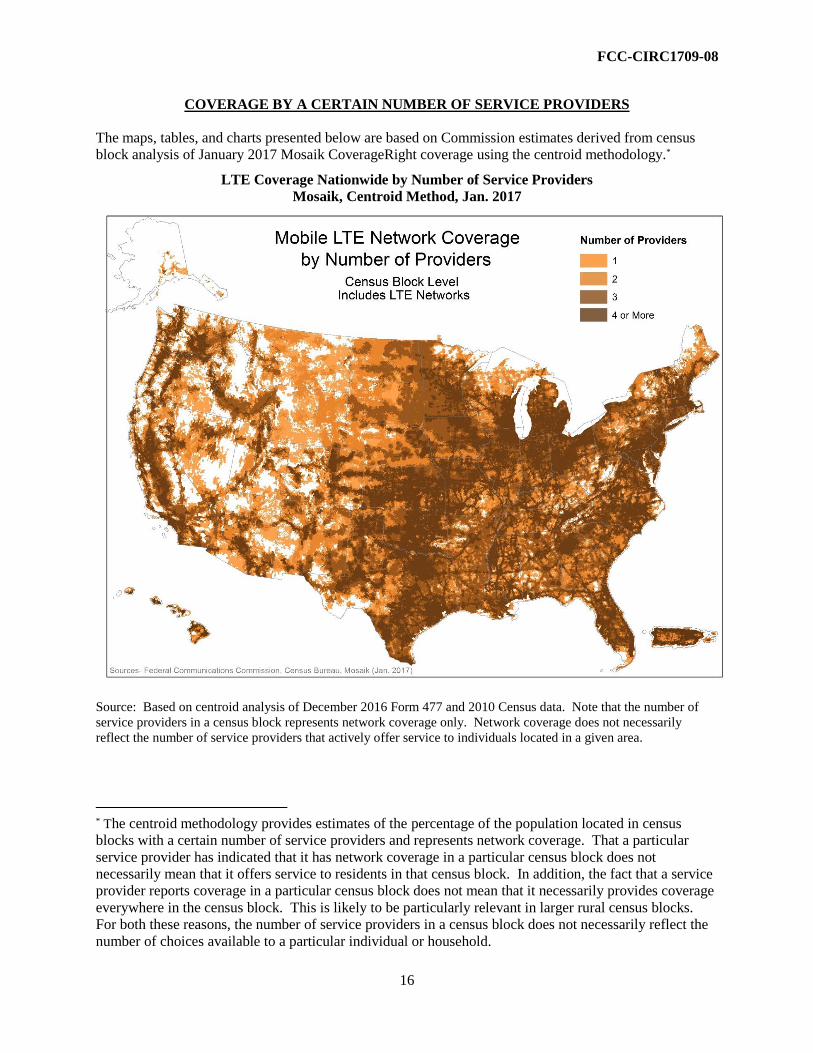
FCC-CIRC1709-08
16
COVERAGE BY A CERTAIN NUMBER OF SERVICE PROVIDERS
The maps, tables, and charts presented below are based on Commission estimates derived from census
block analysis of January 2017 Mosaik CoverageRight coverage using the centroid methodology.*
LTE Coverage Nationwide by Number of Service Providers
Mosaik, Centroid Method, Jan. 2017
Source: Based on centroid analysis of December 2016 Form 477 and 2010 Census data. Note that the number of
service providers in a census block represents network coverage only. Network coverage does not necessarily
reflect the number of service providers that actively offer service to individuals located in a given area.
* The centroid methodology provides estimates of the percentage of the population located in census
blocks with a certain number of service providers and represents network coverage. That a particular
service provider has indicated that it has network coverage in a particular census block does not
necessarily mean that it offers service to residents in that census block. In addition, the fact that a service
provider reports coverage in a particular census block does not mean that it necessarily provides coverage
everywhere in the census block. This is likely to be particularly relevant in larger rural census blocks.
For both these reasons, the number of service providers in a census block does not necessarily reflect the
number of choices available to a particular individual or household.
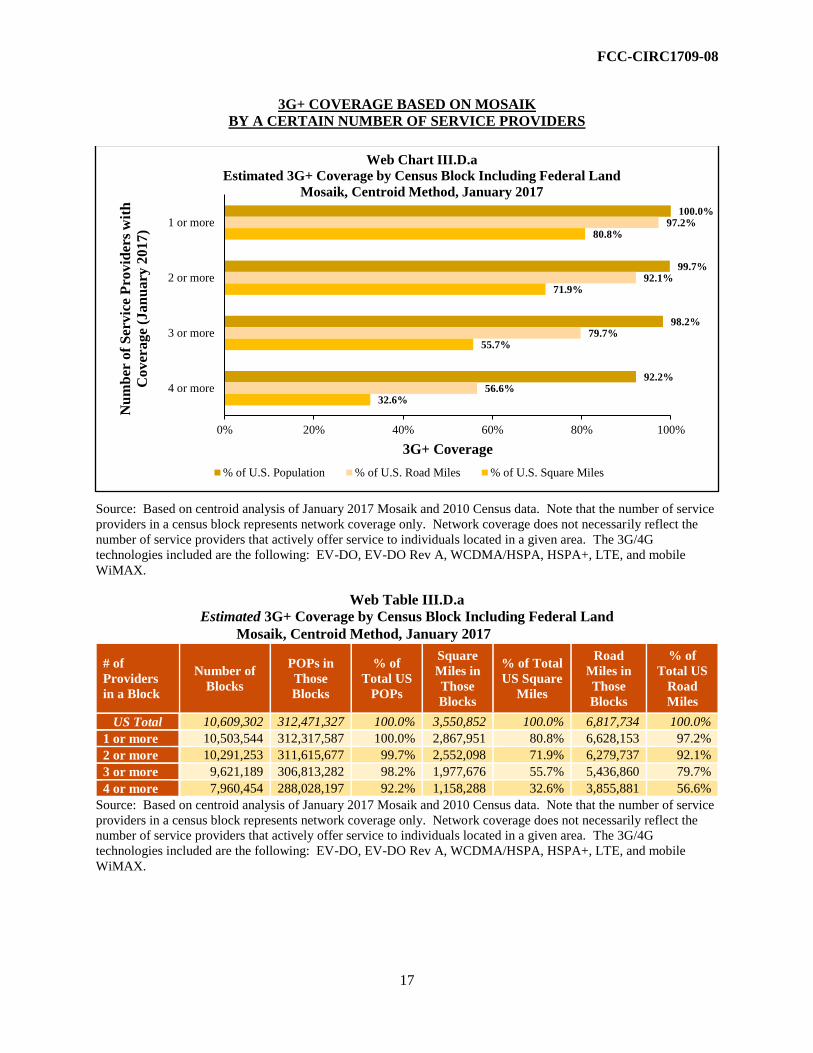
FCC-CIRC1709-08
17
3G+ COVERAGE BASED ON MOSAIK
BY A CERTAIN NUMBER OF SERVICE PROVIDERS
Source: Based on centroid analysis of January 2017 Mosaik and 2010 Census data. Note that the number of service
providers in a census block represents network coverage only. Network coverage does not necessarily reflect the
number of service providers that actively offer service to individuals located in a given area. The 3G/4G
technologies included are the following: EV-DO, EV-DO Rev A, WCDMA/HSPA, HSPA+, LTE, and mobile
WiMAX.
Web Table III.D.a
Estimated 3G+ Coverage by Census Block Including Federal Land
Mosaik, Centroid Method, January 2017
# of
Providers
in a Block
Number of
Blocks
POPs in
Those
Blocks
% of
Total US
POPs
Square
Miles in
Those
Blocks
% of Total
US Square
Miles
Road
Miles in
Those
Blocks
% of
Total US
Road
Miles
US Total 10,609,302 312,471,327 100.0% 3,550,852 100.0% 6,817,734 100.0%
1 or more 10,503,544 312,317,587 100.0% 2,867,951 80.8% 6,628,153 97.2%
2 or more 10,291,253 311,615,677 99.7% 2,552,098 71.9% 6,279,737 92.1%
3 or more 9,621,189 306,813,282 98.2% 1,977,676 55.7% 5,436,860 79.7%
4 or more 7,960,454 288,028,197 92.2% 1,158,288 32.6% 3,855,881 56.6%
Source: Based on centroid analysis of January 2017 Mosaik and 2010 Census data. Note that the number of service
providers in a census block represents network coverage only. Network coverage does not necessarily reflect the
number of service providers that actively offer service to individuals located in a given area. The 3G/4G
technologies included are the following: EV-DO, EV-DO Rev A, WCDMA/HSPA, HSPA+, LTE, and mobile
WiMAX.
100.0%
99.7%
98.2%
92.2%
97.2%
92.1%
79.7%
56.6%
80.8%
71.9%
55.7%
32.6%
0% 20% 40% 60% 80% 100%
1 or more
2 or more
3 or more
4 or more
3G+ Coverage
Nu
mb
er o
f S
erv
ice
Pro
vid
ers
wit
h
Co
ver
ag
e (J
an
ua
ry 2
01
7)
Web Chart III.D.a
Estimated 3G+ Coverage by Census Block Including Federal Land
Mosaik, Centroid Method, January 2017
% of U.S. Population % of U.S. Road Miles % of U.S. Square Miles
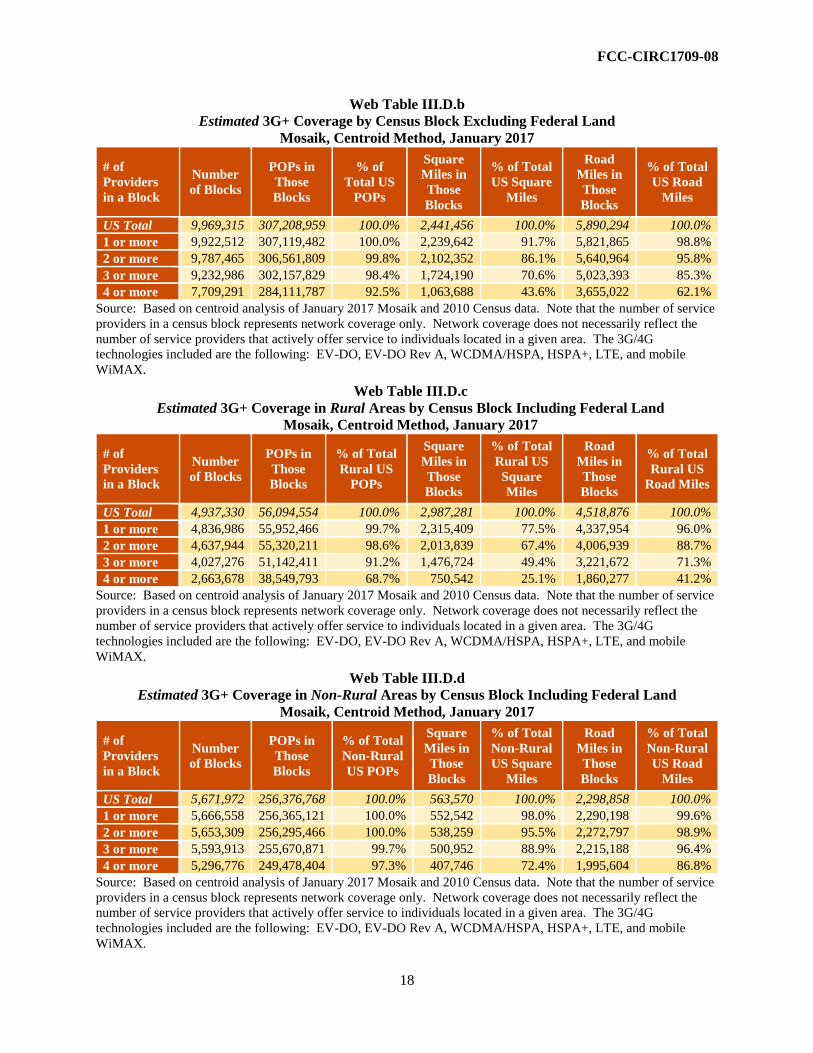
FCC-CIRC1709-08
18
Web Table III.D.b
Estimated 3G+ Coverage by Census Block Excluding Federal Land
Mosaik, Centroid Method, January 2017
# of
Providers
in a Block
Number
of Blocks
POPs in
Those
Blocks
% of
Total US
POPs
Square
Miles in
Those
Blocks
% of Total
US Square
Miles
Road
Miles in
Those
Blocks
% of Total
US Road
Miles
US Total 9,969,315 307,208,959 100.0% 2,441,456 100.0% 5,890,294 100.0%
1 or more 9,922,512 307,119,482 100.0% 2,239,642 91.7% 5,821,865 98.8%
2 or more 9,787,465 306,561,809 99.8% 2,102,352 86.1% 5,640,964 95.8%
3 or more 9,232,986 302,157,829 98.4% 1,724,190 70.6% 5,023,393 85.3%
4 or more 7,709,291 284,111,787 92.5% 1,063,688 43.6% 3,655,022 62.1%
Source: Based on centroid analysis of January 2017 Mosaik and 2010 Census data. Note that the number of service
providers in a census block represents network coverage only. Network coverage does not necessarily reflect the
number of service providers that actively offer service to individuals located in a given area. The 3G/4G
technologies included are the following: EV-DO, EV-DO Rev A, WCDMA/HSPA, HSPA+, LTE, and mobile
WiMAX.
Web Table III.D.c
Estimated 3G+ Coverage in Rural Areas by Census Block Including Federal Land
Mosaik, Centroid Method, January 2017
# of
Providers
in a Block
Number
of Blocks
POPs in
Those
Blocks
% of Total
Rural US
POPs
Square
Miles in
Those
Blocks
% of Total
Rural US
Square
Miles
Road
Miles in
Those
Blocks
% of Total
Rural US
Road Miles
US Total 4,937,330 56,094,554 100.0% 2,987,281 100.0% 4,518,876 100.0%
1 or more 4,836,986 55,952,466 99.7% 2,315,409 77.5% 4,337,954 96.0%
2 or more 4,637,944 55,320,211 98.6% 2,013,839 67.4% 4,006,939 88.7%
3 or more 4,027,276 51,142,411 91.2% 1,476,724 49.4% 3,221,672 71.3%
4 or more 2,663,678 38,549,793 68.7% 750,542 25.1% 1,860,277 41.2%
Source: Based on centroid analysis of January 2017 Mosaik and 2010 Census data. Note that the number of service
providers in a census block represents network coverage only. Network coverage does not necessarily reflect the
number of service providers that actively offer service to individuals located in a given area. The 3G/4G
technologies included are the following: EV-DO, EV-DO Rev A, WCDMA/HSPA, HSPA+, LTE, and mobile
WiMAX.
Web Table III.D.d
Estimated 3G+ Coverage in Non-Rural Areas by Census Block Including Federal Land
Mosaik, Centroid Method, January 2017
# of
Providers
in a Block
Number
of Blocks
POPs in
Those
Blocks
% of Total
Non-Rural
US POPs
Square
Miles in
Those
Blocks
% of Total
Non-Rural
US Square
Miles
Road
Miles in
Those
Blocks
% of Total
Non-Rural
US Road
Miles
US Total 5,671,972 256,376,768 100.0% 563,570 100.0% 2,298,858 100.0%
1 or more 5,666,558 256,365,121 100.0% 552,542 98.0% 2,290,198 99.6%
2 or more 5,653,309 256,295,466 100.0% 538,259 95.5% 2,272,797 98.9%
3 or more 5,593,913 255,670,871 99.7% 500,952 88.9% 2,215,188 96.4%
4 or more 5,296,776 249,478,404 97.3% 407,746 72.4% 1,995,604 86.8%
Source: Based on centroid analysis of January 2017 Mosaik and 2010 Census data. Note that the number of service
providers in a census block represents network coverage only. Network coverage does not necessarily reflect the
number of service providers that actively offer service to individuals located in a given area. The 3G/4G
technologies included are the following: EV-DO, EV-DO Rev A, WCDMA/HSPA, HSPA+, LTE, and mobile
WiMAX.
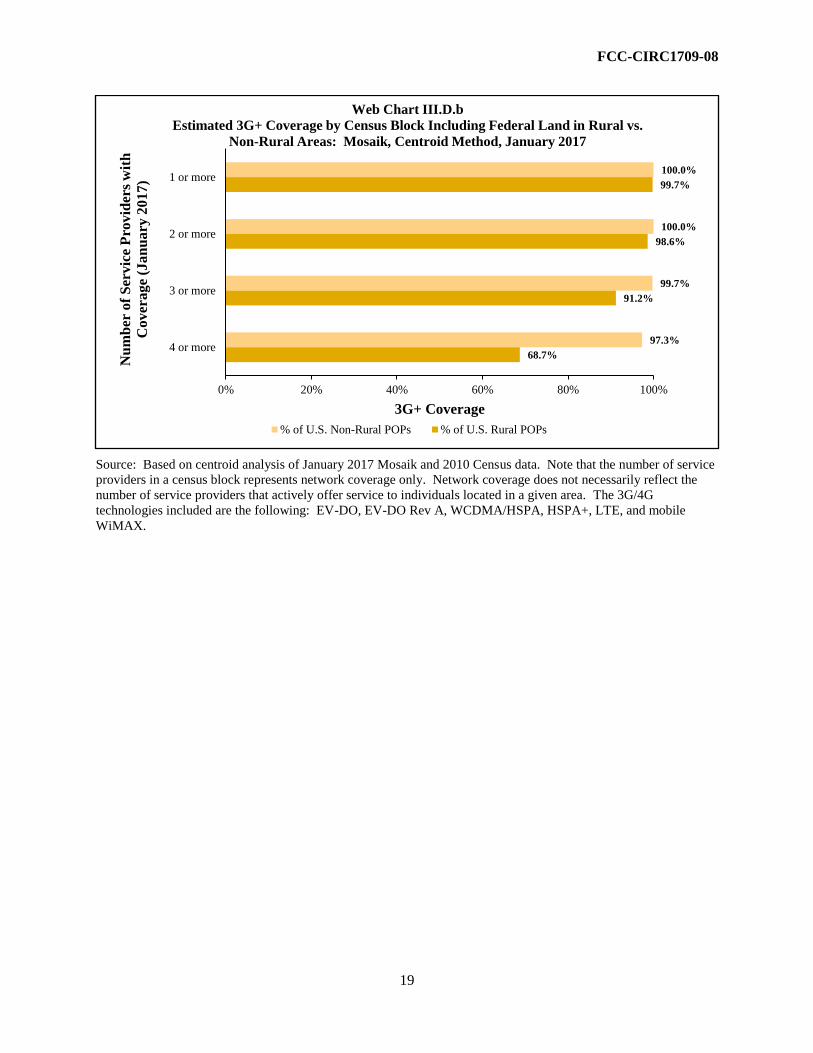
FCC-CIRC1709-08
19
Source: Based on centroid analysis of January 2017 Mosaik and 2010 Census data. Note that the number of service
providers in a census block represents network coverage only. Network coverage does not necessarily reflect the
number of service providers that actively offer service to individuals located in a given area. The 3G/4G
technologies included are the following: EV-DO, EV-DO Rev A, WCDMA/HSPA, HSPA+, LTE, and mobile
WiMAX.
100.0%
100.0%
99.7%
97.3%
99.7%
98.6%
91.2%
68.7%
0% 20% 40% 60% 80% 100%
1 or more
2 or more
3 or more
4 or more
3G+ Coverage
Nu
mb
er o
f S
erv
ice
Pro
vid
ers
wit
h
Co
ver
ag
e (J
an
ua
ry 2
01
7)
Web Chart III.D.b
Estimated 3G+ Coverage by Census Block Including Federal Land in Rural vs.
Non-Rural Areas: Mosaik, Centroid Method, January 2017
% of U.S. Non-Rural POPs % of U.S. Rural POPs

FCC-CIRC1709-08
20
OVERALL MOBILE WIRELESS COVERAGE
AND LTE COVERAGE, INCLUDING FEDERAL LAND
BY A CERTAIN NUMBER OF SERVICE PROVIDERS
Source: Based on centroid analysis of January 2017 Mosaik and 2010 Census data. Note that the number of
service providers in a census block represents network coverage only. Network coverage does not necessarily
reflect the number of service providers that actively offer service to individuals located in a given area.
Web Table III.D.e
Estimated Overall Wireless Coverage by Census Block Including Federal Land
Mosaik, Centroid Method, January 2017
Number of
Providers in a
Block
Number
of Blocks
POPs in
those
Blocks
% Total
US POPs
Square
Miles in
those
Blocks
% Total US
Square
Miles
Road
Miles in
those
Blocks
% Total US
Road Miles
U.S. Total 10,609,302 312,471,327 100.0% 3,550,852 100.0% 6,817,734 100.0%
1 or more 10,513,226 312,357,440 100.0% 2,898,568 81.6% 6,644,223 97.5%
2 or more 10,319,009 311,725,120 99.8% 2,599,435 73.2% 6,326,331 92.8%
3 or more 9,728,333 307,804,864 98.5% 2,053,932 57.8% 5,559,100 81.5%
4 or more 8,224,240 291,409,120 93.3% 1,268,979 35.7% 4,087,802 60.0%
Source: Based on centroid analysis of January 2017 Mosaik and 2010 Census data. Note that the number of
service providers in a census block represents network coverage only. Network coverage does not necessarily
reflect the number of service providers that actively offer service to individuals located in a given area.
100.0%
99.8%
98.5%
93.3%
97.5%
92.8%
81.5%
60.0%
81.6%
73.2%
57.8%
35.7%
0% 10% 20% 30% 40% 50% 60% 70% 80% 90% 100%
1 or more
2 or more
3 or more
4 or more
Wireless Coverage
Nu
mb
er o
f S
erv
ice
Pro
vid
ers
wit
h
Cover
ag
e (J
an
ua
ry 2
01
7)
Web Chart III.D.c
Estimated Overall Wireless Coverage by Census Block Including Federal Land
Mosaik, Centroid Method, January 2017
% of U.S. Population % of U.S. Road Miles % of U.S. Square Miles
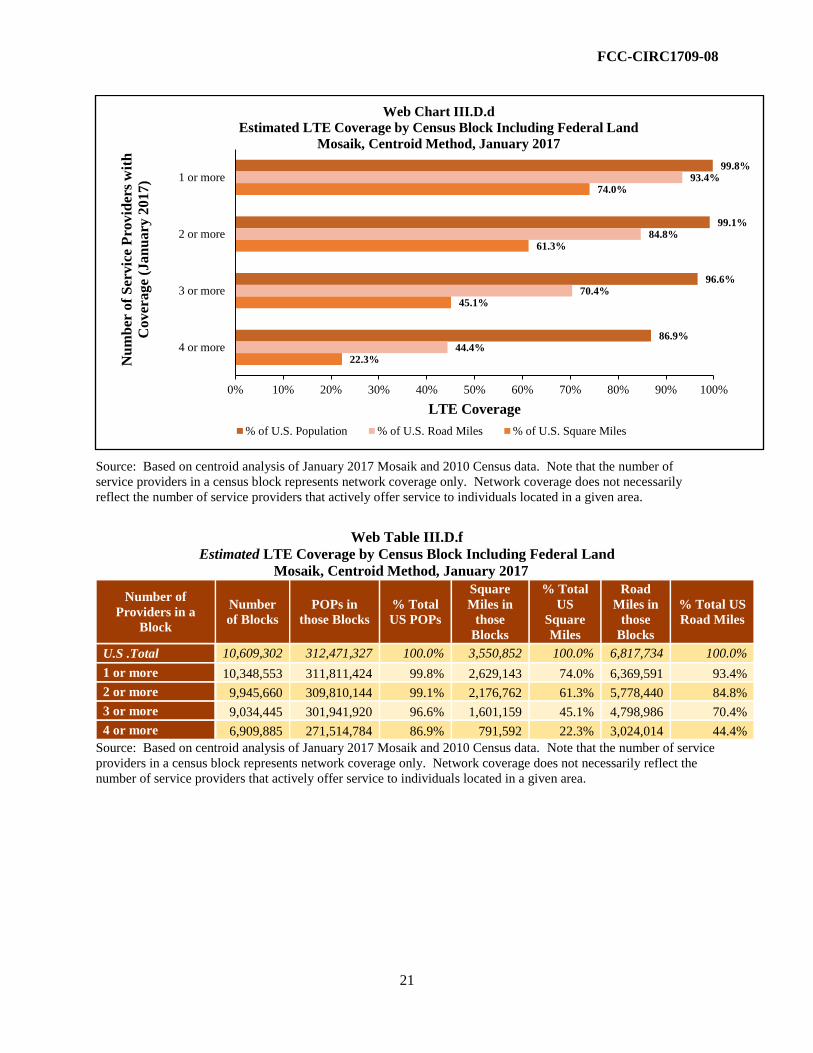
FCC-CIRC1709-08
21
Source: Based on centroid analysis of January 2017 Mosaik and 2010 Census data. Note that the number of
service providers in a census block represents network coverage only. Network coverage does not necessarily
reflect the number of service providers that actively offer service to individuals located in a given area.
Web Table III.D.f
Estimated LTE Coverage by Census Block Including Federal Land
Mosaik, Centroid Method, January 2017
Number of
Providers in a
Block
Number
of Blocks
POPs in
those Blocks
% Total
US POPs
Square
Miles in
those
Blocks
% Total
US
Square
Miles
Road
Miles in
those
Blocks
% Total US
Road Miles
U.S .Total 10,609,302 312,471,327 100.0% 3,550,852 100.0% 6,817,734 100.0%
1 or more 10,348,553 311,811,424 99.8% 2,629,143 74.0% 6,369,591 93.4%
2 or more 9,945,660 309,810,144 99.1% 2,176,762 61.3% 5,778,440 84.8%
3 or more 9,034,445 301,941,920 96.6% 1,601,159 45.1% 4,798,986 70.4%
4 or more 6,909,885 271,514,784 86.9% 791,592 22.3% 3,024,014 44.4%
Source: Based on centroid analysis of January 2017 Mosaik and 2010 Census data. Note that the number of service
providers in a census block represents network coverage only. Network coverage does not necessarily reflect the
number of service providers that actively offer service to individuals located in a given area.
99.8%
99.1%
96.6%
86.9%
93.4%
84.8%
70.4%
44.4%
74.0%
61.3%
45.1%
22.3%
0% 10% 20% 30% 40% 50% 60% 70% 80% 90% 100%
1 or more
2 or more
3 or more
4 or more
LTE Coverage
Nu
mb
er o
f S
erv
ice
Pro
vid
ers
wit
h
Co
ver
ag
e (J
an
ua
ry 2
01
7)
Web Chart III.D.d
Estimated LTE Coverage by Census Block Including Federal Land
Mosaik, Centroid Method, January 2017
% of U.S. Population % of U.S. Road Miles % of U.S. Square Miles
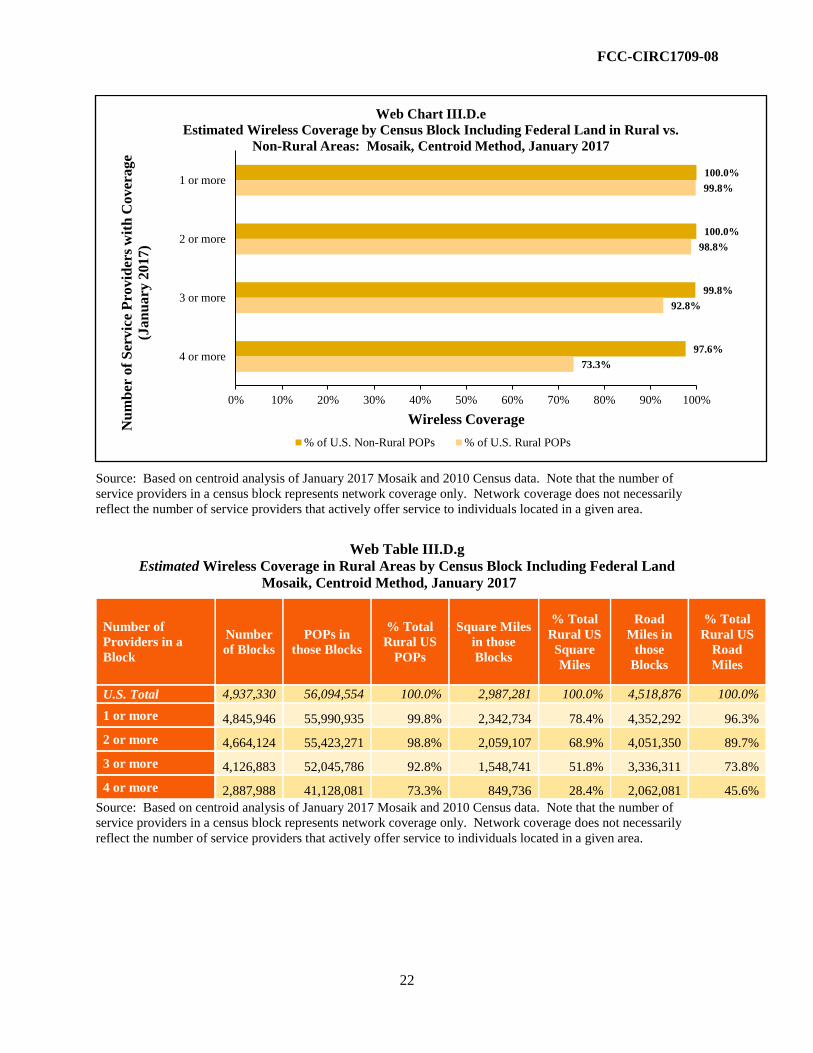
FCC-CIRC1709-08
22
Source: Based on centroid analysis of January 2017 Mosaik and 2010 Census data. Note that the number of
service providers in a census block represents network coverage only. Network coverage does not necessarily
reflect the number of service providers that actively offer service to individuals located in a given area.
Web Table III.D.g
Estimated Wireless Coverage in Rural Areas by Census Block Including Federal Land
Mosaik, Centroid Method, January 2017
Number of
Providers in a
Block
Number
of Blocks
POPs in
those Blocks
% Total
Rural US
POPs
Square Miles
in those
Blocks
% Total
Rural US
Square
Miles
Road
Miles in
those
Blocks
% Total
Rural US
Road
Miles
U.S. Total 4,937,330 56,094,554 100.0% 2,987,281 100.0% 4,518,876 100.0%
1 or more 4,845,946 55,990,935 99.8% 2,342,734 78.4% 4,352,292 96.3%
2 or more 4,664,124 55,423,271 98.8% 2,059,107 68.9% 4,051,350 89.7%
3 or more 4,126,883 52,045,786 92.8% 1,548,741 51.8% 3,336,311 73.8%
4 or more 2,887,988 41,128,081 73.3% 849,736 28.4% 2,062,081 45.6%
Source: Based on centroid analysis of January 2017 Mosaik and 2010 Census data. Note that the number of
service providers in a census block represents network coverage only. Network coverage does not necessarily
reflect the number of service providers that actively offer service to individuals located in a given area.
100.0%
100.0%
99.8%
97.6%
99.8%
98.8%
92.8%
73.3%
0% 10% 20% 30% 40% 50% 60% 70% 80% 90% 100%
1 or more
2 or more
3 or more
4 or more
Wireless Coverage
Nu
mb
er o
f S
erv
ice
Pro
vid
ers
wit
h C
ov
era
ge
(Ja
nu
ary
20
17
)
Web Chart III.D.e
Estimated Wireless Coverage by Census Block Including Federal Land in Rural vs.
Non-Rural Areas: Mosaik, Centroid Method, January 2017
% of U.S. Non-Rural POPs % of U.S. Rural POPs
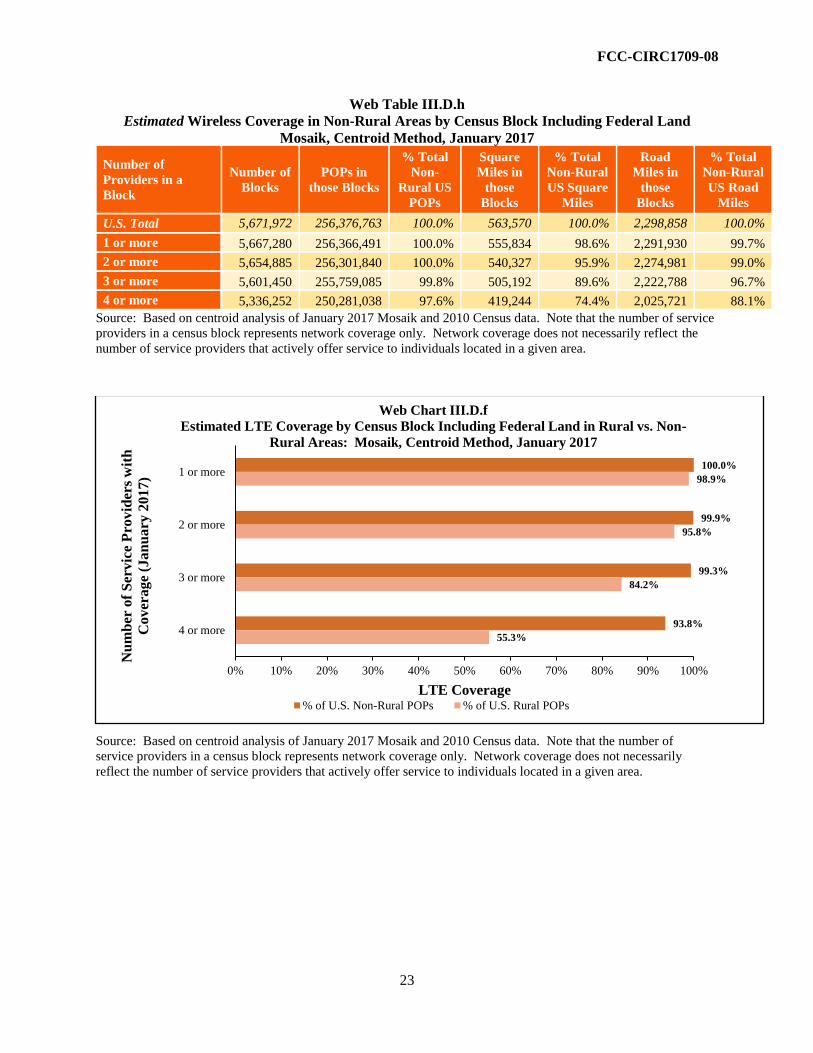
FCC-CIRC1709-08
23
Web Table III.D.h
Estimated Wireless Coverage in Non-Rural Areas by Census Block Including Federal Land
Mosaik, Centroid Method, January 2017
Number of
Providers in a
Block
Number of
Blocks
POPs in
those Blocks
% Total
Non-
Rural US
POPs
Square
Miles in
those
Blocks
% Total
Non-Rural
US Square
Miles
Road
Miles in
those
Blocks
% Total
Non-Rural
US Road
Miles
U.S. Total 5,671,972 256,376,763 100.0% 563,570 100.0% 2,298,858 100.0%
1 or more 5,667,280 256,366,491 100.0% 555,834 98.6% 2,291,930 99.7%
2 or more 5,654,885 256,301,840 100.0% 540,327 95.9% 2,274,981 99.0%
3 or more 5,601,450 255,759,085 99.8% 505,192 89.6% 2,222,788 96.7%
4 or more 5,336,252 250,281,038 97.6% 419,244 74.4% 2,025,721 88.1%
Source: Based on centroid analysis of January 2017 Mosaik and 2010 Census data. Note that the number of service
providers in a census block represents network coverage only. Network coverage does not necessarily reflect the
number of service providers that actively offer service to individuals located in a given area.
Source: Based on centroid analysis of January 2017 Mosaik and 2010 Census data. Note that the number of
service providers in a census block represents network coverage only. Network coverage does not necessarily
reflect the number of service providers that actively offer service to individuals located in a given area.
100.0%
99.9%
99.3%
93.8%
98.9%
95.8%
84.2%
55.3%
0% 10% 20% 30% 40% 50% 60% 70% 80% 90% 100%
1 or more
2 or more
3 or more
4 or more
LTE Coverage
Nu
mb
er o
f S
ervic
e P
rovid
ers
wit
h
Cover
age
(Jan
uary
2017)
Web Chart III.D.f
Estimated LTE Coverage by Census Block Including Federal Land in Rural vs. Non-
Rural Areas: Mosaik, Centroid Method, January 2017
% of U.S. Non-Rural POPs % of U.S. Rural POPs

FCC-CIRC1709-08
24
Web Table III.D.i
Estimated LTE Coverage in Rural Areas by Census Block Including Federal Land
Mosaik, Centroid Method, January 2017
Number of
Providers in a Block
Number of
Blocks
POPs in
those
Blocks
% Total
Rural US
POPs
Square
Miles in
those
Blocks
% Total
Rural US
Square
Miles
Road
Miles in
those
Blocks
% Total
Rural US
Road
Miles
U.S. Total 4,937,330 56,094,554 100.0% 2,987,281 100.0% 4,518,876 100.0%
1 or more 4,691,232 55,487,951 98.9% 2,087,320 69.9% 4,091,641 90.5%
2 or more 4,317,731 53,710,875 95.8% 1,661,510 55.6% 3,535,610 78.2%
3 or more 3,507,923 47,235,522 84.2% 1,128,571 37.8% 2,642,371 58.5%
4 or more 1,943,795 31,035,920 55.3% 455,007 15.2% 1,237,905 27.4%
Source: Based on centroid analysis of January 2017 Mosaik and 2010 Census data. Note that the number of
service providers in a census block represents network coverage only. Network coverage does not
necessarily reflect the number of service providers that actively offer service to individuals located in a
given area.
Web Table III.D.j
Estimated LTE Coverage in Non-Rural Areas by Census Block Including Federal Land
Mosaik, Centroid Method, January 2017
Number of
Providers in a Block
Number of
Blocks
POPs in
those
Blocks
% Total
Non-
Rural US.
POPs
Square
Miles in
those
Blocks
% Total
Non-Rural
US Square
Miles
Road
Miles in
those
Blocks
% Total
US Non-
Rural
Road Miles
U.S. Total 5,671,972 256,376,773 100.0% 563,570 100.0% 2,298,858 100.0%
1 or more 5,657,321 256,323,470 100.0% 541,822 96.1% 2,277,950 99.1%
2 or more 5,627,929 256,099,272 99.9% 515,251 91.4% 2,242,830 97.6%
3 or more 5,526,522 254,706,387 99.3% 472,588 83.9% 2,156,614 93.8%
4 or more 4,966,090 240,478,853 93.8% 336,585 59.7% 1,786,109 77.7%
Source: Based on centroid analysis of January 2017 Mosaik and 2010 Census data. Note that the number of
service providers in a census block represents network coverage only. Network coverage does not necessarily
reflect the number of service providers that actively offer service to individuals located in a given area.
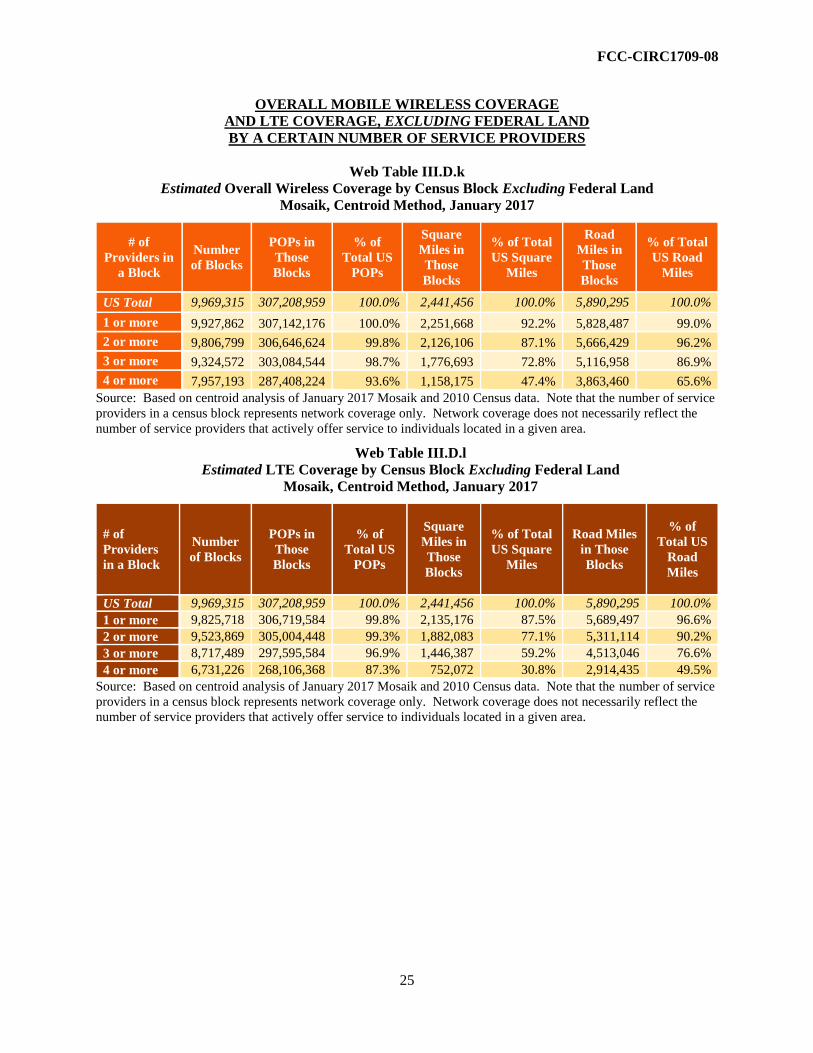
FCC-CIRC1709-08
25
OVERALL MOBILE WIRELESS COVERAGE
AND LTE COVERAGE, EXCLUDING FEDERAL LAND
BY A CERTAIN NUMBER OF SERVICE PROVIDERS
Web Table III.D.k
Estimated Overall Wireless Coverage by Census Block Excluding Federal Land
Mosaik, Centroid Method, January 2017
# of
Providers in
a Block
Number
of Blocks
POPs in
Those
Blocks
% of
Total US
POPs
Square
Miles in
Those
Blocks
% of Total
US Square
Miles
Road
Miles in
Those
Blocks
% of Total
US Road
Miles
US Total 9,969,315 307,208,959 100.0% 2,441,456 100.0% 5,890,295 100.0%
1 or more 9,927,862 307,142,176 100.0% 2,251,668 92.2% 5,828,487 99.0%
2 or more 9,806,799 306,646,624 99.8% 2,126,106 87.1% 5,666,429 96.2%
3 or more 9,324,572 303,084,544 98.7% 1,776,693 72.8% 5,116,958 86.9%
4 or more 7,957,193 287,408,224 93.6% 1,158,175 47.4% 3,863,460 65.6%
Source: Based on centroid analysis of January 2017 Mosaik and 2010 Census data. Note that the number of service
providers in a census block represents network coverage only. Network coverage does not necessarily reflect the
number of service providers that actively offer service to individuals located in a given area.
Web Table III.D.l
Estimated LTE Coverage by Census Block Excluding Federal Land
Mosaik, Centroid Method, January 2017
# of
Providers
in a Block
Number
of Blocks
POPs in
Those
Blocks
% of
Total US
POPs
Square
Miles in
Those
Blocks
% of Total
US Square
Miles
Road Miles
in Those
Blocks
% of
Total US
Road
Miles
US Total 9,969,315 307,208,959 100.0% 2,441,456 100.0% 5,890,295 100.0%
1 or more 9,825,718 306,719,584 99.8% 2,135,176 87.5% 5,689,497 96.6%
2 or more 9,523,869 305,004,448 99.3% 1,882,083 77.1% 5,311,114 90.2%
3 or more 8,717,489 297,595,584 96.9% 1,446,387 59.2% 4,513,046 76.6%
4 or more 6,731,226 268,106,368 87.3% 752,072 30.8% 2,914,435 49.5%
Source: Based on centroid analysis of January 2017 Mosaik and 2010 Census data. Note that the number of service
providers in a census block represents network coverage only. Network coverage does not necessarily reflect the
number of service providers that actively offer service to individuals located in a given area.
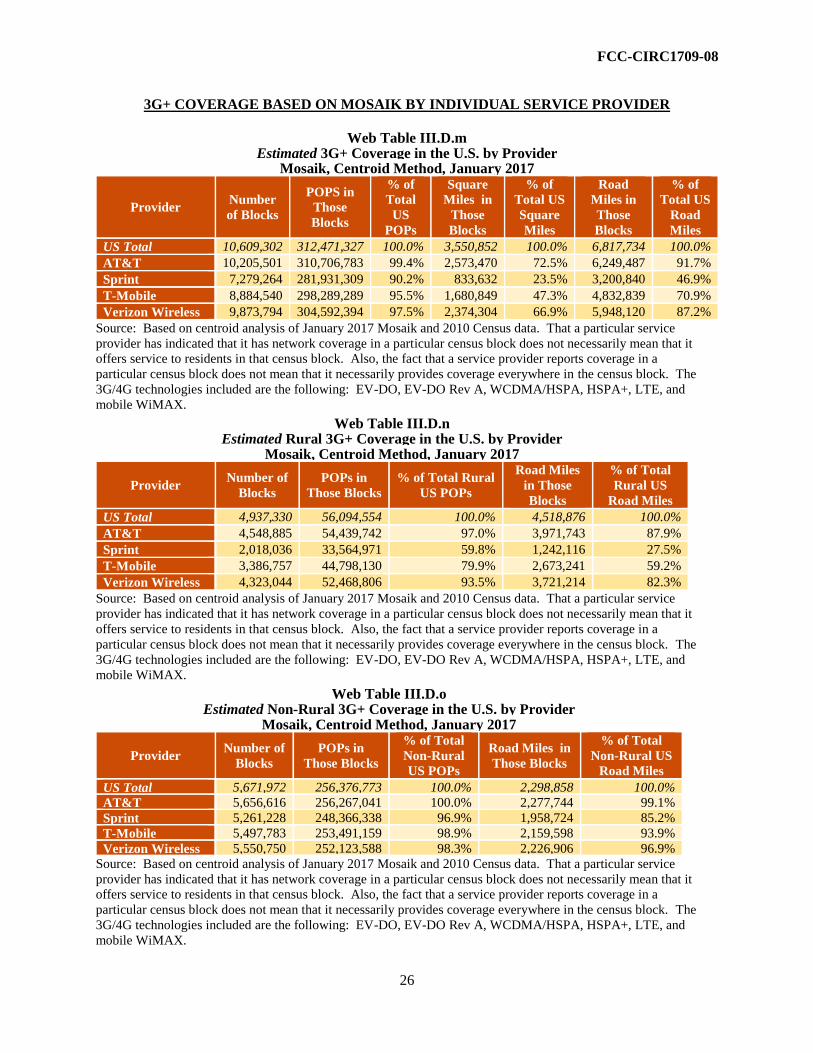
FCC-CIRC1709-08
26
3G+ COVERAGE BASED ON MOSAIK BY INDIVIDUAL SERVICE PROVIDER
Web Table III.D.m Estimated 3G+ Coverage in the U.S. by Provider
Mosaik, Centroid Method, January 2017
Provider Number
of Blocks
POPS in
Those
Blocks
% of
Total
US
POPs
Square
Miles in
Those
Blocks
% of
Total US
Square
Miles
Road
Miles in
Those
Blocks
% of
Total US
Road
Miles
US Total 10,609,302 312,471,327 100.0% 3,550,852 100.0% 6,817,734 100.0%
AT&T 10,205,501 310,706,783 99.4% 2,573,470 72.5% 6,249,487 91.7%
Sprint 7,279,264 281,931,309 90.2% 833,632 23.5% 3,200,840 46.9%
T-Mobile 8,884,540 298,289,289 95.5% 1,680,849 47.3% 4,832,839 70.9%
Verizon Wireless 9,873,794 304,592,394 97.5% 2,374,304 66.9% 5,948,120 87.2%
Source: Based on centroid analysis of January 2017 Mosaik and 2010 Census data. That a particular service
provider has indicated that it has network coverage in a particular census block does not necessarily mean that it
offers service to residents in that census block. Also, the fact that a service provider reports coverage in a
particular census block does not mean that it necessarily provides coverage everywhere in the census block. The
3G/4G technologies included are the following: EV-DO, EV-DO Rev A, WCDMA/HSPA, HSPA+, LTE, and
mobile WiMAX.
Web Table III.D.n Estimated Rural 3G+ Coverage in the U.S. by Provider
Mosaik, Centroid Method, January 2017
Provider Number of
Blocks
POPs in
Those Blocks
% of Total Rural
US POPs
Road Miles
in Those
Blocks
% of Total
Rural US
Road Miles
US Total 4,937,330 56,094,554 100.0% 4,518,876 100.0%
AT&T 4,548,885 54,439,742 97.0% 3,971,743 87.9%
Sprint 2,018,036 33,564,971 59.8% 1,242,116 27.5%
T-Mobile 3,386,757 44,798,130 79.9% 2,673,241 59.2%
Verizon Wireless 4,323,044 52,468,806 93.5% 3,721,214 82.3%
Source: Based on centroid analysis of January 2017 Mosaik and 2010 Census data. That a particular service
provider has indicated that it has network coverage in a particular census block does not necessarily mean that it
offers service to residents in that census block. Also, the fact that a service provider reports coverage in a
particular census block does not mean that it necessarily provides coverage everywhere in the census block. The
3G/4G technologies included are the following: EV-DO, EV-DO Rev A, WCDMA/HSPA, HSPA+, LTE, and
mobile WiMAX.
Web Table III.D.o Estimated Non-Rural 3G+ Coverage in the U.S. by Provider
Mosaik, Centroid Method, January 2017
Provider Number of
Blocks
POPs in
Those Blocks
% of Total
Non-Rural
US POPs
Road Miles in
Those Blocks
% of Total
Non-Rural US
Road Miles
US Total 5,671,972 256,376,773 100.0% 2,298,858 100.0%
AT&T 5,656,616 256,267,041 100.0% 2,277,744 99.1%
Sprint 5,261,228 248,366,338 96.9% 1,958,724 85.2%
T-Mobile 5,497,783 253,491,159 98.9% 2,159,598 93.9%
Verizon Wireless 5,550,750 252,123,588 98.3% 2,226,906 96.9%
Source: Based on centroid analysis of January 2017 Mosaik and 2010 Census data. That a particular service
provider has indicated that it has network coverage in a particular census block does not necessarily mean that it
offers service to residents in that census block. Also, the fact that a service provider reports coverage in a
particular census block does not mean that it necessarily provides coverage everywhere in the census block. The
3G/4G technologies included are the following: EV-DO, EV-DO Rev A, WCDMA/HSPA, HSPA+, LTE, and
mobile WiMAX.
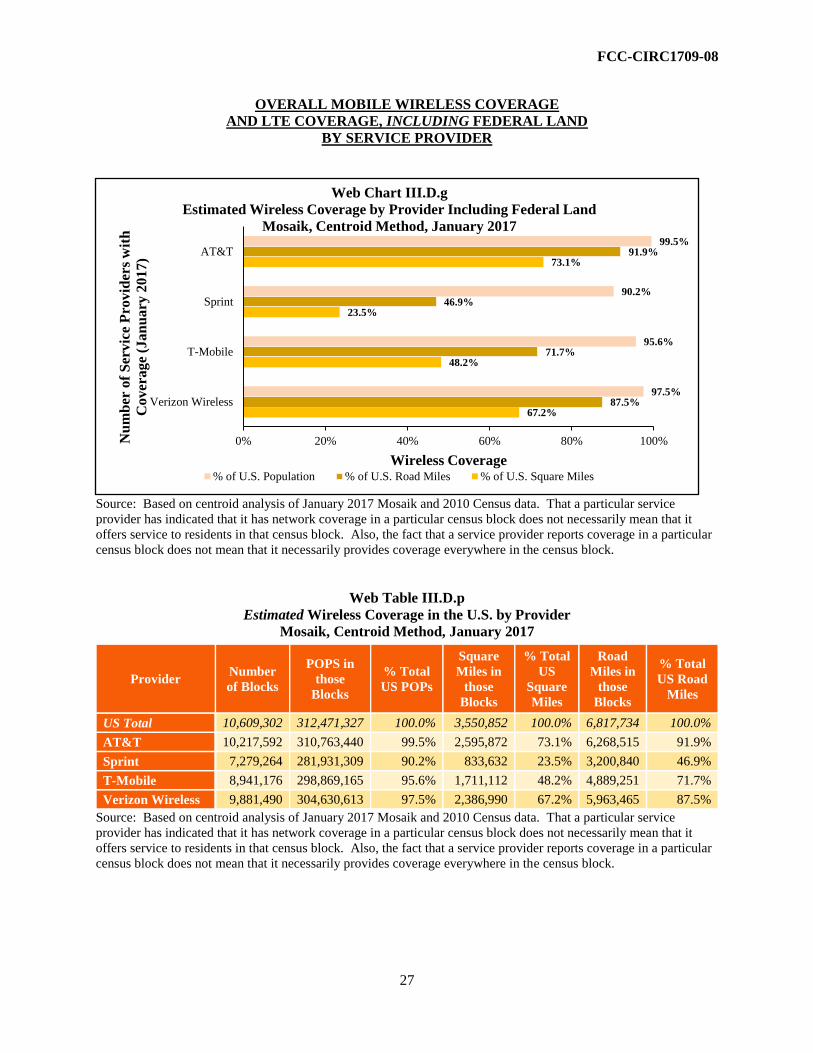
FCC-CIRC1709-08
27
OVERALL MOBILE WIRELESS COVERAGE
AND LTE COVERAGE, INCLUDING FEDERAL LAND
BY SERVICE PROVIDER
Source: Based on centroid analysis of January 2017 Mosaik and 2010 Census data. That a particular service
provider has indicated that it has network coverage in a particular census block does not necessarily mean that it
offers service to residents in that census block. Also, the fact that a service provider reports coverage in a particular
census block does not mean that it necessarily provides coverage everywhere in the census block.
Web Table III.D.p
Estimated Wireless Coverage in the U.S. by Provider
Mosaik, Centroid Method, January 2017
Provider Number
of Blocks
POPS in
those
Blocks
% Total
US POPs
Square
Miles in
those
Blocks
% Total
US
Square
Miles
Road
Miles in
those
Blocks
% Total
US Road
Miles
US Total 10,609,302 312,471,327 100.0% 3,550,852 100.0% 6,817,734 100.0%
AT&T 10,217,592 310,763,440 99.5% 2,595,872 73.1% 6,268,515 91.9%
Sprint 7,279,264 281,931,309 90.2% 833,632 23.5% 3,200,840 46.9%
T-Mobile 8,941,176 298,869,165 95.6% 1,711,112 48.2% 4,889,251 71.7%
Verizon Wireless 9,881,490 304,630,613 97.5% 2,386,990 67.2% 5,963,465 87.5%
Source: Based on centroid analysis of January 2017 Mosaik and 2010 Census data. That a particular service
provider has indicated that it has network coverage in a particular census block does not necessarily mean that it
offers service to residents in that census block. Also, the fact that a service provider reports coverage in a particular
census block does not mean that it necessarily provides coverage everywhere in the census block.
99.5%
90.2%
95.6%
97.5%
91.9%
46.9%
71.7%
87.5%
73.1%
23.5%
48.2%
67.2%
0% 20% 40% 60% 80% 100%
AT&T
Sprint
T-Mobile
Verizon Wireless
Wireless Coverage
Nu
mb
er o
f S
erv
ice
Pro
vid
ers
wit
h
Cover
ag
e (J
an
ua
ry 2
01
7)
Web Chart III.D.g
Estimated Wireless Coverage by Provider Including Federal Land
Mosaik, Centroid Method, January 2017
% of U.S. Population % of U.S. Road Miles % of U.S. Square Miles

FCC-CIRC1709-08
28
Source: Based on centroid analysis of January 2017 Mosaik and 2010 Census data. That a particular service
provider has indicated that it has network coverage in a particular census block does not necessarily mean that it
offers service to residents in that census block. Also, the fact that a service provider reports coverage in a particular
census block does not mean that it necessarily provides coverage everywhere in the census block.
Web Table III.D.q
Estimated LTE Coverage in the U.S. by Provider
Mosaik, Centroid Method, January 2017
Provider Number of
Blocks
POPS in
those
Blocks
% of
Total
US
POPs
Square
Miles in
those
Blocks
% of
Total US
Square
Miles
Road
Miles in
those
Blocks
% of
Total US
Road
Miles
US Total 10,609,302 312,471,327 100.0% 3,550,852 100.0% 6,817,734 100.0%
AT&T 9,492,900 306,039,707 97.9% 1,951,351 55.0% 5,349,954 78.5%
Sprint 6,452,197 266,341,141 85.2% 607,783 17.1% 2,622,519 38.5%
T-Mobile 8,765,306 296,975,459 95.0% 1,619,249 45.6% 4,714,757 69.2%
Verizon Wireless 9,810,695 304,190,692 97.3% 2,321,225 65.4% 5,865,992 86.0%
Source: Based on centroid analysis of January 2017 Mosaik and 2010 Census data. That a particular service
provider has indicated that it has network coverage in a particular census block does not necessarily mean that it
offers service to residents in that census block. Also, the fact that a service provider reports coverage in a particular
census block does not mean that it necessarily provides coverage everywhere in the census block.
97.9%
85.2%
95.0%
97.3%
78.5%
38.5%
69.2%
86.0%
55.0%
17.1%
45.6%
65.4%
0% 20% 40% 60% 80% 100%
AT&T
Sprint
T-Mobile
Verizon Wireless
LTE Coverage
Nu
mb
er o
f S
erv
ice
Pro
vid
ers
wit
h
Co
ver
ag
e (J
an
ua
ry 2
01
7)
Web Chart III.D.h
Estimated LTE Coverage by Provider Including Federal Land
Mosaik, Centroid Method, January 2017
% of U.S. Population % of U.S. Road Miles % of U.S. Square Miles

FCC-CIRC1709-08
29
Source: Based on centroid analysis of January 2017 Mosaik and 2010 Census data. That a particular service
provider has indicated that it has network coverage in a particular census block does not necessarily mean that it
offers service to residents in that census block. Also, the fact that a service provider reports coverage in a particular
census block does not mean that it necessarily provides coverage everywhere in the census block.
Web Table III.D.r
Estimated Rural Wireless Coverage in the U.S. by Provider
Mosaik, Centroid Method, January 2017
Provider Number of
Blocks
POPs in
those Blocks
% Total
Rural US
POPs
Road Miles
in those
Blocks
% Total
Rural US
Road Miles
US Total 4,937,330 56,094,554 100.0% 4,518,876 100.0%
AT&T 4,558,986 54,480,143 97.1% 3,987,378 88.2%
Sprint 2,018,036 33,564,971 59.8% 1,242,116 27.5%
T-Mobile 3,430,937 45,189,121 80.6% 2,719,362 60.2%
Verizon Wireless 4,330,359 52,503,170 93.6% 3,736,186 82.7%
Source: Based on centroid analysis of January 2017 Mosaik and 2010 Census data. That a particular
service provider has indicated that it has network coverage in a particular census block does not necessarily
mean that it offers service to residents in that census block. Also, the fact that a service provider reports
coverage in a particular census block does not mean that it necessarily provides coverage everywhere in the
census block.
100.0%
96.9%
98.9%
98.3%
97.1%
59.8%
80.6%
93.6%
0% 20% 40% 60% 80% 100%
AT&T
Sprint
T-Mobile
Verizon Wireless
Wireless Coverage
Nu
mb
er o
f S
erv
ice
Pro
vid
ers
wit
h C
ov
era
ge
(Ja
nu
ary
20
17
)
Chart III.D.i
Estimated Wireless Coverage by Provider Including Federal Land in Rural vs.
Non-Rural Areas: Mosaik, Centroid Method, January 2017
% of U.S. Non-Rural POPs % of U.S. Rural POPs

FCC-CIRC1709-08
30
Source: Based on centroid analysis of January 2017 Mosaik and 2010 Census data. That a particular service
provider has indicated that it has network coverage in a particular census block does not necessarily mean that it
offers service to residents in that census block. Also, the fact that a service provider reports coverage in a particular
census block does not mean that it necessarily provides coverage everywhere in the census block.
Web Table III.D.s
Estimated Non-Rural Wireless Coverage in the U.S. by Provider
Mosaik, Centroid Method, January 2017
Provider Number of
Blocks
POPs in
those
Blocks
% Total
Non-Rural
US POPs
Road Miles
in those
Blocks
% Total Non-
Rural US
Road Miles
US Total 5,671,972 256,376,773 100.0% 2,298,858 100.0%
AT&T 5,658,606 256,283,297 100.0% 2,281,137 99.2%
Sprint 5,261,228 248,366,338 96.9% 1,958,724 85.2%
T-Mobile 5,510,239 253,680,044 98.9% 2,169,889 94.4%
Verizon Wireless 5,551,131 252,127,443 98.3% 2,227,278 96.9%
Source: Based on centroid analysis of January 2017 Mosaik and 2010 Census data. That a particular
service provider has indicated that it has network coverage in a particular census block does not necessarily
mean that it offers service to residents in that census block. Also, the fact that a service provider reports
coverage in a particular census block does not mean that it necessarily provides coverage everywhere in the
census block.
99.7%
93.2%
98.7%
98.3%
90.1%
48.8%
78.4%
93.0%
0% 20% 40% 60% 80% 100%
AT&T
Sprint
T-Mobile
Verizon Wireless
LTE CoverageNu
mb
er o
f S
erv
ice
Pro
vid
ers
wit
h C
ov
era
ge
(Ja
nu
ary
20
17
)
Web Chart IV.D.j
Estimated LTE Coverage by Provider Including Federal Land in Rural vs. Non-
Rural Areas: Mosaik, Centroid Method, January 2017
% of U.S. Non-Rural POPs % of U.S. Rural POPs
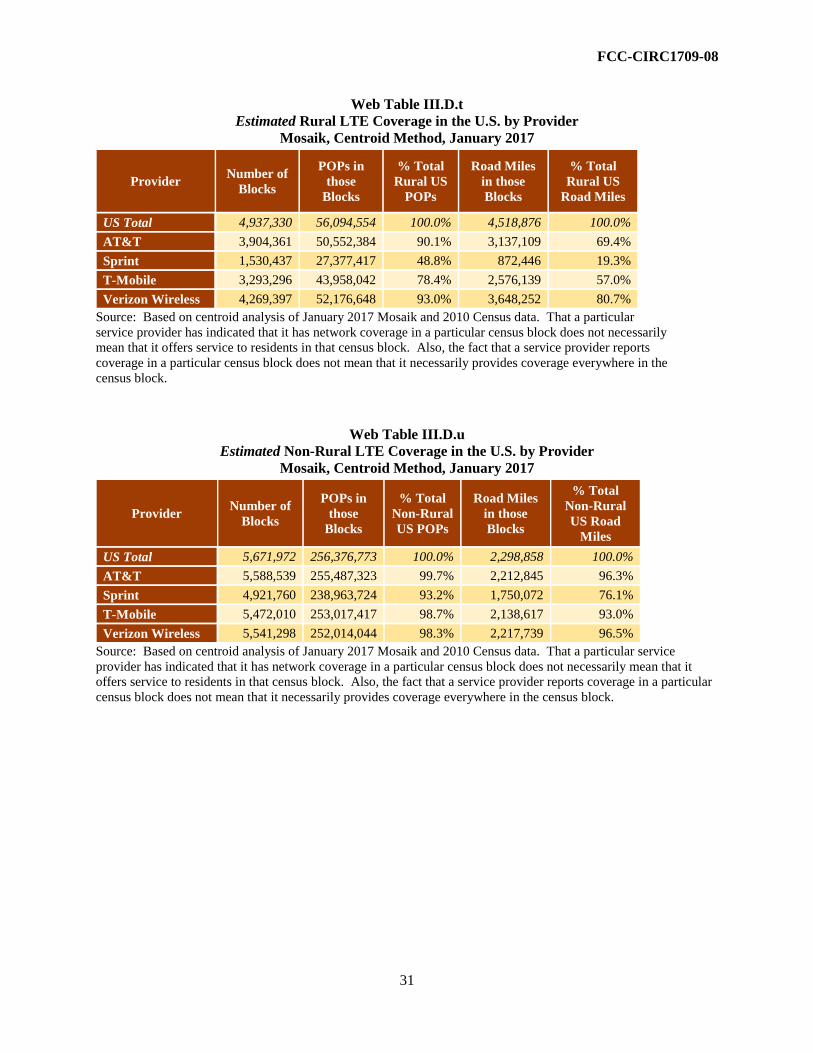
FCC-CIRC1709-08
31
Web Table III.D.t
Estimated Rural LTE Coverage in the U.S. by Provider
Mosaik, Centroid Method, January 2017
Provider Number of
Blocks
POPs in
those
Blocks
% Total
Rural US
POPs
Road Miles
in those
Blocks
% Total
Rural US
Road Miles
US Total 4,937,330 56,094,554 100.0% 4,518,876 100.0%
AT&T 3,904,361 50,552,384 90.1% 3,137,109 69.4%
Sprint 1,530,437 27,377,417 48.8% 872,446 19.3%
T-Mobile 3,293,296 43,958,042 78.4% 2,576,139 57.0%
Verizon Wireless 4,269,397 52,176,648 93.0% 3,648,252 80.7%
Source: Based on centroid analysis of January 2017 Mosaik and 2010 Census data. That a particular
service provider has indicated that it has network coverage in a particular census block does not necessarily
mean that it offers service to residents in that census block. Also, the fact that a service provider reports
coverage in a particular census block does not mean that it necessarily provides coverage everywhere in the
census block.
Web Table III.D.u
Estimated Non-Rural LTE Coverage in the U.S. by Provider
Mosaik, Centroid Method, January 2017
Provider Number of
Blocks
POPs in
those
Blocks
% Total
Non-Rural
US POPs
Road Miles
in those
Blocks
% Total
Non-Rural
US Road
Miles
US Total 5,671,972 256,376,773 100.0% 2,298,858 100.0%
AT&T 5,588,539 255,487,323 99.7% 2,212,845 96.3%
Sprint 4,921,760 238,963,724 93.2% 1,750,072 76.1%
T-Mobile 5,472,010 253,017,417 98.7% 2,138,617 93.0%
Verizon Wireless 5,541,298 252,014,044 98.3% 2,217,739 96.5%
Source: Based on centroid analysis of January 2017 Mosaik and 2010 Census data. That a particular service
provider has indicated that it has network coverage in a particular census block does not necessarily mean that it
offers service to residents in that census block. Also, the fact that a service provider reports coverage in a particular
census block does not mean that it necessarily provides coverage everywhere in the census block.
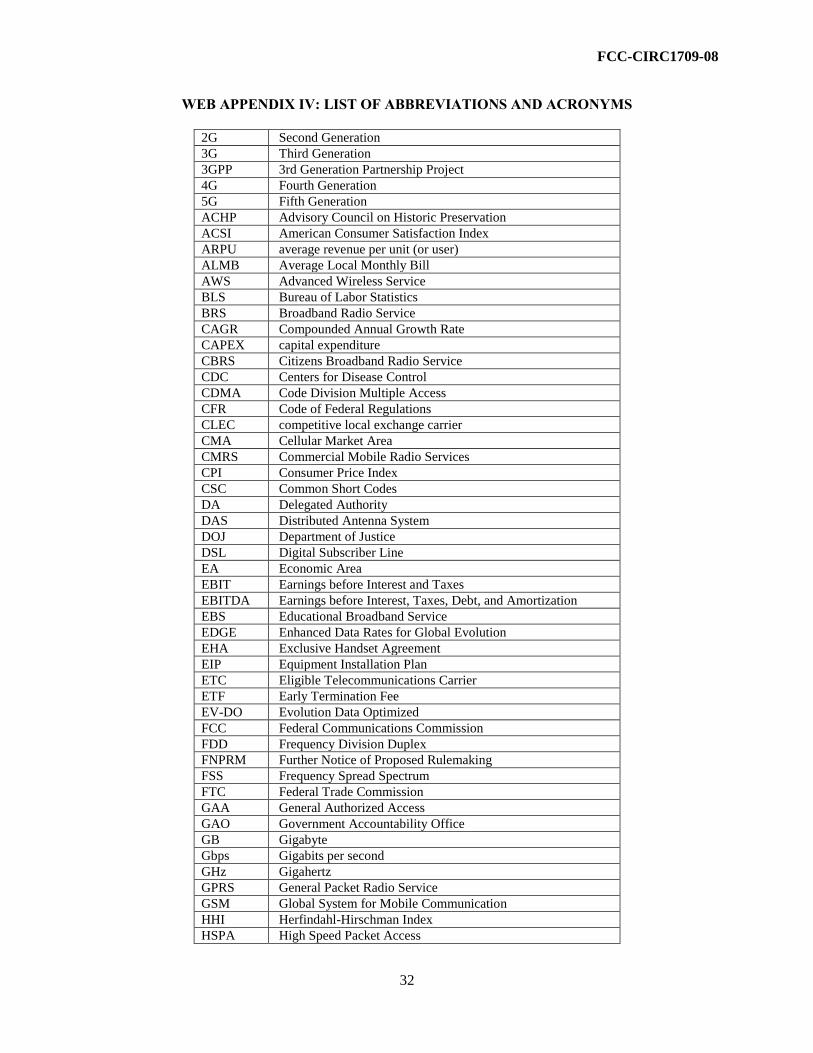
FCC-CIRC1709-08
32
WEB APPENDIX IV: LIST OF ABBREVIATIONS AND ACRONYMS
2G Second Generation
3G Third Generation
3GPP 3rd Generation Partnership Project
4G Fourth Generation
5G Fifth Generation
ACHP Advisory Council on Historic Preservation
ACSI American Consumer Satisfaction Index
ARPU average revenue per unit (or user)
ALMB Average Local Monthly Bill
AWS Advanced Wireless Service
BLS Bureau of Labor Statistics
BRS Broadband Radio Service
CAGR Compounded Annual Growth Rate
CAPEX capital expenditure
CBRS Citizens Broadband Radio Service
CDC Centers for Disease Control
CDMA Code Division Multiple Access
CFR Code of Federal Regulations
CLEC competitive local exchange carrier
CMA Cellular Market Area
CMRS Commercial Mobile Radio Services
CPI Consumer Price Index
CSC Common Short Codes
DA Delegated Authority
DAS Distributed Antenna System
DOJ Department of Justice
DSL Digital Subscriber Line
EA Economic Area
EBIT Earnings before Interest and Taxes
EBITDA Earnings before Interest, Taxes, Debt, and Amortization
EBS Educational Broadband Service
EDGE Enhanced Data Rates for Global Evolution
EHA Exclusive Handset Agreement
EIP Equipment Installation Plan
ETC Eligible Telecommunications Carrier
ETF Early Termination Fee
EV-DO Evolution Data Optimized
FCC Federal Communications Commission
FDD Frequency Division Duplex
FNPRM Further Notice of Proposed Rulemaking
FSS Frequency Spread Spectrum
FTC Federal Trade Commission
GAA General Authorized Access
GAO Government Accountability Office
GB Gigabyte
Gbps Gigabits per second
GHz Gigahertz
GPRS General Packet Radio Service
GSM Global System for Mobile Communication
HHI Herfindahl-Hirschman Index
HSPA High Speed Packet Access
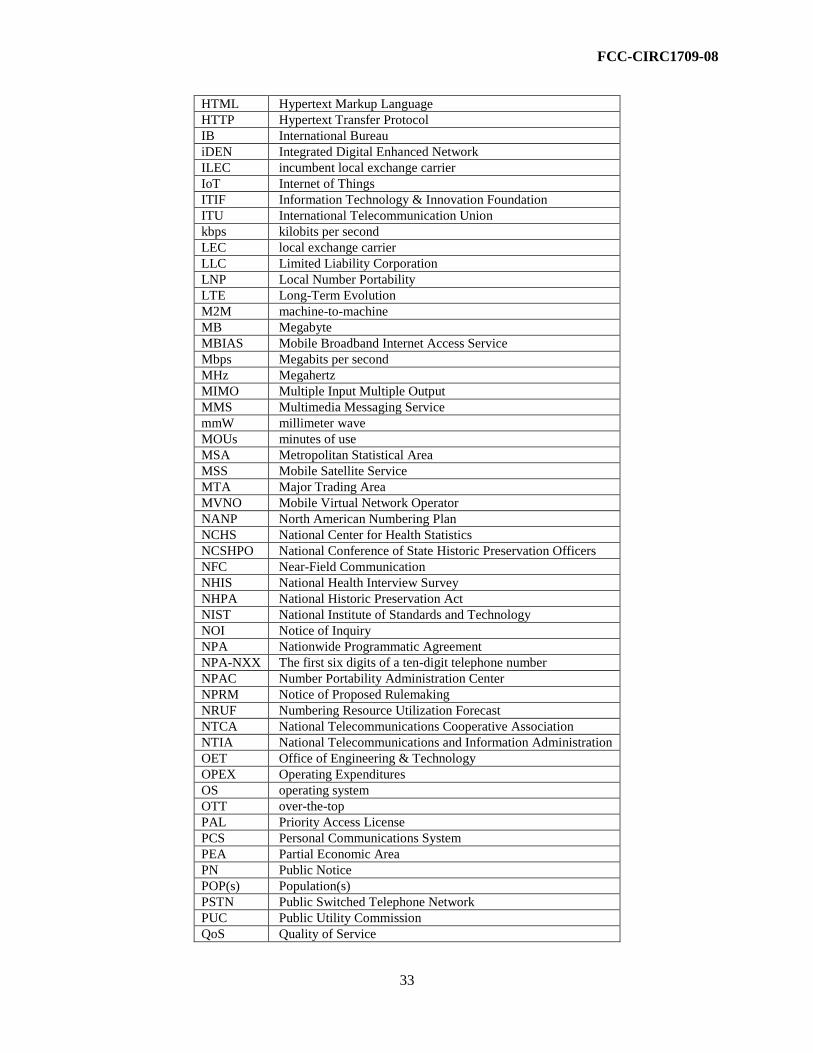
FCC-CIRC1709-08
33
HTML Hypertext Markup Language
HTTP Hypertext Transfer Protocol
IB International Bureau
iDEN Integrated Digital Enhanced Network
ILEC incumbent local exchange carrier
IoT Internet of Things
ITIF Information Technology & Innovation Foundation
ITU International Telecommunication Union
kbps kilobits per second
LEC local exchange carrier
LLC Limited Liability Corporation
LNP Local Number Portability
LTE Long-Term Evolution
M2M machine-to-machine
MB Megabyte
MBIAS Mobile Broadband Internet Access Service
Mbps Megabits per second
MHz Megahertz
MIMO Multiple Input Multiple Output
MMS Multimedia Messaging Service
mmW millimeter wave
MOUs minutes of use
MSA Metropolitan Statistical Area
MSS Mobile Satellite Service
MTA Major Trading Area
MVNO Mobile Virtual Network Operator
NANP North American Numbering Plan
NCHS National Center for Health Statistics
NCSHPO National Conference of State Historic Preservation Officers
NFC Near-Field Communication
NHIS National Health Interview Survey
NHPA National Historic Preservation Act
NIST National Institute of Standards and Technology
NOI Notice of Inquiry
NPA Nationwide Programmatic Agreement
NPA-NXX The first six digits of a ten-digit telephone number
NPAC Number Portability Administration Center
NPRM Notice of Proposed Rulemaking
NRUF Numbering Resource Utilization Forecast
NTCA National Telecommunications Cooperative Association
NTIA National Telecommunications and Information Administration
OET Office of Engineering & Technology
OPEX Operating Expenditures
OS operating system
OTT over-the-top
PAL Priority Access License
PCS Personal Communications System
PEA Partial Economic Area
PN Public Notice
POP(s) Population(s)
PSTN Public Switched Telephone Network
PUC Public Utility Commission
QoS Quality of Service

FCC-CIRC1709-08
34
R&D research and development
R&O Report and Order
RF radio frequency
RPM revenue per minute
RSA Rural Service Area
SAS Spectrum Access System
SEC Securities and Exchange Commission
SIM Subscriber Identity Module
SMR Specialized Mobile Radio
SMS Short Message Service
TB Terabyte
TDD Time Division Duplex
TDM Time Division Multiplexing
TDMA Time Division Multiple Access
UHF Ultra-High Frequency
ULS Universal Licensing System
UMTS Universal Mobile Telecommunications System
U.S. United States
USB Universal Serial Bus
USF Universal Service Fund
VoIP Voice over Internet Protocol
WCDMA Wideband Code Division Multiple Access
WCS Wireless Communications Service
WiMAX Worldwide Interoperability for Microwave Access
WLAN Wireless Local Area Network
WTB Wireless Telecommunications Bureau