september 30th student enrollment and unit allotment
TRANSCRIPT

STATE OF DELAWARE
September 30th Student Enrollment and Unit Allotment Report
November 2012
Delaware Department of Education and State Board of Education

OFFICERS OF THE DEPARTMENT OF EDUCATION John G. Townsend Building
401 Federal Street, Suite 2
Dover, DE 19901
Mark T. Murphy Secretary of Education
David J. Blowman Deputy Secretary of Education
Susan Keene Haberstroh, Ed.D., Acting Associate Secretary College Workforce and Readiness
Mary Ann Mieczkowski, Acting Associate Secretary Teaching & Learning
Karen Field Rogers, Associate Secretary Financial Reform & Resource Mangement
The Delaware Department of Education does not discriminate in employment or educational programs, services or activities, based on race, color, national origin, sex, age, or handicap in accordance with state and federal laws. Inquiries should be directed to Department of Education, Human Resources and Quality Management, John G. Townsend Building, 401 Federal Street, Suite 2, Dover, DE 19901. The telephone number is 302-735-4030. This publication is available in microfiche from the Bureau of Archives and Records, Hall of Records, P. O. Box 1401, Dover, DE 19903, and printed in the U.S.A. Document No. 95-01/12/10/02
Delaware Department of Education and State Board of Education

Delaware Department of Education and State Board of Education
FOREWORD This report is presented in four parts. Part I contains the actual unit allotment information for September 30, 2012, excluding Dover Air Force Base (DAFB). Statewide, the number of Division I units is 9,142.75 and the number of Division II units is 10,378.63. Please review the notes relating to units on page 26. These notes assist the reader by listing the units and other related information for spe-cial education schools and for certain vocational education programs. Part II of the report contains district enrollment data for regular and special education students. Regular enrollments are presented by grade, grade grouping, school, district, county and state. Special education enrollments are presented by needs based categories, school, district, county and state. Students with disabilities are not required to receive a minimum number of hours of spe-cial education instruction to be counted as special education. This report represents the second year of the full implementation of the needs-based funding system. Governor Jack Markell signed into law House Bill 1, in February 2011 which became effective on July 1, 2011. The needs-based funding system allows services for children with disabilities to be funded based on identified individual needs rather than on their classification or placement. The needs-based funding systems also provides districts and charter schools with more flexibility in the provision of special education services and is intended to be more equitable in ensuring that resources are distributed based on the specific needs of students receiving special education services. Part III of the report contains data for regular and special education students enrolled in Charter Schools. These enrollments are presented in the same format as detailed in the above paragraph. In addition, the Charter School pages also incorporate district enrollments to provide a total state enrollment. It should be noted that Charter Schools first opened in the Fall of 1996. Part IV of the report contains data for the 2012—2013 Estimated Unit Count. Governor Jack Markell signed into law SB16 on April 13, 2011. The new law is intended to help Delaware school districts by enabling them to make hiring decisions and job offers earlier in order to recruit qualified teachers for the coming school year. The law requires the state to complete no later than April 15 of each calendar year a district-level projection of Division I teacher units known as the “estimated unit count”. Total district and charter school enrollment for September 30, 2012, excluding Dover Air Force Base (DAFB) is 131,029. This represents an increase of 927 students (+0.71%) over September 30, 2011 enrollment of 130,102. Enrollment at DAFB for September 30, 2012 is 497 students. The number of students enrolled in charter schools for September 30, 2012 grew to 10,438 an increase of 116. The enrollment trend continues to show growth with the last two years representing increases of .98% and 1.32%, consistent with this year’s increase. For further information or explanation, please contact:
Debra Ann Stover, Education Associate Technology Resources and Data Development John G. Townsend Building 401 Federal Street, Suite 2 Dover, DE 19901 (302) 735-4140 Mark T. Murphy Secretary of Education Delaware Department of Education

Delaware Department of Education and State Board of Education
PART I—UNIT ALLOTMENT REPORT SEPTEMBER 30, 2012
NEEDS BASED UNIT CATEGORIES:
Pre-K (Special Education)
K-3 (Regular Education & Special Education)
4-12 Regular Education
4-12 Basic Special Education (Basic)
Pre K-12 Intensive Special Education (Intensive)
Pre K-12 Complex Special Education (Complex)

1

2

Appoquinimink School District (29)
K - 3 4 - 12 Regular 4 - 12 Basic ComplexTotal Regular
Enrollment
Units
2,572.00
158.76
6,071.00
303.55
496.00
59.05
42.00
16.08
8,643.00
462.31
Total Special
976.00
125.39
Units 25.64 70.20 0.00
Total Regular & Special Enrollment
Total Regular & Special Units
Vocational Deduction
Net Total Regular & Special
District Division I
District Division II 645.08
600.52
9,619.00
587.70
12.82
574.88* Includes 588 regular Kindergarten students.
*
Division I
-------------------------- CTE -------------------------
Division II Other
Intensive
208.00
34.71
Pre-K
82.00
6.41
K - 3
148.00
9.14
**
** Includes 22 special education Kindergarten students.
Brandywine School District (31)
K - 3 4 - 12 Regular 4 - 12 Basic ComplexTotal Regular
Enrollment
Units
3,045.00
187.98
6,427.00
321.35
669.00
79.65
116.00
44.54
9,472.00
509.33
Total Special
1,380.00
190.59
Units 34.53 95.71 0.00
Total Regular & Special Enrollment
Total Regular & Special Units
Vocational Deduction
Net Total Regular & Special
District Division I
District Division II 778.37
717.19
10,852.00
699.92
17.26
682.66* Includes 706 regular Kindergarten students.
*
Division I
-------------------------- CTE -------------------------
Division II Other
Intensive
261.00
43.51
Pre-K
138.00
10.78
K - 3
196.00
12.11
**
** Includes 47 special education Kindergarten students.
UNIT ALLOTMENT BASED ON ENROLLMENTS REPORTED BY LOCAL SCHOOL DISTRICTS AS OF SEPTEMBER 30, 2012
3

Christina School District (33)
K - 3 4 - 12 Regular 4 - 12 Basic ComplexTotal Regular
Enrollment
Units
5,534.00
341.59
8,481.00
424.05
906.00
107.87
643.00
247.25
14,015.00
765.64
Total Special
2,792.00
510.33
Units 99.94 283.57 0.00
Total Regular & Special Enrollment
Total Regular & Special Units
Vocational Deduction
Net Total Regular & Special
District Division I
District Division II 1,509.57
1,325.94
16,807.00
1,275.97
49.97
1,226.00* Includes 1470 regular Kindergarten students.
*
Division I
-------------------------- CTE -------------------------
Division II Other
Intensive
712.00
118.74
Pre-K
226.00
17.66
K - 3
305.00
18.81
**
** Includes 67 special education Kindergarten students.
Colonial School District (34)
K - 3 4 - 12 Regular 4 - 12 Basic ComplexTotal Regular
Enrollment
Units
3,074.00
189.74
5,524.00
276.20
647.00
77.06
113.00
43.44
8,598.00
465.94
Total Special
1,343.00
188.30
Units 28.32 80.71 0.00
Total Regular & Special Enrollment
Total Regular & Special Units
Vocational Deduction
Net Total Regular & Special
District Division I
District Division II 720.79
668.40
9,941.00
654.24
14.16
640.08* Includes 744 regular Kindergarten students.
*
Division I
-------------------------- CTE -------------------------
Division II Other
Intensive
288.00
48.03
Pre-K
96.00
7.50
K - 3
199.00
12.27
**
** Includes 47 special education Kindergarten students.
UNIT ALLOTMENT BASED ON ENROLLMENTS REPORTED BY LOCAL SCHOOL DISTRICTS AS OF SEPTEMBER 30, 2012
4

New Castle County Votech School District (38)
K - 3 4 - 12 Regular 4 - 12 Basic ComplexTotal Regular
Enrollment
Units
0.00
0.00
3,949.00
197.45
386.00
45.97
8.00
3.05
3,949.00
197.45
Total Special
538.00
73.02
Units 151.83 436.03 0.00
Total Regular & Special Enrollment
Total Regular & Special Units
Vocational Deduction
Net Total Regular & Special
District Division I
District Division II 630.70
346.50
4,487.00
270.47
75.80
194.67
Division I
-------------------------- CTE -------------------------
Division II Other
Intensive
144.00
24.00
Pre-K
0.00
0.00
K - 3
0.00
0.00
Red Clay Consolidated School District (32)
K - 3 4 - 12 Regular 4 - 12 Basic ComplexTotal Regular
Enrollment
Units
4,952.00
305.67
9,237.00
461.85
1,263.00
150.39
202.00
77.58
14,189.00
767.52
Total Special
2,108.00
298.52
Units 47.70 134.81 0.00
Total Regular & Special Enrollment
Total Regular & Special Units
Vocational Deduction
Net Total Regular & Special
District Division I
District Division II 1,177.00
1,089.89
16,297.00
1,066.04
23.85
1,042.19* Includes 1253 regular Kindergarten students.
*
Division I
-------------------------- CTE -------------------------
Division II Other
Intensive
283.00
47.20
Pre-K
69.00
5.39
K - 3
291.00
17.96
**
** Includes 43 special education Kindergarten students.
UNIT ALLOTMENT BASED ON ENROLLMENTS REPORTED BY LOCAL SCHOOL DISTRICTS AS OF SEPTEMBER 30, 2012
5

Caesar Rodney School District (10)
K - 3 4 - 12 Regular 4 - 12 Basic ComplexTotal Regular
Enrollment
Units
1,823.00
112.53
4,240.00
212.00
447.00
53.21
207.00
79.57
6,063.00
324.53
Total Special
1,129.00
193.15
Units 28.33 79.29 0.00
Total Regular & Special Enrollment
Total Regular & Special Units
Vocational Deduction
Net Total Regular & Special
District Division I
District Division II 582.81
531.85
7,192.00
517.68
14.16
503.52* Includes 450 regular Kindergarten students.
*
Division I
-------------------------- CTE -------------------------
Division II Other
Intensive
285.00
47.51
Pre-K
69.00
5.39
K - 3
121.00
7.47
**
** Includes 0 special education Kindergarten students.
Dover Air Force Base (14)
K - 3 4 - 12 Regular 4 - 12 Basic ComplexTotal Regular
Enrollment
Units
208.00
12.84
227.00
11.35
20.00
2.39
3.00
1.14
435.00
24.19
Total Special
62.00
7.77
Units 1.04 3.02 0.00
Total Regular & Special Enrollment
Total Regular & Special Units
Vocational Deduction
Net Total Regular & Special
District Division I
District Division II 34.46
32.48
497.00
31.96
0.52
31.44* Includes 57 regular Kindergarten students.
*
Division I
-------------------------- CTE -------------------------
Division II Other
Intensive
15.00
2.51
Pre-K
15.00
1.17
K - 3
9.00
0.56
**
** Includes 0 special education Kindergarten students.
UNIT ALLOTMENT BASED ON ENROLLMENTS REPORTED BY LOCAL SCHOOL DISTRICTS AS OF SEPTEMBER 30, 2012
6

Capital School District (13)
K - 3 4 - 12 Regular 4 - 12 Basic ComplexTotal Regular
Enrollment
Units
1,826.00
112.72
3,381.00
169.05
427.00
50.84
191.00
73.42
5,207.00
281.77
Total Special
1,137.00
194.83
Units 23.11 61.94 0.00
Total Regular & Special Enrollment
Total Regular & Special Units
Vocational Deduction
Net Total Regular & Special
District Division I
District Division II 526.98
488.15
6,344.00
476.60
11.56
465.04* Includes 470 regular Kindergarten students.
*
Division I
-------------------------- CTE -------------------------
Division II Other
Intensive
362.00
60.34
Pre-K
33.00
2.57
K - 3
124.00
7.66
**
** Includes 27 special education Kindergarten students.
Lake Forest School District (15)
K - 3 4 - 12 Regular 4 - 12 Basic ComplexTotal Regular
Enrollment
Units
1,129.00
69.69
2,140.00
107.00
266.00
31.67
15.00
5.72
3,269.00
176.69
Total Special
618.00
74.96
Units 12.62 34.37 0.00
Total Regular & Special Enrollment
Total Regular & Special Units
Vocational Deduction
Net Total Regular & Special
District Division I
District Division II 279.71
257.96
3,887.00
251.65
6.31
245.34* Includes 273 regular Kindergarten students.
*
Division I
-------------------------- CTE -------------------------
Division II Other
Intensive
144.00
23.99
Pre-K
102.00
7.97
K - 3
91.00
5.61
**
** Includes 23 special education Kindergarten students.
UNIT ALLOTMENT BASED ON ENROLLMENTS REPORTED BY LOCAL SCHOOL DISTRICTS AS OF SEPTEMBER 30, 2012
7
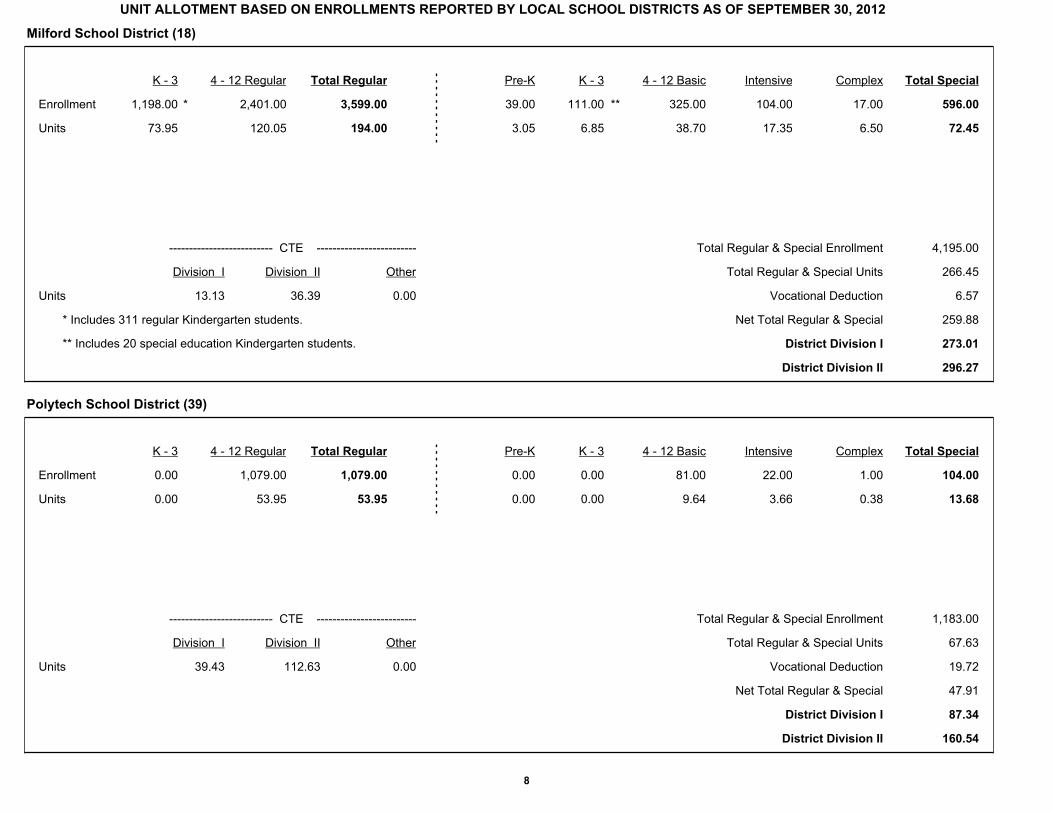
Milford School District (18)
K - 3 4 - 12 Regular 4 - 12 Basic ComplexTotal Regular
Enrollment
Units
1,198.00
73.95
2,401.00
120.05
325.00
38.70
17.00
6.50
3,599.00
194.00
Total Special
596.00
72.45
Units 13.13 36.39 0.00
Total Regular & Special Enrollment
Total Regular & Special Units
Vocational Deduction
Net Total Regular & Special
District Division I
District Division II 296.27
273.01
4,195.00
266.45
6.57
259.88* Includes 311 regular Kindergarten students.
*
Division I
-------------------------- CTE -------------------------
Division II Other
Intensive
104.00
17.35
Pre-K
39.00
3.05
K - 3
111.00
6.85
**
** Includes 20 special education Kindergarten students.
Polytech School District (39)
K - 3 4 - 12 Regular 4 - 12 Basic ComplexTotal Regular
Enrollment
Units
0.00
0.00
1,079.00
53.95
81.00
9.64
1.00
0.38
1,079.00
53.95
Total Special
104.00
13.68
Units 39.43 112.63 0.00
Total Regular & Special Enrollment
Total Regular & Special Units
Vocational Deduction
Net Total Regular & Special
District Division I
District Division II 160.54
87.34
1,183.00
67.63
19.72
47.91
Division I
-------------------------- CTE -------------------------
Division II Other
Intensive
22.00
3.66
Pre-K
0.00
0.00
K - 3
0.00
0.00
UNIT ALLOTMENT BASED ON ENROLLMENTS REPORTED BY LOCAL SCHOOL DISTRICTS AS OF SEPTEMBER 30, 2012
8
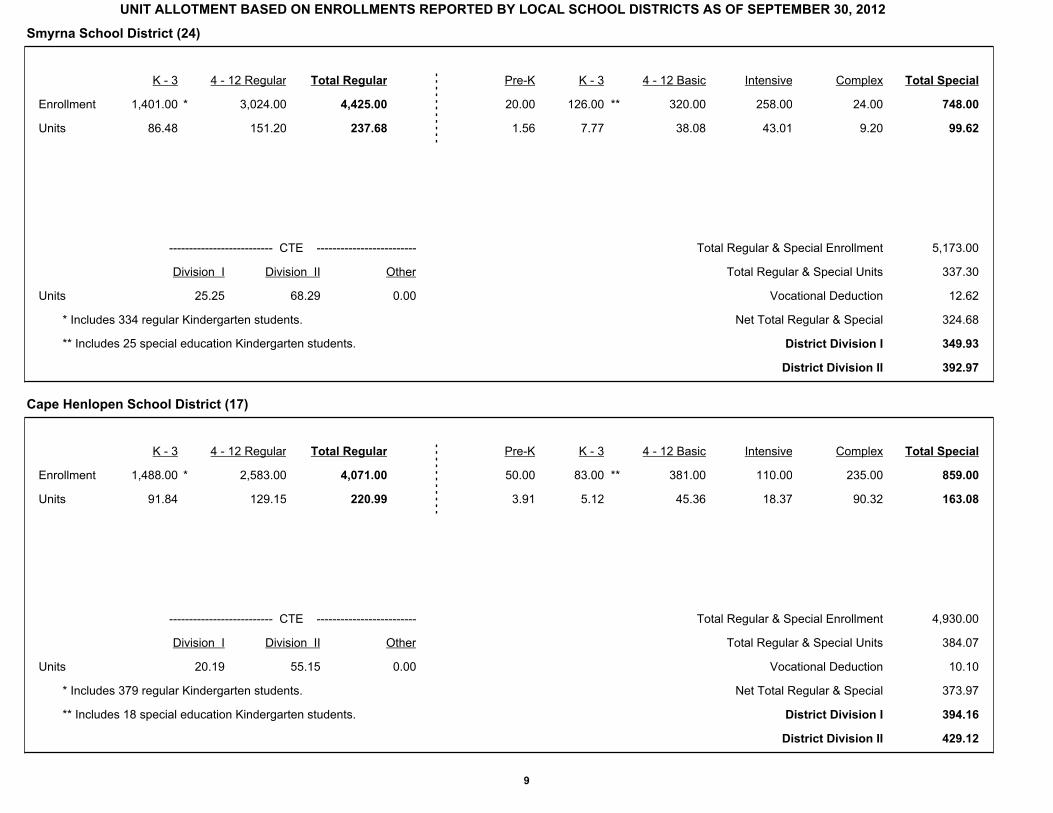
Smyrna School District (24)
K - 3 4 - 12 Regular 4 - 12 Basic ComplexTotal Regular
Enrollment
Units
1,401.00
86.48
3,024.00
151.20
320.00
38.08
24.00
9.20
4,425.00
237.68
Total Special
748.00
99.62
Units 25.25 68.29 0.00
Total Regular & Special Enrollment
Total Regular & Special Units
Vocational Deduction
Net Total Regular & Special
District Division I
District Division II 392.97
349.93
5,173.00
337.30
12.62
324.68* Includes 334 regular Kindergarten students.
*
Division I
-------------------------- CTE -------------------------
Division II Other
Intensive
258.00
43.01
Pre-K
20.00
1.56
K - 3
126.00
7.77
**
** Includes 25 special education Kindergarten students.
Cape Henlopen School District (17)
K - 3 4 - 12 Regular 4 - 12 Basic ComplexTotal Regular
Enrollment
Units
1,488.00
91.84
2,583.00
129.15
381.00
45.36
235.00
90.32
4,071.00
220.99
Total Special
859.00
163.08
Units 20.19 55.15 0.00
Total Regular & Special Enrollment
Total Regular & Special Units
Vocational Deduction
Net Total Regular & Special
District Division I
District Division II 429.12
394.16
4,930.00
384.07
10.10
373.97* Includes 379 regular Kindergarten students.
*
Division I
-------------------------- CTE -------------------------
Division II Other
Intensive
110.00
18.37
Pre-K
50.00
3.91
K - 3
83.00
5.12
**
** Includes 18 special education Kindergarten students.
UNIT ALLOTMENT BASED ON ENROLLMENTS REPORTED BY LOCAL SCHOOL DISTRICTS AS OF SEPTEMBER 30, 2012
9

Delmar School District (37)
K - 3 4 - 12 Regular 4 - 12 Basic ComplexTotal Regular
Enrollment
Units
0.00
0.00
1,208.00
60.40
100.00
11.90
4.00
1.53
1,208.00
60.40
Total Special
126.00
16.83
Units 9.13 26.21 0.00
Total Regular & Special Enrollment
Total Regular & Special Units
Vocational Deduction
Net Total Regular & Special
District Division I
District Division II 98.88
81.80
1,334.00
77.23
4.56
72.67
Division I
-------------------------- CTE -------------------------
Division II Other
Intensive
19.00
3.17
Pre-K
3.00
0.23
K - 3
0.00
0.00
Indian River School District (36)
K - 3 4 - 12 Regular 4 - 12 Basic ComplexTotal Regular
Enrollment
Units
2,874.00
156.20
4,807.00
240.35
423.00
50.38
195.00
74.85
7,681.00
396.55
Total Special
1,466.00
229.90
Units 33.35 95.67 0.00
Total Regular & Special Enrollment
Total Regular & Special Units
Vocational Deduction
Net Total Regular & Special
District Division I
District Division II 705.44
643.12
9,147.00
626.45
16.68
609.77* Includes 687 regular Kindergarten students.
*
Division I
-------------------------- CTE -------------------------
Division II Other
Intensive
488.00
81.38
Pre-K
190.00
14.85
K - 3
170.00
8.44
**
** Includes 67 special education Kindergarten students.
UNIT ALLOTMENT BASED ON ENROLLMENTS REPORTED BY LOCAL SCHOOL DISTRICTS AS OF SEPTEMBER 30, 2012
10
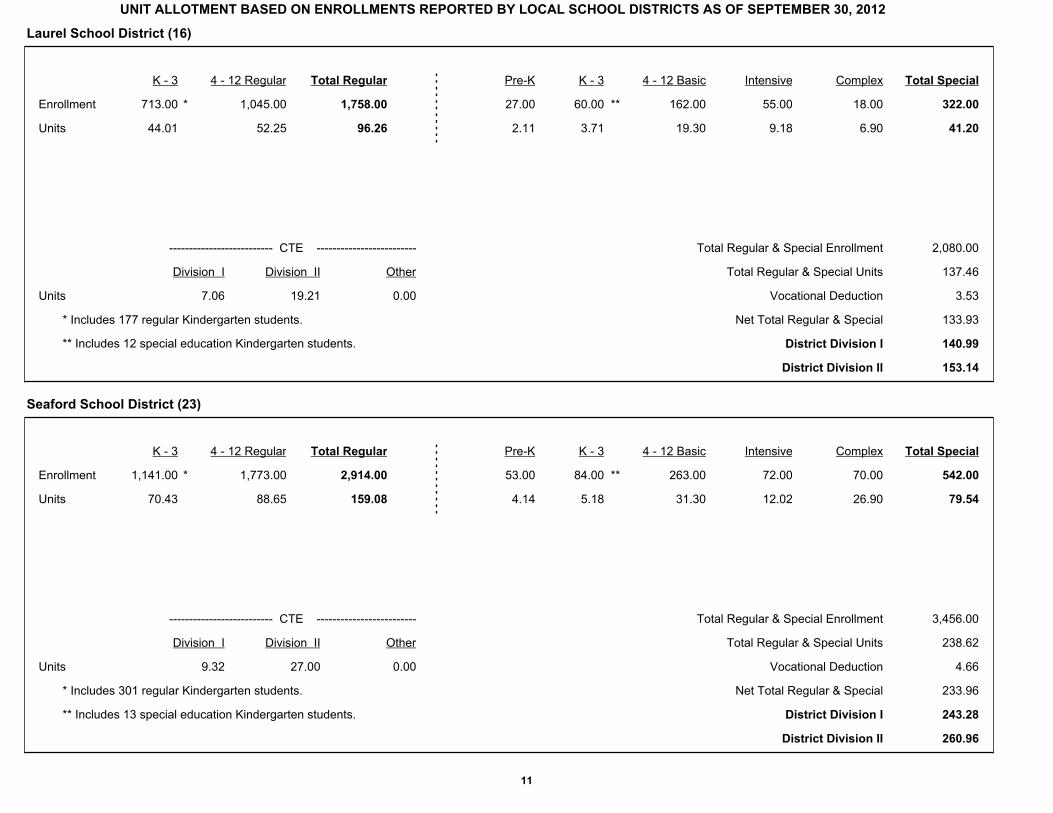
Laurel School District (16)
K - 3 4 - 12 Regular 4 - 12 Basic ComplexTotal Regular
Enrollment
Units
713.00
44.01
1,045.00
52.25
162.00
19.30
18.00
6.90
1,758.00
96.26
Total Special
322.00
41.20
Units 7.06 19.21 0.00
Total Regular & Special Enrollment
Total Regular & Special Units
Vocational Deduction
Net Total Regular & Special
District Division I
District Division II 153.14
140.99
2,080.00
137.46
3.53
133.93* Includes 177 regular Kindergarten students.
*
Division I
-------------------------- CTE -------------------------
Division II Other
Intensive
55.00
9.18
Pre-K
27.00
2.11
K - 3
60.00
3.71
**
** Includes 12 special education Kindergarten students.
Seaford School District (23)
K - 3 4 - 12 Regular 4 - 12 Basic ComplexTotal Regular
Enrollment
Units
1,141.00
70.43
1,773.00
88.65
263.00
31.30
70.00
26.90
2,914.00
159.08
Total Special
542.00
79.54
Units 9.32 27.00 0.00
Total Regular & Special Enrollment
Total Regular & Special Units
Vocational Deduction
Net Total Regular & Special
District Division I
District Division II 260.96
243.28
3,456.00
238.62
4.66
233.96* Includes 301 regular Kindergarten students.
*
Division I
-------------------------- CTE -------------------------
Division II Other
Intensive
72.00
12.02
Pre-K
53.00
4.14
K - 3
84.00
5.18
**
** Includes 13 special education Kindergarten students.
UNIT ALLOTMENT BASED ON ENROLLMENTS REPORTED BY LOCAL SCHOOL DISTRICTS AS OF SEPTEMBER 30, 2012
11

Sussex Technical School District (40)
K - 3 4 - 12 Regular 4 - 12 Basic ComplexTotal Regular
Enrollment
Units
0.00
0.00
1,292.00
64.60
75.00
8.93
1.00
0.38
1,292.00
64.60
Total Special
117.00
16.13
Units 46.97 135.97 0.00
Total Regular & Special Enrollment
Total Regular & Special Units
Vocational Deduction
Net Total Regular & Special
District Division I
District Division II 193.22
104.22
1,409.00
80.73
23.48
57.25
Division I
-------------------------- CTE -------------------------
Division II Other
Intensive
41.00
6.82
Pre-K
0.00
0.00
K - 3
0.00
0.00
Woodbridge School District (35)
K - 3 4 - 12 Regular 4 - 12 Basic ComplexTotal Regular
Enrollment
Units
683.00
42.16
1,290.00
64.50
144.00
17.14
35.00
13.44
1,973.00
106.66
Total Special
285.00
43.44
Units 8.57 22.66 0.00
Total Regular & Special Enrollment
Total Regular & Special Units
Vocational Deduction
Net Total Regular & Special
District Division I
District Division II 168.48
154.39
2,258.00
150.10
4.28
145.82* Includes 182 regular Kindergarten students.
*
Division I
-------------------------- CTE -------------------------
Division II Other
Intensive
57.00
9.50
Pre-K
20.00
1.56
K - 3
29.00
1.80
**
** Includes 11 special education Kindergarten students.
UNIT ALLOTMENT BASED ON ENROLLMENTS REPORTED BY LOCAL SCHOOL DISTRICTS AS OF SEPTEMBER 30, 2012
12

Charter School of Wilmington (70)
K - 3 4 - 12 Regular 4 - 12 Basic ComplexTotal Regular
Enrollment
Units
0.00
0.00
968.00
48.40
2.00
0.24
0.00
0.00
968.00
48.40
Total Special
2.00
0.24
Units 0.47 1.42 0.00
Total Regular & Special Enrollment
Total Regular & Special Units
Vocational Deduction
Net Total Regular & Special
District Division I
District Division II 49.82
48.87
970.00
48.64
0.24
48.40
Division I
-------------------------- CTE -------------------------
Division II Other
Intensive
0.00
0.00
Pre-K
0.00
0.00
K - 3
0.00
0.00
Delaware Academy of Public Safety and Security (68)
K - 3 4 - 12 Regular 4 - 12 Basic ComplexTotal Regular
Enrollment
Units
0.00
0.00
171.00
8.55
21.00
2.50
0.00
0.00
171.00
8.55
Total Special
21.00
2.50
Units 0.00 0.00 0.00
Total Regular & Special Enrollment
Total Regular & Special Units
Vocational Deduction
Net Total Regular & Special
District Division I
District Division II 11.05
11.05
192.00
11.05
0.00
11.05
Division I
-------------------------- CTE -------------------------
Division II Other
Intensive
0.00
0.00
Pre-K
0.00
0.00
K - 3
0.00
0.00
UNIT ALLOTMENT BASED ON ENROLLMENTS REPORTED BY LOCAL SCHOOL DISTRICTS AS OF SEPTEMBER 30, 2012
13

Delaware College Preparatory Academy (66)
K - 3 4 - 12 Regular 4 - 12 Basic ComplexTotal Regular
Enrollment
Units
175.00
10.80
50.00
2.50
2.00
0.24
0.00
0.00
225.00
13.30
Total Special
7.00
0.55
Units 0.00 0.00 0.00
Total Regular & Special Enrollment
Total Regular & Special Units
Vocational Deduction
Net Total Regular & Special
District Division I
District Division II 13.85
13.85
232.00
13.85
0.00
13.85* Includes 53 regular Kindergarten students.
*
Division I
-------------------------- CTE -------------------------
Division II Other
Intensive
0.00
0.00
Pre-K
0.00
0.00
K - 3
5.00
0.31
**
** Includes 1 special education Kindergarten students.
Delaware Military Academy (79)
K - 3 4 - 12 Regular 4 - 12 Basic ComplexTotal Regular
Enrollment
Units
0.00
0.00
555.00
27.75
1.00
0.12
0.00
0.00
555.00
27.75
Total Special
1.00
0.12
Units 2.58 6.28 0.00
Total Regular & Special Enrollment
Total Regular & Special Units
Vocational Deduction
Net Total Regular & Special
District Division I
District Division II 32.86
29.16
556.00
27.87
1.29
26.58
Division I
-------------------------- CTE -------------------------
Division II Other
Intensive
0.00
0.00
Pre-K
0.00
0.00
K - 3
0.00
0.00
UNIT ALLOTMENT BASED ON ENROLLMENTS REPORTED BY LOCAL SCHOOL DISTRICTS AS OF SEPTEMBER 30, 2012
14

East Side Charter School (72)
K - 3 4 - 12 Regular 4 - 12 Basic ComplexTotal Regular
Enrollment
Units
188.00
11.60
133.00
6.65
46.00
5.48
7.00
2.69
321.00
18.25
Total Special
71.00
10.02
Units 0.00 0.00 0.00
Total Regular & Special Enrollment
Total Regular & Special Units
Vocational Deduction
Net Total Regular & Special
District Division I
District Division II 28.27
28.27
392.00
28.27
0.00
28.27* Includes 54 regular Kindergarten students.
*
Division I
-------------------------- CTE -------------------------
Division II Other
Intensive
7.00
1.17
Pre-K
0.00
0.00
K - 3
11.00
0.68
**
** Includes 2 special education Kindergarten students.
Family Foundation Academy (80)
K - 3 4 - 12 Regular 4 - 12 Basic ComplexTotal Regular
Enrollment
Units
363.00
22.41
357.00
17.85
20.00
2.38
2.00
0.76
720.00
40.26
Total Special
39.00
4.51
Units 1.92 5.75 0.00
Total Regular & Special Enrollment
Total Regular & Special Units
Vocational Deduction
Net Total Regular & Special
District Division I
District Division II 49.56
45.73
759.00
44.77
0.96
43.81* Includes 115 regular Kindergarten students.
*
Division I
-------------------------- CTE -------------------------
Division II Other
Intensive
3.00
0.50
Pre-K
0.00
0.00
K - 3
14.00
0.87
**
** Includes 5 special education Kindergarten students.
UNIT ALLOTMENT BASED ON ENROLLMENTS REPORTED BY LOCAL SCHOOL DISTRICTS AS OF SEPTEMBER 30, 2012
15

Gateway Lab School (92)
K - 3 4 - 12 Regular 4 - 12 Basic ComplexTotal Regular
Enrollment
Units
22.00
1.36
78.00
3.90
90.00
10.72
7.00
2.67
100.00
5.26
Total Special
125.00
17.32
Units 0.00 0.00 0.00
Total Regular & Special Enrollment
Total Regular & Special Units
Vocational Deduction
Net Total Regular & Special
District Division I
District Division II 22.58
22.58
225.00
22.58
0.00
22.58* Includes 0 regular Kindergarten students.
*
Division I
-------------------------- CTE -------------------------
Division II Other
Intensive
21.00
3.50
Pre-K
0.00
0.00
K - 3
7.00
0.43
**
** Includes 0 special education Kindergarten students.
Kuumba Academy Charter School (82)
K - 3 4 - 12 Regular 4 - 12 Basic ComplexTotal Regular
Enrollment
Units
177.00
10.93
72.00
3.60
7.00
0.84
0.00
0.00
249.00
14.53
Total Special
14.00
1.27
Units 0.00 0.00 0.00
Total Regular & Special Enrollment
Total Regular & Special Units
Vocational Deduction
Net Total Regular & Special
District Division I
District Division II 15.80
15.80
263.00
15.80
0.00
15.80* Includes 51 regular Kindergarten students.
*
Division I
-------------------------- CTE -------------------------
Division II Other
Intensive
0.00
0.00
Pre-K
0.00
0.00
K - 3
7.00
0.43
**
** Includes 1 special education Kindergarten students.
UNIT ALLOTMENT BASED ON ENROLLMENTS REPORTED BY LOCAL SCHOOL DISTRICTS AS OF SEPTEMBER 30, 2012
16

Las Americas Aspira Academy (69)
K - 3 4 - 12 Regular 4 - 12 Basic ComplexTotal Regular
Enrollment
Units
223.00
13.77
107.00
5.35
3.00
0.36
0.00
0.00
330.00
19.12
Total Special
8.00
0.89
Units 0.00 0.00 0.00
Total Regular & Special Enrollment
Total Regular & Special Units
Vocational Deduction
Net Total Regular & Special
District Division I
District Division II 20.01
20.01
338.00
20.01
0.00
20.01* Includes 50 regular Kindergarten students.
*
Division I
-------------------------- CTE -------------------------
Division II Other
Intensive
2.00
0.34
Pre-K
0.00
0.00
K - 3
3.00
0.19
**
** Includes 0 special education Kindergarten students.
Maurice J. Moyer Academy (75)
K - 3 4 - 12 Regular 4 - 12 Basic ComplexTotal Regular
Enrollment
Units
0.00
0.00
124.00
6.20
46.00
5.47
2.00
0.76
124.00
6.20
Total Special
58.00
7.90
Units 0.00 0.00 0.00
Total Regular & Special Enrollment
Total Regular & Special Units
Vocational Deduction
Net Total Regular & Special
District Division I
District Division II 14.10
14.10
182.00
14.10
0.00
14.10
Division I
-------------------------- CTE -------------------------
Division II Other
Intensive
10.00
1.67
Pre-K
0.00
0.00
K - 3
0.00
0.00
UNIT ALLOTMENT BASED ON ENROLLMENTS REPORTED BY LOCAL SCHOOL DISTRICTS AS OF SEPTEMBER 30, 2012
17

MOT Charter School (88)
K - 3 4 - 12 Regular 4 - 12 Basic ComplexTotal Regular
Enrollment
Units
287.00
17.72
357.00
17.85
15.00
1.80
2.00
0.76
644.00
35.57
Total Special
36.00
4.36
Units 2.07 6.20 0.00
Total Regular & Special Enrollment
Total Regular & Special Units
Vocational Deduction
Net Total Regular & Special
District Division I
District Division II 45.10
40.97
680.00
39.93
1.03
38.90* Includes 73 regular Kindergarten students.
*
Division I
-------------------------- CTE -------------------------
Division II Other
Intensive
6.00
1.00
Pre-K
0.00
0.00
K - 3
13.00
0.80
**
** Includes 3 special education Kindergarten students.
Newark Charter School (89)
K - 3 4 - 12 Regular 4 - 12 Basic ComplexTotal Regular
Enrollment
Units
499.00
30.80
760.00
38.00
50.00
5.95
4.00
1.53
1,259.00
68.80
Total Special
88.00
10.74
Units 1.39 4.17 0.00
Total Regular & Special Enrollment
Total Regular & Special Units
Vocational Deduction
Net Total Regular & Special
District Division I
District Division II 83.02
80.24
1,347.00
79.54
0.69
78.85* Includes 122 regular Kindergarten students.
*
Division I
-------------------------- CTE -------------------------
Division II Other
Intensive
11.00
1.83
Pre-K
0.00
0.00
K - 3
23.00
1.43
**
** Includes 3 special education Kindergarten students.
UNIT ALLOTMENT BASED ON ENROLLMENTS REPORTED BY LOCAL SCHOOL DISTRICTS AS OF SEPTEMBER 30, 2012
18
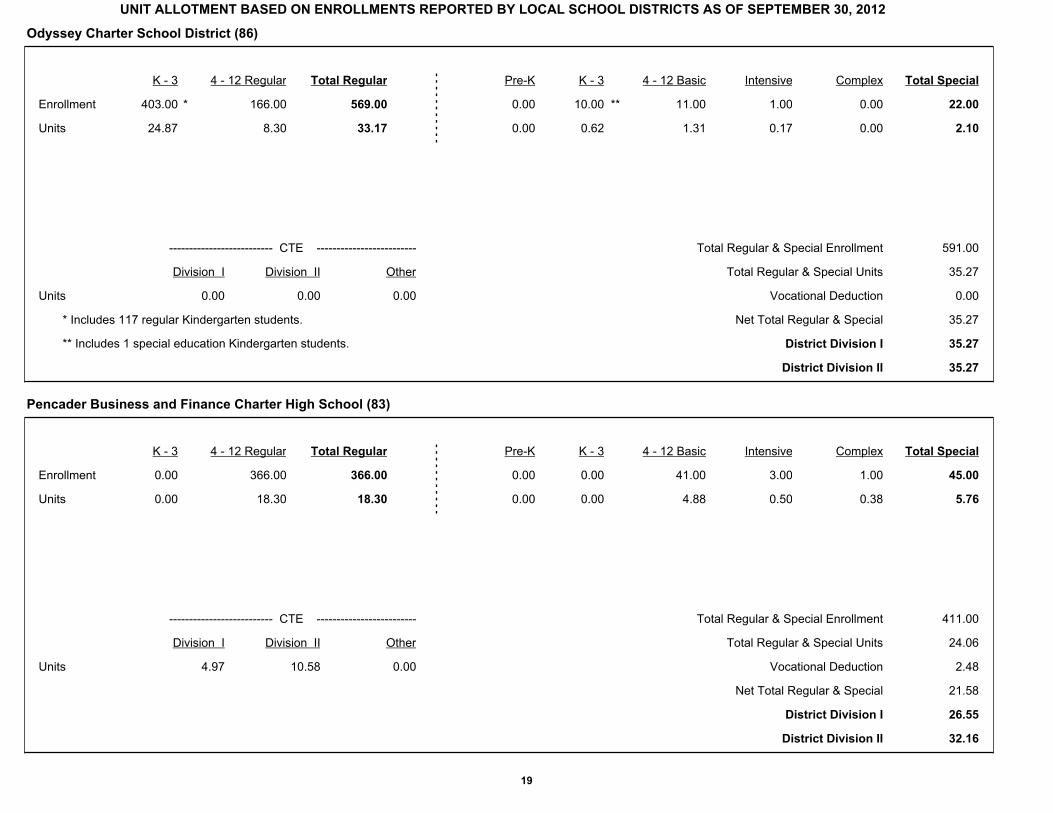
Odyssey Charter School District (86)
K - 3 4 - 12 Regular 4 - 12 Basic ComplexTotal Regular
Enrollment
Units
403.00
24.87
166.00
8.30
11.00
1.31
0.00
0.00
569.00
33.17
Total Special
22.00
2.10
Units 0.00 0.00 0.00
Total Regular & Special Enrollment
Total Regular & Special Units
Vocational Deduction
Net Total Regular & Special
District Division I
District Division II 35.27
35.27
591.00
35.27
0.00
35.27* Includes 117 regular Kindergarten students.
*
Division I
-------------------------- CTE -------------------------
Division II Other
Intensive
1.00
0.17
Pre-K
0.00
0.00
K - 3
10.00
0.62
**
** Includes 1 special education Kindergarten students.
Pencader Business and Finance Charter High School (83)
K - 3 4 - 12 Regular 4 - 12 Basic ComplexTotal Regular
Enrollment
Units
0.00
0.00
366.00
18.30
41.00
4.88
1.00
0.38
366.00
18.30
Total Special
45.00
5.76
Units 4.97 10.58 0.00
Total Regular & Special Enrollment
Total Regular & Special Units
Vocational Deduction
Net Total Regular & Special
District Division I
District Division II 32.16
26.55
411.00
24.06
2.48
21.58
Division I
-------------------------- CTE -------------------------
Division II Other
Intensive
3.00
0.50
Pre-K
0.00
0.00
K - 3
0.00
0.00
UNIT ALLOTMENT BASED ON ENROLLMENTS REPORTED BY LOCAL SCHOOL DISTRICTS AS OF SEPTEMBER 30, 2012
19

Prestige Academy (67)
K - 3 4 - 12 Regular 4 - 12 Basic ComplexTotal Regular
Enrollment
Units
0.00
0.00
244.00
12.20
40.00
4.77
2.00
0.76
244.00
12.20
Total Special
54.00
7.53
Units 0.00 0.00 0.00
Total Regular & Special Enrollment
Total Regular & Special Units
Vocational Deduction
Net Total Regular & Special
District Division I
District Division II 19.73
19.73
298.00
19.73
0.00
19.73
Division I
-------------------------- CTE -------------------------
Division II Other
Intensive
12.00
2.00
Pre-K
0.00
0.00
K - 3
0.00
0.00
Reach Academy for Girls (73)
K - 3 4 - 12 Regular 4 - 12 Basic ComplexTotal Regular
Enrollment
Units
223.00
13.76
147.00
7.35
16.00
1.91
0.00
0.00
370.00
21.11
Total Special
20.00
2.16
Units 0.00 0.00 0.00
Total Regular & Special Enrollment
Total Regular & Special Units
Vocational Deduction
Net Total Regular & Special
District Division I
District Division II 23.27
23.27
390.00
23.27
0.00
23.27* Includes 62 regular Kindergarten students.
*
Division I
-------------------------- CTE -------------------------
Division II Other
Intensive
0.00
0.00
Pre-K
0.00
0.00
K - 3
4.00
0.25
**
** Includes 1 special education Kindergarten students.
UNIT ALLOTMENT BASED ON ENROLLMENTS REPORTED BY LOCAL SCHOOL DISTRICTS AS OF SEPTEMBER 30, 2012
20

Thomas A. Edison Charter School (76)
K - 3 4 - 12 Regular 4 - 12 Basic ComplexTotal Regular
Enrollment
Units
395.00
24.38
299.00
14.95
39.00
4.65
0.00
0.00
694.00
39.33
Total Special
49.00
5.27
Units 0.00 0.00 0.00
Total Regular & Special Enrollment
Total Regular & Special Units
Vocational Deduction
Net Total Regular & Special
District Division I
District Division II 44.60
44.60
743.00
44.60
0.00
44.60* Includes 100 regular Kindergarten students.
*
Division I
-------------------------- CTE -------------------------
Division II Other
Intensive
0.00
0.00
Pre-K
0.00
0.00
K - 3
10.00
0.62
**
** Includes 0 special education Kindergarten students.
Academy of Dover Charter School (85)
K - 3 4 - 12 Regular 4 - 12 Basic ComplexTotal Regular
Enrollment
Units
229.00
14.13
26.00
1.30
2.00
0.24
4.00
1.53
255.00
15.43
Total Special
27.00
3.50
Units 0.00 0.00 0.00
Total Regular & Special Enrollment
Total Regular & Special Units
Vocational Deduction
Net Total Regular & Special
District Division I
District Division II 18.93
18.93
282.00
18.93
0.00
18.93* Includes 75 regular Kindergarten students.
*
Division I
-------------------------- CTE -------------------------
Division II Other
Intensive
4.00
0.68
Pre-K
0.00
0.00
K - 3
17.00
1.05
**
** Includes 2 special education Kindergarten students.
UNIT ALLOTMENT BASED ON ENROLLMENTS REPORTED BY LOCAL SCHOOL DISTRICTS AS OF SEPTEMBER 30, 2012
21
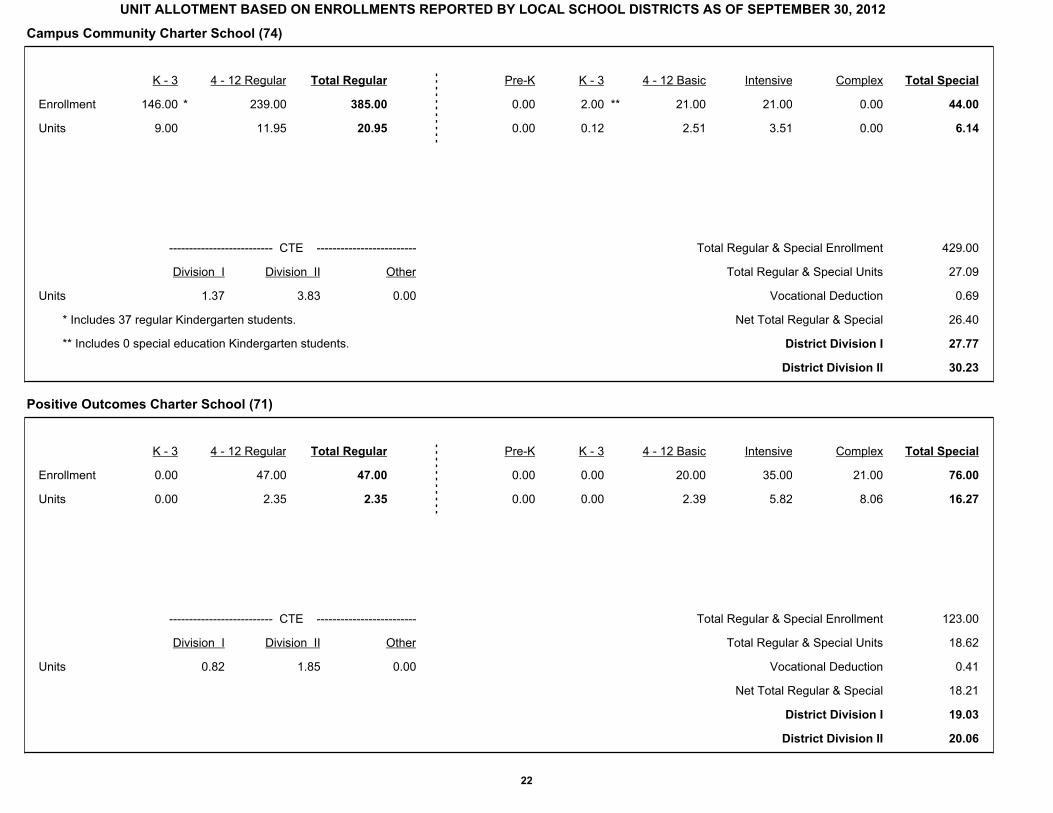
Campus Community Charter School (74)
K - 3 4 - 12 Regular 4 - 12 Basic ComplexTotal Regular
Enrollment
Units
146.00
9.00
239.00
11.95
21.00
2.51
0.00
0.00
385.00
20.95
Total Special
44.00
6.14
Units 1.37 3.83 0.00
Total Regular & Special Enrollment
Total Regular & Special Units
Vocational Deduction
Net Total Regular & Special
District Division I
District Division II 30.23
27.77
429.00
27.09
0.69
26.40* Includes 37 regular Kindergarten students.
*
Division I
-------------------------- CTE -------------------------
Division II Other
Intensive
21.00
3.51
Pre-K
0.00
0.00
K - 3
2.00
0.12
**
** Includes 0 special education Kindergarten students.
Positive Outcomes Charter School (71)
K - 3 4 - 12 Regular 4 - 12 Basic ComplexTotal Regular
Enrollment
Units
0.00
0.00
47.00
2.35
20.00
2.39
21.00
8.06
47.00
2.35
Total Special
76.00
16.27
Units 0.82 1.85 0.00
Total Regular & Special Enrollment
Total Regular & Special Units
Vocational Deduction
Net Total Regular & Special
District Division I
District Division II 20.06
19.03
123.00
18.62
0.41
18.21
Division I
-------------------------- CTE -------------------------
Division II Other
Intensive
35.00
5.82
Pre-K
0.00
0.00
K - 3
0.00
0.00
UNIT ALLOTMENT BASED ON ENROLLMENTS REPORTED BY LOCAL SCHOOL DISTRICTS AS OF SEPTEMBER 30, 2012
22

Providence Creek Academy Charter School (87)
K - 3 4 - 12 Regular 4 - 12 Basic ComplexTotal Regular
Enrollment
Units
301.00
18.58
361.00
18.05
25.00
2.98
0.00
0.00
662.00
36.63
Total Special
33.00
3.47
Units 0.00 0.00 0.00
Total Regular & Special Enrollment
Total Regular & Special Units
Vocational Deduction
Net Total Regular & Special
District Division I
District Division II 40.10
40.10
695.00
40.10
0.00
40.10* Includes 76 regular Kindergarten students.
*
Division I
-------------------------- CTE -------------------------
Division II Other
Intensive
0.00
0.00
Pre-K
0.00
0.00
K - 3
8.00
0.49
**
** Includes 1 special education Kindergarten students.
UNIT ALLOTMENT BASED ON ENROLLMENTS REPORTED BY LOCAL SCHOOL DISTRICTS AS OF SEPTEMBER 30, 2012
23
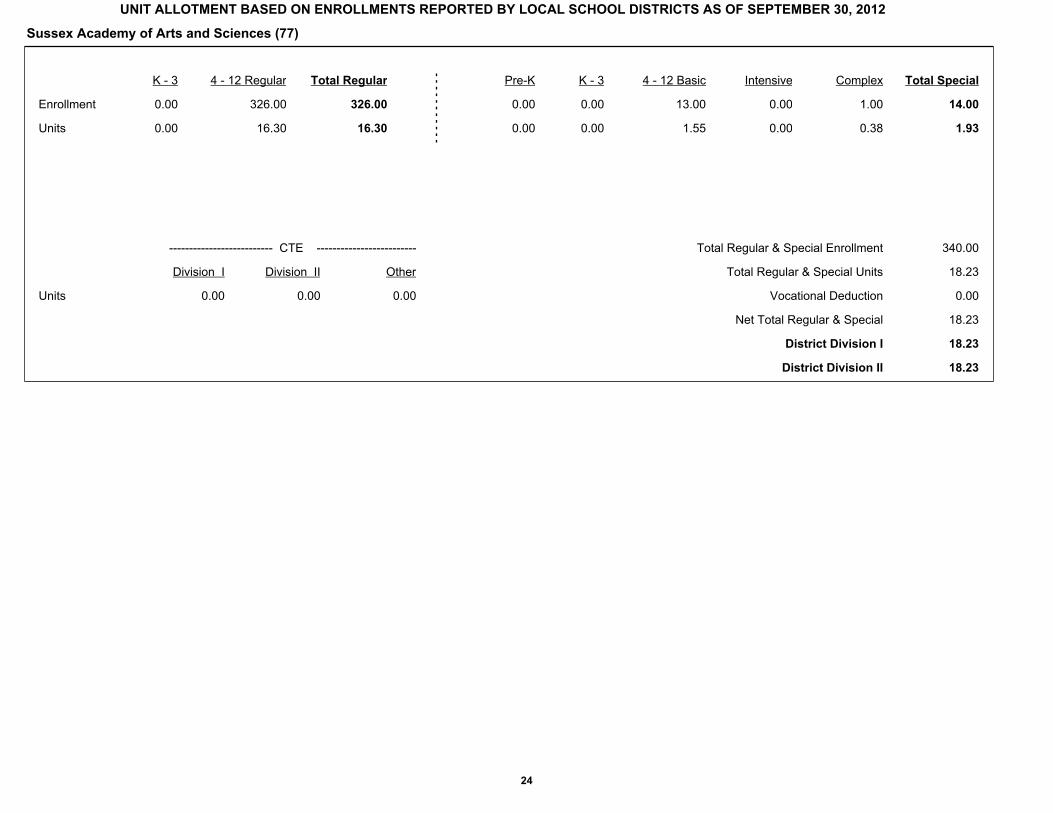
Sussex Academy of Arts and Sciences (77)
K - 3 4 - 12 Regular 4 - 12 Basic ComplexTotal Regular
Enrollment
Units
0.00
0.00
326.00
16.30
13.00
1.55
1.00
0.38
326.00
16.30
Total Special
14.00
1.93
Units 0.00 0.00 0.00
Total Regular & Special Enrollment
Total Regular & Special Units
Vocational Deduction
Net Total Regular & Special
District Division I
District Division II 18.23
18.23
340.00
18.23
0.00
18.23
Division I
-------------------------- CTE -------------------------
Division II Other
Intensive
0.00
0.00
Pre-K
0.00
0.00
K - 3
0.00
0.00
UNIT ALLOTMENT BASED ON ENROLLMENTS REPORTED BY LOCAL SCHOOL DISTRICTS AS OF SEPTEMBER 30, 2012
24

K - 3 4 - 12 Regular Pre-K 4 - 12 BasicTotal Regular
Enrollment
Units
37,292.00
2,280.70
76,132.00
3,806.60
1,232.00
96.25
8,332.00
992.12
113,424.00
6,087.30
Total Special
18,102.00
2,747.28
Units 681.05 1,918.91 0.00
Total Regular & Special Enrollment
Total Regular & Special Units
Vocational Deduction
Net Total Regular & Special
District Division I
District Division II 10,413.09
9,175.23
131,526.00
8,834.58
340.40
8,494.18* Includes 9367 regular Kindergarten students.
*
Division I
-------------------------- CTE -------------------------
Division II Other
State Total Including Dover Air Force Base
Intensive
4,064.00
677.69
Complex
2,193.00
842.47
K - 3
2,281.00
138.75
**
** Includes 462 special education Kindergarten students.
State Total Excluding Dover Air Force Base
K - 3 4 - 12 Regular Pre-K 4 - 12 BasicTotal Regular
Enrollment
Units
37,084.00
2,267.86
75,905.00
3,795.25
1,217.00
95.08
8,312.00
989.73
112,989.00
6,063.11
Total Special
18,040.00
2,739.51
Units 680.01 1,915.89 0.00
Total Regular & Special Enrollment
Total Regular & Special Units
Vocational Deduction
Net Total Regular & Special
District Division I
District Division II 10,378.63
9,142.75
131,029.00
8,802.62
339.88
8,462.74* Includes 9310 regular Kindergarten students.
*
Division I
-------------------------- CTE -------------------------
Division II Other
Intensive
4,049.00
675.18
Complex
2,190.00
841.33
K - 3
2,272.00
138.19
**
* Includes 462 special education Kindergarten students.
UNIT ALLOTMENT BASED ON ENROLLMENTS REPORTED BY LOCAL SCHOOL DISTRICTS AS OF SEPTEMBER 30, 2012
25

NOTES RELATING TO 2012 UNIT ALLOTMENTSChristina Brennen School 375 students (139.94 units): Basic 1 (0.12); Intensive 17 (2.84); Complex 356 (136.92); Regular 1 (0.06); Deduct (1.65); Voc I (3.29); Voc II (9.88); Total Div
I (141.58); Total Div II (148.17)Christina ILC 423 students (77.37 units): Basic 2 (0.24); Intensive 389 (64.83); Complex 32 (12.3); Deduct (1.87); Voc I (3.73); Voc II (11.2); Total Div I (79.23); Total Div
II (86.7)REACH/CBIP 148 students (51.26 units): Intensive 26 (4.34); Complex 122 (46.92)Sterck School 113 students (41.3 units): Intensive 10 (1.67); Complex 103 (39.63); Deduct (0.04); Voc I (0.08); Voc II (0.25); Total Div I (41.34); Total Div II (41.51)
Colonial Leach Ex VocEd 0 students (0 units): Deduct (2.8); Voc I (5.6); Voc II (16.8); Total Div I (2.8); Total Div II (14)Leach School * 94 students (34.76 units): Intensive 11 (1.83); Complex 83 (31.93); PTST 0 (1); Deduct (0.19); Voc I (0.37); Voc II (1.1); Total Div I (34.94); Total Div II
(35.67)
NCC Votech DelCastle ILC 61 students (11.03 units): Intensive 57 (9.5); Complex 4 (1.53)NCC Ex VocEd 0 students (0 units): Deduct (2.04); Voc I (4.07); Voc II (12.2); Total Div I (2.03); Total Div II (10.16)
Red Clay Meadowood Program 138 students (49.4 units): Basic 4 (0.48); Intensive 12 (2); Complex 122 (46.92); Deduct (0.89); Voc I (1.77); Voc II (5.3); Total Div I (50.28); Total Div II (53.81)
Richardson Park Lrn Centr ILC 268 students (44.6 units): PreSch 67 (5.23); Basic 2 (0.24); Intensive 170 (28.33); Complex 28 (10.75); Regular 1 (0.05)The Central School 176 students (26.75 units): Basic 86 (10.24); Intensive 83 (13.83); Complex 7 (2.68); Deduct (0.72); Voc I (1.43); Voc II (4.3); Total Div I (27.46); Total Div II
(30.33)
Caesar Rodney Charlton School * 236 students (77.37 units): Intensive 66 (10.99); Complex 170 (65.38); PTST 0 (1); Deduct (1.89); Voc I (3.77); Voc II (11.3); Total Div I (79.25); Total Div II (86.78)
Kent Elementary ILC 40 students (10.14 units): Intensive 24 (4); Complex 16 (6.14)
Capital Kent County Comm 178 students (66.16 units): PreSch 1 (0.08); Basic 1 (0.12); Intensive 8 (1.34); Complex 168 (64.62)Kent Secondary ILC 86 students (16.06 units): Intensive 78 (13); Complex 8 (3.06); Deduct (1.03); Voc I (2.06); Voc II (6.17); Total Div I (17.09); Total Div II (21.2)
Milford Milford ILC 79 students (16.63 units): Intensive 63 (10.51); Complex 16 (6.12)
Smyrna Smyrna ILC 0 students (0 units)
Cape Henlopen Cape Henlopen ILC 0 students (0 units)Sussex Consortium ILC 269 students (84.74 units): PreSch 50 (3.91); Basic 3 (0.36); Intensive 12 (2.02); Complex 204 (78.45); Deduct (1.05); Voc I (2.1); Voc II (6.29); Total Div I
(85.79); Total Div II (89.98)
Delmar Delmar Middle ILC 3 students (0.51 units): Intensive 3 (0.51)Delmar Secondary ILC 7 students (1.16 units): Intensive 7 (1.16)
Indian River Ennis * 122 students (39.64 units): Intensive 38 (6.35); Complex 84 (32.29); PTST 0 (1); Deduct (0.94); Voc I (1.87); Voc II (5.6); Total Div I (40.57); Total Div II (44.3)
Indian River ILC 74 students (6.61 units): PreSch 67 (5.23); Intensive 6 (1); Complex 1 (0.38)
Laurel Laurel ILC 16 students (3.11 units): Intensive 14 (2.34); Complex 2 (0.77)W Sussex Academy ILC 6 students (1 units): Intensive 6 (1)
Seaford Seaford ILC 52 students (8.66 units): Intensive 52 (8.66)
Woodbridge Woodbridge ILC 0 students (0 units)
* County PTST Unit
26

Delaware Department of Education and State Board of Education
PART II—DISTRICT ENROLLMENT REPORT SECTION I — REGULAR ENROLLMENT SEPTEMBER 30, 2012

REGULAR ENROLLMENT 2012New Castle County
Appoquinimink School District (29)
School Code K 1 2 3 K - 3 4 5 6 7 8 9 10 11 12 4 - 12 K - 12
Appo ECC 29013 163 0 0 0 163 0 0 0 0 0 0 0 0 0 0 163Appo HS 29024 0 0 0 0 0 0 0 0 0 0 377 356 386 312 1,431 1,431Appo ILC 29505 0 0 0 0 0 0 0 0 0 0 0 0 0 0 0 0Appo Low Inc 29507 0 0 0 0 0 0 0 0 0 0 0 0 0 0 0 0Brick Mill Elementary 29021 0 102 83 91 276 99 111 0 0 0 0 0 0 0 210 486Bunker Hill 29028 0 83 112 138 333 159 136 0 0 0 0 0 0 0 295 628Cedar Lane ECC 29022 187 0 0 0 187 0 0 0 0 0 0 0 0 0 0 187Cedar Lane Elem 29011 0 117 103 127 347 118 112 0 0 0 0 0 0 0 230 577Gateway to Learning 29508 0 0 0 0 0 0 0 0 0 0 0 0 0 0 0 0Loss Elementary 29020 0 112 114 137 363 129 111 0 0 0 0 0 0 0 240 603Meredith Middle 29017 0 0 0 0 0 0 0 210 207 217 0 0 0 0 634 634Middletown High 29018 0 0 0 0 0 0 0 0 0 0 326 291 267 224 1,108 1,108Old State ES 29032 0 129 122 128 379 142 121 0 0 0 0 0 0 0 263 642Redding Middle 29016 0 0 0 0 0 0 0 197 238 206 0 0 0 0 641 641Silver Lake Elem 29010 0 93 111 82 286 105 112 0 0 0 0 0 0 0 217 503Spring Meadow EC 29029 131 0 0 0 131 0 0 0 0 0 0 0 0 0 0 131Townsend ECC 29027 107 0 0 0 107 0 0 0 0 0 0 0 0 0 0 107Waters Middle School 29023 0 0 0 0 0 0 0 288 257 257 0 0 0 0 802 802
District Total 588 636 645 703 2,572 752 703 695 702 680 703 647 653 536 6,071 8,643
27

REGULAR ENROLLMENT 2012New Castle County
Brandywine School District (31)
School Code K 1 2 3 K - 3 4 5 6 7 8 9 10 11 12 4 - 12 K - 12
Brandywine High 31190 0 0 0 0 0 0 0 0 0 0 249 240 184 211 884 884Bush School 31510 0 0 0 0 0 0 0 0 0 0 0 0 0 0 0 0Carrcroft Elem 31112 65 89 98 50 302 68 67 0 0 0 0 0 0 0 135 437Claymont Elementary 31151 85 103 91 77 356 181 146 0 0 0 0 0 0 0 327 683Concord High 31194 0 0 0 0 0 0 0 0 0 0 248 254 301 311 1,114 1,114Forwood Elem 31124 71 73 63 63 270 66 58 0 0 0 0 0 0 0 124 394Hanby Elem 31110 81 91 85 80 337 70 66 0 0 0 0 0 0 0 136 473Harlan Elem 31156 51 57 67 58 233 48 45 0 0 0 0 0 0 0 93 326Lancashire Elem 31128 87 88 81 90 346 77 65 0 0 0 0 0 0 0 142 488Lombardy Elem 31130 79 77 82 84 322 76 78 0 0 0 0 0 0 0 154 476Maple Lane Elem 31132 70 75 70 73 288 54 60 0 0 0 0 0 0 0 114 402Mt Pleasant High 31196 0 0 0 0 0 0 0 0 0 0 281 237 138 176 832 832Mt. Pleasant Elem 31176 117 149 163 162 591 70 74 0 0 0 0 0 0 0 144 735P. S. DuPont Middle 31170 0 0 0 0 0 0 0 284 257 264 0 0 0 0 805 805Springer Middle 31178 0 0 0 0 0 0 0 234 257 238 0 0 0 0 729 729Talley Middle 31180 0 0 0 0 0 0 0 200 258 236 0 0 0 0 694 694
District Total 706 802 800 737 3,045 710 659 718 772 738 778 731 623 698 6,427 9,472
28

REGULAR ENROLLMENT 2012New Castle County
Christina School District (33)
School Code K 1 2 3 K - 3 4 5 6 7 8 9 10 11 12 4 - 12 K - 12
Alternative Programs 33537 0 1 2 6 9 5 4 6 11 6 19 1 1 0 53 62Bancroft Elem 33350 70 60 53 49 232 42 36 0 0 0 0 0 0 0 78 310Bayard Middle 33352 0 0 0 0 0 0 0 124 131 126 0 0 0 0 381 381Brader Elem 33339 76 80 79 84 319 69 98 0 0 0 0 0 0 0 167 486Brennen School 33538 0 0 0 0 0 0 0 0 0 0 0 0 0 0 0 0Brookside Elem 33310 60 65 48 49 222 49 41 0 0 0 0 0 0 0 90 312Christiana High 33390 0 0 0 0 0 0 0 0 0 0 177 215 204 143 739 739Christina Early Ed Center 33545 0 0 0 0 0 0 0 0 0 0 0 0 0 0 0 0Christina ILC 33535 0 0 0 0 0 0 0 0 0 0 0 0 0 0 0 0Downes Elem 33318 79 80 74 74 307 64 56 0 0 0 0 0 0 0 120 427Elbert-Palmer Elem 33356 49 41 38 39 167 37 41 0 0 0 0 0 0 0 78 245Gallaher Elem 33320 106 73 63 62 304 77 72 0 0 0 0 0 0 0 149 453Gauger_Cobbs Middle 33372 0 0 0 0 0 0 0 356 315 371 0 0 0 0 1,042 1,042Glasgow High 33392 0 0 0 0 0 0 0 0 0 0 263 226 214 192 895 895Jones Elem 33314 60 87 68 66 281 46 51 0 0 0 0 0 0 0 97 378Keene Elementary 33321 99 119 101 93 412 107 85 0 0 0 0 0 0 0 192 604Kirk Middle 33374 0 0 0 0 0 0 0 221 262 222 0 0 0 0 705 705Leasure Elem 33322 90 89 81 84 344 72 72 0 0 0 0 0 0 0 144 488Maclary Elem 33324 58 64 66 61 249 69 60 0 0 0 0 0 0 0 129 378Marshall Elem 33312 124 102 116 95 437 100 95 0 0 0 0 0 0 0 195 632McVey Elem 33326 87 70 67 62 286 59 53 0 0 0 0 0 0 0 112 398Newark High 33394 0 0 0 0 0 0 0 0 0 0 449 373 291 308 1,421 1,421Porter Road 33327 129 106 126 127 488 96 70 0 0 0 0 0 0 0 166 654Pulaski Elem 33358 76 74 85 56 291 65 63 0 0 0 0 0 0 0 128 419REACH/CBIP 33512 0 0 0 0 0 0 0 0 0 0 0 0 0 0 0 0Shue-Medill Middle 33376 0 0 0 0 0 0 0 289 338 288 0 0 0 0 915 915Smith Elem 33330 96 92 89 78 355 78 90 0 0 0 0 0 0 0 168 523Sterck School 33540 0 0 0 0 0 0 0 0 0 0 0 0 0 0 0 0Stubbs Elem 33362 67 44 50 50 211 58 38 0 0 0 0 0 0 0 96 307West Park Place Elem 33332 57 79 72 63 271 49 30 0 0 0 0 0 0 0 79 350Wilson Elem 33334 87 89 94 79 349 78 64 0 0 0 0 0 0 0 142 491
District Total 1,470 1,415 1,372 1,277 5,534 1,220 1,119 996 1,057 1,013 908 815 710 643 8,481 14,015
29

REGULAR ENROLLMENT 2012New Castle County
Colonial School District (34)
School Code K 1 2 3 K - 3 4 5 6 7 8 9 10 11 12 4 - 12 K - 12
Bedford Middle 34470 0 0 0 0 0 0 0 223 305 319 0 0 0 0 847 847Castle Hills Elem 34412 105 96 104 108 413 107 83 0 0 0 0 0 0 0 190 603Colwyck Elem 34450 44 48 52 50 194 47 40 0 0 0 0 0 0 0 87 281Downie Elem 34410 80 94 100 65 339 79 62 0 0 0 0 0 0 0 141 480Eisenberg Elem 34456 75 80 80 84 319 85 79 0 0 0 0 0 0 0 164 483Kathleen HW Elem 34422 182 183 155 182 702 184 185 0 0 0 0 0 0 0 369 1,071Leach School 34514 0 0 0 0 0 0 0 0 0 0 0 0 0 0 0 0McCullough Middle 34476 0 0 0 0 0 0 0 214 230 230 0 0 0 0 674 674New Castle School ILC 34522 0 0 0 0 0 0 0 0 3 6 8 3 17 3 40 40Penn High 34490 0 0 0 0 0 0 0 0 0 0 614 438 380 372 1,804 1,804Pleasantville Elem 34418 69 101 77 75 322 81 78 0 0 0 0 0 0 0 159 481Read Middle 34474 0 0 0 0 0 0 0 223 227 210 0 0 0 0 660 660Southern Elementary 34427 129 108 128 136 501 134 135 0 0 0 0 0 0 0 269 770Wilm Manor Elem 34420 60 69 78 77 284 56 64 0 0 0 0 0 0 0 120 404
District Total 744 779 774 777 3,074 773 726 660 765 765 622 441 397 375 5,524 8,598
30

REGULAR ENROLLMENT 2012New Castle County
New Castle County Votech School District (38)
School Code K 1 2 3 K - 3 4 5 6 7 8 9 10 11 12 4 - 12 K - 12
DelCastle ILC 38539 0 0 0 0 0 0 0 0 0 0 0 0 0 0 0 0Delcastle Tech High 38080 0 0 0 0 0 0 0 0 0 0 350 352 339 296 1,337 1,337Hodgson Vo-Tech High 38066 0 0 0 0 0 0 0 0 0 0 250 229 240 215 934 934Howard HS of Tech 38026 0 0 0 0 0 0 0 0 0 0 223 217 181 151 772 772St. Georges HS of Tech 38044 0 0 0 0 0 0 0 0 0 0 228 216 234 228 906 906
District Total 0 0 0 0 0 0 0 0 0 0 1,051 1,014 994 890 3,949 3,949
31

REGULAR ENROLLMENT 2012New Castle County
Red Clay Consolidated School District (32)
School Code K 1 2 3 K - 3 4 5 6 7 8 9 10 11 12 4 - 12 K - 12
A I duPont High 32292 0 0 0 0 0 0 0 0 0 0 309 235 245 249 1,038 1,038A I duPont Middle 32274 0 0 0 0 0 0 0 126 139 121 0 0 0 0 386 386Baltz Elem 32252 107 108 86 105 406 77 78 0 0 0 0 0 0 0 155 561Brandywine Springs 32261 105 123 118 116 462 138 116 103 93 100 0 0 0 0 550 1,012Calloway Art School 32286 0 0 0 0 0 0 0 140 143 137 119 115 114 107 875 875Conrad School of Science 32284 0 0 0 0 0 0 0 154 158 161 172 154 138 112 1,049 1,049Dickinson High 32290 0 0 0 0 0 0 0 0 0 0 231 157 142 80 610 610First State School 32530 0 0 0 0 0 0 0 0 0 0 0 0 0 0 0 0Forest Oak Elem 32240 73 102 83 77 335 86 87 0 0 0 0 0 0 0 173 508H B duPont Middle 32276 0 0 0 0 0 0 0 207 240 259 0 0 0 0 706 706Heritage Elem 32242 94 94 98 98 384 102 77 0 0 0 0 0 0 0 179 563Highlands Elem 32244 44 71 57 53 225 49 44 0 0 0 0 0 0 0 93 318Linden Hill Elem 32250 132 137 156 133 558 150 134 0 0 0 0 0 0 0 284 842Marbrook Elem 32256 84 88 100 81 353 91 65 0 0 0 0 0 0 0 156 509McKean High 32294 0 0 0 0 0 0 0 0 0 0 199 174 166 165 704 704Meadowood Program 32516 0 0 0 0 0 0 0 0 0 0 0 0 0 0 0 0Mote Elem 32264 113 98 98 97 406 86 73 0 0 0 0 0 0 0 159 565North Star Elementary 32270 111 115 110 121 457 135 136 0 0 0 0 0 0 0 271 728Richardson Park Elem 32254 67 75 58 60 260 77 56 0 0 0 0 0 0 0 133 393Richardson Park Lrn Centr ILC
32526 0 0 0 0 0 0 1 0 0 0 0 0 0 0 1 1
Richey Elem 32260 78 48 57 67 250 66 48 0 0 0 0 0 0 0 114 364Shortlidge Elem 32248 58 48 36 48 190 38 44 0 0 0 0 0 0 0 82 272Skyline Middle 32280 0 0 0 0 0 0 0 247 234 241 0 0 0 0 722 722Stanton Middle 32282 0 0 0 0 0 0 0 172 195 201 0 0 0 0 568 568The Central School 32527 0 0 0 0 0 0 0 0 0 0 0 0 0 0 0 0Warner Elem 32266 93 91 70 73 327 52 67 0 0 0 0 0 0 0 119 446William Lewis Elem 32246 94 103 81 61 339 55 55 0 0 0 0 0 0 0 110 449
District Total 1,253 1,301 1,208 1,190 4,952 1,202 1,081 1,149 1,202 1,220 1,030 835 805 713 9,237 14,189
32

REGULAR ENROLLMENT 2012Kent County
Caesar Rodney School District (10)
School Code K 1 2 3 K - 3 4 5 6 7 8 9 10 11 12 4 - 12 K - 12
Brown Elem 10622 0 73 50 81 204 69 78 0 0 0 0 0 0 0 147 351Caesar Rodney High 10626 0 0 0 0 0 0 0 0 0 0 523 470 413 360 1,766 1,766Charlton School 10630 0 0 0 0 0 0 0 0 0 0 0 0 0 0 0 0DAFB Choice 10629 22 26 15 24 87 35 21 26 26 32 0 0 0 0 140 227Fifer Middle 10625 0 0 0 0 0 0 0 246 262 244 0 0 0 0 752 752Frear Elem 10610 0 133 94 115 342 100 94 0 0 0 0 0 0 0 194 536Kent Elementary ILC 10615 0 0 0 0 0 0 0 0 0 0 0 0 0 0 0 0McIlvaine Elem 10611 428 0 0 0 428 0 0 0 0 0 0 0 0 0 0 428Postlethwait Middle 10621 0 0 0 0 0 0 0 244 242 237 0 0 0 0 723 723Simpson Elem 10620 0 72 80 98 250 80 86 0 0 0 0 0 0 0 166 416Star Hill Elem 10618 0 108 83 83 274 89 98 0 0 0 0 0 0 0 187 461Stokes Elem 10616 0 81 85 72 238 94 71 0 0 0 0 0 0 0 165 403
District Total 450 493 407 473 1,823 467 448 516 530 513 523 470 413 360 4,240 6,063
33
REGULAR ENROLLMENT 2012Kent County
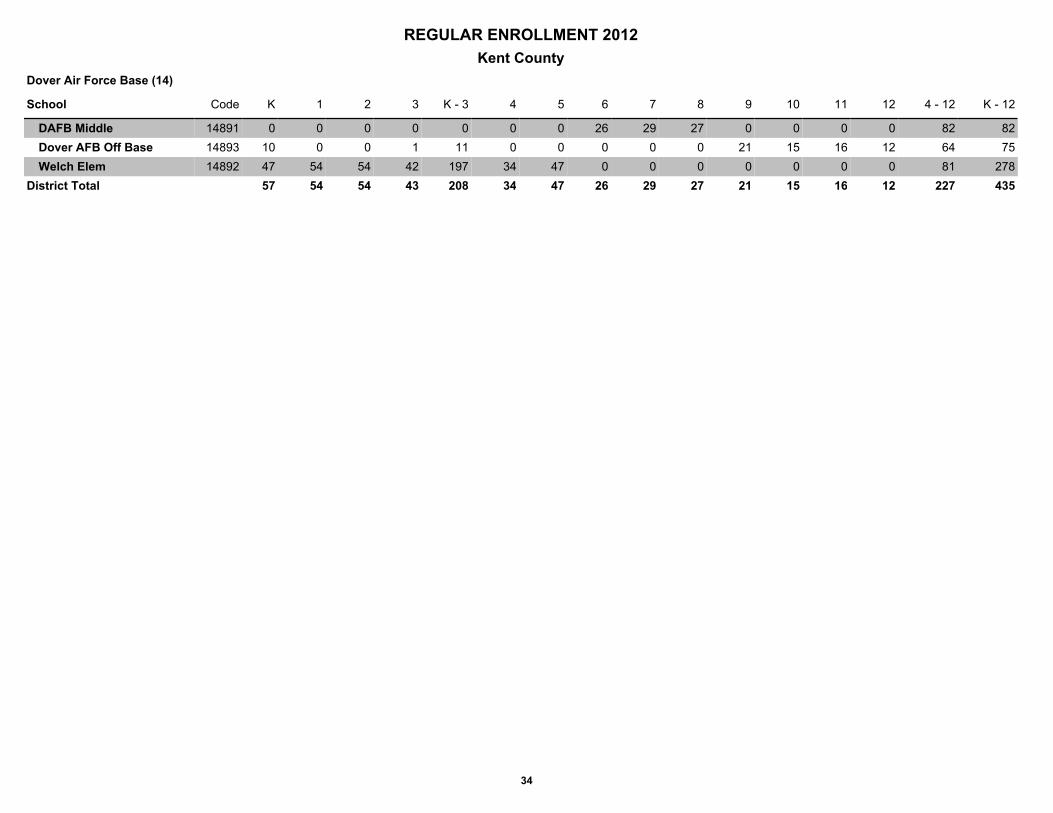
Dover Air Force Base (14)
School Code K 1 2 3 K - 3 4 5 6 7 8 9 10 11 12 4 - 12 K - 12
DAFB Middle 14891 0 0 0 0 0 0 0 26 29 27 0 0 0 0 82 82Dover AFB Off Base 14893 10 0 0 1 11 0 0 0 0 0 21 15 16 12 64 75Welch Elem 14892 47 54 54 42 197 34 47 0 0 0 0 0 0 0 81 278
District Total 57 54 54 43 208 34 47 26 29 27 21 15 16 12 227 435
34

REGULAR ENROLLMENT 2012Kent County
Capital School District (13)
School Code K 1 2 3 K - 3 4 5 6 7 8 9 10 11 12 4 - 12 K - 12
Capital ILC 13649 0 0 0 0 0 0 0 0 0 0 0 0 0 0 0 0Central Middle 13644 0 0 0 0 0 0 0 0 382 376 0 0 0 0 758 758Dover High 13648 0 0 0 0 0 0 0 0 0 0 429 363 318 284 1,394 1,394East Dover Elem 13632 59 56 59 54 228 58 0 0 0 0 0 0 0 0 58 286Fairview Elem 13638 73 61 68 53 255 57 0 0 0 0 0 0 0 0 57 312Hartly Elem 13640 83 73 72 68 296 66 0 0 0 0 0 0 0 0 66 362Kent County Comm 13650 0 0 0 0 0 0 0 0 0 0 0 0 0 0 0 0Kent Secondary ILC 13655 0 0 0 0 0 0 0 0 0 0 0 0 0 0 0 0North Dover Elem 13635 69 74 77 68 288 68 0 0 0 0 0 0 0 0 68 356South Dover Elem 13634 83 79 89 85 336 60 0 0 0 0 0 0 0 0 60 396Towne Point Elem 13642 52 59 50 54 215 54 0 0 0 0 0 0 0 0 54 269Washington Elem 13636 51 51 55 51 208 55 0 0 0 0 0 0 0 0 55 263William Henry Middle 13646 0 0 0 0 0 0 399 412 0 0 0 0 0 0 811 811
District Total 470 453 470 433 1,826 418 399 412 382 376 429 363 318 284 3,381 5,207
35

REGULAR ENROLLMENT 2012Kent County
Lake Forest School District (15)
School Code K 1 2 3 K - 3 4 5 6 7 8 9 10 11 12 4 - 12 K - 12
Del. Childhood Cntr 15663 0 0 0 0 0 0 0 0 0 0 0 0 0 0 0 0L F Central Elem 15669 0 0 0 0 0 274 253 0 0 0 0 0 0 0 527 527L F East Elem 15658 71 75 76 68 290 0 0 0 0 0 0 0 0 0 0 290L F North Elem 15660 101 121 109 90 421 0 0 0 0 0 0 0 0 0 0 421L F South Elem 15662 101 120 101 96 418 0 0 0 0 0 0 0 0 0 0 418Lake Forest ILC 15659 0 0 0 0 0 0 0 0 0 0 0 0 0 0 0 0Lake Forest High 15665 0 0 0 0 0 0 0 0 0 0 225 198 183 173 779 779W T Chipman Middle 15664 0 0 0 0 0 0 0 288 294 252 0 0 0 0 834 834
District Total 273 316 286 254 1,129 274 253 288 294 252 225 198 183 173 2,140 3,269
36

REGULAR ENROLLMENT 2012Kent County
Milford School District (18)
School Code K 1 2 3 K - 3 4 5 6 7 8 9 10 11 12 4 - 12 K - 12
Banneker Elem 18668 0 105 87 87 279 88 93 0 0 0 0 0 0 0 181 460Central Academy 18675 0 0 0 0 0 0 0 0 0 287 241 0 0 0 528 528Milford High 18678 0 0 0 0 0 0 0 0 0 0 39 243 233 227 742 742Milford ILC 18679 0 0 0 0 0 0 0 0 0 0 0 0 0 0 0 0Milford Middle 18676 0 0 0 0 0 0 0 296 270 0 0 0 0 0 566 566Mispillion Elementary 18673 0 105 100 97 302 90 97 0 0 0 0 0 0 0 187 489Morris Early Child 18670 311 0 0 0 311 0 0 0 0 0 0 0 0 0 0 311Ross Elem 18672 0 109 99 98 306 108 89 0 0 0 0 0 0 0 197 503
District Total 311 319 286 282 1,198 286 279 296 270 287 280 243 233 227 2,401 3,599
37

REGULAR ENROLLMENT 2012Kent County
Polytech School District (39)
School Code K 1 2 3 K - 3 4 5 6 7 8 9 10 11 12 4 - 12 K - 12
Polytech High 39652 0 0 0 0 0 0 0 0 0 0 285 267 276 251 1,079 1,079District Total 0 0 0 0 0 0 0 0 0 0 285 267 276 251 1,079 1,079
38
REGULAR ENROLLMENT 2012Kent County
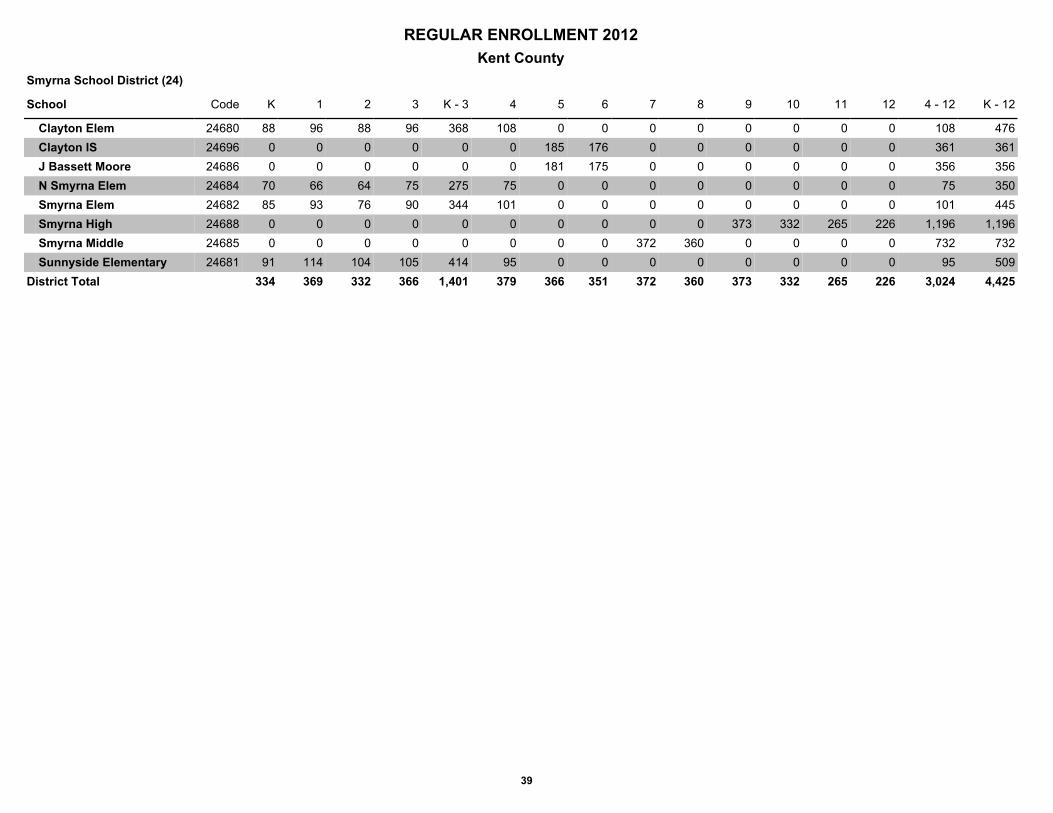
Smyrna School District (24)
School Code K 1 2 3 K - 3 4 5 6 7 8 9 10 11 12 4 - 12 K - 12
Clayton Elem 24680 88 96 88 96 368 108 0 0 0 0 0 0 0 0 108 476Clayton IS 24696 0 0 0 0 0 0 185 176 0 0 0 0 0 0 361 361J Bassett Moore 24686 0 0 0 0 0 0 181 175 0 0 0 0 0 0 356 356N Smyrna Elem 24684 70 66 64 75 275 75 0 0 0 0 0 0 0 0 75 350Smyrna Elem 24682 85 93 76 90 344 101 0 0 0 0 0 0 0 0 101 445Smyrna High 24688 0 0 0 0 0 0 0 0 0 0 373 332 265 226 1,196 1,196Smyrna Middle 24685 0 0 0 0 0 0 0 0 372 360 0 0 0 0 732 732Sunnyside Elementary 24681 91 114 104 105 414 95 0 0 0 0 0 0 0 0 95 509
District Total 334 369 332 366 1,401 379 366 351 372 360 373 332 265 226 3,024 4,425
39
REGULAR ENROLLMENT 2012Sussex County
Cape Henlopen School District (17)
School Code K 1 2 3 K - 3 4 5 6 7 8 9 10 11 12 4 - 12 K - 12
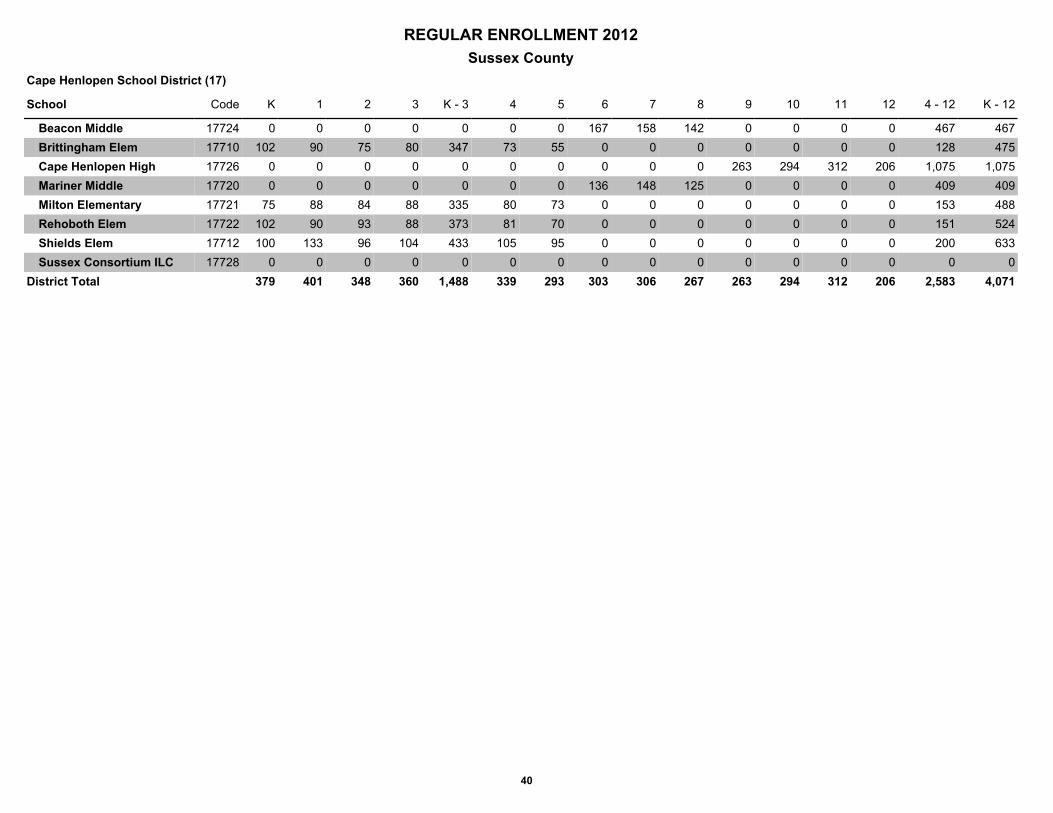
Beacon Middle 17724 0 0 0 0 0 0 0 167 158 142 0 0 0 0 467 467Brittingham Elem 17710 102 90 75 80 347 73 55 0 0 0 0 0 0 0 128 475Cape Henlopen High 17726 0 0 0 0 0 0 0 0 0 0 263 294 312 206 1,075 1,075Mariner Middle 17720 0 0 0 0 0 0 0 136 148 125 0 0 0 0 409 409Milton Elementary 17721 75 88 84 88 335 80 73 0 0 0 0 0 0 0 153 488Rehoboth Elem 17722 102 90 93 88 373 81 70 0 0 0 0 0 0 0 151 524Shields Elem 17712 100 133 96 104 433 105 95 0 0 0 0 0 0 0 200 633Sussex Consortium ILC 17728 0 0 0 0 0 0 0 0 0 0 0 0 0 0 0 0
District Total 379 401 348 360 1,488 339 293 303 306 267 263 294 312 206 2,583 4,071
40

REGULAR ENROLLMENT 2012Sussex County
Delmar School District (37)
School Code K 1 2 3 K - 3 4 5 6 7 8 9 10 11 12 4 - 12 K - 12
Delmar Middle 37733 0 0 0 0 0 0 174 159 154 159 0 0 0 0 646 646Delmar Middle ILC 37739 0 0 0 0 0 0 0 0 0 0 0 0 0 0 0 0Delmar Secondary ILC 37737 0 0 0 0 0 0 0 0 0 0 0 0 0 0 0 0Delmar Sr High 37730 0 0 0 0 0 0 0 0 0 0 149 134 147 132 562 562
District Total 0 0 0 0 0 0 174 159 154 159 149 134 147 132 1,208 1,208
41
REGULAR ENROLLMENT 2012Sussex County
Indian River School District (36)
School Code K 1 2 3 K - 3 4 5 6 7 8 9 10 11 12 4 - 12 K - 12
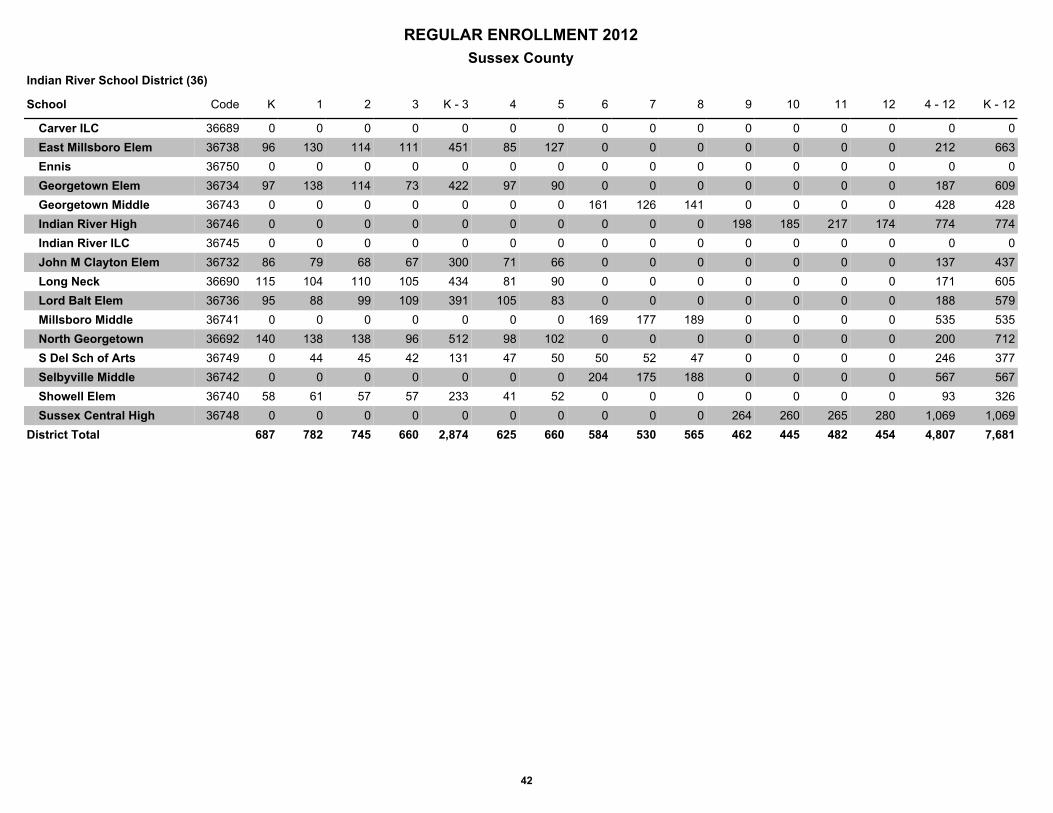
Carver ILC 36689 0 0 0 0 0 0 0 0 0 0 0 0 0 0 0 0East Millsboro Elem 36738 96 130 114 111 451 85 127 0 0 0 0 0 0 0 212 663Ennis 36750 0 0 0 0 0 0 0 0 0 0 0 0 0 0 0 0Georgetown Elem 36734 97 138 114 73 422 97 90 0 0 0 0 0 0 0 187 609Georgetown Middle 36743 0 0 0 0 0 0 0 161 126 141 0 0 0 0 428 428Indian River High 36746 0 0 0 0 0 0 0 0 0 0 198 185 217 174 774 774Indian River ILC 36745 0 0 0 0 0 0 0 0 0 0 0 0 0 0 0 0John M Clayton Elem 36732 86 79 68 67 300 71 66 0 0 0 0 0 0 0 137 437Long Neck 36690 115 104 110 105 434 81 90 0 0 0 0 0 0 0 171 605Lord Balt Elem 36736 95 88 99 109 391 105 83 0 0 0 0 0 0 0 188 579Millsboro Middle 36741 0 0 0 0 0 0 0 169 177 189 0 0 0 0 535 535North Georgetown 36692 140 138 138 96 512 98 102 0 0 0 0 0 0 0 200 712S Del Sch of Arts 36749 0 44 45 42 131 47 50 50 52 47 0 0 0 0 246 377Selbyville Middle 36742 0 0 0 0 0 0 0 204 175 188 0 0 0 0 567 567Showell Elem 36740 58 61 57 57 233 41 52 0 0 0 0 0 0 0 93 326Sussex Central High 36748 0 0 0 0 0 0 0 0 0 0 264 260 265 280 1,069 1,069
District Total 687 782 745 660 2,874 625 660 584 530 565 462 445 482 454 4,807 7,681
42

REGULAR ENROLLMENT 2012Sussex County
Laurel School District (16)
School Code K 1 2 3 K - 3 4 5 6 7 8 9 10 11 12 4 - 12 K - 12
Dunbar Elem 16753 177 190 0 0 367 0 0 0 0 0 0 0 0 0 0 367Laurel High 16756 0 0 0 0 0 0 0 0 0 0 90 112 80 100 382 382Laurel ILC 16781 0 0 0 0 0 0 0 0 0 0 0 0 0 0 0 0Laurel Intermediate 16755 0 0 0 0 0 0 144 112 0 0 0 0 0 0 256 256Laurel Middle 16754 0 0 0 0 0 0 0 0 125 132 0 0 0 0 257 257N Laurel Elem 16752 0 0 158 188 346 150 0 0 0 0 0 0 0 0 150 496W Sussex Academy ILC 16765 0 0 0 0 0 0 0 0 0 0 0 0 0 0 0 0
District Total 177 190 158 188 713 150 144 112 125 132 90 112 80 100 1,045 1,758
43

REGULAR ENROLLMENT 2012Sussex County
Seaford School District (23)
School Code K 1 2 3 K - 3 4 5 6 7 8 9 10 11 12 4 - 12 K - 12
Blades Elementary 23761 77 94 90 93 354 78 67 0 0 0 0 0 0 0 145 499Fred Douglass Elem 23762 68 52 69 60 249 61 38 0 0 0 0 0 0 0 99 348Seaford Autistic Program 23763 0 0 0 0 0 0 0 0 0 0 0 0 0 0 0 0Seaford Central Elem 23759 89 73 78 56 296 71 52 0 0 0 0 0 0 0 123 419Seaford High 23766 0 0 0 0 0 0 0 0 0 0 183 165 120 165 633 633Seaford ILC 23767 0 0 0 0 0 0 0 0 0 0 0 0 0 0 0 0Seaford Middle 23764 0 0 0 0 0 0 69 207 210 205 0 0 0 0 691 691Sussex Ortho/Vis Han 23768 0 0 0 0 0 0 0 0 0 0 0 0 0 0 0 0West Seaford Elem 23760 67 66 59 50 242 47 35 0 0 0 0 0 0 0 82 324
District Total 301 285 296 259 1,141 257 261 207 210 205 183 165 120 165 1,773 2,914
44

REGULAR ENROLLMENT 2012Sussex County
Sussex Technical School District (40)
School Code K 1 2 3 K - 3 4 5 6 7 8 9 10 11 12 4 - 12 K - 12
Sussex Tech High 40770 0 0 0 0 0 0 0 0 0 0 394 314 304 280 1,292 1,292District Total 0 0 0 0 0 0 0 0 0 0 394 314 304 280 1,292 1,292
45

REGULAR ENROLLMENT 2012Sussex County
Woodbridge School District (35)
School Code K 1 2 3 K - 3 4 5 6 7 8 9 10 11 12 4 - 12 K - 12
Phillis Wheatley Middle 35775 0 0 0 0 0 0 179 166 153 153 0 0 0 0 651 651Woodbridge Elem 35776 182 173 185 143 683 153 0 0 0 0 0 0 0 0 153 836Woodbridge High 35780 0 0 0 0 0 0 0 0 0 0 127 125 149 85 486 486
District Total 182 173 185 143 683 153 179 166 153 153 127 125 149 85 1,290 1,973
46

New Castle CountyAppoquinimink 588 636 645 703 2,572 752 703 695 702 680 703 647 653 536 6,071 8,643Brandywine 706 802 800 737 3,045 710 659 718 772 738 778 731 623 698 6,427 9,472Christina 1,470 1,415 1,372 1,277 5,534 1,220 1,119 996 1,057 1,013 908 815 710 643 8,481 14,015Colonial 744 779 774 777 3,074 773 726 660 765 765 622 441 397 375 5,524 8,598NCC Votech 0 0 0 0 0 0 0 0 0 0 1,051 1014 994 890 3,949 3,949Red Clay 1,253 1,301 1,208 1,190 4,952 1,202 1,081 1,149 1,202 1,220 1,030 835 805 713 9,237 14,189
CountyTotal 4,761 4,933 4,799 4,684 19,177 4,657 4,288 4,218 4,498 4,416 5,092 4,483 4,182 3,855 39,689 58,866
Kent CountyCaesar Rodney 450 493 407 473 1,823 467 448 516 530 513 523 470 413 360 4,240 6,063Capital 470 453 470 433 1,826 418 399 412 382 376 429 363 318 284 3,381 5,207DAFB 57 54 54 43 208 34 47 26 29 27 21 15 16 12 227 435Lake Forest 273 316 286 254 1,129 274 253 288 294 252 225 198 183 173 2,140 3,269Milford 311 319 286 282 1,198 286 279 296 270 287 280 243 233 227 2,401 3,599Polytech 0 0 0 0 0 0 0 0 0 0 285 267 276 251 1,079 1,079Smyrna 334 369 332 366 1,401 379 366 351 372 360 373 332 265 226 3,024 4,425
CountyTotal 1,895 2,004 1,835 1,851 7,585 1,858 1,792 1,889 1,877 1,815 2,136 1,888 1,704 1,533 16,492 24,077
Sussex CountyCape Henlopen 379 401 348 360 1,488 339 293 303 306 267 263 294 312 206 2,583 4,071Delmar 0 0 0 0 0 0 174 159 154 159 149 134 147 132 1,208 1,208Indian River 687 782 745 660 2,874 625 660 584 530 565 462 445 482 454 4,807 7,681Laurel 177 190 158 188 713 150 144 112 125 132 90 112 80 100 1,045 1,758Seaford 301 285 296 259 1,141 257 261 207 210 205 183 165 120 165 1,773 2,914Sussex Technical 0 0 0 0 0 0 0 0 0 0 394 314 304 280 1,292 1,292Woodbridge 182 173 185 143 683 153 179 166 153 153 127 125 149 85 1,290 1,973
CountyTotal 1,726 1,831 1,732 1,610 6,899 1,524 1,711 1,531 1,478 1,481 1,668 1,589 1,594 1,422 13,998 20,897
All Counties and Districts 8,382 8,768 8,366 8,145 33,661 8,039 7,791 7,638 7,853 7,712 8,896 7,960 7,480 6,810 70,179 103,840
All less DAFB 8,325 8,714 8,312 8,102 33,453 8,005 7,744 7,612 7,824 7,685 8,875 7,945 7,464 6,798 69,952 103,405
REGULAR ENROLLMENT 2012DISTRICT SUMMARY
K 1 2 3 K - 3 4 5 6 7 8 9 10 11 12 4 - 12 K - 12
47

Delaware Department of Education and State Board of Education
PART II—DISTRICT ENROLLMENT REPORT SECTION I — SPECIAL EDUCATION ENROLLMENT SEPTEMBER 30, 2012
NEEDS BASED UNIT CATEGORIES:
Pre-K (Special Education)
K-3 (Special Education)
4-12 Basic Special Education (Basic)
Pre K-12 Intensive Special Education (Intensive)
Pre K-12 Complex Special Education (Complex)

SPECIAL EDUCATION ENROLLMENT 2012New Castle County
Appoquinimink School District (29)
K - 3 Special Education Basic 4 - 12 Intensive Complex Total
School School Code PreK K 1 - 3 Total Grades 4-12 All Grades All Grades All Grades School
Appo ECC 29013 6 14 0 14 0 0 0 20 Appo ECCAppo HS 29024 0 0 0 0 69 11 2 82 Appo HSAppo ILC 29505 0 0 2 2 13 68 3 86 Appo ILCAppo Low Inc 29507 0 1 0 1 0 52 20 73 Appo Low IncBrick Mill Elementary 29021 0 0 19 19 17 4 2 42 Brick Mill ElementaryBunker Hill 29028 0 0 19 19 18 2 0 39 Bunker HillCedar Lane ECC 29022 1 3 0 3 0 1 0 5 Cedar Lane ECCCedar Lane Elem 29011 0 0 7 7 21 5 3 36 Cedar Lane ElemGateway to Learning 29508 75 0 0 0 0 3 1 79 Gateway to Learning Loss Elementary 29020 0 0 18 18 13 2 0 33 Loss ElementaryMeredith Middle 29017 0 0 0 0 70 6 1 77 Meredith MiddleMiddletown High 29018 0 0 0 0 78 31 6 115 Middletown HighOld State ES 29032 0 0 39 39 28 1 0 68 Old State ESRedding Middle 29016 0 0 0 0 86 9 0 95 Redding MiddleSilver Lake Elem 29010 0 0 22 22 27 2 1 52 Silver Lake ElemSpring Meadow EC 29029 0 3 0 3 0 0 0 3 Spring Meadow ECTownsend ECC 29027 0 1 0 1 0 0 0 1 Townsend ECCWaters Middle School 29023 0 0 0 0 56 11 3 70 Waters Middle School
District Total 82 22 126 148 496 208 42 976 District Total
48
SPECIAL EDUCATION ENROLLMENT 2012New Castle County
Brandywine School District (31)
K - 3 Special Education Basic 4 - 12 Intensive Complex Total
School School Code PreK K 1 - 3 Total Grades 4-12 All Grades All Grades All Grades School
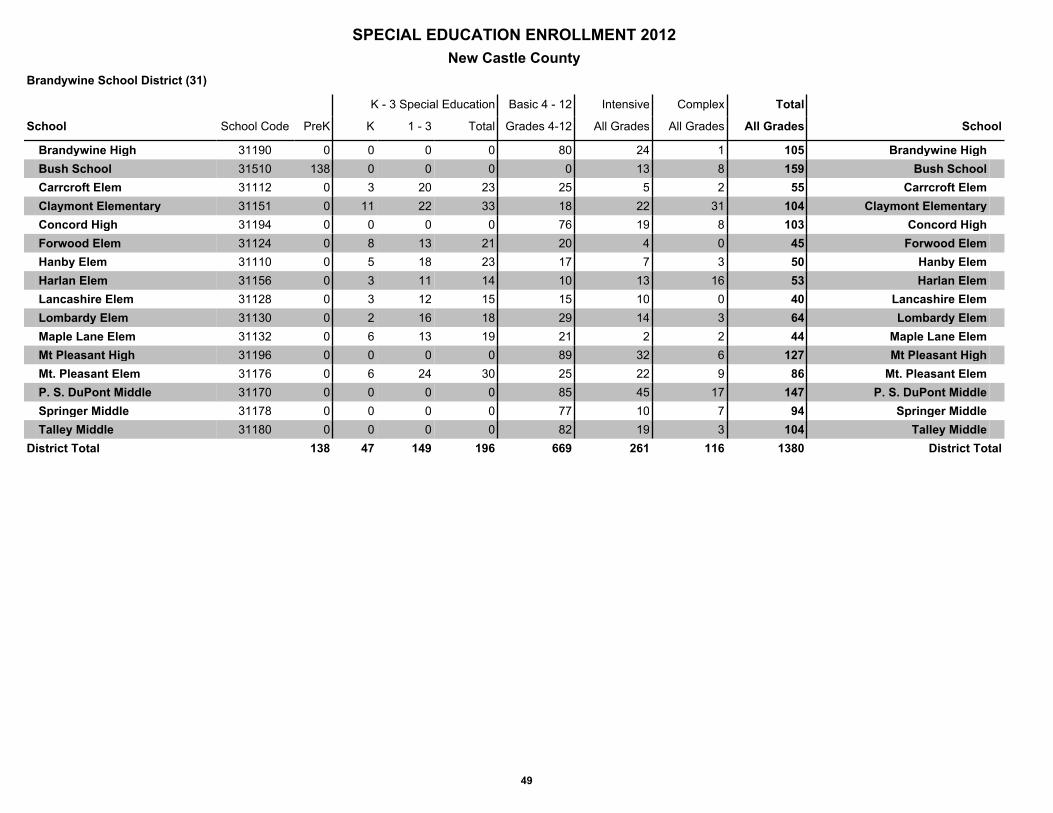
Brandywine High 31190 0 0 0 0 80 24 1 105 Brandywine HighBush School 31510 138 0 0 0 0 13 8 159 Bush SchoolCarrcroft Elem 31112 0 3 20 23 25 5 2 55 Carrcroft ElemClaymont Elementary 31151 0 11 22 33 18 22 31 104 Claymont ElementaryConcord High 31194 0 0 0 0 76 19 8 103 Concord HighForwood Elem 31124 0 8 13 21 20 4 0 45 Forwood ElemHanby Elem 31110 0 5 18 23 17 7 3 50 Hanby ElemHarlan Elem 31156 0 3 11 14 10 13 16 53 Harlan ElemLancashire Elem 31128 0 3 12 15 15 10 0 40 Lancashire ElemLombardy Elem 31130 0 2 16 18 29 14 3 64 Lombardy ElemMaple Lane Elem 31132 0 6 13 19 21 2 2 44 Maple Lane ElemMt Pleasant High 31196 0 0 0 0 89 32 6 127 Mt Pleasant HighMt. Pleasant Elem 31176 0 6 24 30 25 22 9 86 Mt. Pleasant ElemP. S. DuPont Middle 31170 0 0 0 0 85 45 17 147 P. S. DuPont MiddleSpringer Middle 31178 0 0 0 0 77 10 7 94 Springer MiddleTalley Middle 31180 0 0 0 0 82 19 3 104 Talley Middle
District Total 138 47 149 196 669 261 116 1380 District Total
49

SPECIAL EDUCATION ENROLLMENT 2012New Castle County
Christina School District (33)
K - 3 Special Education Basic 4 - 12 Intensive Complex Total
School School Code PreK K 1 - 3 Total Grades 4-12 All Grades All Grades All Grades School
Alternative Programs 33537 0 0 2 2 12 7 1 22 Alternative ProgramsBancroft Elem 33350 0 8 16 24 7 16 0 47 Bancroft ElemBayard Middle 33352 0 0 0 0 79 13 0 92 Bayard MiddleBrader Elem 33339 0 2 11 13 25 2 0 40 Brader ElemBrennen School 33538 0 0 1 1 1 17 356 375 Brennen SchoolBrookside Elem 33310 0 1 9 10 16 1 0 27 Brookside ElemChristiana High 33390 0 0 0 0 84 13 0 97 Christiana HighChristina Early Ed Center 33545 226 0 0 0 0 47 16 289 Christina Early Ed CenterChristina ILC 33535 0 0 0 0 2 389 32 423 Christina ILCDownes Elem 33318 0 1 10 11 16 3 1 31 Downes ElemElbert-Palmer Elem 33356 0 4 11 15 10 1 0 26 Elbert-Palmer ElemGallaher Elem 33320 0 2 6 8 11 13 1 33 Gallaher ElemGauger_Cobbs Middle 33372 0 0 0 0 118 10 0 128 Gauger_Cobbs MiddleGlasgow High 33392 0 0 0 0 83 4 0 87 Glasgow HighJones Elem 33314 0 3 16 19 14 5 1 39 Jones ElemKeene Elementary 33321 0 9 30 39 25 18 0 82 Keene ElementaryKirk Middle 33374 0 0 0 0 64 12 1 77 Kirk MiddleLeasure Elem 33322 0 3 18 21 13 4 0 38 Leasure ElemMaclary Elem 33324 0 8 11 19 9 3 0 31 Maclary ElemMarshall Elem 33312 0 3 16 19 24 5 1 49 Marshall ElemMcVey Elem 33326 0 7 12 19 8 7 0 34 McVey ElemNewark High 33394 0 0 0 0 91 18 0 109 Newark HighPorter Road 33327 0 3 15 18 23 11 1 53 Porter RoadPulaski Elem 33358 0 2 10 12 22 3 0 37 Pulaski ElemREACH/CBIP 33512 0 0 0 0 0 26 122 148 REACH/CBIPShue-Medill Middle 33376 0 0 0 0 96 16 1 113 Shue-Medill MiddleSmith Elem 33330 0 6 3 9 12 11 5 37 Smith ElemSterck School 33540 0 0 0 0 0 10 103 113 Sterck SchoolStubbs Elem 33362 0 0 10 10 20 4 0 34 Stubbs ElemWest Park Place Elem 33332 0 2 5 7 5 11 0 23 West Park Place ElemWilson Elem 33334 0 3 26 29 16 12 1 58 Wilson Elem
District Total 226 67 238 305 906 712 643 2792 District Total
50

SPECIAL EDUCATION ENROLLMENT 2012New Castle County
Colonial School District (34)
K - 3 Special Education Basic 4 - 12 Intensive Complex Total
School School Code PreK K 1 - 3 Total Grades 4-12 All Grades All Grades All Grades School
Bedford Middle 34470 0 0 0 0 88 0 1 89 Bedford MiddleCastle Hills Elem 34412 0 6 22 28 24 1 0 53 Castle Hills ElemColwyck Elem 34450 96 5 12 17 8 17 0 138 Colwyck ElemDownie Elem 34410 0 6 11 17 24 3 0 44 Downie ElemEisenberg Elem 34456 0 1 25 26 27 1 0 54 Eisenberg ElemKathleen HW Elem 34422 0 8 28 36 28 0 1 65 Kathleen HW ElemLeach School 34514 0 0 0 0 0 11 83 94 Leach SchoolMcCullough Middle 34476 0 0 0 0 106 3 0 109 McCullough MiddleNew Castle School ILC 34522 0 0 0 0 2 86 5 93 New Castle School ILCPenn High 34490 0 0 0 0 206 58 5 269 Penn HighPleasantville Elem 34418 0 6 15 21 18 1 0 40 Pleasantville ElemRead Middle 34474 0 0 0 0 81 67 3 151 Read MiddleSouthern Elementary 34427 0 12 24 36 24 40 15 115 Southern ElementaryWilm Manor Elem 34420 0 3 15 18 11 0 0 29 Wilm Manor Elem
District Total 96 47 152 199 647 288 113 1343 District Total
51
SPECIAL EDUCATION ENROLLMENT 2012New Castle County
New Castle County Votech School District (38)
K - 3 Special Education Basic 4 - 12 Intensive Complex Total
School School Code PreK K 1 - 3 Total Grades 4-12 All Grades All Grades All Grades School
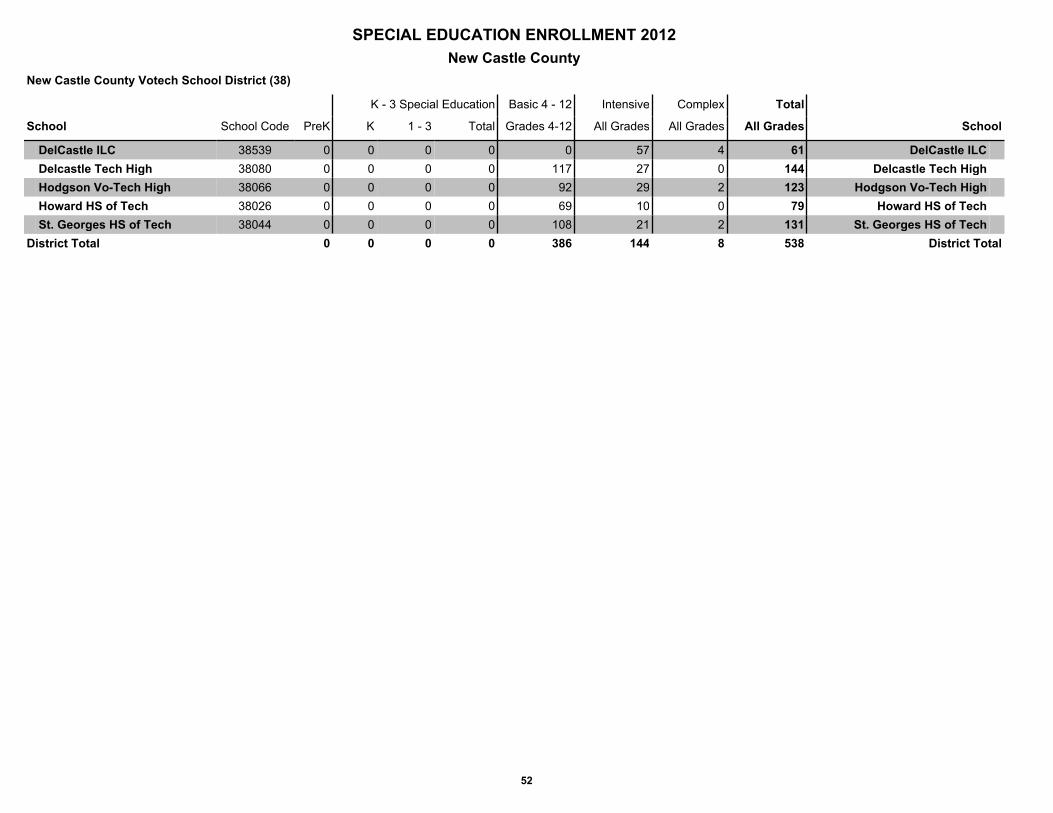
DelCastle ILC 38539 0 0 0 0 0 57 4 61 DelCastle ILCDelcastle Tech High 38080 0 0 0 0 117 27 0 144 Delcastle Tech HighHodgson Vo-Tech High 38066 0 0 0 0 92 29 2 123 Hodgson Vo-Tech HighHoward HS of Tech 38026 0 0 0 0 69 10 0 79 Howard HS of TechSt. Georges HS of Tech 38044 0 0 0 0 108 21 2 131 St. Georges HS of Tech
District Total 0 0 0 0 386 144 8 538 District Total
52

SPECIAL EDUCATION ENROLLMENT 2012New Castle County
Red Clay Consolidated School District (32)
K - 3 Special Education Basic 4 - 12 Intensive Complex Total
School School Code PreK K 1 - 3 Total Grades 4-12 All Grades All Grades All Grades School
A I duPont High 32292 0 0 0 0 133 0 1 134 A I duPont HighA I duPont Middle 32274 0 0 0 0 83 0 0 83 A I duPont MiddleBaltz Elem 32252 0 4 27 31 20 0 0 51 Baltz ElemBrandywine Springs 32261 0 2 18 20 53 2 3 78 Brandywine SpringsCalloway Art School 32286 0 0 0 0 21 0 1 22 Calloway Art SchoolConrad School of Science 32284 0 0 0 0 31 1 1 33 Conrad School of ScienceDickinson High 32290 0 0 0 0 113 0 3 116 Dickinson HighFirst State School 32530 0 0 0 0 0 0 18 18 First State SchoolForest Oak Elem 32240 0 6 16 22 13 0 0 35 Forest Oak ElemH B duPont Middle 32276 0 0 0 0 115 1 4 120 H B duPont MiddleHeritage Elem 32242 0 4 14 18 16 1 0 35 Heritage ElemHighlands Elem 32244 0 0 15 15 17 0 0 32 Highlands ElemLinden Hill Elem 32250 0 3 19 22 15 0 2 39 Linden Hill ElemMarbrook Elem 32256 0 2 21 23 15 0 1 39 Marbrook ElemMcKean High 32294 0 0 0 0 157 0 3 160 McKean HighMeadowood Program 32516 0 0 0 0 4 12 122 138 Meadowood ProgramMote Elem 32264 0 4 16 20 15 1 1 37 Mote ElemNorth Star Elementary 32270 0 2 8 10 10 0 3 23 North Star ElementaryRichardson Park Elem 32254 0 4 19 23 21 0 0 44 Richardson Park ElemRichardson Park Lrn Centr ILC 32526 67 0 0 0 2 170 28 267 Richardson Park Lrn Centr ILCRichey Elem 32260 0 3 15 18 20 0 0 38 Richey ElemShortlidge Elem 32248 1 4 15 19 24 1 0 45 Shortlidge ElemSkyline Middle 32280 0 0 0 0 102 1 1 104 Skyline MiddleStanton Middle 32282 0 0 0 0 121 0 1 122 Stanton MiddleThe Central School 32527 0 0 0 0 86 83 7 176 The Central SchoolWarner Elem 32266 1 4 33 37 45 10 2 95 Warner ElemWilliam Lewis Elem 32246 0 1 12 13 11 0 0 24 William Lewis Elem
District Total 69 43 248 291 1263 283 202 2108 District Total
53

SPECIAL EDUCATION ENROLLMENT 2012Kent County
Caesar Rodney School District (10)
K - 3 Special Education Basic 4 - 12 Intensive Complex Total
School School Code PreK K 1 - 3 Total Grades 4-12 All Grades All Grades All Grades School
Brown Elem 10622 0 0 28 28 21 36 4 89 Brown ElemCaesar Rodney High 10626 0 0 0 0 210 32 4 246 Caesar Rodney HighCharlton School 10630 0 0 0 0 0 66 170 236 Charlton SchoolDAFB Choice 10629 0 0 0 0 11 0 0 11 DAFB ChoiceFifer Middle 10625 0 0 0 0 70 38 7 115 Fifer MiddleFrear Elem 10610 0 0 32 32 27 1 1 61 Frear ElemKent Elementary ILC 10615 0 0 0 0 0 24 16 40 Kent Elementary ILCMcIlvaine Elem 10611 0 0 0 0 0 37 0 37 McIlvaine ElemPostlethwait Middle 10621 0 0 0 0 54 33 3 90 Postlethwait MiddleSimpson Elem 10620 0 0 19 19 16 0 0 35 Simpson ElemStar Hill Elem 10618 0 0 23 23 18 3 1 45 Star Hill ElemStokes Elem 10616 69 0 19 19 20 15 1 124 Stokes Elem
District Total 69 0 121 121 447 285 207 1129 District Total
54

SPECIAL EDUCATION ENROLLMENT 2012Kent County
Dover Air Force Base (14)
K - 3 Special Education Basic 4 - 12 Intensive Complex Total
School School Code PreK K 1 - 3 Total Grades 4-12 All Grades All Grades All Grades School
DAFB Middle 14891 0 0 0 0 6 0 0 6 DAFB MiddleDover AFB Off Base 14893 15 0 0 0 4 15 3 37 Dover AFB Off BaseWelch Elem 14892 0 0 9 9 10 0 0 19 Welch Elem
District Total 15 0 9 9 20 15 3 62 District Total
55

SPECIAL EDUCATION ENROLLMENT 2012Kent County
Capital School District (13)
K - 3 Special Education Basic 4 - 12 Intensive Complex Total
School School Code PreK K 1 - 3 Total Grades 4-12 All Grades All Grades All Grades School
Capital ILC 13649 0 0 0 0 1 119 8 128 Capital ILCCentral Middle 13644 0 0 0 0 80 42 0 122 Central MiddleDover High 13648 0 0 0 0 204 16 5 225 Dover HighEast Dover Elem 13632 14 2 9 11 7 0 0 32 East Dover ElemFairview Elem 13638 14 5 11 16 6 2 0 38 Fairview ElemHartly Elem 13640 4 2 15 17 4 9 0 34 Hartly ElemKent County Comm 13650 1 0 0 0 1 8 168 178 Kent County CommKent Secondary ILC 13655 0 0 0 0 0 78 8 86 Kent Secondary ILCNorth Dover Elem 13635 0 2 15 17 7 9 1 34 North Dover ElemSouth Dover Elem 13634 0 11 15 26 10 21 0 57 South Dover ElemTowne Point Elem 13642 0 3 20 23 2 8 0 33 Towne Point ElemWashington Elem 13636 0 2 12 14 5 10 0 29 Washington ElemWilliam Henry Middle 13646 0 0 0 0 100 40 1 141 William Henry Middle
District Total 33 27 97 124 427 362 191 1137 District Total
56
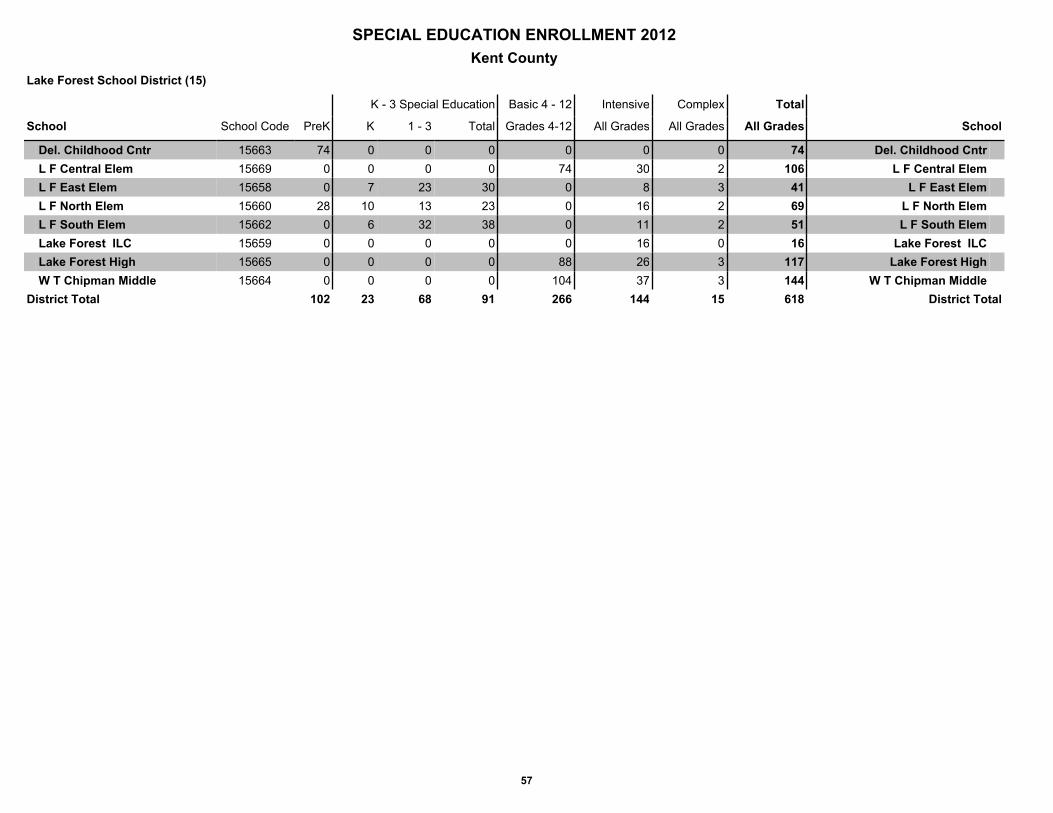
SPECIAL EDUCATION ENROLLMENT 2012Kent County
Lake Forest School District (15)
K - 3 Special Education Basic 4 - 12 Intensive Complex Total
School School Code PreK K 1 - 3 Total Grades 4-12 All Grades All Grades All Grades School
Del. Childhood Cntr 15663 74 0 0 0 0 0 0 74 Del. Childhood CntrL F Central Elem 15669 0 0 0 0 74 30 2 106 L F Central ElemL F East Elem 15658 0 7 23 30 0 8 3 41 L F East ElemL F North Elem 15660 28 10 13 23 0 16 2 69 L F North ElemL F South Elem 15662 0 6 32 38 0 11 2 51 L F South ElemLake Forest ILC 15659 0 0 0 0 0 16 0 16 Lake Forest ILCLake Forest High 15665 0 0 0 0 88 26 3 117 Lake Forest HighW T Chipman Middle 15664 0 0 0 0 104 37 3 144 W T Chipman Middle
District Total 102 23 68 91 266 144 15 618 District Total
57

SPECIAL EDUCATION ENROLLMENT 2012Kent County
Milford School District (18)
K - 3 Special Education Basic 4 - 12 Intensive Complex Total
School School Code PreK K 1 - 3 Total Grades 4-12 All Grades All Grades All Grades School
Banneker Elem 18668 0 0 31 31 33 0 0 64 Banneker ElemCentral Academy 18675 0 0 0 0 64 2 0 66 Central AcademyMilford High 18678 0 0 0 0 98 6 0 104 Milford HighMilford ILC 18679 0 0 0 0 0 63 16 79 Milford ILCMilford Middle 18676 0 0 0 0 83 2 0 85 Milford MiddleMispillion Elementary 18673 0 0 33 33 28 2 1 64 Mispillion ElementaryMorris Early Child 18670 39 20 0 20 0 27 0 86 Morris Early ChildRoss Elem 18672 0 0 27 27 19 2 0 48 Ross Elem
District Total 39 20 91 111 325 104 17 596 District Total
58
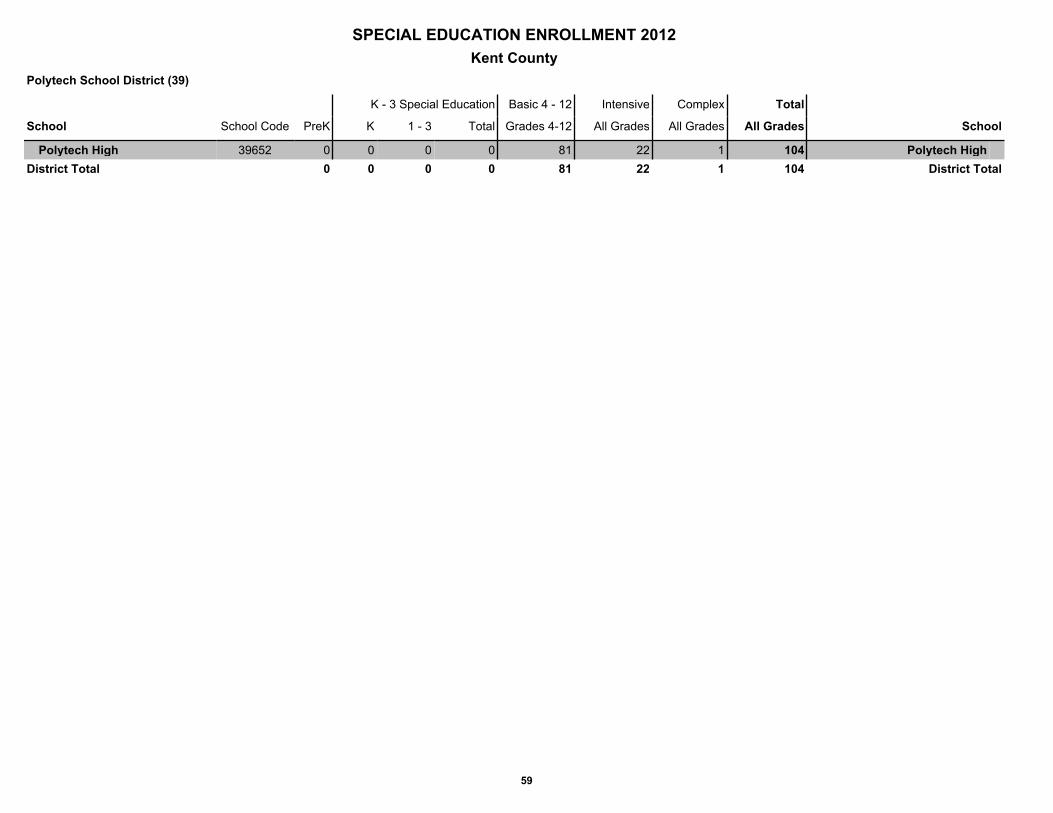
SPECIAL EDUCATION ENROLLMENT 2012Kent County
Polytech School District (39)
K - 3 Special Education Basic 4 - 12 Intensive Complex Total
School School Code PreK K 1 - 3 Total Grades 4-12 All Grades All Grades All Grades School
Polytech High 39652 0 0 0 0 81 22 1 104 Polytech HighDistrict Total 0 0 0 0 81 22 1 104 District Total
59

SPECIAL EDUCATION ENROLLMENT 2012Kent County
Smyrna School District (24)
K - 3 Special Education Basic 4 - 12 Intensive Complex Total
School School Code PreK K 1 - 3 Total Grades 4-12 All Grades All Grades All Grades School
Clayton Elem 24680 0 1 26 27 10 1 0 38 Clayton ElemClayton IS 24696 0 0 0 0 37 22 3 62 Clayton ISJ Bassett Moore 24686 0 0 0 0 35 33 1 69 J Bassett MooreN Smyrna Elem 24684 0 7 20 27 7 37 2 73 N Smyrna ElemSmyrna Elem 24682 20 10 31 41 12 74 3 150 Smyrna ElemSmyrna High 24688 0 0 0 0 118 64 9 191 Smyrna HighSmyrna Middle 24685 0 0 0 0 92 27 5 124 Smyrna MiddleSunnyside Elementary 24681 0 7 24 31 9 0 1 41 Sunnyside Elementary
District Total 20 25 101 126 320 258 24 748 District Total
60
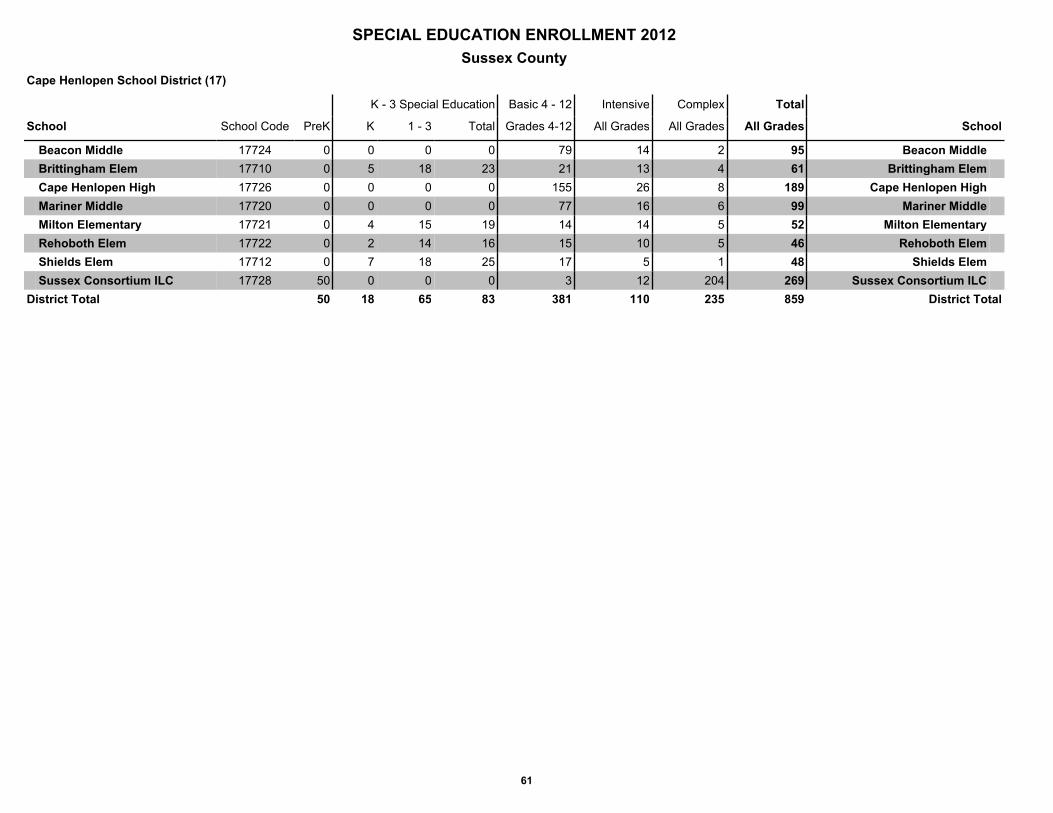
SPECIAL EDUCATION ENROLLMENT 2012Sussex County
Cape Henlopen School District (17)
K - 3 Special Education Basic 4 - 12 Intensive Complex Total
School School Code PreK K 1 - 3 Total Grades 4-12 All Grades All Grades All Grades School
Beacon Middle 17724 0 0 0 0 79 14 2 95 Beacon MiddleBrittingham Elem 17710 0 5 18 23 21 13 4 61 Brittingham ElemCape Henlopen High 17726 0 0 0 0 155 26 8 189 Cape Henlopen HighMariner Middle 17720 0 0 0 0 77 16 6 99 Mariner MiddleMilton Elementary 17721 0 4 15 19 14 14 5 52 Milton ElementaryRehoboth Elem 17722 0 2 14 16 15 10 5 46 Rehoboth ElemShields Elem 17712 0 7 18 25 17 5 1 48 Shields ElemSussex Consortium ILC 17728 50 0 0 0 3 12 204 269 Sussex Consortium ILC
District Total 50 18 65 83 381 110 235 859 District Total
61

SPECIAL EDUCATION ENROLLMENT 2012Sussex County
Delmar School District (37)
K - 3 Special Education Basic 4 - 12 Intensive Complex Total
School School Code PreK K 1 - 3 Total Grades 4-12 All Grades All Grades All Grades School
Delmar Middle 37733 3 0 0 0 52 4 4 63 Delmar MiddleDelmar Middle ILC 37739 0 0 0 0 0 3 0 3 Delmar Middle ILCDelmar Secondary ILC 37737 0 0 0 0 0 7 0 7 Delmar Secondary ILCDelmar Sr High 37730 0 0 0 0 48 5 0 53 Delmar Sr High
District Total 3 0 0 0 100 19 4 126 District Total
62

SPECIAL EDUCATION ENROLLMENT 2012Sussex County
Indian River School District (36)
K - 3 Special Education Basic 4 - 12 Intensive Complex Total
School School Code PreK K 1 - 3 Total Grades 4-12 All Grades All Grades All Grades School
Carver ILC 36689 0 0 0 0 0 45 20 65 Carver ILCEast Millsboro Elem 36738 12 5 7 12 8 20 8 60 East Millsboro ElemEnnis 36750 0 0 0 0 0 38 84 122 EnnisGeorgetown Elem 36734 29 9 11 20 21 24 28 122 Georgetown ElemGeorgetown Middle 36743 0 0 0 0 37 33 1 71 Georgetown MiddleIndian River High 36746 0 0 0 0 84 33 6 123 Indian River HighIndian River ILC 36745 67 0 0 0 0 6 1 74 Indian River ILCJohn M Clayton Elem 36732 16 10 24 34 10 16 13 89 John M Clayton ElemLong Neck 36690 17 15 31 46 18 15 8 104 Long NeckLord Balt Elem 36736 11 8 5 13 15 18 5 62 Lord Balt ElemMillsboro Middle 36741 0 0 0 0 57 45 3 105 Millsboro MiddleNorth Georgetown 36692 29 10 13 23 10 42 0 104 North GeorgetownS Del Sch of Arts 36749 0 0 2 2 15 9 4 30 S Del Sch of ArtsSelbyville Middle 36742 0 0 0 0 53 45 4 102 Selbyville MiddleShowell Elem 36740 9 10 10 20 8 10 6 53 Showell ElemSussex Central High 36748 0 0 0 0 87 89 4 180 Sussex Central High
District Total 190 67 103 170 423 488 195 1466 District Total
63

SPECIAL EDUCATION ENROLLMENT 2012Sussex County
Laurel School District (16)
K - 3 Special Education Basic 4 - 12 Intensive Complex Total
School School Code PreK K 1 - 3 Total Grades 4-12 All Grades All Grades All Grades School
Dunbar Elem 16753 27 12 17 29 0 4 8 68 Dunbar ElemLaurel High 16756 0 0 0 0 56 15 2 73 Laurel HighLaurel ILC 16781 0 0 0 0 0 14 2 16 Laurel ILCLaurel Intermediate 16755 0 0 0 0 41 7 2 50 Laurel IntermediateLaurel Middle 16754 0 0 0 0 47 6 0 53 Laurel MiddleN Laurel Elem 16752 0 0 31 31 18 3 4 56 N Laurel ElemW Sussex Academy ILC 16765 0 0 0 0 0 6 0 6 W Sussex Academy ILC
District Total 27 12 48 60 162 55 18 322 District Total
64

SPECIAL EDUCATION ENROLLMENT 2012Sussex County
Seaford School District (23)
K - 3 Special Education Basic 4 - 12 Intensive Complex Total
School School Code PreK K 1 - 3 Total Grades 4-12 All Grades All Grades All Grades School
Blades Elementary 23761 0 5 15 20 18 6 0 44 Blades ElementaryFred Douglass Elem 23762 53 2 15 17 15 1 0 86 Fred Douglass ElemSeaford Autistic Program 23763 0 0 0 0 0 1 27 28 Seaford Autistic ProgramSeaford Central Elem 23759 0 5 23 28 20 3 0 51 Seaford Central ElemSeaford High 23766 0 0 0 0 74 0 1 75 Seaford HighSeaford ILC 23767 0 0 0 0 0 52 0 52 Seaford ILCSeaford Middle 23764 0 0 0 0 120 2 0 122 Seaford MiddleSussex Ortho/Vis Han 23768 0 0 0 0 0 4 42 46 Sussex Ortho/Vis HanWest Seaford Elem 23760 0 1 18 19 16 3 0 38 West Seaford Elem
District Total 53 13 71 84 263 72 70 542 District Total
65

SPECIAL EDUCATION ENROLLMENT 2012Sussex County
Sussex Technical School District (40)
K - 3 Special Education Basic 4 - 12 Intensive Complex Total
School School Code PreK K 1 - 3 Total Grades 4-12 All Grades All Grades All Grades School
Sussex Tech High 40770 0 0 0 0 75 41 1 117 Sussex Tech HighDistrict Total 0 0 0 0 75 41 1 117 District Total
66

SPECIAL EDUCATION ENROLLMENT 2012Sussex County
Woodbridge School District (35)
K - 3 Special Education Basic 4 - 12 Intensive Complex Total
School School Code PreK K 1 - 3 Total Grades 4-12 All Grades All Grades All Grades School
Phillis Wheatley Middle 35775 0 0 0 0 73 25 8 106 Phillis Wheatley MiddleWoodbridge Elem 35776 20 11 18 29 8 18 9 84 Woodbridge ElemWoodbridge High 35780 0 0 0 0 63 14 18 95 Woodbridge High
District Total 20 11 18 29 144 57 35 285 District Total
67

New Castle County
Appoquinimink 82 22 126 148 496 208 42 976 AppoquiniminkBrandywine 138 47 149 196 669 261 116 1380 BrandywineChristina 226 67 238 305 906 712 643 2792 ChristinaColonial 96 47 152 199 647 288 113 1343 ColonialNCC Votech 0 0 0 0 386 144 8 538 NCC VotechRed Clay 69 43 248 291 1263 283 202 2108 Red Clay
County Total 611 226 913 1,139 4,367 1,896 1,124 9,137 County Total
Kent County
Caesar Rodney 69 0 121 121 447 285 207 1129 Caesar RodneyCapital 33 27 97 124 427 362 191 1137 CapitalDAFB 15 0 9 9 20 15 3 62 DAFBLake Forest 102 23 68 91 266 144 15 618 Lake ForestMilford 39 20 91 111 325 104 17 596 MilfordPolytech 0 0 0 0 81 22 1 104 PolytechSmyrna 20 25 101 126 320 258 24 748 Smyrna
County Total 278 95 487 582 1,886 1,190 458 4,394 County Total
Sussex County
Cape Henlopen 50 18 65 83 381 110 235 859 Cape HenlopenDelmar 3 0 0 0 100 19 4 126 DelmarIndian River 190 67 103 170 423 488 195 1466 Indian RiverLaurel 27 12 48 60 162 55 18 322 LaurelSeaford 53 13 71 84 263 72 70 542 SeafordSussex Technical 0 0 0 0 75 41 1 117 Sussex TechnicalWoodbridge 20 11 18 29 144 57 35 285 Woodbridge
County Total 343 121 305 426 1,548 842 558 3,717 County Total
All Counties and Districts 1,232 442 1,705 2,147 7,801 3,928 2,140 17,248
All less DAFB 1,217 442 1,696 2,138 7,781 3,913 2,137 17,186
SPECIAL EDUCATION ENROLLMENT 2012DISTRICT SUMMARY
K - 3 Special Education Basic 4 - 12 Intensive Complex TotalPreK K 1 - 3 Total Grades 4-12 All Grades All Grades All Grades
68
Delaware Department of Education and State Board of Education
PART III — CHARTER SCHOOL REGULAR AND SPECIAL EDUCATION ENROLLMENT REPORT (INCLUDING DISTRICT AND STATE TOTALS) SEPTEMBER 30, 2012
NEEDS BASED UNIT CATEGORIES:
Pre-K (Special Education)
K-3 (Regular Education & Special Education)
4-12 Regular Education
4-12 Basic Special Education (Basic)
Pre K-12 Intensive Special Education (Intensive)
Pre K-12 Complex Special Education (Complex)

New Castle County
Charter Sch of Wilm 70295 0 0 0 0 0 0 0 0 0 0 253 240 233 242 968 968DAPSS 68567 0 0 0 0 0 0 0 0 0 0 88 83 0 0 171 171Del College Prep 66565 53 49 38 35 175 36 14 0 0 0 0 0 0 0 50 225Delaware Military Academy
79578 0 0 0 0 0 0 0 0 0 0 143 144 138 130 555 555
East Side Chtr 72571 54 49 50 35 188 44 20 32 21 16 0 0 0 0 133 321Family Foundations 80579 115 94 90 64 363 84 70 78 78 47 0 0 0 0 357 720Gateway Charter 92543 0 0 0 22 22 20 20 14 10 14 0 0 0 0 78 100Kuumba Academy 82581 51 50 41 35 177 40 32 0 0 0 0 0 0 0 72 249ASPIRA Academy 69568 50 88 42 43 223 41 43 23 0 0 0 0 0 0 107 330Moyer Academy 75574 0 0 0 0 0 0 0 13 19 39 23 13 7 10 124 124MOT Charter 88587 73 74 72 68 287 70 71 73 74 69 0 0 0 0 357 644Newark Charter 89588 122 130 127 120 499 153 150 150 152 155 0 0 0 0 760 1,259Odyssey Charter 86585 117 121 82 83 403 83 83 0 0 0 0 0 0 0 166 569Pencader Charter HS 83582 0 0 0 0 0 0 0 0 0 0 83 105 87 91 366 366Prestige Academy 67566 0 0 0 0 0 0 45 68 75 56 0 0 0 0 244 244Reach Academy 73572 62 57 56 48 223 0 19 46 43 39 0 0 0 0 147 370Thomas Edison Chtr 76575 100 101 97 97 395 74 72 57 49 47 0 0 0 0 299 694
County Total 797 813 695 650 2,955 645 639 554 521 482 590 585 465 473 4,954 7,909
Kent County
Academy of Dover 85584 75 63 53 38 229 26 0 0 0 0 0 0 0 0 26 255Campus Community Chtr 74573 37 24 43 42 146 39 48 39 47 40 0 0 0 26 239 385Positive Outcomes 71570 0 0 0 0 0 0 0 0 7 6 9 8 11 6 47 47Providence Creek 87586 76 78 74 73 301 76 74 70 70 71 0 0 0 0 361 662
County Total 188 165 170 153 676 141 122 109 124 117 9 8 11 32 673 1,349
Sussex County
Sussex Academy Chtr 77576 0 0 0 0 0 0 0 111 108 107 0 0 0 0 326 326County Total 0 0 0 0 0 0 0 111 108 107 0 0 0 0 326 326
All Counties and Charters 985 978 865 803 3,631 786 761 774 753 706 599 593 476 505 5,953 9,584
State Totals Reg Enr. w/DAFB 9,367 9,746 9,231 8,948 37,292 8,825 8,552 8,412 8,606 8,418 9,495 8,553 7,956 7,315 76,132 113,424
State Totals Reg Enr. less DAFB 9,310 9,692 9,177 8,905 37,084 8,792 8,505 8,386 8,577 8,391 9,474 8,538 7,940 7,307 75,905 112,989
CHARTER SCHOOL REGULAR ENROLLMENT 2012
Code K 1 2 3 K - 3 4 5 6 7 8 9 10 11 12 4 - 12 K - 12
69

New Castle County
Charter Sch of Wilm 70295 0 0 0 0 2 0 0 2 Charter Sch of WilmDAPSS 68567 0 0 0 0 21 0 0 21 DAPSSDel College Prep 66565 0 1 4 5 2 0 0 7 Del College PrepDelaware Military Academy 79578 0 0 0 0 1 0 0 1 Delaware Military AcademyEast Side Chtr 72571 0 2 9 11 46 7 7 71 East Side ChtrFamily Foundations 80579 0 5 9 14 20 3 2 39 Family FoundationsGateway Charter 92543 0 0 7 7 90 21 7 125 Gateway CharterKuumba Academy 82581 0 1 6 7 7 0 0 14 Kuumba AcademyASPIRA Academy 69568 0 0 3 3 3 2 0 8 ASPIRA AcademyMoyer Academy 75574 0 0 0 0 46 10 2 58 Moyer AcademyMOT Charter 88587 0 3 10 13 15 6 2 36 MOT CharterNewark Charter 89588 0 3 20 23 50 11 4 88 Newark CharterOdyssey Charter 86585 0 1 9 10 11 1 0 22 Odyssey CharterPencader Charter HS 83582 0 0 0 0 41 3 1 45 Pencader Charter HSPrestige Academy 67566 0 0 0 0 40 12 2 54 Prestige AcademyReach Academy 73572 0 1 3 4 16 0 0 20 Reach AcademyThomas Edison Chtr 76575 0 0 10 10 39 0 0 49 Thomas Edison Chtr
County Total 0 17 90 107 450 76 27 660 County Total
Kent County
Academy of Dover 85584 0 2 15 17 2 4 4 27 Academy of DoverCampus Community Chtr 74573 0 0 2 2 21 21 0 44 Campus Community ChtrPositive Outcomes 71570 0 0 0 0 20 35 21 76 Positive OutcomesProvidence Creek 87586 0 1 7 8 25 0 0 33 Providence Creek
County Total 0 3 24 27 68 60 25 180 County Total
Sussex County
Sussex Academy Chtr 77576 0 0 0 0 13 0 1 14 Sussex Academy ChtrCounty Total 0 0 0 0 13 0 1 14 County Total
All Counties and Charters 0 20 114 134 531 136 53 854
State Totals SpEd Enr. w/DAFB 1,232 462 1,819 2,281 8,332 4,064 2,193 18,102
State Totals SpEd Enr. less DAFB 1,217 462 1,810 2,272 8,312 4,049 2,190 18,040
CHARTER SPECIAL EDUCATION ENROLLMENT 2012K - 3 Special Education Basic 4 - 12 Intensive Complex Total
Code PreK K 1 - 3 Total Grades 4-12 All Grades All Grades All Grades
70

Delaware Department of Education and State Board of Education
PART IV — ESTIMATED UNIT COUNT FOR 2012—2013

FY13 Estimated Unit Count
District
FY13 EstimatedDivision I Units
(100%)
FY13 EstimatedDivision I Units
(98%)
Appoquinimink School District 600.00 588.00
Brandywine School District 722.00 707.56
Caesar Rodney School District 530.00 519.40
Cape Henlopen School District 390.00 382.20
Capital School District 471.00 461.58
Christina School District 1,321.00 1,294.58
Colonial School District 662.00 648.76
Delmar School District 78.00 76.44
Indian River School District 621.00 608.58
Lake Forest School District 258.00 252.84
Laurel School District 146.00 143.08
Milford School District 269.00 263.62
NCVT School District 344.00 337.12
Polytech School District 87.00 85.26
Red Clay School District 1,089.00 1,067.22
Seaford School District 241.00 236.18
Smyrna School District 355.00 347.90
SCVT School District 98.00 96.04
Woodbridge School District 153.00 149.94
TOTAL 8,435.00 8,266.30
REVISED 4/5/2012

DEPARTMENT OF EDUCATION CONTRIBUTORS
TECHNOLOGY RESOURCES AND DATA DEVELOPMENT Robert E. Czeizinger, Director
Debra Ann Stover, Education Associate, Unit Count
Xinyu “Justin” Tan, Ph.D., Education Associate, Data Management
Lisa M. Marcum, Education Associate, Pupil Accounting
Jeff Hansen, Diamond Technologies
Diane Alvarez, TRDD Support