september 15, 2013 helping think tanks measure impact€¦ · september 15, 2013 helping solve...
TRANSCRIPT
September 15, 2013
Helping solve urgent social problems.
Helping Think Tanks Measure Impact Prepared for the International Development Research Centre’s Think Tank Initiative

Redstone Strategy Group is a leading advisor to private foundations and non-profits
worldwide. We help clients identify their highest-return investments, track and learn
from results, and continually improve their efforts to solve urgent social problems. Our
approach combines substantial experience across all sectors of philanthropy with deep
appreciation of our clients’ knowledge and expertise. This allows us to collaborate
effectively with clients as they improve their ability to achieve social good and learn
from their results.
Helping Think Tanks Measure Impact
Table of Contents Helping Think Tanks Measure Impact
Project background and objectives ................................................... 1
Problem and methodology ................................................................. 2
Lessons and example results .............................................................. 5
Lessons .............................................................................................................................................. 5
Case example: Fundación ARU’s work on microfinance in Bolivia ....................... 6
Feedback from participating think tanks ......................................... 7
Step-by-step guide for a think tank ................................................. 9
Choosing and describing a case ........................................................................................ 10
Estimating the benefit ............................................................................................................. 10
Estimating the cost ................................................................................................................... 11
Estimating your institution’s contribution to the benefit ....................................... 11
Estimating your institution’s expected return on investment .............................. 14
A possible broader application: prospective decision-making . 14
Appendix A: Other case examples .................................................. 16
Appendix B: Sources ........................................................................... 19

1 Helping Think Tanks Measure Impact
Project background and objectives Launched in 2008 and managed by Canada’s International Development Research
Centre, the Think Tank Initiative (TTI) is a multi-donor program dedicated to
strengthening the capacity of independent policy research organizations, popularly
known as think tanks, in the developing world.
Policy change aimed at improving life in the real world is central to TTI’s philosophy.
As stated on the website, “By generating and analyzing credible local data, [think
tanks] can enhance public policy debates and promote more objective, evidence-
based decision-making that makes real, sustained improvements in people’s lives.”1
Still, communicating the value of this work – particularly to the growing number of
donors interested in quantitative assessments of impact – can be a challenge. While it
is clear that a relatively modest investment of funding and staff time in research and
advocacy can leverage policies with large tangible benefits for society, such
contributions are difficult to measure with any precision. To better understand these
contributions, the Hewlett Foundation commissioned Redstone Strategy Group to
work with six TTI-funded think tanks to document cases in which each influenced an
important policy. The objectives were to:
Document clear success stories to help make the case for providing long-term,
core support to research institutions in developing countries to donors who
are particularly interested in real-world outcomes, also known as impact
Explore how outcome-focused monitoring and evaluation (M&E) approaches
employed by other policy-oriented organizations could be applied to think
tanks
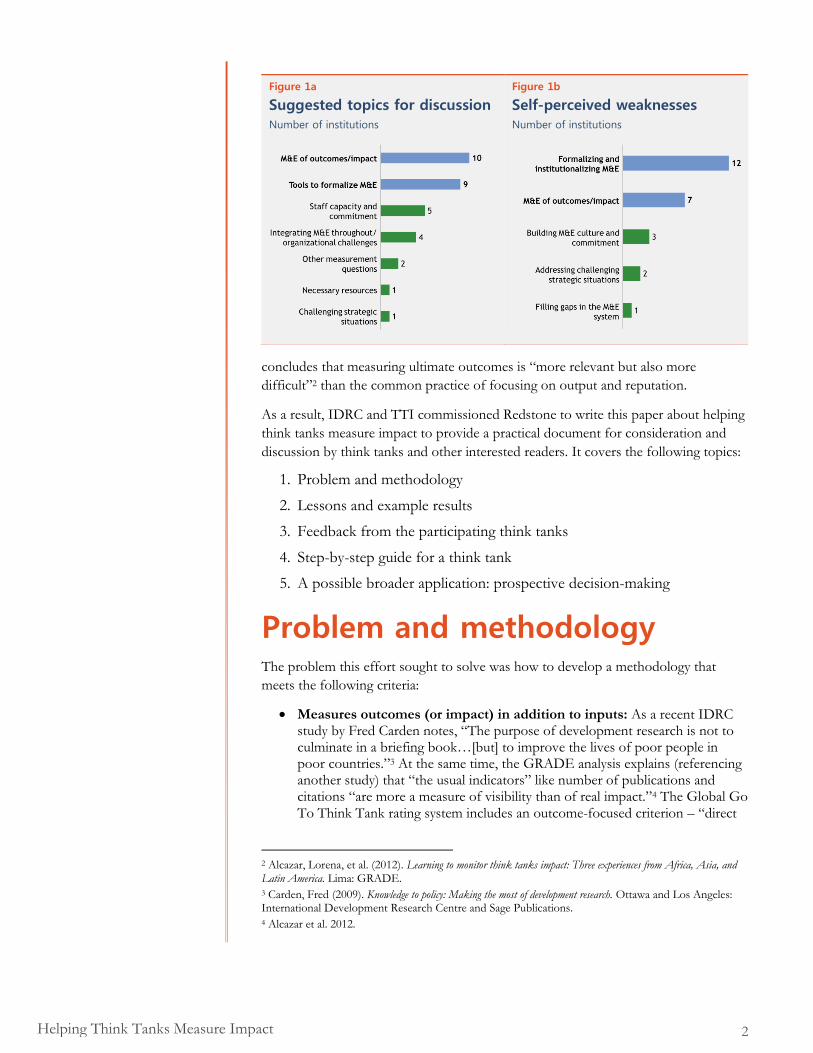
During the project, it became clear that these approaches also were of high interest to
the think tanks themselves. For example, in advance of a recent workshop on M&E
for the Latin American TTI grantees, the topics of greatest interest revolved around
outcome-focused M&E and practical ways to implement, formalize, and
institutionalize M&E (Figure 1). These issues were perceived as the think tanks’ most
common weaknesses as well. Likewise, a recent study by the Peruvian grantee
Development Analysis Group (GRADE, in Spanish) begins by noting that “the
impact of think tanks has received increasing attention in the literature” and many
stakeholders, including “think tanks themselves…are increasingly aware of the
importance of monitoring and evaluating think tanks’ impact.” However, GRADE
1 Think Tank Initiative (2013). Approach. http://www.thinktankinitiative.org/program/approach
While it is clear that a relatively
modest investment…can leverage policies
with large tangible benefits for
society, such contributions are
difficult to measure
2 Helping Think Tanks Measure Impact
concludes that measuring ultimate outcomes is “more relevant but also more
difficult”2 than the common practice of focusing on output and reputation.
As a result, IDRC and TTI commissioned Redstone to write this paper about helping
think tanks measure impact to provide a practical document for consideration and
discussion by think tanks and other interested readers. It covers the following topics:
1. Problem and methodology
2. Lessons and example results
3. Feedback from the participating think tanks
4. Step-by-step guide for a think tank
5. A possible broader application: prospective decision-making
Problem and methodology The problem this effort sought to solve was how to develop a methodology that
meets the following criteria:
Measures outcomes (or impact) in addition to inputs: As a recent IDRC study by Fred Carden notes, “The purpose of development research is not to culminate in a briefing book…[but] to improve the lives of poor people in poor countries.”3 At the same time, the GRADE analysis explains (referencing another study) that “the usual indicators” like number of publications and citations “are more a measure of visibility than of real impact.”4 The Global Go To Think Tank rating system includes an outcome-focused criterion – “direct
2 Alcazar, Lorena, et al. (2012). Learning to monitor think tanks impact: Three experiences from Africa, Asia, and Latin America. Lima: GRADE. 3 Carden, Fred (2009). Knowledge to policy: Making the most of development research. Ottawa and Los Angeles: International Development Research Centre and Sage Publications. 4 Alcazar et al. 2012.
Figure 1a
Suggested topics for discussion
Number of institutions
Figure 1b
Self-perceived weaknesses
Number of institutions

3 Helping Think Tanks Measure Impact
relationship between organization’s efforts in a particular area to a positive change in societal values such as significant changes in quality of life.” But even this contribution is rated by experts rather than measured directly. Moreover, many of the “impact indicators” in that system are more focused on what might be called intermediate outcomes, such as citations in the literature, rather than ultimate outcomes, such as the number of people helped by a new policy.5
It is clear that more exploration is needed on M&E methodologies that allow development policy research institutions to focus on their effect on “the lives of poor people in poor countries” or whatever a think tank’s ultimate objective might be.
Amenable to systematic use: Carden notes that “there is no list of ‘best practices’ when it comes to research influencing public policy.”6 At the same time, as shown in Figure 1, think tanks are looking for something that will allow for formalized and institutionalized use. This, in turn, requires a methodology to be amenable to systematic use – that is, widely applicable and efficient to use.
Quantitative but nuanced: As noted above, many potential readers of the results are interested in quantitative M&E. In many ways, this preference is simply a practical translation of a focus on outcomes, since the quantitative results to which they are referring generally are framed in terms of tangible real-world changes. Nonetheless, it is widely recognized that quantitative metrics often cannot capture all the nuances of a policy effort. Qualitative descriptions of the effects of a venture are often useful to supplement the numbers.
Easy-to-understand format: A fourth criterion, relevant only to the presentation of results, was that the final documents be easy to read and visually compelling, since they are intended in part for fundraising and communications. This is reflected in the format used, but is less relevant to a think tank trying to institute a systematic M&E approach.
Many existing methodologies are valuable when compared against one or more of
these criteria. For example, peer review can help establish the quality of research, but
does not by itself account for potential impact. As Carden notes, “In all the
confusions and frustrations of making policy in developing countries, development
research frequently fails to register any apparent influence whatsoever.”7 Conversely,
the outcome mapping approach used by the Overseas Development Institute (ODI)
recognizes that research “can contribute to policies that have a dramatic impact on
lives.”8 This method is detailed, well developed, and focused on impact. It brings
together many useful tools (e.g., force field analysis, which helps assess the relevant
strength of forces acting on a given issue9) in a methodical system for considering the
5 McGann, James (2013). 2012 Global Go To Think Tanks report and policy advice. Philadelphia: U. of Pennsylvania. 6 Carden 2009. 7 Carden 2009. 8 Young, John and Mendizabal, Enrique (2009). Helping researchers become policy entrepreneurs. London: Overseas Development Institute. http://www.odi.org.uk/publications/1127-become-policy-entrepreneur-roma. 9 Overseas Development Institute (2009). Management techniques: Force field analysis. http://www.odi.org.uk/publications/5218-force-field-analysis-decision-maker.

4 Helping Think Tanks Measure Impact
achievements beyond research that are needed to produce outcomes. However, the
complexity involved in outcome mapping makes it less amenable to systematic use
(criterion 2) and the approach is not particularly quantitative (criterion 3).
Several social sector organizations, pursuing a similar methodology, have taken on
“measuring and/or estimating social value creation.”10 In many cases, some form of
cost/benefit analysis is used. Building on that work, Redstone and its partners have
developed a variation on cost/benefit analysis that explicitly recognizes the
uncertainty inherent in many social investments.
Known as expected return on investment (EROI), this methodology has four elements
(Figure 2):
Benefit: The benefit is the ideal ultimate outcome from a think tank’s engagement on an issue. For example, it may be the number of rural families whose household income rises as a result of a policy. While often difficult to calculate precisely, even a rough estimate of benefit can generate a useful picture of the outcome of a think tank’s work.
Likelihood of success (LOS): This is the probability the think tank’s work will result in the benefit, and is the source of the “E” in “EROI.” While also hard to estimate, applying a consistent approach to approximating likelihood of success helps organizations use EROI across many different policy efforts.
Contribution to LOS: This is the portion of the LOS for which the think tank can claim credit. For example, the think tank may generate the policy idea or ensure support of policymakers. Because this project focused on past policy changes, in this instance we combine this factor and LOS into one estimate referred to simply as “contribution.” This combined factor refers to the difference between the LOS before and after a think tank’s involvement in a policy effort.
Cost: The cost estimate is the cost to the think tank (i.e., staff time, travel, etc.).
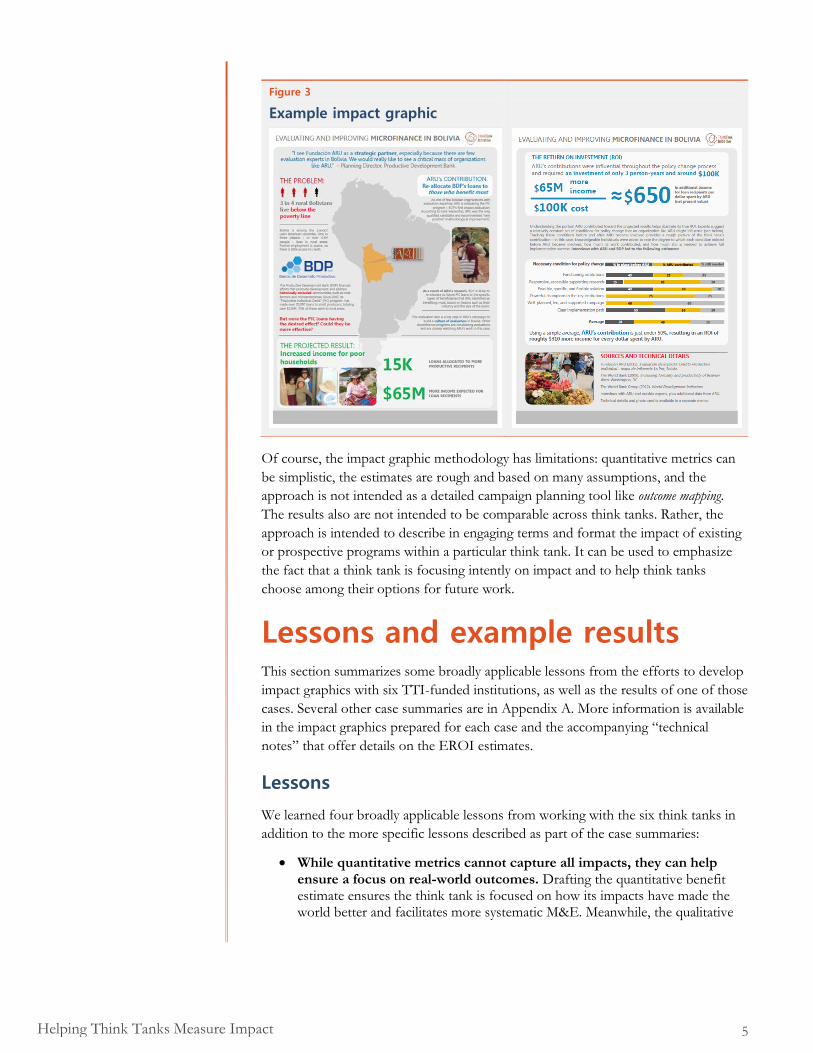
To present the results, we created a two-page impact graphic format that presents a
summary of the quantitative results along with a narrative that explores the qualitative
nuances of each case, such as the broader benefits of a think tank’s involvement
(Figure 3).
10 Tuan, Melinda (2008). Measuring and/or estimating social value creation: Insights into eight integrated cost approaches. Seattle: Bill and Melinda Gates Foundation. http://www.melindatuan.com/dnld/Measuring%20and-or%20Estimating%20Social%20Value%20Creation.pdf.
Figure 2
Expected return on investment formula
Redstone and its partners have
developed a variation on cost/benefit analysis that
explicitly recognizes the
uncertainty inherent in many
social investments
5 Helping Think Tanks Measure Impact
Of course, the impact graphic methodology has limitations: quantitative metrics can
be simplistic, the estimates are rough and based on many assumptions, and the
approach is not intended as a detailed campaign planning tool like outcome mapping.
The results also are not intended to be comparable across think tanks. Rather, the
approach is intended to describe in engaging terms and format the impact of existing
or prospective programs within a particular think tank. It can be used to emphasize
the fact that a think tank is focusing intently on impact and to help think tanks
choose among their options for future work.
Lessons and example results This section summarizes some broadly applicable lessons from the efforts to develop
impact graphics with six TTI-funded institutions, as well as the results of one of those
cases. Several other case summaries are in Appendix A. More information is available
in the impact graphics prepared for each case and the accompanying “technical
notes” that offer details on the EROI estimates.
Lessons
We learned four broadly applicable lessons from working with the six think tanks in
addition to the more specific lessons described as part of the case summaries:
While quantitative metrics cannot capture all impacts, they can help ensure a focus on real-world outcomes. Drafting the quantitative benefit estimate ensures the think tank is focused on how its impacts have made the world better and facilitates more systematic M&E. Meanwhile, the qualitative
Figure 3
Example impact graphic

6 Helping Think Tanks Measure Impact
portion of the impact graphic allows for exploration of crucial nuances and broader benefits.
It is important to balance rigor with pragmatism. M&E focused on impact by its nature often is imprecise and may conflict with the admirable focus on rigor at the core of think tank research. Applying a similar rigor to M&E can be very difficult, but pragmatic tools like proxies, reasonable assumptions, and ranges used to calculate EROI estimates often can generate M&E results that are sufficient to give a sense of a think tank’s tangible impact.
M&E systems should distinguish between internal and external uses, and between systematic use and one-off communications. For internal and systematic use, consistency – based on modeling of the think tank’s assumptions about its role in the broader context – is key. However, for external, one-off communications like impact graphics, there often is a balancing act between a think tank’s efforts to understand and recognize its own role with its need to be politic with partners. We experienced this potential conflict throughout the project, and in retrospect might have done a better job of addressing it. For example, we might have customized the model for estimating contribution to each think tank’s assumptions (though this would have made the explanations more complex).
To build a systematic M&E culture, it helps to have an internal champion among the research staff so that M&E is not seen as an outside imposition. This project focused on testing the methodology with a variety of think tanks rather than helping any one organization implement the method systematically. However, past experience with similar organizations suggests that the research staff as a whole must be committed to M&E for it to work. Having an internal champion from among the research staff – instead of, or in addition to, an M&E officer and external consultants – who can speak to the benefits and challenges of M&E greatly helps in securing that buy in. This work seems to have established potential internal champions in most of the think tanks with which we worked. That opened a possible door to establishing a more systematic use of impact-focused M&E.
Case example: Fundación ARU’s work on microfinance
in Bolivia
Case summary: ARU is young, small Bolivian think tank that is just beginning to see
the impacts of its work. We explored three cases in which ARU has affected policy,
eventually focusing on their work to evaluate a Bolivian Productive Development
Bank (PDB) microfinance program – the bank’s first impact evaluation. As a result of
ARU’s research findings, the bank is likely to re-allocate many of its future loans to
the specific types of recipients that ARU identified as benefiting most, based on
factors such as the industry in which they work (e.g., agriculture or manufacturing)
and the size of the loans they received.
EROI: With the staff at ARU, we estimated the number of improved loans and their
effect on recipients’ income, resulting in an estimate of $65 million more income
expected for loan recipients due to improvements in the loan program (net present
value)
The research staff as a whole must be
committed to M&E for it to
work
7 Helping Think Tanks Measure Impact
According to ARU, roughly $100,000 was needed for staff, overhead, and data
gathering for this effort. Interviews with ARU and bank staff resulted in an estimated
contribution of roughly 50 percent. This suggests an EROI of roughly $310 in
additional income for loan recipients per dollar ARU spent, assuming success is
achieved (discrepancies may appear in these calculations due to rounding).
Substantive and procedural challenges, and approaches to addressing them:
One substantive challenge was the timeline: the evaluation is only just being
completed, so the exact changes that PDB will make are not set. We addressed this
through discussion with ARU staff about what they felt were reasonably conservative
assumptions about what could be expected to change. The EROI can be refined over
time as those changes become clearer.
Another challenge was determining the correct balance of nuance and
straightforwardness in the benefit estimate. ARU’s rigorous evaluation work had
identified a classification system for types of loan recipients and the benefits derived
from the way each is likely to use the loan (e.g., greater direct consumption vs. greater
investment in children’s education). In the end, though, the group decided to simplify
this classification in the estimate both to keep it conservative and to make it more
transparent and understandable to external readers.
Finally, ARU was concerned that the benefit metrics would not capture the broader
aims of its work: most importantly, to build a culture of evaluation in Bolivia. As a
result, we added a section to the qualitative portion of the graphic discussing these
broader benefits. This format was carried into all the impact graphics.
Feedback from participating think tanks
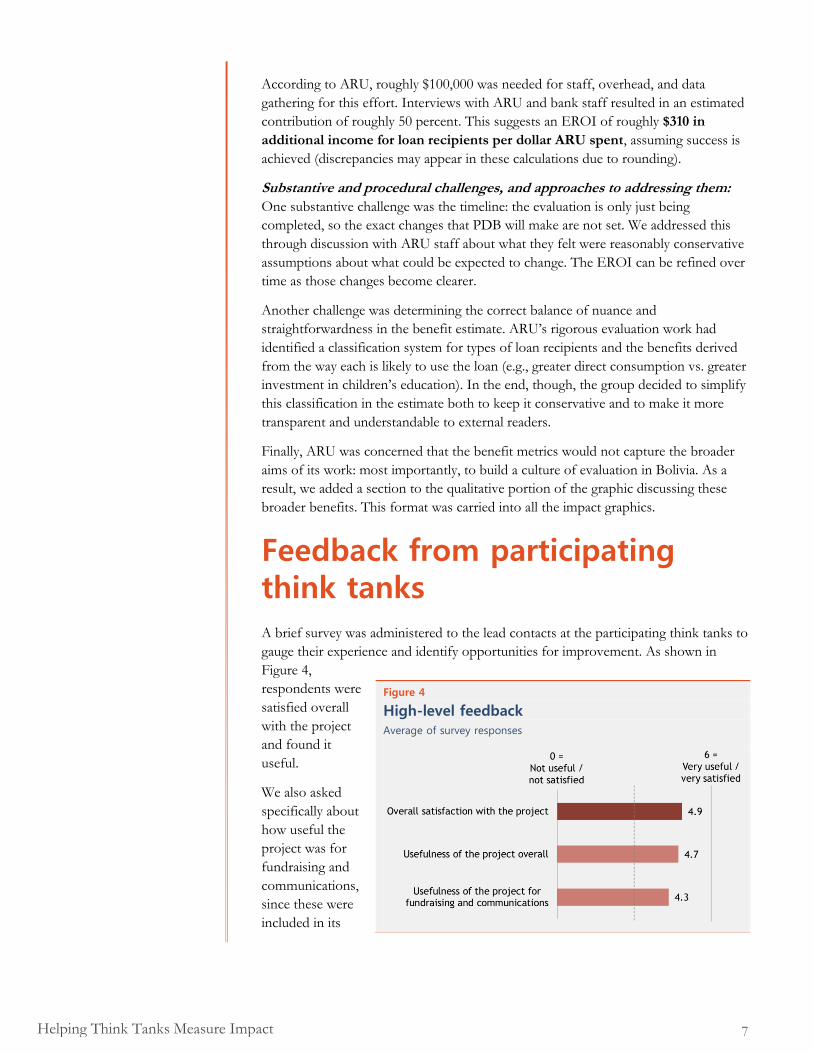
A brief survey was administered to the lead contacts at the participating think tanks to
gauge their experience and identify opportunities for improvement. As shown in
Figure 4,
respondents were
satisfied overall
with the project
and found it
useful.
We also asked
specifically about
how useful the
project was for
fundraising and
communications,
since these were
included in its
Figure 4
High-level feedback Average of survey responses

8 Helping Think Tanks Measure Impact
aims. There was a bit more ambivalence here, partly because, as some respondents
commented, it is too soon to know how useful the impact graphics are for these
purposes. As a result, it may be worth checking in with the think tanks in a year or so.
However, the group seems optimistic about the graphics’ utility.
Diving deeper into the impact graphic approach as an M&E tool, we also asked the
respondents to rate how important each of the criteria described in Section 1 was for
measurement, and how well each was delivered by the impact graphic process. As
Figure 5 shows, the ratings tracked each other fairly well. Most encouraging of all is
the fact that respondents overall believe it is somewhat likely that their institution will
use a similar approach for evaluating the success of completed projects going forward
(3.7 out of 6).
The slight lag in the measures outcomes/impact in addition to inputs and nuanced criteria
between the delivery by impact graphics and the criteria’s importance in M&E likely
is explained by the fact that some participants were nervous about the rough nature
of the quantitative estimates and how prominently they were featured. Indeed, the
need for careful treatment of the quantitative estimates came up in several
respondents’ comments, and in discussions at the M&E workshop in Peru. This
suggests that one opportunity for improvement is to work with the think tanks to
refine the estimates and their messaging. While this probably would require more
time than was available in this project for one-off case studies, helping think tanks
systematically institutionalize a similar approach would give them the tools to make
the appropriate tradeoffs themselves.
Finally, Figure 6
shows the results
of two questions
on the survey
related to using an
EROI-like
approach
prospectively to aid
in strategic
decision-making.
Since this topic
was barely
discussed during
the project, it is
not surprising that
the likelihood of
use rating, in
particular, is a bit
lower here. For
the same reason, it is perhaps noteworthy that the ratings are as high as they are. At
the Peru workshop, several attendees – including one who otherwise was critical of
Figure 5
Criteria for M&E
Average of survey responses
Likelihood of using impact graphics for M&E

9 Helping Think Tanks Measure Impact
the approach11 –
suggested that
EROI might be
even more useful
for prospective
decision-making
than for
retrospective
M&E.
This sentiment is
consistent with
Redstone’s previous experience, in that we have found EROI to be most helpful
when used to create an integrated system for both strategic decision-making and
M&E. Section 5 goes into more detail on this application of EROI.
It is important to keep in mind that longer-term systematic uptake of the
methodology likely would require more intensive efforts with any particular think
tank. For example, some TTI-funded institutions have begun discussing the
possibility of a joint effort to build a similar M&E approach into their institutions
systematically as part of the Initiative’s second phase. The narrow purpose of this
project, conversely, was to generate case studies to help funders understand the
impact that think tanks can have. As discussed regarding Figure 4, the early results are
promising but it will take a bit of time to know how successful the project was in
reaching these objectives. Beyond that, it is exciting that many participants are
interested in using the methodology in the future. However, no efforts to institute it
systematically in a TTI-funded institution have occurred.
Step-by-step guide for a think tank To help readers create their own case studies, this section contains a step-by-step
guide to compiling the information needed to create an impact graphic, including an
EROI estimate.
The guide is divided into the following steps:
Choosing and describing a case
Estimating the benefit
Estimating the cost
11 Mendizabal, Enrique (2013). A cheaper and more useful alternative to ROI for a think tank: Force Field Analysis. On Think Tanks blog, http://onthinktanks.org/2013/04/15/a-cheaper-and-more-useful-alternative-to-an-roi-for-a-think-tank-force-field-analysis/.
Figure 6
Criteria for M&E
Average of survey responses
Likelihood of using impact graphics for strategic
decision-making
We have found EROI to be most helpful when used
to create an integrated system for both strategic decision-making
and M&E
10 Helping Think Tanks Measure Impact
Estimating your institution’s contribution to the benefit
Estimating your institution’s expected return on investment
For further details, please see the technical notes accompanying the example impact
graphics on the TTI website. Reading these documents, which contain the
methodology, data, and assumptions behind each number in the impact graphics, is
the best way to see how the methodology has been applied in practice.
Choosing and describing a case
The first step in creating an impact graphic is to choose a case. Redstone has worked
with organizations that use EROI across all of their work, so there likely are many
cases involving your institution that could work well. Nonetheless, starting with a
straightforward case can help you become comfortable with the approach. The ideal
case has two traits:
A strong and direct connection between your institution’s work and a policy change or other impact. The definition of “policy” is broad: it refers to legislation, judicial opinion, and administrative regulations as well as to executive branch and/or donor practices. Similarly, a policy change could result in a totally new policy, refinements to one that already existed, defense against the repeal of a good policy, or changes that make implementation more feasible or effective.
Tangible real-world benefits that can be estimated, even if such an estimate is very rough. For example, the ARU case discusses a policy that will result in more income for microfinance loan recipients. Contrast that case to one in which a think tank may have helped create a new government research institute on an important issue. This certainly could be a valuable achievement, but it would be difficult to estimate the EROI until the institute’s research began influencing policy.
Once you have chosen a case, consider these three questions:
What was the problem or opportunity that the policy sought to address?
How did your institution contribute to the policy change process?
How do you think the policy will affect society? In other words, what would have happened if the policy did not come about?
These details form the basis for the qualitative portion of the case. The remainder of
the graphic – and of this guide – covers the quantitative piece: the return on
investment estimate.
Estimating the benefit
The first element of the EROI equation is the benefit, or what the policy’s effect on
society will be. To estimate the benefit, begin by determining what metric to use in
measuring the policy’s impact. This may tie closely to your answer to the third
question above and ideally should relate to your institution’s overall goals.
To estimate the benefit, begin by
determining what metric to use in
measuring the policy’s impact
11 Helping Think Tanks Measure Impact
See Section 3 for examples of metrics others have used. Note that it is not necessary
for the metric to be monetary, though it should focus on real-world outcomes.
The next step is to consider how you might estimate the benefit using those metrics.
There is no set way to do this – your creativity is needed. The estimate does not have
to be complicated. Indeed, given the often speculative nature of these estimates,
simpler can be better. Here are a few thoughts to help get you started:
For metrics that focus on people or households, it may be helpful to break the estimate into two parts: how many people will be affected and how strongly will they be affected?
For simplicity and conservatism, you can limit the estimate to a set number of years to avoid estimating benefits in perpetuity. For example, is there a standard government planning cycle?
If the policy is unlike anything that has existed before, or that has been studied in your country, there may be a comparable situation in another country or topic area. For example, if your policy covers the management of revenue from newly discovered natural resources, your country may have experience (good or bad) in managing another resource, or there may be another country with experience managing the same resource.
If the estimate feels particularly speculative, you can use several scenarios for key assumptions (e.g., a 10%, 30%, or 50% improvement) or otherwise display a range.
Estimating the cost
The denominator of the EROI formula is the cost. Note that this refers to the cost to
your institution of working on this policy effort – it is not the cost of the
government’s spending related to the policy. This is because you are estimating your
institution’s EROI.
A quick rule of thumb for estimating cost is to multiply the number of years over
which an effort occurred, the average cost per full-time staff person per year, and the
number of full-time staff person equivalents who were involved. You can add other
costs (e.g., data gathering and communications) as needed.
Estimating your institution’s contribution to the
benefit
To estimate the true return on investment for your institution, we need to understand
the portion of the benefits for which your institution can claim credit – the
contribution.
This is the most difficult factor to estimate. However, Redstone and its partners have
recently worked on precisely this problem. The results are presented in this paper and

12 Helping Think Tanks Measure Impact
were applied in simplified form herein.12 To summarize, economist Daniel Kahneman
has found that “simple, equally weighted formulas based on existing statistics or on
common sense are often very good predictors of significant outcomes.”13 So, a
flexible but structured framework for tracking the generally necessary conditions for
policy change can help assess where a think tank’s contributions have been most
important (or could be most helpful, in the case of prospective use – see Section 5).
Redstone’s review – and field testing with partners – of roughly a dozen policy
change evaluation models revealed a relatively constant set of key conditions. For this
project’s purposes – specifically, to recognize the centrality of research to think tank
work and make its benefits easier to identify – the list was modified into these six
conditions:
Functioning institutions: The relevant legislative, legal, and regulatory institutions are functioning sufficiently for research and advocacy to be effective
Responsive and accessible supporting research: The solution is supported by compelling, data-driven evidence that can counter opposing arguments and sway decision-makers
Feasible, specific, and flexible solution: A feasible solution has been developed and shown to produce the intended benefits, with acceptable alternatives if the exact proposal is untenable
Powerful champions in the key institutions: Decision-makers who can overcome the opposition support the solution and its underlying principles
Well-planned, led, and supported campaign: Advocates assemble resources, a pragmatic and flexible strategy, and a supportive public or other allies
Clear implementation path: The implementing institutions have the commitment and the capacity to execute the solution
The difference in the strength of each condition before and after the think tank’s
intervention gives a rough sense of the think tank’s contribution. The method for
translating those ratings into a numerical contribution estimate depends on what
assumptions best reflect your context. For simplicity, we generally use a raw average:
we take the average difference between the before and after ratings and divide by four
(the difference between the very high and very low ratings). In some cases we have
used more complex methodologies, such as grouping the conditions into three stages
(agenda setting, adoption, and implementation) and multiplying the average difference
within each stage.14 For communications, the most important element is transparency,
and for systematic use, it is consistency – either way, as with benefit, the goal is a
balance of reasonableness and usefulness, not scientific precision.
12 Barkhorn, Ivan; Huttner, Nathan; and Blau, Jason (2013). “Assessing advocacy.” Stanford Social Innovation Review, Spring 2013, pp. 58-64. 13 Kahneman, Daniel (2011). Thinking Fast and Slow. New York: Farrar, Straus, and Giroux. 14 Barkhorn, Huttner, and Blau 2013.

13 Helping Think Tanks Measure Impact
In some cases, not all the conditions are relevant. For example, there may be no need
for a large advocacy campaign. In that case, you can leave out the irrelevant
conditions, which will have the effect of raising the importance of each remaining
condition. Conversely, you can add other conditions that you feel are not captured in
this list.
In creating the impact graphics, we asked several knowledgeable experts from outside
the think tank – such as policymakers, journalists, and staff at other think tanks or
NGOs – to make these same contribution ratings. This is optional (especially for
systematic use of this methodology), but can make the estimates more credible.
How strong were the following conditions for policy change before
the think tank’s involvement and after, when the change occurred?
Mark “O” for the strength BEFORE Fundación ARU involvement
Mark “ X ” for the strength AFTER Fundación ARU involvement, when the change occurred
Condition Strength rating a. Functioning institutions: The relevant
legislative, legal, and regulatory institutions are functioning sufficiently for research and advocacy to be effective
b. Responsive and accessible supporting research: The solution is supported by compelling, data-driven evidence that can counter opposing arguments and sway decision-makers
c. Feasible, specific, and flexible solution: A feasible solution has been developed and shown to produce the intended benefits, with acceptable alternatives if the exact proposal is untenable
d. Powerful inside champions: Decision-makers who can overcome the opposition support the solution and its underlying principles
e. Well-planned, led, and supported campaign: Advocates assemble resources, a pragmatic and flexible strategy, and a supportive public or other allies
f. Clear implementation path: The implementing institutions have the commitment and the capacity to execute the solution
g. Other:

14 Helping Think Tanks Measure Impact
Estimating your institution’s expected return on
investment
Finally, to create the EROI estimate, divide the benefit by the cost, then multiply the
resulting number by the contribution estimate.
A possible broader application: prospective decision-making The project discussed in this document was limited in scope: it focused on applying
EROI to six isolated success stories and communicating the stories in a compelling
way to donors. This document’s main purpose has been to show how these and other
think tanks could use the approach (or at least the EROI component) as a systematic
retrospective M&E tool.
EROI also is commonly used as an aid for prospective decision-making: that is, to
decide what opportunities to pursue and how strongly to pursue each one. As
discussed above, several participants at the recent Latin America M&E workshop felt
that EROI also may be quite useful for internal decisions on resource allocation.
While not a replacement for expertise or judgment calls, EROI can provide a
consistent way to use existing knowledge to clarify decision making. Specifically,
practical experience suggests that EROI can help organizations make the assumptions
behind their decisions clear to themselves and others, learn more about opportunities
by thinking critically about the elements of EROI, compare alternative approaches,
and prioritize the highest-return opportunities. Moreover, recent innovations in
strategic planning in the social sector suggest that organizations are most successful
when M&E connects closely to strategy.15
To use EROI this way, the methodology is largely the same, with a couple small
adjustments:
To compare opportunities, a standard benefit metric is needed, which should relate to an organization’s overall goal. For example, another prominent think tank with which Redstone has worked often uses two metrics when it estimates EROIs: one standard metric and a context-specific metric that allows for exploration of other important benefits from the policy. For a poverty reduction-focused think tank, a standard metric could be “additional income for poor people in developing countries,” while context-specific metrics would depend on the specific project (e.g., more natural resource revenues managed transparently).
Instead of estimating the benefit of an achievement that has occurred (e.g., passing a policy), you would estimate the benefit of the achievement you hope to secure. Likewise, the contribution ratings are not before and after, but rather
15 See, for example: Twerksy, Fay, et al. (2010). A guide to actionable measurement. Gates Foundation. http://docs.gatesfoundation.org/learning/documents/guide-to-actionable-measurement.pdf
EROI can provide a consistent way to
use existing knowledge to
clarify decision making
15 Helping Think Tanks Measure Impact
current strength vs. how strong you would expect to make each condition. In other words, the contribution estimate is the increase that you expect to bring about in an effort’s likelihood of success. In practice, though, the math is the same.
Think tanks often begin research on a topic without knowing exactly where it will lead. As a result, it may make sense for an institution to divide its work explicitly into more exploratory efforts (where EROI may be less relevant) and shorter-term policy-focused efforts for which EROI can be a helpful M&E tool. EROI generally would be used only for the latter, but those working on longer-term research projects still could be expected to use an “EROI mindset” in considering where more and less progress has been made.
The list of conditions for policy change also could be useful as a quick work planning
tool, since monitoring changes in the conditions over time helps reveal where the
most progress is being made and where more focus is needed. Note that it is entirely
possible for conditions to get weaker after they become strong – policy change is
rarely linear.
* * *
We look forward to comments, ideas, and suggestions for how the approach
described in this paper can be made most useful to think tanks and other interested
practitioners.
16 Helping Think Tanks Measure Impact
Appendix A: Other case examples This section describes three other case studies, including qualitative summaries,
EROI estimates, substantive and procedural challenges, and approaches to addressing
them.
Ghana: Institute of Economic Affairs (IEA) – case 1
Case summary: Ghana is one of Africa’s most successful democracies, having held a
series of peaceful elections and transfers of power. But peaceful does not mean smooth.
Tension and uncertainty during presidential transitions have threatened Ghana’s
political stability and generated misuse of state assets. Moreover, empirical evidence
suggests that political instability is harmful to economic growth. IEA, whose research
had clarified the close relationship between rough transitions and polarization, led the
drafting of a Presidential Transition Act to regulate the transfer of authority. It passed
unanimously in 2012, but had already had an effect. Even though it was only a draft
law in 2009, it guided that year’s transition and facilitated a smoother power change
than in the past. Interviewees are optimistic about its future effects, given its
influence in that transition and after the December 2012 election.
EROI: Two benefits were created. One was a more modest but also more readily
measurable estimate of the impact on the misuse of state assets during transitions.
The other was a broader estimate of the economic effects of greater political stability,
based on recent research on the relationship between stability and growth. The latter
is admittedly somewhat speculative, so the benefit is shown within a large range: $0.4-
1.4 billion in potential additional gross domestic product (GDP) – or avoided loss in
GDP – over the next four political terms as a result of greater political stability (net
present value).
According to IEA, roughly $100,000 was needed for this effort. Interviews with IEA
staff and outside experts resulted in an estimated contribution of roughly 45 percent.
Using the midpoint of the benefit estimate, this suggests an EROI of roughly $4,200
in additional GDP per dollar IEA spent, assuming success is achieved.
Substantive and procedural challenges, and approaches to addressing them:
As noted above, the benefit estimate was somewhat more speculative than in other
cases, though existing data provided a reasonable proxy. As a consequence, the
benefit is shown using a range, which both accounts directly for the uncertainty but
also communicates recognition that the estimate is rough.
Ghana: Institute of Economic Affairs (IEA) – case 2
Case summary: IEA has had many policy successes and was particularly enthusiastic
about the impact graphic approach, so two cases were pursued. In this second case,
17 Helping Think Tanks Measure Impact
IEA sponsored an initiative to determine policy options for managing Ghana’s
newfound oil wealth. Recent experience in Ghana and elsewhere suggests natural
resources can be both a blessing and a curse for developing countries. That led IEA
and its NGO partners to help policymakers draft legislation on managing oil
revenues. The 2011 Petroleum Revenue Management Act includes most of the
suggestions from IEA and its partners: it requires revenues to go through the public
budget, divides use between direct investment with clear priorities (e.g., infrastructure
and agriculture) and long-term savings, and establishes oversight committees.
EROI: The benefit estimate focused on the amount of resources that will be
managed more transparently as a result of the law. It relied on conservative estimates
of potential revenues and a proxy baseline for lost revenue from mismanagement
based on the experience in nearby Nigeria. Several scenarios were created, given the
estimates’ speculative nature, and produced a range estimate of $300-700 million in
oil revenues through 2025 that will be managed more transparently as a result of the
Act (net present value).
According to IEA, roughly $125,000 was needed for this effort. Interviews with IEA
staff and outside experts resulted in an estimated contribution of roughly 40 percent.
Using the midpoint of the benefit estimate, this suggests an EROI of roughly $1700
in additional transparently managed revenues per dollar that IEA spent,
assuming success is achieved.
Challenges and approaches to addressing them: This estimate faced many of the
same substantive challenges as the other IEA case, such as the need for a range to
account for uncertainties. The main challenge, though, was related to
communications – in particular, balancing IEA’s leadership with the important role
played by several NGOs, including those funded by TTI funders (e.g., Revenue
Watch Institute and the International Growth Centre). There is no magic formula for
resolving this type of issue, but close communication with IEA and these funders
through several drafts helped allay concerns.
Tanzania: Research on Poverty Alleviation (REPOA)
Case summary: Tanzania continues to struggle with high poverty levels – especially
in rural areas – despite fast-paced growth and several rounds of strategic planning to
reduce poverty. In 2001, after the first poverty reduction strategy was completed, the
government created working groups to monitor progress and identify improvements.
One of these – the Research and Analysis Working Group – was tasked with
analyzing data from the others and making policy suggestions. REPOA serves as the
group’s secretariat. In this role, it observed that growth had largely bypassed
agriculture and other sectors that affect the poor. Its response was to encourage a
shift to a more nuanced approach that prioritizes inclusive growth in addition to
providing social services. In practice, this has meant measures such as more public
investment in roads and infrastructure as well as efforts to improve farmers’
livelihoods.
18 Helping Think Tanks Measure Impact
EROI: The benefit estimate focused on the increased investment in rural roads. Past
road-building efforts and data on the effect of roads on rural incomes led to an
estimate of income increases from the current round of strategic plan execution: $40-
80 million more income for rural workers with closer access to a paved road from
2016-2025 (net present value).
According to REPOA, roughly $250,000 was needed for this effort. Interviews with
REPOA staff and outside experts produced an estimated contribution of roughly 35
percent. Using the midpoint of the benefit estimate, this suggests an EROI of roughly
$85 in additional income per dollar that REPOA spent, assuming success is
achieved.
Challenges and approaches to addressing them: As in other cases, a challenge for
the EROI estimate was capturing the benefits of REPOA’s leadership over time. For
simplicity and clarity, this estimate focuses on the most important impact while the
qualitative portion of the graphic discusses the broader benefits. Even if the
quantitative metric does not capture everything, it keeps the focus on the ultimate
outcomes. After all, the broader effects are only important to the extent that they
influence tangible change on the ground.
Finally, data scarcity was a particular challenge for this case. As is usually true,
however, reasonable proxies were found, though only after more research than was
required for the other cases. Additionally, a range again was used to acknowledge the
uncertainty.

19 Helping Think Tanks Measure Impact
Appendix B: Sources Alcazar, Lorena, et al. (2012). Learning to monitor think tanks impact: Three experiences from
Africa, Asia, and Latin America. Lima: GRADE.
Barkhorn, Ivan; Huttner, Nathan; and Blau, Jason (2013). “Assessing advocacy.”
Stanford Social Innovation Review, Spring 2013, pp. 58-64.
Carden, Fred (2009). Knowledge to policy: Making the most of development research. Ottawa
and Los Angeles: International Development Research Centre and Sage
Publications.
Kahneman, Daniel (2011). Thinking Fast and Slow. New York: Farrar, Straus, and
Giroux.
McGann, James (2013). 2012 Global Go To Think Tanks report and policy advice.
Philadelphia: U. of Pennsylvania.
Mendizabal, Enrique (2013). A cheaper and more useful alternative to ROI for a think tank:
Force Field Analysis. On Think Tanks blog, http://onthinktanks.org/2013/04/15/a-
cheaper-and-more-useful-alternative-to-an-roi-for-a-think-tank-force-field-analysis/
Overseas Development Institute (2009). Management techniques: Force field analysis.
http://www.odi.org.uk/publications/5218-force-field-analysis-decision-maker.
Think Tank Initiative (2013). Approach.
http://www.thinktankinitiative.org/program/approach
Tuan, Melinda (2008). Measuring and/or estimating social value creation: Insights into eight
integrated cost approaches. Seattle: Bill and Melinda Gates Foundation.
http://www.melindatuan.com/dnld/Measuring%20and-
or%20Estimating%20Social%20Value%20Creation.pdf
Twerksy, Fay, et al. (2010). A guide to actionable measurement. Gates Foundation.
http://docs.gatesfoundation.org/learning/documents/guide-to-actionable-
measurement.pdf
Young, John and Mendizabal, Enrique (2009). Helping researchers become policy
entrepreneurs. London: Overseas Development Institute.
http://www.odi.org.uk/publications/1127-become-policy-entrepreneur-roma