sept 2010 roadshows en final - safran€¦ · · 2014-11-25potential for 130+ cfm56 engines...
TRANSCRIPT

Safran
Investors roadshow
Europe & North America September 2010
2Investors roadshow - September 2010
Safran
An international high-technology groupTier-1 equipment supplier

3Investors roadshow - September 2010
2009 revenue by activities
26%
10%54%
Aircraft Equipment
DefenceAerospacePropulsion
Security
Holding
9%
1%
Revenue €10,448MRecurring operating income €729M (7.0% of revenue)
Net income - Group share €395M (€0.99/share)
Free Cash Flow €818MNet cash (debt) €(498)M (11% gearing)
A tier-1 leader in Aerospace, Defence & SecurityFY 2009 key figures*
* FY 2009 adjusted & restated figures

4Investors roadshow - September 2010
• Engine nacelles• Wheels & brakes
• Landing gear• Wiring• Power transmission
• Biometric and ID solutions• Helicopter Flight Control
• Detection
• Inertial navigation systems• Optronic systems: #1 Europe• Military Engine
• Space Propulsion
• Single aisle aero-engine• Helicopter aero-engine
Aerospace Propulsion Aircraft Equipment Defence and Security
Leading market positionsBusinesses with high technological barriers to entry

5Investors roadshow - September 2010
NacellesNacelles and components(thrust reversers,…)
Engine equipment and parts• Integrated engine control systems • Power transmissions• Engine modules and components• Composite engine parts
Engines• CFM56 family (50/50 with GE)• SAM146 engine for the Superjet 100
Regional Jet (50/50 with NPO Saturn)• Participation in programs: CF6, GE90,GE90-115B, GP7000, PW4000, AS900, CF34, GEnX
Landing & braking systems• Landing gear for all types of aircraft • Braking/landing control systems• Wheels and carbon brakes• Control systems and hydraulics• Maintenance, repair and overhaul
Aircraft Equipment• Network server systems• Back-up flight control• Secure data link• Cockpit control systems• Electrical wiring systems• Aircraft condition monitoring systems
Engine services• Maintenance, repair and overhaul• Engine testing and test equipment
• Composite aerostructures• Auxiliary power units• Hydraulic systems• Sensors and actuators• Ventilation/filtration• Inertial references
A tier-1 supplier in aerospaceWhat do we do
6Investors roadshow - September 2010
RENEWAL
UNTIL
2040Nacelles
July 2008
(LEAP-X)
RichardNixon
Georges Pompidou
CFM56
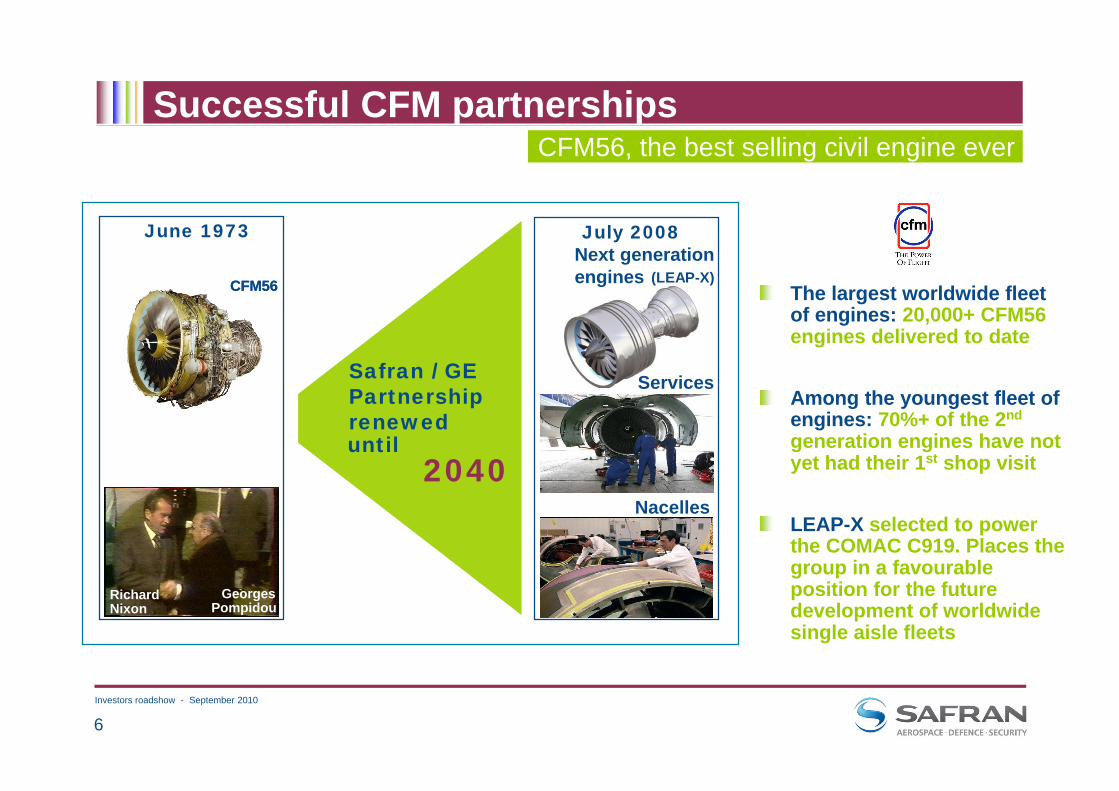
Safran / GE Partnership reneweduntil
2040
Next generation engines
RichardNixon
Georges Pompidou
RichardNixon
Georges Pompidou
June 1973
CFM56 The largest worldwide fleet of engines: 20,000+ CFM56 engines delivered to date
Among the youngest fleet of engines: 70%+ of the 2nd
generation engines have not yet had their 1st shop visit
LEAP-X selected to power the COMAC C919. Places the group in a favourable position for the future development of worldwide single aisle fleets
Services
Successful CFM partnershipsCFM56, the best selling civil engine ever
7Investors roadshow - September 2010
0
5 000
10 000
15 000
20 000
82 83 84 85 86 87 88 89 90 91 92 93 94 95 96 97 98 99 00 01 02 03 04 05 06 07 08 090
100
200
300
(num
bero
f en
gine
s)
(cha
nge
in g
loba
l CFM
56 s
pare
s re
venu
e)
Base
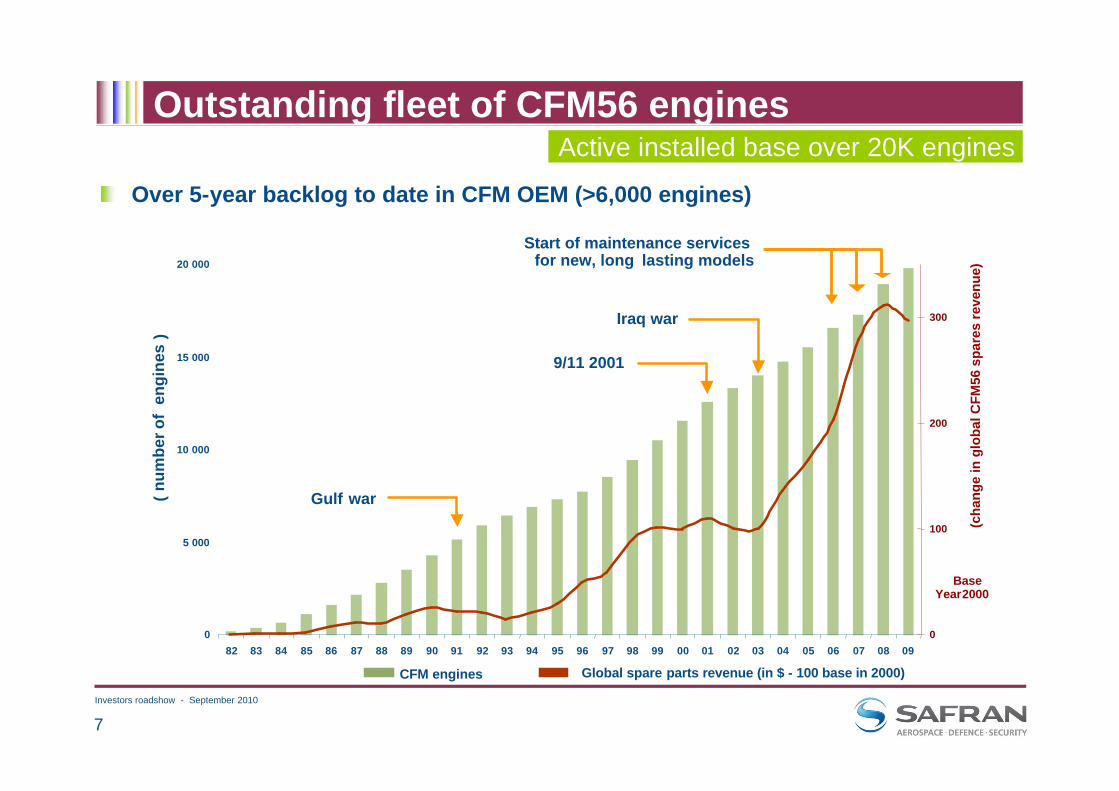
Gulf
Iraq
Global spare parts revenue (in $ - 100 base in 2000)
Year2000
war
9/11 2001
war
CFM engines
Start of maintenance servicesfor new, long lasting models
Over 5-year backlog to date in CFM OEM (>6,000 engines)
Active installed base over 20K engines Outstanding fleet of CFM56 engines

8Investors roadshow - September 2010
Secure ID documentsConsolidated since Sept. 2008
100% ownership (€325 m)
HomeLand Protection
2008 2009
Fingerprint ID systemsConsolidated since April 2009
100% ownership (€133 m)
Tomography-based detection systemsConsolidated since Sept. 2009
81% ownership (€407 m)
3 strategic acquisitions in Biometric ID and Detection systems for a total cash-out of €865 m
An attractive investment case consistent with our business modelSecurity becoming a strong third pillar
2010
9Investors roadshow - September 2010
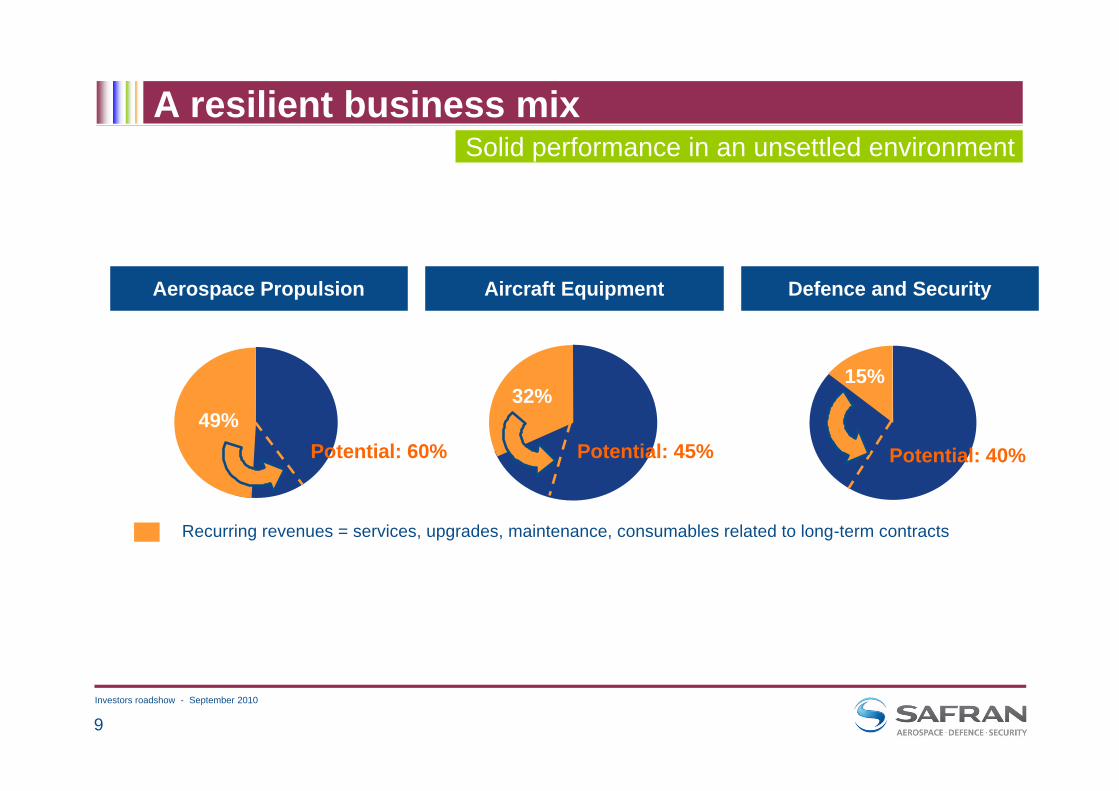
Aerospace Propulsion Aircraft Equipment Defence and Security
49%32%
Recurring revenues = services, upgrades, maintenance, consumables related to long-term contracts
Potential: 60% Potential: 45% Potential: 40%
15%
A resilient business mixSolid performance in an unsettled environment

10Investors roadshow - September 2010
As of July 31, 2010
56 %
French State30.2%
Areva7.4%
Public41.2%
Treasury shares4.2% Employees
17.0%
Equity shareholding$10.9bn market cap (Sept. 2, 2010)

11Investors roadshow - September 2010
Safran
H1 2010 Highlights

12Investors roadshow - September 2010
H1 2010 financial highlightsSolid operating leverage
H1 09 H1 10
5,1495,197
Growing recurring operating income across all four activities
347
428+23%
Slight deterioration in net debt due to dividend payment (€152M) and French
MoD payment delays (€269M)
(498)(€M) (€M)
(€M)
H1 09restated
H1 10
H1 09 H1 10
(573)
+0.9%
Resilient revenue, with growth in Defence and Security
13Investors roadshow - September 2010
Business model is performingSolid performance in improving economic conditions
Increasing group margins towards 8% range
Increasing profits in Propulsion despite CFM aftermarket softness
Recovery plan delivering results in Equipment
Originating new business in Security at attractive margins
Benefiting of over 2 years of Safran+ cost savings
Foreign exchange effects
Tailwind on revenue and mild headwind on profits
Investing in world-class capability - improving productivity
Opening of 2 new facilities in Mexico & inauguration of 2 new world-class French facilities

14Investors roadshow - September 2010
Encouraging economic signs
IATA: traffic above pre-recession levels
Driven by traffic in emerging countries (Asia, Middle East,Africa, and Latin America) and low cost carriers
Airlines expected to post profits in 2010
Airbus & Boeing announced uplift in narrowbody production rates for 2011/12
Potential for 130+ CFM56 engines run-rate increment
Continued demand in Security for biometry and detection end-to-end solutions
€/$ down to 1.25-1.30 range, providing long term opportunity for stronger performance
Fundamentals improving
Passenger8.1%
Freight27.5%
(YTD July 2010)
15Investors roadshow - September 2010
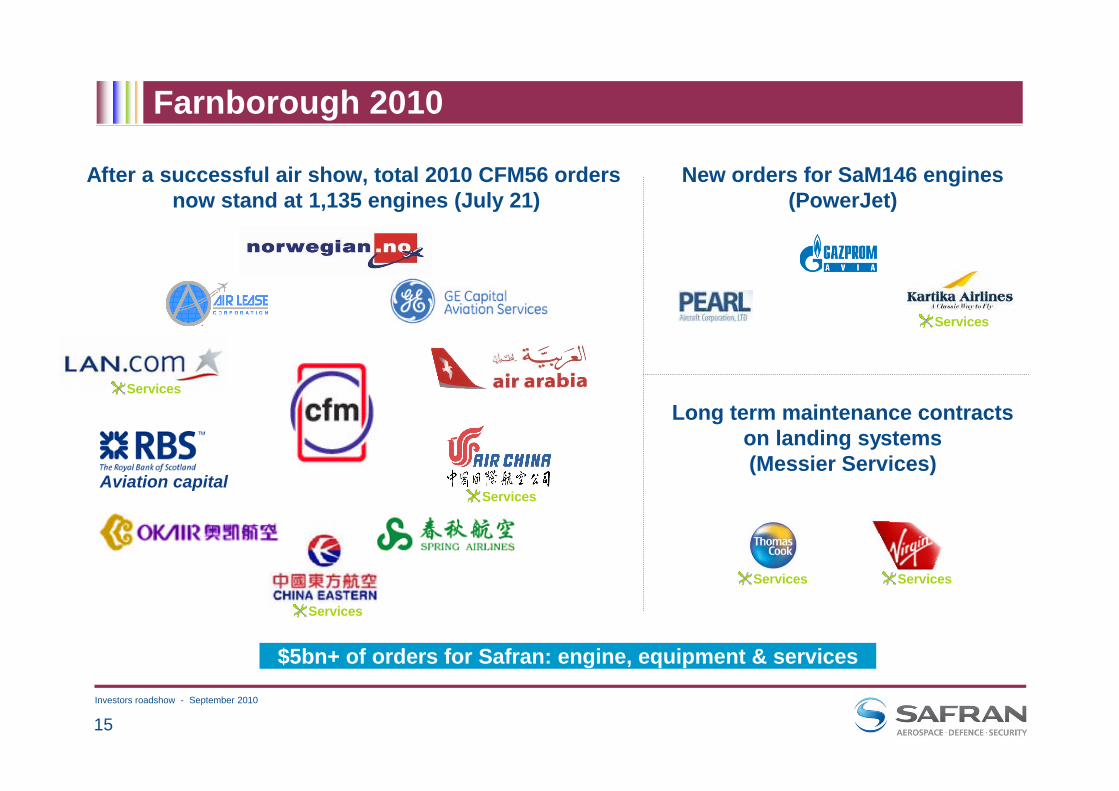
Farnborough 2010
Aviation capital
Services
Services Services
Services
Long term maintenance contracts on landing systems (Messier Services)
New orders for SaM146 engines (PowerJet)
Services
Services
$5bn+ of orders for Safran: engine, equipment & services
After a successful air show, total 2010 CFM56 orders now stand at 1,135 engines (July 21)

16Investors roadshow - September 2010
39
(20)%
(32)%
(27)%
636
422
28
121
597
547
41
165
Number of deliveries
1. CFM56 engines
2. Helicopter engines
3. A380 nacelles
4. Small nacelles (biz & regional jets)
Aerospace OE
20,383
55%
H1 2010
6%
3pts
19,216
52%
Total installed base
Share of 2nd gen. engines
ChangeH1 2009CFM56 engines
(1.8)%2,3372,380 **OE revenue* Prop. & Equipment (in €M)
Increased share of 2nd generation CFM engines in fleet
future flow of high value services
1. Strong CFM56 deliveries, above H1 2009 record level
2. Impact of decline in small helicopters
3. Impact of inventory build-up at end 2009 due to Airbus A380 deliveries delay
4. Continued weakness in business & regional jets
* Including revenue from R&D contracts and miscellaneous** Restated to include leases in Services
Aerospace OE impacted, but CFM workhorse continued at top rates

17Investors roadshow - September 2010
Services revenue driven by engines aftermarket despite CFM spares sales softness
High performance for services to military customers (aircraft and helicopters)
Growth in high thrust widebody engine spares (e.g. GE90 on B777)
CFM spares’ softness (-25% in $)
* Including spares and maintenance & repair activities** Restated to include leases
Aerospace services
(0.1)%1,8001,802Total services revenue
1.4%1.3pt
44832.6%
44231.3%
Aircraft EquipmentServices share of total revenue
1,35349.0%
H1 2010
(0.5)%(0.1)pt
1,36049.1%
Aerospace PropulsionServices share of total revenue
ChangeH1 2009 **
Services* revenue(in €M)
Resilient total services revenue

18Investors roadshow - September 2010
Worldwide CFM spares revenue in $: -25% in H1 2010 vs. H1 2009Q2 trends broadly similar to Q1 - the low point?
Airlines consume their inventory, delay shop visits & decrease scope of overhauls - optimizing their engine fleet
68 CFM56 powered aircraft returned to service
Impact of island volcano traffic disruption?
46% of CFM active fleet still to have their first shop visit (>80% of the 2nd generation engines)
Aerospace - CFM aftermarket
H1 2009
1,174
H1 2010CFM56 shop visits
(total worldwide)1,011
48%52% 52% 48%
Total -14%1st gen. CFM56 -13%2nd gen. CFM56 -14%
Shop visit numbers are estimates; these can be revised marginally as airlines finalise reports
1st gen. 1st gen.2nd gen. 2nd gen.
Soft CFM aftermarket

19Investors roadshow - September 2010
Identification
Successful integration of Printrak and SDU-I leading to new contract awards (secure driver license system for the state of North Carolina (USA), secure identity documents in Mauritania)
Major new contract awards
Identification: Secure travel documents for Dutch government (7 years)Criminal Investigation Police: AFIS extension or upgrade (Argentina, Mexico, Calgary)
Border control: Replacement of IRS recognition system in the EAU
Detection
Solid orders intake in EDS (TSA, India…)
XRD 3500, the first detection equipment compliant with ECAC Standard 3 level - the standard to be required in Europe from 2012
Contract awards for Computed Tomography systems (Hong Kong, Nassau, Chongqing…) and inauguration of San Jose, CA Terminal B airport with state-of-the-art CTX 9800
SecuritySolid commercial momentum
EDS: Explosive Detection SystemECAC: European Civil Aviation Conference
XRD 3500

20Investors roadshow - September 2010
Strong dynamic in Optronics: 2-digit revenue growthFelin: last milestone reached before 1st Regiment delivery in July
Portable optronics: new contract awards, notably for the US Army
AvionicsReached a technical & commercial agreement with Airbus on A400M GADIRS
Navigation activities stable and slowdown in flight controls
Safran ElectronicsEstablished as the Group’s world-class expertise in electronics and safety-critical software
Inaugurated Sagem’s new facility, the main R&D centre in Massy, near Paris
DefenceRobust niches in Defence matching asymmetric threat needs

21Investors roadshow - September 2010
H1 2010 income statement
Of which cost of net debt of €(20)M
2810.70
48(99)
6(5)
7
3246.3%
nana
5,149
H1 2009reported
2230.56
2070.52
Profit - group shareBasic EPS (in €)
(136)(70)
-(6)
7
(83)(59)
6(5)
7
Net finance (cost) incomeIncome tax expenseProfit (loss) from discontinued op.Minority interestsShare in profit from associates
4288.2%
3416.6%
Profit from operations% of revenue
4288.2%
3476.7%
Recurring operating income% of revenue
5,1975,149Revenue
H1 2010H1 2009restated(In €M)
EPS growth of 8%
22Investors roadshow - September 2010
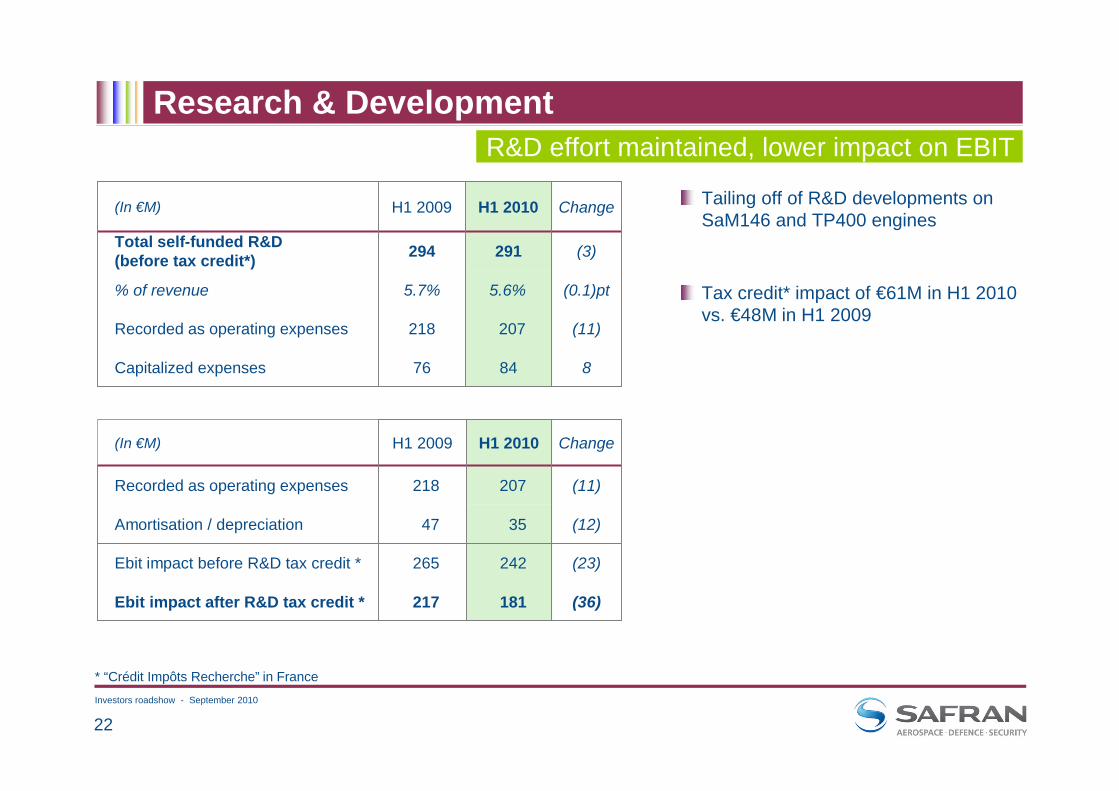
88476Capitalized expenses
(11)207218Recorded as operating expenses
(0.1)pt5.6%5.7%% of revenue
(3)291294Total self-funded R&D(before tax credit*)
ChangeH1 2010H1 2009(In €M)
(36)181217Ebit impact after R&D tax credit *
(23)242265Ebit impact before R&D tax credit *
(12)3547Amortisation / depreciation
(11)207218Recorded as operating expenses
ChangeH1 2010H1 2009(In €M)
Research & Development
Tailing off of R&D developments on SaM146 and TP400 engines
Tax credit* impact of €61M in H1 2010 vs. €48M in H1 2009
* “Crédit Impôts Recherche” in France
R&D effort maintained, lower impact on EBIT
23Investors roadshow - September 2010
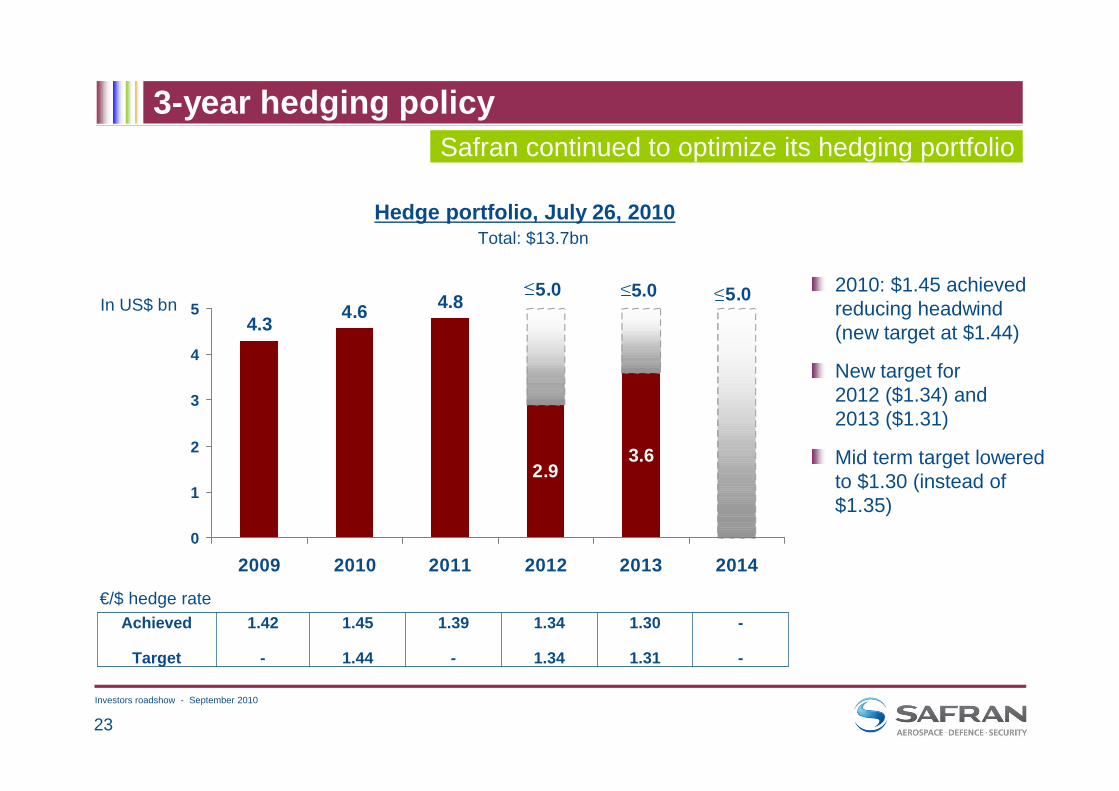
3-year hedging policy
Hedge portfolio, July 26, 2010
1.34
1.34
-
-
1.30
1.31
1.39
-
1.45
1.44
1.42
-
Achieved
Target
In US$ bn2010: $1.45 achieved reducing headwind (new target at $1.44)
New target for 2012 ($1.34) and 2013 ($1.31)
Mid term target lowered to $1.30 (instead of $1.35)
€/$ hedge rate
Safran continued to optimize its hedging portfolio
Total: $13.7bn
3.62.9
4.3 4.6 4.8 5.05.05.0
0
1
2
3
4
5
2009 2010 2011 2012 2013 2014

24Investors roadshow - September 2010
3-year hedging policy
Currency impact on profitability is around 2/3rd in Propulsion and 1/3rd in Equipment; non material for Defence and Security businesses
Headwind reduced in 2010 and material tailwind expected from 2011 onwards
Estimated impact on recurring operating incomeof targeted €/$ hedge rates
Strategy is to reduce future swings in profits
127109
(38)
75
1.42
1.44
1.39
1.31
2009 2011E 2012E
1.34
2013E 2014E
88
1.30
2010E
-100
-50
0
50
100
150
200
250
300
350
400
200
100
0
-100
EBIT impactvs. previousyear (in €M)
1.2
1.3
1.4
1.1
1.35
1.25
1.15
1.05
1
€/$Hedge
rate
300
25Investors roadshow - September 2010
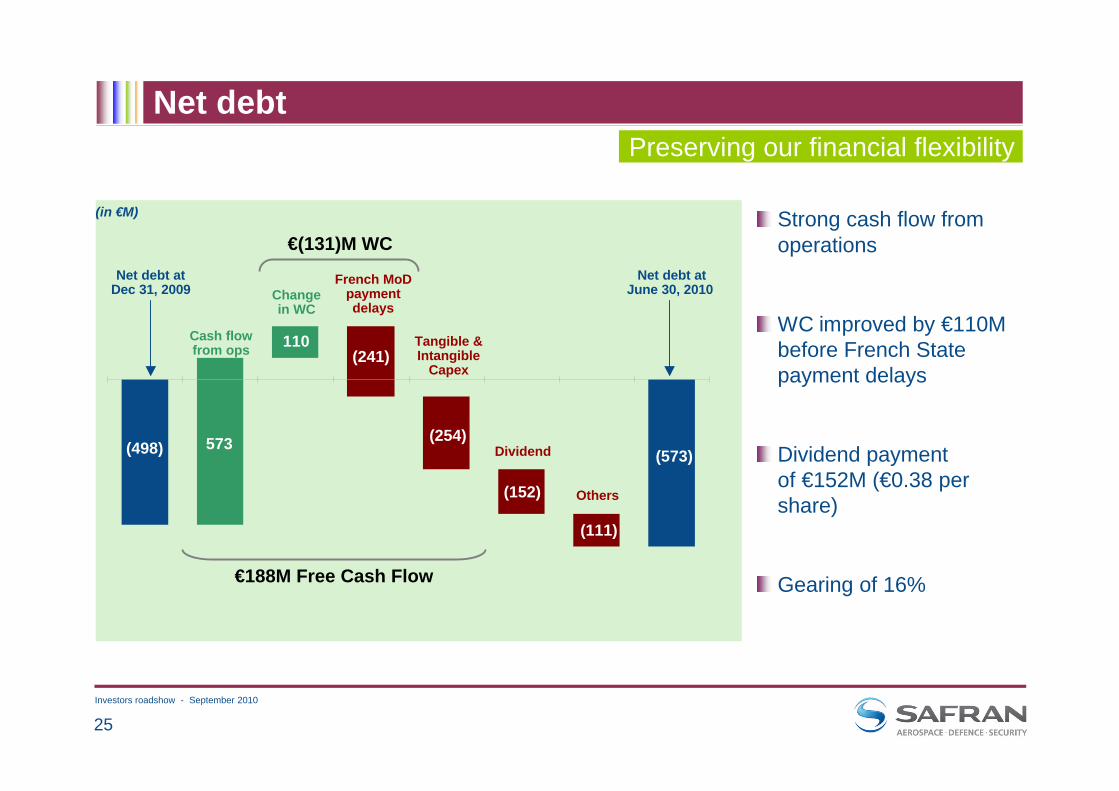
(in €M)
(498)
110
Dividend573 (254)
Net debt
Strong cash flow from operations
WC improved by €110M before French State payment delays
Dividend payment of €152M (€0.38 per share)
Gearing of 16%
Net debt at Dec 31, 2009
Cash flowfrom ops
Others
Net debt at June 30, 2010Change
in WC
Tangible & Intangible
Capex
(111)
€188M Free Cash Flow
(152)
(573)
Preserving our financial flexibility
(241)
French MoDpayment delays
€(131)M WC

26Investors roadshow - September 2010
Gross cash & debt
EIB loan - €300M, undrawn, maturity 2020; subject to 2 covenants (net debt/EBITDA <2.5 and Gearing <1; respectively 0.48 and 0.16 at June 30, 2010)
Credit line - €800M, undrawn, maturity Jan. 2012; no covenants
Available financing resources:Committed & undrawn = €1.1bn
Gross debt repayment schedule(June 30 , 2010)
125
784
1,102
<1 year 1 to 5 years >5 years
€1,250m
€1,000m
€750m
€500m
€250m
€0m
<1 year
The Group is adequately funded
Bond - €750M, maturity Nov. 2014; 4% annual coupon, no covenants.
Bond

27Investors roadshow - September 2010
Balance sheet highlights
2,2435,501
8631,266(573)
2,1265,418
722965
(498)
GoodwillTangible & Intangible assetsOther non current assetsOperating Working CapitalNet cash (debt)
3,417151
1,3002,3442,088
4,353148
1,7392,354
139
Shareholders’ equity - Group shareMinority interestsNon current liabilities (excl. net debt)ProvisionsOther current liabilities / (assets) net
June 30, 2010
Dec. 31, 2009(In €M)
Shareholders’ equity down by €936M
Net debt slightly increased by €75M
OWC increased by €301M at €1,266M (12,1% of revenue), reflecting French MoD payment delays and other non-cash items
Provisions remained stable
Solid balance sheet

28Investors roadshow - September 2010
Safran
Outlook

29Investors roadshow - September 2010
Investing in productivityWorld class operations
Improving industrial efficiency
50% reduction of development and manufacturing cycles of helicopter engines
Massy - June 2010
Bordes - June 2010
Montluçon - Sept. 2010
World-class expertise in electronics and safety-critical software
30 to 40% production cost reduction on some pieces for CFM56-7
Queretaro - Mars 2010
World-class manufacturing facility for sensors and inertial measurements

30Investors roadshow - September 2010
Investing on platforms for growthWhile managing short-term volatility
Airbus A380 Boeing B787 Airbus A400M
Sukhoi Superjet 100 Comac C919 Airbus A350XWB
Growing installed base with higher shipset value
31Investors roadshow - September 2010
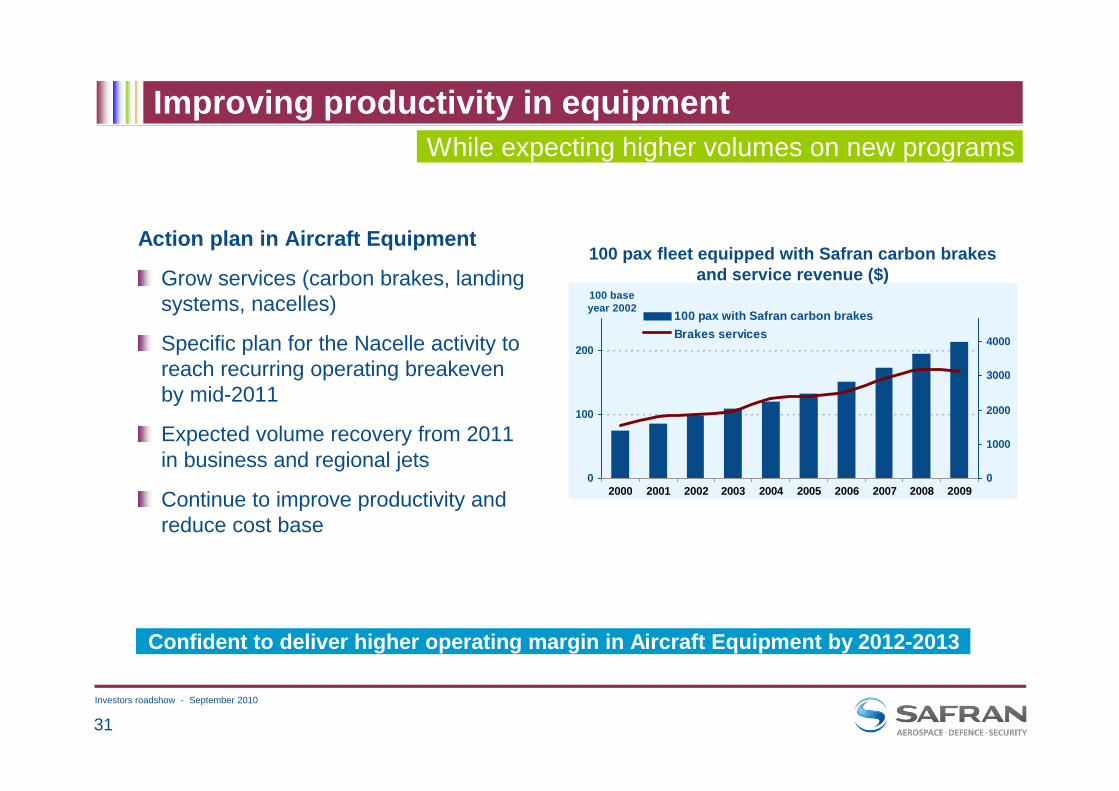
Improving productivity in equipmentWhile expecting higher volumes on new programs
Action plan in Aircraft Equipment
Grow services (carbon brakes, landing systems, nacelles)
Specific plan for the Nacelle activity to reach recurring operating breakeven by mid-2011
Expected volume recovery from 2011 in business and regional jets
Continue to improve productivity and reduce cost base
Confident to deliver higher operating margin in Aircraft Equipment by 2012-2013
100 pax fleet equipped with Safran carbon brakes and service revenue ($)
100 base year 2002
0
100
200
2000 2001 2002 2003 2004 2005 2006 2007 2008 20090
1000
2000
3000
4000
100 pax with Safran carbon brakesBrakes services
32Investors roadshow - September 2010
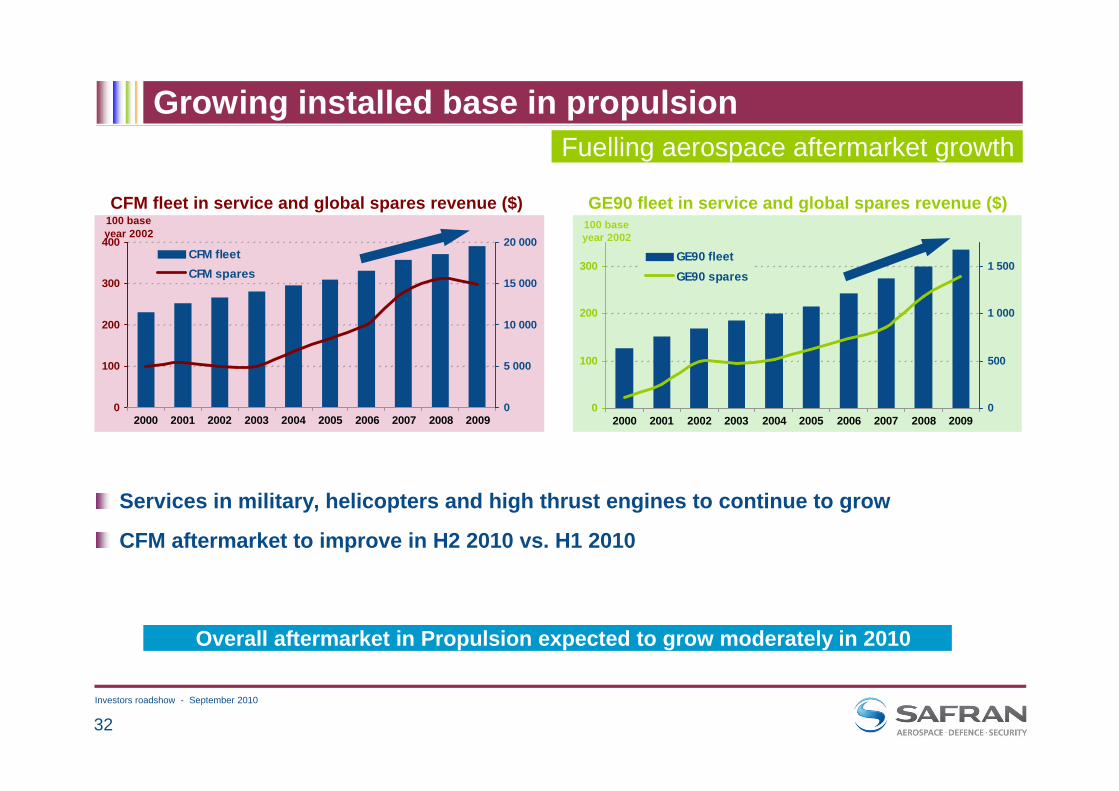
Growing installed base in propulsion
CFM fleet in service and global spares revenue ($)
Fuelling aerospace aftermarket growth
GE90 fleet in service and global spares revenue ($)100 base year 2002
0
100
200
300
400
2000 2001 2002 2003 2004 2005 2006 2007 2008 20090
5 000
10 000
15 000
20 000CFM fleetCFM spares
0
100
200
300
2000 2001 2002 2003 2004 2005 2006 2007 2008 20090
500
1 000
1 500GE90 fleetGE90 spares
100 base year 2002
Services in military, helicopters and high thrust engines to continue to grow
CFM aftermarket to improve in H2 2010 vs. H1 2010
Overall aftermarket in Propulsion expected to grow moderately in 2010

33Investors roadshow - September 2010
Upgraded 2010 outlook
Revenue expected to be similar to 2009
Recurring operating margin expected to trend towards the 8% range(at a targeted hedge rate of USD 1.44 to the Euro)
Free cash flow expected to represent at least half of the recurring operating income(assuming that French MoD payment delays are significantly resorbed)
Underlying assumptionsA 5%+ increase in global air traffic
A stabilization in original equipment commercial aviation business
A moderate growth in sales in aerospace services, back ended (H2 2010)
Strong and profitable growth for the Security business
On-going Safran+ plan to enhance profitability and reduce overheads

34Investors roadshow - September 2010
Aerospace equipment consolidation
Creating a global Tier 1 equipment manufacturer Global business model is moving towards fewer and stronger, more diversified equipment manufacturers (as demonstrated by the industry leaders GE, UTC, Honeywell, Goodrich, etc. as well as Zodiac Aerospace)
Broadening and diversifying the offering is a critical step on the path to sustainable growth and margins
Taking advantage of outstanding technologies fit will create breakthrough long term value on « more electrical aircraft »
Beyond costs synergies, scale & strategic fit provide revenue synergies Synergies are not limited to specific product overlap or industrial duplication
• Technical• Commercial• In service support and logistics
The merits of a combination are strong

35Investors roadshow - September 2010
Aerospace equipment consolidation
Beyond costs synergies, scale & strategic fit provide revenue synergies Commercial synergies: covering 75% of an aircraft value, providing access to top-level decision-makers, will allow to systematically secure a significant value share of new programs
Critical mass is required to develop and fund a fast growing services and after-sales global platform
High technological complementarities in electrical power, real-time calculators, de-icing, fuel and hydraulic systems
Costs synergies (to be jointly explored), similar as in any combination (support, purchasing, R&D, etc)
Any transaction would be value-enhancing to all stakeholdersWe are convinced by the strategic rationale of a combination
Any contemplated transaction would be financially attractive to all shareholders while preserving the financial flexibility of the combined entity

36Investors roadshow - September 2010
Safe harbor
Except for historical information, all other information in this presentation consists of forward-looking statements within the meaning of the US Private Securities Litigation Reform Act of 1995, as amended. These forward looking statements include statements regarding the future financial and operating results of Safran such as (i) expected revenue for full year 2010, (ii) expected profit from operations for the full year 2010 and iii) free cash flow for the full year 2010. Words such as "expects," "anticipates," "targets," "projects," "intends," plans," "believes," "estimates," variations of such words and similar expressions are intended to identify such forward-looking statements which are not statements of historical facts.These forward-looking statements are not guarantees of future performance and involve certain risks, uncertainties and assumptions that are difficult to assess. Therefore, actual outcomes and results may differ materially from what is expressed or forecasted in such forward-looking statements. These risks and uncertainties are based upon a number of important factors including, among others: our ability to operate effectively in a highly competitive industry with many participants; our ability to keep pace with technological advances and correctly identify and invest in the technologies that become commercially accepted; difficulties and delays in achieving synergies and cost savings; fluctuations in the aerospace market; exposure to the pricing pressures in the regions in which we sell; the pricing, cost and other risks inherent in long-term sales agreements; exposure to the credit risk of customers;reliance on a limited number of contract manufacturers to supply products we sell; the social, political and economic risks of our global operations; the costs and risks associated with pension and postretirement benefit obligations; the complexity of products sold; changes to existing regulations or technical standards; existing and future litigation; difficulties and costs in protecting intellectual property rights and exposure to infringement claims by others; compliance with environmental, health and safety laws; the economic situation in general (including exchange rate fluctuations) and uncertainties in Safran’s customers businesses in particular; customer demand for Safran’s products and services; control of costs and expenses; international growth; conditions and growth rates in the aerospace industry; and the impact of each of these factors on sales and income. For a more complete list and description of such risks and uncertainties, refer to Safran’s Document de Référence for the year ended December 31, 2008. Safran disclaims any intention or obligation to update any forward-looking statements after the distribution of this news release, whether as a result of new information, future events, developments, changes in assumptions or otherwise.
* Adjusted data
For forward looking statements

37Investors roadshow - September 2010

38Investors roadshow - September 2010
Safran
Additional Information

39Investors roadshow - September 2010
All figures in this presentation represent Adjusted data (see “Additional Information” for bridge with consolidated accounts)
Safran’s interim consolidated income statement has been adjusted for the impact of:
purchase price allocations with respect to material business combinations. Since 2005, this restatement concerns the amortization charged against intangible assets relating to aeronautical programs that were revalued at the time of the Sagem-Snecma merger. With effect from the first-half 2010 interim financial statements, the Group has decided to restate the impact of purchase price allocations for all material business combinations (and not only those relating to the Sagem-Snecma merger). In particular, this concerns the amortization of intangible assets recognized at the time of the acquisition, and amortized over extended periods, justified by the length of the Group's business cycles;
the mark-to-market of foreign currency derivatives, in order to better reflect the economic substance of the Group's overall foreign currency risk hedging strategy:
revenue net of purchases denominated in foreign currencies is measured using the effective hedging rate, i.e., including the costs of the hedging strategy,the recognition of all mark-to-market changes on non-settled hedging instruments at the closing date is neutralized, including the “ineffective” portion with effect from the publication of the 2009 financial statements, given that the Group's hedging strategy includes optional hedging instruments and optimization measures combined with highly volatile market inputs used to mark to market.
Recurring operating incomeIt excludes income and expenses which are largely unpredictable because of their unusual, infrequent and/or material nature such as: impairment losses/reversals, capital gains/losses on disposals of operations and other unusual and/or material non operational items).
ForewordDefinitions

40Investors roadshow - September 2010
H1 2009 restated income statement
77Share in profit from associates
341324Profit from operations
0.520.70EPS (in €)207-(79)-5281Net income – group share
(5)(5)Minority interests66Profit (loss) from discontinued op.
(59)-42-(2)(99)Income tax expense(83)-(121)(10)-48Net financial income (expense)
6.6%6.3%% of revenues
(6)(6)Other non-current charges/income
6.7%6.3%% of revenues3476-107324Recurring operating income
5,1495,149Revenue
(iv)(iii)(ii)(i)(in Euro million)
H1 2009 Restated
One off Items
HedgingPension Financial
Component
PPAH1 2009 Reported
Income Statement

41Investors roadshow - September 2010
Fx volatility
Increased Fx volatility during H1 2010
Translation effect: foreign currencies translated into €⇒ Strong positive impact AUD, BRL in H1, almost neutral from $⇒ Impact on Revenue and Return on Sales
Transaction effect: mismatch between $ sales and € costs is hedged⇒ Mild negative impact from $ ⇒ Slight positive impact from other currencies ($/CAD, $/GBP)⇒ Impact on Profits
Mark-to-market effect⇒ €(1.8)bn on fair value of financial instrument⇒ Impact on consolidated “statutory” accounts
Hedging management - continuing policy
Capturing better rates to optimize portfolio
Rolling 3-year hedging policy
Diverse impacts on P&L
Hedge rate
$ 1.45$ 1.43H1 2010H1 2009
Average spot rate
$ 1.33$ 1.33H1 2010H1 2009
Spot rate
$ 1.23$ 1.44June 30, 2010Dec 31, 2009
42Investors roadshow - September 2010
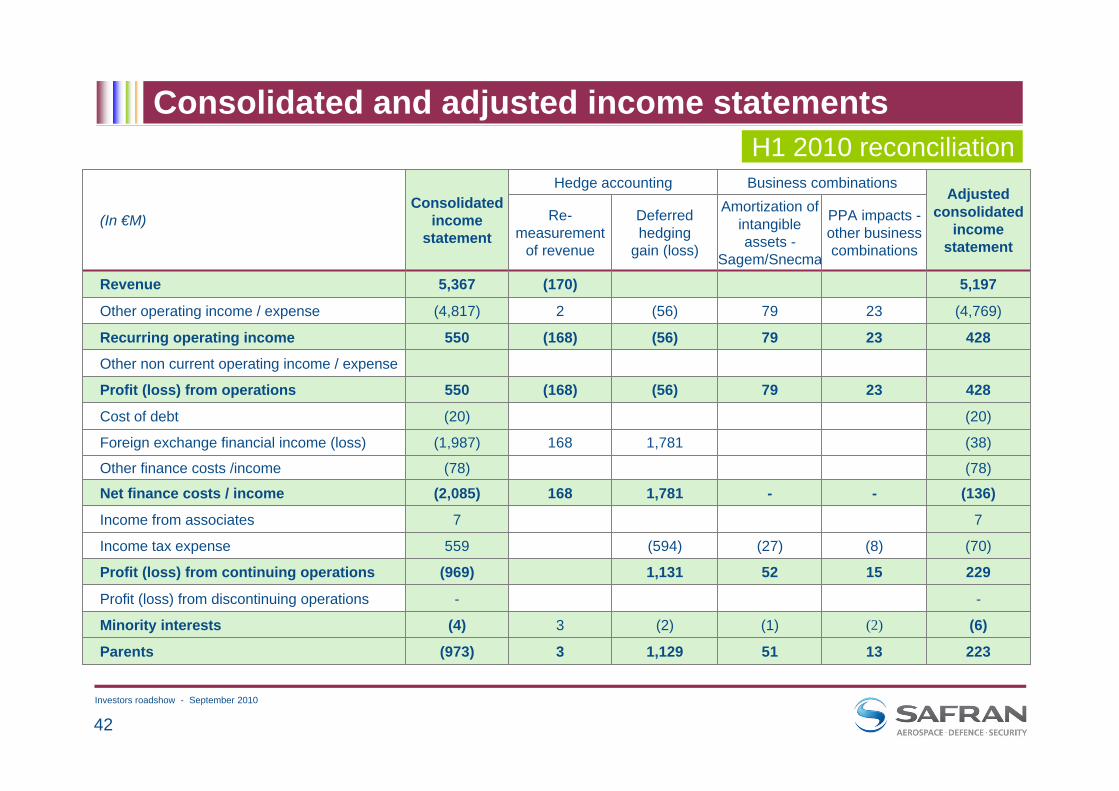
Consolidated and adjusted income statements
PPA impacts -other business combinations
Amortization of intangible assets -
Sagem/Snecma
51
(1)
52
(27)
-
79
79
79
42823(56)(168)550Recurring operating income
Other non current operating income / expense
223131,1293(973)Parents
(6)(2)(2)3(4)Minority interests
--Profit (loss) from discontinuing operations
229151,131(969)Profit (loss) from continuing operations
(70)(8)(594)559Income tax expense
77Income from associates
(136)-1,781168(2,085)Net finance costs / income(78)(78)Other finance costs /income
(38)1,781168(1,987)Foreign exchange financial income (loss)
(20)(20)Cost of debt
42823(56)(168)550Profit (loss) from operations
(4,769)23(56)2(4,817)Other operating income / expense
5,197(170)5,367Revenue
Deferred hedging
gain (loss)
Re-measurement
of revenue
Adjusted consolidated
income statement
Business combinationsHedge accountingConsolidated
income statement
(In €M)
H1 2010 reconciliation

43Investors roadshow - September 2010
Aerospace Propulsion
Stable revenue
Growth in services for military, helicopters & high trust engines
Strong deliveries in OE CFM and space engines
Offset by soft CFM aftermarket
Growing profits despite CFM aftermarket softness
Impact of better CFM volume/price
Aftermarket except CFM
Good cost control
R&D efficiency
Slight adverse currency effect
R&D: tailing off of SaM146 and TP400; increasing efforts on Leap-X and Silvercrest
4069Capex (tangible assets)
4236Capitalized expenses
90103Recorded as opex
4.8%5.0%% of revenue
132139Total self-funded R&Dbefore tax credit
H1 2010H1 2009(In €M)
-(6) One-off items
+1.5pt11.3%9.8%% of revenue
14.8%311271Recurring operating income
11.3%
311
2,763
H1 2010
(0.2)%
Change
(0.7)%2,769Revenue
9.6%% of revenue
265Profit (loss) from op.
Organic Change
H1 2009restated(In €M)
Key figures

44Investors roadshow - September 2010
Aircraft Equipment
Strong deliveries of large nacelles (A320, A330)
Impact of business and regional jets crisis on Equipment activities (small nacelles, wiring and landing systems)
Recovery plan delivering results
Sustained growth of services in landing systems, brakes and wheels
A 380 : lower volumes, improved production costs
B 787 : higher volumes, first benefits of new conditions (harnessing)
R&D: tailing off of B787; increasing efforts on A350
1944Capex (tangible assets)
2625Capitalized expenses
3840Recorded as opex
4.7%4.6%% of revenue
6465Total self-funded R&Dbefore tax credit
H1 2010H1 2009(In €M)
--One-off items
+1.6pt4.9%3.3%% of revenue
44.7%6847Recurring operating income
4.9%
68
1,374
H1 2010
(2.8)%
Change
(4.4)%1,413Revenue
3.3%% of revenue
47Profit (loss) from op.
Organic Change
H1 2009restated(In €M)
Key figures
45Investors roadshow - September 2010
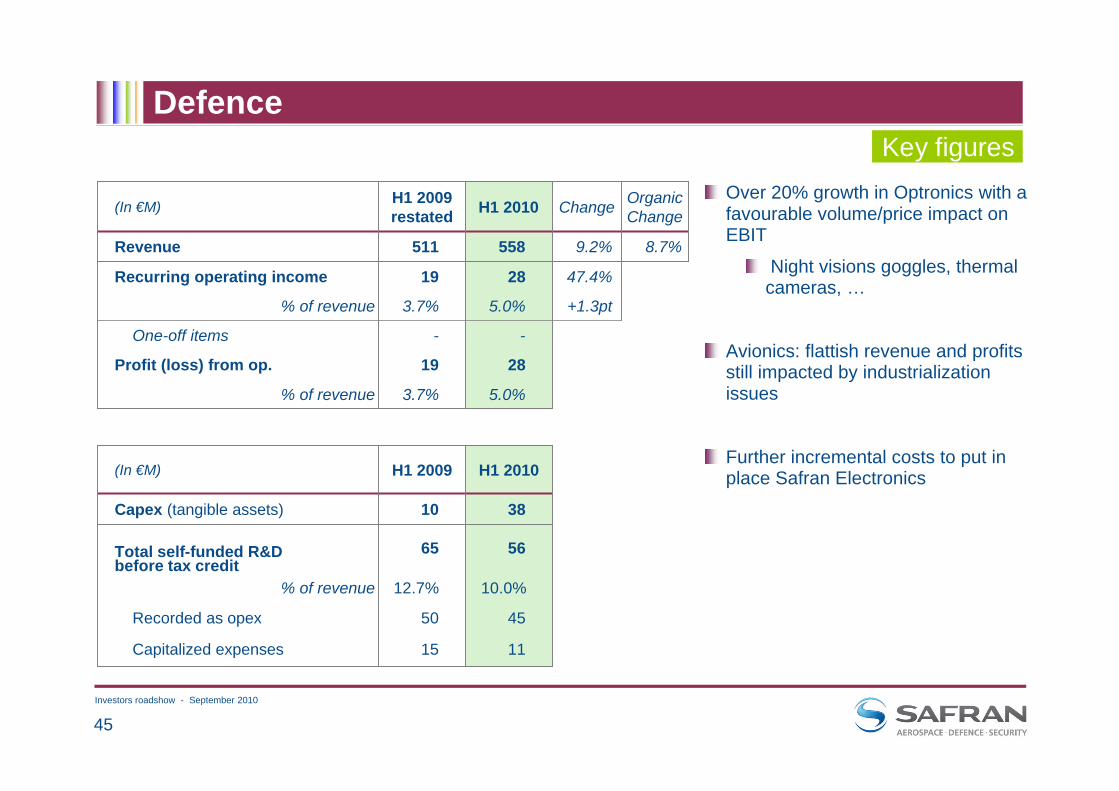
Defence
Over 20% growth in Optronics with a favourable volume/price impact on EBIT
Night visions goggles, thermal cameras, …
Avionics: flattish revenue and profits still impacted by industrialization issues
Further incremental costs to put in place Safran Electronics
3810Capex (tangible assets)
1115Capitalized expenses
4550Recorded as opex
10.0%12.7%% of revenue
5665Total self-funded R&Dbefore tax credit
H1 2010H1 2009(In €M)
--One-off items
+1.3pt5.0%3.7%% of revenue
47.4%2819Recurring operating income
5.0%
28
558
H1 2010
9.2%
Change
8.7%511Revenue
3.7%% of revenue
19Profit (loss) from op.
Organic Change
H1 2009restated(In €M)
Key figures

46Investors roadshow - September 2010
--One-off items
+3.5pts12.7%9.2%% of revenue
52.5%6140Recurring operating income
12.7%
61
479
H1 2010
10.4%
Change
(17.7)%434Revenue
9.2%% of revenue
40Profit (loss) from op.
Organic Change
H1 2009restated(In €M)
Security
Revenue and profit growth are acquisition-driven (Detection)
Negative organic growth (-17.7%)
ID solutions in emerging countries (Ivory Coast)
Stable organic profits
Improvements in Identification and smart cards offset by volume effect on Ivory Coast162Capex (tangible assets)
5-Capitalized expenses
3424Recorded as opex
8.1%5.5%% of revenue
3924Total self-funded R&Dbefore tax credit
H1 2010H1 2009(In €M)
Key figures
Note: PPA is now adjusted[€23M in H1 2010]

47Investors roadshow - September 2010
Customer financial guarantees
69110Provisions
75117Net exposure on these guarantees
94120Estimated value of pledges
169237Total guarantees
June 30, 2010
Dec. 31,2009(In $M)
Reduced level of total guarantees
Marginal Safran outstanding risk on Aircraft financing, representing less than 2% of Safran revenue on an annual basis
Reduced level of total guarantees reflecting a low participation of manufacturer financial support despite the proximity of the 2008/2009 bank crisis
Outstanding risk of the portfolio covered by the conservative estimated value of the assets securing the financing and the provisions booked in Safran account

48Investors roadshow - September 2010
H1 2007-2010 Security revenue
0
50
100
150
200
250
300
350
400
450
500
H1 2007 H1 2008 H1 2009 H1 2010
Revenue from acquisitions (Printrak, GE HLP)Restated revenue at 2008 perimeter (excluding Monetel activity) and excluding contract in Ivory Coast
Average organic growth of c.25% per annum
2008 perimeter: excluding Monetel business, excluding Printrak & GE HLP acquisitions, and including SDU-I
Excluding revenue from Identification governmental contract in Ivory Coast

49Investors roadshow - September 2010
* Source : UBS
Aerospace
93%
7%
1st CFM56 generation (-2, -3, -5A, -5C)
Dec 31, 2009468 aircraft
2nd CFM56 generation (-5B, -7)
91%
9%
June 30, 2010400 aircraft
Number of grounded planes powered by CFM56 engines Grounded CFM-equipped aircraft
represent 4% of the total CFM fleet
vs. 12% for the total active aircraft market*
A majority of B737NG returned to traffic
68 CFM56 powered aircraft returned to service in H1 2010