sentinel-1 for observing forests in the tropics - soft
TRANSCRIPT

SOFT Final Report
Ref.: SOFT_FR_202104_v2.0
Issue: 1.0
Date: 22.04.2021
Page : 1 of 38
Sentinel-1 for Observing Forests in the Tropics - SOFT Final Report - April 2021
Project Name Sentinel-1 for Observing Forests in the Tropics - SOFT
Contract Number 4000129739/20/I-DT EO Science for Society EOEP-5 Block-4
Issue Date 22.04.2021
Version 2.0
Author S. Mermoz, T. Le Toan, A. Bouvet
Document Reference SOFT_FR_202104_v2.0
Document Type External
SOFT Final Report
Ref.: SOFT_FR_202104_v2.0
Issue: 1.0
Date: 22.04.2021
Page : 2 of 38
THIS PAGE IS INTENTIONALLY LEFT BLANK

SOFT Final Report
Ref.: SOFT_FR_202104_v2.0
Issue: 1.0
Date: 22.04.2021
Page : 3 of 38
Table of Contents
1 Introduction ................................................................................................................................7
1.1 Purpose of the document ....................................................................................................7
1.2 Executive Summary Report ..................................................................................................7
1.3 Context................................................................................................................................8
1.4 Background ....................................................................................................................... 10
2 Work to be performed .............................................................................................................. 12
2.1 Scientific and technical objectives ...................................................................................... 12
2.2 Work packages .................................................................................................................. 12
2.2.1 WP 100: Management ............................................................................................... 12
2.2.2 WP 200: Algorithm development ............................................................................... 13
2.2.3 WP 300: Large scale mapping ..................................................................................... 13
2.2.4 WP 400: Validation .................................................................................................... 14
3 Activities performed and results: WP 100 .................................................................................. 14
4 Activities performed and results: WP 200 .................................................................................. 15
4.1 Selection of the forest loss detection method .................................................................... 15
4.2 Forest definitions............................................................................................................... 16
4.3 Sites selection for the PoC ................................................................................................. 16
4.4 Reference data selection for the PoC ................................................................................. 18
4.5 Ancillary data selection ...................................................................................................... 20
4.6 Analysis results in the frame of the PoC ............................................................................. 22
4.7 Map resulting from the PoC ............................................................................................... 25
5 Activities performed and results: WP 300 .................................................................................. 28
6 Activities performed and results: WP 400 .................................................................................. 34
7 References ................................................................................................................................ 37
SOFT Final Report
Ref.: SOFT_FR_202104_v2.0
Issue: 1.0
Date: 22.04.2021
Page : 4 of 38
List of figures
Figure 1. Study sites used in the proof-of-concept development. Reference data (forest loss in red and intact
forest in green) were selected in the tiles in white and are described in section 4.4. _____________________ 18
Figure 2. Distribution of the forest loss and intact forest reference plots surface area. ___________________ 19
Figure 3. Distribution of the terrain slope values over the forest loss and intact forest reference plots. ______ 20
Figure 4. Tree canopy cover 2017 and primary forest extent at 30 m pixel size from Potapov et al. (2019) ___ 21
Figure 5. Comparison between the tree cover maps from Hansen et al. (2013) and Potapov et al. (2019). The
map from Hansen is particularly affected by the failure of the Landsat -7 Scan Line Corrector in the Enhanced
Thematic Mapper Plus (ETM+) instrument. ____________________________________________________ 22
Figure 6. Backscatter γ0VV and radar change ratio (RCR) time series from October 2017 to end of 2019 for the
tiles 48PWV, 48PYA and 48QXD. Precip means precipitations.______________________________________ 23
Figure 7. Probability density function (PDF) and cumulative PDF of the min(RCR) indicator at VV and VH
polarization for reference data over the tile 48PVV in ascending (ASC) and descending (DES) modes. The term
«shadows» means that 25% of the pixels of each plot with the lowest min(RCR) values were used to draw the
PDF. ___________________________________________________________________________________ 24
Figure 8. Forest loss detection results over the tiles selected in the frame of the PoC. Forest areas from Potapov
et al. (2019) are in dark green and the background image is from Google Earth. The indicated numbers
correspond to specific areas presented in Figure 9. ______________________________________________ 26
Figure 9. Visual comparison of forest loss detection results, highlighting the various sizes and distributions of
disturbed areas. Intact forest and forest loss reference data are drawn in green and red respectively. Forest
areas from Potapov et al. (2019) are in dark green and the background image is from Google Earth. _______ 27
Figure 10. Number and distribution of Sentinel-1 frames in ascending and descending modes over Vietnam,
Cambodia and Laos. ______________________________________________________________________ 28
Figure 11. Forest disturbances map using Sentinel-1 data in Vietnam, Laos and Cambodia from the end of 2017
to the beginning of 2021. __________________________________________________________________ 30
Figure 12. Forest disturbances map using Sentinel-1 data at the border between Laos and Vietnam, from the
end of 2017 to the beginning of 2021. The background image is from Google Earth. The map evidences high
forest losses currently happening in Northern Laos versus low forest losses in Northern Vietnam. __________ 31
Figure 13. Visual comparison of forest loss detection results, highlighting the various sizes and distributions of
disturbed areas. Forest areas from Potapov et al. (2019) are in dark green and the background image is from
Google Earth. ___________________________________________________________________________ 32
Figure 14. Visual comparison between the forest disturbances maps from this study (Left) and from Global
Forest Watch (Right). The two areas are centred on 102.75°N and 20.48°E in Laos (Up) and 107.21°N and
16.61°E in Vietnam (Bottom). The background image is from Google Earth. ___________________________ 34
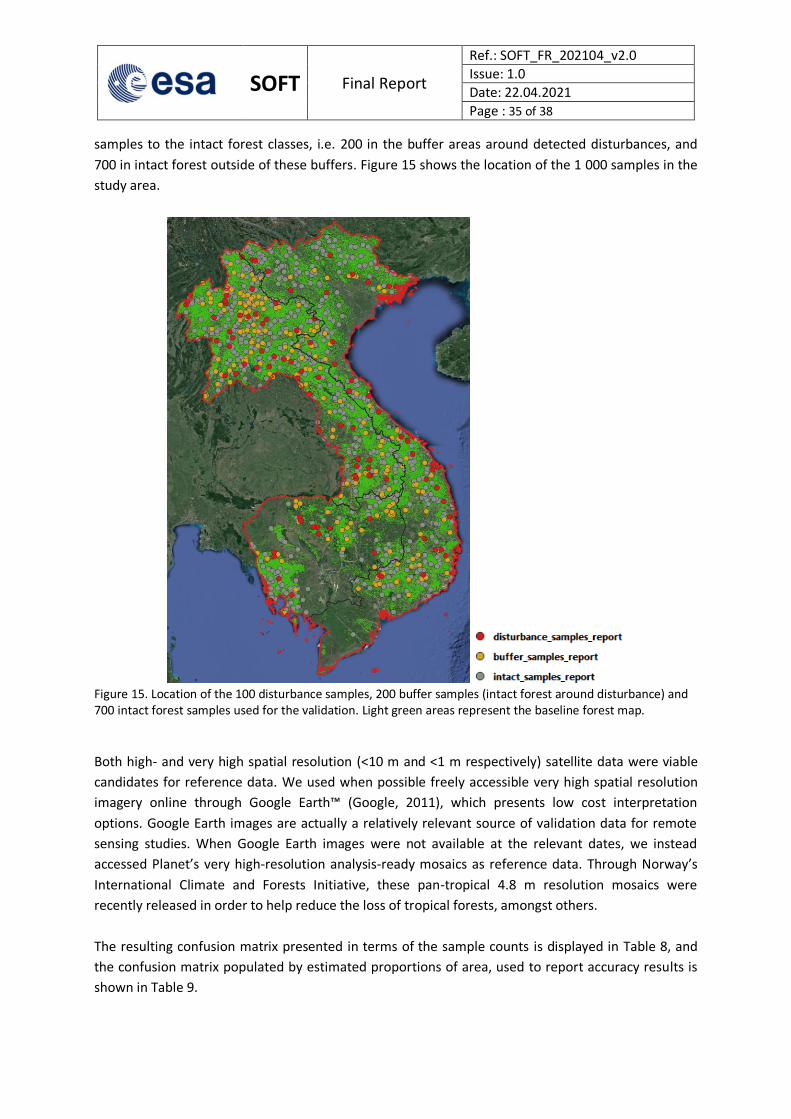
Figure 15. Location of the 100 disturbance samples, 200 buffer samples (intact forest around disturbance) and
700 intact forest samples used for the validation. Light green areas represent the baseline forest map. _____ 35

SOFT Final Report
Ref.: SOFT_FR_202104_v2.0
Issue: 1.0
Date: 22.04.2021
Page : 5 of 38
List of tables
Table 1. Forest area in 1990, 2000, 2010 and 2020, forest area proportion in 2020 and primary forest proportion
in 2020 in Vietnam, Cambodia and Laos according to FAO (2020). ___________________________________ 9
Table 2. Main characterictics of the selected tile in the frame of the WP 200, i.e. country in which the tile is
located, forest proportion in 2017 relative to the entire tile without taking into account permanent water,
proportion of forest loss from 2000 to 2017 relative to the entire tile without taking into account permanent
water and mean slope value over areas with tree cover higher than 50% in 2017. ______________________ 17
Table 3. Numbers and sizes of the reference polygons constituting the training and testing database for forest
loss assessment. _________________________________________________________________________ 19
Table 4. Summary of ancillary data___________________________________________________________ 20
Table 5. Assessment of indicators describing the separability of forest loss and intact forest reference data over
the tile 48PVV with two scenarii : scenario s1 that is a trade-off between low false alarms rate and accurate
forest loss detection and scenario s2 corresponding to the most accurate map in term of producer and user
accuracy. The ranges of values for each indicator of scenario 2 are associated with the best 10 E[TDFL ,TDIF]-
s2 values. The terms nb FL and nb IF refer to the number of pixels from the forest loss and intact forest reference
dataset that were used for computing the indicators. The true positive detection TD is defined as true positive
samples divided by the sum of true positive and false negative samples for a given min(RCR) threshold. The term
all means that all available reference data were used, whereas the term shad means that 25% of the pixels of
each plot with the lowest min(RCR) values were used. ____________________________________________ 25
Table 6. Assessment (pixel counting) of the forest loss detection method accuracy for the tile 49PBS (left) and
48PZC (right). Columns show the forest loss (FL) and intact forest (IF) as determined by the detection method,
whereas rows indicate the reference data. PA, UA and OA are in % and stand for producer, user and overall
acuracy, k stands for kappa index. ___________________________________________________________ 28
Table 7. Surface areas per year and country in hectare, from this study, Global Forest Watch (Hansen et al.,
2013) and GLAD (Hansen et al., 2016). ________________________________________________________ 33
Table 8. Error matrix of sample counts ________________________________________________________ 36
Table 9. Error matrix in Table 8 populated by estimated proportions of area, used to report accuracy results _ 36

SOFT Final Report
Ref.: SOFT_FR_202104_v2.0
Issue: 1.0
Date: 22.04.2021
Page : 6 of 38
List of acronyms
AIL Action Item List
ARD Analysis Ready Data
ATBD Algorithm Theoretical Basis Document
C3S Copernicus Climate Change Service
CEOS Committee on Earth Observation satellites
CESBIO Centre d’Etudes Spatiales de la Biosphère
CNES Centre National d’Etudes Spatiales
DBH Diameter at breast height
EO Earth Observation
ESA European Space Agency
FAO Food and Agriculture Organisation
FREL Forest reference emission level
GEDI Global Ecosystem Dynamics Investigation
GFW Global Forest Watch
GLAD Global Land Analysis and Discovery
GlobEO Global Earth Observation
GSMaP Global Satellite Mapping of Precipitations
HPC High performance computing
IDEAM Instituto de Hidrología, Meteorología y Estudios Ambientales
INPE Instituto Nacional de Pesquisas Espaciais
JAXA Japan Aerospace Exploration Agency
JICA Japan International Cooperation Agency
MINAM Ministerio del Ambiente
MGRS Military grid reference system
NRT Near real-time
PDF Probability density function
PNCB Programa Nacional de Conservación de Bosques
PoC Proof of concept
RCR Radar change ratio
RADD Radar for Detecting Deforestation
REDD+ Reducing emissions from deforestation and forest degradation
SAD Deforestation Alert System
SAR Synthetic Aperture Radar
SOFT Sentinel-1 for Observing Forests in the Tropics
TD True positive detection
UMD University of Maryland
UNFCCC United Nations Framework Convention on Climate Change
VHR Very high resolution
WP Work package
WWF World Wide Fund for Nature

SOFT Final Report
Ref.: SOFT_FR_202104_v2.0
Issue: 1.0
Date: 22.04.2021
Page : 7 of 38
1 INTRODUCTION
1.1 Purpose of the document
The final report aims at fully describing the work done in the frame of the SOFT project, including
the description of the programme of work, the activities performed and the main results. It provides
a complete description of all the work done during the activity and covers the whole scope of the
activity.
1.2 Executive Summary Report
The world’s forests have undergone substantial changes in the last decades. Deforestation and forest
degradation in particular, contribute greatly to these changes. In certain regions and countries, the
changes have been more rapid, which is the case in the Greater Mekong sub-region recognized as
deforestation hotspot. Effective tools are thus urgently needed to survey Illegal logging operations
which cause widespread concern in the region.
Several research and government organizations have developed systems that provide regular
updates to the public, principally based on satellite data. However, most monitoring approaches rely
predominantly on optical remote sensing. Nevertheless, a major limitation for optical-based near real
time applications is the presence of haze in the dry season (caused by fire) and, more importantly, of
clouds persistent in the tropics during the wet season. Cloud cover free SAR images have great
potential in tropical areas, but have rarely been used for forest loss monitoring compared to optical
imagery. Yet, the dense time series of the Sentinel-1 constellation offer a unique opportunity to
systematically monitor forests at the global scale. In addition, it has been recently demonstrated that
forest losses can be monitored using Sentinel-1 dense time series based on reliable indicators that
bypass environmental effects on SAR signals.
In this context, the primary science objective of the SOFT project is to provide near real time forest
loss maps over Vietnam, Cambodia and Laos using Sentinel-1 data to the users of public sectors to
support their efforts to control logging and log trade.
SAR-based Algorithms of forest loss detection were first adapted and tested over eleven test sites in
the frame of the proof-of-concept (PoC) development. The forest loss detection method from Bouvet
et al. (2018) was considered as the best potential candidate algorithms for the reasons detailed in
the Final Report. Regarding the Sentinel-1 data processing, we used the pre-processing chain
developed at CESBIO and CNES as an operational tool for Sentinel-1 GRD data processing. The chain
is based on open source libraries and can be used freely. We selected an adapted forest definitions,
selected the test sites and reference data for the PoC, which covered various landscapes and terrain
slopes. We also selected relevant ancillary data such as a forest mask, the quality of which has a big
impact on the final forest loss detection results. Using these dataset, we deeply analyzed the
Sentinel-1 backscatter signal over forest loss and intact forest areas of Vietnam, Cambodia and Laos,
which was needed to adapt the forest loss detection method. The quality of maps resulting from the
PoC was analysed and assessed qualitatively and quantitatively.

SOFT Final Report
Ref.: SOFT_FR_202104_v2.0
Issue: 1.0
Date: 22.04.2021
Page : 8 of 38
The results of the PoC were extended to the whole Vietnam, Laos and Cambodia for the years 2018
to 2020. We optimized, installed and ran the scripts (in Python) onto the high performance
computing (HPC) cluster of the CNES. Then, the processing of the whole study area has been
achieved. We mosaicked the resulting maps, checked their quality and manually corrected outliers.
This led to the final map which is the main outcome of the SOFT project. The map provides clear
hints of the spatial and temporal distribution of forest losses. For example, the difference between
high forest losses currently happening in Northern Laos versus low forest losses in Northern Vietnam
is clearly seen, although the whole Northern mountainous region is covered by similar forest types.
We also compared the forest loss surface areas obtained from our method with the results from
GFW and GLAD. Although we do not consider the maps of GFW and GLAD as a benchmark and
although the use of Sentinel-1 is basically much more relevant in term of timely detection of forest
losses, we quantitatively compared the statistics per year and country and qualitatively compared
both maps. The results from this study and from GFW are remarkably similar, the largest difference
(23%) being found for Laos in 2019. This result highlights the fact that our detection system can be
used as an alert system (fast detection from sentinel-1 data) and as an annual detection system
similar to GFW, used for example to compute national statistics.
The final map was thoroughly validated following the recommandations from Olofsson (2014 and
2020). We chose as sampling design a stratification with stratas defined by the map classes, mainly to
improve the precision of the accuracy and area estimates. We specified a target standard error for
overall accuracy of 0.01 and supposed that user's accuracies of the change class is 0.70 for forest
disturbances and 0.90 for intact forest. The resulting sample size was therefore n=803 in total, which
we have rounded up to 1 000 samples. We then assessed the allocation of the sample to strata so
that the sample size allocation results in precise estimates of accuracy and area. We followed
Olofsson’s recommendations and allocated a sample size of 100 for the forest disturbance stratum,
and then allocated the remainder of the samples to the intact forest classes, i.e. 200 in the buffer
areas around detected disturbances, and 700 in intact forest outside of these buffers. We used when
possible freely accessible very high spatial resolution imagery online through Google Earth™, which
presents low cost interpretation options. When Google Earth images were not available at the
relevant dates, we instead accessed Planet’s very high-resolution analysis-ready mosaics as reference
data. We then calculated the resulting confusion matrix presented in terms of the sample counts and
the confusion matrix populated by estimated proportions of area, used to report accuracy results.
The estimated user's accuracy (±95% confidence interval) is 0.95 for forest disturbances and 0.99 for
intact forest (including buffer areas around disturbance) and the estimated producer's accuracy is
0.90 for forest disturbances and 0.99 for intact forest. Finally, a quality assessment was performed by
comparing the final map to existing optical-based products. The estimated area of 2018 and 2019
deforestation according to the reference data was 23 437 ± 2 140 km².
1.3 Context
Over the last 25 years, the world’s forests have undergone substantial changes. Deforestation and
forest degradation in particular contribute greatly to biodiversity loss through habitat destruction,
soil erosion, terrestrial water cycle disturbances and anthropogenic CO2 emissions. Regarding the

SOFT Final Report
Ref.: SOFT_FR_202104_v2.0
Issue: 1.0
Date: 22.04.2021
Page : 9 of 38
latter, deforestation and forest degradation accounted for 77% and 13%, respectively, of the total
net flux attributable to land use and land cover changes over the period from 1850 to 2015
(estimated to have been 145 ± 16 PgC globally with 102 ± 5.8 PgC in the tropics, according to
Houghton and Nassikas, 2017).
In certain regions and countries, the changes have been more rapid, which is the case in the Greater
Mekong sub-region recognized as deforestation hotspot, where forest loss from 2009 to 2030 is
projected to reach 17% to 34% of the total forest area (15 to 30 million ha) (WWF, 2013). In this
region, illegal and unsustainable logging and conversion of forests for agriculture, construction of
dams and infrastructure are the direct causes of deforestation and biodiversity loss driven by
population growth, increasing market demand, and policies that promote short-term economic
growth. Commercial logging and log exports are regulated by governments in all Greater Mekong
sub-region countries. However, higher demand and weak law enforcement have hindered efforts to
control logging and the log trade. Effective tools are thus urgently needed to survey Illegal logging
operations which cause widespread concern in the region.
Vietnam is among the countries with the greatest annual changes in primary forest area and planted
forest area in the last 20 years. According to the FAO, the extent of primary forest in Vietnam
decreased at rates of 6.94%, 15.6% and 1.21% in 1990 to 2000, 2000 to 2005 and 2005 to 2010,
respectively. In 2020, the proportion of primary forets area reaches 0.5% of the total surface area
(Table 1). Meanwhile, the extent of planted trees increased with values of 0.75 Mha in 1990, 1.92
Mha in 2000 and 3.08 Mha in 2010. The FAO currently considers Vietnam to be a reforesting country
because tree plantations are included as forests in the FRA process, as shown by the forest area
temporal evolution from 1990 to 2020 in Table 1. On the contrary, the amount of forest in Cambodia
dropped from approximately 11 Mha to 8 Mha between 1990 and 2020. Laos as well experiences a
constant decline of its forest surface.
Table 1. Forest area in 1990, 2000, 2010 and 2020, forest area proportion in 2020 and primary forest proportion in 2020 in Vietnam, Cambodia and Laos according to FAO (2020).
Vietnam Cambodia Laos
Forest area 1990 (ha x 103) 9 376 11 005 17 843
Forest area 2000 (ha x 103) 11 784 10 781 17 425
Forest area 2010 (ha x 103) 13 388 10 589 16 940
Forest area 2020 (ha x 103) 14 643 8 068 16 595
Forest area % of land area 2020 47.2 45.7 71.9
Primary forest % of forest area 2020 0.5 4 -
A remote sensing based near real-time (NRT) forest monitoring system with dedicated user needs
assessment is adapted to combat deforestation, providing information on newly deforested areas in
vast and sometimes inaccessible forests. These systems play a valuable role to :

SOFT Final Report
Ref.: SOFT_FR_202104_v2.0
Issue: 1.0
Date: 22.04.2021
Page : 10 of 38
Provide early detections of illegal forest loss. System alerts developed in countries like Brazil
and Peru have been critical to increasing the capacities of law enforcement and land
management agencies in reducing illegal deforestation.
The detection of active forest loss (hotspots) is important for reducing emissions from
deforestation and forest degradation (REDD+) implementation when tracking forest area
change that requires immediate response or interventions, although early losses detection is
not required in international forest conservation agreements such as REDD+,
Support national statistical reporting programs,
Complement a current annual global forest cover loss product, implemented in collaboration
with Google and World Resources Institute as part of Global Forest Watch (GFW - Hansen et
al., 2013). The annual product is based on a calendar year update, first prototyped using
Landsat data from 2000.
At the regional scale, early warning system would help Vietnam to integrate a number of on-going
Committee on Earth Observation satellites (CEOS) activities and data in support of forest monitoring
for the Mekong Delta region.
1.4 Background
Several research and government organizations have developed systems that provide regular
updates to the public, principally based on optical remote sensing data. With a coarse spatial
resolution (MODIS data, 250m), the FORMA (Wheeler et al., 2014), Terra-I (Reymondin et al., 2012)
and IDEAM systems are developed at the pantropical scale (except IDEAM covering only Colombia)
and are respectively available biweekly, monthly and quarterly. DETER-B (Diniz et al., 2015), a
Brazilian operational system, provides results with a 60 m spatial resolution and a 5-day frequency. It
is developed by the Instituto Nacional de Pesquisas Espaciais (INPE), based on AWiFS data and
including a photointerpretation step. Most recently, the Brazilian SAD (Deforestation Alert System;
civil society) alerts were further innovated by incorporating Sentinel imagery, both optical and radar.
Finally, with the medium resolution of 30 m Landsat data, the MINAM (Peru) and the University of
Maryland (UMD) produce forest alerts dataset every week: PNCB Early Warning Alerts, and Global
Land Analysis and Discovery (GLAD) forest alerts (Hansen et al., 2016) respectively.
A NRT forest loss monitoring protocol starts with forest losses detection as precisely and quickly as
possible. That’s why medium-resolution Landsat and Sentinel-based alerts have replaced coarse-
resolution (MODIS)-based alerts as the standard. Thereby, the detection of large areas (> 3 ha) is now
well controlled globally. In less than a decade, sensing capability for automated forest-loss alerts has
improved resolution from 1 km to 10 m. Such operational forest alerts systems should allow states or
forest managers to fight against drivers of deforestation, which are generally linked to illegal
activities. They can also be used for protected areas management, community forest monitoring,
management of agricultural and other productive concessions and raising awareness (Finer et al.,
2018).
However, most monitoring approaches rely predominantly on optical remote sensing, due to the
opening of the Landsat archive in 2008 together with the availability of easily downloadable fully

SOFT Final Report
Ref.: SOFT_FR_202104_v2.0
Issue: 1.0
Date: 22.04.2021
Page : 11 of 38
processed images. Hansen et al. (2016) demonstrated the potential and constraints of operational
Landsat based forest loss alerts for the humid tropics. Nevertheless, a major limitation for optical-
based NRT applications is the presence of haze in the dry season (caused by fire) and, more
importantly, of clouds persistent in the tropics during the wet season. In fact, clouds during the wet
season may cause important temporal detection delays, which contradicts the need for fast forest
loss alerts. In French Guiana for instance, Ballère et al. (2021) found a median temporal delay of 143
days (more than 4.5 months) using the GLAD optical-based system for year-round activities such as
gold mining. And some countries like Vietnam suffer from pervasive cloud cover throughout a large
part of the year.
Cloud cover free Synthetic Aperture Radar (SAR) images have great potential in tropical areas, but
have rarely been used for forest loss monitoring compared to optical imagery (for notable
exceptions, refer to Mermoz and Le Toan, 2016; Lohberger et al., 2018; Reiche et al., 2021), partly
because of the scarce data availability until the Sentinel-1 program (Reiche et al., 2016). An exception
is the JJ-FAST system developed by the JAXA/JICA, based on ALOS-2 radar data that produce forest
loss alerts over 77 tropical countries every 1.5 months with a spatial resolution of 5 ha (Watanabe et
al., 2017).
The dense time series of the Sentinel-1 constellation offer a unique opportunity to systematically
monitor forests at the global scale. Since the launch of Sentinel-1 in 2014, SAR images are now easily
accessible with systematic acquisitions at a 5x20 m spatial resolution and a 6- to 12 days revisit time
(depending on the location) in all weather conditions. Although the C-band frequency of the Sentinel-
1 SAR system is less adapted for forest loss detection than the longer wavelengths (because it may
lead to confusion between the intact forest and deforested area due to the backscatter variability of
deforested area having a diversity of surface conditions), large-scale forest disturbances maps have
emerged very recently, mostly during the SOFT project. Two notable examples are detailed below :
- Doblas et al. (2020) used Google Earth Engine to extract some 8 million samples of Sentinel-1
backscatter data over the Brazilian Amazon, and then tested two different approaches to
deforestation detection (adaptive linear thresholding and maximum likelihood classification).
The results were evaluated, reaching more than 95% of global accuracy. This research has
backed the creation of a fully-automated, cloud-based deforestation detection system, which
is actually running at INPE’s servers.
- Reiche et al. (2021) released a new forest disturbances alerts detection system based on
Sentinel-1 data (RADD). The detection system was built on prior developments and
publications (e.g. Reiche et al., 2018). The user's and producer's accuracies of confirmed
disturbance alerts were 97.6% and 95.0%, respectively, suggesting confident detection of
forest disturbances larger than or equal to 0.2 ha. When including samples representing
disturbance events <0.2 ha, the producer's accuracy was 83.5%. Note that validation was
performed using probability sampling with three strata and a total of 1100 sample points.
This work represents a step forward because of the large study area (Congo Basin and insular
South-East Asia so far) and because the map is available via the GFW platform.

SOFT Final Report
Ref.: SOFT_FR_202104_v2.0
Issue: 1.0
Date: 22.04.2021
Page : 12 of 38
It has been therefore demonstrated that forest losses can be monitored using Sentinel-1 dense time
series based on reliable indicators that bypass environmental effects on SAR signals. These methods
have been successfully applied at the local/regional scale and are now being adapted at the pan-
tropical scale.
2 WORK TO BE PERFORMED
This section details the work to be performed in the frame of the SOFT project, including the
description of the work packages (WP).
2.1 Scientific and technical objectives
As detailed in the proposal of the SOFT project, the primary science objective is to provide NRT forest
loss maps over Vietnam, Cambodia and Laos using Sentinel-1 data to the users of public sectors to
support their efforts to control logging and log trade.
The major technical objective is to build on methods developed for mapping forest loss from
Sentinel-1 data, identify the weaknesses in these methods when applied in various conditions and
where possible address these issues and adapt the methods to apply them at the country scale. The
quality of the maps are verified so that they can be used with confidence.
GlobEO and CESBIO had to implement and demonstrate forest monitoring capabilities exploiting to
the maximal extent the two Sentinel-1A and 1B platforms. Optical sensors such as Sentinel-2 were
not considered because of the frequent cloud cover in these tropical regions. The demonstration
covered the following types of applications and scope:
- The regional demonstration covers relevant areas in Vietnam, Cambodia and Laos.
- The temporal coverage of the demonstration ranges from January 2018 to January 2021.
- The demonstration is performed in a NRT scenario.
- Maps are thoroughly validated based on reference data obtained from in situ observations and
mainly from very high resolution (VHR) optical images.
- The system has to operate efficiently in a cloud computing environment, e.g. access the EO input
data in an efficient and dynamic manner. Code optimization is performed to be able to manage the
large quantities of data mandatory for the application.
2.2 Work packages
2.2.1 WP 100: Management
This work package lasted from the beginning of the project. As a reminder, the objectives of the WP
were to carry out an effective management of the project and coordinate and control all the work
done within the consortium. The tasks are:
- WP 110 Project management and reporting
Organise, monitor and control all project activities and ensure the overall integrity of all WPs

SOFT Final Report
Ref.: SOFT_FR_202104_v2.0
Issue: 1.0
Date: 22.04.2021
Page : 13 of 38
Report on the progress of the work on a regular basis to the ESA Technical Officer by
providing monthly review reports to the Agency,
Provide meeting agendas to the Agency, at least 1 week prior to each progress meeting
(done by teleconference) and 2 weeks prior to each project review (i.e. Kick-Off, Final
Review);
Write the minutes of all progress meetings and project reviews
Maintain an up to date Action Items List (AIL)
Take all steps necessary to maintain the schedule. In case of departure from schedule, the
project manager shall notify immediately the ESA Technical Officer and propose corrective
actions to recover all scheduling over-run;
Check and review all project deliverables for quality and completeness before delivery.
Coordinate the participation of the end-user organisations to the project.
- WP120 Dissemination
Promote and disseminate the results of the project.
2.2.2 WP 200: Algorithm development
This work package lasted during the first 6 months of the project from March to September 2020.
The objectives of the WP were to develop, select and adapt SAR-based algorithms of forest loss
detection. The tasks are:
- WP 210 Technical and scientific engineering
Review of state-of-the-art in SAR-based forest loss detection and selection of candidate
algorithms.
Test the retained algorithms over a set of 5-10 test sites representative of the variety of
configurations (type of forest loss, availability of Sentinel-1).
- WP 220 Proof-of-Concept development
Converge towards a unique algorithm, or a set of algorithms with application rules, which
provide satisfying results over the 5-10 test sites.
2.2.3 WP 300: Large scale mapping
The objectives of this WP were to upscale the results from the PoC to extend it at the regional scale
(Vietnam, Cambodia, Laos), and to produce the final forest loss maps. WP 300 started 2 months after
the kick-off and lasted until the end of the project. The tasks are:
- WP 310 Demonstrator implementation

SOFT Final Report
Ref.: SOFT_FR_202104_v2.0
Issue: 1.0
Date: 22.04.2021
Page : 14 of 38
Implement the algorithms in a cloud-computing environment
Produce forest loss maps at a monthly time scale
- WP 320 Consistency assessment
Check the reliability of the large-scale implementation of the algorithms with respect to the
PoC
Check the consistency of the results at the regional scale
2.2.4 WP 400: Validation
The objectives of the WP were to carry out a thorough validation of the produced maps. This WP
started in October 2020 until the end of the project. The tasks are:
- WP 410 Demonstrator campaign and analysis
Collect reference data mainly from very high resolution optical images.
Carry out a field campaign in Vietnam to collect reference data with Vietnamese partners
and analyse the results of the demonstration campaign.
- WP 420 Accuracy assessment
Accuracy assessment following Olofsson et al. (2014,2020), with reference data from the
field and from VHR optical imagery.
3 ACTIVITIES PERFORMED AND RESULTS: WP 100
Project management was smooth, which was facilitated by the small number of partners in the
project. Discussions were almost daily and usually related on work planning, technical matters, and
human resource recruitment. All project activities were organised and controled to ensure the
successful completion of the project.
Reporting consisted in gathering and synthetizing the advancements and results, and writing and
delivering to ESA the monthly review reports, the ATBD, the mid-term review report (MTRR), the
validation report, the final report and the executive summary report (ESR).
All planned activities were achieved with the following deviations that were reported and detailed in
the monthly reports :
- Negative effects of Covid-19 on the project
The exceptional health situation that started exactly at the beginning of the project has had
an impact on the WP 410. No field campaign in Vietnam could be carried out to collect
reference data together with Vietnamese partners, because of the travel ban. Our
Vietnamese partners were unable to organize any field campaign in 2020. We discussed the
possibility to use field data already acquired in 2018 and 2019, but the sampling design was
not adapted to our study (very small areas covered compared with our study area, small
number of field dat etc.). We finally successfully validated the forest loss maps using VHR
optical data.

SOFT Final Report
Ref.: SOFT_FR_202104_v2.0
Issue: 1.0
Date: 22.04.2021
Page : 15 of 38
France was confined from March 17, 2020 to May 11, 2020 and from October 30, 2020 to
December 15, 2020, which made recruiting complicated especially at the beginning of the
project. Meanwhile, the contract of Alexandre Bouvet at CESBIO could be renewed from July
2020 to work on the SOFT project.
- Delivery of the forest disturbances maps
The maps are being delivered in April 2021, instead of December 2020 due to the processing
duration of the data.
Regarding dissemination, a paper summarizing the main results of the projects will be submitted to a
scientific journal with peer-review process before July 2021. A review paper gathering the work
achieved on forest loss detection using SAR data is also in preparation.
The particular context related to the Covid19 led to the cancelation of numerous workshops and
conferences, including Forestsat 2020 that should have taken place in Krakow, Poland, for which it
was basically planned to submit a contribution on the SOFT project. Nevertheless, numerous events
are being organized online. The SOFT project will thus be presented at the EGU online General
Assembly 2021 on Monday, 26 April 2021 in session BG11 - 'Remote sensing for forest applications’ -
EGU21-16177 : Forest disturbances detection in Vietnam, Cambodia and Laos using Sentinel-1 data.
4 ACTIVITIES PERFORMED AND RESULTS: WP 200
4.1 Selection of the forest loss detection method
The team first performed a bibliographic review related to forest disturbances detection using SAR,
with Sentinel-1 based studies analyzed first, followed by studies based on C-band data in general and
then other frequencies. The results of the bibliographic review have been detailed in the ATBD.
However, the forest loss detection method from Bouvet et al. (2018) was considered as the best
potential candidate algorithms for the following reasons :
CESBIO and GlobEO are convinced of the potential of the method, which provided excellent
results over Peru (Bouvet al., 2018), French Guiana (Ballère et al., 2021), Gabon (Hirgschmugl
et al., 2020), Brasil and Vietnam (unpublished results).
CESBIO and GlobEO created this method and thus perfectly know how to improve or adapt it
to Vietnam, Cambodia and Laos.
The short time of the project (1 year) did not allow for a thorough comparison of existing
methods. In addition, CESBIO already performed this round review exercise before the SOFT
project and results showed that Bouvet’s method provided more accurate maps with lower
computation time over selected test sites than others’s methods.
The forest loss detection system that we adopted is composed of two steps:
Detect shadows that appear or disappear in a series of images, and,
Reconstruct the deforested patches associated to the shadows.

SOFT Final Report
Ref.: SOFT_FR_202104_v2.0
Issue: 1.0
Date: 22.04.2021
Page : 16 of 38
It is important to note that the main advantage of the method is to avoid false alarms detection,
which would be far worse when forest loss patches are detected in a classical manner without the
prior detection of shadows. The method is fully described in the ATBD, in Bouvet et al. (2018) and
Ballère et al. (2021).
Regarding the Sentinel-1 data processing, we used the pre-processing chain developed at CESBIO
(https://gitlab.orfeo-toolbox.org/s1-tiling/s1tiling), as an operational tool for Sentinel-1 GRD data
processing and tiling per the 100 km MGRS used by the Sentinel-2 processing system. The chain is
based on open source libraries and can be used freely (Inglada and Christophe 2009).
4.2 Forest definitions
According to the reports submitted by Vietnam, Cambodia and Laos to the UNFCCC (respectively the
first summary of information for Vietnam, the Cambodia forest report 2016, and the report of the
technical assessment of the proposed forest reference emission level - FREL), Vietnam and Cambodia
use the same forest definition, i.e. a tree cover of 10%, a minimum tree height of 5 m at maturity and
a minimum area of 0.5 ha. Laos employs a tree cover value of 20%, 10 cm stand diameter at breast
height (DBH) and 0.5 hectares of area. The plantations such as rubber, oil palm, teak, acacia and
eucalyptus and other kinds of trees which fall under the above criteria area also classified as forests.
In this study, we defined forest as at least 5 m tall trees with a tree cover exceeding 50%. Forest loss
is defined as a forest area with a tree cover larger than 50% before disturbance and very low after
disturbance (less than 10%, although this value is qualitative). In fact, we assumed that forest loss
detection methods based on Sentinel-1 backscatter does not allow to identify forest loss over low
tree cover areas. In addition, this definition is also used in Hansen et al., (2013), which is crucial when
comparing the results from both methods.
4.3 Sites selection for the PoC
We selected 110x110 km2 MGRS tiles as study sites with natural forests and plantations, flat and
steep terrain, and with available very high resolution (VHR) images in Google Earth. Table 2
summarizes the main characteristics of the selected tiles, i.e. :
- Country in which the tile is located,
- Forest proportion in 2017, i.e. the proportion of forest relative to the entire tile without
taking into account permanent water, using the tree cover map from Potapov et al. (2019),
- Forest loss from 2000 to 2017, i.e. the proportion of forest loss using the GFW annual
product (Hansen et al., 2013), relative to the entire tile without taking into account
permanent water,
- Mean slope over forest, i.e. the mean slope value over areas with tree cover higher than 50%
in 2017.

SOFT Final Report
Ref.: SOFT_FR_202104_v2.0
Issue: 1.0
Date: 22.04.2021
Page : 17 of 38
Table 2. Main characterictics of the selected tile in the frame of the WP 200, i.e. country in which the tile is located, forest proportion in 2017 relative to the entire tile without taking into account permanent water, proportion of forest loss from 2000 to 2017 relative to the entire tile without taking into account permanent water and mean slope value over areas with tree cover higher than 50% in 2017.
Country
Forest proportion in 2017 (%)
Forest loss (%) Mean slope
over forest (°) 48PVV Cambodge 25.1 15.3 3.2
48PWV Cambodge 52.1 28.5 3.6
48PYA Cambodge - Vietnam
Laos 60.1 21.3 12.1
49PBS Vietnam 67.2 21.4 16.1
48PZC Vietnam 58.5 21.1 17.9
48QXD Vietnam - Laos 72.9 18.8 14.6
48PUT Cambodge 73.9 12.3 8.8
48PXT Vietnam - Cambodge 28.5 12.2 3.8
48QVF Laos - Vietnam 83.6 10.4 20.4
48QTH Laos 76.2 16.4 21
48QVK Vietnam 50.6 7.3 23.1
We tested the method over the following 6 tiles : 48PVV, 48PWV, 48PYA, 49PBS, 48PZC and 48QXD
(in white in Figure 1), and quantitatively assessed the results over these tiles using reference data
described in section 4.4. Among the 6 test tiles, 3 tiles are located mainly in Vietnam and 3 tiles in
Cambodia, with 2 tiles intersecting Laos. Five out of the 6 tiles have a forest proportion higher than
50% and all the tiles show a proportion of forest loss higher than 15%. The mean slope value over
forest ranges between 3 and 18°. More information related to these tiles is provided in the ATBD.
We then tested the retained method over 5 other tiles : 48PUT, 48PXT, 48QVF, 48QTH and 48QVK
(Figure 1). The test was qualitative as no reference data could be selected over these tiles because of
the lack of historical VHR optical data (Planet free cloud mosaic data were not released yet before
September 2020).
SOFT Final Report
Ref.: SOFT_FR_202104_v2.0
Issue: 1.0
Date: 22.04.2021
Page : 18 of 38
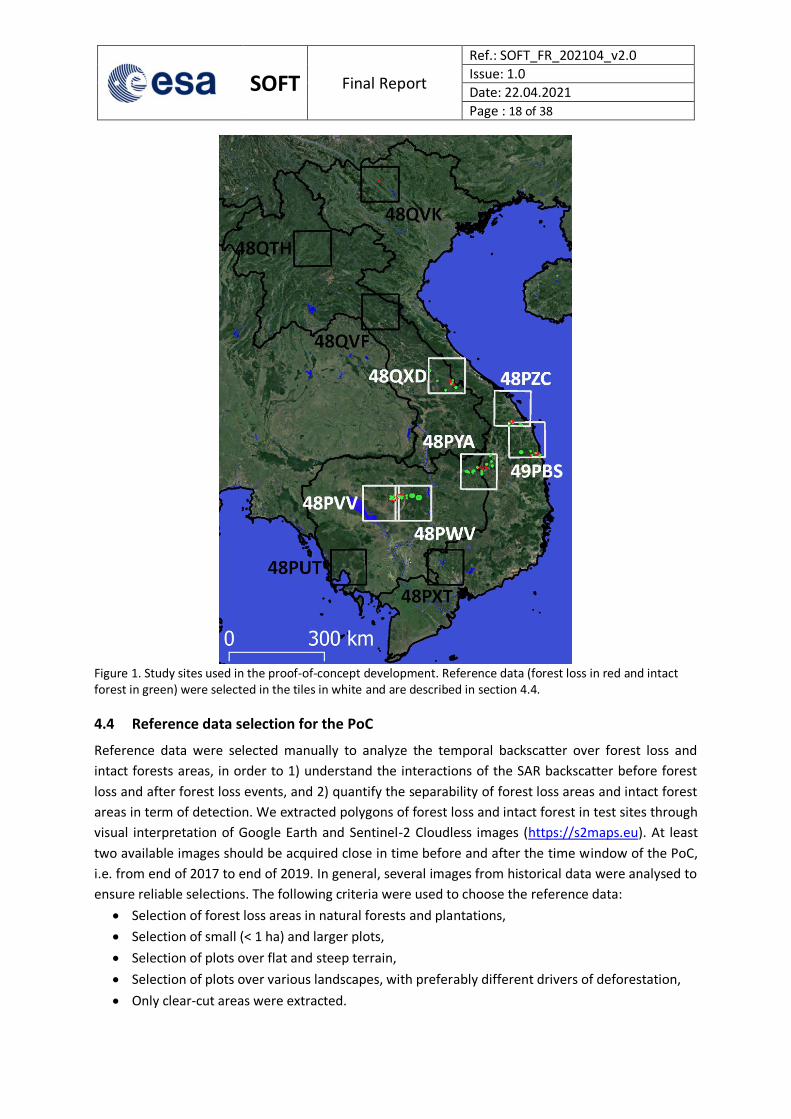
Figure 1. Study sites used in the proof-of-concept development. Reference data (forest loss in red and intact forest in green) were selected in the tiles in white and are described in section 4.4.
4.4 Reference data selection for the PoC
Reference data were selected manually to analyze the temporal backscatter over forest loss and
intact forests areas, in order to 1) understand the interactions of the SAR backscatter before forest
loss and after forest loss events, and 2) quantify the separability of forest loss areas and intact forest
areas in term of detection. We extracted polygons of forest loss and intact forest in test sites through
visual interpretation of Google Earth and Sentinel-2 Cloudless images (https://s2maps.eu). At least
two available images should be acquired close in time before and after the time window of the PoC,
i.e. from end of 2017 to end of 2019. In general, several images from historical data were analysed to
ensure reliable selections. The following criteria were used to choose the reference data:
Selection of forest loss areas in natural forests and plantations,
Selection of small (< 1 ha) and larger plots,
Selection of plots over flat and steep terrain,
Selection of plots over various landscapes, with preferably different drivers of deforestation,
Only clear-cut areas were extracted.

SOFT Final Report
Ref.: SOFT_FR_202104_v2.0
Issue: 1.0
Date: 22.04.2021
Page : 19 of 38
The spatial distribution of the reference polygons are shown in Figure 1 and the numbers and sizes of
the reference polygons are shown in Table 3. A total of 539 plots were selected in 5 sites over 6
MGRS tiles: 48PVV, 48PWV, 48PYA, 49PBS, 48PZC and 48QXD. The histogram of the reference plots
size is shown in Figure 2. Approximately 69% of the intact forest reference plots have a surface area
lower than 100 ha, and 76% of the forest loss reference plots have a surface area lower than 2 ha.
Table 3. Numbers and sizes of the reference polygons constituting the training and testing database for forest loss assessment.
Nb. areas Mean size (ha) Surface (ha)
Forest loss 457 4.3 1 971
Intact forest 82 381.2 31 260
Figure 2. Distribution of the forest loss and intact forest reference plots surface area.
Although no tile has been selected as a study site in the mountains of Northern Vietnam and Laos,
the distributions of the terrain slope values over the forest loss and intact forest reference plots
(Figure 3) show that reference data have been chosen over a variety of reliefs, with mean values up
to 12.5° and 23.5° for forest loss and intact forest plots repectively, over the tile 48PZC for example.
The selection of these plots ensures the faisability of the analysis in flat and steep areas detailed in
the ATBD. This is crucial as forests over slopes exceeding 20° represent 5.3% of the whole study area
and 11.3% of total forest area (Mermoz et al., 2016).

SOFT Final Report
Ref.: SOFT_FR_202104_v2.0
Issue: 1.0
Date: 22.04.2021
Page : 20 of 38
Figure 3. Distribution of the terrain slope values over the forest loss and intact forest reference plots.
4.5 Ancillary data selection In addition to Sentinel-1 images, numerous ancillary data were used in the project and are
summarized in Table 4.
Table 4. Summary of ancillary data
Dataset type Dataset name Time frequency Resolution Reference
Forest mask Tree canopy cover Annual 30m Potapov et al. 2019
Forest loss Global Forest Watch Annual 30m Hansen et al. 2013
Forest loss alerts GLAD Alerts Weekly 30m Hansen et al. 2016
Forest loss alerts JJ-Fast 1.5 months 5 ha Watanabe et al. 2017
Tree canopy height Tree canopy height Annual 30m Potapov et al. 2021
Precipitations GSMap Daily 0.1° Kubota et al. 2020
The first step of the forest loss monitoring workflow is the use of an initial benchmark forest/non-
forest mask (hereafter referred to as the forest mask), which accurately represents the forest area at
the beginning of the change detection time window. The quality of the forest mask has a tremendous
impact on the quality of the forest loss maps.

SOFT Final Report
Ref.: SOFT_FR_202104_v2.0
Issue: 1.0
Date: 22.04.2021
Page : 21 of 38
We compared various tree canopy cover maps detailed in the ATBD. We drew the following
conclusions:
The tree canopy cover 2010 from Hansen et al. (2013) can be updated to a 2017 forest mask by
using the annual tree cover loss layer from GFW. However, it appeared that the quality of this
map was much lower than the one from Potapov et al. (2019) (that is shown in Figure 4), partly
because the 2010 map was produced using the Landsat 7 satellite data, whose the Scan Line
Corrector in the Enhanced Thematic Mapper Plus (ETM+) instrument failed. A comparison
between the two maps is shown in Figure 5,
The accuracy of the forest/non-forest map from Shimada et al. (2014) was found to be too low,
The Land use land cover maps 2017 from Trung et al. (2018), Duong et al. (2018) and Tung et
al. (2016) have been derived in three parts (Northern, Central and Southern Vietnam) with two
different methods, leading to spatial differences of quality. In addition, these maps covered
Vietnam only,
The spatial resolution of the fraction of green vegetation cover and the C3S global land cover
was too coarse regarding the objectives of the SOFT project.
We finally selected the tree canopy cover map that has been produced in the frame of a joint project
conducted by the GLAD laboratory from UMD and SERVIR-Mekong. The method used to derive the
tree canopy cover map has been extensively described in Potapov et al. (2019). The obtained tree
canopy cover (Figure 4) is defined as a proportion of canopy cover from woody vegetation taller than
5 m at 30 m pixel size from 2010 to 2017. Note that natural tree cover and tree plantation and
agroforestry were not discriminated.
Figure 4. Tree canopy cover 2017 and primary forest extent at 30 m pixel size from Potapov et al. (2019)

SOFT Final Report
Ref.: SOFT_FR_202104_v2.0
Issue: 1.0
Date: 22.04.2021
Page : 22 of 38
Figure 5. Comparison between the tree cover maps from Hansen et al. (2013) and Potapov et al. (2019). The map from Hansen is particularly affected by the failure of the Landsat -7 Scan Line Corrector in the Enhanced Thematic Mapper Plus (ETM+) instrument.
In addition to tree cover maps, we also used:
- Forest loss dataset from Hansen et al. (2013), from Hansen et al. (2016) and from JJ-FAST
(Watanabe et al., 2017). Existing forest loss detection systems are useful in the SOFT project.
These products were not considered here as benchmarks, but rather helped in the selection
of study sites where forest losses are active and were compared with our forest loss maps.
- The last global forest canopy height map at 30 m resolution, which was developed recently
through the integration of the Global Ecosystem Dynamics Investigation (GEDI) lidar forest
structure measurements and Landsat analysis-ready data (ARD) time-series.
- Precipitations data. We analyzed rainfalls together with SAR backscatter using the Global
Satellite Mapping of Precipitations (GSMaP) product (Kubota et al., 2020) to better
understand the SAR backscatter behavior.
The above-mentioned dataset are fully described in the ATBD.
4.6 Analysis results in the frame of the PoC
Analyses of the Sentinel-1 backscatter signal over forest loss and intact forest areas of Vietnam,
Cambodia and Laos were needed to adapt the forest loss detection method. Basic tools have
therefore been developed to quickly analyze temporal images and backscatter profiles and for quick
image vizualisation, which is useful to check the quality of the data before and after processing
(problems related to geometric shifts and outliers in Sentinel-1 images). Figure 6 shows examples of
temporal backscatter profiles over the tiles 48PWV, 48PYA and 48QXD. Temporal backscatter profiles
consisted in profiles of backscatter and radar change ratio (RCR - Tanase et al., 2018) at VV and VH
polarizations over reference data, and precipitations using the Global Satellite Mapping of
Precipitations (GSMaP) product (Kubota et al., 2020). Temporal backscatter profiles allow to

SOFT Final Report
Ref.: SOFT_FR_202104_v2.0
Issue: 1.0
Date: 22.04.2021
Page : 23 of 38
understand the backscatter temporal variations over plots with various characteristics, such as
terrain slope and humidity due to rainfalls.
Figure 6. Backscatter γ0
VV and radar change ratio (RCR) time series from October 2017 to end of 2019 for the tiles 48PWV, 48PYA and 48QXD. Precip means precipitations.
We also analysed the probability density function (PDF) and cumulative PDF of the minimum RCR
indicator min(RCR) (Tanase et al., 2018, Bouvet et al., 2018) over the reference data of forest loss and
intact forest areas, for each selected tile detailed in section 4.3, in ascending and descending modes
separately. Figure 7 shows an example over the tile 48PVV. In Figure 7, the term «shadows» means
that 25% of the pixels of each plot with the lowest min(RCR) values were used to draw the PDF.

SOFT Final Report
Ref.: SOFT_FR_202104_v2.0
Issue: 1.0
Date: 22.04.2021
Page : 24 of 38
Figure 7. Probability density function (PDF) and cumulative PDF of the min(RCR) indicator at VV and VH polarization for reference data over the tile 48PVV in ascending (ASC) and descending (DES) modes. The term «shadows» means that 25% of the pixels of each plot with the lowest min(RCR) values were used to draw the PDF.
From these plots, we quantified the following indicators describing the separability of forest loss and
intact forest reference data, with two different scenarii:
- Scenario s1: In this scenario, the true positive detection (TD) of the intact forest class is targetted
to 95%, ensuring a trade-off between low false alarms rate and accurate forest loss detection.
Note that TD is defined as true positive samples divided by the sum of true positive and false
negative samples for a given min(RCR) threshold.
- Scenario s2 : This scenario is more flexible. A range of indicator values is computed to correspond
to various user needs, from detections with the highest possible certainty to avoid field teams
being sent to sites at which deforestation events were falsely detected, to the most accurate map
in term of producer and user accuracy.
In Table 5, the indicators described above were quantified for the tile 48PVV in ascending and
descending modes. Regarding scenario 2, the range of values for each indicator in Table 5 are

SOFT Final Report
Ref.: SOFT_FR_202104_v2.0
Issue: 1.0
Date: 22.04.2021
Page : 25 of 38
associated with the best 10 E[TDFL ,TDIF]-s2 values (FL and IF mean forest loss and intact forest
respectively). We drew from these results the following conclusions :
- The separability between forest loss and intact forest reference data is obviously better when
shadows are considered, as the pixels with the lowest min(RCR) values are selected in this case.
- Although results obtained at VV and VH polarizations are in general quite similar, results were
systematically better at VH polarization as shown in the ATBD.
- The min(RCR) values were remarkably stable, ranging from -5.7 to -2.3 dB in general.
The indicators assessment for the other tiles of the PoC is detailed in the ATBD.
Table 5. Assessment of indicators describing the separability of forest loss and intact forest reference data over the tile 48PVV with two scenarii : scenario s1 that is a trade-off between low false alarms rate and accurate forest loss detection and scenario s2 corresponding to the most accurate map in term of producer and user accuracy. The ranges of values for each indicator of scenario 2 are associated with the best 10 E[TDFL ,TDIF]-s2 values. The terms nb FL and nb IF refer to the number of pixels from the forest loss and intact forest reference dataset that were used for computing the indicators. The true positive detection TD is defined as true positive samples divided by the sum of true positive and false negative samples for a given min(RCR) threshold. The term all means that all available reference data were used, whereas the term shad means that 25% of the pixels of each plot with the lowest min(RCR) values were used.
scenario 1 scenario 2
nb FL x103
nb IF x103
min(RCR) s1 (db)
TDFL s1 (%)
min(RCR) s2 (db)
TDFL s2 (%)
TDIF s2 (%)
E[TDFL ,TDIF] s2 (%)
48P
VV
ASC
02
6 V
V all 87
142 -3.1
97 -4.1 -3.2
92.1 96.7
99.8 95.8
96 97.2
shad 22 100 -4.8 -3.9
99.7 100
100 99.7
99.8 100
VH
all 87
142 -3
97.9 -4.3 -3.4
95.5 97.4
100 98.4
97.8 98.2
shad 22 100 -5.5 -4.5
99.9 100
100 100
100 100
DES
091
VV
all 87
142 -3.2
93.2 -4
-3.1 86
94.5 99.6 91.3
92.8 94.6
shad 22 99.5 -5.1 -4.2
98.4 98.6
100 99.8
99.2 99.2
VH
all 87
142 -3
95.7 -4.1 -3.2
92.2 95.2
99.9 96.9
96 96.7
shad 22 99.2 -5
-4.1 98.5 98.6
100 99.9
99.2 99.3
4.7 Map resulting from the PoC
From the analysis above, we decided to restricted ourselves to the VH polarization to keep a
consistent time series over the full date range. We applied the methodology fully described in the
ATBD to the tiles selected in the frame of the PoC. We then discarded small outliers in the obtained
maps by sieving and retained segments of more than 4 pixels, which correspond to a minimum
mapping unit of 0.04 ha. The resulting forest loss map is shown in Figure 8, where the indicated
SOFT Final Report
Ref.: SOFT_FR_202104_v2.0
Issue: 1.0
Date: 22.04.2021
Page : 26 of 38
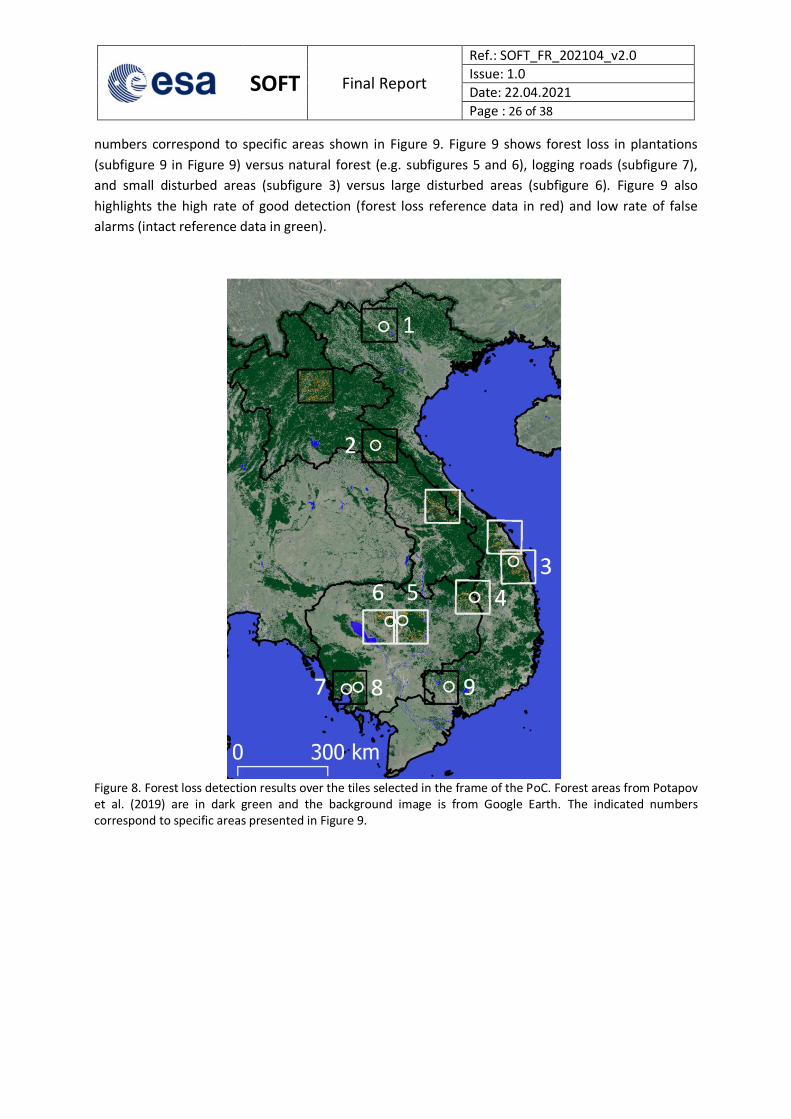
numbers correspond to specific areas shown in Figure 9. Figure 9 shows forest loss in plantations
(subfigure 9 in Figure 9) versus natural forest (e.g. subfigures 5 and 6), logging roads (subfigure 7),
and small disturbed areas (subfigure 3) versus large disturbed areas (subfigure 6). Figure 9 also
highlights the high rate of good detection (forest loss reference data in red) and low rate of false
alarms (intact reference data in green).
Figure 8. Forest loss detection results over the tiles selected in the frame of the PoC. Forest areas from Potapov et al. (2019) are in dark green and the background image is from Google Earth. The indicated numbers correspond to specific areas presented in Figure 9.

SOFT Final Report
Ref.: SOFT_FR_202104_v2.0
Issue: 1.0
Date: 22.04.2021
Page : 27 of 38
Figure 9. Visual comparison of forest loss detection results, highlighting the various sizes and distributions of disturbed areas. Intact forest and forest loss reference data are drawn in green and red respectively. Forest areas from Potapov et al. (2019) are in dark green and the background image is from Google Earth.
We computed confusion matrices (Table 6) for the tiles 49PBS and 48PZC, where reference data were
selected and where terrain relief is the steepest. Producer, user and overall acuracy were found to be
higher than 94% and kappa index higher than 0.96. We noticed a slight over-estimation of detected
forest losses (UA of 94% for the two tiles). However, these results showed that accurate forest loss
detection is possible, even over hilly or mountainous areas.

SOFT Final Report
Ref.: SOFT_FR_202104_v2.0
Issue: 1.0
Date: 22.04.2021
Page : 28 of 38
Table 6. Assessment (pixel counting) of the forest loss detection method accuracy for the tile 49PBS (left) and 48PZC (right). Columns show the forest loss (FL) and intact forest (IF) as determined by the detection method, whereas rows indicate the reference data. PA, UA and OA are in % and stand for producer, user and overall acuracy, k stands for kappa index.
FL IF UA
FL 25 315 1 380 94.8
IF 0 418 231 100
PA 100 99.7
OA 99.7
k 0.97
FL IF UA
FL 12 561 730 94.5
IF 211 71 487 99.7
PA 98.3 99
OA 98.9
k 0.96
5 ACTIVITIES PERFORMED AND RESULTS: WP 300
In the frame of WP 300, we mainly optimized, installed and ran the scripts (in Python) onto the high
performance computing (HPC) cluster of the CNES.
The main technical challenge was the processing of the large amount of available Sentinel-1 data (see
Figure 10), with 37 and 34 frames of Sentinel-1 data in ascending and descending geometry
respectively, to cover the whole study area. Given the small duration of the project and the amount
of data to be processed, we started to work on this WP from the beginning of the project.
Figure 10. Number and distribution of Sentinel-1 frames in ascending and descending modes over Vietnam, Cambodia and Laos.
In the frame of the extension of the GeoRice project funded by ESA (Contract Change Notice number
1 of the ESA Contract 4000113388/15/I-NB) and conducted by CESBIO and GlobEO, a part of Sentinel-
SOFT Final Report
Ref.: SOFT_FR_202104_v2.0
Issue: 1.0
Date: 22.04.2021
Page : 29 of 38
1 data used in the SOFT project, over Vietnam, Cambodia and Laos was already processed at the
beginning of the SOFT project and made available in the CEOS analysis ready data (ARD) format in
sigma naught. To complete the processing specific to the SOFT project (i.e. to forest monitoring), we
first processed and standardized all the data needed to convert sigmal naught Sentinel-1 backscatter
from the GeoRice project to topographic-corrected gamma naught, i.e., terrain slope and aspect
angles, and local incidence angles. We downloaded and fully processed the Sentinel-1 dataset in
ascending mode from 2018 to 2021 and in descending mode in 2020 (not processed in the frame of
the GeoRice project) and converted sigmal naught Sentinel-1 backscatter to topographic-corrected
gamma naught over selected test sites. We then filtered in NRT mode the Sentinel-1 images. To do
so, each new acquired image was filtered using previously acquired images, instead of filtering the
whole stack of images.
We could handle efficiently the large amount of Sentinel-1 data available using the pre-processing
chain developed at CESBIO, detailed in the ATBD. The chain is highly scalable (multithreading /
multiprocessor), which made it easy to install onto the high performance computing (HPC) CNES
cluster in May 2020. After the installation of the codes, we performed tests of the various scripts
(NRT speckle filtering, detection of forest loss, post-processing). We also fixed some problems related
to data management, e.g. the large amount of Sentinel-1 data by compressing input and output data
and removing input data on-the-fly when not necessary anymore in the detection algorithm.
Then, the processing of the whole study area has been achieved. We mosaicked the resulting maps,
checked their quality and manually corrected outliers. Outliers were found to be rare as the forest
loss detection method is not applied over areas with potential false alarms, i.e. with backscatter
varying in time (such as water areas, bare soils, mangroves and non forest areas in general).
Nevertheless, some tiles had to be reprocessed due to flaws in the acquisition of the Sentinel-1 data,
leading for example to geometric inconsistencies.
The final forest loss map over Vietnam, Laos and Cambodia from 2018 to 2021, is shown in Figure 11.
The map provides clear hints of the spatial and temporal distribution of forest losses. For example,
Figure 12 shows the difference between high forest losses currently happening in Northern Laos
versus low forest losses in Northern Vietnam, although the whole Northern mountainous region is
covered by similar forest types.
Specific areas of the whole forest loss map are shown in Figure 13. Figure 13 shows forest loss in
various environments and forest types, from North to South of the study area. It is important to note
that the method provided accurate results whatever the topography, as emphasized in the ATBD
following the results of the PoC.

SOFT Final Report
Ref.: SOFT_FR_202104_v2.0
Issue: 1.0
Date: 22.04.2021
Page : 30 of 38
Figure 11. Forest disturbances map using Sentinel-1 data in Vietnam, Laos and Cambodia from the end of 2017 to the beginning of 2021.

SOFT Final Report
Ref.: SOFT_FR_202104_v2.0
Issue: 1.0
Date: 22.04.2021
Page : 31 of 38
Figure 12. Forest disturbances map using Sentinel-1 data at the border between Laos and Vietnam, from the end of 2017 to the beginning of 2021. The background image is from Google Earth. The map evidences high forest losses currently happening in Northern Laos versus low forest losses in Northern Vietnam.

SOFT Final Report
Ref.: SOFT_FR_202104_v2.0
Issue: 1.0
Date: 22.04.2021
Page : 32 of 38
Figure 13. Visual comparison of forest loss detection results, highlighting the various sizes and distributions of disturbed areas. Forest areas from Potapov et al. (2019) are in dark green and the background image is from Google Earth.

SOFT Final Report
Ref.: SOFT_FR_202104_v2.0
Issue: 1.0
Date: 22.04.2021
Page : 33 of 38
We also compared the forest loss surface areas obtained from our method with the results from
GFW and GLAD. Although we do not consider the maps of GFW and GLAD as a benchmark and
although the use of Sentinel-1 is basically much more relevant in term of timely detection of forest
losses, we quantitatively compared the statistics per year and country (Table 7) and qualitatively
compared both maps (Figure 14). Note that at the time of the writting, the GFW maps were not
available for the year 2020. We also wrote to the GLAD team to ask for the GLAD 2018 alerts (that
are not available anymore on line), but did not receive any answer. The results from this study and
from GFW are remarkably similar, the largest difference (23%) being found for Laos in 2019. This
result highlights the fact that our detection system can be used as an alert system (fast detection
from sentinel-1 data) and as an annual detection system similar to GFW, used for example to
compute national statistics. As expected, the GLAD alerts allowed to detect much less forest loss
areas, with notable time delays (see Ballère et al., 2021 for a detailed analysis on this topic).
Table 7. Surface areas per year and country in hectare, from this study, Global Forest Watch (Hansen et al., 2013) and GLAD (Hansen et al., 2016).
This study GFW
(Hansen et al., 2013) GLAD
(Hansen et al., 2016)
Vietnam 2018 345 121 422 300 - Vietnam 2019 445 977 421 910 83 361 Vietnam 2020 333 655 - -
Cambodia 2018 200 400 180 970 - Cambodia 2019 281 335 236 780 119 042
Laos 2018 327 152 400 290 - Laos 2019 648 089 498 830 153 187 Laos 2020 292 383 - -
We performed visual comparisons between the maps resulting from our study and from GFW. The
example in Figure 14 (Up) illustrates the fact that in many areas, the results from both methods are
rather similar. However, the exemple in Figure 14 (Bottom) emphasizes a phenomenon that is
common in the resulting maps : only the edges of the disturbed areas are detected in the GFW maps,
contrary to the maps from our method in which the disturbed areas are accurately detected.

SOFT Final Report
Ref.: SOFT_FR_202104_v2.0
Issue: 1.0
Date: 22.04.2021
Page : 34 of 38
Figure 14. Visual comparison between the forest disturbances maps from this study (Left) and from Global Forest Watch (Right). The two areas are centred on 102.75°N and 20.48°E in Laos (Up) and 107.21°N and 16.61°E in Vietnam (Bottom). The background image is from Google Earth.
6 ACTIVITIES PERFORMED AND RESULTS: WP 400
The validation framework is primarily based on the good practices recommended by Olofsson et al.
(2014 and 2020).
In the frame of the SOFT project, we chose as sampling design a stratification with stratas defined by
the map classes, mainly to improve the precision of the accuracy and area estimates. The stratified
design satisfies the basic accuracy assessment objectives and most of the desirable design criteria.
We selected a buffer stratum in addition to an intact forest stratum and a forest disturbances
stratum, for the reasons detailed in the validation report and as recommanded by Olofsson et al.
(2020).
We specified a target standard error for overall accuracy of 0.01 and supposed that user's accuracies
of the change class is 0.70 for forest disturbances and 0.90 for intact forest. The resulting sample size
is therefore n=803 in total, which we have rounded up to 1 000 samples.
We then assessed the allocation of the sample to strata so that the sample size allocation results in
precise estimates of accuracy and area. We followed Olofsson’s recommendations and allocated a
sample size of 100 for the forest disturbance stratum, and then allocated the remainder of the
SOFT Final Report
Ref.: SOFT_FR_202104_v2.0
Issue: 1.0
Date: 22.04.2021
Page : 35 of 38
samples to the intact forest classes, i.e. 200 in the buffer areas around detected disturbances, and
700 in intact forest outside of these buffers. Figure 15 shows the location of the 1 000 samples in the
study area.
Figure 15. Location of the 100 disturbance samples, 200 buffer samples (intact forest around disturbance) and 700 intact forest samples used for the validation. Light green areas represent the baseline forest map.
Both high- and very high spatial resolution (<10 m and <1 m respectively) satellite data were viable
candidates for reference data. We used when possible freely accessible very high spatial resolution
imagery online through Google Earth™ (Google, 2011), which presents low cost interpretation
options. Google Earth images are actually a relatively relevant source of validation data for remote
sensing studies. When Google Earth images were not available at the relevant dates, we instead
accessed Planet’s very high-resolution analysis-ready mosaics as reference data. Through Norway’s
International Climate and Forests Initiative, these pan-tropical 4.8 m resolution mosaics were
recently released in order to help reduce the loss of tropical forests, amongst others.
The resulting confusion matrix presented in terms of the sample counts is displayed in Table 8, and
the confusion matrix populated by estimated proportions of area, used to report accuracy results is
shown in Table 9.

SOFT Final Report
Ref.: SOFT_FR_202104_v2.0
Issue: 1.0
Date: 22.04.2021
Page : 36 of 38
Table 8. Error matrix of sample counts
Reference
Disturbances Intact Total Am,i (km²) Wi
Map
Disturbances 96 5 101 22 222 5.84%
Intact buffer 3 194 197 70 667 18.58%
Intact 3 693 696 287 462 75.58%
Total 102 892 994 380 351 100%
Table 9. Error matrix in Table 8 populated by estimated proportions of area, used to report accuracy results
Reference
Disturbances Intact Total (Wi) Am,i (km²)
Map
Disturbances 5.55% 0.29% 5.84% 22 222
Intact buffer 0.28% 18.30% 18.58% 70 667
Intact 0.33% 75.25% 75.58% 287 462
Total 6.16% 93.84% 100% 380 351
We then estimated from the confusion matrix in Table 9 user's accuracy, producer's accuracy and
overall accuracy. Variances for these accuracy measures are estimated using Eqs. (5)–(7) from
Olofsson et al. (2014):
The estimated user's accuracy (±95% confidence interval) is 0.950 ± 0.043 for forest
disturbances and 0.993 ± 0.005 for intact forest (including buffer areas around disturbance).
The estimated producer's accuracy is 0.898 ± 0.061 for forest disturbances and 0.997 ± 0.043
for intact forest.
The estimated overall accuracy is 0.991 ± 0.006.
We also estimated area proportions from the confusion matrix in Table 9. The row totals of the
confusion matrix give the mapped area proportions Wi while the column totals give the estimated
area proportions according to the reference data. Multiplying the latter by the total mapped area
gives the stratified area estimate of each class according to the reference data. For example, the
estimated area of 2018 and 2019 deforestation according to the reference data is =
m m . The mapped area of deforestation Am,1 of 22 222 km²
was thus underestimated by 1 215 km².
The final step is to estimate a confidence interval for the area of each class. From Eq. (10) in Olofsson
et al (2014), and the standard error for the estimated area of forest loss is
= m m . The margin of error of the
confidence interval is 1.96 × 1 092 = 2 140 km². We have thus estimated the area of deforestation
with a 95% confidence interval: 23 437 ± 2 140 km².
SOFT Final Report
Ref.: SOFT_FR_202104_v2.0
Issue: 1.0
Date: 22.04.2021
Page : 37 of 38
7 REFERENCES
Ballère, M., Bouvet, A., Mermoz, S., Le Toan, T., Koleck, T., Bedeau, C., ... & Lardeux, C. (2021). SAR data for tropical forest disturbance alerts in French Guiana: Benefit over optical imagery. Remote Sensing of Environment, 252, 112159.
Bouvet, A., Mermoz, S., Ballère, M., Koleck, T., & Le Toan, T. (2018). Use of the SAR shadowing effect for deforestation detection with Sentinel-1 time series. Remote Sensing, 10(8), 1250.
Diniz, C. G., De Almeida Souza, A. A., Santos, D. C., Dias, M. C., da Luz, N. C., de Moraes, D. R. V., ... & Adami, M. (2015). DETER-B: The new Amazon near real-time deforestation detection system. IEEE Journal of Selected Topics in Applied Earth Observations and Remote Sensing, 8(7), 3619-3628.
Doblas, J., Carneiro, A., Shimabu uro, Y., Sant’Anna, S., Aragão, L., & Pereira, F. R. S. (2020). Stabilization of sentinel-1 SAR time-series using climate and forest structure data for early tropical deforestation detection. ISPRS Annals of the Photogrammetry, Remote Sensing and Spatial Information Sciences, 3, 89-96.
Duong, P. C., Trung, T. H., Nasahara, K. N., & Tadono, T. (2018). JAXA High-Resolution Land Use/Land Cover Map for Central Vietnam in 2007 and 2017. Remote Sensing, 10(9), 1406.
FAO. Global Forest Resources Assessment; Technical Report; Food and Agriculture Association of the United-States: Rome, Italy, 2020.
Finer, M., Novoa, S., Weisse, M.J., Petersen, R., Mascaro, J., Souto, T., Stearns, F., Martinez, R.G., 2018. Combating deforestation: From satellite to intervention. Science 360, 1303–1305. https://doi.org/10.1126/science.aat1203
Google, C. (2010). Google earth. Accessed on 2020 and 2021. Hansen, M. C., Potapov, P. V., Moore, R., Hancher, M., Turubanova, S. A., Tyukavina, A., ... & Kommareddy, A. (2013). High-resolution global maps of 21st-century forest cover change. Science, 342(6160), 850-853.
Hansen, M. C., Krylov, A., Tyukavina, A., Potapov, P. V., Turubanova, S., Zutta, B., ... & Moore, R. (2016). Humid tropical forest disturbance alerts using Landsat data. Environmental Research Letters, 11(3), 034008.
Harris, N., E. Goldman and S. Gibbes. “Spatial Database of Planted Trees (SDPT) Version 1.0.” Accessed through Global Forest Watch on 10/04/2020. www.globalforestwatch.org.
Houghton, R.A., Nassikas, A.A., 2017. Global and regional fluxes of carbon from land use and land cover change 1850-2015: Carbon Emissions From Land Use. Glob. Biogeochem. Cycles 31, 456–472. https://doi.org/10.1002/2016GB005546.
Kubota, T., K. Aonashi, T. Ushio, S. Shige, Y. N. Takayabu, M. Kachi, Y. Arai, T. Tashima, T. Masaki, N. Kawamoto, T. Mega, M. K. Yamamoto, A. Hamada, M. Yamaji, G. Liu and R. Oki 2020: Global Satellite Mapping of Precipitation (GSMaP) products in the GPM era, Satellite precipitation measurement, Springer. Lohberger, S., Stängel, M., Atwood, E.C., Siegert, F., 2018. Spatial evaluation of Indonesia’s 2015 fire‐affected area and estimated carbon emissions using Sentinel‐1. Glob. Change Biol. 24, 644–654. https://doi.org/10.1111/gcb.1384.
Mermoz, S., & Le Toan, T. (2016). Forest disturbances and regrowth assessment using ALOS PALSAR data from 2007 to 2010 in Vietnam, Cambodia and Lao PDR. Remote Sensing, 8(3), 217.
Olofsson, P., Foody, G. M., Herold, M., Stehman, S. V., Woodcock, C. E., & Wulder, M. A. (2014). Good practices for estimating area and assessing accuracy of land change. Remote Sensing of Environment, 148, 42-57.

SOFT Final Report
Ref.: SOFT_FR_202104_v2.0
Issue: 1.0
Date: 22.04.2021
Page : 38 of 38
Olofsson, P., Arévalo, P., Espejo, A. B., Green, C., Lindquist, E., McRoberts, R. E., & Sanz, M. J. (2020). Mitigating the effects of omission errors on area and area change estimates. Remote Sensing of Environment, 236, 111492. Potapov, P., Li, X., Hernandez-Serna, A., Tyukavina, A., Hansen, M. C., Kommareddy, A., ... & Hofton, M. (2021). Mapping global forest canopy height through integration of GEDI and Landsat data. Remote Sensing of Environment, 253, 112165. Potapov, P., Siddiqui, B. N., Iqbal, Z., Aziz, T., Zzaman, B., Islam, A., ... & Hansen, M. C. (2017). Comprehensive monitoring of Bangladesh tree cover inside and outside of forests, 2000–2014. Environmental Research Letters, 12(10), 104015. Reiche, J., Mullissa, A., Slagter, B., Gou, Y., Tsendbazar, N. E., Odongo-Braun, C., ... & Herold, M. (2021). Forest disturbance alerts for the Congo Basin using Sentinel-1. Environmental Research Letters, 16(2), 024005.
Reiche, J., Verhoeven, R., Verbesselt, J., Hamunyela, E., Wielaard, N., & Herold, M. (2018). Characterizing tropical forest cover loss using dense sentinel-1 data and active fire alerts. Remote Sensing, 10(5), 777.
Reiche, J., Lucas, R., Mitchell, A.L., Verbesselt, J., Hoekman, D.H., Haarpaintner, J., Kellndorfer, J.M., Rosenqvist, A., Lehmann, E.A., Woodcock, C.E., Seifert, F.M., Herold, M., 2016. Combining satellite data for better tropical forest monitoring. Nat. Clim. Change 6, 120–122. https://doi.org/10.1038/nclimate2919.
Reymondin, L., Jarvis, A., Perez-Uribe, A., Touval, J., Argote, K., Coca, A., Rebetez, J., Guevara, E., Mulligan, M., 2012. Terra-i : A methodology for near real-time monitoring of habitat change at continental scales using MODIS-NDVI and TRMM.
Shimada, M., Itoh, T., Motooka, T., Watanabe, M., Shiraishi, T., Thapa, R., & Lucas, R. (2014). New global forest/non-forest maps from ALOS PALSAR data (2007–2010). Remote Sensing of environment, 155, 13-31.
Stehman, S. V., Olofsson, P., Woodcock, C. E., Herold, M., & Friedl, M. A. (2012). A global land-cover validation data set, II: Augmenting a stratified sampling design to estimate accuracy by region and land-cover class. International Journal of Remote Sensing, 33(22), 6975-6993. Tanase, M. A., Aponte, C., Mermoz, S., Bouvet, A., Le Toan, T., & Heurich, M. (2018). Detection of windthrows and insect outbreaks by L-band SAR: A case study in the Bavarian Forest National Park. Remote Sensing of Environment, 209, 700-711.
Trung, T.H. Land Cover Change Mapping in Southern Vietnam Using Multi-temporal High resolution Satellite Remote Sensing Data, Master’s thesis, University of Tsu uba, 2018.
Tung, T. Analysis of Land Cover Change in Northern Vietnam Using High Resolution Remote Sensing Data, Hoang, Master’s thesis, University of Tsukuba, 2016.
Watanabe, M., Koyama, C., Hayashi, M., Kaneko, Y., Shimada, M., 2017. Development of early-stage deforestation detection algorithm (advanced) with PALSAR-2/ScanSAR for JICA-JAXA program (JJ-FAST). IEEE, pp. 2446–2449. https://doi.org/10.1109/IGARSS.2017.8127487.
Wheeler, D., Hammer, D., Kraft, R., Steelr, A., 2014. Satellite-based forest clearing detection in the brazilian amazon: FORMA, DETER, and PRODES. World Resources Institute: Washington, DC, USA.
World Wildlife Fund. (2013). Ecosystems in the Greater Mekong: Past trends, current status, possible futures.