sentiment bias and asset prices: evidence from sports...
TRANSCRIPT
Sentiment Bias and Asset Prices: Evidence from Sports
Betting Markets and Social Media
Arne Feddersen∗ Brad R. Humphreys† Brian P. Soebbing‡
September 2013
Abstract
Previous research using attendance-based proxies for the number of investors with
sentiment bias supported the presence of investor sentiment in sports betting markets.
We use data from social media (Facebook “Likes”) to proxy for participants with
investor sentiment and analyze variation in prices set by bookmakers for evidence of
influence from investor sentiment. Based on prices and outcomes over two seasons
in seven professional sports leagues in Europe and North America, we develop new
evidence that asset prices reflect the presence of investor sentiment in these markets,
or that bookmakers believe they exist, by offering favorable betting lines for popular
teams. Favorable prices do not translate into a higher probability of winning a bet.
JEL Codes: L81, G14
Key words: investor sentiment, sports betting, social media
∗University of Southern Denmark, Department of Environmental and Business Economics, Niels-Bohrs-Vej 9, DK-6700 Esbjerg, Denmark; E-mail: [email protected]†West Virginia University, College of Business & Economics, 601 University Ave., PO Box 6025, Mor-
gantown, WV 26506-6025, USA; Email: [email protected].‡Louisiana State University, School of Kinesiology, 112 Long Field House, Baton Rouge, LA, 70803, USA;
E-mail: [email protected]
1
I INTRODUCTION
A growing literature examines the effects of investor sentiment on prices in financial markets.
Investor sentiment refers to behavior on the part of investors that can be interpreted as irra-
tional. Early research on investor sentiment focused on explaining the apparent overreaction
and underreaction of stock prices to good and bad news in financial markets (Lee, Shleifer,
and Thaler, 1991). Later research expanded investor sentiment to include any “nonmaxi-
mizing trading pattern among noise traders that can be attributed to a particular exogenous
motivation” (Avery and Chevalier, 1999, p. 493). Identifying markets where investor senti-
ment takes place is an important element for research in this area, and a growing body of
research looks for evidence of investor sentiment in sports betting markets. Sports betting
markets have clear advantages for investigating the effects of investor sentiment. These sim-
ple financial markets have clear payoffs at a specific point in time, and the teams involved
in the betting action have readily identifiable characteristics that aid researchers in identi-
fying the presence of investor sentiment. Investor sentiment in sports betting markets can
stem from the popularity and emotional attachment to certain teams that would lead some
bettors to place a bet on certain teams due to loyalty (Braun and Kvasnicka, 2013; Franck
et al., 2011). The presence of sentiment bias can affect bookmakers’ odds or point spreads.
Bookmakers may adjust their odds or point spreads due to the presence of investor sentiment
but cannot adjust too much because informed and unbiased bettors could take the other side
when odds or point spreads reflect sentiment, reducing the bookmaker’s profit.
This research develops evidence consistent with the presence of sentiment bias in prices
in sports betting markets (fixed decimal odds and point spreads) in professional leagues in
Europe and North America. Our sample contains all regular season games from the so-called
“big 5” European football leagues (England, France, Germany, Italy, and Spain) and the
National Basketball Association (NBA) over the 2011-12 and 2012-13 seasons. Additionally,
betting data on National Football League (NFL) games is analyzed for the 2012-13 season.
2
The regression model builds on the research of Forrest and Simmons (2008) and Franck
et al. (2011), who analyzed bet outcomes and found evidence of sentiment bias in European
football betting. In contrast to the measure of sentiment used in previous research, differences
in attendance at home games or matches, we use a popularity measure based on team
attachments stated by “fans” on the social media platform Facebook to identify the presence
of investor sentiment. More precisely, we employ the number of Facebook “Likes” received
by each team as a proxy for the presence of fans exhibiting sentiment bias in betting markets.
As of March 2013, Facebook had over one billion active users worldwide and nearly all sports
teams from major professional leagues have official pages on Facebook, where members of
this social networking platform can go to a team’s page and click the “Like” button to signal
approval of or affinity with the team. Thus, Facebook “Likes” seem to be an appropriate
proxy for the size of a team’s fan base and the number of bettors who might exhibit sentiment
bias toward this team.
An analysis of prices set in sports betting markets – betting odds in five top European
professional football leagues and two major North American professional sports leagues –
uncovers evidence of investor sentiment in these markets. The larger the share of Facebook
“Likes” attributable to the home team, the more favorable odds or point spreads set by
bookmakers on those matches, even when controlling for the relative strengths of the two
teams involved and other unobservable heterogenous factors that affect prices set in sports
betting markets. Our results suggest that for every one percentage point increase in the
difference in the share of Facebook “Likes” for the home team, bookmakers make the home
team a stronger favorite, or less of an underdog, by an additional 0.1 points in betting on
NBA games and 0.6 points in betting on NFL games. In betting on matches in top European
domestic football leagues, betting odds are adjusted to increase the implied bookmaker
probability of a home win by 0.6 percentage points for each one percentage point increase in
relative Facebook “Likes” for the home team. These changes in prices suggest the presence of
investor sentiment in these markets, and support the previous results in the literature using
3
attendance-based indicators for investor sentiment. An analysis of bet outcomes suggests
that these changes in prices are not large enough to generate excess profits for bettors;
the probability of a bet placed on the home team winning does not appear to be related
to relative differences in Facebook “Likes.” Our results suggest the presence of investor
sentiment is broader than indicated by previous research, as prices in betting markets for
five top European domestic leagues and two major North American professional leagues
reflect the presence of investor sentiment. Our results also support the results from earlier
studies that use attendance-based proxies for the presence of investor sentiment using a more
broad-based indicator, Facebook “Likes.”
II LITERATURE REVIEW
Sports is a good empirical setting for examining economic and organizational phenomena
that are difficult to detect in other settings (Day et al., 2012; Kahn, 2000; Wolfe et al.,
2005). In the literature, sports betting markets have been identified as “simple financial
markets” (Sauer, 1998, p. 2021) containing well defined outcomes (i.e., wins and losses)
and clear ending times (start of the game or match). In fact, Sauer (1998) remarked that
sports wagering markets provide a more simplistic and clearer view regarding issues related
to pricing than other industries. Within sports betting markets, a bookmaker sets the price.
This price is either in the form of a point spread, common in sports where scoring is frequent,
or betting odds, common in lower scoring sporting events. In leagues where odds betting is
common, the bettor places a bet on the outcome of the match. Conversely, a bettor wagering
on a match using point spreads will wager on the expected margin of victory, not the actual
outcome.
Historically, the assumption regarding bookmaking behavior was prices set by the book-
makers balance the money value of bets of each side of the bet (commonly called the “bal-
anced book hypothesis”). With this behavior by bookmakers, they could pay the winning
bets from the money from the losing bet. The profit that is remaining is the commission, com-
4
monly called the “vig” or “over-round”, that the bookmaker collected from all the bettors.
Levitt (2004) and other more recent research (Paul and Weinbach, 2008; Humphreys, 2010;
Kain and Logan, In press) challenged the traditional balanced book assumption. Rather
than setting a point spread to maximize the total money bet on each side of a point spreads,
this body of research concluded that bookmakers took a position regarding the outcome of
the match and “exploit[ed] bettors’ biases” (Levitt, 2004, p. 226). Furthermore, recent re-
search by Kain and Logan (In press) stated that bookmakers could develop riskier strategies
depending on their own risk tolerance while still accounting for the bettor sentiment. The
risk for bookmakers with attempting to exploit investor sentiment is that informed bettors
could bet a large amount of money against these biases. Research by Gandar, Dare, Brown,
and Zuber (1998) found that informed traders influenced the opening point spread set by
bookmakers as well as the movement in the point spread from the opening line until the
closing line. This large wager by informed bettors could result in large losses for the book-
makers and threaten their gambling operation. Thus, bookmakers need to recognize bettor
biases which they can exploit to make a larger profit. However, bookmakers need to be
cognizant of the informed bettors within the gambling market and their potential to exploit
point spreads/betting lines if the bookmaker attempts to extract too large of a profit due to
investor sentiment.
Investor sentiment can be broadly defined as “any nonmaximizing trading pattern among
noise traders that can be attributed to a particular exogenous motivation” (Avery and Cheva-
lier, 1999, p. 493). Two major sources of sentiment identified by Avery and Chevalier (1999)
are unanticipated and anticipated. Unanticipated sentiment, resulting in the price of the
asset shifting away from the true market value of that asset, is generally attributed to an
unanticipated demand shock. Conversely, anticipated sentiment is known to all parties within
the market prior to the completion of trading. According to Avery and Chevalier (1999),
unanticipated sentiment affects the position of the demand curve. They identified specific
conditions that can affect the demand curve of an asset like a bet on a sporting event. These
5
conditions included dynamic uncertainty, myopic pricing, irrationality of the market maker,
defined in sports betting markets as book makers underestimating the power and degree
that the particular sentiment has in the market, price discrimination, and composition of
the market in terms of informed and uniformed bettors.
Overall, Brown and Sauer (1993b) identified fundamental factors, like investor biases,
that could influence point spreads and betting odds in professional sports betting markets.
These various fundamental factors are all potential sources of investor sentiment bias. Much
of the early research on sports betting markets focused on market efficiency (Sauer, 2005),
in particular documenting the existence of the favorite/longshot bias. Golec and Tamarkin
(1991) analyzed point spread betting on both National Football League (NFL) and college
football games and found that significant biases existed in the NFL betting market against
home teams and for favorites. There was no evidence in their study that biases were not
found in the college football betting market. More recently, Sinkey and Logan (2012) ex-
amined price setting in US college football and found that bookmakers tended to overprice
favorites who had been successful in beating the point spread in recent games. In European
football, Kuypers (2000) found that bookmakers offered lower odds against the team that
was considered the favorite in the match in order to take advantage of biased bettors who
miscalculated the strength of the favorite. Additionally, evidence for the reverse favorite-
longshot bias has been found in both Major League Baseball (Woodland and Woodland,
1994, 2003) and the National Hockey League (Woodland and Woodland, 2001). The reverse
favorite-longshot bias states that bettors favor the favorites in the betting lines compared to
the longshots.
Another bias is the“hot hand.” The “hot hand” is a phenomenon where bettors mis-
understand the randomness of events such as winning and losing streaks by sports teams.
Camerer (1989) examined the influence of the “hot hand” on point spreads for NBA games
from 1983-1986. He hypothesized that teams with winning streaks would have point-spreads
set too high, and teams on losing streaks would have point spreads set too low, by book
6
makers. His results agreed with these two hypotheses. However, the changes in the point
spreads were not large enough to be exploited by the betting public into a profitable bet-
ting strategy. Brown and Sauer (1993a) criticized Camerer’s (1989) results stating that
his conclusion was based on the incorrect premise regarding the “hot hand” pheonomenon.
However, Brown and Sauer (1993a) concluded that the hot hand phenomenon was real in
the sense that winning and losing streaks influenced the point-spreads set by book makers in
the NBA. More recent research by Paul and Weinbach (2005) supported Brown and Sauer’s
(1993a) conclusions by showing that the betting public overbets NBA teams that are on
winning streaks.
Sentiment due to the popularity of teams and/or individuals also affects bettors decisions
and prices offered by bookmakers. Forrest and Simmons (2008, p. 120) defined this type
of sentiment as “different returns to betting according to whether one wagers on more or
less glamorous teams.” Forsythe, Rietz, and Ross (1999) developed evidence that bettors
in political prediction markets purchased “shares” of the candidates of the political party in
which they were affiliated. Strumpf (2003) found in an analysis of illegal sports betting in
New York City that gamblers were more likely to bet on the local teams, such as the New
York Yankees, compared to other teams. Avery and Chevalier (1999) found in their study
of NFL games that bettors bet on teams that were covered more in the media.
Based on data from European football (soccer), empirical evidence can be found that
bookmakers account for bettor sentiment, in terms of the popularity of certain teams or
countries. For example, Forrest and Simmons (2008) identified bettor sentiment in their
examination of betting on Spanish and Scottish football. Using the difference in average
attendance from each team’s previous season as measure of sentiment, they concluded that
betting odds were more favorable for the more popular team in the observed match. Based
on an analysis of betting on English football matches, Franck, Verbeek, and Nuesch (2011)
developed evidence supporting the findings of Forrest and Simmons (2008). In addition,
Franck et al. (2011) examined the impact of weekday versus weekend matches on investor
7
sentiment. These results showed that more favorable odds were offered on weekend matches.
The authors hypothesized this difference was due to the increased number of casual bettors
participating in the betting market for weekend games compared to weekend games. Finally,
Braun and Kvasnicka (2013) found evidence of biases in the prices that bookmakers offered
for a country’s national football team games. The results from their research supported two
types of bias. The first is perception bias, which is the confidence of the bettors that their
home country will win. The second type is loyalty bias, which is described as wagers on the
national team to win due to the loyalty of bettors to their home country.
In summary, bookmakers have to recognize various biases in order to set point spreads
or betting odds to offer on a game or match. Recent research suggested that bookmakers
try to exploit these various biases, which can be interpreted as a form of investor sentiment.
Academic research has examined many biases including favorites, underdogs, the “hot hand”
phenomena, and the popularity of teams. Baker and Wurgler (2006) noted that the relevant
question for future research examining sentiment bias is not whether sentiment has an effect
on prices, but rather how to measure investor sentiment more accurately and ascertain its
effects on the market. This paper extends the research on sentiment bias by developing a
novel measure of the presence of biased bettors based on social media data. This new measure
reflects the presence of investor sentiment more accurately in sports betting markets.
Social Media
The use of the internet and, by extension, social media web sites and services provides
opportunities for researchers to study phenomena that they were not able to study in the
past (Edelman, 2012b). The use of the internet to gather information allowed researchers
to analyze phenomena like pricing for sporting events (Drayer et al., 2012; Shapiro and
Drayer, 2012, e.g.,), pricing by online merchants (Brown and Goolsbee, 2002; Chevalier and
8
Goolsbee, 2003, e.g.,), market volatility (Edelman, 2012a), and search costs (Brynjolfsson
et al., 2011).1
Social media has also provided researchers with access to information that would be
otherwise difficult to obtain. Edelman (2012b, p. 196) observed:
“The Internet’s newest services also facilitate research on users’ views of com-
panies and organizations. Every company and organization page on Facebook
includes a “like” button, and Facebook, Google, and others now let sites present
“like,” “+1,” and similar buttons to garner user endorsements. The number
and/or identity of users clicking these buttons is often available to researchers
and the interested public–facilitating research about trends and trendsetters, re-
action to news, and more”
Specifically in regards to sentiment bias in betting markets, previous research measured
the popularity of teams in the forms of attendance at games (e.g., Forrest and Simmons,
2008; Franck et al., 2011; Feddersen et al., 2013). This popularity measure may not fully
provide researchers with a measure of popularity. For example, a person living in the United
States may be a fan of the Arsenal Football Club but may never attend a match and, thus,
would not be reflected in an attendance-based measure of team popularity. The use of social
media, such as Facebook and Twitter, to determine popularity provides an opportunity to
better measure a team’s popularity and thus the presence of bettors with sentiment bias.
For the present research, we use Facebook “Likes” as the measure of bettor sentiment. As
reported by the company in March 2013, Facebook has 1.11 billion users around the world
(Associated Press, 2013). On the Facebook website, a user has an opportunity to “Like” a
particular event or business. According to the Facebook help page, “When you click ‘Like’
on a Facebook Page, in an advertisement, or on content off of Facebook, you are making
1See Edelman (2012b) for additional information on the use of data from social media in economicresearch.
9
a connection.”2 This connection extends to businesses. According to Wallace, Wilson, and
Miloch (2011), the Facebook company launched a Page feature, allowing businesses and
other organizations to communicate with Facebook users. In addition to launching the Page
feature, the company also allowed Facebook users to connect with businesses through the
“Like” feature. This “Like” feature on Facebook is what we use to examine sentiment bias
in the betting market of sports leagues in both North America and Europe. As it is free for
Facebook Users to not only participate by “liking” a particular organization or business but
also remove their “liking” of a particular organization or business at any time, it seems to
be an appropriate proxy for the size of a team’s fan base and the number of bettors who
might exhibit sentiment bias toward the team.
III EMPIRICAL ANALYSIS
Empirical Strategy
One key element in the analysis of sentiment bias in betting markets is to identify observable
factors likely to be associated with the presence of investor sentiment. It is especially difficult
to find an appropriate observable indicator which can be included in regression models of the
determination of prices and bet outcomes in betting markets. In previous research, various
proxy variables have been used. Avery and Chevalier (1999), for example, used expert
opinions, performance in the previous year, and conference affiliation as proxy variables for
the presence of bettors with sentiment bias in NFL betting markets. Forrest and Simmons
(2008) used the difference in mean home attendance in the previous season between the two
teams participating in a given football match in the Spanish and Scottish top divisions. The
indicator for the presence of bettors with sentiment bias used by Feddersen et al. (2013) is
the difference in the percent of seating capacity filled in the two team’s home arenas in the
previous season in the NBA.
2Retrieved from: http://www.facebook.com/help/131263873618748/?q=Like&sid=0POJmFTevPsrjBwzO.
10
As pointed out by Feddersen et al. (2013), these proxies can be criticized in two ways.
First, attendance based measures of the presence of sentiment bias might only be a local
measure of the popularity of the teams. If these proxies only capture local popularity,
they might strongly depend on the market potential of the surrounding region, while biased
bettors might exist in a broader area or even national- or world-wide. Furthermore, stadium
attendance and capacity utilization can be influenced more or less by the team by, for
example, reducing ticket prices or intensifying promotional activities. Based on this critique,
Feddersen et al. (2013) derived two criteria for a measure of popularity as a proxy for the
existence of bettors with sentiment bias, which might be better suited than attendance
based measures. The proxy variables should be (a) not only a local measure and (b) not
under direct control of the teams. Consequently, they identify data from social media (e.g.
Facebook “Likes” or Twitter followers) as an obvious measure of team popularity. However,
in their analysis, they do not use such data due to unavailability during their observation
period. Embracing their suggestion, the present research employs data from social media –
Facebook “Likes” – to reflect the number of bettors with sentiment bias in the market.
Similar to Forrest and Simmons (2008), the present research looks for evidence of sen-
timent bias in both the prices set by bookmakers, and in betting market outcomes. We
estimate reduced form models of the determination of betting lines, which are either based
on bookmaker probabilities implied by fixed odds or point spreads, in seven professional
team sports leagues in Europe and North America. Furthermore, reduced form models of
the outcomes of bets, based on a dichotomous dependent variable the is equal to one if a
bet on that team won, are estimated using a probit model. Both empirical models include
variables that proxy for the presence of bettors with sentiment bias in the market. The sign
of the estimated parameters on these variables will be statistically significant if bettors with
sentiment bias bet on these games, or if book makers believe such bettors are present.
11
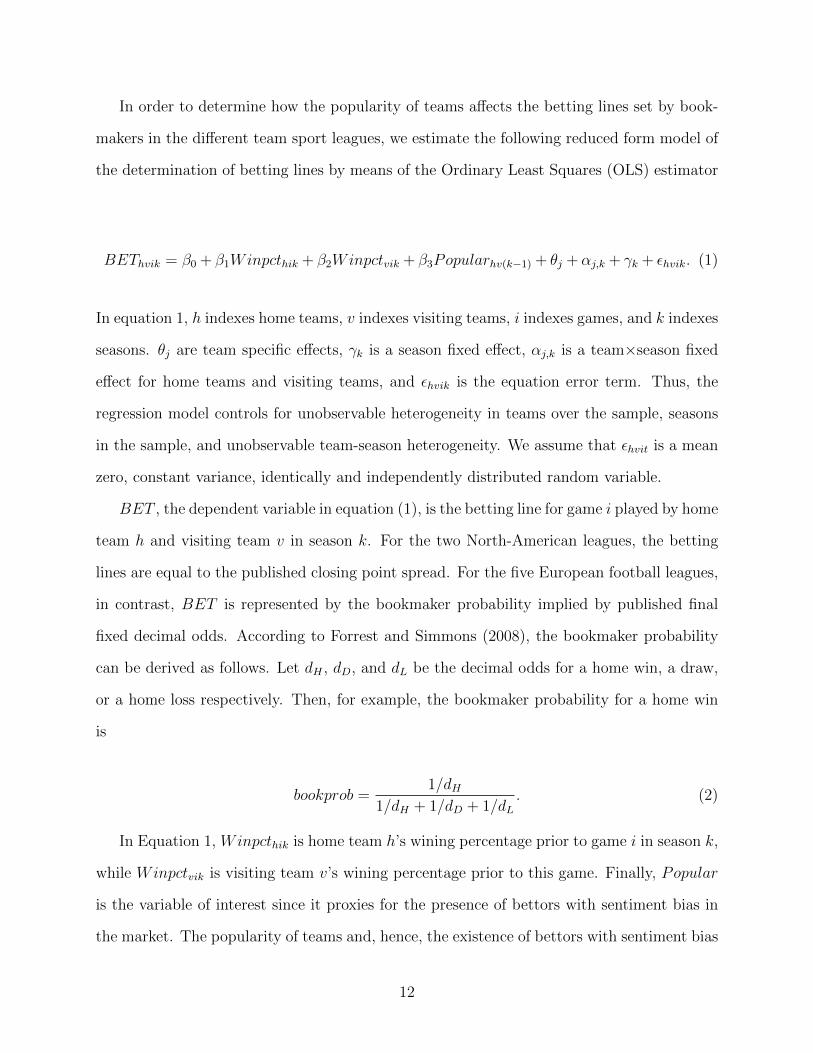
In order to determine how the popularity of teams affects the betting lines set by book-
makers in the different team sport leagues, we estimate the following reduced form model of
the determination of betting lines by means of the Ordinary Least Squares (OLS) estimator
BEThvik = β0 + β1Winpcthik + β2Winpctvik + β3Popularhv(k−1) + θj + αj,k + γk + εhvik. (1)
In equation 1, h indexes home teams, v indexes visiting teams, i indexes games, and k indexes
seasons. θj are team specific effects, γk is a season fixed effect, αj,k is a team×season fixed
effect for home teams and visiting teams, and εhvik is the equation error term. Thus, the
regression model controls for unobservable heterogeneity in teams over the sample, seasons
in the sample, and unobservable team-season heterogeneity. We assume that εhvit is a mean
zero, constant variance, identically and independently distributed random variable.
BET , the dependent variable in equation (1), is the betting line for game i played by home
team h and visiting team v in season k. For the two North-American leagues, the betting
lines are equal to the published closing point spread. For the five European football leagues,
in contrast, BET is represented by the bookmaker probability implied by published final
fixed decimal odds. According to Forrest and Simmons (2008), the bookmaker probability
can be derived as follows. Let dH , dD, and dL be the decimal odds for a home win, a draw,
or a home loss respectively. Then, for example, the bookmaker probability for a home win
is
bookprob =1/dH
1/dH + 1/dD + 1/dL. (2)
In Equation 1, Winpcthik is home team h’s wining percentage prior to game i in season k,
while Winpctvik is visiting team v’s wining percentage prior to this game. Finally, Popular
is the variable of interest since it proxies for the presence of bettors with sentiment bias in
the market. The popularity of teams and, hence, the existence of bettors with sentiment bias
12
should be reflected in data from social media and, in particular, by the difference in Facebook
“Likes” for each team. Since the number of members, the general usage, and the utilization
as a marketing tool by professional sport teams of the social media platform Facebook
is still growing, we use the relative difference in Likes instead of the absolute difference.
Therefore, the share of the Facebook “Likes” for each team is calculated compared to the
league average at the beginning of season k. To capture the relative difference in popularity
of the two teams competing in game i in season k, the variable Popular is defined as the
difference in these shares of the Facebook “Likes”. As this difference in Facebook “Likes”
increases, we hypothesize that more bettors with sentiment bias toward the team with the
larger number of Facebook “Likes”’ exist in the betting market.
Data
The data set used in the following empirical analysis is based on game data from both
European and North American team sports leagues, which is augmented by betting lines
and information from social media. The data set for the European leagues includes every
regular season game played in the so-called “big five” domestic football leagues (England,
France, Germany, Italy, and Spain) for two seasons (2011-12 and 2012-13). Both game
data and fixed decimal betting odds were gathered from http://www.football-data.co.uk.
Although the mentioned website provides betting data from many bookmakers, we limit
our analysis to one of them (bet365 ) because betting odds from this bookmaker is available
for all games from the European leagues within our sample. The North-American data set
contains data on regular season games for two seasons from the NBA (2011-12 and 2012-
13) and one season from the NFL (2012-13). Game data for these leagues were collected
from Sports Reference. Point spreads were collected from Goldsheet. Finally, the Facebook
“‘Likes”, which are – as described above – employed to capture the popularity of the teams,
have been collected from the clubs’ official Facebook pages at the beginning of each regular
season for all seven leagues in the sample. Overall, there were 6,127 games played in the
13
seven leagues. By far, the most games in the sample occurred in the NBA (2,219). Four of
the European football leagues consist of 20 teams (England, France, Italy, and Spain). Based
on the balanced double round robin format, where each team plays each team twice, 760
games have been played within the sample period. Accordingly, 612 games can be observed
during the same time period for the German “Bundesliga”, which consist of 18 teams in the
two seasons. Finally, only 256 NFL games are included into the data set because information
on the number of Facebook “Likes” has only been collected for the 2012-13 season.
Table 1 presents the summary statistics for each of the seven leagues. For all leagues,
both the mean home and away team winning percentage prior to playing the observed game
was around 0.500. The average bookmaker probability for a home win ranges between 44.9%
for the French league and 46.8% for the Spanish league. Table 1 contains also the absolute
difference of the share of Facebook “Like”. The mean of this difference is quite similar in all
five European football leagues lying between 8.0% (France) and 9.4% (Spain). The minimum
is around zero for all leagues, while the maximum ranges from 41.8% for the French league
and 59.6% for the Italian league. In the North American leagues, the average point spread
was −3.194 in the NBA and −2.428 in the NFL, meaning that the home team was just over
a three point favorite to win the games in the NBA and about a 2.5 point favorite in the
NFL respectively. Furthermore, the home team covered 49.5% of the time and 1.7% of the
NBA games in the sample were a push. In the NFL, approximately 46.1% of the games
were covered by the home team, while only 0.8% of the games were a push. Compared to
the European football leagues, the maximum values of the absolute difference in Facebook
“Likes” share is lower for the NBA with 27.4% and remarkably lower for the NFL with only
9.6%. Also the standard deviation of this measure is lower for the North American leagues
with 2.4% and 6.9% compared to the European leagues ranging from 11.8% to 19.2%. This
might lead to the assumption that the distribution of team popularity is more skewed to the
most popular teams in the European football leagues compared to the NBA and NFL.
14
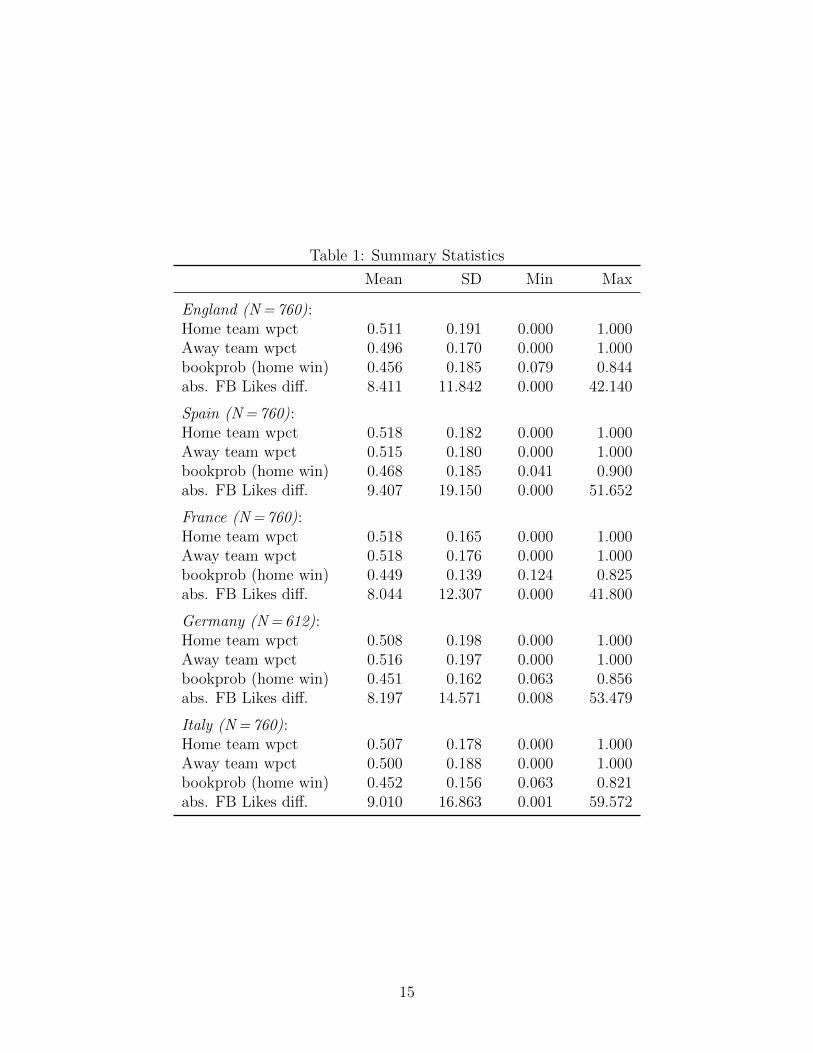
Table 1: Summary Statistics
Mean SD Min Max
England (N = 760):Home team wpct 0.511 0.191 0.000 1.000Away team wpct 0.496 0.170 0.000 1.000bookprob (home win) 0.456 0.185 0.079 0.844abs. FB Likes diff. 8.411 11.842 0.000 42.140
Spain (N = 760):Home team wpct 0.518 0.182 0.000 1.000Away team wpct 0.515 0.180 0.000 1.000bookprob (home win) 0.468 0.185 0.041 0.900abs. FB Likes diff. 9.407 19.150 0.000 51.652
France (N = 760):Home team wpct 0.518 0.165 0.000 1.000Away team wpct 0.518 0.176 0.000 1.000bookprob (home win) 0.449 0.139 0.124 0.825abs. FB Likes diff. 8.044 12.307 0.000 41.800
Germany (N = 612):Home team wpct 0.508 0.198 0.000 1.000Away team wpct 0.516 0.197 0.000 1.000bookprob (home win) 0.451 0.162 0.063 0.856abs. FB Likes diff. 8.197 14.571 0.008 53.479
Italy (N = 760):Home team wpct 0.507 0.178 0.000 1.000Away team wpct 0.500 0.188 0.000 1.000bookprob (home win) 0.452 0.156 0.063 0.821abs. FB Likes diff. 9.010 16.863 0.001 59.572
15
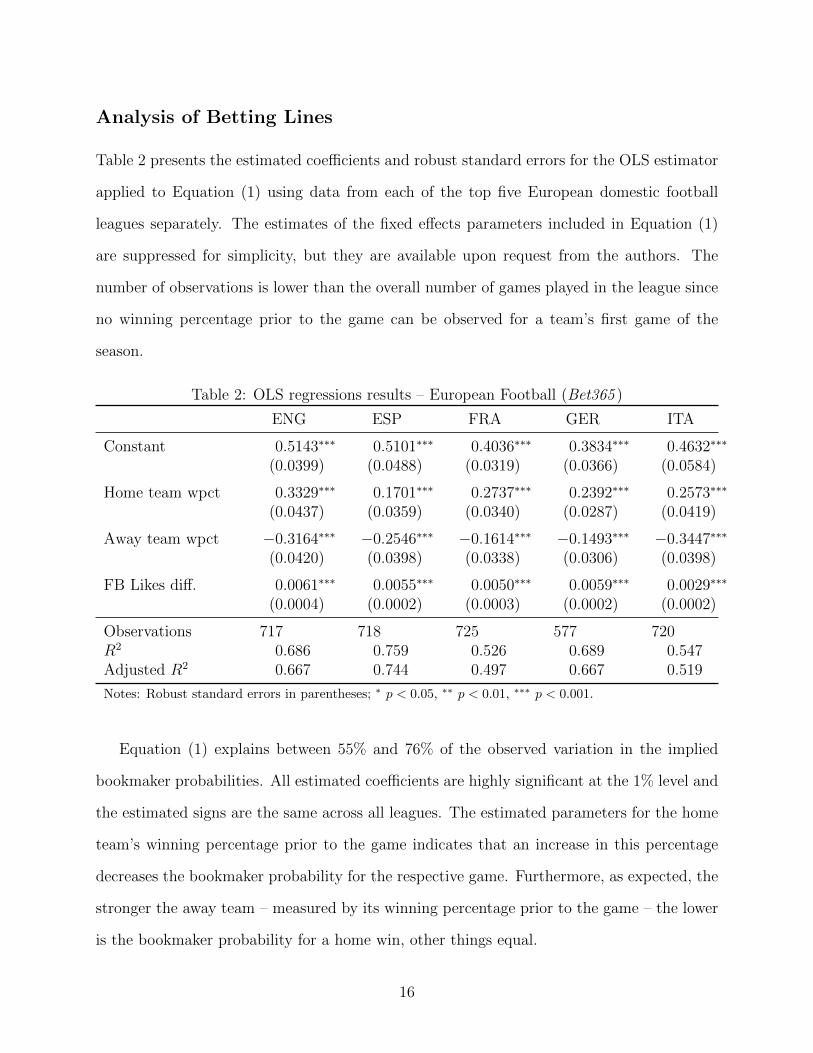
Analysis of Betting Lines
Table 2 presents the estimated coefficients and robust standard errors for the OLS estimator
applied to Equation (1) using data from each of the top five European domestic football
leagues separately. The estimates of the fixed effects parameters included in Equation (1)
are suppressed for simplicity, but they are available upon request from the authors. The
number of observations is lower than the overall number of games played in the league since
no winning percentage prior to the game can be observed for a team’s first game of the
season.
Table 2: OLS regressions results – European Football (Bet365 )
ENG ESP FRA GER ITA
Constant 0.5143∗∗∗ 0.5101∗∗∗ 0.4036∗∗∗ 0.3834∗∗∗ 0.4632∗∗∗
(0.0399) (0.0488) (0.0319) (0.0366) (0.0584)
Home team wpct 0.3329∗∗∗ 0.1701∗∗∗ 0.2737∗∗∗ 0.2392∗∗∗ 0.2573∗∗∗
(0.0437) (0.0359) (0.0340) (0.0287) (0.0419)
Away team wpct −0.3164∗∗∗ −0.2546∗∗∗ −0.1614∗∗∗ −0.1493∗∗∗ −0.3447∗∗∗
(0.0420) (0.0398) (0.0338) (0.0306) (0.0398)
FB Likes diff. 0.0061∗∗∗ 0.0055∗∗∗ 0.0050∗∗∗ 0.0059∗∗∗ 0.0029∗∗∗
(0.0004) (0.0002) (0.0003) (0.0002) (0.0002)
Observations 717 718 725 577 720R2 0.686 0.759 0.526 0.689 0.547Adjusted R2 0.667 0.744 0.497 0.667 0.519
Notes: Robust standard errors in parentheses; ∗ p < 0.05, ∗∗ p < 0.01, ∗∗∗ p < 0.001.
Equation (1) explains between 55% and 76% of the observed variation in the implied
bookmaker probabilities. All estimated coefficients are highly significant at the 1% level and
the estimated signs are the same across all leagues. The estimated parameters for the home
team’s winning percentage prior to the game indicates that an increase in this percentage
decreases the bookmaker probability for the respective game. Furthermore, as expected, the
stronger the away team – measured by its winning percentage prior to the game – the lower
is the bookmaker probability for a home win, other things equal.
16
Our variable of interest is, as described above, the difference in the share of Facebook
“Likes” for a given team compared to the league total at the beginning of each regular season.
For example, if in the 2011-12 season Manchester United had 42% of all Facebook “Likes” in
the English Premier League and Arsenal accounted for 17%, then Popular is equal to 25 for
a match at Old Trafford; if Arsenal is the home team in this match, Popular would be equal
to −25. From Table 2, in the case of the English Premier League, for every one percentage
point increase in the difference of the Facebook “Likes” in favor of the home team, the
bookmaker probability of a home win is increased by 0.6 percentage points. It appears that
bookmakers adjust the bookmaker probability or more precisely the underlying betting odds
based upon the relative popularity of the teams competing in a given game when popularity
is measured by the difference in fans’ attachments expressed on Facebook, holding constant
the quality of the teams playing in the match. This result can be interpreted as evidence that
investor sentiment is present in the big five European football leagues and that bookmakers
adjust the odds on matches to account for this. The results in 2 supports the findings of
both Forrest and Simmons (2008) for Spanish and Scottish football and Franck et al. (2011)
for English football.
Table 3: OLS regressions results – US Major Leagues
NBA NFL
Constant −2.9262∗∗ −2.8980(1.0171) (2.2627)
Home team wpct −17.3675∗∗∗ −9.3768∗∗∗
(1.0476) (1.9621)
Away team wpct 18.4800∗∗∗ 10.5671∗∗∗
(1.0347) (1.7322)
Popular −0.1147∗∗∗ −0.6061∗∗∗
(0.0098) (0.0878)
Observations 2181 240R2 0.661 0.541Adjusted R2 0.652 0.465
Notes: Robust standard errors in parentheses;∗ p < 0.05, ∗∗ p < 0.01, ∗∗∗ p < 0.001.
17
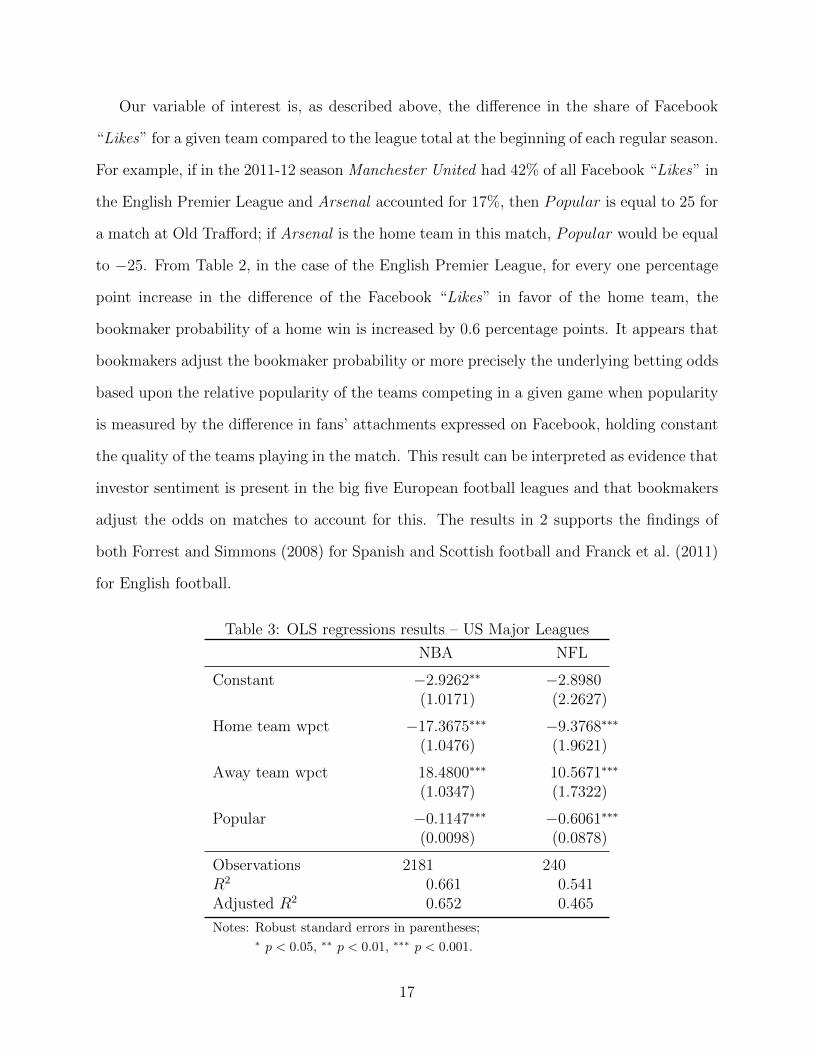
Table 3 contains OLS regression results for Equation (1) with respect to the two major
North American leagues. Like in Table (2), all parameter estimates are significant at the
1% level. Furthermore, the signs of the coefficients show the same and expected sign as in
Table (2). Since the point spread is given from the perspective of the home team, decreases
in the point spread indicates that the home team is a bigger favorite or a smaller underdog.
Accordingly, the estimated coefficient on the home team’s winning percentage prior to the
game suggest that an increasing winning percentage of the home team decreases the point
spread as expected. Similarly, the significantly positive sign of the variable isolating the
effect of the away team’s winning percentage prior to the game indicates that the home team
becomes a bigger favorite (smaller underdog) the stronger the away team is. The estimated
coefficients for the popularity variable are negative for both leagues, indicating that, for
every one percentage point increase of the difference in the share of Facebook “Likes”, the
point spread favors the home team by additional 0.1 points in betting on NBA games and
0.6 points in betting on NFL games. Again, the results show evidence that bookmakers
adjust point spreads based upon the relative popularity of the two teams competing in a
given game. Bettors with sentiment bias appear to exist in betting markets for NBA and
NFL games, which is in line with the findings in Feddersen et al. (2013) in a different setting,
the NBA, and different NFL seasons.
Analysis of Bet Outcomes
The results in the previous section suggest that prices set in sports betting markets (book-
maker probability based on decimal betting odds for European leagues and point spreads
for North American leagues) reflect both the relative strength of the teams in the game as
well as the popularity of the teams, measured by the difference in the shares of Facebook
“Likes” of the two teams. To determine how the changes in prices identified in the previous
section influences the likelihood of a bettor winning a bet placed on team i, the following
probit model is estimated:
18
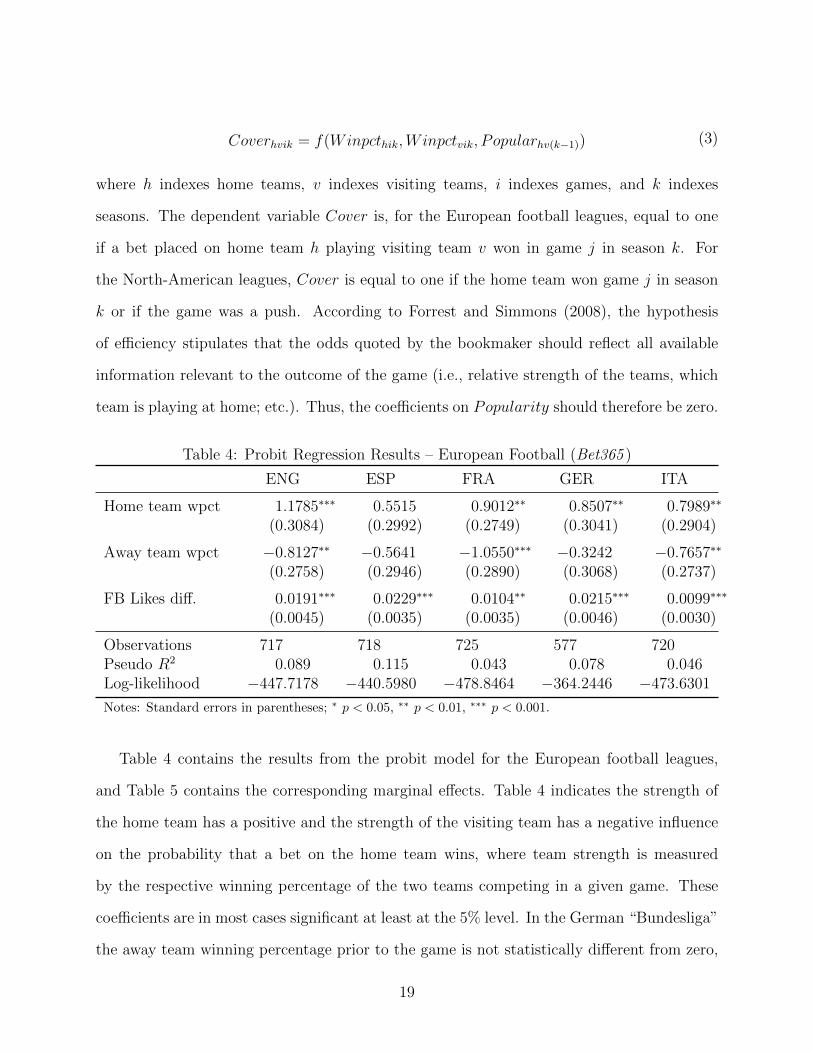
Coverhvik = f(Winpcthik,Winpctvik, Popularhv(k−1)) (3)
where h indexes home teams, v indexes visiting teams, i indexes games, and k indexes
seasons. The dependent variable Cover is, for the European football leagues, equal to one
if a bet placed on home team h playing visiting team v won in game j in season k. For
the North-American leagues, Cover is equal to one if the home team won game j in season
k or if the game was a push. According to Forrest and Simmons (2008), the hypothesis
of efficiency stipulates that the odds quoted by the bookmaker should reflect all available
information relevant to the outcome of the game (i.e., relative strength of the teams, which
team is playing at home; etc.). Thus, the coefficients on Popularity should therefore be zero.
Table 4: Probit Regression Results – European Football (Bet365 )
ENG ESP FRA GER ITA
Home team wpct 1.1785∗∗∗ 0.5515 0.9012∗∗ 0.8507∗∗ 0.7989∗∗
(0.3084) (0.2992) (0.2749) (0.3041) (0.2904)
Away team wpct −0.8127∗∗ −0.5641 −1.0550∗∗∗ −0.3242 −0.7657∗∗
(0.2758) (0.2946) (0.2890) (0.3068) (0.2737)
FB Likes diff. 0.0191∗∗∗ 0.0229∗∗∗ 0.0104∗∗ 0.0215∗∗∗ 0.0099∗∗∗
(0.0045) (0.0035) (0.0035) (0.0046) (0.0030)
Observations 717 718 725 577 720Pseudo R2 0.089 0.115 0.043 0.078 0.046Log-likelihood −447.7178 −440.5980 −478.8464 −364.2446 −473.6301
Notes: Standard errors in parentheses; ∗ p < 0.05, ∗∗ p < 0.01, ∗∗∗ p < 0.001.
Table 4 contains the results from the probit model for the European football leagues,
and Table 5 contains the corresponding marginal effects. Table 4 indicates the strength of
the home team has a positive and the strength of the visiting team has a negative influence
on the probability that a bet on the home team wins, where team strength is measured
by the respective winning percentage of the two teams competing in a given game. These
coefficients are in most cases significant at least at the 5% level. In the German “Bundesliga”
the away team winning percentage prior to the game is not statistically different from zero,
19
while for the Spanish “Primera Division’ both coefficients are not statistically different from
zero.
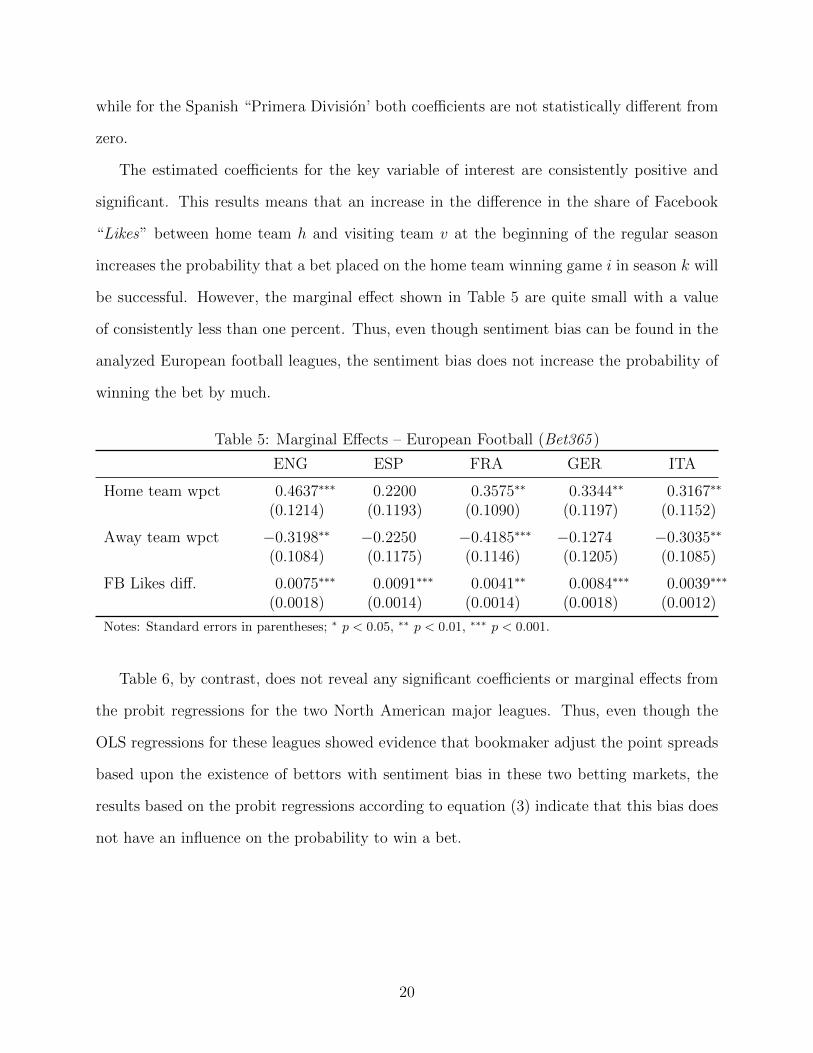
The estimated coefficients for the key variable of interest are consistently positive and
significant. This results means that an increase in the difference in the share of Facebook
“Likes” between home team h and visiting team v at the beginning of the regular season
increases the probability that a bet placed on the home team winning game i in season k will
be successful. However, the marginal effect shown in Table 5 are quite small with a value
of consistently less than one percent. Thus, even though sentiment bias can be found in the
analyzed European football leagues, the sentiment bias does not increase the probability of
winning the bet by much.
Table 5: Marginal Effects – European Football (Bet365 )
ENG ESP FRA GER ITA
Home team wpct 0.4637∗∗∗ 0.2200 0.3575∗∗ 0.3344∗∗ 0.3167∗∗
(0.1214) (0.1193) (0.1090) (0.1197) (0.1152)
Away team wpct −0.3198∗∗ −0.2250 −0.4185∗∗∗ −0.1274 −0.3035∗∗
(0.1084) (0.1175) (0.1146) (0.1205) (0.1085)
FB Likes diff. 0.0075∗∗∗ 0.0091∗∗∗ 0.0041∗∗ 0.0084∗∗∗ 0.0039∗∗∗
(0.0018) (0.0014) (0.0014) (0.0018) (0.0012)
Notes: Standard errors in parentheses; ∗ p < 0.05, ∗∗ p < 0.01, ∗∗∗ p < 0.001.
Table 6, by contrast, does not reveal any significant coefficients or marginal effects from
the probit regressions for the two North American major leagues. Thus, even though the
OLS regressions for these leagues showed evidence that bookmaker adjust the point spreads
based upon the existence of bettors with sentiment bias in these two betting markets, the
results based on the probit regressions according to equation (3) indicate that this bias does
not have an influence on the probability to win a bet.
20
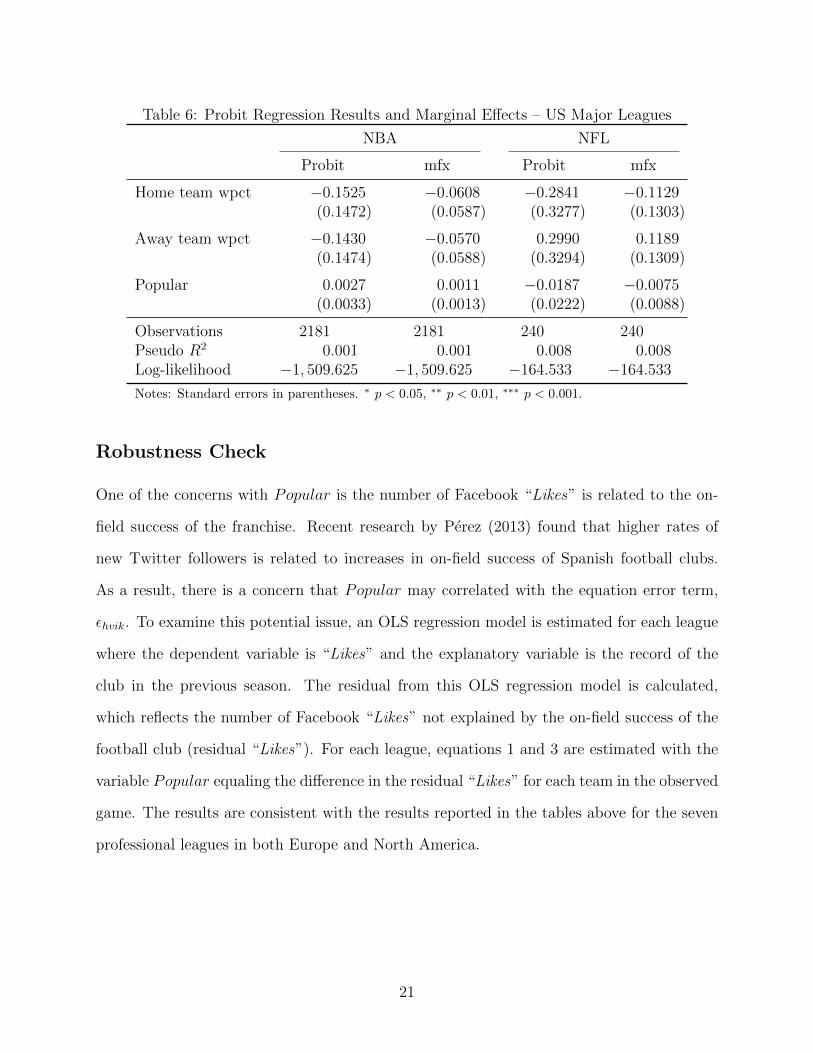
Table 6: Probit Regression Results and Marginal Effects – US Major Leagues
NBA NFL
Probit mfx Probit mfx
Home team wpct −0.1525 −0.0608 −0.2841 −0.1129(0.1472) (0.0587) (0.3277) (0.1303)
Away team wpct −0.1430 −0.0570 0.2990 0.1189(0.1474) (0.0588) (0.3294) (0.1309)
Popular 0.0027 0.0011 −0.0187 −0.0075(0.0033) (0.0013) (0.0222) (0.0088)
Observations 2181 2181 240 240Pseudo R2 0.001 0.001 0.008 0.008Log-likelihood −1, 509.625 −1, 509.625 −164.533 −164.533
Notes: Standard errors in parentheses. ∗ p < 0.05, ∗∗ p < 0.01, ∗∗∗ p < 0.001.
Robustness Check
One of the concerns with Popular is the number of Facebook “Likes” is related to the on-
field success of the franchise. Recent research by Perez (2013) found that higher rates of
new Twitter followers is related to increases in on-field success of Spanish football clubs.
As a result, there is a concern that Popular may correlated with the equation error term,
εhvik. To examine this potential issue, an OLS regression model is estimated for each league
where the dependent variable is “Likes” and the explanatory variable is the record of the
club in the previous season. The residual from this OLS regression model is calculated,
which reflects the number of Facebook “Likes” not explained by the on-field success of the
football club (residual “Likes”). For each league, equations 1 and 3 are estimated with the
variable Popular equaling the difference in the residual “Likes” for each team in the observed
game. The results are consistent with the results reported in the tables above for the seven
professional leagues in both Europe and North America.
21
IV CONCLUSIONS
Previous research indicated that sentiment bias existed in sports betting markets for English
Premier League (Franck et al., 2011), Spanish “Primera Division” and Scottish Premier
League matches (Forrest and Simmons, 2008) in Europe, and NBA games (Feddersen et al.,
2013) in North America. Common to all of these papers is the assumption that the existence
of investor sentiment in betting markets is reflected in differences in attendance or capacity
utilization at home games of the two teams competing in a given game. When discussing
the robustness of their results, Feddersen et al. (2013) discussed several limitations of using
attendance-based proxies for the presence of investor sentiment. Although they highlight the
usefulness of data from social media platforms, they draw on all star game voting to construct
an alternative proxy for team popularity in the absence of availability of the according social
media data. We use information on Facebook “Likes” collected for teams participating in five
European football leagues (England, France, Germany, Italy, Spain) and two North American
major leagues (NBA, NFL). For almost all leagues, besides the information gathered from
Facebook, game specific and betting data for two seasons (2011-12 and 2012-23) have been
used in the empirical analysis.3 This analysis is among the first employing social media
data, a broader measure of team popularity that avoids many of the problems associated
with using attendance data to capture the presence of investor sentiment.
Based on separate OLS and probit estimations, we develop evidence suggesting that the
popularity of teams in the seven analyzed leagues based on the number of Facebook “Likes”
influenced the betting lines set by the bookmakers. The results indicate that bookmakers
adjust the betting lines due to the existence of bettors with sentiment bias. However, the
analysis of bet outcomes reveals that knowledge of this behavior cannot be exploited by
bettors since the sentiment bias does not increase the probability of winning the bet by
3The analysis of the NFL betting market is only based on the 2012-13 season, since the number ofFacebook “Likes” have not been collected.
22
much. These results are robust when controlling for the on-field success of teams leading to
an increase in social media followers.
The results presented here raise interesting questions about the operations of bookmakers,
which still seems to be largely unexamined in academic research on sports betting market
outcomes. The fact that bookmakers offer more favorable betting lines to bettors with
sentiment bias lead to the assumption that this behavior might increase the profits earned
by the bookmaker. This would be the case if offering these more favorable betting lines
on popular teams may induce more fans of these teams to bet on the respective game
and, thus, generate imbalanced betting on popular teams (Feddersen et al., 2013). That
unbalanced betting exist in the case of the NBA has been shown by Paul and Weinbach
(2008). Furthermore, Humphreys (2010) showed that unbalanced betting on NFL games
lead to higher bookmaker profits than balanced betting. Although the probability of a
bet placed on a team that generates significant sentiment bias is not more likely to win,
betting volumes and thus bookmaker profits might be. A full assessment of the effect of
this “shading” of lines and betting odds on bookmaker profits requires data on bet volume,
which we currently lack access to. Further research should also focus on betting volumes
and not just betting odds or point spreads to better understand the effects of sentiment bias
in betting markets.
References
Associated Press. “Number of active users at Facebook over the years.” Yahoo! News, 2013.
http://news.yahoo.com/number-active-users-facebook-over-230449748.html(n.p).
Avery, C. and J. Chevalier. “Identifying Investor Sentiment from Price Paths: The Case of
Football Betting.” Journal of Business, 72(4), (1999), 493–521.
Baker, M. and J. Wurgler. “Investor Sentiment and the Cross-Section of Stock Returns.”
Journal of Finance, 61(4), (2006), 1645–1680.
23
Braun, S. and M. Kvasnicka. “National Sentiment and Economic Behavior: Evidence From
Online Betting on European Football.” Journal of Sports Economics, 14(1), (2013), 45–64.
Brown, J. R. and A. Goolsbee. “Does the Internet Make Markets More Competitive? Ev-
idence from the Life Insurance Industry.” Journal of Political Economy, 110(3), (2002),
481–507.
Brown, W. O. and R. Sauer. “Does the Basketball Market Believe in the Hot Hand? Com-
ment.” American Economic Review, 83(5), (1993a), 1377–1386.
———. “Fundamentals or Noise? Evidence from the Professional Basketball Betting Mar-
ket.” Journal of Finance, 48(4), (1993b), 1193–1209.
Brynjolfsson, E., Y. J. Hu, and D. Simester. “Goodbye Pareto Principle, hello long tail: The
effect of search costs on the concentration of product sales.” Management Science, 57(8),
(2011), 1373–1386.
Camerer, C. F. “Does the Basketball Market Believe in the ‘Hot Hand’?” American
Economic Review, 79(5), (1989), 1257–61.
Chevalier, J. and A. Goolsbee. “Measuring Prices and Price Competition Online: Ama-
zon.com vs. BarnesandNoble.com.” Quantitative Marketing and Economics, 1(2), (2003),
203–222.
Day, D. V., S. Gordon, and C. Fink. “The Sporting Life: Exploring Organizations through
the Lens of Sport.” Academy of Management Annals, 6(1), (2012), 397–433.
Drayer, J., D. A. Rascher, and C. D. McEvoy. “An examination of underlying consumer
demand and sport pricing using secondary market data.” Sport Management Review,
15(4), (2012), 448–460.
Edelman, B. “Earnings and ratings at Google Answers.” Economic Inquiry, 50(2), (2012a),
309–320.
24
———. “Using Internet Data for Economic Research.” Journal of Economic Perspectives,
26(2), (2012b), 189–206.
Feddersen, A., B. R. Humphreys, and B. P. Soebbing. “Sentiment Bias in the National
Basketball Association.”, 2013.
Forrest, D. and R. Simmons. “Sentiment in the betting market on Spanish football.” Applied
Economics, 40(1), (2008), 119–126.
Forsythe, R., T. Rietz, and T. Ross. “Wishes, Expectations and Actions: Price Formation in
Election Stock Markets.” Journal of Economic Behavior and Organization, 39(1), (1999),
83–110.
Franck, E., E. Verbeek, and S. Nuesch. “Sentimental Preferences and Organizational Regime
of Betting Markets.” Southern Economic Journal, 78(2), (2011), 502–518.
Gandar, J. M., W. H. Dare, C. R. Brown, and R. A. Zuber. “Informed Traders and Price
Variations in the Betting Market for Professional Basketball Games.” Journal of Finance,
53(1), (1998), 385–401.
Golec, J. and M. Tamarkin. “The Degree of Inefficiency in the Football Betting Market.”
Journal of Financial Economics, 30(2), (1991), 311–323.
Humphreys, B. R. “Point spread shading and behavioral biases in NBA betting markets.”
Rivista di Diritto ed Economia dello Sport, 6(1), (2010), 13–26.
Kahn, L. M. “The Sports Business as a Labor Market Laboratory.” Journal of Economic
Perspectives, 14(3), (2000), 75–94.
Kain, K. J. and T. D. Logan. “Are sports betting markets prediction markets? Evidence
from a new test.” Journal of Sports Economics.
Kuypers, T. “Information and Efficiency: An empirical study of a fixed odds betting market.”
Applied Economics, 32(11), (2000), 1353–1363.
25
Lee, C., A. Shleifer, and R. H. Thaler. “Investor sentiment and the closed-end fund puzzle.”
Journal of Finance, 46(1), (1991), 75–109.
Levitt, S. “Why are gambling markets organised so differently from financial markets?”
Economic Journal, 114(495), (2004), 223–246.
Paul, R. J. and A. P. Weinbach. “Bettor Misconceptions in the NBA: The overbetting of
large favorites and the “hot hand”.” Journal of Sports Economics, 6(4), (2005), 390–400.
———. “Price Setting in the NBA Gambling Market: Tests of the Levitt Model of Sports-
book Behavior.” International Journal of Sport Finance, 3(3), (2008), 137–145.
Perez, L. “What drives the number of new Twitter followers? An economic note and a case
study of professional soccer teams.” Economics Bulletin, 33(3), (2013), 1941–1947.
Sauer, R. “The Economics of Wagering Markets.” Journal of Economic Literature, 36(4),
(1998), 2021–2064.
Sauer, R. D. “The State of Research on Markets for Sports Betting and Suggested Future
Directions.” Journal of Economics and Finance, 29(3), (2005), 416–426.
Shapiro, S. L. and J. Drayer. “A new age of demand-based pricing: An examination of
dynamic ticket pricing and secondary market prices in Major League Baseball.” Journal
of Sport Management, 26(6), (2012), 532–546.
Sinkey, M. and T. Logan. “Does the Hot Hand Drive the Market? Evidence from Betting
Markets.” Tech. rep., Working Paper. University of West Georgia, 2012.
Strumpf, C. S. “Illegal sports bookmakers.”, 2003. Available at: http://www.unc.edu/
∼cigar/.
Wallace, L., J. Wilson, and K. Miloch. “Sporting Facebook: A Content Analysis of NCAA
Organizational Sport Pages and Big 12 Conference Athletic Department Pages.” Intern-
tional Journal of Sport Communication, 4(4), (2011), 422–444.
26
Wolfe, R. A., K. E. Weick, J. M. Usher, J. R. Terborg, L. Poppo, A. J. Murrell, J. M.
Dukerich, D. C. Core, K. E. Dickson, and J. S. Jourdan. “Sport and organizational
studies.” Journal of Management Inquiry, 14(2), (2005), 182.
Woodland, L. M. and B. M. Woodland. “Market efficiency and the favorite-longshot bias:
The baseball betting market.” Journal of Finance, 49(1), (1994), 269–280.
———. “Market efficiency and profitable wagering in the National Hockey League: Can
bettors score on longshots?” Southern Economic Journal, 67(4), (2001), 983–995.
———. “The Reverse Favourite-Longshot Bias and Market Efficiency in Major League
Baseball: An Update.” Bulletin of Economic Research, 55(2).
27