sentiment analysis of smartphone … analysis of smartphone product review using support vector...
TRANSCRIPT
Journal of Theoretical and Applied Information Technology 15
th September 2016. Vol.91. No.1
© 2005 - 2016 JATIT & LLS. All rights reserved.
ISSN: 1992-8645 www.jatit.org E-ISSN: 1817-3195
189
SENTIMENT ANALYSIS OF SMARTPHONE PRODUCT
REVIEW USING SUPPORT VECTOR MACHINE
ALGORITHM-BASED PARTICLE SWARM
OPTIMIZATION
1MOCHAMAD WAHYUDI,
2DINAR AJENG KRISTIYANTI
1,2Sekolah Tinggi Manajemen Informatika dan Komputer (STMIK Nusa Mandiri)
E-mail: [email protected],
ABSTRACT
Nowdays, social media gives the very large effect to the digital improvement in terms of global
communications. It can be seen from the increasing of consumers opinion and review about smartphone
product that they write on various social media. So that can be recognized various sentiments about the
product either positive, negative or neutral. Sentiment analysis is a computational study of the opinions,
behaviors and emotions of people toward the entity. The entity describes the individuals, events or topics.
That topics generally could be the review of diverse datasets, one of it is a product review.
www.gsmarena.com is one of the website that provides information of smartphone products review.
Reexamination of smartphone product review by classifiying it into positive and negative class is the good
way to find out the consumers response of the products quickly and properly. From some techniques of
classifications, the most often used is Support Vector Machine (SVM). SVM are able to identify the
sparated hyperplane which maximize margin two different classes. However SVM is lack of electing
appropriate parameters or features. Election features and setting parameter at SVM significantly affecting
the results of accuracy classifications. Therefore, in this research used the merger method election features,
namely Particle Swarm Optimization in order to increase the classifications accuracy Support Vector
Machine. This research produces classifications text in the positive or negative of smartphone products
review. The evaluation was done by using 10 Fold Cross Validation. While the measurement accuracy is
measured by Confusion Matrix and ROC curve. The result showed an increasing in accuracy SVM of
82.00% to 94.50%.
Keywords: Particle Swarm Optimization, Review, Sentiment Analysis, Support Vector Machines, Text
Classification.
1. INTRODUCTION
Trend development of cell phone is a cell phone
which is much more smart (or commonly called
smartphone) by its nature intricate and easy to use. Due to the evolving nature of mobile technology,
the boundaries between "smart" and "dumb" an
increasingly unclear phones (Litchfield, 2010). It is
predicted that by 2019, there will be approximately
5.6 billion smartphone users, which will produce 10
Exabyte (1018 bits) of data flow (Zhang et al.,
2014). The proliferation of the use of smartphones
in recent years due to several factors, including the
functions of the smartphone itself apart as a means
of supporting the work, the nature of smartphone
multitasking, as a means of entertainment,
communication tools are simple and easy to use and
carry anywhere. This is what makes the smartphone
demand by any person and by any circles. The
development of smartphones are increasingly
diverse not only in terms of looks alone but also in
terms of features and specifications ("trend in the
use of smartphones for sharing online world").
The smartphone market has grown increasingly,
not only in the conventional sales but have
penetrated in the online shop. But not all
smartphones have good quality to support the needs
of consumers and it is to be noticed by the
consumer. Before consumers decide to buy a
smartphone, they should know the details of the
specifications and functions of the smartphone, it
can be learned from the testimony and opinion or
the results of a review of smartphone users.
Currently consumers who write opinion and
experience online is increasing. If the consumers
read the whole review it can spend much times. But
if it is read without some evaluation it will be

Journal of Theoretical and Applied Information Technology 15
th September 2016. Vol.91. No.1
© 2005 - 2016 JATIT & LLS. All rights reserved.
ISSN: 1992-8645 www.jatit.org E-ISSN: 1817-3195
190
biased. Sentiment classification aims to overcome
this problem by automatically classifying user
review be positive or negative opinion (Z. Zhang ,
et al., 2011).
Sentiment analysis or opinion mining is the
computational study of the opinions, attitudes and
emotions of the entity. The entity may describe an
individual, event or topic. The topic is likely to be a
review (Medhat, Hassan, & Korashy, 2014).
Classification techniques commonly used for
sentiment analysis including Naïve Bayes reviews,
Support Vector Machines (SVM) and K-Nearest
Neighbor (KNN) (Dehkharghani, et al., 2014).
There are few studies that have been conducted
within the classification sentiment towards the
reviews are available online including, sentiment
analysis on mobile user reviews (Zhang et al.,
2014). Opinion sentiment analysis on movie
reviews using Support Vector Machine classifier
and Particle Swarm Optimization (Basari, et al.,
2013). Sentiment classification at the reviews
online travel destinations using Naïve Bayes
classifier, Support Vector Machines and Character-
Based N-gram model (Ye, Zhang, & Law, 2009).
Sentiment analysis on movie reviews and some
products from Amazon.com using a classifier
Support Vector Machines and Artificial Neural
Network (Moraes, Valiati, & Gaviao Neto, 2013).
Sentiment classification at a restaurant review on
the internet written in Naïve Bayes classifier
Canton use and Support Vector Machines (Z.
Zhang et al., 2011). Social media sentiment
analysis in the Czech Republic using Supervised
Machine Learning (Habernal, Ptacek, &
Steinberger, 2014).
The most often techniques used for data
classification is Support Vector Machines (SVM).
SVM is a supervised learning methods that analyze
the data and identify patterns that are used for
classification (Basari et al., 2013). Support Vector
Machines (SVM) is a special case of a family of
algorithms called regularized linear classification
methods and powerful method to minimize the risk
(Weiss, Indurkhya, & Zhang, 2010). SVM has the
advantage of being able to identify separate hyper
plane that maximizes the margin between two
different classes (Chou et al., 2014). However
Support Vector Machine has a deficiency of the
problem or the parameter selection corresponding
features (Basari et al., 2013). Selection of features
at once setup parameters in SVM significantly
influence the results of classification accuracy
(Zhao, et al., 2011). In certain application
problems, not all of these features are equally
important. Better performance can be achieved by
removing some of the features. Thus, it can be the
removal of noise, data that is irrelevant and
redundant (Zhao et al., 2011).
Particle Swarm Optimization (PSO) is widely
used to solve optimization problems as well as a
feature selection problem (Liu et al., 2011). In
engineering Particle Swarm Optimization (PSO),
there are several ways to perform optimizing
including increased weight attribute (attribute
weight) for all attributes or variables used, selecting
the attribute (attribute selection) and feature
selection. Particle Swarm Optimization (PSO) is an
optimization technique that is very simple to
implement and modify some parameters (Basari et
al., 2013).
In this study Support Vector Machines
algorithm and Particle Swarm Optimization
algorithm as a feature selection method will be
applied by researchers to classify text on
smartphone product reviews in order to improve the
accuracy of sentiment analysis.
2. LITERARY REVIEW
A. Product Review
Website is a forum for diverse opinions. A form
of opinion that has credibility is product reviews.
Websites such as amazon.com encourage users to
give a review (review) (Weiss, Indurkhya, &
Zhang, 2010). The results of the review text mining
can be classified in three categories: positive,
negative and neutral. For example, the following
are examples of product reviews at amazon.com:
Source: (Weiss, Indurkhya, & Zhang, 2010).
Figure 1: Prototype Product Reviews at amazon.com
After analyzed through text mining are obtained
decision rule on the classification review of the
product as follows:
Source: (Weiss, Indurkhya, & Zhang, 2010).
Figure 2: Decision Rules in
Classification Product Reviews at amazon.com
Journal of Theoretical and Applied Information Technology 15
th September 2016. Vol.91. No.1
© 2005 - 2016 JATIT & LLS. All rights reserved.
ISSN: 1992-8645 www.jatit.org E-ISSN: 1817-3195
191
B. Sentiment Analysis
According to Tang in Haddi (Haddi, Liu, & Shi,
2013), sentiment analysis on the review is to
investigate the process of product reviews on the
Internet to determine all the opinion or feelings of a
product. According to Thelwall in Haddi (Haddi,
Liu, & Shi, 2013, sentiment analysis is treated as a
classification task which classifies the orientation
of a text into positive or negative. According to
Mejova in Basari (Basari et al.,2013), the purpose
of the analysis is to determine the behavior
sentiment or opinion of an author with attention to a
particular topic. The behavior could indicate the
reason, opinion or judgment, the tendency
conditions (how the author wants to influence the
reader).
According to Moraes in (Wahyudi and Putri,
2016) measures that are commonly found in text
classification sentiment analysis including:
1) Define the domain of dataset: dataset collection
spanning a domain, for example dataset movie
reviews, dataset review products and others.
2) Pre-processing: the initial processing stage
which is generally carried out by the process of
tokenization, stopwords removal, and
stemming.
3) Transformation: The process of representation
figures calculated from textual data. Binary
representation that is commonly used and only
count the presence or absence of a word in the
document. How many times a word appears in a
document is also used as a weighting scheme of
textual data. The process that is commonly used
is the TF-IDF, Binary Frequency
Transformation and Transformation.
4) Feature Selection: Selection of features (feature
selection) can make the classifier more
efficient/effective by reducing the amount of
data to be analyzed to identify the relevant
features for further processing. Feature selection
method that is usually used is Expert.
C. Feature Selection
Feature selection is one of the most important
factors that may affect the accuracy of classification
because if the dataset contains a number of features,
dimensions of space will be large, degrading the
accuracy of classification (Liu et al., 2011). Feature
selection affects several aspects of the pattern of
classification, classification accuracy, the time
required for learning classification functions, the
amount of sample needed for learning and costs
associated with the features according to Yang and
Honavar in Zhao (Zhao, et al., 2011). Feature
selection is an optimization process to reduce a
large set of great features original to a relatively
small subset of features that are significant to
improve the classification accuracy quickly and
effectively.
D. Particle Swarm Optimization (PSO)
Particle Swarm Optimization (PSO) is widely
used to solve optimization problems as well as a
feature selection problem (Liu et al., 2011).
Optimization is the process of adjusting to the input
or device characteristics, mathematical process, or
experiment to find the minimum or maximum
output results. Input consists of variables, process
or function known as a cost function, the objective
function or the ability to function and the output is
the cost or purpose, if the process is an experiment,
then the variable is the physical input to the
experiment (Haupt and Haupt, 2004). In
engineering Particle Swarm Optimization (PSO),
there are several ways to perform optimizing
including increased weight attribute (attribute
weight) for all attributes or variables used, select
the attribute (attribute selection) and feature
selection. Particle Swarm Optimization (PSO) is an
optimization technique that is very simple to
implement and modify some parameters (Basari et
al., 2013).
E. Support Vector Machine (SVM)
Support Vector Machines (SVM) is a set of
methods related to a method of learning, for both
classification and regression problems (Maimon,
2010). With task-oriented, robust, computationally
tractable nature, SVM has achieved great success
and is considered a state-of-the art classifier current
(Huang, et al., 2008). Two classes of data are
depicted as circles and solid dots presented in this
figure. Intuitively observed, there are many
decisions hyperplanes that can be used to separate
the two groups of data. However, illustrated by
figures have been as favorable to separate the field,
because it contains the maximum margin between
the two classes. Therefore, the goal function of
SVM, a regularization term representing the margin
appears. Moreover, as seen in this figure, only the
full points are called support vectors primarily
determines the separating plane, while the other
points do not contribute to the margin at all. In
other words, only the number of ducks is important
for classification purposes in the SVM framework
and thus should be taken (Huang et al., 2008).
The concept of SVM can be explained simply as
the search for the best hyperplane which serves as a
separator are two classes in the input space. For
dimensional space, the data input x (i = 1...k),
Which belongs to a class 1 or class 2 and the
Journal of Theoretical and Applied Information Technology 15
th September 2016. Vol.91. No.1
© 2005 - 2016 JATIT & LLS. All rights reserved.
ISSN: 1992-8645 www.jatit.org E-ISSN: 1817-3195
192
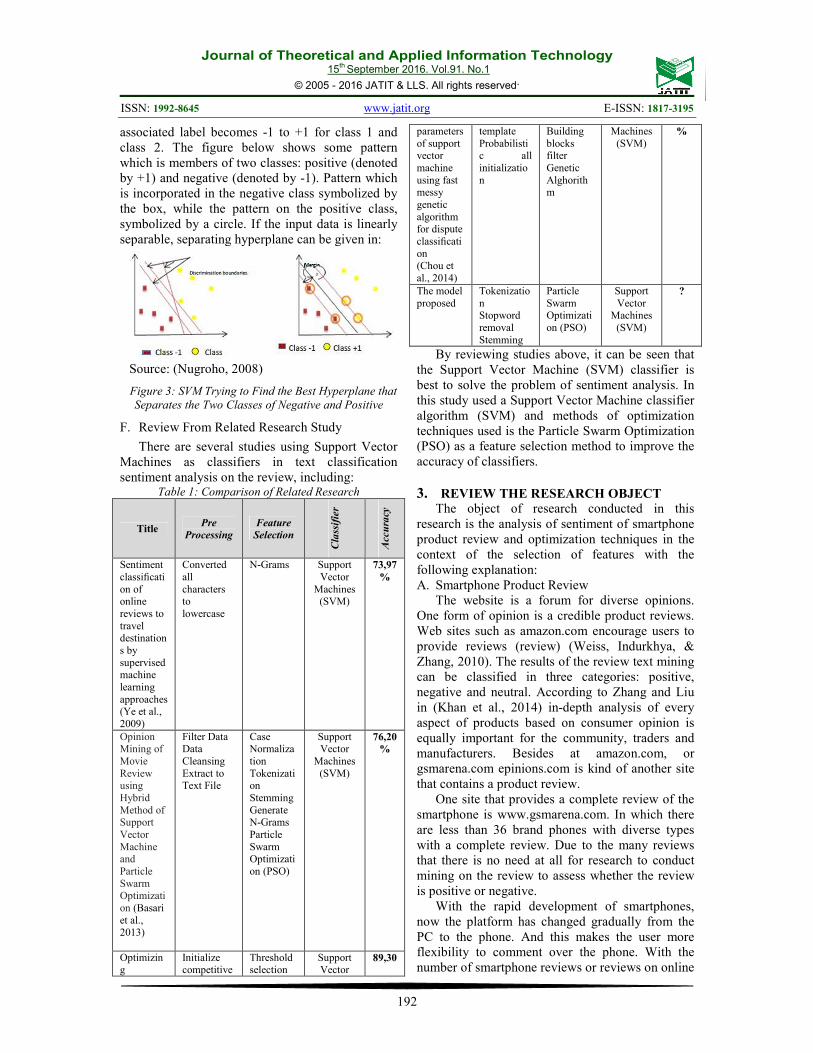
associated label becomes -1 to +1 for class 1 and
class 2. The figure below shows some pattern
which is members of two classes: positive (denoted
by +1) and negative (denoted by -1). Pattern which
is incorporated in the negative class symbolized by
the box, while the pattern on the positive class,
symbolized by a circle. If the input data is linearly
separable, separating hyperplane can be given in:
Source: (Nugroho, 2008)
Figure 3: SVM Trying to Find the Best Hyperplane that
Separates the Two Classes of Negative and Positive
F. Review From Related Research Study
There are several studies using Support Vector
Machines as classifiers in text classification
sentiment analysis on the review, including: Table 1: Comparison of Related Research
Title Pre
Processing
Feature
Selection
Cla
ssif
ier
Accu
racy
Sentiment
classificati
on of online
reviews to
travel destination
s by
supervised machine
learning
approaches (Ye et al.,
2009)
Converted
all
characters to
lowercase
N-Grams Support
Vector
Machines (SVM)
73,97
%
Opinion Mining of
Movie
Review using
Hybrid
Method of Support
Vector
Machine and
Particle
Swarm Optimizati
on (Basari
et al., 2013)
Filter Data Data
Cleansing
Extract to Text File
Case Normaliza
tion
Tokenization
Stemming
Generate N-Grams
Particle
Swarm Optimizati
on (PSO)
Support Vector
Machines
(SVM)
76,20
%
Optimizing
Initialize competitive
Threshold selection
Support Vector
89,30
parameters
of support vector
machine
using fast messy
genetic
algorithm for dispute
classificati
on (Chou et
al., 2014)
template
Probabilistic all
initializatio
n
Building
blocks filter
Genetic
Alghorithm
Machines
(SVM) %
The model
proposed
Tokenizatio
n Stopword
removal
Stemming
Particle
Swarm Optimizati
on (PSO)
Support
Vector Machines
(SVM)
?
By reviewing studies above, it can be seen that
the Support Vector Machine (SVM) classifier is
best to solve the problem of sentiment analysis. In
this study used a Support Vector Machine classifier
algorithm (SVM) and methods of optimization
techniques used is the Particle Swarm Optimization
(PSO) as a feature selection method to improve the
accuracy of classifiers.
3. REVIEW THE RESEARCH OBJECT
The object of research conducted in this
research is the analysis of sentiment of smartphone
product review and optimization techniques in the
context of the selection of features with the
following explanation:
A. Smartphone Product Review
The website is a forum for diverse opinions.
One form of opinion is a credible product reviews.
Web sites such as amazon.com encourage users to
provide reviews (review) (Weiss, Indurkhya, &
Zhang, 2010). The results of the review text mining
can be classified in three categories: positive,
negative and neutral. According to Zhang and Liu
in (Khan et al., 2014) in-depth analysis of every
aspect of products based on consumer opinion is
equally important for the community, traders and
manufacturers. Besides at amazon.com, or
gsmarena.com epinions.com is kind of another site
that contains a product review.
One site that provides a complete review of the
smartphone is www.gsmarena.com. In which there
are less than 36 brand phones with diverse types
with a complete review. Due to the many reviews
that there is no need at all for research to conduct
mining on the review to assess whether the review
is positive or negative.
With the rapid development of smartphones,
now the platform has changed gradually from the
PC to the phone. And this makes the user more
flexibility to comment over the phone. With the
number of smartphone reviews or reviews on online
Journal of Theoretical and Applied Information Technology 15
th September 2016. Vol.91. No.1
© 2005 - 2016 JATIT & LLS. All rights reserved.
ISSN: 1992-8645 www.jatit.org E-ISSN: 1817-3195
193
sites then felt the need to get information from
many data via text mining (Zhang et al., 2014).
B. Selection Feature (Feature Selection)
According to Medhat (Medhat et al., 2014)
tasks of sentiment analysis has been considered as a
classification problem, the first step in a sentiment
calcification problem is to extract and select
features on the text. Here explanation of some of
the current selection of features, including:
1) Terms Presence and Frequance
These features are individual words or N-Gram
and the number of frequencies that often appear
as giving weight to the words into a binary
value (zero if the word message has appeared
and one otherwise), or a weighted frequencies
are istilh to show interest relative to the feature.
2) Part Of Speech (POS)
The discovery of adjectives as it is someone
important indicator of an opinion.
3) Opinion Words and Phrases
Are words commonly used to mengekspersikan
including the opinion of the opinion that good
or bad and like datau hate. From the other side a
few phrases express opinions without using
words opinions.
4) Negations
The emergence of negative words that can
change the orientation of opinion as well not be
on par with the poor.
C. Validation and Evaluation of Data Mining
Algorithms
There are many methods used to validate a
model based on existing data, such as the holdout,
random sub-sampling, cross-validation, stratified
sampling, bootstrap and others. According to Han
(Han & Kamber, 2007) confusion matrix is a very
useful tool to analyze how well the classifier to
recognize bias tuple of a different class. In the
confusion matrix known terms such as True
positives refers to the positive tuple is correctly
labeled by the classifier, while True negative is
negative tuple is correctly labeled by the classifier.
Unisex False positives are negative tuple is
incorrectly labeled by the classifier, and False
negative is positive tuple is incorrectly labeled by
the classifier.
K-fold cross-validation is a validation technique
with initial data randomly split into k sections
mutually exclusive or "fold" (Han & Kamber,
2007). ROC curves will be used to measure the
AUC (Area Under the Curve). ROC curve divides a
positive result in the y-axis and a negative result in
the x-axis (Witten, Frank, & Hall, 2011). Graph
curve ROC (Receiver operating characteristic) is
used to evaluate the accuracy classifier and to
compare the different classification models
(Vercellis, 2009). So the larger the area under the
curve, the better the prediction results.
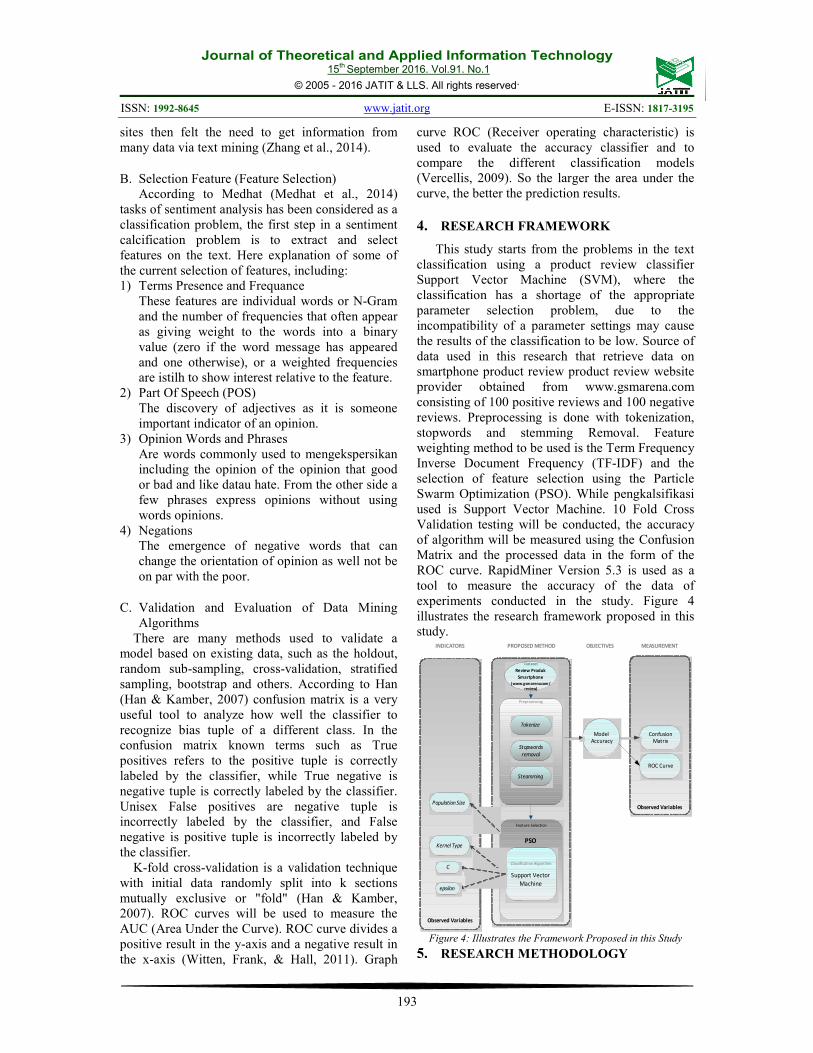
4. RESEARCH FRAMEWORK
This study starts from the problems in the text
classification using a product review classifier
Support Vector Machine (SVM), where the
classification has a shortage of the appropriate
parameter selection problem, due to the
incompatibility of a parameter settings may cause
the results of the classification to be low. Source of
data used in this research that retrieve data on
smartphone product review product review website
provider obtained from www.gsmarena.com
consisting of 100 positive reviews and 100 negative
reviews. Preprocessing is done with tokenization,
stopwords and stemming Removal. Feature
weighting method to be used is the Term Frequency
Inverse Document Frequency (TF-IDF) and the
selection of feature selection using the Particle
Swarm Optimization (PSO). While pengkalsifikasi
used is Support Vector Machine. 10 Fold Cross
Validation testing will be conducted, the accuracy
of algorithm will be measured using the Confusion
Matrix and the processed data in the form of the
ROC curve. RapidMiner Version 5.3 is used as a
tool to measure the accuracy of the data of
experiments conducted in the study. Figure 4
illustrates the research framework proposed in this
study.
Observed Variables
Observed Variables
PROPOSED METHOD OBJECTIVES
Model
Accuracy
MEASUREMENT
Confusion
Matrix
INDICATORS
Population Size
Dataset
Review Produk
Smartphone (www.gsmarena.com/
review)
Feature Selection
PSO
Preprocessing
Tokenize
Stopwords
removal
Steamming
Classification Algorithm
Support Vector
Machine
ROC Curve
Kernel Type
C
epsilon
Figure 4: Illustrates the Framework Proposed in this Study
5. RESEARCH METHODOLOGY
Journal of Theoretical and Applied Information Technology 15
th September 2016. Vol.91. No.1
© 2005 - 2016 JATIT & LLS. All rights reserved.
ISSN: 1992-8645 www.jatit.org E-ISSN: 1817-3195
194
Researchers doing research methods are
experimental research methods, with the following
stages:
A. Design Research
1) Data Collection: Data for this experiment were
collected, and then selected from the data that
does not fit.
2) Initial Processing Data: Model selected based
on the suitability of the data with the best
method of some text classification method that
has been used by previous researchers. The
model used is the algorithm of Support Vector
Machines (SVM).
3) Proposed method: To improve the accuracy of
the algorithm of Support Vector Machines
(SVM), then the addition of the improved
method of optimization that combines Particle
Swarm Optimization (PSO).
4) Experiment and Testing Methods: For
experimental research data, researchers used
Rapid Miner 5.3 to process the data and as an
aid in assessing the accuracy of the data of
experiments conducted in the study.
5) Evaluation and Validation Results: The
evaluation was conducted to determine the
accuracy of the model algorithm Support Vector
Machines. Validation is used to compare the
results of the accuracy of the model used by the
results that have been there before. Validation
technique used is Cross Validation, accuracy
algorithm will be measured using the Confusion
Matrix and the processed data in the form of the
ROC curve.
B. Data Collection
Researchers used data collected smartphone
product review of the site www.gsmarena.com. The
data consists of 100 positive reviews and 100
negative reviews. Researchers download the data
from http://www.gsmarena.com.
Examples of positive reviews as follows:
“The Asus PadFone X is one of the best-rounded
high-end propositions available in the Android
realm at the moment. It skillfully blends a powerful
chipset, a good display, and a capable camera into
a solidly built package, thus offering a mighty good
alternative to the established players on the US
market.The device surely is a welcome sight on the
busy smartphone field in the United States by
offering a combination of talents which none of its
direct competitors can exactly match”.
While examples of the negative review as
follows:
“The Samsung Galaxy Mega 6.3 doesn't have a lot
of competition - the good thing is it easily stands
out, the bad is that the lack of devices might be due
to the lack of potential buyers. Not that Samsung
has ever been afraid of exploring uncharted market
territories”.
C. Initial Data Processing
For reducing the time of data processing,
researchers only use 100 positive reviews and 100
negative reviews as data training. This dataset that
in preprocessing should pass 3 steps, they are:
1) Tokenization: collect all the words that appear
and removes any punctuation or symbols that
are not letters.
2) Stopwords Removal: deletion of the words that
are not relevant, such as the, of, for, with, and
so on.
3) Stemming: grouping words into several groups
that have the same root, such as drug, drugged,
and drugs where the root of it all is said drug.
As for the phase transformation by TF-IDF
weighting on each word. Where the process
calculates the presence or absence of a word in
the document. How many times a word appears
in a document is also used as a weighting
scheme of textual data.
D. Proposed Model
Researchers have proposed method is the use of
one (1) type of feature selection method, namely
Particle Swarm Optimization that is used as a
feature selection method that accuracy classifier
Support Vector Machines (SVM) can be increased.
Researchers using Support Vector Machines
classifiers as a machine learning technique that is
popular text classification, and has performed well
in many domains.
E. Evaluation and Validation Results
The model proposed in the study on smartphone
product review is by applying Support Vector
Machines (SVM) and Support Vector Machine
(SVM) based Particle Swarm optimization (PSO).
Application of SVM algorithm to determine the
type of kernel first. Then determine the selection of
parameter C and epsilon right. Having obtained the
AUC values of accuracy and the greatest, that value
will be the value that will be used to find the value
of accuracy and the highest AUC. While the
application of SVM algorithm based on a
determination of the value of the PSO oriented
exact population size. Of the value of the most ideal
accuracy of these parameters, the ideal structure is
formed algorithm for solving the problem.
The following is a confusion matrix display and
calculation formula according Gorunescu (Moraes,
Journal of Theoretical and Applied Information Technology 15
th September 2016. Vol.91. No.1
© 2005 - 2016 JATIT & LLS. All rights reserved.
ISSN: 1992-8645 www.jatit.org E-ISSN: 1817-3195
195
2013):
Accuracy ���
��� � �… �1�
Note ∶ TP ∶ True Possitive, TN ∶ True Negative,
FP ∶ False Possitive, FN ∶ False Negative
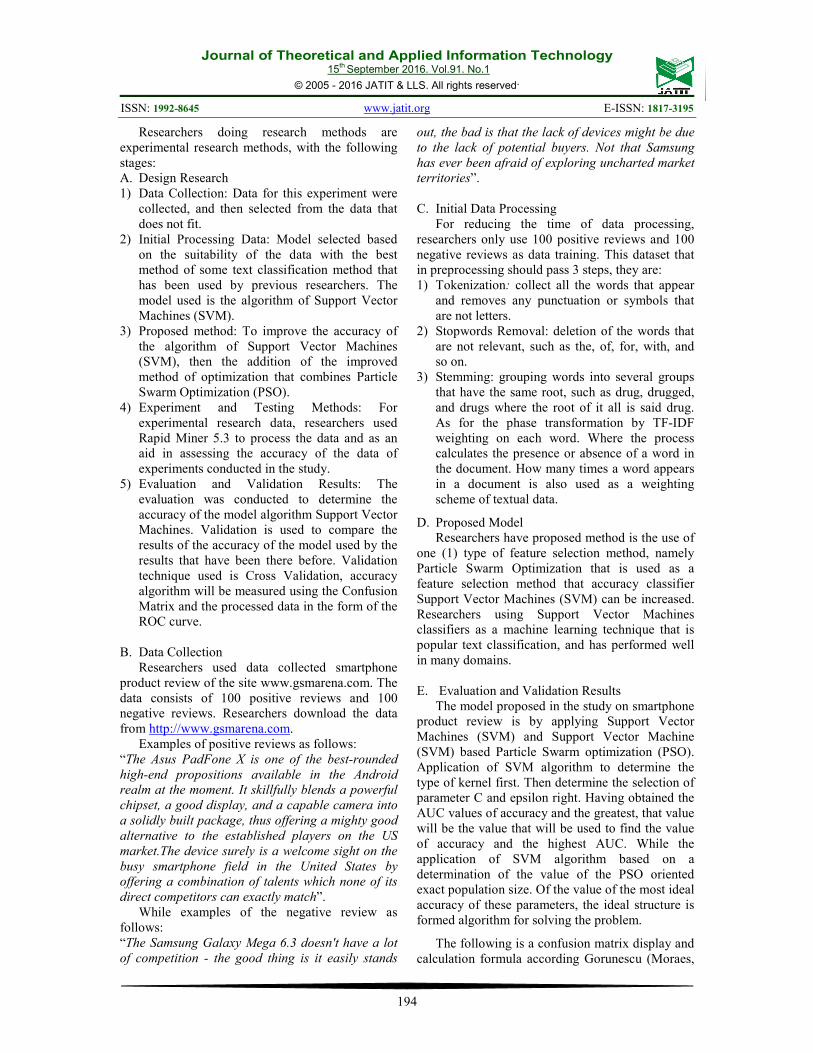
The test method using Cross Validation with the
design model as follows:
Figure 5: Design Model Validation
F. Text Classification Using Support Vector
Machine Algorithm
Training data used in this text classification
consists of 100 smartphone product reviews
positive and 100 negative smartphone product
reviews. The data is still a bunch of separate text in
the form of documents. Before classified, the data
must go through several stages of the process in
order to be classified in the next process, the
following are the stages of the process:
1) Data Collection: Positive review of data
together in a folder with the name of the post.
While the data is negative review unified
storage in the folder with the name neg. Each
extension.txt document that can be opened
using Notepad application.
2) Initial Data Processing: The process through
which consists of tokenization , stopwords
removal and stemming. Table 2: Initial Data Processing
Review Tokenization Stopwords
Removal Stemming
The Samsung
Galaxy Note
is the device we all wish
we had: a
huge high-res screen,
plenty of
processing power, and a
great
camera. But as far as
portability
goes, the Note is closer
to a 7" tablet
than a phone. You could
The Samsung
Galaxy Note
is the device we all wish
we had a
huge high res screen plenty
of processing
power and a great camera
But as far as
portability goes the Note
is closer to a
tablet than a phone You
could carry it
around but it won t feel
Samsung
Galaxy
Note device wish huge
res screen
plenty processing
power
great camera
portability
goes Note closer
tablet
phone carry won t
feel
comfortable jeans shirt
samsung
galaxi note
devic wish huge res
screen plenti
process power great
camera
portabl goe note closer
tablet phone
carri won t feel comfort
jean shirt
carry it
around, but it won't feel
comfortable
in your jeans or shirt
pocket.
comfortable
in your jeans or shirt
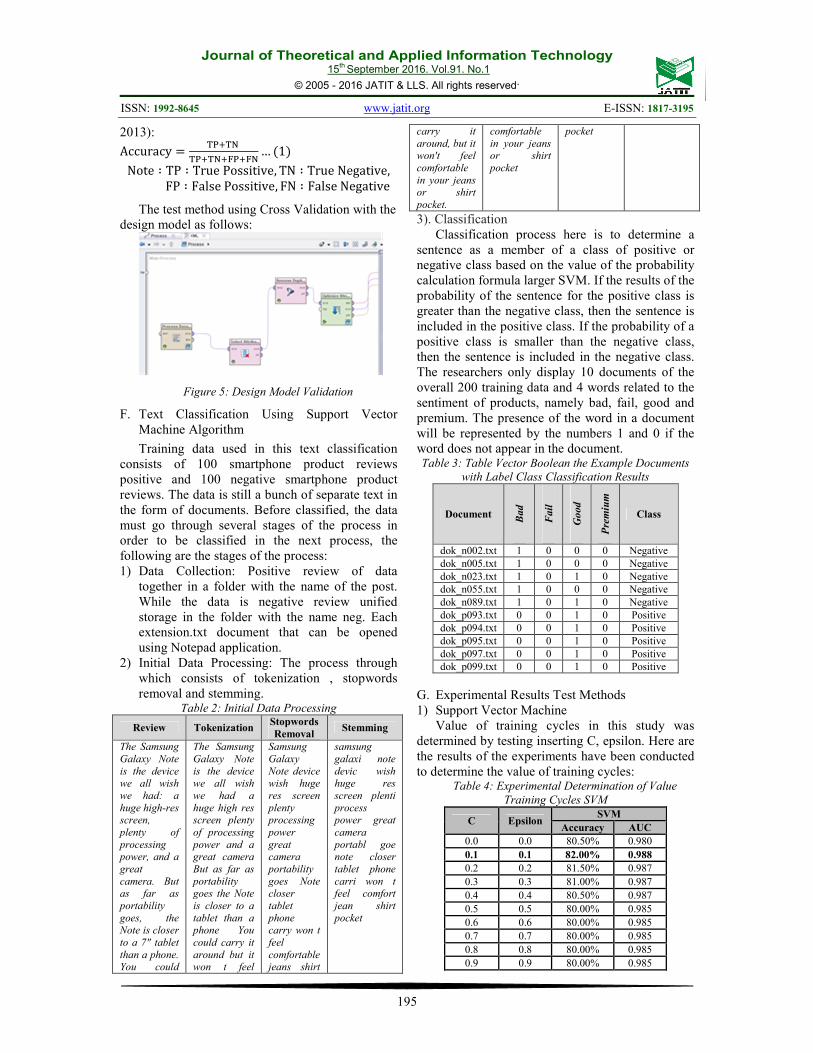
3). Classification
Classification process here is to determine a
sentence as a member of a class of positive or
negative class based on the value of the probability
calculation formula larger SVM. If the results of the
probability of the sentence for the positive class is
greater than the negative class, then the sentence is
included in the positive class. If the probability of a
positive class is smaller than the negative class,
then the sentence is included in the negative class.
The researchers only display 10 documents of the
overall 200 training data and 4 words related to the
sentiment of products, namely bad, fail, good and
premium. The presence of the word in a document
will be represented by the numbers 1 and 0 if the
word does not appear in the document. Table 3: Table Vector Boolean the Example Documents
with Label Class Classification Results
Document B
ad
Fail
Go
od
Pre
miu
m
Class
dok_n002.txt 1 0 0 0 Negative
dok_n005.txt 1 0 0 0 Negative dok_n023.txt 1 0 1 0 Negative dok_n055.txt 1 0 0 0 Negative dok_n089.txt 1 0 1 0 Negative dok_p093.txt 0 0 1 0 Positive
dok_p094.txt 0 0 1 0 Positive dok_p095.txt 0 0 1 0 Positive dok_p097.txt 0 0 1 0 Positive dok_p099.txt 0 0 1 0 Positive
G. Experimental Results Test Methods
1) Support Vector Machine
Value of training cycles in this study was
determined by testing inserting C, epsilon. Here are
the results of the experiments have been conducted
to determine the value of training cycles: Table 4: Experimental Determination of Value
Training Cycles SVM
C Epsilon SVM
Accuracy AUC
0.0 0.0 80.50% 0.980
0.1 0.1 82.00% 0.988
0.2 0.2 81.50% 0.987
0.3 0.3 81.00% 0.987
0.4 0.4 80.50% 0.987
0.5 0.5 80.00% 0.985
0.6 0.6 80.00% 0.985
0.7 0.7 80.00% 0.985
0.8 0.8 80.00% 0.985
0.9 0.9 80.00% 0.985

Journal of Theoretical and Applied Information Technology 15
th September 2016. Vol.91. No.1
© 2005 - 2016 JATIT & LLS. All rights reserved.
ISSN: 1992-8645 www.jatit.org E-ISSN: 1817-3195
196
0.0 1.0 50.00% 0.500
1.0 1.0 50.00% 0.500
1.0 0.0 81.00% 0.987
The best results in the experiments above SVM
is with C = 0.1 and epsilon = 0.1 resulting accuracy
82.00% and AUC 0.988.
2) Support Vector Machine Based on Particle
Swarm Optimization
Value of training cycles in this study was
determined by testing inserting C, epsilon and
population size. Here are the results of the
experiments have been conducted to determine the
value of training cycles: Table 5: Experimental Determination of Value Training
Cycles SVM-Based PSO
C
Ep
silo
n
Po
pu
lati
on
Siz
e SVM SVM+PSO
Accuracy AUC Accuracy AUC
0.0 0.0 5 80.50% 0.980 94.00% 0.976
0.1 0.1 5 82.00% 0.988 92.00% 0.986
0.2 0.2 5 81.50% 0.987 93.00% 0.986
0.3 0.3 5 81.00% 0.987 93.50% 0.984
0.4 0.4 5 80.50% 0.987 94.00% 0.987
0.5 0.5 5 80.00% 0.985 93.50% 0.988
0.6 0.6 5 80.00% 0.985 94.00% 0.987
0.7 0.7 5 80.00% 0.985 93.00% 0.974
0.8 0.8 5 80.00% 0.985 94.50% 0.988
0.9 0.9 5 80.00% 0.985 93.50% 0.987
0.0 1.0 5 50.00% 0.500 93.00% 0.977
1.0 1.0 5 50.00% 0.500 93.50% 0.988
1.0 0.0 5 81.00% 0.987 94.00% 0.976
The best results in the experiments above PSO-
based SVM is with C = 0.8 and Epsilon = 0.8 and
the population size = 5 generated 94.50% accuracy
and AUC 0.988.
H. Results of Testing Model Support Vector
Machine (SVM)
In the determination of the research results of a
review of this smartphone using Support Vector
Machine algorithm in the framework Rapid Miner
as follows:
Figure 6: Model Validation Testing Support Vector
Machine
Value accuracy, precision and recall of training
data can be calculated by using RapidMiner. Test
results using Support Vector Machine models
showed in Table 6.
1) Confusion Matrix
Table 6 training data used consist of 100
positive reviews of data smartphones and 100
negative review of data products smartphone. For
data of the positive smartphones reviews, 88 are
classified into a positive review in accordance with
the predictions made by the method of data
predicted SVM and 12 positive reviews but it turns
out the prediction results of negative reviews. For
data negative reviews smartphones, 76 negative
reviews are classified according to the predictions
made by the method of data predicted SVM and 24
negative reviews prediction result is positive
review. Table 6: Confusion Matrix Model to Support Vector
Machine Method
Accuracy: 82.00%, +/- 8.12% (Micro: 82.00%)
True
Positive
True
Negative
Class
Precission
Predictions Positive 88 24 78.57%
Predictions Negative 12 76 86.36%
Class Recall 88.00% 76.00%
Based on Table 6 shows that, the level of
accuracy by using the SVM algorithm is equal to
82.00%, and can be calculated to find the value of
Accuracy, Sensitivity, Specificity, PPV and NPV
result in the equation below:
Conclusion The results of the calculation of the
above equation shown in Table 7 below:
Journal of Theoretical and Applied Information Technology 15
th September 2016. Vol.91. No.1
© 2005 - 2016 JATIT & LLS. All rights reserved.
ISSN: 1992-8645 www.jatit.org E-ISSN: 1817-3195
197
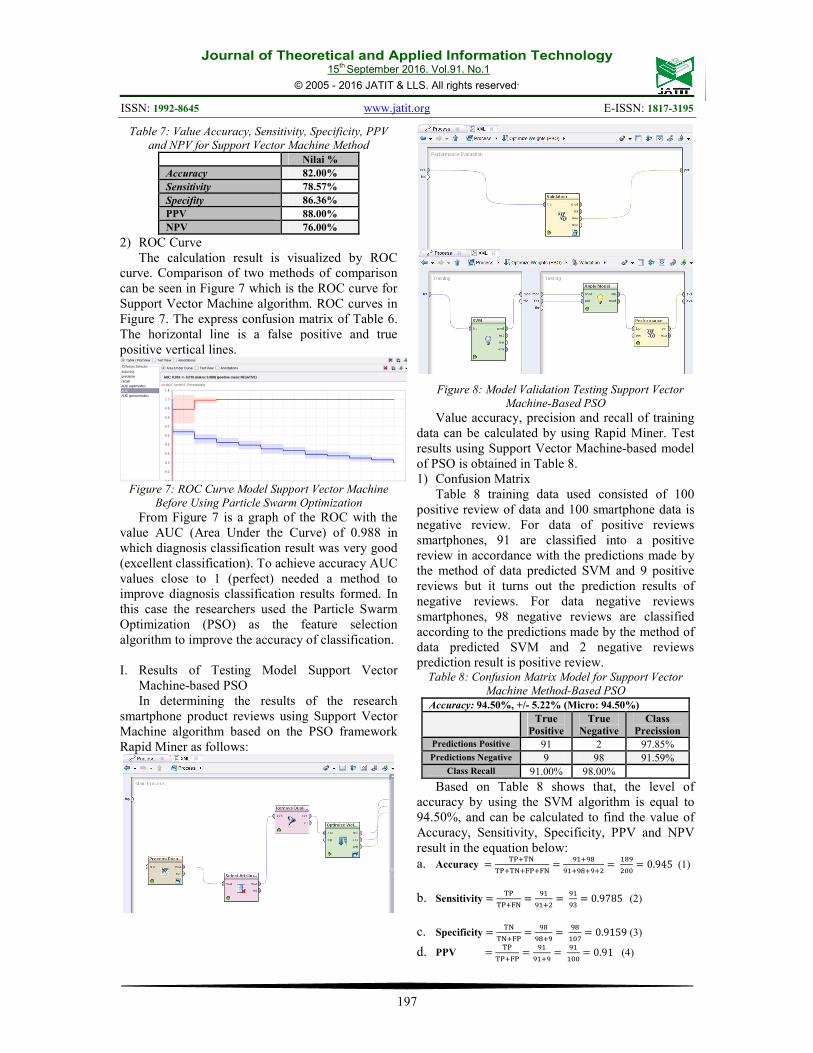
Table 7: Value Accuracy, Sensitivity, Specificity, PPV
and NPV for Support Vector Machine Method
Nilai %
Accuracy 82.00%
Sensitivity 78.57%
Specifity 86.36%
PPV 88.00%
NPV 76.00%
2) ROC Curve
The calculation result is visualized by ROC
curve. Comparison of two methods of comparison
can be seen in Figure 7 which is the ROC curve for
Support Vector Machine algorithm. ROC curves in
Figure 7. The express confusion matrix of Table 6.
The horizontal line is a false positive and true
positive vertical lines.
Figure 7: ROC Curve Model Support Vector Machine
Before Using Particle Swarm Optimization
From Figure 7 is a graph of the ROC with the
value AUC (Area Under the Curve) of 0.988 in
which diagnosis classification result was very good
(excellent classification). To achieve accuracy AUC
values close to 1 (perfect) needed a method to
improve diagnosis classification results formed. In
this case the researchers used the Particle Swarm
Optimization (PSO) as the feature selection
algorithm to improve the accuracy of classification.
I. Results of Testing Model Support Vector
Machine-based PSO
In determining the results of the research
smartphone product reviews using Support Vector
Machine algorithm based on the PSO framework
Rapid Miner as follows:
Figure 8: Model Validation Testing Support Vector
Machine-Based PSO
Value accuracy, precision and recall of training
data can be calculated by using Rapid Miner. Test
results using Support Vector Machine-based model
of PSO is obtained in Table 8.
1) Confusion Matrix
Table 8 training data used consisted of 100
positive review of data and 100 smartphone data is
negative review. For data of positive reviews
smartphones, 91 are classified into a positive
review in accordance with the predictions made by
the method of data predicted SVM and 9 positive
reviews but it turns out the prediction results of
negative reviews. For data negative reviews
smartphones, 98 negative reviews are classified
according to the predictions made by the method of
data predicted SVM and 2 negative reviews
prediction result is positive review. Table 8: Confusion Matrix Model for Support Vector
Machine Method-Based PSO
Accuracy: 94.50%, +/- 5.22% (Micro: 94.50%)
True
Positive
True
Negative
Class
Precission
Predictions Positive 91 2 97.85%
Predictions Negative 9 98 91.59%
Class Recall 91.00% 98.00%
Based on Table 8 shows that, the level of
accuracy by using the SVM algorithm is equal to
94.50%, and can be calculated to find the value of
Accuracy, Sensitivity, Specificity, PPV and NPV
result in the equation below:
a. Accuracy ���
��� � ��
!� "
!� "� �#�
!"
#$$� 0.945 (1)
b. Sensitivity �
� ��
!
!�#�
!
*� 0.9785 (2)
c. Specificity ��
�� �
"
"� �
"
!$-� 0.9159 (3)
d. PPV �
� �
!
!� �
!
!$$� 0.91 (4)
Journal of Theoretical and Applied Information Technology 15
th September 2016. Vol.91. No.1
© 2005 - 2016 JATIT & LLS. All rights reserved.
ISSN: 1992-8645 www.jatit.org E-ISSN: 1817-3195
198
e. NPV ��
�� ��
"
"�#�
"
!$$� 0.98 (5)
Conclusion the results of the calculation of the
above equation shown in Table 9 below: Table 9: Value Accuracy, Sensitivity, Specificity, PPV
and NPV for Support Vector Machine Method-Based
PSO
Nilai %
Accuracy 94.50%
Sensitivity 97.85%
Specifity 91.59%
PPV 91.00%
NPV 98.00%
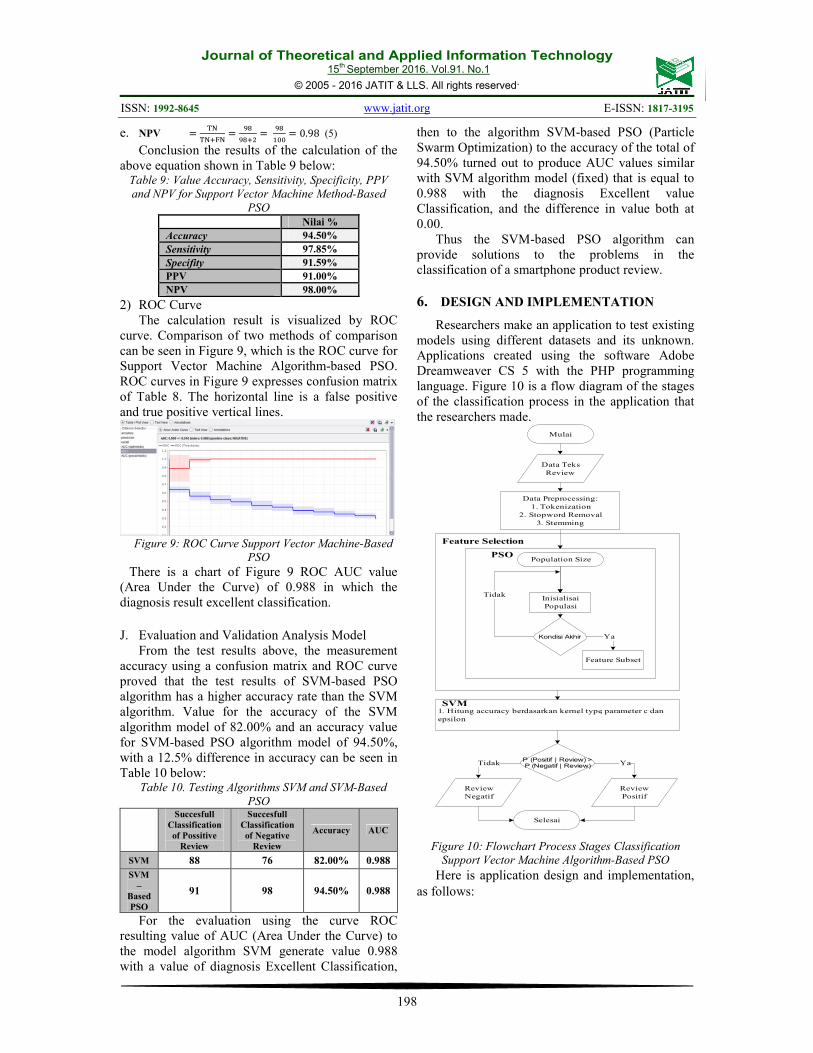
2) ROC Curve
The calculation result is visualized by ROC
curve. Comparison of two methods of comparison
can be seen in Figure 9, which is the ROC curve for
Support Vector Machine Algorithm-based PSO.
ROC curves in Figure 9 expresses confusion matrix
of Table 8. The horizontal line is a false positive
and true positive vertical lines.
Figure 9: ROC Curve Support Vector Machine-Based
PSO
There is a chart of Figure 9 ROC AUC value
(Area Under the Curve) of 0.988 in which the
diagnosis result excellent classification.
J. Evaluation and Validation Analysis Model
From the test results above, the measurement
accuracy using a confusion matrix and ROC curve
proved that the test results of SVM-based PSO
algorithm has a higher accuracy rate than the SVM
algorithm. Value for the accuracy of the SVM
algorithm model of 82.00% and an accuracy value
for SVM-based PSO algorithm model of 94.50%,
with a 12.5% difference in accuracy can be seen in
Table 10 below: Table 10. Testing Algorithms SVM and SVM-Based
PSO
Succesfull
Classification
of Possitive
Review
Succesfull
Classification
of Negative
Review
Accuracy AUC
SVM 88 76 82.00% 0.988
SVM
–
Based
PSO
91 98 94.50% 0.988
For the evaluation using the curve ROC
resulting value of AUC (Area Under the Curve) to
the model algorithm SVM generate value 0.988
with a value of diagnosis Excellent Classification,
then to the algorithm SVM-based PSO (Particle
Swarm Optimization) to the accuracy of the total of
94.50% turned out to produce AUC values similar
with SVM algorithm model (fixed) that is equal to
0.988 with the diagnosis Excellent value
Classification, and the difference in value both at
0.00.
Thus the SVM-based PSO algorithm can
provide solutions to the problems in the
classification of a smartphone product review.
6. DESIGN AND IMPLEMENTATION
Researchers make an application to test existing
models using different datasets and its unknown.
Applications created using the software Adobe
Dreamweaver CS 5 with the PHP programming
language. Figure 10 is a flow diagram of the stages
of the classification process in the application that
the researchers made.
Mulai
Data Teks
Review
Data Preprocessing:
1. Tokenization
2. Stopword Removal
3. Stemming
Feature Selection
PSOPopulation Size
Inisialisai
Populasi
Kondisi Akhir Ya
Feature Subset
Tidak
1. Hitung accuracy berdasarkan kernel type, parameter c dan
epsilon
SVM
P (Positif | Review) > P (Negatif | Review) YaTidak
Review
Positif
Review
Negatif
Selesai
Figure 10: Flowchart Process Stages Classification
Support Vector Machine Algorithm-Based PSO
Here is application design and implementation,
as follows:
Journal of Theoretical and Applied Information Technology 15
th September 2016. Vol.91. No.1
© 2005 - 2016 JATIT & LLS. All rights reserved.
ISSN: 1992-8645 www.jatit.org E-ISSN: 1817-3195
199
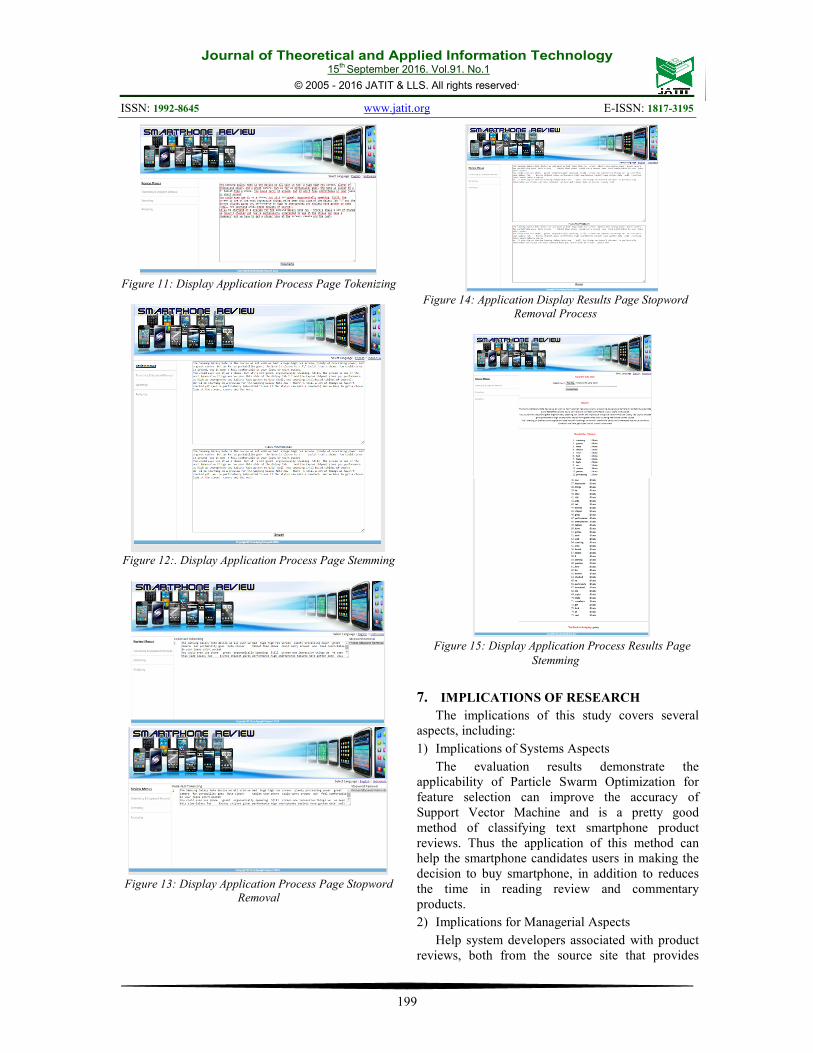
Figure 11: Display Application Process Page Tokenizing
Figure 12:. Display Application Process Page Stemming
Figure 13: Display Application Process Page Stopword
Removal
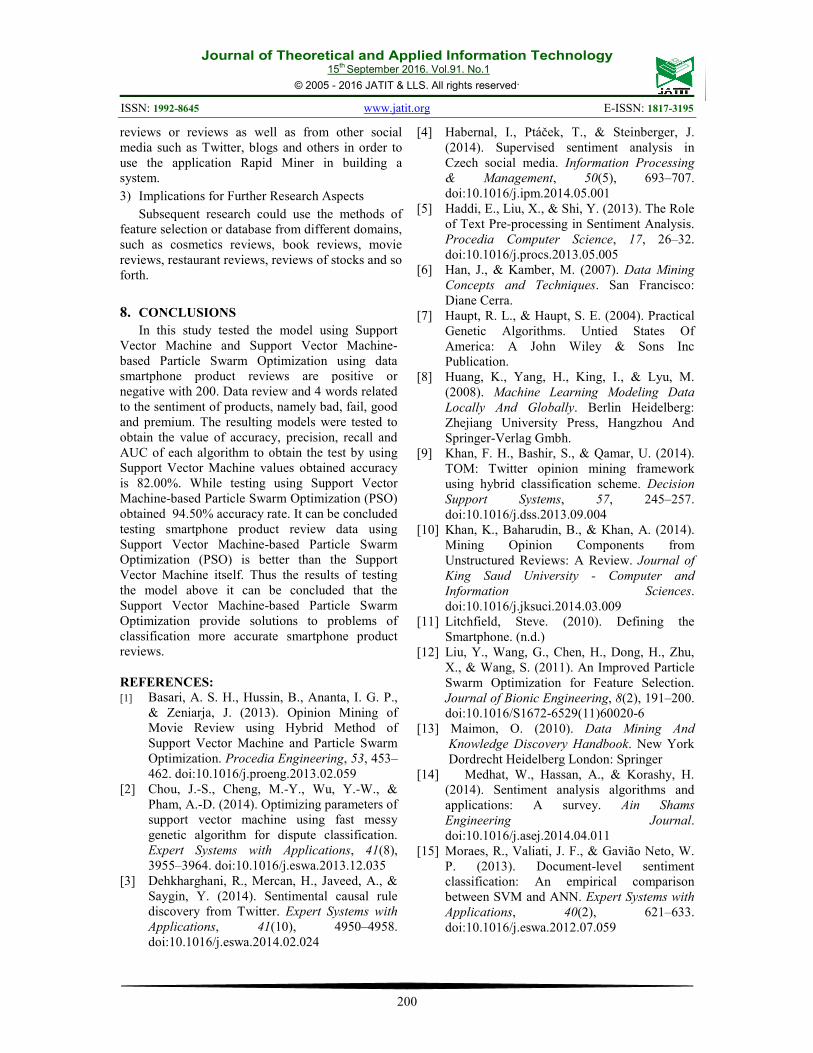
Figure 14: Application Display Results Page Stopword
Removal Process
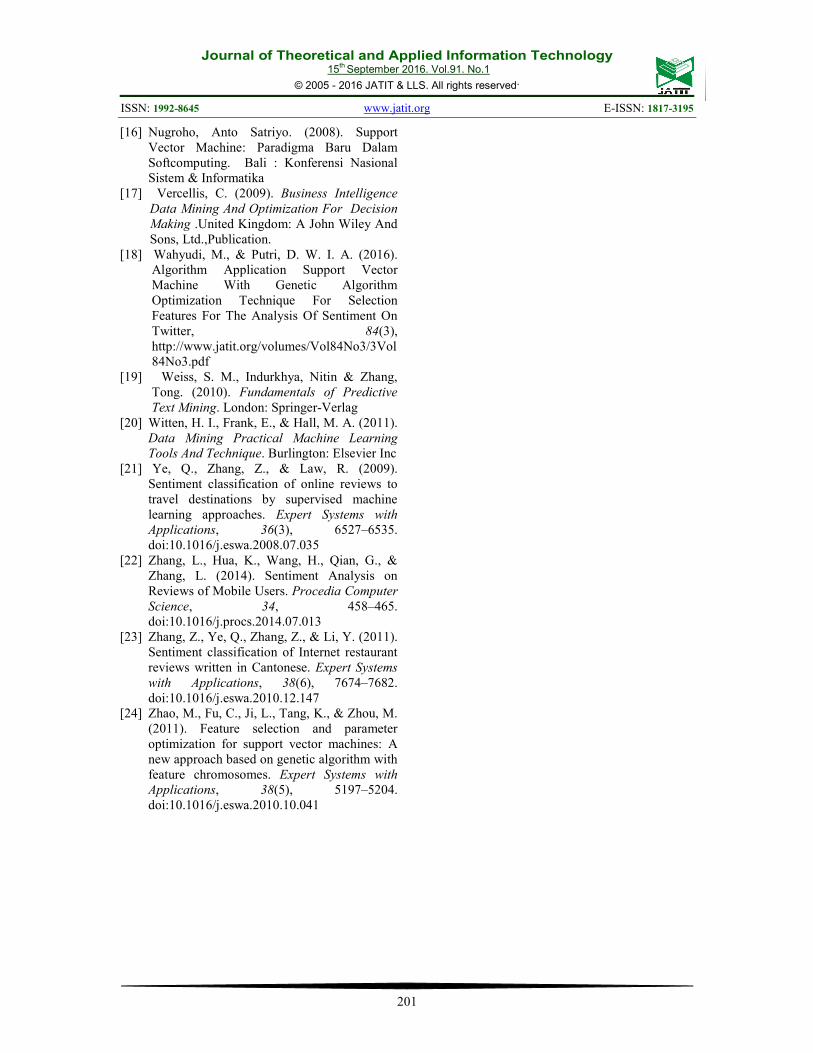
Figure 15: Display Application Process Results Page
Stemming
7. IMPLICATIONS OF RESEARCH
The implications of this study covers several
aspects, including:
1) Implications of Systems Aspects
The evaluation results demonstrate the
applicability of Particle Swarm Optimization for
feature selection can improve the accuracy of
Support Vector Machine and is a pretty good
method of classifying text smartphone product
reviews. Thus the application of this method can
help the smartphone candidates users in making the
decision to buy smartphone, in addition to reduces
the time in reading review and commentary
products.
2) Implications for Managerial Aspects
Help system developers associated with product
reviews, both from the source site that provides
Journal of Theoretical and Applied Information Technology 15
th September 2016. Vol.91. No.1
© 2005 - 2016 JATIT & LLS. All rights reserved.
ISSN: 1992-8645 www.jatit.org E-ISSN: 1817-3195
200
reviews or reviews as well as from other social
media such as Twitter, blogs and others in order to
use the application Rapid Miner in building a
system.
3) Implications for Further Research Aspects
Subsequent research could use the methods of
feature selection or database from different domains,
such as cosmetics reviews, book reviews, movie
reviews, restaurant reviews, reviews of stocks and so
forth.
8. CONCLUSIONS
In this study tested the model using Support
Vector Machine and Support Vector Machine-
based Particle Swarm Optimization using data
smartphone product reviews are positive or
negative with 200. Data review and 4 words related
to the sentiment of products, namely bad, fail, good
and premium. The resulting models were tested to
obtain the value of accuracy, precision, recall and
AUC of each algorithm to obtain the test by using
Support Vector Machine values obtained accuracy
is 82.00%. While testing using Support Vector
Machine-based Particle Swarm Optimization (PSO)
obtained 94.50% accuracy rate. It can be concluded
testing smartphone product review data using
Support Vector Machine-based Particle Swarm
Optimization (PSO) is better than the Support
Vector Machine itself. Thus the results of testing
the model above it can be concluded that the
Support Vector Machine-based Particle Swarm
Optimization provide solutions to problems of
classification more accurate smartphone product
reviews.
REFERENCES:
[1] Basari, A. S. H., Hussin, B., Ananta, I. G. P.,
& Zeniarja, J. (2013). Opinion Mining of
Movie Review using Hybrid Method of
Support Vector Machine and Particle Swarm
Optimization. Procedia Engineering, 53, 453–
462. doi:10.1016/j.proeng.2013.02.059
[2] Chou, J.-S., Cheng, M.-Y., Wu, Y.-W., &
Pham, A.-D. (2014). Optimizing parameters of
support vector machine using fast messy
genetic algorithm for dispute classification.
Expert Systems with Applications, 41(8),
3955–3964. doi:10.1016/j.eswa.2013.12.035
[3] Dehkharghani, R., Mercan, H., Javeed, A., &
Saygin, Y. (2014). Sentimental causal rule
discovery from Twitter. Expert Systems with
Applications, 41(10), 4950–4958.
doi:10.1016/j.eswa.2014.02.024
[4] Habernal, I., Ptáček, T., & Steinberger, J.
(2014). Supervised sentiment analysis in
Czech social media. Information Processing
& Management, 50(5), 693–707.
doi:10.1016/j.ipm.2014.05.001
[5] Haddi, E., Liu, X., & Shi, Y. (2013). The Role
of Text Pre-processing in Sentiment Analysis.
Procedia Computer Science, 17, 26–32.
doi:10.1016/j.procs.2013.05.005
[6] Han, J., & Kamber, M. (2007). Data Mining
Concepts and Techniques. San Francisco:
Diane Cerra.
[7] Haupt, R. L., & Haupt, S. E. (2004). Practical
Genetic Algorithms. Untied States Of
America: A John Wiley & Sons Inc
Publication.
[8] Huang, K., Yang, H., King, I., & Lyu, M.
(2008). Machine Learning Modeling Data
Locally And Globally. Berlin Heidelberg:
Zhejiang University Press, Hangzhou And
Springer-Verlag Gmbh.
[9] Khan, F. H., Bashir, S., & Qamar, U. (2014).
TOM: Twitter opinion mining framework
using hybrid classification scheme. Decision
Support Systems, 57, 245–257.
doi:10.1016/j.dss.2013.09.004
[10] Khan, K., Baharudin, B., & Khan, A. (2014).
Mining Opinion Components from
Unstructured Reviews: A Review. Journal of
King Saud University - Computer and
Information Sciences.
doi:10.1016/j.jksuci.2014.03.009
[11] Litchfield, Steve. (2010). Defining the
Smartphone. (n.d.)
[12] Liu, Y., Wang, G., Chen, H., Dong, H., Zhu,
X., & Wang, S. (2011). An Improved Particle
Swarm Optimization for Feature Selection.
Journal of Bionic Engineering, 8(2), 191–200.
doi:10.1016/S1672-6529(11)60020-6
[13] Maimon, O. (2010). Data Mining And
Knowledge Discovery Handbook. New York
Dordrecht Heidelberg London: Springer
[14] Medhat, W., Hassan, A., & Korashy, H.
(2014). Sentiment analysis algorithms and
applications: A survey. Ain Shams
Engineering Journal.
doi:10.1016/j.asej.2014.04.011
[15] Moraes, R., Valiati, J. F., & Gavião Neto, W.
P. (2013). Document-level sentiment
classification: An empirical comparison
between SVM and ANN. Expert Systems with
Applications, 40(2), 621–633.
doi:10.1016/j.eswa.2012.07.059
Journal of Theoretical and Applied Information Technology 15
th September 2016. Vol.91. No.1
© 2005 - 2016 JATIT & LLS. All rights reserved.
ISSN: 1992-8645 www.jatit.org E-ISSN: 1817-3195
201
[16] Nugroho, Anto Satriyo. (2008). Support
Vector Machine: Paradigma Baru Dalam
Softcomputing. Bali : Konferensi Nasional
Sistem & Informatika
[17] Vercellis, C. (2009). Business Intelligence
Data Mining And Optimization For Decision
Making .United Kingdom: A John Wiley And
Sons, Ltd.,Publication.
[18] Wahyudi, M., & Putri, D. W. I. A. (2016).
Algorithm Application Support Vector
Machine With Genetic Algorithm
Optimization Technique For Selection
Features For The Analysis Of Sentiment On
Twitter, 84(3),
http://www.jatit.org/volumes/Vol84No3/3Vol
84No3.pdf
[19] Weiss, S. M., Indurkhya, Nitin & Zhang,
Tong. (2010). Fundamentals of Predictive
Text Mining. London: Springer-Verlag
[20] Witten, H. I., Frank, E., & Hall, M. A. (2011).
Data Mining Practical Machine Learning
Tools And Technique. Burlington: Elsevier Inc
[21] Ye, Q., Zhang, Z., & Law, R. (2009).
Sentiment classification of online reviews to
travel destinations by supervised machine
learning approaches. Expert Systems with
Applications, 36(3), 6527–6535.
doi:10.1016/j.eswa.2008.07.035
[22] Zhang, L., Hua, K., Wang, H., Qian, G., &
Zhang, L. (2014). Sentiment Analysis on
Reviews of Mobile Users. Procedia Computer
Science, 34, 458–465.
doi:10.1016/j.procs.2014.07.013
[23] Zhang, Z., Ye, Q., Zhang, Z., & Li, Y. (2011).
Sentiment classification of Internet restaurant
reviews written in Cantonese. Expert Systems
with Applications, 38(6), 7674–7682.
doi:10.1016/j.eswa.2010.12.147
[24] Zhao, M., Fu, C., Ji, L., Tang, K., & Zhou, M.
(2011). Feature selection and parameter
optimization for support vector machines: A
new approach based on genetic algorithm with
feature chromosomes. Expert Systems with
Applications, 38(5), 5197–5204.
doi:10.1016/j.eswa.2010.10.041