sensors & transducers arvind k., lightfield, ... sensors & transducers journal ... research...
TRANSCRIPT


SSeennssoorrss && TTrraannssdduucceerrss
IInntteerrnnaattiioonnaall OOffffiicciiaall JJoouurrnnaall ooff tthhee IInntteerrnnaattiioonnaall FFrreeqquueennccyy SSeennssoorr AAssssoocciiaattiioonn ((IIFFSSAA)) DDeevvootteedd ttoo
RReesseeaarrcchh aanndd DDeevveellooppmmeenntt ooff SSeennssoorrss aanndd TTrraannssdduucceerrss
VVoolluummee 115522,, IIssssuuee 55,, MMaayy 22001133
Editor-in-Chief Sergey Y. YURISH
IFSA Publishing: Barcelona Toronto

Copyright 2013 IFSA Publishing. All rights reserved. This journal and the individual contributions in it are protected under copyright by IFSA Publishing, and the following terms and conditions apply to their use: Photocopying: Single photocopies of single articles may be made for personal use as allowed by national copyright laws. Permission of the Publisher and payment of a fee is required for all other photocopying, including multiple or systematic copyright, copyright for advertising or promotional purposes, resale, and all forms of document delivery. Derivative Works: Subscribers may reproduce tables of contents or prepare list of articles including abstract for internal circulation within their institutions. Permission of the Publisher is required for resale or distribution outside the institution. Permission of the Publisher is required for all other derivative works, including compilations and translations. Authors' copies of Sensors & Transducers journal and articles published in it are for personal use only. Address permissions requests to: IFSA Publisher by e-mail: [email protected] Notice: No responsibility is assumed by the Publisher for any injury and/or damage to persons or property as a matter of products liability, negligence or otherwise, or from any use or operation of any methods, products, instructions or ideas contained in the material herein. Printed in the USA.

SSeennssoorrss && TTrraannssdduucceerrss
Volume 152, Issue 5, May 2013
www.sensorsportal.com ISSN 2306-8515 e-ISSN 1726-5479
Editors-in-Chief: professor Sergey Y. Yurish, Tel.: +34 696067716, e-mail: [email protected]
Editors for Western Europe Meijer, Gerard C.M., Delft Univ. of Technology, The Netherlands Ferrari, Vittorio, Universitá di Brescia, Italy Editor for Eastern Europe Sachenko, Anatoly, Ternopil National Economic University, Ukraine Editors for North America Katz, Evgeny, Clarkson University, USA Datskos, Panos G., Oak Ridge National Laboratory, USA Fabien, J. Josse, Marquette University, USA
Editor South America Costa-Felix, Rodrigo, Inmetro, Brazil Editors for Asia Ohyama, Shinji, Tokyo Institute of Technology, Japan Zhengbing, Hu, Huazhong Univ. of Science and Technol., China Editor for Asia-Pacific Mukhopadhyay, Subhas, Massey University, New Zealand Editor for Africa Maki K.Habib, American University in Cairo, Egypt
Editorial Board
Abdul Rahim, Ruzairi, Universiti Teknologi, Malaysia Abramchuk, George, Measur. Tech. & Advanced Applications, Canada Ascoli, Giorgio, George Mason University, USA Atalay, Selcuk, Inonu University, Turkey Atghiaee, Ahmad, University of Tehran, Iran Augutis, Vygantas, Kaunas University of Technology, Lithuania Ayesh, Aladdin, De Montfort University, UK Baliga, Shankar, B., General Monitors, USA Basu, Sukumar, Jadavpur University, India Bousbia-Salah, Mounir, University of Annaba, Algeria Bouvet, Marcel, University of Burgundy, France Campanella, Luigi, University La Sapienza, Italy Carvalho, Vitor, Minho University, Portugal Changhai, Ru, Harbin Engineering University, China Chen, Wei, Hefei University of Technology, China Cheng-Ta, Chiang, National Chia-Yi University, Taiwan Chung, Wen-Yaw, Chung Yuan Christian University, Taiwan Cortes, Camilo A., Universidad Nacional de Colombia, Colombia D'Amico, Arnaldo, Università di Tor Vergata, Italy De Stefano, Luca, Institute for Microelectronics and Microsystem, Italy Ding, Jianning, Changzhou University, China Djordjevich, Alexandar, City University of Hong Kong, Hong Kong Donato, Nicola, University of Messina, Italy Dong, Feng, Tianjin University, China Erkmen, Aydan M., Middle East Technical University, Turkey Gaura, Elena, Coventry University, UK Gole, James, Georgia Institute of Technology, USA Gong, Hao, National University of Singapore, Singapore Gonzalez de la Rosa, Juan Jose, University of Cadiz, Spain Guillet, Bruno, University of Caen, France Hadjiloucas, Sillas, The University of Reading, UK Hao, Shiying, Michigan State University, USA Hui, David, University of New Orleans, USA Jaffrezic-Renault, Nicole, Claude Bernard University Lyon 1, France Jamil, Mohammad, Qatar University, Qatar Kaniusas, Eugenijus, Vienna University of Technology, Austria Kim, Min Young, Kyungpook National University, Korea Kumar, Arun, University of Delaware, USA Lay-Ekuakille, Aime, University of Lecce, Italy Li, Si, GE Global Research Center, USA Lin, Paul, Cleveland State University, USA Liu, Aihua, Chinese Academy of Sciences, China
Mahadi, Muhammad, University Tun Hussein Onn Malaysia, Malaysia Mansor, Muhammad Naufal, University Malaysia Perlis, Malaysia Marquez, Alfredo, Centro de Investigacion en Materiales Avanzados, Mexico Mishra, Vivekanand, National Institute of Technology, India Moghavvemi, Mahmoud, University of Malaya, Malaysia Morello, Rosario, University "Mediterranea" of Reggio Calabria, Italy Mulla, Imtiaz Sirajuddin, National Chemical Laboratory, Pune, India Nabok, Aleksey, Sheffield Hallam University, UK Neshkova, Milka, Bulgarian Academy of Sciences, Bulgaria Passaro, Vittorio M. N., Politecnico di Bari, Italy Penza, Michele, ENEA, Italy Pereira, Jose Miguel, Instituto Politecnico de Setebal, Portugal Pogacnik, Lea, University of Ljubljana, Slovenia Pullini, Daniele, Centro Ricerche FIAT, Italy Reig, Candid, University of Valencia, Spain Restivo, Maria Teresa, University of Porto, Portugal Rodríguez Martínez, Angel, Universidad Politécnica de Cataluña, Spain Sadana, Ajit, University of Mississippi, USA Sadeghian Marnani, Hamed, TU Delft, The Netherlands Sapozhnikova, Ksenia, D. I. Mendeleyev Institute for Metrology, Russia Singhal, Subodh Kumar, National Physical Laboratory, India Shah, Kriyang, La Trobe University, Australia Shi, Wendian, California Institute of Technology, USA Shmaliy, Yuriy, Guanajuato University, Mexico Song, Xu, An Yang Normal University, China Srivastava, Arvind K., LightField, Corp, USA Stefanescu, Dan Mihai, Romanian Measurement Society, Romania Sumriddetchkajorn, Sarun, Nat. Electr. & Comp. Tech. Center, Thailand Sun, Zhiqiang, Central South University, China Sysoev, Victor, Saratov State Technical University, Russia Thirunavukkarasu, I., Manipal University Karnataka, India Thomas, Sadiq, Heriot Watt University, Edinburgh, UK Tianxing, Chu, Research Center for Surveying & Mapping, Beijing, China Vazquez, Carmen, Universidad Carlos III Madrid, Spain Wang, Jiangping, Xian Shiyou University, China Xue, Ning, Agiltron, Inc., USA Yang, Dongfang, National Research Council, Canada Yang, Shuang-Hua, Loughborough University, UK Yaping Dan, Harvard University, USA Zakaria, Zulkarnay, University Malaysia Perlis, Malaysia Zhang, Weiping, Shanghai Jiao Tong University, China Zhang, Wenming, Shanghai Jiao Tong University, China
Sensors & Transducers Journal (ISSN 2306-8515) is a peer review international journal published monthly online by International Frequency Sensor Association (IFSA). Available in both: print and electronic (printable pdf) formats. Copyright © 2013 by International Frequency Sensor Association.
All rights reserved.

SSeennssoorrss && TTrraannssdduucceerrss JJoouurrnnaall
CCoonntteennttss
Volume 152 Issue 5 May 2013
www.sensorsportal.com ISSN: 2306-8515 e-ISSN 1726-5479
Research Articles
Research on the Structure and Signal Transmission of Rotary Piezoelectric Dynamometer Zhenyuan Jia, Yongyan Shang, Zongjin Ren, Yifei Gao and Shengnan Gao........................... 1 Piezoelectric Sensor of Control Surface Hinge Moment Zongjin Ren, Shengnan Gao, Zhenyuan Jia,Yongyan Shang and Yifei Gao ............................ 11 Research Algorithm on Building Intelligent Transportation System based on RFID Technology Chuanqi Chen ............................................................................................................................ 18 Using Displacement Sensor to Determinate the Fracture Toughness of PMMA Bone Cement Yongzhi Xu, Youzhi Wang ......................................................................................................... 27 Study on the Applications of Fiber Bragg Grating and Wireless Network Technologies in Telemetry System of Atmospheric Precipitation Han Bing, Tan Dongjie, Li Liangliang, Liu Jianping ...................................................................................................................................... 33 An Energy-Efficient Adaptive Clustering Protocol for Wireless Sensor Network Lü Tao, Zhu Qing-Xin, Zhu Yu-Yu ............................................................................................ 41 A Case Study of Event Detection Performance Measure in WSNs Using Gini Index Luhutyit Peter Damuut, Dongbing Gu ........................................................................................ 51 Fault Diagnosis of Tool Wear Based on Weak Feature Extraction and GA-B-spline Network Weiqing Cao, Pan Fu, Genhou Xu............................................................................................. 60 The Research Abort Concept Restructuring of the Sensor Semantic Networks Guanwei ..................................................................................................................................... 68 Coordinating Reasoning Method for Semantic Sensor Networks Shi Yun Ping .............................................................................................................................. 76 A Novel Intelligent Transportation Control Supported by Wireless Sensor Network Zhe Qian, Jianqi Liu. .................................................................................................................. 84 Research on the Special Railway Intelligence Transportation Hierarchy and System Integration Methodology Meng-Jie Wang, Xi-Fu Wang, Wen-Ying Zhang, Xue Feng ...................................................... 89 Application of a Heterogeneous Wireless Framework for Radiation Monitoring in Nuclear Power Plant Gu Danying ................................................................................................................................ 98

Acoustic Emission Signal Analysis of Aluminum Alloy Fatigue Crack Wenxue Qian, Xiaowei Yin, Liyang Xie...................................................................................... 105 A New Ultra-lightweight Authentication Protocol for Low Cost RFID Tags Xin Wang, Qingxuan Jia, Xin Gao, Peng Chen, Bing Zhao....................................................... 110 AGC Design in Frequency Modulation System for Voice Communication via Underwater Acoustic Channel Cheng En, Chen Sheng-Li, Li Ye, Ke Fu-Yuan, Yuan Fei ......................................................... 116 Joint Source-Channel Coding for Underwater Image Transmission Chen Hua-Bin, Chen Wei-Ling, Li Ye, Cheng En, Yuan Fei...................................................... 122 Study on the Applications of Cross-Layer Information Fusion in Target Recognition Xing Liu, Shoushan Jiang .......................................................................................................... 129 A Simple Tree Detector Using Laser and Camera Fusion D. Wang, J. H. Liu, J. L. Wang, T. Li.......................................................................................... 137 Simulation and Analysis of T-Junction Microchannel Kainat Nabi, Rida Rafi, Muhammad Waseem Ashraf, Shahzadi Tayyaba, Zahoor Ahmad, Muhammad Imran, Faran Baig and Nitin Afzulpurkar................................................................ 146 Mass Flow Measurement of Fluids by a Helically Coiled Tube Tian Zhou, Zhiqiang Sun, Zhenying Dong, Saiwei Li, Jiemin Zhou........................................... 152 Comparative Creep Evaluation between the Use of ISO 376 and OIML R60 for Silicon Load Cell Characterization Ebtisam H. Hasan, Rolf Kumme, Günther Haucke and Sascha Mäuselein .............................. 158 Development of Noise Measurements. Part 3. Passive Method of Electronic Elements Quality Characterization Yuriy Bobalo, Zenoviy Kolodiy, Bohdan Stadnyk, Svyatoslav Yatsyshyn ................................. 164 Application of Mixed Programming in the Simulation of Lorenz Chaotic System's Dynamics Characteristics Based on Labview and Matlab Peng Zhou, Gang Xu, Liang Chen............................................................................................. 169 A Nanostructure with Dual-Band Plasmonic Resonance and Its Sensing Application Zongheng Yuan, Jing Huan , Xiaonan Li and Dasen Ren. ........................................................ 174 A Glucose Sensor Based on Glucose Oxidase Immobilized by Electrospinning Nanofibrous Polymer Membranes Modified with Carbon Nanotubes You Wang, Hui Xu, Zhengang Wang, Ruifen Hu, Zhiyuan Luo, Zhikang Xu, Guang Li......... 180 The Platform Architecture and Key Technology of Cloud Service that Support Wisdom City Management Liang Xiao .................................................................................................................................. 186
Authors are encouraged to submit article in MS Word (doc) and Acrobat (pdf) formats by e-mail: [email protected] Please visit journal’s webpage with preparation instructions: http://www.sensorsportal.com/HTML/DIGEST/Submition.htm
International Frequency Sensor Association (IFSA).

Sensors & Transducers, Vol. 152, Issue 5, May 2013, pp. 137-145
137
SSSeeennnsssooorrrsss &&& TTTrrraaannnsssddduuuccceeerrrsss
© 2013 by IFSAhttp://www.sensorsportal.com
A Simple Tree Detector Using Laser and Camera Fustion
D. Wang, * J. H. Liu, J. L. Wang, T. Li School of Technology, Beijing Forestry, Beijing 100083, China
Tel.: +86 010 62336204 E-mail: [email protected], [email protected], [email protected],
Received: 14 April 2013 /Accepted: 15 May 2013 /Published: 27 May 2013 Abstract: To improve the detecting ability on the felling target tree of forest harvester, a simple sensor system have been employed in the present paper, and to make the data obtained from laser scanner and camera can be merged into a new image several methods have been employed by researchers. However these methods usually standardized the image for fusion which takes lots of resources. In the present paper, a simple but useful method has been used to make this fusion process much more economize At last, as the experiment results show that, with the adaptive calculation on the number of pixels in the segmentation grids, the pixel level fusion effect was good enough for detecting the felling target. Copyright © 2013 IFSA. Keywords: data fusion, laser scanner, adaptive round algorithm, pixel fusion. 1. Introduction
For enhancing the automation and the work efficiency of the forest harvester further, optimizing the felling operation, improving the utilization of forest resources and protecting the forest ecology environment, some aspects should be studied deeply such as the operating environment perception, manipulator path planning, attachment obstacle avoidance and the vehicle cross ability, etc. In order to resolve the problems which the forest harvester meets, a measurement system which is built by the 2-D laser scanner is adopt to obtain the laser scan data of the living-tree in the stage of the observation and identification of the felling operation.
In the research of the automatic navigation in the forest and the independent felling and cultivating operation of the forest harvester [1-4], the mobile environment measurement system, composed by 2-D laser scanner which is SICK-LMS291 and digital camera, is used to perceive the position of the felling and cultivating targets and obstacles in forest [5-8].
On the basis of the above, in order to further improve the identify ability on the felling and cultivating target [9], we conducted a research on the pixel level fusion for matching the 2-D laser scanning points of felling and cultivating target surface and the true color pixels of target in image [10-14].
There are many researches with a mobile laser scanner to measure the location and the diameter of the felling target tree. For example, Jaakko Jutila, Kosti Kannas et al. Studied the method on diameter and location measurement of tree parameters by 2D Laser scanner mounted on a mobile ATV platform [15]. The error of the tree diameter calculations is 4 %. Thies Michael, Pfeifer Norbert et al. use terrestrial laser scanner to capture the geometric aspects of a tree: the radius, length and diameter of the trunk and individual branches [16]. Matti Öhman, Mikko Miettinen et al. use the 2D scanning laser range finders, machine vision systems and GPS to get information about the surrounding forest, such as tree diameters, positions and stem density. This information can be used on-line for the simultaneous
Article number P_1203
Sensors & Transducers, Vol. 152, Issue 5, May 2013, pp. 137-145
138
localization and mapping for the forest harvesters or off-line in a forest asset management system [17, 18]. But there is a problem of the method mentioned above which is that the measuring results of laser scan could not be displayed quickly, easily and intuitive for the operator.
Based on the data collected by the measuring system, we use a method to fuse the two kinds of data together and show it on the image of the display. But during the process of the research, the laser scanning points of target surface could not match the true color pixels of target in image due to image horizontal distortion. To solve this problem, we use a way named parabola grid method to divide image into n grids along the horizontal direction according to the number n of laser beams of 2-D laser scanning points. Use n as index value, and then build matching relationship between the depth information of target surface of 2-D laser scanning points and the true color pixels of target in image. However, due to the number N of pixels in the horizontal direction in image and the number n of segmentation grids are integers, according to the quadratic parabolic function calculation, it may lead to the appearance of fractional number of pixels in each grid and make the summation of all pixels contained in grids much smaller than N, which directly result in the failure of the fusion matching. So that, an adaptive rounding calculation was developed, by adopting the parabolic method to segment image, it could make the number of pixels of each grids to be an integer, and the error between the summation of the number of pixels in every grid and the number N of pixels in the horizontal direction of image is not greater than 1 pixel, meanwhile ensuring that the distribution of the number of pixels in every grid follows the form of the class quadratic parabola segmentation.
2. Experiment Materials
2.1. Measurement System The system of the data measurement on living-
trees in the forest land includes a LMS291 type 2D laser scanner produced by SICK company, Germany, a 24 V DC power supplied for scanners, a computer for data storage and analysis and a camera which can be used for take a picture of the scanning vision.
In the host computer, the programming executes the communication with LMS291 laser scanner through Active X named Microsoft Comm Control 6.0 in Visual Basic 6.0 to set the operating parameters of the scanner and read the stored scan data. 2.2. Parameters of System
The maximum measurement range of LMS291 laser scanner is adjustable (8 m, 16 m, 32 m, 80 m),
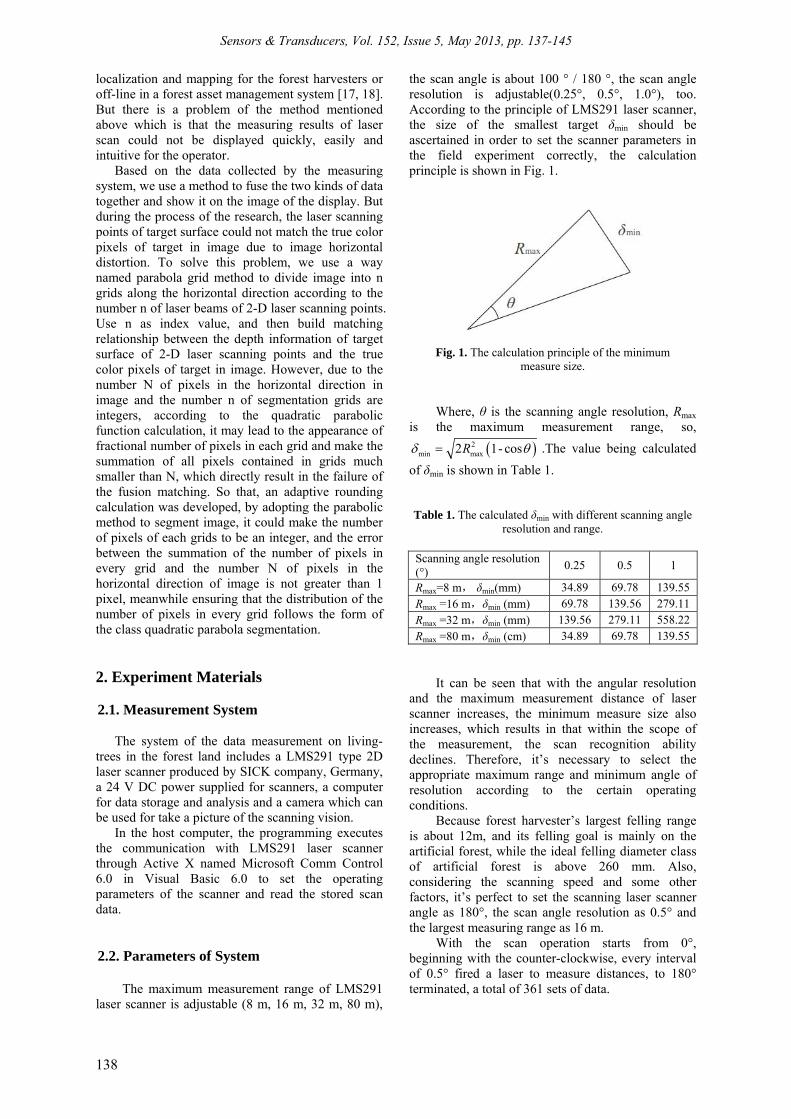
the scan angle is about 100 ° / 180 °, the scan angle resolution is adjustable(0.25°, 0.5°, 1.0°), too. According to the principle of LMS291 laser scanner, the size of the smallest target δmin should be ascertained in order to set the scanner parameters in the field experiment correctly, the calculation principle is shown in Fig. 1.
Fig. 1. The calculation principle of the minimum measure size.
Where, θ is the scanning angle resolution, Rmax is the maximum measurement range, so,
2min max2 1- cosR .The value being calculated
of δmin is shown in Table 1. Table 1. The calculated δmin with different scanning angle
resolution and range.
Scanning angle resolution (°)
0.25 0.5 1
Rmax=8 m, δmin(mm) 34.89 69.78 139.55 Rmax =16 m,δmin (mm) 69.78 139.56 279.11 Rmax =32 m,δmin (mm) 139.56 279.11 558.22 Rmax =80 m,δmin (cm) 34.89 69.78 139.55
It can be seen that with the angular resolution and the maximum measurement distance of laser scanner increases, the minimum measure size also increases, which results in that within the scope of the measurement, the scan recognition ability declines. Therefore, it’s necessary to select the appropriate maximum range and minimum angle of resolution according to the certain operating conditions.
Because forest harvester’s largest felling range is about 12m, and its felling goal is mainly on the artificial forest, while the ideal felling diameter class of artificial forest is above 260 mm. Also, considering the scanning speed and some other factors, it’s perfect to set the scanning laser scanner angle as 180°, the scan angle resolution as 0.5° and the largest measuring range as 16 m.
With the scan operation starts from 0°, beginning with the counter-clockwise, every interval of 0.5° fired a laser to measure distances, to 180° terminated, a total of 361 sets of data.
Sensors & Transducers, Vol. 152, Issue 5, May 2013, pp. 137-145
139
3. Theoretical Introduction
3.1. Parabolic Segmentation
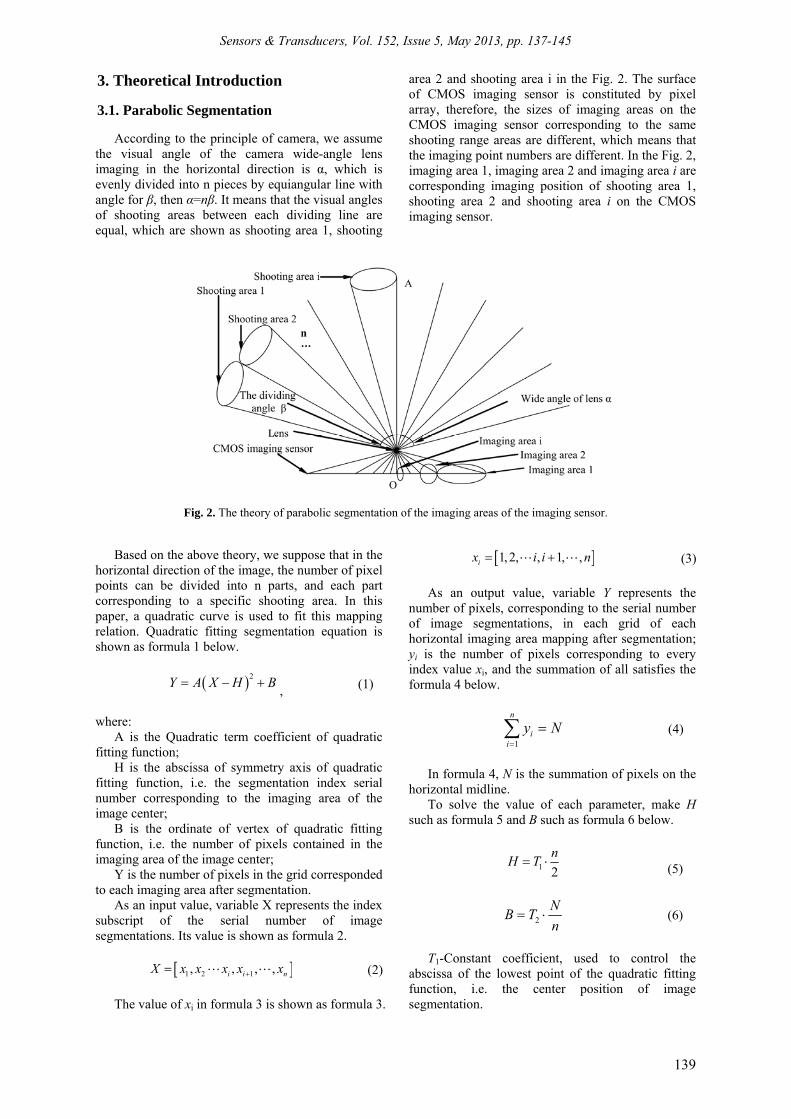
According to the principle of camera, we assume the visual angle of the camera wide-angle lens imaging in the horizontal direction is α, which is evenly divided into n pieces by equiangular line with angle for β, then α=nβ. It means that the visual angles of shooting areas between each dividing line are equal, which are shown as shooting area 1, shooting
area 2 and shooting area i in the Fig. 2. The surface of CMOS imaging sensor is constituted by pixel array, therefore, the sizes of imaging areas on the CMOS imaging sensor corresponding to the same shooting range areas are different, which means that the imaging point numbers are different. In the Fig. 2, imaging area 1, imaging area 2 and imaging area i are corresponding imaging position of shooting area 1, shooting area 2 and shooting area i on the CMOS imaging sensor.
Fig. 2. The theory of parabolic segmentation of the imaging areas of the imaging sensor.
Based on the above theory, we suppose that in the horizontal direction of the image, the number of pixel points can be divided into n parts, and each part corresponding to a specific shooting area. In this paper, a quadratic curve is used to fit this mapping relation. Quadratic fitting segmentation equation is shown as formula 1 below.
2Y A X H B
, (1)
where:
A is the Quadratic term coefficient of quadratic fitting function;
H is the abscissa of symmetry axis of quadratic fitting function, i.e. the segmentation index serial number corresponding to the imaging area of the image center;
B is the ordinate of vertex of quadratic fitting function, i.e. the number of pixels contained in the imaging area of the image center;
Y is the number of pixels in the grid corresponded to each imaging area after segmentation.
As an input value, variable X represents the index subscript of the serial number of image segmentations. Its value is shown as formula 2.
1 2 1, , , ,i i nX x x x x x (2)
The value of xi in formula 3 is shown as formula 3.
1,2, , 1, ,ix i i n (3)
As an output value, variable Y represents the
number of pixels, corresponding to the serial number of image segmentations, in each grid of each horizontal imaging area mapping after segmentation; yi is the number of pixels corresponding to every index value xi, and the summation of all satisfies the formula 4 below.
1
n
ii
y N
(4)
In formula 4, N is the summation of pixels on the
horizontal midline. To solve the value of each parameter, make H
such as formula 5 and B such as formula 6 below.
1 2
nH T
(5)
2
NB T
n
(6)
T1-Constant coefficient, used to control the
abscissa of the lowest point of the quadratic fitting function, i.e. the center position of image segmentation.
Sensors & Transducers, Vol. 152, Issue 5, May 2013, pp. 137-145
140
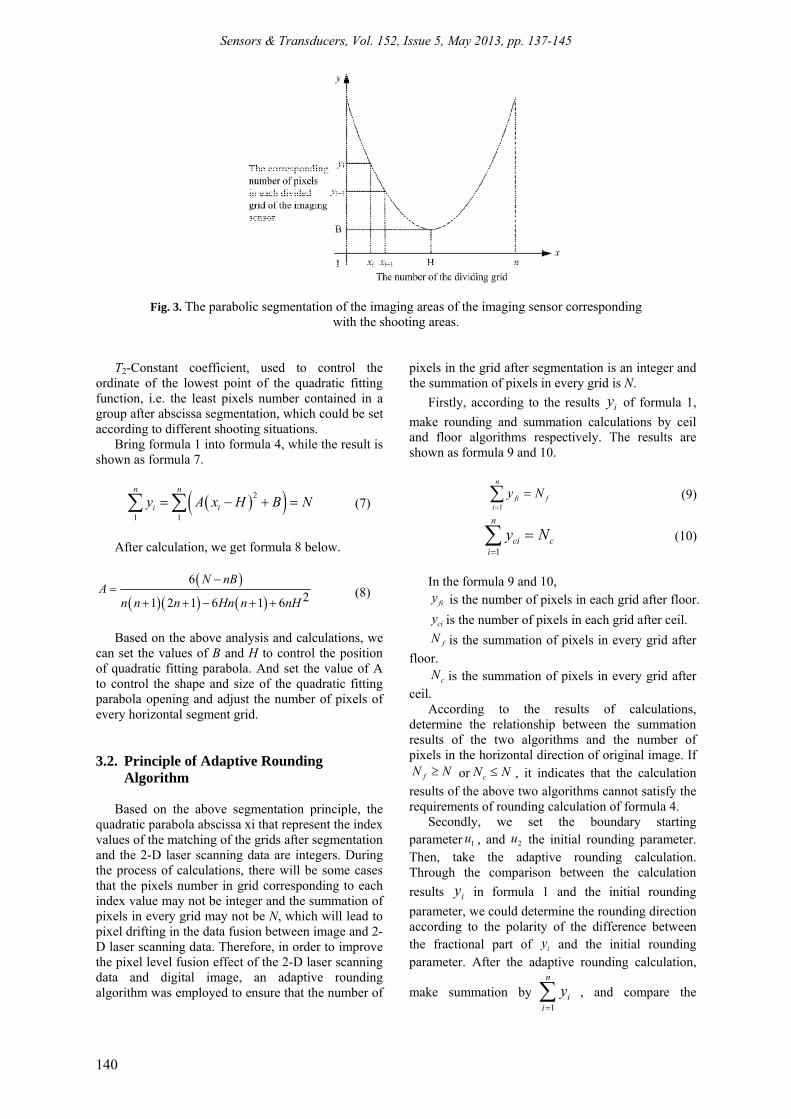
Fig. 3. The parabolic segmentation of the imaging areas of the imaging sensor corresponding with the shooting areas.
T2-Constant coefficient, used to control the ordinate of the lowest point of the quadratic fitting function, i.e. the least pixels number contained in a group after abscissa segmentation, which could be set according to different shooting situations.
Bring formula 1 into formula 4, while the result is shown as formula 7.
2
1 1
n n
i iy A x H B N
(7)
After calculation, we get formula 8 below.
6
21 2 1 6 1 6
N nBA
n n n Hn n nH
(8)
Based on the above analysis and calculations, we
can set the values of B and H to control the position of quadratic fitting parabola. And set the value of A to control the shape and size of the quadratic fitting parabola opening and adjust the number of pixels of every horizontal segment grid.
3.2. Principle of Adaptive Rounding Algorithm
Based on the above segmentation principle, the
quadratic parabola abscissa xi that represent the index values of the matching of the grids after segmentation and the 2-D laser scanning data are integers. During the process of calculations, there will be some cases that the pixels number in grid corresponding to each index value may not be integer and the summation of pixels in every grid may not be N, which will lead to pixel drifting in the data fusion between image and 2-D laser scanning data. Therefore, in order to improve the pixel level fusion effect of the 2-D laser scanning data and digital image, an adaptive rounding algorithm was employed to ensure that the number of
pixels in the grid after segmentation is an integer and the summation of pixels in every grid is N.
Firstly, according to the results iy of formula 1,
make rounding and summation calculations by ceil and floor algorithms respectively. The results are shown as formula 9 and 10.
1
n
fi fi
y N
(9)
1
n
ci ci
y N
(10)
In the formula 9 and 10,
fiy is the number of pixels in each grid after floor.
ciy is the number of pixels in each grid after ceil.
fN is the summation of pixels in every grid after floor.
cN is the summation of pixels in every grid after ceil.
According to the results of calculations, determine the relationship between the summation results of the two algorithms and the number of pixels in the horizontal direction of original image. If
fN N or cN N , it indicates that the calculation results of the above two algorithms cannot satisfy the requirements of rounding calculation of formula 4.
Secondly, we set the boundary starting parameter 1u , and 2u the initial rounding parameter. Then, take the adaptive rounding calculation. Through the comparison between the calculation
results iy in formula 1 and the initial rounding
parameter, we could determine the rounding direction according to the polarity of the difference between the fractional part of iy and the initial rounding parameter. After the adaptive rounding calculation,
make summation by1
n
ii
y , and compare the
Sensors & Transducers, Vol. 152, Issue 5, May 2013, pp. 137-145
141
summation results and the summation N of pixels on
the horizontal midline of image. If 1
- 1n
ii
y N
,
then1
n
ii
y N
, it indicates that the adaptive
rounding results satisfy the requirements of
segmentation. If 1
- 1n
ii
y N
, then determine the
polarity of 1
-n
ii
y N . When
1
- 0n
ii
y N
, make
'2 2u u , then continue adaptive rounding summation
calculation until 1
n
ii
y N
that the adaptive
rounding results satisfy the requirements of
segmentation. If 1
- 0n
ii
y N
, make '1 1u u , then
continue adaptive rounding summation calculation
until1
n
ii
y N
that the adaptive rounding results
satisfy the requirements of segmentation.
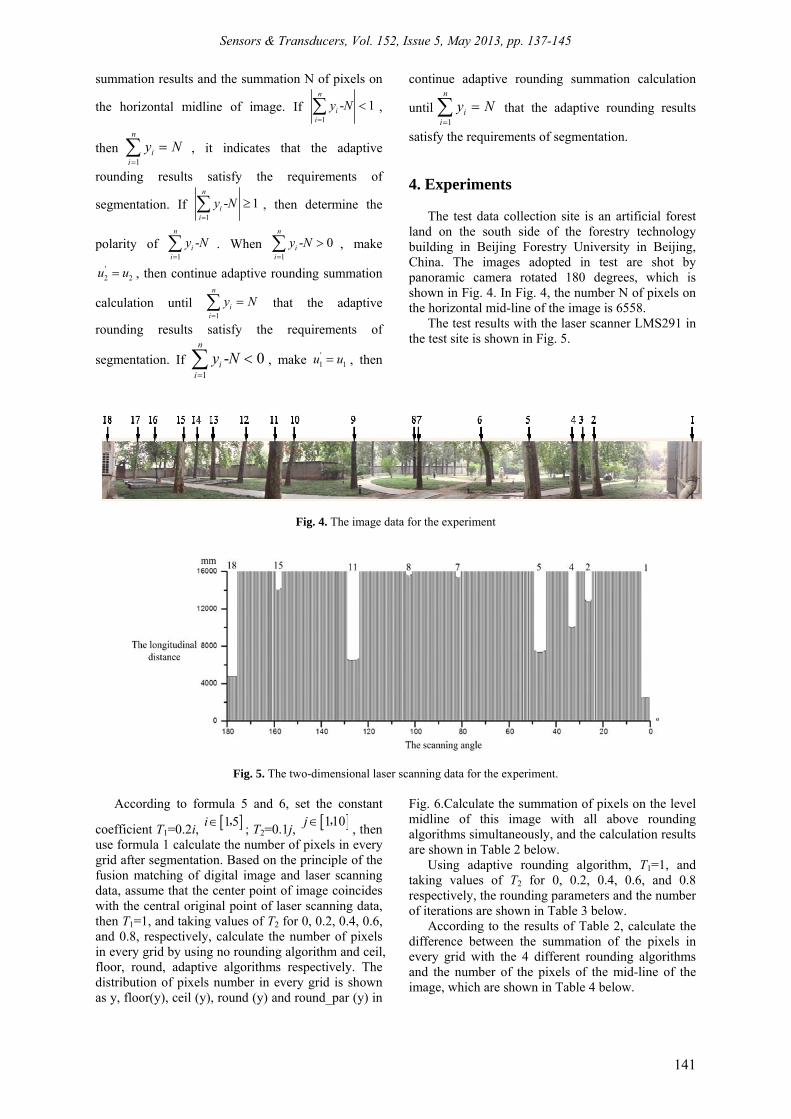
4. Experiments The test data collection site is an artificial forest
land on the south side of the forestry technology building in Beijing Forestry University in Beijing, China. The images adopted in test are shot by panoramic camera rotated 180 degrees, which is shown in Fig. 4. In Fig. 4, the number N of pixels on the horizontal mid-line of the image is 6558.
The test results with the laser scanner LMS291 in the test site is shown in Fig. 5.
Fig. 4. The image data for the experiment
Fig. 5. The two-dimensional laser scanning data for the experiment.
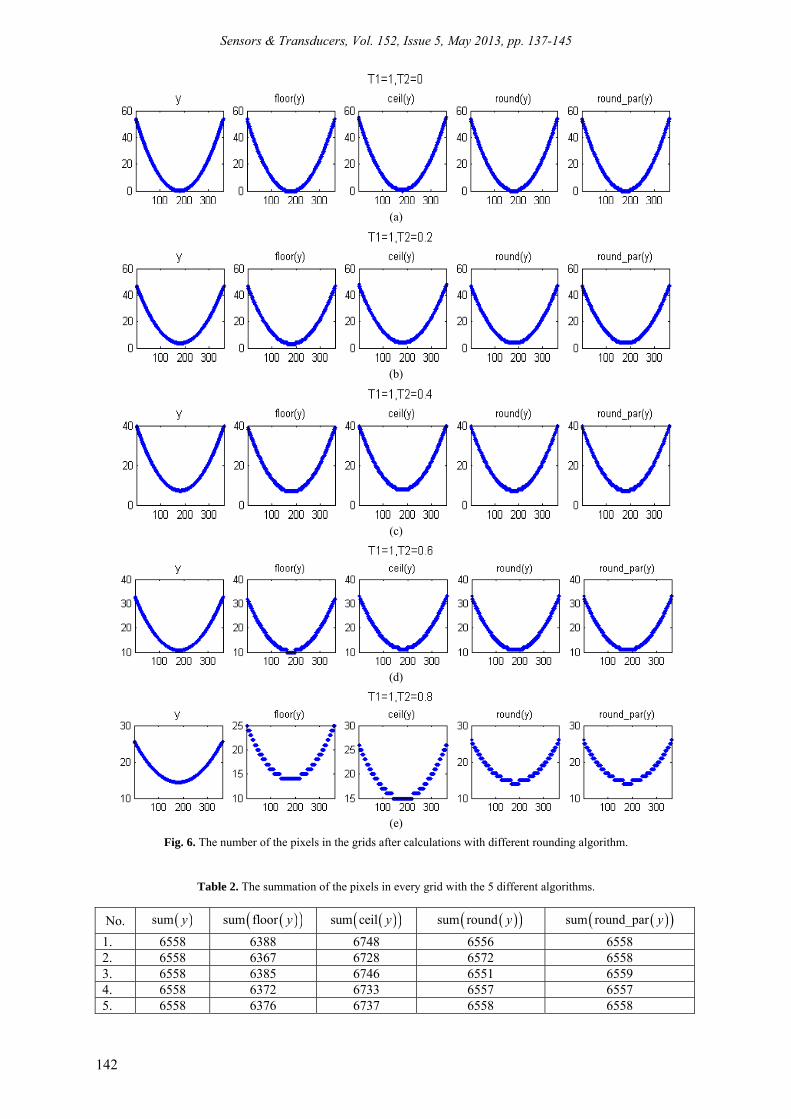
According to formula 5 and 6, set the constant
coefficient T1=0.2i, 1 5i ,; T2=0.1j, 110j ,
, then use formula 1 calculate the number of pixels in every grid after segmentation. Based on the principle of the fusion matching of digital image and laser scanning data, assume that the center point of image coincides with the central original point of laser scanning data, then T1=1, and taking values of T2 for 0, 0.2, 0.4, 0.6, and 0.8, respectively, calculate the number of pixels in every grid by using no rounding algorithm and ceil, floor, round, adaptive algorithms respectively. The distribution of pixels number in every grid is shown as y, floor(y), ceil (y), round (y) and round_par (y) in
Fig. 6.Calculate the summation of pixels on the level midline of this image with all above rounding algorithms simultaneously, and the calculation results are shown in Table 2 below.
Using adaptive rounding algorithm, T1=1, and taking values of T2 for 0, 0.2, 0.4, 0.6, and 0.8 respectively, the rounding parameters and the number of iterations are shown in Table 3 below.
According to the results of Table 2, calculate the difference between the summation of the pixels in every grid with the 4 different rounding algorithms and the number of the pixels of the mid-line of the image, which are shown in Table 4 below.
Sensors & Transducers, Vol. 152, Issue 5, May 2013, pp. 137-145
142
(a)
(b)
(c)
(d)
(e)
Fig. 6. The number of the pixels in the grids after calculations with different rounding algorithm.
Table 2. The summation of the pixels in every grid with the 5 different algorithms.
No. sum y sum floor y
sum ceil y
sum round y
sum round_par y
1. 6558 6388 6748 6556 6558 2. 6558 6367 6728 6572 6558 3. 6558 6385 6746 6551 6559 4. 6558 6372 6733 6557 6557 5. 6558 6376 6737 6558 6558
Sensors & Transducers, Vol. 152, Issue 5, May 2013, pp. 137-145
143
Table 3. The rounding parameters and the number of iterations with the adaptive rounding algorithm.
No. u Calculating times 1. 0.488281 7 2. 0.546875 5 3. 0.484375 5 4. 0.5 0 5. 0.5 0
Table 4. The difference between the summation of the pixels in every grid with the 4 different rounding algorithms and the number of the pixels of the mid-line of the image.
No.
sum floor
sum
y
y
sum ceil
sum
y
y
sum round
sum
y
y
sum round_par
sum
y
y
1. -170 190 -2 0 2. -191 170 14 0 3. -173 188 -7 1 4. -186 175 -1 -1 5. -182 179 0 0
5. Results According to the calculation results, the
summation of pixels in each grid is greater than the numbers of pixels on the mid-line of original image with ceil and round algorithms. Therefore, only using the floor and the adaptive algorithms could achieve matching of the image data and the 2-D laser scanning data, but the two algorithms have certain difference in matching effect. 5.1. The Effect of Fusion Matching
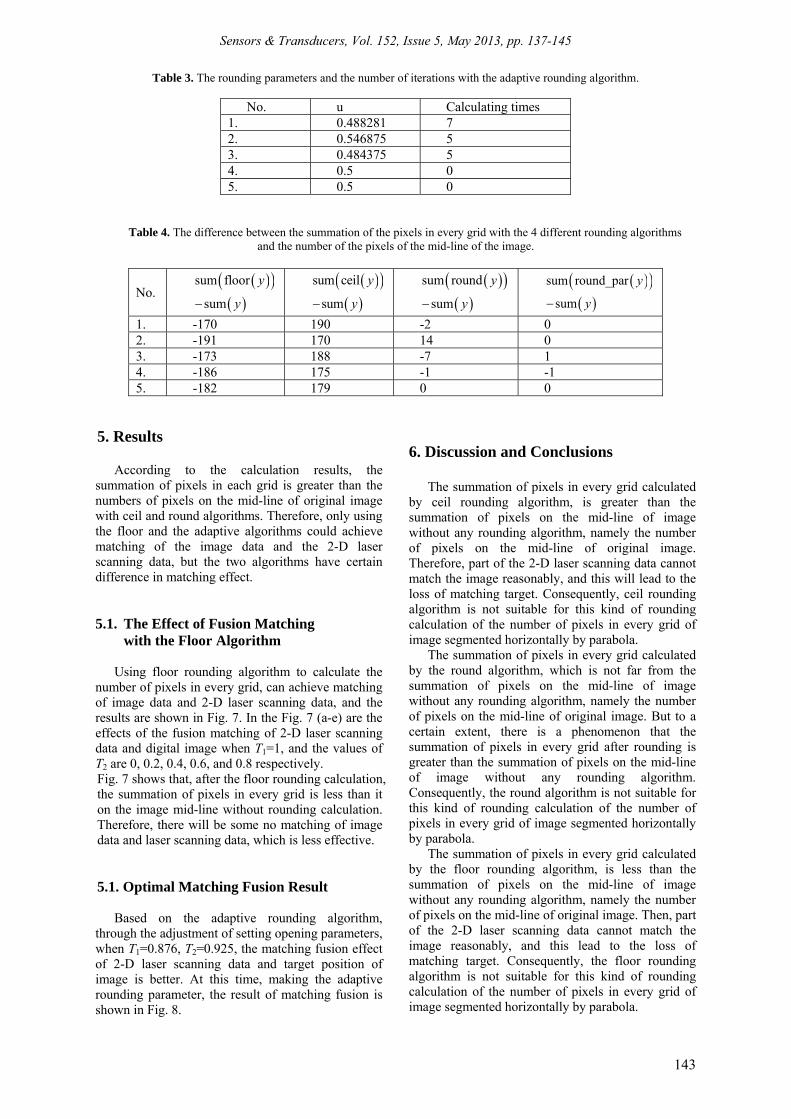
with the Floor Algorithm Using floor rounding algorithm to calculate the
number of pixels in every grid, can achieve matching of image data and 2-D laser scanning data, and the results are shown in Fig. 7. In the Fig. 7 (a-e) are the effects of the fusion matching of 2-D laser scanning data and digital image when T1=1, and the values of T2 are 0, 0.2, 0.4, 0.6, and 0.8 respectively. Fig. 7 shows that, after the floor rounding calculation, the summation of pixels in every grid is less than it on the image mid-line without rounding calculation. Therefore, there will be some no matching of image data and laser scanning data, which is less effective. 5.1. Optimal Matching Fusion Result
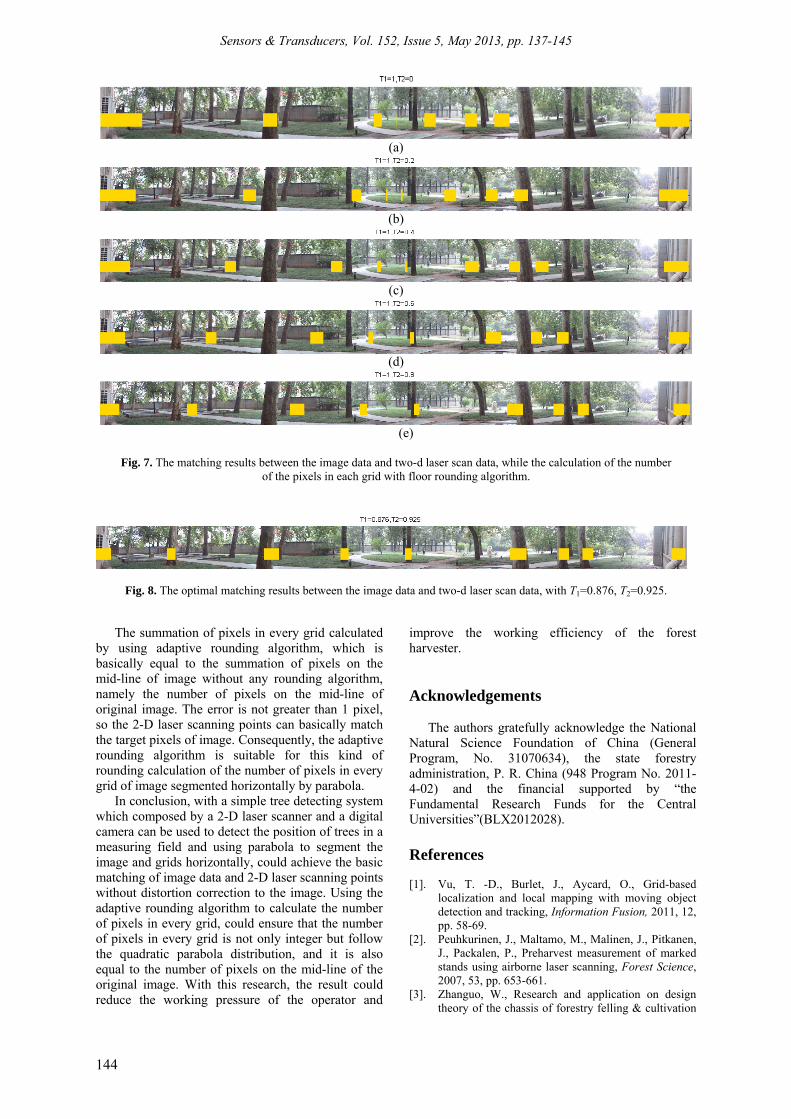
Based on the adaptive rounding algorithm,
through the adjustment of setting opening parameters, when T1=0.876, T2=0.925, the matching fusion effect of 2-D laser scanning data and target position of image is better. At this time, making the adaptive rounding parameter, the result of matching fusion is shown in Fig. 8.
6. Discussion and Conclusions
The summation of pixels in every grid calculated by ceil rounding algorithm, is greater than the summation of pixels on the mid-line of image without any rounding algorithm, namely the number of pixels on the mid-line of original image. Therefore, part of the 2-D laser scanning data cannot match the image reasonably, and this will lead to the loss of matching target. Consequently, ceil rounding algorithm is not suitable for this kind of rounding calculation of the number of pixels in every grid of image segmented horizontally by parabola.
The summation of pixels in every grid calculated by the round algorithm, which is not far from the summation of pixels on the mid-line of image without any rounding algorithm, namely the number of pixels on the mid-line of original image. But to a certain extent, there is a phenomenon that the summation of pixels in every grid after rounding is greater than the summation of pixels on the mid-line of image without any rounding algorithm. Consequently, the round algorithm is not suitable for this kind of rounding calculation of the number of pixels in every grid of image segmented horizontally by parabola.
The summation of pixels in every grid calculated by the floor rounding algorithm, is less than the summation of pixels on the mid-line of image without any rounding algorithm, namely the number of pixels on the mid-line of original image. Then, part of the 2-D laser scanning data cannot match the image reasonably, and this lead to the loss of matching target. Consequently, the floor rounding algorithm is not suitable for this kind of rounding calculation of the number of pixels in every grid of image segmented horizontally by parabola.
Sensors & Transducers, Vol. 152, Issue 5, May 2013, pp. 137-145
144
(a)
(b)
(c)
(d)
(e)
Fig. 7. The matching results between the image data and two-d laser scan data, while the calculation of the number
of the pixels in each grid with floor rounding algorithm.
Fig. 8. The optimal matching results between the image data and two-d laser scan data, with T1=0.876, T2=0.925.
The summation of pixels in every grid calculated by using adaptive rounding algorithm, which is basically equal to the summation of pixels on the mid-line of image without any rounding algorithm, namely the number of pixels on the mid-line of original image. The error is not greater than 1 pixel, so the 2-D laser scanning points can basically match the target pixels of image. Consequently, the adaptive rounding algorithm is suitable for this kind of rounding calculation of the number of pixels in every grid of image segmented horizontally by parabola.
In conclusion, with a simple tree detecting system which composed by a 2-D laser scanner and a digital camera can be used to detect the position of trees in a measuring field and using parabola to segment the image and grids horizontally, could achieve the basic matching of image data and 2-D laser scanning points without distortion correction to the image. Using the adaptive rounding algorithm to calculate the number of pixels in every grid, could ensure that the number of pixels in every grid is not only integer but follow the quadratic parabola distribution, and it is also equal to the number of pixels on the mid-line of the original image. With this research, the result could reduce the working pressure of the operator and
improve the working efficiency of the forest harvester.
Acknowledgements
The authors gratefully acknowledge the National Natural Science Foundation of China (General Program, No. 31070634), the state forestry administration, P. R. China (948 Program No. 2011-4-02) and the financial supported by “the Fundamental Research Funds for the Central Universities”(BLX2012028). References [1]. Vu, T. -D., Burlet, J., Aycard, O., Grid-based
localization and local mapping with moving object detection and tracking, Information Fusion, 2011, 12, pp. 58-69.
[2]. Peuhkurinen, J., Maltamo, M., Malinen, J., Pitkanen, J., Packalen, P., Preharvest measurement of marked stands using airborne laser scanning, Forest Science, 2007, 53, pp. 653-661.
[3]. Zhanguo, W., Research and application on design theory of the chassis of forestry felling & cultivation

Sensors & Transducers, Vol. 152, Issue 5, May 2013, pp. 137-145
145
machine, Doctor, Beijing Forestry University, China, 2011.
[4]. Rongfeng, S., Research on forestry felling & cultivation machine executive mechanism and load-sensing hydraulic system, Doctor, Beijing Forestry University, China, 2010.
[5]. Wang, D., Liu, J., Wang, J., Identification and classification of scanned target in forest based on hierarchical cluster, Nongye Gongcheng Xuebao/Transactions of the Chinese Society of Agricultural Engineering, 2011, 27, pp. 173-177.
[6]. Wang, D., Liu, J., Wang, J., Diameter fitting by least square algorithm based on the data acquired with a 2-d laser scanner, Procedia Engineering, 2011, 15, pp. 1560-1564.
[7]. Saeedi, S., Paull, L., Trentini, M., Li, H., Neural network-based multiple robot simultaneous localization and mapping, IEEE Transactions on Neural Networks, 2011, 22, pp. 2376-2387.
[8]. Selkäinaho, J. , Adaptive autonomous navigation of mobile robots in unknown environments, Helsinki University of Technology, Finland, 2002.
[9]. Ma, Y. Q., Bazakos, M., Wang, Z., Au, W., 3D scene modeling for activity detection, in Perspectives in conceptual modeling, 2005, Vol. 3770, pp 300-309.
[10]. Gamba, P., Dell'Acqua, F., Houshmand, B., Comparison and fusion of lidar and insar digital elevation models over urban areas, International Journal of Remote Sensing, 2003, 24, pp. 4289-4300.
[11]. Swatantran, A., Dubayah, R., Roberts, D., Hofton, M., Blair, J. B., Mapping biomass and stress in the Sierra Nevada using lidar and hyperspectral data fusion, Remote Sensing of Environment, 2011, 115, pp. 2917-2930.
[12]. Chen, D., Dong, F., Adaptive surface texture synthesis using round-shaped neighbourhoods, Comput. Graph. Forum, 2008, 27, pp. 2128-2142.
[13]. Kolar, R., Kubecka, L., Jan, J., Registration and fusion of the autofluorescent and infrared retinal images, International Journal of Biomedical Imaging, 2008, 2008, 513478.
[14]. Xiuli, G., Huaimin, L., In Recent development of forest industrial robot in china, in Proceedings of the International Conference on Intelligent Computation Technology and Automation (ICICTA' 2010), 11-12 May 2010, pp. 984-987.
[15]. Jutila, J., Kannas, K., Visala, A., In Tree measurement in forest by 2d laser scanning, in Proceedings of the IEEE International Symposium on Computational Intelligence in Robotics and Automation, (CIRA' 2007), 20-23 June 2007, Jacksonville, FL, United States, 2007, pp. 491-496.
[16]. Thies, M., Pfeifer, N., Winterhalder, D., Gorte, B. G. H., Three-dimensional reconstruction of stems for assessment of taper, sweep and lean based on laser scanning of standing trees, Scandinavian Journal of Forest Research, 2004, 19, pp. 571-581.
[17]. Miettinen, M., Ohman, M., Visala, A., Forsman, P., In Simultaneous localization and mapping for forest harvesters, in Proceedings of the IEEE International Conference on Robotics and Automation (ICRA'07), April 10, 2007 - April 14, 2007, Rome, Italy, 2007, pp. 517-522.
[18]. Ohman, M., Miettinen, M., Kannas, K., Jutila, J., Visala, A., Forsman, P. , In Tree measurement and simultaneous localization and mapping system for forest harvesters, Field and Service Robotics, Results of the 6th International Conference, Heidelberg, Germany, 2008, pp. 369-378.
___________________
2013 Copyright ©, International Frequency Sensor Association (IFSA). All rights reserved. (http://www.sensorsportal.com)


Aims and Scope Sensors & Transducers is a peer reviewed international, interdisciplinary journal that provides an advanced forum for the science and technology of physical, chemical sensors and biosensors. It publishes original research articles, timely state-of-the-art reviews and application specific articles with the following devices areas: Physical, chemical and biosensors; Digital, frequency, period, duty-cycle, time interval, PWM, pulse number output sensors and transducers; Theory, principles, effects, design, standardization and modeling; Smart sensors and systems; Sensor instrumentation; Virtual instruments; Sensors interfaces, buses and networks; Signal processing and interfacing; Frequency (period, duty-cycle)-to-code converters, ADC; Technologies and materials; Nanosensors; Microsystems; Applications. Further information on this journal is available from the Publisher's web site: http://www.sensorsportal.com/HTML/DIGEST/Submission.htm Subscriptions An annual subscription includes 12 regular issues and some special issues. Annual subscription rates for 2013 are the following: Electronic version (in printable pdf format): 400.00 EUR Printed with b/w illustrations: 640.00 EUR Printed full color version: 760.00 EUR 40 % discount is available for IFSA Members. Prices include shipping costs by mail. Further information about subscription is available through IFSA Publishing's web site: http://www.sensorsportal.com/HTML/DIGEST/Journal_Subscription.htm Advertising Information If you are interested in advertising or other commercial opportunities please e-mail [email protected] and your enquiry will be passed to the correct person who will respond to you within 24 hours. Please download also our Media Planner 2013: http://www.sensorsportal.com/DOWNLOADS/Media_Planner_2013.pdf Books for Review Publications should be sent to the IFSA Publishing Office: Ronda de Ramon Otero Pedrayo, 42C, 1-5, 08860, Castelldefels, Barcelona, Spain. Abstracting Services This journal is cited, indexed and abstracted by Chemical Abstracts, EBSCO Publishing, IndexCopernicus Journals Master List, ProQuest Science Journals, CAS Source Index (CASSI), Ulrich's Periodicals Directory, Scirus, Google Scholar, etc. Since 2011 Sensors & Transducers journal is covered and indexed by EI Compendex index (including a Scopus, Embase, Engineering Village and Reaxys) in Elsevier products. Instructions for Authors Please visit the journal web page http://www.sensorsportal.com/HTML/DIGEST/Submission.htm Authors must follow the instructions very carefully when submitting their manuscripts. Manuscript must be send electronically in both: MS Word 2003 for Windows (doc) and Acrobat (pdf) formats by e-mail: [email protected]