sensitivity to space and time resolution of a hydrological model using digital elevation data
TRANSCRIPT
HYDROLOGICAL PROCESSES, VOL. 9, 69-81 (1995)
SENSITIVITY TO SPACE AND TIME RESOLUTION OF A HYDROLOGICAL MODEL USING DIGITAL ELEVATION DATA
P. BRUNEAU AND C. GASCUEL-ODOUX
INRA, Science du Sol, 65 Route de Saint-Brieuc, 35042 Rennes cedex, France
P. ROBIN
INRA, Bioclimatologie, 65 Route de Saint-Brieuc, 35042 Rennes cedex, France
Ph. MEROT
INRA, Science du Sol, 65 Route de Saint-Brieuc, 35042 Rennes cedex. France
AND K. BEVEN
Centre for Research on Environmental Systems and Statistics, Lancaster University, Lancaster LA1 4 YQ, UK
ABSTRACT
The space and time resolutions used for the input variables of a distributed hydrological model have a sufficient impact on the model results. This resolution depends on the required accuracy, experimental site and the processes and variables taken into account in the hydrological model. The influence of space and time resolution is studied here for the case of TOPMODEL, a model based on the variable contributing area concept, applied to an experimental 12 km2 catchment (Coet-Dan, Brittany, France) during a two month winter period. A sensitivity analysis to space and time resolution is performed first for input variables derived from the digital elevation data, secondly for the opti- mized values of the TOPMODEL parameters and finally for modelling efficiency. This analysis clearly shows that a relevant domain of space and time resolutions where efficiency is fairly constant can be defined for the input topo- graphic variables, as opposed to another domain of larger resolutions that induces a strong decrease of modelling effci- ency. It also shows that the use of a single set of parameters, defined as mean values of parameters on this relevant domain of resolution, does not modify the accuracy of modelling. The sensitivity of the parameters to space and time resolution allows the physical significance of the parameter values to be discussed.
KEY WORDS Hydrological models Digital elevation data Sensitivity analysis Space/time resolution
INTRODUCTION
Digital elevation data are increasingly being used in hydrological modelling studies. Such data are available at a variety of scales, derived from a variety of original data sources. The distributed hydrological models that use such data vary in process representations, the way in which the elevation data are used and compu- tational complexity. There have, as yet, been few studies that have looked into the interactions that might be expected between the structure of the distributed model, the appropriate model parameter values and the space and time scales at which the input variables are defined. This paper attempts to do so in an appli- cation of the semi-distributed variable contributing area TOPMODEL (Beven and Kirkby, 1979) in an application to the 12 km2 Coetdan experimental catchment in Brittany, France.
Distributed hydrological modelling is a useful tool to simulate the different flows on an experimental catchment if accurate and abundent data are available. It can be a useful aid to understanding the various
CCC 0885-6087/95/010069-13 0 1995 by John Wiley & Sons, Ltd.
Received 30 September 1993 Accepted 24 December 1993
70 P. BRUNEAU ET AL.
processes according to space and time scales, as predicted distributed patterns of hydrological variables can be compared with what is known of the processes operating in the field. Transposing models and parameter values to sites with less information, however, induces an uncertainty that must take into account the rele- vant space and time resolutions of the input variables. The models best suited for transposition to other sites will have few independent and physically based parameters. The strategy of estimating these para- meters on cells or time steps from local and few field measurements must produce small estimated variances and allow those variances to be quantified. A calibration phase may still be necessary and allows some compensation for a lack of information about spatial variability and simplified process representation used by the model. Consistency of the calibrated parameters is often verified a posteriori.
This calibration phase is particularly important for conceptual or multibox models based on simplified processes, as opposed to physically based models that use elementary physical laws. For conceptual models, a few parameters (three to five) are normally sufficient to characterize a catchment if only the discharge data are available for use in calibration (Beven, 1989); however, obtaining a set of optimum and independent values is not guaranteed (Beven, 1993). The problem is not, however, avoided with the so-called physically based models; in fact, because of the large number of interacting parameter values involved and the diffi- culties in obtaining independent estimates of parameter values by measurement, the problem may actually be worse. TOPMODEL uses a model structure that aims to capture the essential aspects of the distributed response of a catchment by means of a simplified physical theory, but which involves only a small number of parameters.
Many experimental studies have been carried out to determine the parameters for which the various types of models are sensitive (see the review of Robin, 1990) and to indicate those for which a better knowledge of their space and time distribution would improve the accuracy of modelling. Physically based models are mainly sensitive to the water content at saturation, flow resistance in the channel network and soils, but also to the initial conditions of the simulations. For the conceptual models, the size of the storage element controlling the production of surface runoff is usually the most important parameter.
The choice of a time and space resolution for input variables is always based on a compromise between the requirement for accuracy, the availability of accurate data and the computational demands of using smaller space and time steps. The purpose of this work was to analyse whether appropriate resolutions can be defined in the particular case of TOPMODEL, which characterizes the hydrological response of the catchment in terms of an index, ln(a/ tanp), derived from an analysis of the catchment topography, which reflects the tendency of water to accumulate at any point of the catchment. The availability of digital terrain models (DTMs) allows the automatic derivation of flow pathways and so provides a useful basis for this type of distributed hydrological modelling (Band, 1986; Beven, 1987; Beven and Wood, 1983; Moore et al., 1991), at least for certain types of catchments that exhibit dynamic surface or subsurface contributing areas. In the form used here, TOPMODEL also uses four parameters globally determined for the whole catchment.
In what follows, the relevance of space and time resolutions to the modelling process is considered in three different ways. A sensitivity analysis to time and space resolution is performed on: (1) the distri- butions of the topographic index derived from the analysis of the DTM; (2) the optimized values of the four parameters of the model; and (3) the modelling efficiency for the simulated flows.
METHODS
TOPMODEL requirements A detailed description of the basis of TOPMODEL is given elsewhere (Beven and Kirkby, 1979; Beven,
1986; Quinn et al., 1991). It is not a fixed model structure but more a collection of concepts based on the topographic index as a measure of hydrological similarity that can be modified according to what is known about the spatially distributed response of a catchment. The different elementary physical processes are simplified using two assumptions: firstly, that the downslope subsurface flows are adequately represented by a succession of steady-state water-table positions; and secondly, that the local hydraulic gradient can
HYDROLOGICAL SPACE-TIME SENSITIVITY 71
be approximated by the local ground surface slope. This assumption requires a detailed analysis of catch- ment topography, but will be most appropriate in catchments of moderate topography with a relatively shallow hydrologically active soil layer. In the form used here an exponential relationship between local storage and downslope flow-rate is assumed. This leads to the index of hydrological similarity being calcu- lated as In(a/tan p) , where a is the upslope area per unit contour length draining through a point, and tan p is the local slope. Four physical parameters, globally determined for the whole catchment, are retained in TOPMODEL: M (in metres) is the coefficient of the exponential decrease of hydraulic conductivity with depth; SKO (in metres by time step) is the hydraulic conductivity at soil surface; SRMAX (in metres) is the maximum storage in the upper layer, used to control the calculation of actual evapotranspiration rates; and CHV (in metres by time step) is the flow velocity in the channel network.
M plays an important part in the model. The theory of TOPMODEL shows that it is involved both as a scaling parameter in the calculation of local storage deficit, Si, from the catchment mean storage deficit, S, as
(Si - S ) / M = [-y - In(a/To tanp)]
where To is the downslope transmissivity at soil saturation (which, assuming isotropy, can be approximated by SKO/M, see Beven, 1986), and is the areal average value of the topographic soil index In(a/To tanp). This equation is used to calculate that part of the catchment that has zero storage deficits at any time step, representing the dynamic contributing area. The parameter M , together with SKO, is also used in the calculation of the outflows from the saturated zone (Beven, 1986) as
Q b = Qo exP(-S/M) where Qo is given by exp(-y).
Precipitation and potential evapotranspiration expressed in metres by time step are the only time depen- dent variables used in this application of TOPMODEL. The spatial variability of these input variables has been neglected, as is often the case, because of the difficulties involved in making accurate spatial estimates (Barancourt et al., 1992).
The catchment characterization deduced from a topographic analysis of the DTM is only space depen- dent, i.e. dependent on the grid size. The DTM used here is calculated on a regular raster grid using a local third-degree polynomial interpolation form the contour data. The derivation of the flow pathways may require some modifications of the DTM, particularly due to sink and dam features, to allow continuous downslope flow pathways to the outlet. The algorithm used here modifies the elevation of a sink or dam cell according to a fixed step and the altitude of the eight neighbours. These steps and the further topo- graphic analysis to derive flow pathways are computed by the MNT-SURF software package (Bruneau, 1992) according to the principles developed in Quinn et al. (1991). This flow pathway algorithm allows multiple flow directions to exit from a single cell. The flow pathways are used to calculate the ln(a/tanp) index for each cell of the raster grid within the catchment. The distribution of cell values defines the distribution function of In a/tan ,8) that is used in the model to characterize the catchment. In this application, different distributions of the topographic index are used for subcatchments defined by the distance to the outlet calculated from the estimated flow pathways, using a distance increment of 1000 m. Predicted subcatchment discharges are routed to the outlet using a linear routing algorithm con- trolled by the parameter CHV.
An efficiency criterion (Nash and Sutcliffe, 1979), calculated from one minus the reduced mean squared error and expressed as a percentage, provides a measure of the error between the simulated and the observed discharge during the calibration period. Simulations of the different flows and of saturated area extensions allow the consistency of the modelling to be checked.
Sensitivity analysis of the simulations to space and time resolutions Two levels of sensitivity analysis to space and time resolution can be distinguished; the first concerns the
input topographic index distribution, the second the modelling sensu strict0 in terms of both the optimized values of the parameters and the results of simulations.
72 P. BRUNEAU ET AL.
The influence of space resolution is analysed from six DTMs independently calculated from scanned 1/10000 contour data. Their grid sizes are respectively 100, 70, 50, 30, 25 and 20m. The following pro- cedures are used on each of these DTMs: correction of the elevation to establish the continuity of the flow pathways; derivation of the flow pathways; delineation of the catchment; and computation of the different topographic variables for each cell (slope, cumulative upslope area and topographic index). The influence of the grid size is analysed in terms of the statistical distributions and areal distributions of these variables.
The influence of the time step on hydrological variables is analysed from a study of the variations in mean and maximum values of precipitation intensity and discharge, according to the time step. Inter- actions with the model assumptions are also considered. Seven steps are distinguished: 30 minutes, one, two, four, seven, 12 and 24 hours.
The influence of time and space resolution on the optimized values of parameters and on the simulation results is then analysed. Optimized parameter values are determined by using a Rosenbrock optimization scheme that minimizes the objective function, here the sum of squared errors. Firstly, a grid size of 30 m is selected to analyse the effect of time resolution and the time step of one hour for the effect of space resol- ution. Secondly, the 42 input data sets, combining the seven time steps and the six grid sizes and inducing 42 sets of optimized parameters are used to analyse the effect on the simulation of the catchment response.
Finally, the influence of using fixed values of parameters on hydrological simulations is assessed for different space and time resolutions. Two sets of parameters are defined from the 42 sets of parameters to simulate the hydrological processes for the different space and time resolutions. The first set consists of the mean values of the optimized values expressed in metres and metres per time step; the second set consists of the mean values of the optimized values expressed in metres and metres/hour. The second set is considered to be more physically meaningful. These two sets of parameters are calculated on the restricted domain of space and time resolution that presents the greatest efficiencies.
EXPERIMENTAL CATCHMENT
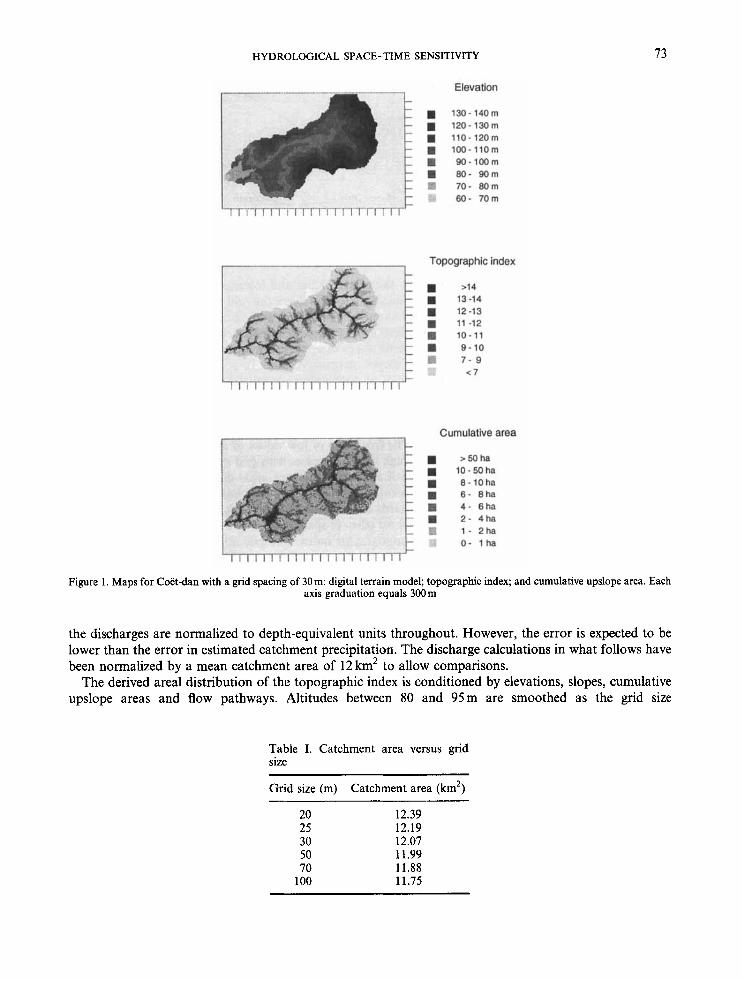
The experimental catchment of Coet-Dan (Brittany, France) is 12 km2 in area with a maximum elevation of 136m, and an elevation range of 71 m (Figure 1). It is intensively cultivated. The northern part is a plateau of open fields; the southern part, with steeper slopes, presents a more developed bocage of small pasture fields surrounded by hedges and walls. The bedrock is mainly schists. Waterlogging and very waterlogged soils are mainly located along the channels; they extend to 16 and 6% of the catchment area, respectively, i.e. about 200 and 70 ha.
The annual precipitation and the annual discharge are 721 and 320 mm, respectively, for the studied year, recorded with a constant time step of 30 min. The studied period ranges from 7 December 1986 to 24 January 1987 and includes 10 successive hydrograph events. This makes up the calibration period; no validation is studied here. For this period, the simulated surface runoff corresponds to about 9% of the whole discharge.
RESULTS
Sensitivity analysis of topographic analysis to space resolution The importance of elevation corrections arising from the occurrence of pit and dam features depends on
the grid size. They are greater and more frequent as the grid size increases. Corrections are necessary mainly along the channels and on the plateau, where variations in level are small. It is due to the lower consistency of elevation estimates as the grid size increases and the slope decreases. On the other hand, when the grid size is too small relative to the original digitized contour interval, the DTM shows low stair-like features oriented parallel to the contour lines, as often observed in DTM computations.
The catchment area decreases as the grid size increases (Table I). The difference of 0.65 km2 between the 20m grid size and lOOm grid corresponds to 5% of the catchment area. Increasing the grid size consequently leads to a decrease in the simulated discharge, or an increase in the ‘observed’ discharges if
HYDROLOGICAL SPACE-TIME SENSITIVITY 73
Figure 1 . Maps for Coet-dan with a grid spacing of 30m: digital terrain model; topographic index; and cumulative upslope area. Each axis graduation equals 300 m
the discharges are normalized to depth-equivalent units throughout. However, the error is expected to be lower than the error in estimated catchment precipitation. The discharge calculations in what follows have been normalized by a mean catchment area of 12 km2 to allow comparisons.
The derived areal distribution of the topographic index is conditioned by elevations, slopes, cumulative upslope areas and flow pathways. Altitudes between 80 and 95m are smoothed as the grid size
Table I. Catchment area versus grid size
Grid size (m) Catchment area (km2)
20 12.39 25 12.19 30 12.07 50 11.99 70 11.88
100 11.75
74 P. BRUNEAU ET AL.
cumulative frequency 1 1 I
0.8
0.6
0.4
0.2
0 I 60 70 80 90 100 110 120 130 140
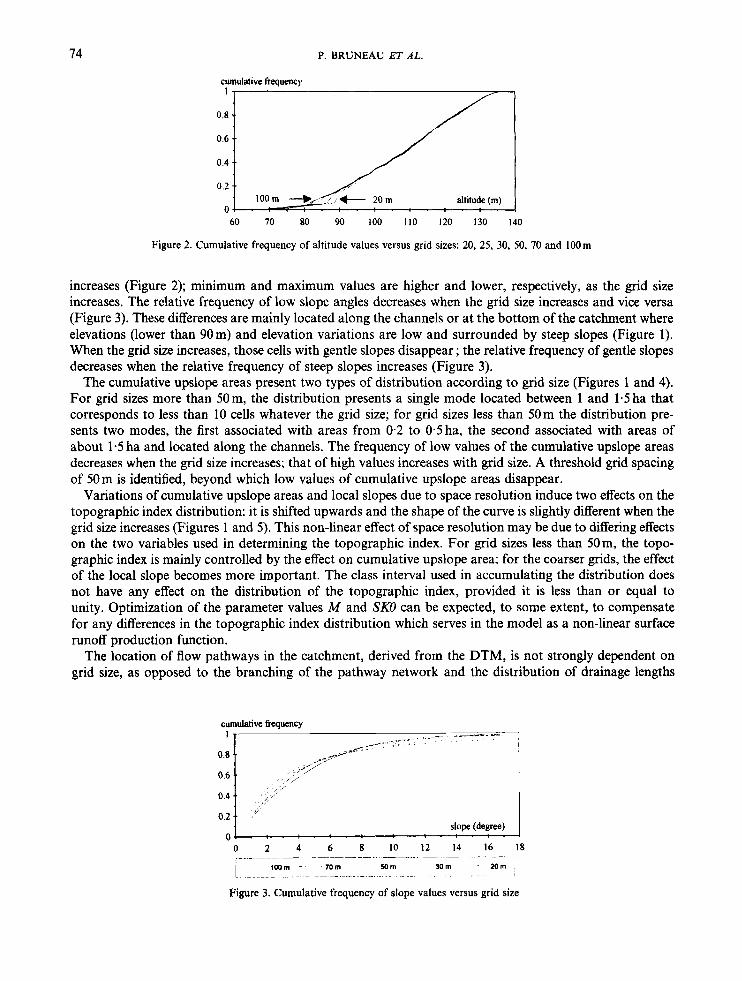
Figure 2. Cumulative frequency of altitude values versus grid sizes: 20, 25, 30, 50, 70 and lOOm
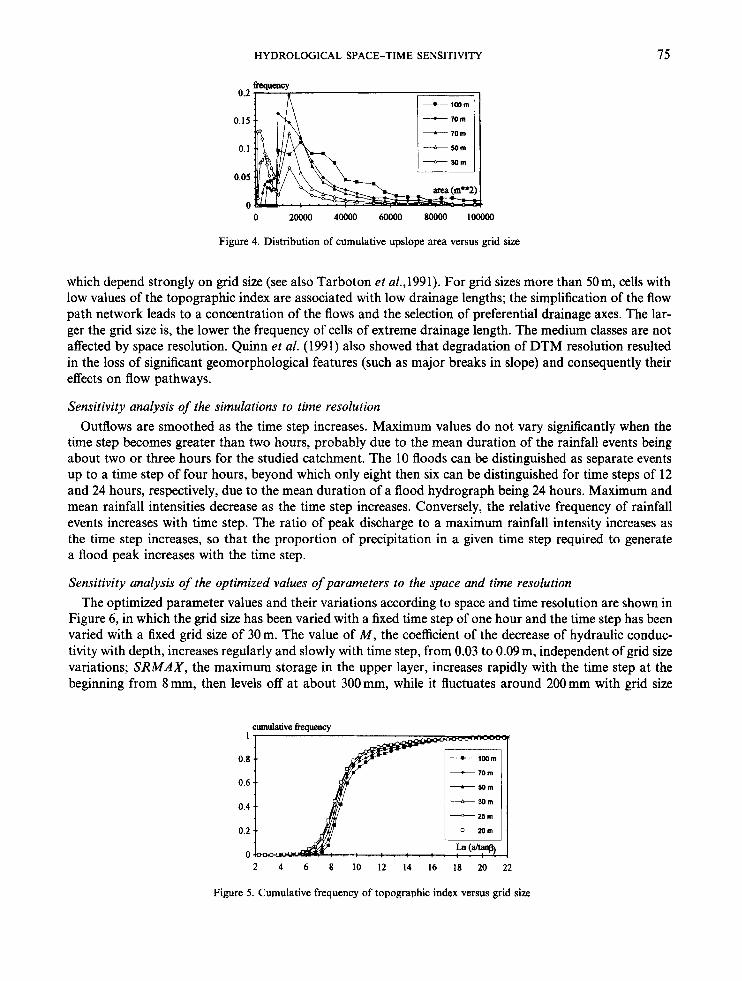
increases (Figure 2); minimum and maximum values are higher and lower, respectively, as the grid size increases. The relative frequency of low slope angles decreases when the grid size increases and vice versa (Figure 3). These differences are mainly located along the channels or at the bottom of the catchment where elevations (lower than 90m) and elevation variations are low and surrounded by steep slopes (Figure 1). When the grid size increases, those cells with gentle slopes disappear ; the relative frequency of gentle slopes decreases when the relative frequency of steep slopes increases (Figure 3).
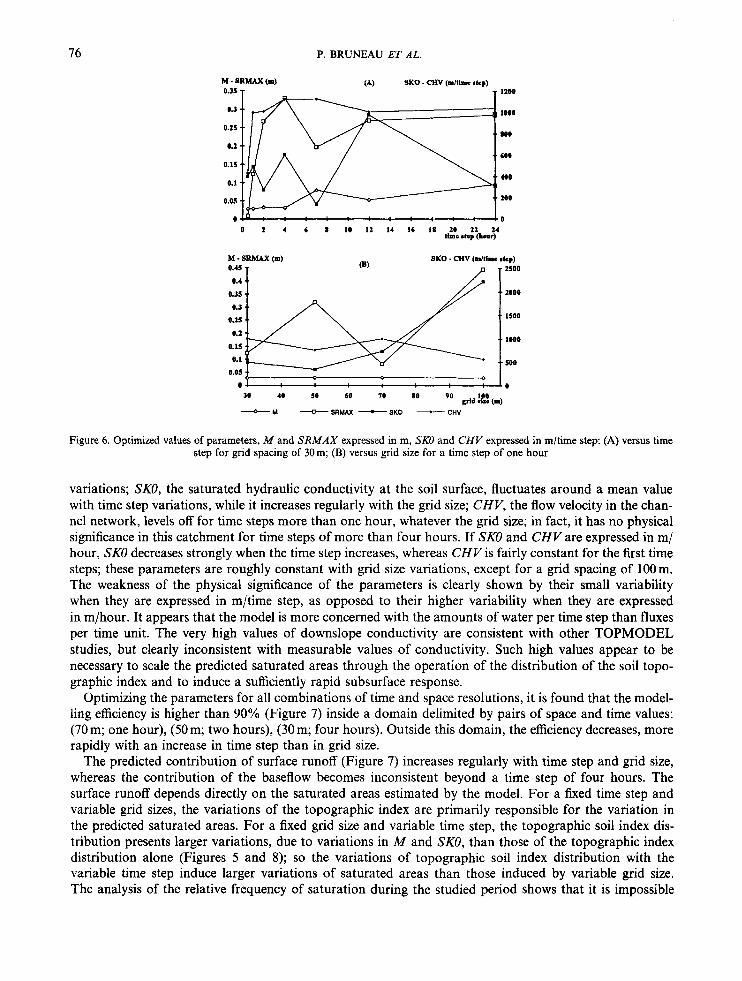
The cumulative upslope areas present two types of distribution according to grid size (Figures 1 and 4). For grid sizes more than 50 m, the distribution presents a single mode located between 1 and 1.5 ha that corresponds to less than 10 cells whatever the grid size; for grid sizes less than 50m the distribution pre- sents two modes, the first associated with areas from 0.2 to 0.5 ha, the second associated with areas of about 1.5 ha and located along the channels. The frequency of low values of the cumulative upslope areas decreases when the grid size increases; that of high values increases with grid size. A threshold grid spacing of 50m is identified, beyond which low values of cumulative upslope areas disappear.
Variations of cumulative upslope areas and local slopes due to space resolution induce two effects on the topographic index distribution: it is shifted upwards and the shape of the curve is slightly different when the grid size increases (Figures 1 and 5). This non-linear effect of space resolution may be due to differing effects on the two variables used in determining the topographic index. For grid sizes less than 50m, the topo- graphic index is mainly controlled by the effect on cumulative upslope area; for the coarser grids, the effect of the local slope becomes more important. The class interval used in accumulating the distribution does not have any effect on the distribution of the topographic index, provided it is less than or equal to unity. Optimization of the parameter values M and SKO can be expected, to some extent, to compensate for any differences in the topographic index distribution which serves in the model as a non-linear surface runoff production function.
The location of flow pathways in the catchment, derived from the DTM, is not strongly dependent on grid size, as opposed to the branching of the pathway network and the distribution of drainage lengths
cumulative frequency
0.2 t I'
slope (degree) o l ' : . :
0 2 4 6 8 10 12 14 16 18
m m 1 i :I--- . _ 1Wm - 70m 50m 30 m
Figure 3. Cumulative frequency of slope values versus grid size
HYDROLOGICAL SPACE-TIME SENSITIVITY 15
0.2
0.15
0.1
0.05
0
Figure 4. Distribution of cumulative upslope area versus grid size
which depend strongly on grid size (see also Tarboton et a1.,1991). For grid sizes more than 50m, cells with low values of the topographic index are associated with low drainage lengths; the simplification of the flow path network leads to a concentration of the flows and the selection of preferential drainage axes. The lar- ger the grid size is, the lower the frequency of cells of extreme drainage length. The medium classes are not affected by space resolution. Quinn et al. (1991) also showed that degradation of DTM resolution resulted in the loss of significant geomorphological features (such as major breaks in slope) and consequently their effects on flow pathways.
Sensitivity analysis of the simulations to time resolution Outflows are smoothed as the time step increases. Maximum values do not vary significantly when the
time step becomes greater than two hours, probably due to the mean duration of the rainfall events being about two or three hours for the studied catchment. The 10 floods can be distinguished as separate events up to a time step of four hours, beyond which only eight then six can be distinguished for time steps of 12 and 24 hours, respectively, due to the mean duration of a flood hydrograph being 24 hours. Maximum and mean rainfall intensities decrease as the time step increases. Conversely, the relative frequency of rainfall events increases with time step. The ratio of peak discharge to a maximum rainfall intensity increases as the time step increases, so that the proportion of precipitation in a given time step required to generate a flood peak increases with the time step.
Sensitivity analysis of the optimized values of parameters to the space and time resolution The optimized parameter values and their variations according to space and time resolution are shown in
Figure 6, in which the grid size has been varied with a fixed time step of one hour and the time step has been varied with a fixed grid size of 30m. The value of M , the coefficient of the decrease of hydraulic conduc- tivity with depth, increases regularly and slowly with time step, from 0.03 to 0.09 m, independent of grid size variations; SRMAX, the maximum storage in the upper layer, increases rapidly with the time step at the beginning from 8 mm, then levels off at about 300 mm, while it fluctuates around 200 mm with grid size
cumulative hquency 1
0.8
0.6
0.4
0.2
0 2 4 6 8 10 12 14 16 18 20 22
Figure 5. Cumulative frequency of topographic index versus grid size
76 P. BRUNEAU ET AL.
. . T 0.3s
1.3
0.2s
t.1
0.15
0.1
0.05
1200
1 o a
800
6OB
400
208
0 4 * : : : : : : : : : : : l o 0 2 4 6 8 10 12 14 16 18 20 22 24
Ha= .tc, (ll.tlr)
M - SRMAX (m) SKO - CHV ( d H a c ~tcp) 0.45 - (B)
0.4 .. 0.35 ..
'. 1008
30 40 50 60 70 80 YO gM!fMtm)
-M -SRMAX -SKO 4 - C H V
Figure 6. Optimized values of parameters, M and SRMAX expressed in m, SKO and CHV expressed in m/time step: (A) versus time step for grid spacing of 30 m; (B) versus grid size for a time step of one hour
variations; SKO, the saturated hydraulic conductivity at the soil surface, fluctuates around a mean value with time step variations, while it increases regularly with the grid size; CHV, the flow velocity in the chan- nel network, levels off for time steps more than one hour, whatever the grid size; in fact, it has no physical significance in this catchment for time steps of more than four hours. If SKO and CHV are expressed in m/ hour, SKO decreases strongly when the time step increases, whereas CHV is fairly constant for the first time steps; these parameters are roughly constant with grid size variations, except for a grid spacing of 100m. The weakness of the physical significance of the parameters is clearly shown by their small variability when they are expressed in m/time step, as opposed to their higher variability when they are expressed in m/hour. It appears that the model is more concerned with the amounts of water per time step than fluxes per time unit. The very high values of downslope conductivity are consistent with other TOPMODEL studies, but clearly inconsistent with measurable values of conductivity. Such high values appear to be necessary to scale the predicted saturated areas through the operation of the distribution of the soil topo- graphic index and to induce a sufficiently rapid subsurface response.
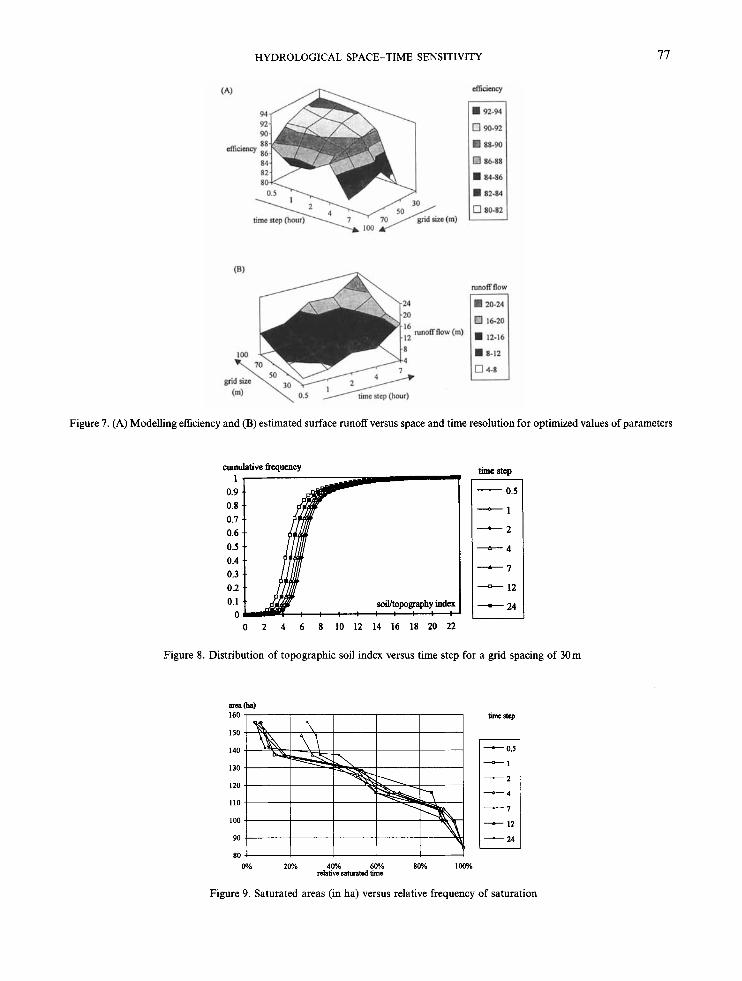
Optimizing the parameters for all combinations of time and space resolutions, it is found that the model- ling efficiency is higher than 90% (Figure 7) inside a domain delimited by pairs of space and time values: (70 m; one hour), (50 m; two hours), (30 m; four hours). Outside this domain, the efficiency decreases, more rapidly with an increase in time step than in grid size.
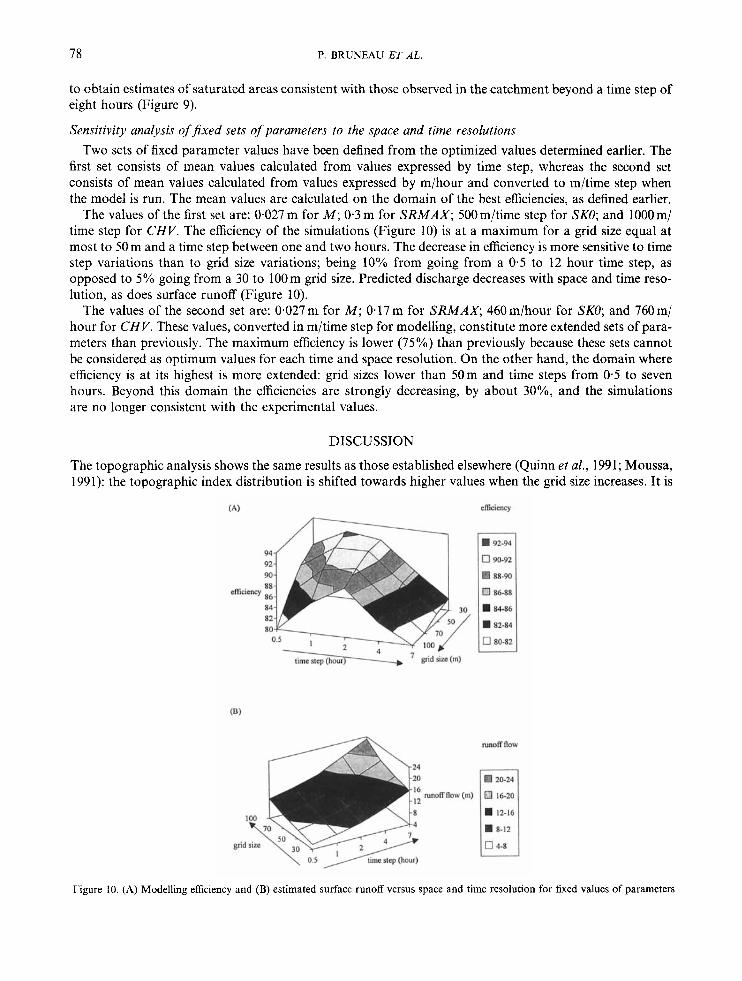
The predicted contribution of surface runoff (Figure 7) increases regularly with time step and grid size, whereas the contribution of the baseflow becomes inconsistent beyond a time step of four hours. The surface runoff depends directly on the saturated areas estimated by the model. For a fixed time step and variable grid sizes, the variations of the topographic index are primarily responsible for the variation in the predicted saturated areas. For a fixed grid size and variable time step, the topographic soil index dis- tribution presents larger variations, due to variations in M and SKO, than those of the topographic index distribution alone (Figures 5 and 8); so the variations of topographic soil index distribution with the variable time step induce larger variations of saturated areas than those induced by variable grid size. The analysis of the relative frequency of saturation during the studied period shows that it is impossible
HYDROLOGICAL SPACE-TIME SENSITIVITY 77
Figure 7. (A) Modelling efficiency and (B) estimated surface runoff versus space and time resolution for optimized values of parameters
0.9 0.8 0.7 0.6 0.5 0.4 0.3 0.2 0.1 0
- 12
--t 24
0 2 4 6 8 10 12 14 16 18 20 22
Figure 8. Distribution of topographic soil index versus time step for a grid spacing of 30m
160 7 I I I I I
150 I d \ I I I I I I h m
- 0,s
- 1 -- - 4
- 7 - 12
24 - I I I I I
0% 2G% 4.0% 60% 80% loOo/. relave satwtcd tune
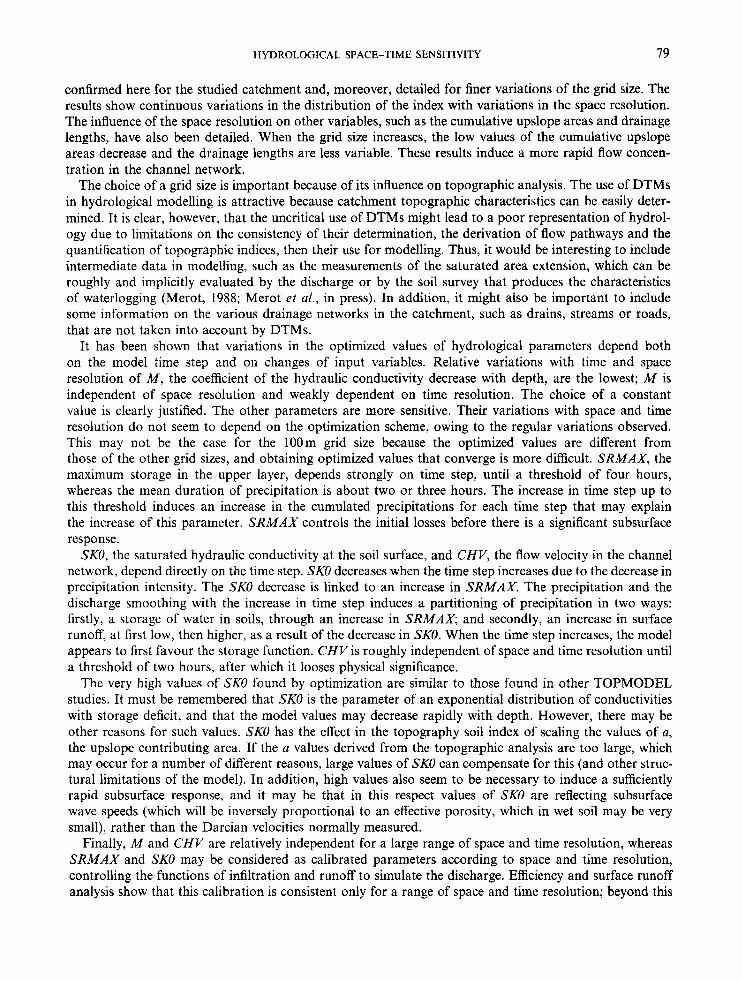
Figure 9. Saturated areas (in ha) versus relative frequency of saturation
78 P. BRUNEAU ET AL.
to obtain estimates of saturated areas consistent with those observed in the catchment beyond a time step of eight hours (Figure 9).
Sensitivity analysis of fixed sets of parameters to the space and time resolutions Two sets of fixed parameter values have been defined from the optimized values determined earlier. The
first set consists of mean values calculated from values expressed by time step, whereas the second set consists of mean values calculated from values expressed by m/hour and converted to m/time step when the model is run. The mean values are calculated on the domain of the best efficiencies, as defined earlier.
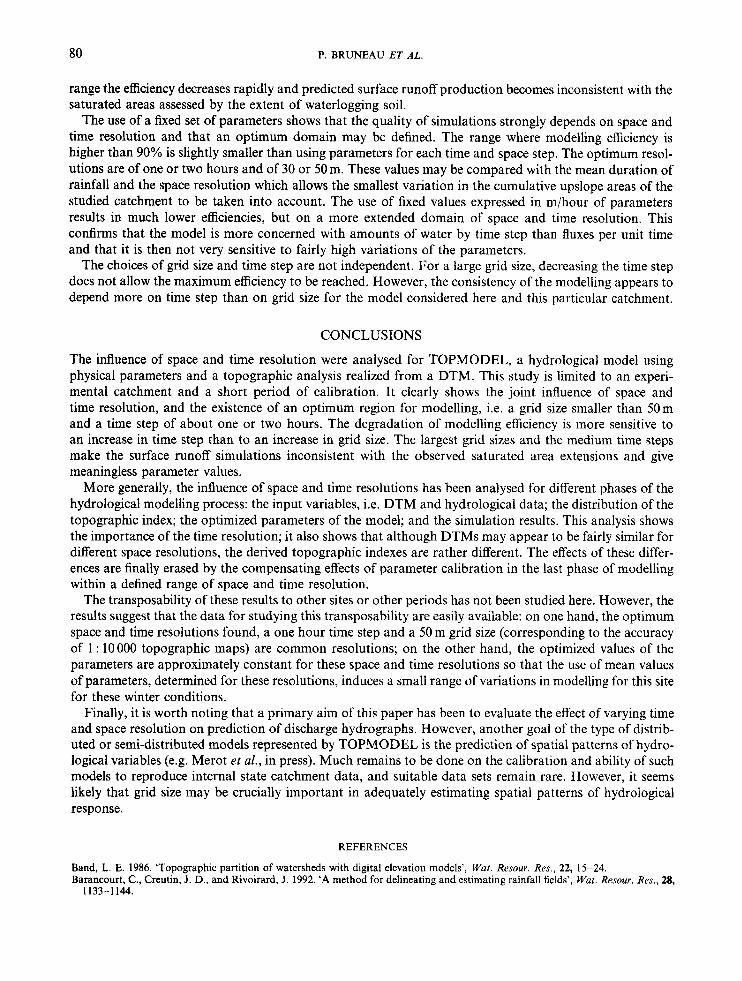
The values of the first set are: 0-027 m for M ; 0.3 m for SRMAX; 500m/time step for SKO; and 1OOOm/ time step for CHV. The efficiency of the simulations (Figure 10) is at a maximum for a grid size equal at most to 50 m and a time step between one and two hours. The decrease in efficiency is more sensitive to time step variations than to grid size variations; being 10% from going from a 0-5 to 12 hour time step, as opposed to 5% going from a 30 to lOOm grid size. Predicted discharge decreases with space and time reso- lution, as does surface runoff (Figure lo).
The values of the second set are: 0.027m for M ; 0.17m for SRMAX; 460m/hour for SKO; and 760m/ hour for CHV. These values, converted in m/time step for modelling, constitute more extended sets of para- meters than previously. The maximum efficiency is lower (75%) than previously because these sets cannot be considered as optimum values for each time and space resolution. On the other hand, the domain where efficiency is at its highest is more extended: grid sizes lower than 50m and time steps from 0.5 to seven hours. Beyond this domain the efficiencies are strongly decreasing, by about 30%, and the simulations are no longer consistent with the experimental values.
DISCUSSION
The topographic analysis shows the same results as those established elsewhere (Quinn et aE., 1991; Moussa, 1991): the topographic index distribution is shifted towards higher values when the grid size increases. It is
Figure 10. (A) Modelling efficiency and (B) estimated surface runoff versus space and time resolution for fixed values of parameters
HYDROLOGICAL SPACE-TIME SENSITIVITY 79
confirmed here for the studied catchment and, moreover, detailed for finer variations of the grid size. The results show continuous variations in the distribution of the index with variations in the space resolution. The influence of the space resolution on other variables, such as the cumulative upslope areas and drainage lengths, have also been detailed. When the grid size increases, the low values of the cumulative upslope areas decrease and the drainage lengths are less variable. These results induce a more rapid flow concen- tration in the channel network.
The choice of a grid size is important because of its influence on topographic analysis. The use of DTMs in hydrological modelling is attractive because catchment topographic characteristics can be easily deter- mined. It is clear, however, that the uncritical use of DTMs might lead to a poor representation of hydrol- ogy due to limitations on the consistency of their determination, the derivation of flow pathways and the quantification of topographic indices, then their use for modelling. Thus, it would be interesting to include intermediate data in modelling, such as the measurements of the saturated area extension, which can be roughly and implicitly evaluated by the discharge or by the soil survey that produces the characteristics of waterlogging (Merot, 1988; Merot et al., in press). In addition, it might also be important to include some information on the various drainage networks in the catchment, such as drains, streams or roads, that are not taken into account by DTMs.
It has been shown that variations in the optimized values of hydrological parameters depend both on the model time step and on changes of input variables. Relative variations with time and space resolution of M , the coefficient of the hydraulic conductivity decrease with depth, are the lowest; M is independent of space resolution and weakly dependent on time resolution. The choice of a constant value is clearly justified. The other parameters are more sensitive. Their variations with space and time resolution do not seem to depend on the optimization scheme, owing to the regular variations observed. This may not be the case for the lOOm grid size because the optimized values are different from those of the other grid sizes, and obtaining optimized values that converge is more difficult. SRMAX, the maximum storage in the upper layer, depends strongly on time step, until a threshold of four hours, whereas the mean duration of precipitation is about two or three hours. The increase in time step up to this threshold induces an increase in the cumulated precipitations for each time step that may explain the increase of this parameter. SRMAX controls the initial losses before there is a significant subsurface response.
SKO, the saturated hydraulic conductivity at the soil surface, and CHV, the flow velocity in the channel network, depend directly on the time step. SKO decreases when the time step increases due to the decrease in precipitation intensity. The SKO decrease is linked to an increase in SRMAX. The precipitation and the discharge smoothing with the increase in time step induces a partitioning of precipitation in two ways: firstly, a storage of water in soils, through an increase in SRMAX, and secondly, an increase in surface runoff, at first low, then higher, as a result of the decrease in SKO. When the time step increases, the model appears to first favour the storage function. CHVis roughly independent of space and time resolution until a threshold of two hours, after which it looses physical significance.
The very high values of SKO found by optimization are similar to those found in other TOPMODEL studies. It must be remembered that SKO is the parameter of an exponential distribution of conductivities with storage deficit, and that the model values may decrease rapidly with depth. However, there may be other reasons for such values. SKO has the effect in the topography soil index of scaling the values of a, the upslope contributing area. If the a values derived from the topographic analysis are too large, which may occur for a number of different reasons, large values of SKO can compensate for this (and other struc- tural limitations of the model). In addition, high values also seem to be necessary to induce a sufficiently rapid subsurface response, and it may be that in this respect values of SKO are reflecting subsurface wave speeds (which will be inversely proportional to an effective porosity, which in wet soil may be very small), rather than the Darcian velocities normally measured.
Finally, M and CHV are relatively independent for a large range of space and time resolution, whereas SRMAX and SKO may be considered as calibrated parameters according to space and time resolution, controlling the functions of infiltration and runoff to simulate the discharge. Efficiency and surface runoff analysis show that this calibration is consistent only for a range of space and time resolution; beyond this
80 P. BRUNEAU ET AL.
range the efficiency decreases rapidly and predicted surface runoff production becomes inconsistent with the saturated areas assessed by the extent of waterlogging soil.
The use of a fixed set of parameters shows that the quality of simulations strongly depends on space and time resolution and that an optimum domain may be defined. The range where modelling efficiency is higher than 90% is slightly smaller than using parameters for each time and space step. The optimum resol- utions are of one or two hours and of 30 or 50 m. These values may be compared with the mean duration of rainfall and the space resolution which allows the smallest variation in the cumulative upslope areas of the studied catchment to be taken into account. The use of fixed values expressed in m/hour of parameters results in much lower efficiencies, but on a more extended domain of space and time resolution. This confirms that the model is more concerned with amounts of water by time step than fluxes per unit time and that it is then not very sensitive to fairly high variations of the parameters.
The choices of grid size and time step are not independent. For a large grid size, decreasing the time step does not allow the maximum efficiency to be reached. However, the consistency of the modelling appears to depend more on time step than on grid size for the model considered here and this particular catchment.
CONCLUSIONS
The influence of space and time resolution were analysed for TOPMODEL, a hydrological model using physical parameters and a topographic analysis realized from a DTM. This study is limited to an experi- mental catchment and a short period of calibration. It clearly shows the joint influence of space and time resolution, and the existence of an optimum region for modelling, i.e. a grid size smaller than 50m and a time step of about one or two hours. The degradation of modelling efficiency is more sensitive to an increase in time step than to an increase in grid size. The largest grid sizes and the medium time steps make the surface runoff simulations inconsistent with the observed saturated area extensions and give meaningless parameter values.
More generally, the influence of space and time resolutions has been analysed for different phases of the hydrological modelling process: the input variables, i.e. DTM and hydrological data; the distribution of the topographic index; the optimized parameters of the model; and the simulation results. This analysis shows the importance of the time resolution; it also shows that although DTMs may appear to be fairly similar for different space resolutions, the derived topographic indexes are rather different. The effects of these differ- ences are finally erased by the compensating effects of parameter calibration in the last phase of modelling within a defined range of space and time resolution.
The transposability of these results to other sites or other periods has not been studied here. However, the results suggest that the data for studying this transposability are easily available: on one hand, the optimum space and time resolutions found, a one hour time step and a 50 m grid size (corresponding to the accuracy of 1 : 10000 topographic maps) are common resolutions; on the other hand, the optimized values of the parameters are approximately constant for these space and time resolutions so that the use of mean values of parameters, determined for these resolutions, induces a small range of variations in modelling for this site for these winter conditions.
Finally, it is worth noting that a primary aim of this paper has been to evaluate the effect of varying time and space resolution on prediction of discharge hydrographs. However, another goal of the type of distrib- uted or semi-distributed models represented by TOPMODEL is the prediction of spatial patterns of hydro- logical variables (e.g. Merot et af., in press). Much remains to be done on the calibration and ability of such models to reproduce internal state catchment data, and suitable data sets remain rare. However, it seems likely that grid size may be crucially important in adequately estimating spatial patterns of hydrological response.
REFERENCES
Band, L. E. 1986. ‘Topographic partition of watersheds with digital elevation models’, Wac. Resour. RKS., 22, 15-24. Barancourt, C., Creutin, J . D., and Rivoirard, J. 1992. ‘A method for delineating and estimating rainfall fields’, War. Resour. RKS., 28,
1133-1 144.
HYDROLOGICAL SPACE-TIME SENSITIVITY 81
Beven, K. J. 1986. ‘Hillslope runoff processes and flood frequency characteristics’ Abrahams, A. D. (Ed.), in Hillslope Processes. Allen
Beven, K. J. 1987. ‘Towards the use of catchment geomorphology in flood frequency predictions’, Earth Surf: Processes Landf, 12,
Beven, K. J. 1989. ‘Changing ideas in hydrology. The case of physically based models’, J . Hydrol., 105, 157-172. Beven, K. J. 1993. ‘Prophecy, reality and uncertainty in distributed hydrological modelling’, Adv. War. Resour., 16, 41-51. Beven, J. K., and Kirkby, M. J. 1979. ‘A physically based, variable contributing area model of catchment hydrology’, Hydrol. Sci., 24,
Beven, K. J., and Wood, E. F. 1983, ‘Catchment geomorphology and the dynamics of runoff contributing areas’, J. Hydrof., 65,
Bruneau, P. 1992. ‘MNT-TOP, programme de traitement des MNTs et de modklisation hydrologique par TOPMODEL‘. Note interne,
Merot, P. 1988. ‘Les zones de sources i surface variable et la question de leur localisation’, Hydrol. Continent., 3, 105-115. Merot, P., Ezzahar, B., Walter, C., and Aurousseau, P. Mapping hydromorphic soils using digital terrain models, Hydrol. Process., in
Moore, I. D., Grayson, R. B., and Ladson, R. B. 1991. ‘Digital terrain modelling: a review of hydrological, geomorphological and
Moussa, R. 1991. ‘Variabilitk spatio-temporelle et modklisation hydrologique. Application au bassin versant du Gardon d‘Anduze’,
Nash, J. E., and Sutcliffe, J. V. 1979. ‘River flow forecasting through conceptual models, 1. A discussion of principles’, J . Hydrol., 10,
Quinn, P., Beven, K., Chevallier, P., and Planchon, 0. 1991. ‘The prediction of hillslope flow paths for distributed hydrological model-
Robin, P. 1990. ‘Bilan hydrique des sols: quantification de la variabilite spatiale et de l’incertitude. Application a la modelisation hy-
Tarboton, D. G., Bras, R. L., and Rodriguez-Iturbe, I. 1991. ‘On the extraction of channel networks from digital elevation data’,
and Unwin, Boston, pp. 187-202.
69-82.
43-69.
139-158.
INRA, Science du Sol, Rennes, 41 pp.
press.
biological applications’, Hydrol. Process., 5, 3-30.
Th&e de Doctorat, USTL, Montpelier, 314 pp.
282-290.
ling using digital terrain models’, Hydrol. Process., 5 , 59-79.
drologique de la Guadeloupe, Ile de Basse-Terre’, Thise de Doctorat, ENSMP and INA-PG, 196 pp.
Hydrol. Process., 5, 8 1 - 100.