sensitivity analysis of parameters used in spectrum's aim ... · the department of economic...
TRANSCRIPT

United Nations
Department of Economic and Social Affairs
Population Division
Technical Paper
No. 2019/1
A Sensitivity Analysis of Parameters Used in
Spectrum’s Aids Impact Model: The Role of the
Sex Ratio of HIV Incidence and Adult Treatment
on Mortality Levels and Trends

This page is intentionally left blank
Population Division
Technical Paper
No. 2019/1
A Sensitivity Analysis of Parameters Used in
Spectrum’s Aids Impact Model: The Role of the
Sex Ratio of HIV Incidence and Adult Treatment
on Mortality Levels and Trends
François Pelletier
United Nations New York, 2019
The Department of Economic and Social Affairs of the United Nations Secretariat is a vital interface between
global policies in the economic, social and environmental spheres and national action. The Department works in
three main interlinked areas: (i) it compiles, generates and analyses a wide range of economic, social and
environmental data and information on which States Members of the United Nations draw to review common
problems and take stock of policy options; (ii) it facilitates the negotiations of Member States in many
intergovernmental bodies on joint courses of action to address ongoing or emerging global challenges; and (iii) it
advises interested Governments on the ways and means of translating policy frameworks developed in United
Nations conferences and summits into programmes at the country level and, through technical assistance, helps
build national capacities.
The Population Division of the Department of Economic and Social Affairs provides the international community
with timely and accessible population data and analysis of population trends and development outcomes for all
countries and areas of the world. To this end, the Division undertakes regular studies of population size and
characteristics and of all three components of population change (fertility, mortality and migration). Founded in
1946, the Population Division provides substantive support on population and development issues to the United
Nations General Assembly, the Economic and Social Council and the Commission on Population and
Development. It also leads or participates in various interagency coordination mechanisms of the United Nations
system. The work of the Division also contributes to strengthening the capacity of Member States to monitor
population trends and to address current and emerging population issues.
Notes
The designations employed in this report and the material presented in it do not imply the expression of any
opinions whatsoever on the part of the Secretariat of the United Nations concerning the legal status of any country,
territory, city or area or of its authorities, or concerning the delimitation of its frontiers or boundaries.
The term “country” as used in this paper also refers, as appropriate, to territories or areas.
This publication has been issued without formal editing.
This technical paper is available in electronic format on the Division’s website at www.unpopulation.org. For
further information about this technical paper, please contact the Population Division, Department of Economic
and Social Affairs, Two United Nations Plaza, DC2-1950, New York, 10017, USA; phone: +1 212-963-3209;
e-mail: [email protected].
Suggested citation:
Pelletier, Francois. (2019). A Sensitivity Analysis of Parameters Used in Spectrum’s Aids Impact Model: The
Role of the Sex Ratio of HIV Incidence and Adult Treatment on Mortality Levels and Trends, United Nations,
Department of Economics and Social Affairs, Population Division, Technical Paper No. 1.
Copyright © United Nations, 2019, made available under a Creative Commons license CC BY 3.0
IGO: http://creativecommons.org/licenses/by/3.0/igo/

iii
PREFACE
Within the framework of the biennial publication World Population Prospects, the United Nations
Population Division has been generating estimates and projections of mortality indicators for several decades
using standard approaches for all countries of the world. Upon the onset of the HIV/AIDS epidemic, new
approaches were adopted to measure mortality within a number of countries highly affected by this epidemic. In
the 2017 Revision of the World Population Prospects and for countries most highly affected by the HIV/AIDS
epidemic, mortality levels were estimated and projected by modelling explicitly the course of the epidemic and
projecting the yearly incidence of HIV infection, while adding the AIDS related deaths to those from the no-
AIDS scenario. The Spectrum software and AIM module (Aids Impact Model) were used to estimate the
demographic impact of the HIV/AIDS epidemic in selected countries.
This technical paper presents selected results from a sensitivity analysis of parameters used in Spectrum’s
AIM module on mortality levels and trends. It illustrates how modifications in time-series of selected input
parameters or values used in the AIM module may influence the estimated and projected levels and trends of all-
cause mortality, using as examples modifications that have been made in a few countries affected by the
HIV/AIDS epidemic, namely Gabon, Malawi and Zimbabwe. The analysis focusses on the role of the sex ratio
of HIV incidence and “adult treatment” on mortality levels and trends, using selected mortality indicators.
The author gratefully acknowledges Mr. John Stover from Avenir Health, as well as Ms. Sara Hertog, Mr.
Frank Swiaczny and Mr. Guangyu Zhang from the United Nations Population Division for their insightful
comments and useful inputs.
The purpose of the Technical Paper series is to publish substantive and methodological research on
population issues carried out by experts both within and outside the United Nations system. The series promotes
scientific understanding of population issues among Governments, national and international organizations,
research institutions and individuals engaged in social and economic planning, research and training.
The Technical Paper series as well as other population information may be accessed on the Population
Division’s website at www.unpopulation.org. For further information about this technical paper, please contact
the Population Division, Department of Economic and Social Affairs, Two United Nations Plaza, DC2-1950,
New York, 10017, USA; phone: +1 212-963-3209; e-mail: [email protected].

This page is intentionally left blank
v
CONTENTS
PREFACE ....................................................................................................................................................... iii
1. INTRODUCTION ..................................................................................................................................... 1
2. OVERALL SETTING OF THE SENSITIVITY ANALYSIS .............................................................................. 3
3. RESULTS ............................................................................................................................................... 4
4. DISCUSSION AND RECOMMENDATIONS .............................................................................................. 16
REFERENCES ............................................................................................................................................... 18
FIGURES
Figure 1. Sex ratios of HIV incidence: original and modified patterns, Malawi, 1980-2030 ..................................... 5
Figure 2. Life expectancy at birth for males and females: No-AIDS scenario and AIDS scenarios with
original and modified sex ratios of HIV incidence, Malawi, 1980-2030 .................................................... 6
Figure 3. Sex ratios of life expectancy at birth (F/M): No-AIDS scenario and AIDS scenarios with original
and modified sex ratios of HIV incidence, Malawi, 1980-2030 ................................................................. 6
Figure 4. Adult mortality estimates (45q15) for males and females: No-AIDS scenario and AIDS scenarios
with original and modified sex ratios of HIV incidence, Malawi, 1995-2015 ............................................ 7
Figure 5. Sex ratios of HIV incidence: original, modified and lower patterns, Gabon, 1980-2030 ........................... 8
Figure 6. Sex ratios of life expectancy at birth (F/M): No-AIDS scenario and AIDS scenarios with original,
modified and lower sex ratios of HIV incidence, Gabon, 1980-2030 ......................................................... 9
Figure 7. Adult mortality estimates (45q15) for males and females: AIDS scenarios with original and
modified sex ratios of HIV incidence, Gabon, 1995-2015 ........................................................................ 10
Figure 8. Adult mortality estimates (45q15) for males and females: AIDS scenarios with original and lower
sex ratios of HIV incidence, Gabon, 1995-2015 ....................................................................................... 10
Figure 9. Sex ratios of HIV incidence: original and modified patterns, Zimbabwe, 1980-2030 .............................. 11
Figure 10. Adult mortality estimates (45q15) for males and females: AIDS scenarios with original and
modified sex ratios of HIV incidence, Zimbabwe, 1995-2015 ................................................................. 12
Figure 11. Estimates and projections of the percentage of HIV-positive adult men and women who are in
need of receiving ART, 2000-2030, Zimbabwe ........................................................................................ 13
Figure 12. Life expectancy at birth for males and females: AIDS scenarios with and without adult treatment,
Zimbabwe, 1980-2030 .............................................................................................................................. 13
Figure 13. Sex ratios of life expectancy at birth (F/M): No-AIDS scenario and AIDS scenarios with and
without adult treatment, Zimbabwe, 1980-2030 ....................................................................................... 14
Figure 14. Estimates and projections of the percentage of HIV-positive adult men and women who are in
need of receiving ART, with fluctuating and smoothed adult treatment levels, 2000-2020 ..................... 15
Figure 15. Adult mortality estimates (45q15) for both sexes combined: AIDS scenarios with fluctuating and
smoothed adult treatment levels, 2000-2020 ............................................................................................. 15
vi
ANNEX TABLES
Figure A. 1. Sex ratios of HIV incidence, original patterns, selected countries, 1980-2014 ...................................... 19
Figure A. 2. Estimates of the percentage of HIV-positive adult men (A) and women (B) who are in need of
receiving ART, selected countries, 2000-2015 ...................................................................................... 20
Figure A. 3. Adult mortality estimates (35q15) for males and females based on Demographic Health Surveys
- Gabon, Malawi and Zimbabwe- for selected periods .......................................................................... 22
1
A SENSITIVITY ANALYSIS OF PARAMETERS USED IN SPECTRUM’S
AIDS IMPACT MODEL ON MORTALITY LEVELS AND TRENDS
1. INTRODUCTION
Within the framework of the biennial publication World Population Prospects, the United Nations
Population Division has been generating estimates and projections of mortality indicators for several
decades using standard approaches for all countries of the world. Upon the onset of the HIV/AIDS
epidemic, new approaches were adopted to measure mortality within a number of countries highly affected
by this epidemic. The general approach for deriving estimates and projections of mortality was not
appropriate for countries whose recent mortality patterns had been significantly affected by this epidemic.
The particular dynamic of HIV/AIDS and the severity of its outcome require explicit modelling of the
epidemic. Unlike other infectious diseases, HIV/AIDS has a very long incubation period during which an
infected person is mostly symptom-free but already infectious. Also, unlike many other infectious diseases,
individuals do not develop immunity, but, in the absence of treatment, almost always die as a consequence
of their compromised immune system. Another reason for an explicit modelling of the HIV/AIDS is the
avalanche-like process of the infection spreading through a population and the particular age pattern of
infection exhibited by HIV/AIDS. The additional deaths due to HIV/AIDS, predominantly occurring among
adults in their reproductive age, consequently distort the usual U-shaped age profile of mortality; this
distorted atypical pattern cannot be found in the model life tables that are available to demographers
(Heuveline, 2003). In more recent years, the availability and use of antiretroviral therapy (ART) has also
modified substantially the survival prospects of people affected by this epidemic.
As a consequence, instead of an overall mortality process that can be captured by standard age patterns
of mortality and smooth trends of changing life expectancy, for countries highly affected by HIV/AIDS,
two separate mortality processes have been modelled: the mortality due to the HIV/AIDS epidemic itself
and the mortality that prevails among the non-infected population. The latter is often called the level of
“background mortality” and has often been reported as the no-AIDS scenario.
In the 2017 Revision of the World Population Prospects (WPP 2017) and for countries most highly
affected by the HIV/AIDS epidemic, mortality levels were estimated and projected by modelling explicitly
the course of the epidemic and projecting the yearly incidence of HIV infection, while adding the AIDS
related deaths to those from the no-AIDS scenario (United Nations, 20171). The Spectrum2 software and
AIM module (Aids Impact Model) were used to estimate the demographic impact of the HIV/AIDS
epidemic in selected countries. The model was developed by the UNAIDS Reference Group on Estimates,
Modelling and Projections (Stanecki, Garnett, and Ghys, 2012; Stover, Brown, and Marston, 2012), and
epidemiological parameters used by UNAIDS were made available to the Population Division in 2016.
Most of these were used by the Population Division to estimate the mortality impact of the HIV/AIDS
epidemic while some were adjusted, most importantly the sex ratio of HIV incidence. extracted
The Spectrum software is also used by national programmes and the Joint United Nations Programme
on HIV/AIDS (UNAIDS) “to prepare estimates of trends and current values of key HIV indicators for 161
countries. The model uses country-specific HIV surveillance, national surveys, case reports, and vital
registration data to determine trends in HIV prevalence and incidence. These are combined with country-
specific data on program outputs…and global/regional epidemiological patterns…to produce estimates of
1 “Country files” used in updating the World Population Prospects were utilized to conduct portions of this analysis though some mortality indicators
were recomputed based on annual data in the Spectrum files (5-year averages may differ slightly from official estimates). Non-published data from
the no-AIDS scenario and times-series of selected parameters were taken from the “country files”. 2 For accessing the official versions of Spectrum, please see: www.avenirhealth.org/software-spectrum.php. A special release of Spectrum
(UNPOP100, December 2014), specifically extended to handle higher life expectancy projections up to age 100 was used for the 2017 Revision.
The same version (v.5.45 beta 10) was used to generate the simulations in the current sensitivity analysis and for updating the countries for which explicit modelling of HIV/AIDS was employed in the 2017 Revision. Spectrum is an analytical tool developed to support policy decisions
concerning public health. Spectrum includes modules for examining health intervention impact and costing along with underlying demographics.

2
key indicators…” (Stover and others, 2017, p. S5-6). AIM, a module within Spectrum, “is a computer
program for projecting the impact of the HIV/AIDS epidemic. It can be used to estimate the number of
people infected with HIV, the number of new infections, the need for treatment….and many other indicators
of interest.” (Avenir Health, 2019, p. 89). “AIM requires that a demographic projection first be prepared…”
(ibid, p. 94). Among other inputs, AIM requires an assumption about the past and future course of adult
HIV incidence and treatment coverage. In a nutshell, several input parameters are used to generate specific
epidemiological patterns which are then combined into a cohort component demographic model.
The Population Division has been incorporating the impact of the HIV/AIDS epidemic on its mortality
estimates for some time, either by relying on Spectrum/AIM in more recent years or other software with
similar approaches in previous years. When this overall modelling exercise was initiated in the 1990s, for
many of the countries highly affect by the HIV/AIDS epidemic, limited data, especially on adult mortality,
had been made available or had been thoroughly investigated, not allowing for a systematic comparison
between the modelled estimates and other empirical evidence. In more recent years, and with an increase
in the availability and analysis of empirical mortality estimates, such comparisons have been made and
have led to some questioning or reviewing of the modelled estimates. In that regard and in order to address
concerns related to the sex ratio of all-cause mortality in specific age groups, the ratios of female to male
HIV incidence for ages 15-49 (or sex ratio of HIV incidence) were adjusted for a number of countries within
the 2017 Revision in order to yield modelled estimates that are more consistent with observed mortality
estimates.
Considering that Spectrum/AIM is used by many national programmes, national and international
organizations, academics, etc., to measure the demographic impact of the HIV/AIDS epidemic, among
other things, it was considered important to further explore the role of specific input parameters within the
module on the generated mortality outputs.
The purpose of this technical paper is to illustrate how modifications in time-series of selected input
parameters or values used in the AIM module of Spectrum may influence the estimated and projected levels
and trends of all-cause mortality.
Within this analysis, the focus is on the following input variables:
1) The sex ratio of HIV incidence (F/M), described as the ratio of female to male incidence in ages
15-49;
2) The percentage of HIV-positive adult men and women who are in need of receiving antiretroviral
therapy3 (ART), also referred to as “adult treatment”.
The mortality indicators that are analysed are as follow:
1) Life expectancy at birth by sex;
2) The sex ratio of life expectancy at birth (F/M; female to male ratio);
3) The estimates of adult mortality by sex, described as the probability of dying between ages 15 and
60 (45q15).
3 Refers to the adults receiving ART plus those eligible but not receiving treatment. Estimates of the need of receiving ART are based on those who
are eligible according to CD4 count criteria (Avenir Health, 2019)
3
2. OVERALL SETTING OF THE SENSITIVITY ANALYSIS
The starting point of this analysis are the results from the 2017 Revision of the World Population
Prospects, using selected country examples. The 2017 Revision made explicit modelling assumptions to
incorporate the demographic impact of the HIV/AIDS epidemic for 18 countries where HIV prevalence
among persons aged 15 to 49 was ever equal to or greater than 5 per cent between 1980 and 2015. Using
as examples modifications that have been made in certain inputs values for a few countries, namely Gabon,
Malawi and Zimbabwe, for which the AIDS mortality was modelled using the AIM module, we illustrate
how these changes influence the all-cause mortality levels and trends. The analysis focusses on the impact
of the sex ratio of HIV incidence and the “adult treatment” on mortality levels and trends. A brief illustration
of the role of fluctuating vs. smoothed proportions of HIV-positive adults in need of receiving treatment on
mortality trends is also presented.
A. Sex ratio of HIV incidence
At a given HIV incidence rate for the population of both women and men combined, the sex ratio of
HIV incidence determines its distribution by sex4. A ratio above one implies that the incidence rate is
higher for women than men, and, a ratio below one, that the incidence rate is higher for men than women,
having implications on their respective simulated survival prospects in subsequent years. Within Spectrum,
adult HIV incidence is basically disaggregated into female and male incidence by specifying the ratio of
new female infections to new male infections. For countries with “generalized epidemics” where HIV is
firmly established in the general population5, it is generally assumed that the ratio is less than one at the
beginning of the epidemic and then increases to greater than one about 10 years into the epidemic. Based
on available data, a ratio of 1.38 was assumed in several countries with generalized epidemics (Avenir
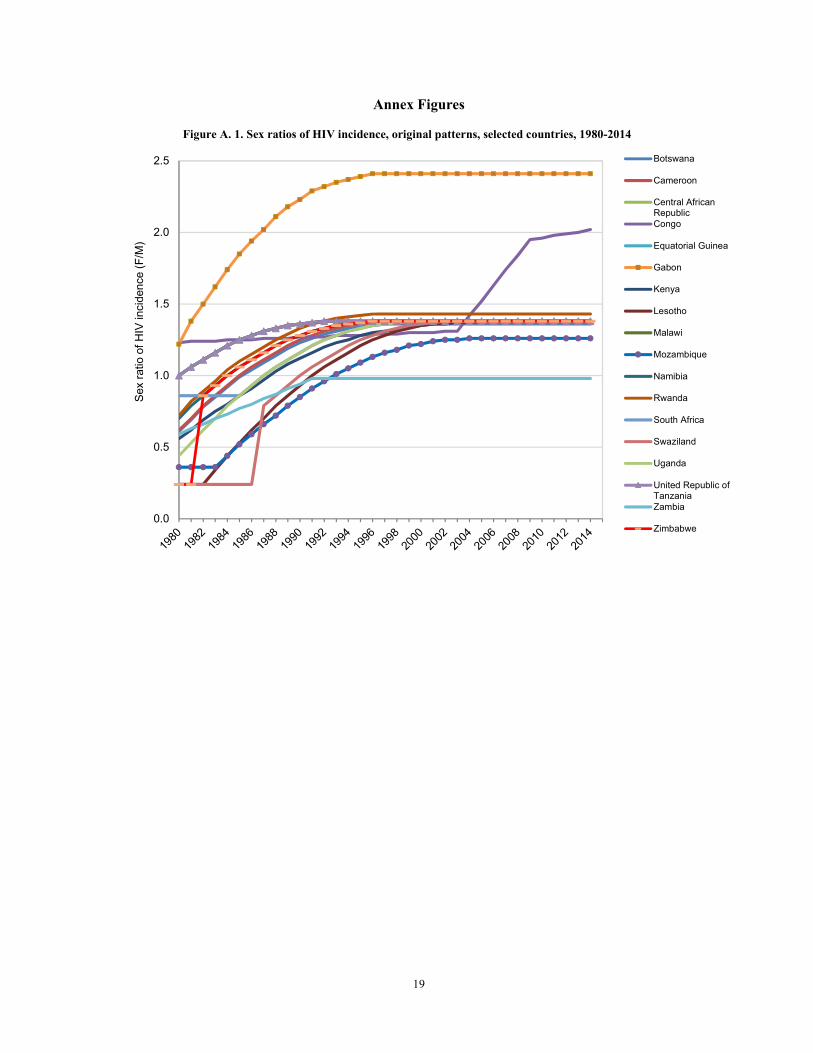
Health, 2019). When comparing the time-series of the “original” sex ratios of HIV incidence by country,
as provided by UNAIDS for the production of the 2017 Revision, out of 18 countries, 9 countries had the
same sex ratios in the year 2000 (with a value of 1.38, roughly implying that 138 women are being infected
for each 100 men) and by 2010, that same value was encountered in 13 countries (see annex figure A.1).
Furthermore, the Central African Republic, Equatorial Guinea, Malawi and the United Republic of
Tanzania had the exact same time-series from 1980 to 2014. A few more countries had a similar pattern as
those countries though with different values as start off points in 1980 (Cameroun, South Africa, Uganda,
Zimbabwe). Therefore, for most of these countries, the time-series are not country specific estimates and
they have been derived from data collected in sentinel surveillance sites such as Rakai, Uganda6. On the
other hand, estimates for Gabon were partly derived from data collected in the 2012 Gabon Demographic
Household Survey6 (DHS), with an estimated peak value of 2.41; this value implies that substantially more
women are being infected as compared to men. It should be noted that within Spectrum, for countries that
have information on prevalence by age and sex, the “Incidence Rate Ratios” can be calculated by using
survey data (Avenir Health, 2019).
As stated above, in the 2017 Revision, in order to address concerns related to the sex ratio of all-cause
mortality in specific age groups, the sex ratios of HIV incidence were modified for a number of countries
in the process of estimating the demographic impact of the HIV/AIDS epidemic. The ratios were modified
in the countries that had a prevalence of 8 per cent or more between 1980 and 2015, namely Botswana, the
Central African Republic, Kenya, Lesotho, Malawi, Namibia, South Africa, Swaziland, Uganda, the United
Republic of Tanzania, Zambia, and Zimbabwe, using lower levels in line with those estimated for
Mozambique. The ratios in Congo, Gabon and Rwanda were also modified though assumed to be higher
than the pattern used in Mozambique. Overall, in doing these different changes, it was still assumed that
more women than men were being infected by HIV, but to a lesser degree than implied with the original
4 A similar approach is used to distribute the HIV incidence rate by age for each sex. Though not addressed in this technical paper, further analysis
on the role of the age pattern of HIV incidence on mortality pattern by age may be worth investigating. 5 All countries listed in this analysis are considered to have generalized epidemics. 6 Based on communication with Mr. John Stover from Avenir Health.
4
time-series included in the Spectrum files, as provided by UNAIDS7. These changes had implications for
the all-cause mortality levels for both men and women. Generally, it implied higher mortality levels for
men and lower ones for women, which, on the whole, is more consistent with empirical evidence regarding
the sex differentials in mortality (to be further discussed).
B. Adult treatment
Considering the important role that treatment may have on survival prospects of HIV-positive adults,
it was decided to further explore the relations between these variables within a modelled framework.
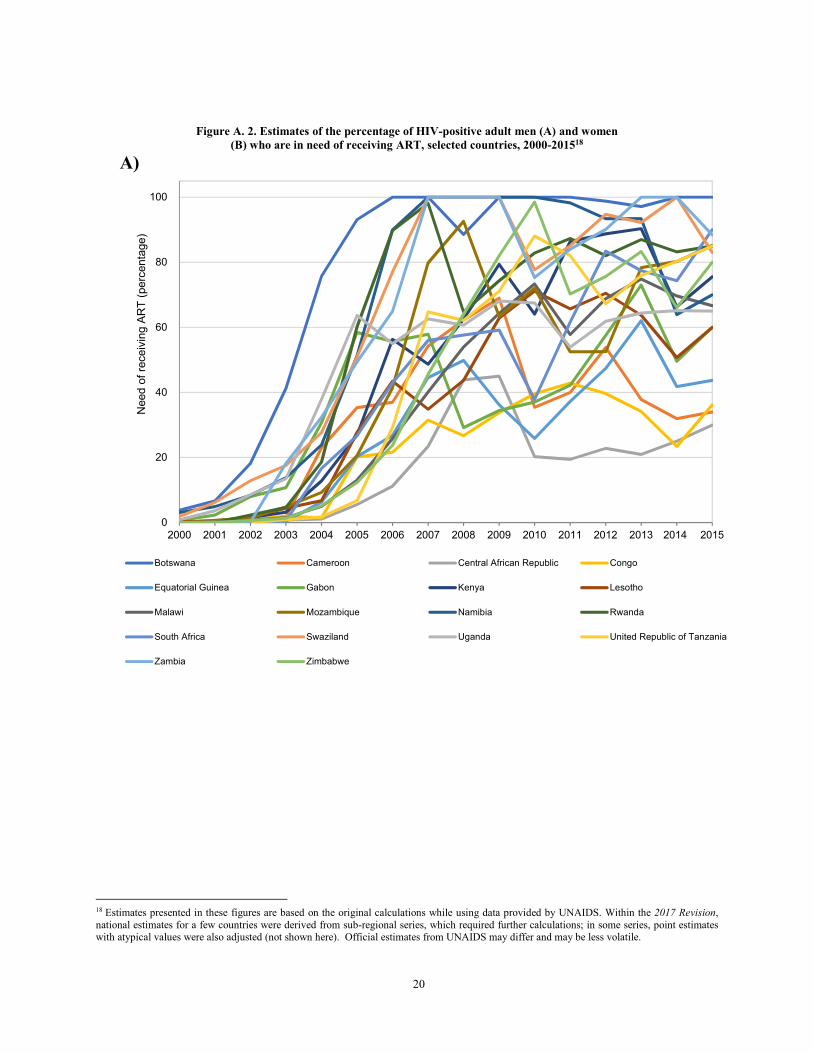
Proportions of HIV-positive adults in need of receiving treatment in each country, for both men and women
from 1980 to 2015, were for the most part estimated or calculated based on information provided by
UNAIDS8. For a few countries, national estimates were derived from sub-regional series, which required
further calculations; in some series, point estimates with atypical values were also adjusted. The proportions
of HIV-positive adults in need of receiving treatment were then projected to reach 90 per cent in 2050 if it
was below 85 per cent in 2015 or to reach 95 per cent if it was above 85 per cent in 2015; it remained
constant thereafter until 2100. These values were used to derive the number of adults receiving ART. As
observed in annex figure A.2, time-series of “adult treatment” can be quite volatile and these fluctuations
may have an impact on the estimated mortality levels. It should also be noted that measuring adequately
time-series of adult treatment is not an easy task and that progress has been made in recent years in deriving
more reliable estimates.
3. RESULTS
Before embarking on the sensitivity analysis about how modifications in time-series of the sex ratios
of HIV incidence may influence the estimated and projected levels and trends of all-cause mortality in
selected countries, it was deemed important to briefly review the mortality patterns by sex based on
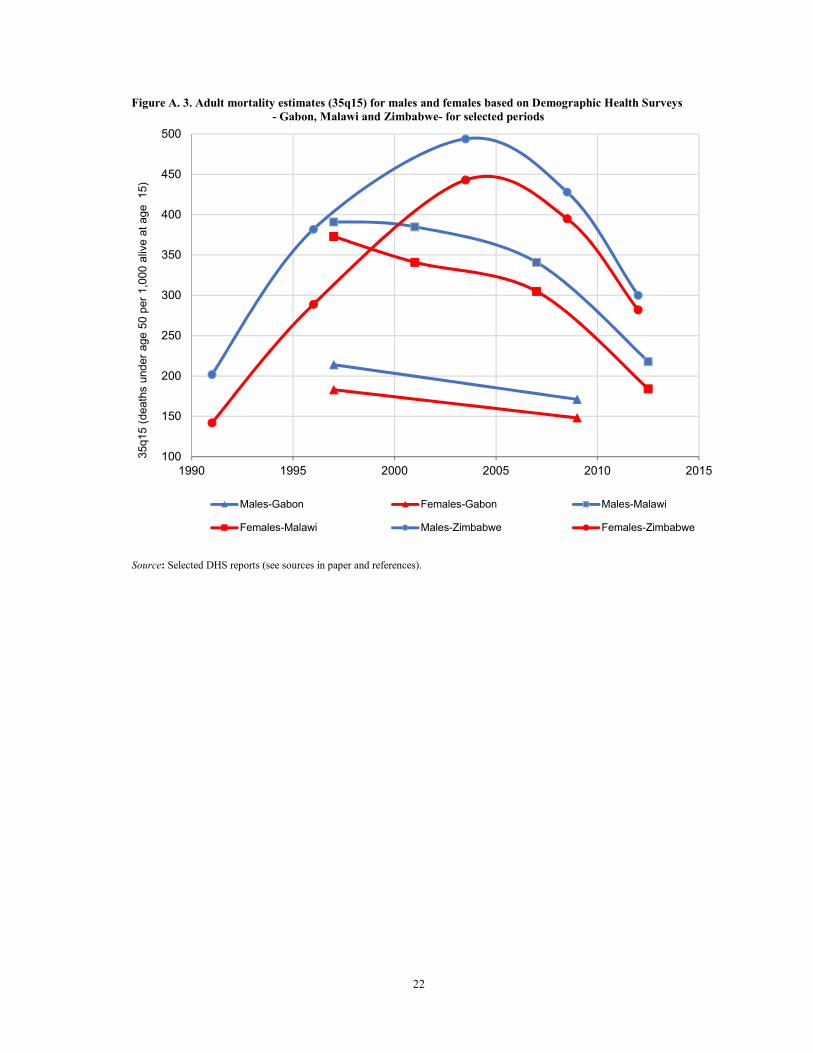
empirical estimates. Annex figure A.3 depicts adult mortality estimates between ages 15 and 50 (35q159)
for both males and females as reported in different Demographic Health Surveys for the three countries
under analysis in this section (Gabon, Malawi and Zimbabwe). It can be observed that in all three countries,
male adult mortality levels are systematically higher than female adult mortality across the observed
periods. In the case of Zimbabwe, it could be argued that the sex differential in mortality between gender
(male over female: M/F) is reduced overtime though still present. This pattern has also been observed in
other countries affected by the HIV/AIDS epidemic (data not shown10). Considering that parts of the
upcoming analysis will be focussed on adult mortality between ages 15 and 60 (45q15), it is important to
point out that in most countries male excess mortality between ages 50 to 60 is usually more pronounced
and therefore, one could anticipate larger sex differentials (M/F) in mortality with the 45q15s than with the
35q15s.
A. Malawi
As a first step, and while only modifying the time-series of the sex ratios of HIV incidence in the
“country file” of Malawi, a brief description of the changes in the estimated and projected levels of life
expectancy at birth by sex, the sex ratios of life expectancy at birth and the adult mortality estimates by sex
are provided below.
7 The time-series of the sex ratios of HIV incidence that were used in the World Population Prospects should not be interpreted as the definitive
ones for each country but as alternatives to address mortality estimation matters. 8 Official estimates from UNAIDS may differ. 9 The comparison of adult mortality estimates is based on 35q15 estimates since Demographic Health Surveys do not report 45q15 estimates. 10 Furthermore, Masquelier and others (2017; p. S80) indicated that in selected countries “there was no distinct reduction of the women advantage in adult mortality as the share of AIDS-related deaths increased”.

5
Figure 1 shows the original and modified time-series of the sex ratios of HIV incidence from 1980 to
2030. In the original series, the start off point in 1980 was estimated at 1 increasing to a value of 1.38 by
1992 and remaining constant thereafter till 2014. Values from 2015 till 2030 are projections on the basis of
a linear interpolation, assuming it will reach 1.1 by 2050. The modified series starts with a substantially
lower sex ratio in 1980, set at 0.36, implying that many more men are being infected at the onset of the
epidemic and increasing rapidly thereafter to reach a value of 1.26 by 2004; thereafter, it remains constant
till 2014. As mentioned above, this still assumes that more women than men are being infected by HIV, but
to a lesser degree than implied with the original time-series included in the Spectrum files.
Figure 1. Sex ratios of HIV incidence: original and modified patterns, Malawi, 1980-2030
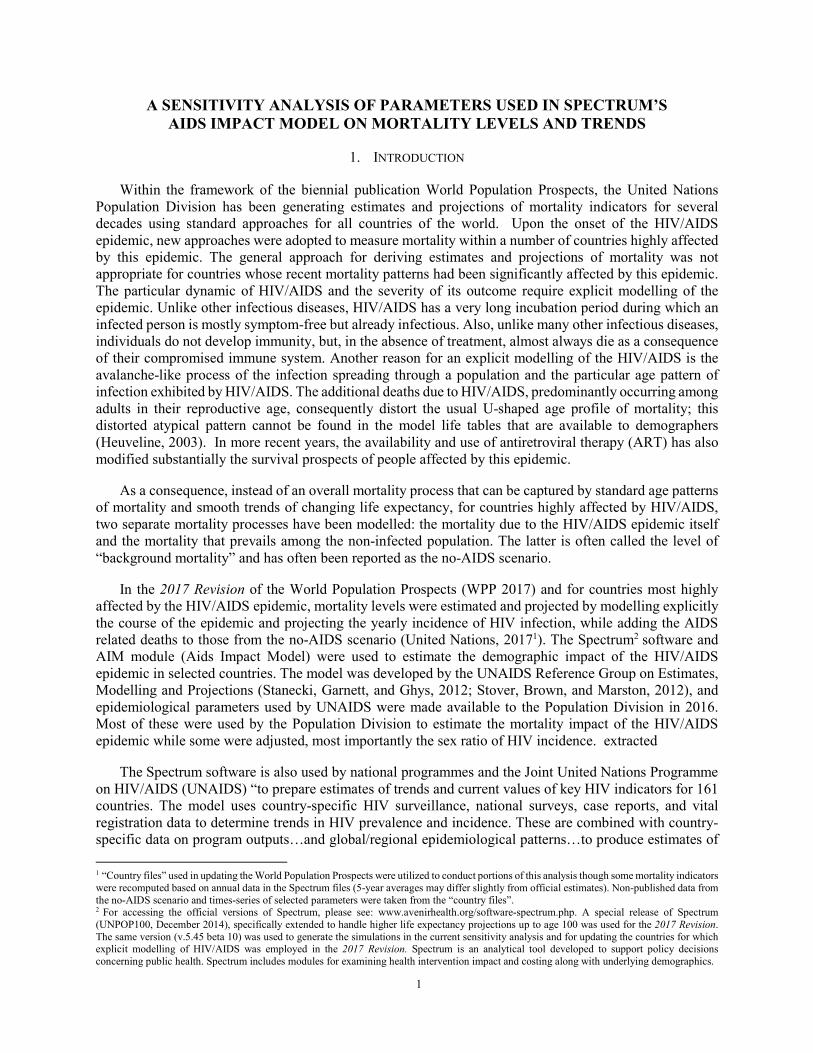
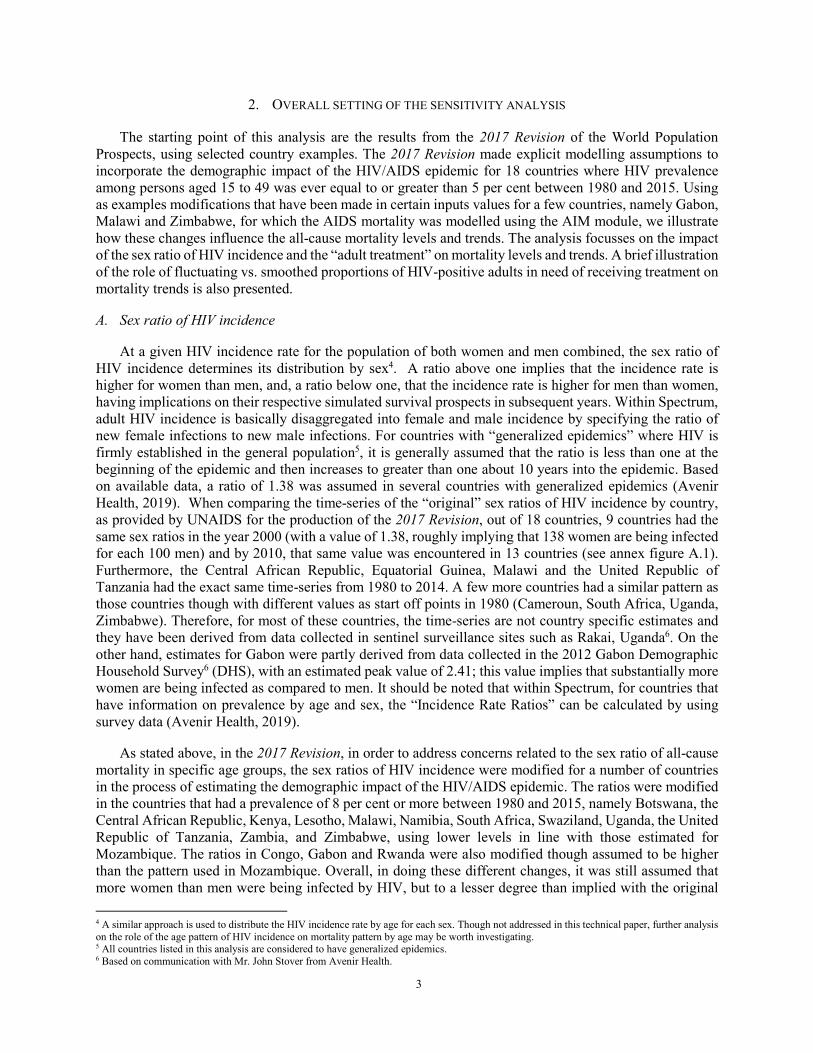
Figure 2 shows the life expectancy estimates by sex from 1980 to 2030 for the “no-AIDS scenario” and
the “AIDS scenarios” with the original and modified sex ratios of HIV incidence; figure 3 shows the
corresponding trends in the sex ratios of life expectancy at birth (female over male: F/M). With the no-
AIDS scenarios, life expectancy increases quite rapidly for both men and women until reaching levels
between 65 and 70 years, at which point the pace of increment starts to slow down. Overall, the sex gap in
survival prospects favours women and increases from a sex ratio of about 1.04 to 1.06 between 1980 and
2005. With the “AIDS impact”, regardless of the scenario, life expectancy levels for both men and women
tend to plateau between 1990 and 2005. However, the sex ratio of life expectancy changes dramatically
during that period across scenarios. With the original time-series, male survival prospects even surpass that
of women in the early 2000s, since it is assumed that relatively more women are contracting HIV. In the
modified scenario, the sex ratio increases between 1980 and 1995 and thereafter declines as relatively more
women are dying from AIDS related causes. In both scenarios, access to treatment contributes to a recovery
in survival prospects. Sex differentials in treatment levels also influences the pace of recovery by sex, in
favour of women (to be further explored with other examples below). In the end, the sex ratios of HIV
incidence in the original time-series seem to distort the “inherent” sex differential in survival prospects and
the derived mortality estimates are less in line with some observed values 11. As shown in annex figure A.3,
adult mortality estimates between the ages of 15 and 50 (35q15) based on survey data are higher for men
than women in Malawi (as well as in Gabon and Zimbabwe).
11 Based on the 2000, 2004 and 2010 Malawi DHSs, adult mortality estimates between ages 15 and 50 (35q15) are higher for men than for women in the 7-year periods prior to each survey (National Statistical Office (NSO) [Malawi] and ICF, 2017).
0.0
0.2
0.4
0.6
0.8
1.0
1.2
1.4
1.6
1980 1985 1990 1995 2000 2005 2010 2015 2020 2025 2030
Sex r
atio o
f H
IV incid
ence (
F/M
)
Original Modified/WPP2017
6
Figure 2. Life expectancy at birth for males and females: No-AIDS scenario and AIDS scenarios
with original and modified sex ratios of HIV incidence, Malawi, 1980-2030
Figure 3. Sex ratios of life expectancy at birth (F/M): No-AIDS scenario and AIDS scenarios
with original and modified sex ratios of HIV incidence, Malawi, 1980-2030
40
45
50
55
60
65
70
75
1980 1985 1990 1995 2000 2005 2010 2015 2020 2025 2030
Life e
xpecta
ncy a
t bir
th (
years
)
Males No-Aids
Females No Aids
Males-Orig SR
Females-Orig SR
Males-Mod SR
Females-Mod SR
0.98
1.00
1.02
1.04
1.06
1.08
1.10
1980 1985 1990 1995 2000 2005 2010 2015 2020 2025 2030
Sex r
atio o
f lif
e e
xpecta
ncy a
t bir
th (
F/M
)
Ratio e0 (F/M)-No Aids Ratio e0 (F/M)-Orig SR Ratio e0 (F/M)-Mod SR
7
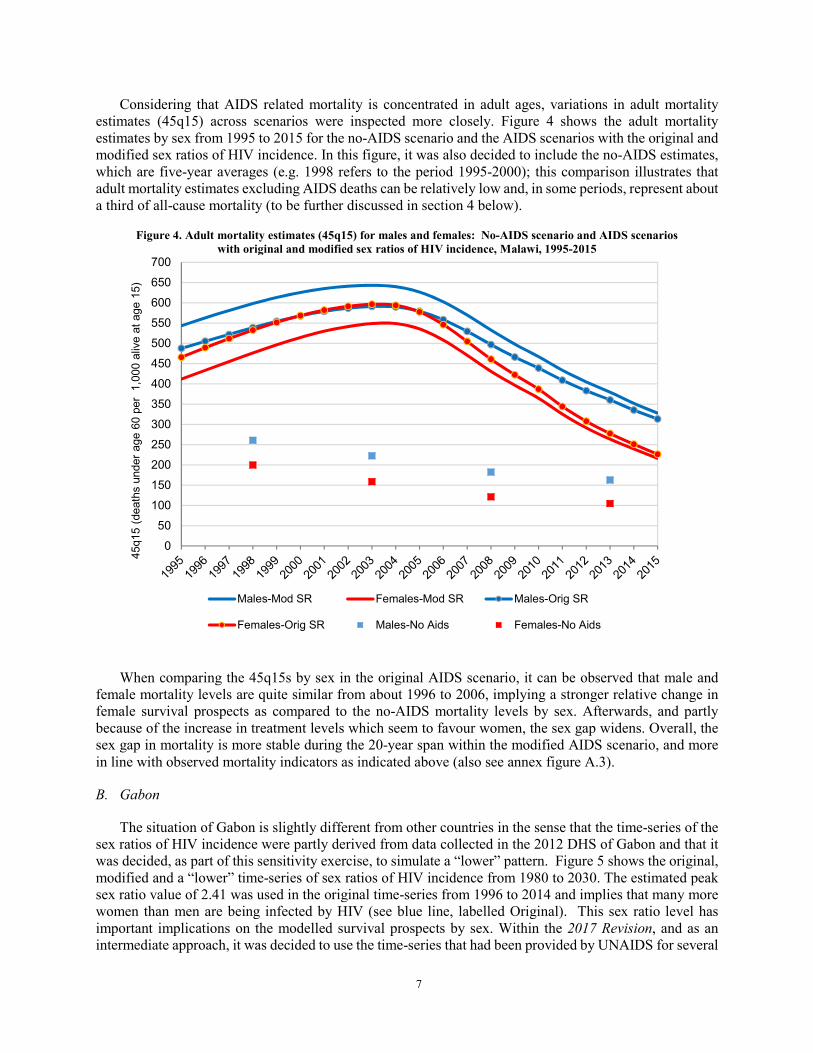
Considering that AIDS related mortality is concentrated in adult ages, variations in adult mortality
estimates (45q15) across scenarios were inspected more closely. Figure 4 shows the adult mortality
estimates by sex from 1995 to 2015 for the no-AIDS scenario and the AIDS scenarios with the original and
modified sex ratios of HIV incidence. In this figure, it was also decided to include the no-AIDS estimates,
which are five-year averages (e.g. 1998 refers to the period 1995-2000); this comparison illustrates that
adult mortality estimates excluding AIDS deaths can be relatively low and, in some periods, represent about
a third of all-cause mortality (to be further discussed in section 4 below).
Figure 4. Adult mortality estimates (45q15) for males and females: No-AIDS scenario and AIDS scenarios
with original and modified sex ratios of HIV incidence, Malawi, 1995-2015
When comparing the 45q15s by sex in the original AIDS scenario, it can be observed that male and
female mortality levels are quite similar from about 1996 to 2006, implying a stronger relative change in
female survival prospects as compared to the no-AIDS mortality levels by sex. Afterwards, and partly
because of the increase in treatment levels which seem to favour women, the sex gap widens. Overall, the
sex gap in mortality is more stable during the 20-year span within the modified AIDS scenario, and more
in line with observed mortality indicators as indicated above (also see annex figure A.3).
B. Gabon
The situation of Gabon is slightly different from other countries in the sense that the time-series of the
sex ratios of HIV incidence were partly derived from data collected in the 2012 DHS of Gabon and that it
was decided, as part of this sensitivity exercise, to simulate a “lower” pattern. Figure 5 shows the original,
modified and a “lower” time-series of sex ratios of HIV incidence from 1980 to 2030. The estimated peak
sex ratio value of 2.41 was used in the original time-series from 1996 to 2014 and implies that many more
women than men are being infected by HIV (see blue line, labelled Original). This sex ratio level has
important implications on the modelled survival prospects by sex. Within the 2017 Revision, and as an
intermediate approach, it was decided to use the time-series that had been provided by UNAIDS for several
0
50
100
150
200
250
300
350
400
450
500
550
600
650
700
45q15 (
death
s u
nder
age 6
0 p
er
1,0
00 a
live a
t age 1
5)
Males-Mod SR Females-Mod SR Males-Orig SR
Females-Orig SR Males-No Aids Females-No Aids

8
other countries12, starting with a value of 1 in 1980 and a peak value of 1.38 (see red line below, labelled
Modified/WPP2017). After careful review of the derived mortality estimates, it probably would have been
better to use the lower values as those used in countries such as Malawi (see dark red line, labelled Lower).
Figure 5. Sex ratios of HIV incidence: original, modified and lower patterns, Gabon, 1980-2030
Without showcasing the estimated levels of life expectancy at birth by sex derived for the three different
incidence patterns described above, figure 6 illustrates the important variations in the sex ratios of life
expectancy at birth across the different “scenarios”. While using the original time-series with a peak value
of 2.41, female life expectancy estimates are lower and even lower than that of males for several years (see
ratios with a value below one), which is not corroborated by empirical mortality estimates13. It could be
argued that by increasing the sex differential in life expectancy at birth in the no-AIDS scenario, one could
simulate all-cause mortality sex ratios (F/M) that are higher. However, that would imply extremely high
excess male mortality in the absence of AIDS. As stated above, in the 2017 Revision, it was decided to use
the pattern with values ranging from 1 in 1980 to a peak of 1.38, which yielded somewhat more “reasonable”
life expectancy estimates by sex, with the sex ratio of life expectancy (F/M) plateauing at just under 1.02
from about 2005 to 2010 (the sex ratio should be above 1). However, with the use of the “lower” sex ratio
of HIV incidence time-series, the sex ratios of life expectancy are somewhat higher overall, which is in
better alignment to the levels implied by using empirical data on adult mortality (see figure annex A.3).
12 In the original time-series provided by UNAIDS, the Central African Republic, Equatorial Guinea, Malawi and the United Republic of Tanzania
were all identical (starting with 1 in 1980 and with a peak value of 1.38). This series implied higher sex ratios of HIV incidence than the one used
in most countries and was used in Congo, Gabon and Rwanda; the default time-series reached even higher levels. 13 Based on the 2000 and 2012 Gabon DHSs, adult mortality estimates between ages 15 and 50 (35q15) are higher for men than for women in the
7-year periods prior to both surveys (Direction Générale de la Statistique (DGS) et ICF International, 2013).
0.0
0.5
1.0
1.5
2.0
2.5
1980 1985 1990 1995 2000 2005 2010 2015 2020 2025 2030
Sex r
atio o
f H
IV incid
ence (
F/M
)
Original Modified/WPP2017 Lower

9
Figure 6. Sex ratios of life expectancy at birth (F/M): No-AIDS scenario and AIDS scenarios
with original, modified and lower sex ratios of HIV incidence, Gabon, 1980-2030
The concerns that have been raised with regards to the mortality levels by sex depending which time-
series of sex ratios of HIV incidence is used are more apparent when looking at the levels and trends of
adult mortality estimates. Figures 7 and 8 provide a comparison of adult mortality estimates (45q15) for
both males and females based on different scenarios. Figure 7 shows that with the original ratios, adult
mortality is substantially higher for females than for males, mainly for the period 2000-2010, with estimates
ranging from about 340 for women and 280 for men around 2007. With the modified scenario, the
differences are smaller though female mortality is still higher mainly during the period 2005-2010. In figure
8, it can be observed that by using the “lower” scenario, male adult mortality levels are always higher than
that of females, though mortality levels by sex do converge in the mid-2000s. The swift changes in mortality
levels by sex after 2010 in the different scenarios are partly related to the access of antiretroviral therapy,
which prevalence levels are estimated, on the whole, to be higher for women. Lastly, it should be noted that
when looking at modelled estimates of adult mortality between the ages 15 and 50 (35q15), the
inconsistencies with mortality levels by sex are even more accentuated (data not shown14). This could also
be partially related to the age pattern of HIV incidence, for which the distribution or median age is younger
for women (as mentioned earlier, this aspect is not investigated in this paper).
14 As mentioned earlier, because male mortality is generally higher than female mortality between ages 50 to 60, one could anticipate larger sex differentials (M/F) with the 45q15s than with 35q15s.
0.98
1.00
1.02
1.04
1.06
1.08
1980 1985 1990 1995 2000 2005 2010 2015 2020 2025 2030
Sex r
atio o
f lif
e e
xpecta
ncy a
t bir
th (
F/M
)
Ratio e0 (F/M)-No Aids Ratio e0 (F/M)-Orig SR
Ratio e0 (F/M)-Lower SR Ratio e0 (F/M)-Mod SR

10
Figure 7. Adult mortality estimates (45q15) for males and females: AIDS scenarios
with original and modified sex ratios of HIV incidence, Gabon, 1995-2015
Figure 8. Adult mortality estimates (45q15) for males and females: AIDS scenarios
with original and lower sex ratios of HIV incidence, Gabon, 1995-2015
180
200
220
240
260
280
300
320
340
360
380
45q15 (
death
s u
nder
age 6
0 p
er
1,0
00 a
live a
t age 1
5)
Males-Mod SR Females-Mod SR Males-Orig SR Females-Orig SR
180
200
220
240
260
280
300
320
340
360
380
45q15 (
death
s u
nder
age 6
0 p
er
1,0
00 a
live a
t age 1
5)
Males-Low SR Females-Low SR Males-Orig SR Females-Orig SR

11
C. Zimbabwe
For the purpose of this sensitivity analysis, some results related to Zimbabwe are now presented with
the objective of reiterating the role of the sex ratio of HIV incidence on the sex patterns of mortality
(meaning it is not an isolated case) and illustrating how the levels and trends in antiretroviral therapy by
sex play an important role on the estimated survival prospects.
As in the cases of both Gabon and Malawi, the sex ratios of HIV incidence for Zimbabwe were also
modified in the 2017 Revision (figure 9). Consequently, the derived adult mortality estimates for both men
and women were altered (figure 10). Again, with the original scenario, female mortality is higher than that
of males from about 2000 till 2007. However, it is interesting to note the sharp decline in the trajectories
of both scenarios a few years after access to treatment is made available, starting in the early-mid 2000s,
and how the mortality levels fluctuate in the year 201215.
Figure 9. Sex ratios of HIV incidence: original and modified patterns, Zimbabwe, 1980-2030
The observation of such patterns incited us to further explore the role of treatment on modelled
mortality levels and trends in the context of the HIV/AIDS epidemic. It should be stated that “the most
important recent change in HIV epidemiology has been the provision of antiretroviral therapy (ART) in
low-income and middle-income countries…” (Eaton and others, 2015, p. e598). Indeed, access to treatment
or antiretroviral therapy (ART) has modified substantially the survival prospects of men and women who
have been diagnosed with HIV/AIDS.
15 Within the 2017 Revision of World Population Prospects, such fluctuations in mortality levels were not detected mainly because annual estimates (as reported here) were aggregated in five-year period estimates which smoothed the trends.
0.0
0.2
0.4
0.6
0.8
1.0
1.2
1.4
1.6
1980 1985 1990 1995 2000 2005 2010 2015 2020 2025 2030
Sex r
atio o
f H
IV incid
ence (
F/M
)
Original Modified/WPP2017

12
Figure 10. Adult mortality estimates (45q15) for males and females: AIDS scenarios
with original and modified sex ratios of HIV incidence, Zimbabwe, 1995-2015
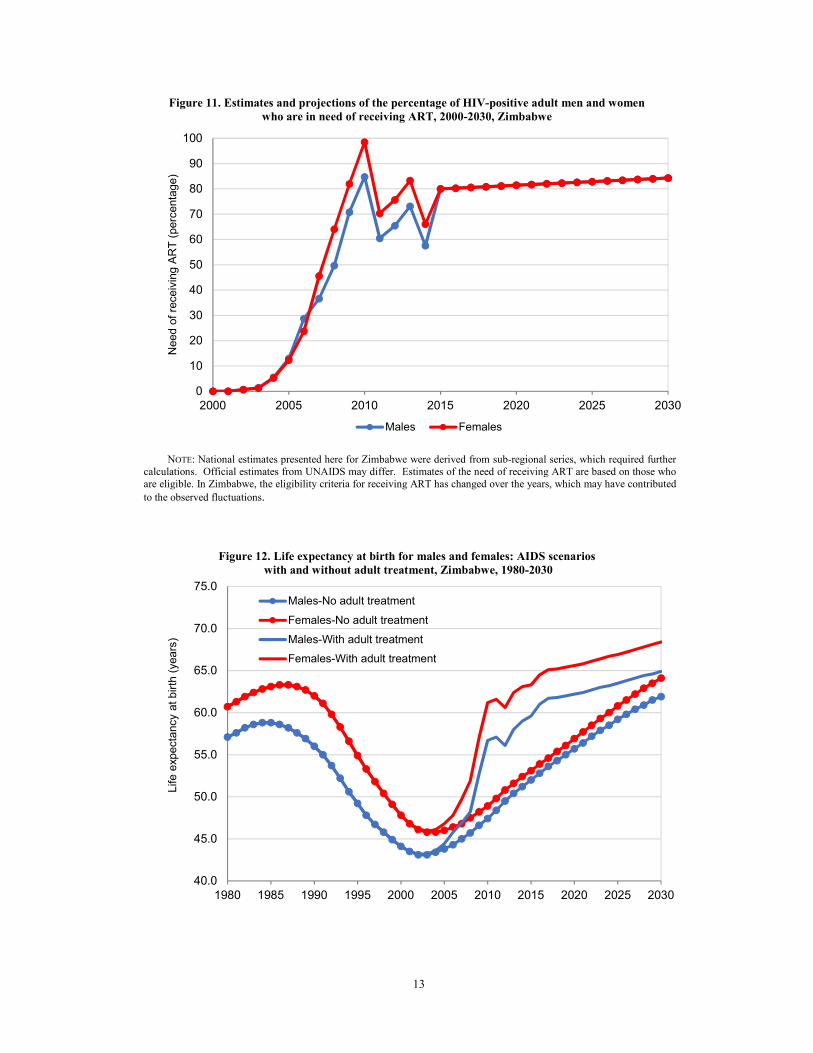
Figure 11 illustrates the estimates and projections of the percentage of HIV-positive adult men and
women who are in need of receiving ART. These values were used in the 2017 Revision within the AIM
module of Spectrum to model adult treatment. As portrayed, on the whole, estimates for women are higher
than for men and in both cases the levels fluctuate considerably between 2010 and 2015. These fluctuations
are partly responsible for the oscillations in the mortality levels illustrated in the year 2012 in figure 10
(above) and in figure 12 (below).
Figure 12 presents levels of life expectancy at birth by sex and basically illustrates the significant impact
of adult treatment on survival prospects, with a sharp increase in life expectancy at birth after 2005 (see
series “with adult treatment”). Without adult treatment, life expectancy starting in about 2005 would have
been substantially lower, with peak differences as compared to the all-cause mortality estimates surpassing
10 years of life expectancy in the period 2010-2015. In the scenario with treatment, as in the case of adult
mortality, it can be observed that life expectancy estimates tend to fluctuate in the more recent years. Lastly,
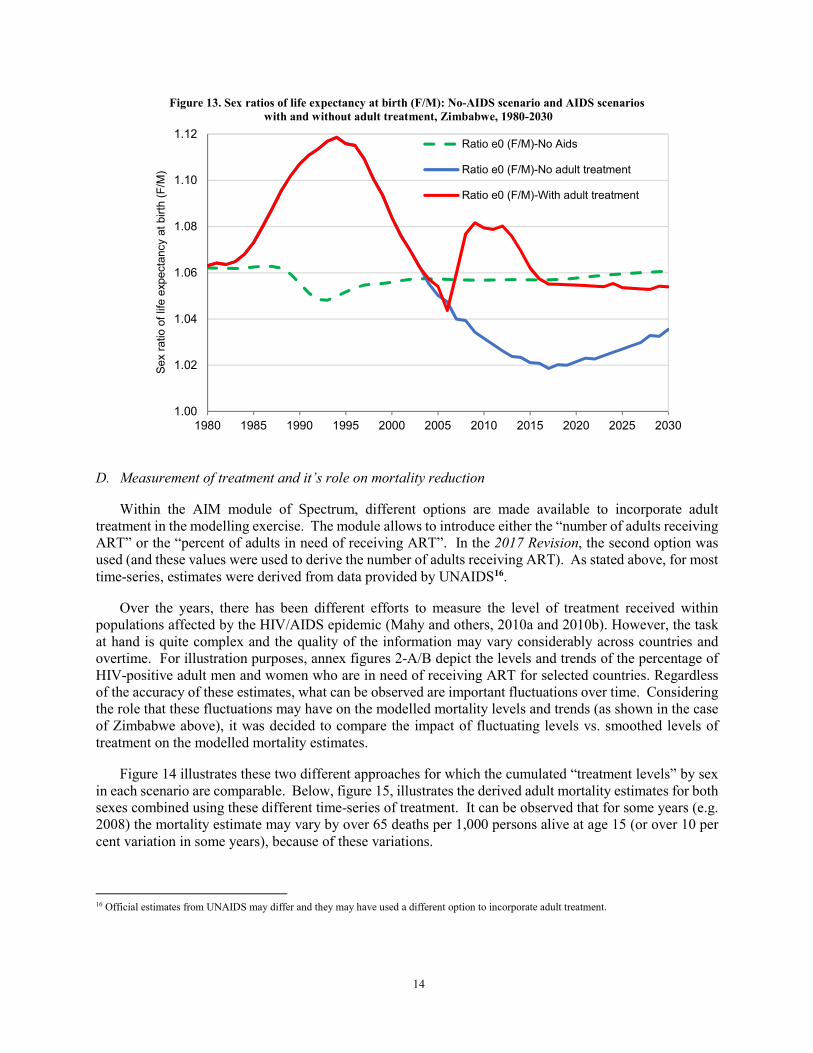
as observed in figure 13, the sex ratios of life expectancy at birth change dramatically from 2006 to 2009
in the treatment scenario, reflecting differences in treatment by gender. A few years later, it starts to decline
until about 2016, when it starts to plateau off, in line with the harmonization of the treatment “prevalence”
levels by sex.
250
350
450
550
650
75045q15 (
death
s u
nder
age 6
0 p
er
1,0
00 a
live a
t age 1
5)
Males-Mod SR Females-Mod SR Males-Orig SR Females-Orig SR
13
Figure 11. Estimates and projections of the percentage of HIV-positive adult men and women
who are in need of receiving ART, 2000-2030, Zimbabwe
NOTE: National estimates presented here for Zimbabwe were derived from sub-regional series, which required further
calculations. Official estimates from UNAIDS may differ. Estimates of the need of receiving ART are based on those who
are eligible. In Zimbabwe, the eligibility criteria for receiving ART has changed over the years, which may have contributed
to the observed fluctuations.
Figure 12. Life expectancy at birth for males and females: AIDS scenarios
with and without adult treatment, Zimbabwe, 1980-2030
0
10
20
30
40
50
60
70
80
90
100
2000 2005 2010 2015 2020 2025 2030
Need o
f re
ceiv
ing A
RT
(perc
enta
ge)
Males Females
40.0
45.0
50.0
55.0
60.0
65.0
70.0
75.0
1980 1985 1990 1995 2000 2005 2010 2015 2020 2025 2030
Life e
xpecta
ncy a
t bir
th (
years
)
Males-No adult treatment
Females-No adult treatment
Males-With adult treatment
Females-With adult treatment
14
Figure 13. Sex ratios of life expectancy at birth (F/M): No-AIDS scenario and AIDS scenarios
with and without adult treatment, Zimbabwe, 1980-2030
D. Measurement of treatment and it’s role on mortality reduction
Within the AIM module of Spectrum, different options are made available to incorporate adult
treatment in the modelling exercise. The module allows to introduce either the “number of adults receiving
ART” or the “percent of adults in need of receiving ART”. In the 2017 Revision, the second option was
used (and these values were used to derive the number of adults receiving ART). As stated above, for most
time-series, estimates were derived from data provided by UNAIDS16.
Over the years, there has been different efforts to measure the level of treatment received within
populations affected by the HIV/AIDS epidemic (Mahy and others, 2010a and 2010b). However, the task
at hand is quite complex and the quality of the information may vary considerably across countries and
overtime. For illustration purposes, annex figures 2-A/B depict the levels and trends of the percentage of
HIV-positive adult men and women who are in need of receiving ART for selected countries. Regardless
of the accuracy of these estimates, what can be observed are important fluctuations over time. Considering
the role that these fluctuations may have on the modelled mortality levels and trends (as shown in the case
of Zimbabwe above), it was decided to compare the impact of fluctuating levels vs. smoothed levels of
treatment on the modelled mortality estimates.
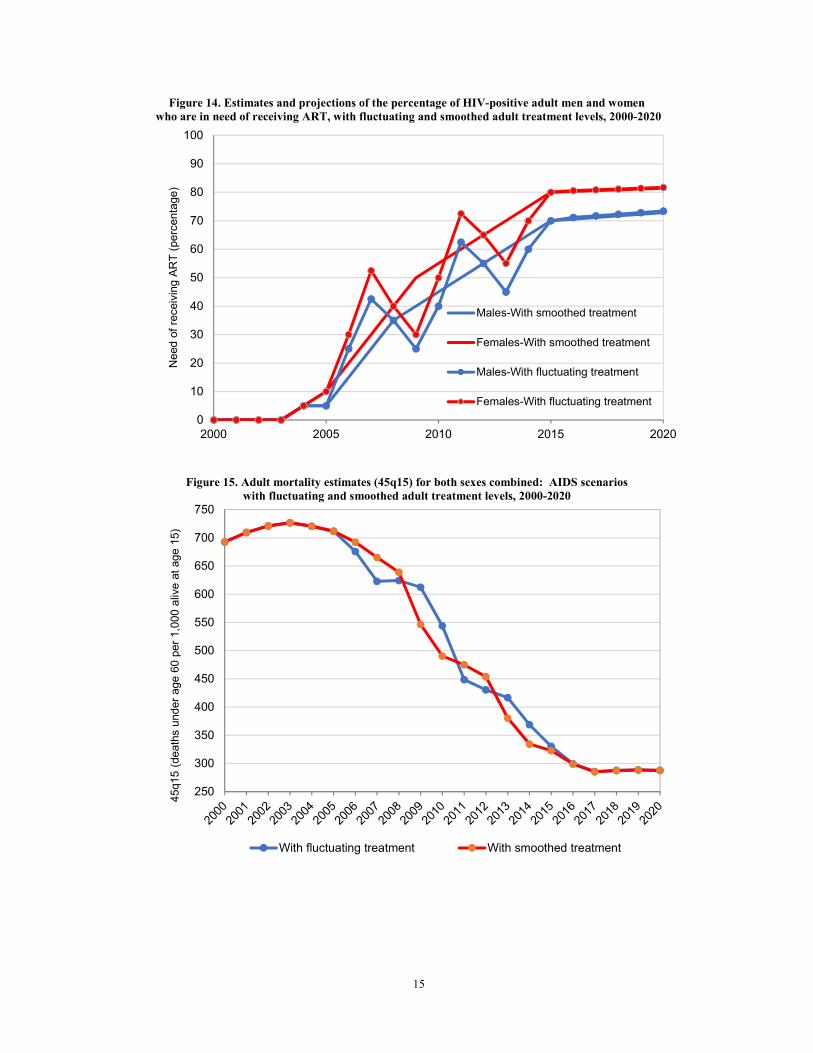
Figure 14 illustrates these two different approaches for which the cumulated “treatment levels” by sex
in each scenario are comparable. Below, figure 15, illustrates the derived adult mortality estimates for both
sexes combined using these different time-series of treatment. It can be observed that for some years (e.g.
2008) the mortality estimate may vary by over 65 deaths per 1,000 persons alive at age 15 (or over 10 per
cent variation in some years), because of these variations.
16 Official estimates from UNAIDS may differ and they may have used a different option to incorporate adult treatment.
1.00
1.02
1.04
1.06
1.08
1.10
1.12
1980 1985 1990 1995 2000 2005 2010 2015 2020 2025 2030
Sex r
atio o
f lif
e e
xpecta
ncy a
t bir
th (
F/M
)
Ratio e0 (F/M)-No Aids
Ratio e0 (F/M)-No adult treatment
Ratio e0 (F/M)-With adult treatment
15
Figure 14. Estimates and projections of the percentage of HIV-positive adult men and women
who are in need of receiving ART, with fluctuating and smoothed adult treatment levels, 2000-2020
Figure 15. Adult mortality estimates (45q15) for both sexes combined: AIDS scenarios
with fluctuating and smoothed adult treatment levels, 2000-2020
0
10
20
30
40
50
60
70
80
90
100
2000 2005 2010 2015 2020
Need o
f re
ceiv
ing A
RT
(perc
enta
ge)
Males-With smoothed treatment
Females-With smoothed treatment
Males-With fluctuating treatment
Females-With fluctuating treatment
250
300
350
400
450
500
550
600
650
700
750
45q15 (
death
s u
nder
age 6
0 p
er
1,0
00 a
live a
t age 1
5)
With fluctuating treatment With smoothed treatment

16
4. DISCUSSION AND RECOMMENDATIONS
Civil registration systems that would allow to measure and monitor accurately the number of deaths by
specific cause, including AIDS related deaths, are currently not available in the vast majority of countries
highly affected by the HIV/AIDS epidemic. Even in countries where civil registration of deaths has yielded
useful data (e.g. South Africa, Zimbabwe), deaths from HIV/AIDS are particularly likely to be reported as
being from other diseases (Timaeus and others, 2004). Therefore, and for the time being, we are likely to
continue to rely on models such as the one referred to in this paper to generate information related to AIDS
mortality for many countries. “Model projections have become increasingly central to policy decision
making and resource planning and allocation. For many uses, the value of these analyses for public health
decision making depends on the accuracy of their projections” (Eaton and others, 2015, p. e598). “As
models are increasingly used to support policy planning, advocate and allocate resources, and assess
programmes, surveillance and trial data must also continue to be collected to validate and improve the
information that underlie these processes” (ibid. p. e606). In that spirit, the results of this sensitivity analysis
constitute a small step in trying to improve the modelling exercise of the HIV/AIDS epidemic and to
contribute to a better assessment and measurement of different inputs and mortality outputs.
With close to 40 years after the onset of the HIV-AIDS epidemic, one could argue that using a model
that relies on a no-AIDS scenario as the starting point is questionable. Indeed, the no-AIDS mortality
levels and trends cannot be measured with a high degree of accuracy and could be responsible, in some
cases, for inconsistencies in the modelled all-cause mortality estimates. When all-cause mortality estimates
derived from such a “simulation” differed from observed mortality rates across multiple revisions or
modelling exercises, it has been inferred by some researchers that the no-AIDS scenario could be one of
the culprits (UNAIDS/WHO, 2003; Grassly and others, 2004; Masquelier and others, 2017). However, as
observed in the case of Malawi above (figure 4) and with other countries highly affected by the HIV/AIDS
epidemic (data not shown), the estimated no-AIDS mortality amongst adults can be relatively low as
compared to the estimated all-cause mortality17 . Considering that the so-called AIDS mortality may
represent a large portion of the overall mortality in many countries at specific points in time, it was deemed
important to further investigate what might be influencing the levels and trends by sex of the overall
mortality once the AIDS impact had been incorporated, which is one of the objectives of this sensitivity
analysis.
While looking at mortality estimates derived from surveys or other sources in several countries affected
by the HIV/AIDS epidemic that are referred to in this paper, there is evidence that male mortality is usually
higher than female mortality. By using the original sex ratios of HIV incidence, female mortality in several
countries and age groups had been estimated to be similar or higher than that of male mortality. It was
observed in different examples that the choice of the time-series in the sex ratio of HIV incidence had some
implications on the derived mortality levels by sex and, overall, generated sex patterns mortality that were
more in line with observed data. It was also highlighted that for most of the 18 countries included in figure
A.1, the sex ratios of HIV incidence were not necessarily derived from country specific data. In that regard,
it is recommended that more attention be given to better validate this input and evaluate its role on mortality
patterns by sex. Attention should be given to both the level of the sex ratio and its trend overtime.
Furthermore, if the derived input is based on a country specific survey (as in the case of Gabon), one should
examine the implication of using such values and question the idea of deriving a full time-series starting in
1980 on limited data or data that refer to a much more recent period.
17 It should be noted that across different revisions within the World Population Prospects, the mortality levels within the no-Aids scenario were in
some cases intentionally maintained low in order to compensate for the high number of AIDS related deaths generated by the simulation exercise; this occurred mainly for selected countries with very high HIV prevalence levels.

17
Considering the difficulty in measuring treatment levels, the volatility of point estimates within the
time-series and the important role that treatment plays on the estimated and projected survival prospects, it
is recommended that more attention be given to the measurement of treatment. In the meantime, and within
the framework of model estimates, it is suggested, as an interim solution, that the time-series be smoothed
since they have the potential to distort mortality trends. Greater attention may also need to be given to the
sex differentials in treatment levels and its impact on the projected survival prospects by sex.
Masquelier and others (2017, p. S77) had indicated that “discrepancies in levels, sex ratios and age
patterns of adult mortality between empirical and UNAIDS estimates call for additional data quality
assessments and improvements in estimation methods”. In that regard, aside from further investigation on
the role of the treatment and the sex ratio of HIV incidence on mortality patterns, it could also be interesting
to investigate the role of the age pattern of incidence by sex, and how such patterns may influence estimated
and projected mortality levels and trends as well. Seemingly, these different inputs have the potential to
distort the age and sex patterns of mortality.
18
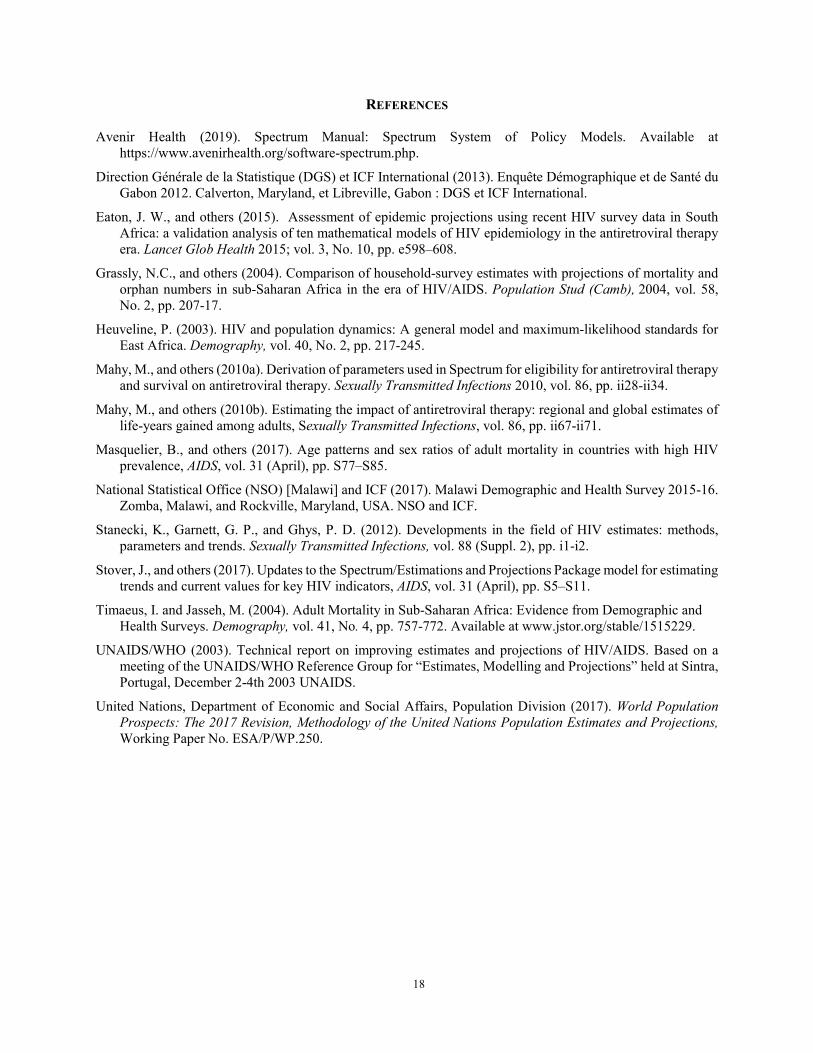
REFERENCES
Avenir Health (2019). Spectrum Manual: Spectrum System of Policy Models. Available at
https://www.avenirhealth.org/software-spectrum.php.
Direction Générale de la Statistique (DGS) et ICF International (2013). Enquête Démographique et de Santé du
Gabon 2012. Calverton, Maryland, et Libreville, Gabon : DGS et ICF International.
Eaton, J. W., and others (2015). Assessment of epidemic projections using recent HIV survey data in South
Africa: a validation analysis of ten mathematical models of HIV epidemiology in the antiretroviral therapy
era. Lancet Glob Health 2015; vol. 3, No. 10, pp. e598–608.
Grassly, N.C., and others (2004). Comparison of household-survey estimates with projections of mortality and
orphan numbers in sub-Saharan Africa in the era of HIV/AIDS. Population Stud (Camb), 2004, vol. 58,
No. 2, pp. 207-17.
Heuveline, P. (2003). HIV and population dynamics: A general model and maximum-likelihood standards for
East Africa. Demography, vol. 40, No. 2, pp. 217-245.
Mahy, M., and others (2010a). Derivation of parameters used in Spectrum for eligibility for antiretroviral therapy
and survival on antiretroviral therapy. Sexually Transmitted Infections 2010, vol. 86, pp. ii28-ii34.
Mahy, M., and others (2010b). Estimating the impact of antiretroviral therapy: regional and global estimates of
life-years gained among adults, Sexually Transmitted Infections, vol. 86, pp. ii67-ii71.
Masquelier, B., and others (2017). Age patterns and sex ratios of adult mortality in countries with high HIV
prevalence, AIDS, vol. 31 (April), pp. S77–S85.
National Statistical Office (NSO) [Malawi] and ICF (2017). Malawi Demographic and Health Survey 2015-16.
Zomba, Malawi, and Rockville, Maryland, USA. NSO and ICF.
Stanecki, K., Garnett, G. P., and Ghys, P. D. (2012). Developments in the field of HIV estimates: methods,
parameters and trends. Sexually Transmitted Infections, vol. 88 (Suppl. 2), pp. i1-i2.
Stover, J., and others (2017). Updates to the Spectrum/Estimations and Projections Package model for estimating
trends and current values for key HIV indicators, AIDS, vol. 31 (April), pp. S5–S11.
Timaeus, I. and Jasseh, M. (2004). Adult Mortality in Sub-Saharan Africa: Evidence from Demographic and
Health Surveys. Demography, vol. 41, No. 4, pp. 757-772. Available at www.jstor.org/stable/1515229.
UNAIDS/WHO (2003). Technical report on improving estimates and projections of HIV/AIDS. Based on a
meeting of the UNAIDS/WHO Reference Group for “Estimates, Modelling and Projections” held at Sintra,
Portugal, December 2-4th 2003 UNAIDS.
United Nations, Department of Economic and Social Affairs, Population Division (2017). World Population
Prospects: The 2017 Revision, Methodology of the United Nations Population Estimates and Projections,
Working Paper No. ESA/P/WP.250.
19
Annex Figures
Figure A. 1. Sex ratios of HIV incidence, original patterns, selected countries, 1980-2014
0.0
0.5
1.0
1.5
2.0
2.5
Sex r
atio o
f H
IV incid
ence (
F/M
)
Botswana
Cameroon
Central AfricanRepublic
Congo
Equatorial Guinea
Gabon
Kenya
Lesotho
Malawi
Mozambique
Namibia
Rwanda
South Africa
Swaziland
Uganda
United Republic ofTanzania
Zambia
Zimbabwe
20
Figure A. 2. Estimates of the percentage of HIV-positive adult men (A) and women
(B) who are in need of receiving ART, selected countries, 2000-201518
A)
18 Estimates presented in these figures are based on the original calculations while using data provided by UNAIDS. Within the 2017 Revision,
national estimates for a few countries were derived from sub-regional series, which required further calculations; in some series, point estimates with atypical values were also adjusted (not shown here). Official estimates from UNAIDS may differ and may be less volatile.
0
20
40
60
80
100
2000 2001 2002 2003 2004 2005 2006 2007 2008 2009 2010 2011 2012 2013 2014 2015
Need o
f re
ceiv
ing A
RT
(perc
enta
ge)
Botswana Cameroon Central African Republic Congo
Equatorial Guinea Gabon Kenya Lesotho
Malawi Mozambique Namibia Rwanda
South Africa Swaziland Uganda United Republic of Tanzania
Zambia Zimbabwe

21
B)
0
20
40
60
80
100
2000 2001 2002 2003 2004 2005 2006 2007 2008 2009 2010 2011 2012 2013 2014 2015
Need o
f re
cevin
g A
RT
(perc
enta
sge)
Botswana Cameroon Central African Republic Congo
Equatorial Guinea Gabon Kenya Lesotho
Malawi Mozambique Namibia Rwanda
South Africa Swaziland Uganda United Republic of Tanzania
Zambia Zimbabwe
22
Figure A. 3. Adult mortality estimates (35q15) for males and females based on Demographic Health Surveys
- Gabon, Malawi and Zimbabwe- for selected periods
Source: Selected DHS reports (see sources in paper and references).
100
150
200
250
300
350
400
450
500
1990 1995 2000 2005 2010 2015
35q15 (
death
s u
nder
age 5
0 p
er
1,0
00 a
live a
t age
15)
Males-Gabon Females-Gabon Males-Malawi
Females-Malawi Males-Zimbabwe Females-Zimbabwe