sensitive ecosystems inventory: east vancouver island and...
TRANSCRIPT

Sensitive Ecosystems Inventory: East Vancouver Island and Gulf Islands 1993 - 1997
Volume 1: Methodology, Ecological Descriptions and Results Peggy Ward Gillian Radcliffe Jan Kirkby Jeanne Illingworth Carmen Cadrin
Pacific and Yukon Region 1998 Canadian Wildlife Service Environmental Conservation Branch
Technical Report Series Number 320

TECHNICAL REPORT SERIES
CANADIAN WILDLIFE SERVICE This series of reports, established in 1986, contains technical and scientific information from projects of the Canadian Wildlife Service. The reports are intended to make available material that either is of interest to a limited audience or is too extensive to be accommodated in scientific journals or in existing CWS series. Demand for these Technical Reports is usually confined to specialists in the fields concerned. Consequently, they are produced regionally and in small quantities; they can be obtained only from the address given on the back of the title page. However, they are numbered nationally. The recommended citation appears on the title page. Technical Reports are available in CWS libraries and are listed in the catalogue of the National Library of Canada in scientific libraries across Canada. They are printed in the official language chosen by the author to meet the language preference of the likely audience, with a résumé in the second official language. To determine whether there is significant demand for making the reports available in the second official language, CWS invites users to specify their official language preference. Requests for Technical Reports in the second official language should be sent to the address on the back of the title page.
SÉRIE DE RAPPORTS TECHNIQUES DU SERVICE CANADIEN DE LA FAUNE
Cette série de rapports donnant des informations scientifiques et techniques sur les projets du Service canadien de la faune (SCF) a démarré en 1986. L'objet de ces rapports est de promouvoir la diffusion d'études s'adressant à un public restreint ou trop volumineuses pour paraître dans une revue scientifique ou l'une des séries du SCF. Ordinairement, seuls les spécialistes des sujets traités demandent ces rapports techniques. Ces documents ne sont donc produits qu'à l'échelon régional et en quantités limitées; ils ne peuvent être obtenus qu'à l'adresse figurant au dos de la page titre. Cependant, leur numérotage est effectué à l'échelle nationale. La citation recommandée apparaît à la page titre. Ces rapports se trouvent dans les bibliothèques du SCF et figurent aussi dans la liste de la Bibliothèque nationale du Canada utilisée dans les principales bibliothèques scientifiques du Canada. Ils sont publiés dans la langue officielle choisie par l'auteur en fonction du public visé, avec un résumé dans la deuxième langue officielle. En vue de déterminer si la demande est suffisamment importante pour produire ces rapports dans la deuxième langue officielle, le SCF invite les usagers à lui indiquer leur langue officielle préferée. Il faut envoyer les demandes de rapports techniques dans la deuxième langue officielle à l'adresse indiquée au verso de la page titre.

Sensitive Ecosystems Inventory: East Vancouver Island and Gulf Islands
1993-1997
Volume 1: Methodology, Ecological Descriptions and Results
Peggy Ward Gillian Radcliffe
Jan Kirkby Jeanne Illingworth
Carmen Cadrin
Technical Report Series No. 320 Pacific and Yukon Region 1998
Canadian Wildlife Service
This series may be cited as: Ward, P., G. Radcliffe, J. Kirkby, J. Illingworth and C. Cadrin. 1998. Sensitive Ecosystems Inventory: East Vancouver Island and Gulf Islands, 1993 - 1997. Volume 1: Methodology, Ecological Descriptions and Results. Technical Report Series No. 320, Canadian Wildlife Service, Pacific and Yukon Region, British Columbia.

Published by the authority of the Minister of Environment Canadian Wildlife Service ©Minister of Government Services 1998 Catalogue No. CW69-5/320E ISBN 0-662-26946-2
Copies may be obtained from: Canadian Wildlife Service, Pacific and Yukon Region 5421 Robertson Road, RR1, Delta, B.C. V4K 3N2

i
Acknowledgments The Sensitive Ecosystems Inventory (SEI) of East Vancouver Island and Gulf Islands was coordinated and overseen by a Technical Advisory Group (TAG) consisting of representatives from: Environment Canada, Canadian Wildlife Service (CWS), Qualicum Beach; Ministry of Environment, Lands and Parks (MELP), Vancouver Island Region, Nanaimo; and MELP Conservation Data Centre (CDC), Victoria. The project management team included Peggy Ward (CWS); Marlene Caskey, Don Doyle, Trudy Chatwin, Pete Law (MELP, VI Region); Andrew Harcombe, Carmen Cadrin and Jan Kirkby (CDC, Victoria). The air photo interpretation, field data collection, and map production phases were managed by the TAG, specifically Peggy Ward, Carmen Cadrin, and contractors Jeanne Illingworth and Joel Ussery. The contracts were administered by the CDC. For the Comox-Strathcona Regional District portion of the study area, the air photo interpretation was done by Graham Suther, Jenny Balke and Evan McKenzie and field data collection was done by Precision Identification Ltd. For the Vancouver Island portion of the Regional District of Nanaimo, air photo interpretation was done by Don Blood and Associates, Evan McKenzie, June Ryder and Associates, and Ron Kowall and field data was collected by Precision Identification Ltd. For the Vancouver Island portion of the Cowichan Valley Regional District, the air photo interpretation and field data collection was done by Madrone Consultants Ltd. For the Vancouver Island portion of the Capital Regional District, the air photo interpretation was done by the Special Ecosystem Inventory Group and the field data collection was done by Shearwater Mapping. For the southern Gulf Islands area, air photo interpretation was performed by Shearwater Mapping and field data collection was by MELP staff. Digitizing was carried out by Integrated Mapping Technologies, and map production was done by Clover Point Cartographics. In addition to the four of us (JI, JK, PW, CC) who were involved on a daily basis with quality control of the SEI material, we would like to thank Mariah Grau, and Jo-Anne Stacey who also spent many long days over a period of two years diligently reviewing hundreds of air photos and draft maps for accuracy, completeness, and quality. Many private landowners are thanked for assisting in the project by providing access to their land for purposes of field checking. Will MacKenzie and Allen Banner of the Ministry of Forests in Smithers provided a training course for sampling wetlands and a draft wetland classification for use in the project, and Will MacKenzie assisted with clarification on various wetland classification issues. Major funding for the project was provided by Environment Canada (Pacific Coast Joint Venture) and the Habitat Conservation Trust Fund. Additional funds were contributed by B.C.’s Corporate Resources Inventory Initiative, B.C. Ministry of Forests, Capital and Comox-Strathcona Regional Districts, Provincial Capital Commission, Islands Trust, City of Nanaimo and the District of Campbell River. Fisheries and Oceans Canada provided additional stream data to supplement the TRIM (Terrain Resource Information Management) digital base maps. Technical Report: This Technical Report was originally drafted by Madrone Consultants Ltd., and was prepared for publication by the SEI Technical Advisory Group. Excerpts from the SEI Conservation Manual (McPhee, et al., in progress), the companion volume to this report, were used throughout Section 4. We also thank Gordon Butt, Trudy Chatwin, Neil Dawe, Syd Cannings and Mike Ryan for providing technical information and helpful discussion and Judith Cullington for her contributions and advice throughout the preparation of this document.

ii
Abstract The eastern coastal lowland of Vancouver Island and the adjacent Gulf Islands comprise a unique ecological region in Canada, with exceptionally high biodiversity values and many rare and endangered plant and animal species and plant communities. Intense development pressure in this area has resulted in the fragmentation and loss of many of these rare ecosystems. The Sensitive Ecosystems Inventory (SEI) of East Vancouver Island and Gulf Islands was initiated in 1993 in response to an urgent need for inventory information on rare and fragile ecosystems, to support sound land use planning decisions. This technical report documents and discusses the methodology and results of the inventory. The project systematically identified and mapped the ecologically significant and relatively unmodified sensitive terrestrial ecosystems remaining in this area, specifically, wetland and riparian ecosystems, older forests and woodlands, coastal bluffs, sparsely vegetated dunes, spits and cliffs, and terrestrial herbaceous ecosystems. Seasonally flooded agricultural fields and large patches of older second growth forests were also mapped for their general biodiversity values. Inventory data was gathered through air photo interpretation, supported by selective field checking. In general, only sites larger than 0.5 hectares were mapped. Sixty-six maps at 1:20,000 were developed using Arc/Info GIS, and are available in both digital and hardcopy formats. These maps and accompanying database provide a user-friendly flagging tool for identifying remaining natural areas and important wildlife habitats. The inventory results strongly support claims that natural areas and habitats are fast disappearing. Today, less than 8% of the entire study area can be considered relatively unmodified. Even many areas within this 8% are substantially degraded by fragmentation, human use, and introduced species. An additional 0.7% of the study area was mapped as seasonally flooded agricultural fields, with another 10.9% occupied by large stands of second growth forests over 60 years old. The rest of the study area is under urban or rural land use, or comprises recent clearcuts or young forests of under 60 years of age. This report (Volume 1) and the Conservation Manual (Volume 2) are designed to support sustainable land use decisions and to encourage wildlife conservation. These sensitive ecosystems are not the only areas of ecological importance; a variety of other habitats, such as aquatic ecosystems and younger forests also are important to the conservation of wildlife. Many of the sites identified by the SEI are at high risk of conversion to other land uses or degradation by human use and invasion by non-native vegetation. With so few of these rare and fragile ecosystems left in the study area, the need to treat seriously every one of the sites identified, and to fully evaluate all possible land use options before initiating any changes, is critical.

iii
Résumé Les basses-terres de la côte est de l’île de Vancouver et les îles Gulf, adjacentes, forment une zone écologique unique au Canada, offrant des valeurs exceptionnelles sur le plan de la diversité biologique et abritant de nombreuses espèces végétales et animales rares et en danger de disparition. Les intenses activités de développement dans cette région ont entraîné la fragmentation, voire la perte, d’un grand nombre de ces écosystèmes rares. L’Inventaire des écosystèmes sensibles sur la côte est de l’île de Vancouver et dans les îles Gulf a été mis en oeuvre en 1993 pour répondre à un urgent besoin d’information sur les écosystèmes rares et fragiles en vue d’appuyer la prise de décisions judicieuses en matière de planification de l’utilisation des terres. Le présent rapport technique documente et examine la méthodologie et les résultats de l’inventaire. Ce projet a permis d’identifier et de cartographier, de façon systématique, les écosystèmes terrestres sensibles, écologiquement importants et dans un état relativement naturel qui subsistent dans la région visée, en particulier les écosystèmes riverains et ceux des milieux humides, des forêts anciennes et des boisés, des falaises côtières, des dunes, des flèches et des falaises à végétation éparse, ainsi que les écosystèmes terrestres à végétation herbacée. Il vise également, pour leur valeur en matière de biodiversité, des terres agricoles inondées en certaines saisons et de grandes étendues de forêts de seconde venue plus âgées. Les données de l’inventaire ont été recueillies à l’aide de photos aériennes, puis vérifiées sur le terrain. En général, seuls les sites de plus de 0,5 hectare ont pu être cartographiés. Soixante-six cartes à 1:20 000 ont été établies à l’aide du système SIG Arcinfo; elles se présentent en format numérique ou sur papier. Les cartes et la base de données qui les accompagne fournissent un instrument de signalisation convivial pour l’identification des zones naturelles et des habitats fauniques importants restants. Les résultats de l’Inventaire donnent beaucoup de poids à l’hypothèse que les zones et les habitats naturels disparaissent rapidement. À l’heure actuelle, seulement moins de 8 % de la superficie de toute la zone visée peut être considérée comme dans un état relativement naturel. Et même bon nombre d’endroits de cette zone se sont considérablement dégradés en raison de la fragmentation, de l’activité humaine et des espèces introduites. On a cartographié une superficie additionnelle de 7 % de la zone visée, qui correspond aux terres agricoles inondées en certaines saisons, et une autre de 10,9 % occupée par de grands peuplements de forêts de seconde venue âgées de plus de 60 ans. La superficie restante de la zone visée soit est aménagée à des fins urbaines ou rurales, soit a fait l’objet de récentes coupes à blanc ou est constituée de jeunes forêts de moins de 60 ans. Le présent rapport (Volume 1) et le manuel sur la conservation (Volume 2) ont été préparés pour appuyer la prise de décision en matière d’utilisation durable des terres et pour favoriser la conservation des espèces sauvages. Ces écosystèmes sensibles ne sont pas les seuls milieux qui ont une importance appréciable sur le plan écologique; une multitude d’autres habitats, comme les écosystèmes aquatiques et les jeunes forêts, jouent également un rôle important dans la conservation des espèces sauvages. Un grand nombre de sites répertoriés dans le cadre de l’Inventaire des écosystèmes sensibles risquent fortement d’être convertis à d’autres usages, ou de se dégrader du fait de leur utilisation par l’homme et de l’invasion d’espèces exotiques. Compte tenu de la faible proportion d’écosystèmes rares et fragiles restants dans la zone visée, il devient impératif, avant d’entreprendre tout changement, de porter une grande attention à chacun des sites repérés et d’évaluer en profondeur toutes les options possibles quant à l’utilisation des terres.

iv

v
Table of Contents
Acknowledgments................................................................................................................................ i Abstract ............................................................................................................................................... ii Résumé.............................................................................................................................................. iii Table of Contents................................................................................................................................ v Appendices ....................................................................................................................................... vii List of Figures ................................................................................................................................... vii List of Tables.....................................................................................................................................viii List of Photos ....................................................................................................................................viii
Section 1 Introduction ............................................................................................ 1 1.1 Purpose of the Technical Report ..................................................................................................1 1.2 Objectives of the Sensitive Ecosystems Inventory .......................................................................1 1.3 Study Area ....................................................................................................................................1 1.4 Rationale.......................................................................................................................................3
1.4.1 Ecological Importance ..........................................................................................................3 1.4.2 Development pressure .........................................................................................................5
1.5 History of the SEI Project..............................................................................................................5 1.6 Sensitive Ecosystems Categories ................................................................................................7 1.7 Inventory Format...........................................................................................................................7
Section 2 Methodology and Limitations ............................................................... 9 2.1 Study Area Boundaries .................................................................................................................9 2.2 SEI Ecosystem Classification .......................................................................................................9 2.3 Inventory Phase 1: Air Photo Interpretation (1993 - 1994).........................................................12
2.3.1 Air photos............................................................................................................................12 2.3.2 Mapping criteria ..................................................................................................................12 2.3.3 Database Development ......................................................................................................14 2.3.4 Working maps.....................................................................................................................15
2.4 Inventory Phase 2: Field Checking (1994 and 1995 field seasons) ...........................................15 2.4.1 Field sampling strategy.......................................................................................................15 2.4.2 Private land access protocol...............................................................................................16 2.4.3 Field work ...........................................................................................................................16 2.4.4 Full ecological plots ............................................................................................................17 2.4.5 CWS Comox Valley Wetlands Inventory (CVWI) field work...............................................17
2.5 Inventory Phase 3: Map Preparation (1995 - 1997) ...................................................................17 2.5.1 Digitizing .............................................................................................................................17 2.5.2 Databases...........................................................................................................................18 2.5.3 Map development ...............................................................................................................18
2.6 Limitations...................................................................................................................................20 2.6.1 Revisions and updates .......................................................................................................21
2.7 Obtaining Further Information.....................................................................................................21
Section 3 Ecosystem Descriptions ...................................................................... 23 3.1 Significance and Interdependence of Ecosystem Types at the Landscape Level .....................23 3.2 Coastal Bluff (CB) .......................................................................................................................24 3.3 Sparsely Vegetated (SV) ............................................................................................................27 3.4 Terrestrial Herbaceous (HT) .......................................................................................................30 3.5 Wetland (WN)..............................................................................................................................33 3.6 Riparian (RI)................................................................................................................................36 3.7 Woodland (WD) ..........................................................................................................................39 3.8 Older Forest (OF)........................................................................................................................42

vi
3.9 Older Second Growth Forest (SG)..............................................................................................45 3.10 Seasonally Flooded Agricultural Field (FS) ..............................................................................48
Section 4 Results and Discussion.......................................................................55 4.1 Limitations of the Analysis...........................................................................................................55 4.2 Analysis of Results for Entire SEI Study Area ............................................................................56
4.2.1 Summary data.....................................................................................................................56 4.2.2 Coastal Bluff (CB) ...............................................................................................................58 4.2.3 Sparsely Vegetated (SV) ....................................................................................................59 4.2.4 Terrestrial Herbaceous (HT) ...............................................................................................60 4.2.5 Wetland (WN) .....................................................................................................................60 4.2.6 Riparian (RI)........................................................................................................................63 4.2.7 Woodland (WD) ..................................................................................................................64 4.2.8 Older Forest (OF)................................................................................................................66 4.2.9 Older Second Growth Forest (SG) .....................................................................................68 4.2.10 Seasonally Flooded Agricultural Field (FS) ......................................................................68 4.2.11 Additional General Observations ......................................................................................69
4.3 Comox Sub-unit ..........................................................................................................................70 4.3.1 Summary data.....................................................................................................................70 4.3.2 Coastal Bluff (CB) ...............................................................................................................71 4.3.3 Sparsely Vegetated (SV) ....................................................................................................71 4.3.4 Terrestrial Herbaceous (HT) ...............................................................................................71 4.3.5 Wetland (WN) .....................................................................................................................72 4.3.6 Riparian (RI)........................................................................................................................73 4.3.7 Woodland (WD) ..................................................................................................................74 4.3.8 Older Forest (OF)................................................................................................................74 4.3.9 Older Second Growth Forest (SG) .....................................................................................74 4.3.10 Seasonally Flooded Agricultural Field (FS) ......................................................................75
4.4 Nanaimo Sub-unit .......................................................................................................................76 4.4.1 Summary data.....................................................................................................................76 4.4.2 Coastal Bluff (CB) ...............................................................................................................77 4.4.3 Sparsely Vegetated (SV) ....................................................................................................77 4.4.4 Terrestrial Herbaceous (HT) ...............................................................................................77 4.4.5 Wetland (WN) .....................................................................................................................78 4.4.6 Riparian (RI)........................................................................................................................78 4.4.7 Woodland (WD) ..................................................................................................................79 4.4.8 Older Forest (OF)................................................................................................................80 4.4.9 Older Second Growth Forest (SG) .....................................................................................80 4.4.10 Seasonally Flooded Agricultural Field (FS) ......................................................................80
4.5 Cowichan Sub-unit ......................................................................................................................81 4.5.1 Summary data.....................................................................................................................81 4.5.2 Coastal Bluff (CB) ...............................................................................................................82 4.5.3 Sparsely Vegetated (SV) ....................................................................................................82 4.5.4 Terrestrial Herbaceous (HT) ...............................................................................................82 4.5.5 Wetland (WN) .....................................................................................................................83 4.5.6 Riparian (RI)........................................................................................................................83 4.5.7 Woodland (WD) ..................................................................................................................85 4.5.8 Older Forest (OF)................................................................................................................85 4.5.9 Older Second Growth Forest (SG) .....................................................................................85 4.5.10 Seasonally Flooded Agricultural Field (FS) ......................................................................86
4.6 Capital Sub-unit...........................................................................................................................87 4.6.1 Summary data.....................................................................................................................87 4.6.2 Coastal Bluff (CB) ...............................................................................................................88 4.6.3 Sparsely Vegetated (SV) ....................................................................................................88 4.6.4 Terrestrial Herbaceous (HT) ...............................................................................................88

vii
4.6.5 Wetland (WN) .....................................................................................................................89 4.6.6 Riparian (RI) .......................................................................................................................89 4.6.7 Woodland (WD) ..................................................................................................................89 4.6.8 Older Forest (OF) ...............................................................................................................90 4.6.9 Older Second Growth Forest (SG) .....................................................................................90 4.6.10 Seasonally Flooded Agricultural Field (FS) ......................................................................90
4.7 Islands Sub-unit ..........................................................................................................................91 4.7.1 Summary data ....................................................................................................................91 4.7.2 Coastal Bluff (CB) ...............................................................................................................93 4.7.3 Sparsely Vegetated (SV) ....................................................................................................93 4.7.4 Terrestrial Herbaceous (HT)...............................................................................................93 4.7.5 Wetland (WN) .....................................................................................................................93 4.7.6 Riparian (RI) .......................................................................................................................94 4.7.7 Woodland (WD) ..................................................................................................................94 4.7.8 Older Forest (OF) ...............................................................................................................94 4.7.9 Older Second Growth Forest (SG) .....................................................................................95 4.7.10 Seasonally Flooded Agricultural Field (FS) ......................................................................95
Section 5 Conclusions and Future Directions.................................................... 97 References......................................................................................................................................101 Glossary ..........................................................................................................................................106
Appendices 2 Appendix 1: Inventory Products..........................................................................................................111 Appendix 2: Structural Stages ............................................................................................................114 Appendix 3: Introduced Plant Species................................................................................................117 Appendix 4: Common and Scientific Plant Names Used in This Report............................................120 Appendix 5: SEI Update Form ............................................................................................................125 Appendix 6: List of Contacts ...............................................................................................................126 Appendix 7: SEI Polygon Database....................................................................................................127 Appendix 8: Field Data Report - Sample ............................................................................................128 Appendix 9: Groundtruthing Forms.....................................................................................................130 Appendix 10 Natural History of the Study Area .................................................................................137
List of Figures Figure 1: Study Area ...............................................................................................................................2 Figure 2: Ecosections of the Georgia Depression Ecoprovince.............................................................3 Figure 3: Biogeoclimatic Units Associated with the Study Area .............................................................4 Figure 4: Study area sub-units................................................................................................................8 Figure 5: Occurrence of ‘pure’ and ‘complexed’ units by ecosystem type ...........................................14 Figure 6: Illustration of ‘pure’ and ‘complexed’ map symbols...............................................................19 Figure 7: Sample of attribute table shown on paper maps...................................................................20 Figure 8: Coastal Bluff polygons in the Ballenas/Winchelsea Archipelago ..........................................26 Figure 9: Sparsely Vegetated spit, dune and cliff polygons on Sidney and James Islands .................29 Figure 10: Sparsely Vegetated barrier spits in the Capital Sub-unit ...................................................29 Figure 11: Terrestrial Herbaceous ecosystem polygons in the Menzies Bay area ..............................32 Figure 12: Wetlands near Qualicum Beach..........................................................................................35 Figure 13: Wetlands at the Campbell River estuary.............................................................................35 Figure 14: Riparian ecosystem polygons on the tributaries and main stem of the Englishman River .37 Figure 15: Woodland polygons on Saltspring Island ............................................................................40 Figure 16: Older forest polygons in the Deep Bay, Rosewall Creek area............................................43 Figure 17: Older second growth forest polygons in the Comox Valley ................................................46 Figure 18: Seasonally Flooded Agricultural Field polygons near the Chemainus River ......................50

viii
Figure 19: Seasonally Flooded Agricultural Field polygons near the Nanaimo River Estuary .............50 Figure 20: Study area sub-units............................................................................................................55 Figure 21: Landscapes of East Vancouver Island and Gulf Islands.....................................................56 Figure 22: Proportion of sub-units containing Coastal Bluff ecosystems .............................................58 Figure 23: Occurrence of CB as ‘pure’ or ‘complexed’ polygons .........................................................58 Figure 24: Proportion of sub-units containing Sparsely Vegetated ecosystems ..................................59 Figure 25: Occurrence of SV as ‘pure’ or ‘complexed’ polygons..........................................................59 Figure 26: Proportion of sub-units containing Terrestrial Herbaceous ecosystems.............................60 Figure 27: Occurrence of HT as ‘pure’ or ‘complexed’ units.................................................................60 Figure 28: Wetland sub-classes by sub-unit.........................................................................................61 Figure 29: Occurrence of WN as ‘pure’ or ‘complexed’ polygons ........................................................61 Figure 30: Representation of wetlands by sub-class............................................................................62 Figure 31: Proportion of sub-units containing Riparian structural stages.............................................63 Figure 32: Occurrence of Riparian Structural Stages as pure or dominant components.....................63 Figure 33: Occurrence of RI as ‘pure’ or ‘complexed’ polygons...........................................................64 Figure 34: Woodland ecosystems by sub-unit......................................................................................65 Figure 35: Woodlands as ‘pure’ or ‘complexed’ units ...........................................................................65 Figure 36: Proportion of sub-units containing Older Forest ecosystems..............................................66 Figure 37: Occurrence of OF as ‘pure’ or ‘complexed’ polygons .........................................................67 Figure 38: Occurrence of SG as ‘pure’ or ‘complexed’ polygons .........................................................68 Figure 39: FS ecosystems by sub-unit .................................................................................................68 Figure 40: Occurrence of FS as ‘pure’ or ‘complexed’ polygons..........................................................69 Figure 41: Comox Sub-unit and municipal boundaries.........................................................................70 Figure 42: Relative proportion of sensitive ecosystems in Comox Sub-unit ........................................71 Figure 43: Riparian ecosystems in the Comox Sub-unit ......................................................................73 Figure 44: Nanaimo Sub-unit and municipal boundaries......................................................................76 Figure 45: Relative proportion of sensitive ecosystems in Nanaimo Sub-unit .....................................77 Figure 46: Riparian ecosystems in the Nanaimo Sub-unit ...................................................................79 Figure 47: Cowichan Sub-unit and municipal boundaries ....................................................................81 Figure 48: Relative proportion of sensitive ecosystems in Cowichan Sub-unit ....................................82 Figure 49: Riparian ecosystems in the Cowichan Sub-unit ..................................................................84 Figure 50: Capital Sub-unit and municipal boundaries.........................................................................87 Figure 51: Relative proportion of sensitive ecosystems in the Capital Sub-unit...................................88 Figure 52: Islands Sub-unit and major islands......................................................................................91 Figure 53: Relative proportion of sensitive ecosystems in Islands Sub-unit ........................................92 Sample map and corresponding air photo................................................................... inside back cover
List of Tables Table 1: Sites visited by ecosystem type..............................................................................................15 Table 2: Summary SEI Data by Sub-unit and Dominant Ecosystem Type...........................................57 Table 3: Area (ha) of ecosystems in the Comox Sub-unit by municipality ...........................................70 Table 4: Area (ha) of ecosystems in the Nanaimo Sub-unit by municipality ........................................76 Table 5: Area (ha) of ecosystems in the Cowichan Sub-unit by municipality.......................................81 Table 6: Area (ha) of ecosystems in the Capital Sub-unit by municipality ...........................................87 Table 7: Area (ha) of ecosystems in the Islands Sub-unit by major island...........................................92
List of Photos Photo 1: Coastal Bluff (CB)...................................................................................................................51 Photo 2: Sparsely Vegetated sand and gravel spit (SV:sp)..................................................................51 Photo 3: Terrestrial Herbaceous (HT)...................................................................................................51 Photo 4: Wetland: marsh (WN:ms) .......................................................................................................52 Photo 5: Wetland: shallow water (WN:sw)............................................................................................52 Photo 6: Wetland: swamp (WN:sp).......................................................................................................52 Photo 7: Riparian: mature (RI:6) ...........................................................................................................53

ix
Photo 8: Woodland (WD)......................................................................................................................53 Photo 9: Older Forest (OF) ...................................................................................................................53 Photo 10: Older Second Growth Forest (SG).......................................................................................54 Photo 11: Seasonally Flooded Agricultural Field (FS)..........................................................................54

x

Introduction
Sensitive Ecosystems Inventory: East Vancouver Island and Gulf Islands 1
Section 1 Introduction 1.1 Purpose of the Technical Report This is the first of two reports which are intended to accompany the Sensitive Ecosystems Inventory (SEI) maps and associated database. This report (Volume 1) describes the inventory and mapping methods used (Section 2), briefly discusses the ecological characteristics of the major ecosystem types mapped (Section 3) and summarizes and analyzes the inventory results (Section 4). The companion report1 (Volume 2) discusses more fully the values of the ecosystems mapped, provides management guidelines and describes tools and mechanisms available for implementing appropriate land management on the identified sites.
1.2 Objectives of the Sensitive Ecosystems Inventory The primary objective of the SEI project was to systematically identify, classify, and map terrestrial2 ecosystems3 and other habitats of high biodiversity which remain relatively unmodified, on eastern Vancouver Island and the adjacent Gulf Islands. The intent was to develop an inventory information base that would support sound land management decisions and promote good land stewardship. It is the first inventory of its kind in B.C. in which a broad ecosystem approach has been taken in a large study area to provide scientific data on ecosystem distribution, vegetation, quality and condition as an aid in land use planning. Although these rare and fragile ecosystems were mapped individually, many are interdependent and should not be looked at in isolation. They must be considered within the context of the overall landscape which includes sensitive aquatic ecosystems. Some partially modified and non-natural ecosystems also function as reservoirs for biodiversity in otherwise highly developed and urbanized landscapes, act as buffers between developed areas and the more fragile ecosystems and provide wildlife corridors and important habitat niches throughout developed areas. The growing recognition of, and interest in, rare or threatened ecosystems and rare species was accompanied by the increasing realization that even these modified ecosystems were increasingly threatened by development.
1.3 Study Area The study area (Figure 1) is located in southwestern British Columbia on the eastern coastal lowland of Vancouver Island. It extends approximately 250 km from Campbell River in the north to Sooke in the south, and includes the adjacent Gulf Islands4. The width of the region is variable, from less than two kilometres in the vicinity of Fanny Bay to approximately 35 km between Galiano Island and the upper Cowichan River valley. This region, comprising approximately 4,100 square kilometres, consists mainly of gently rolling hills that give way to flatter plains bordering much of the Strait of Georgia. It also lies within the rainshadow of the Vancouver Island and Olympic mountains, which is a major contributing factor to the study area’s unique ecological nature.
1 SEI Conservation Manual (McPhee et al., in progress) 2 Streams, lakes and marine areas are equally important, although not included in this partlicular inventory 3 All terms highlighted in bold are explained in the glossary. 4 The islands in Howe Sound and the more northerly islands in the Strait of Georgia are not included in this study area.

Introduction
Sensitive Ecosystems Inventory: East Vancouver Island and Gulf Islands 2
Approximately 90% of the population of Vancouver Island and most of the island’s farmland and major transportation routes are found here (Yorath and Nasmith 1995). Fully half of the identified and described plant communities found within this rapidly developing area are on the Conservation Data Centre’s list of rare, threatened and endangered elements. The majority of the remainder is considered to be vulnerable to, and at risk of, human activities or natural events The study area lies within the Georgia Depression Ecoprovince5 (Figure 2), and includes: • the Nanaimo Lowland Ecosection (NAL), the coastal plain that defines the study boundaries
on east Vancouver Island; • the Southern Gulf Islands Ecosection (SGI), which encompasses the southern islands
portion of the study area; and • the Strait of Georgia Ecosection (SOG), the semi-enclosed basin that separates southern
Vancouver Island from the mainland and includes Denman, Hornby and Lasqueti Islands.
5 Demarchi (1996) describes the Ecoregion Classification System, which stratifies B.C. into discrete geographical units based on climatic processes and landforms. The classification applies at five different levels; of these, the lowest three levels, Ecoprovince, Ecoregion, and Ecosection, are the most detailed and the most relevant for purposes of this study. They describe areas of similar climate, physiography, oceanography, hydrology, vegetation, and wildlife potential.
20 0 20 40 60 80 100 Kilometers
Study Area
V a n c o u v e r I s l a n d
Campbell River
Comox
Nanaimo
Victoria
Vancouver
Lasqueti I.
Georgia#
pw
Figure 1: Study Area

Introduction
Sensitive Ecosystems Inventory: East Vancouver Island and Gulf Islands 3
1.4 Rationale
1.4.1 Ecological Importance The study area comprises an ecological region unique in Canada. The unusual climatic regime, combined with a diversity of ecosystem types and relatively high productivity, results in an area of exceptionally high biodiversity values. The area supports many unique ecosystems and contains some of the most endangered rare plant species in British Columbia. At least half of the identified plant communities occurring within the study area are considered provincially rare or endangered (red-listed); most of the remainder are considered vulnerable (blue-listed)6. Further information on the natural history of this area is provided in Appendix 10. A 1976 symposium on Canada’s threatened species and ecosystems pointed to the increasing rarity of a number of the ecosystems within the study area, as well as in the lower mainland and the southern interior (Foster, B. in Mosquin & Suchal 1977). In the same year, a paper on the native vegetation of the Capital Region (McMinn et al. 1976) singled out oak woodlands and identified that very few remained in original condition due to settlement. It also identified that only two of seven large peat bogs that had previously existed on the Saanich Peninsula were extant in 1976. At a 1980 symposium on threatened and endangered species and habitats in B.C. and the Yukon, lowland forests, especially old-growth Douglas-fir7 forests, Garry oak ecosystems, natural grasslands, marshes, bogs, estuaries, sand dunes, and tidal flats were all identified as threatened or rare ecosystems on 6 These red and blue-listed plant associations refer exclusively to ‘climax’ successional stages. 7 Common plant names are used in this report; see Appendix 4 for corresponding scientific names.
GEORGIA DEPRESSION ECOPROVINCE
20 0 20 40 60 80 100 Kilometers
Fraser Lowland EcosectionGeorgia Lowland EcosectionLeeward Island Mountains EcosectionNanaimo Lowland EcosectionSouthern Gulf Islands EcosectionStrait of Georgia Ecosection
FRLGELLIMNALSGISOG
LIM
NAL
SOG
GEL
SGI
FRLpw
Figure 2: Ecosections of the Georgia Depression Ecoprovince

Introduction
Sensitive Ecosystems Inventory: East Vancouver Island and Gulf Islands 4
southeast Vancouver Island and the Gulf Islands (Foster 1980; Pojar 1980a, 1980b; and Hunter 1980). Since then, several other reviews and analyses have been conducted to examine certain ecosystems in more detail. Considerable emphasis has focused on coastal old-growth forest ecosystems, with a number of papers examining their status in the province, including Roemer et al. (1988), who emphasized the need to inventory remaining old-growth forest both within and outside of protected areas, in order to identify important gaps in ecological representation. Woodlands have also been the centre of considerable attention, and a symposium specifically addressing Garry oak ecosystems was held in Victoria in 1993. At this symposium, a recommendation for inventory of the Garry oak ecosystems was strongly supported.
The SEI study area includes two biogeoclimatic zones8: the Coastal Douglas-fir zone (CDF) and the Coastal Western Hemlock zone (CWH) (Figure 3). In Canada, the CDF zone occurs only on southeastern Vancouver Island, on the Gulf Islands, on small portions of the Sunshine Coast, and on the Fraser River Delta (Eng 1992). The zone covers about 2,161 sq. km. in total, representing only one-quarter of one percent of B.C.’s total land area (948,600 sq. km.). Almost three-quarters of the CDF zone occurs within the SEI study area. Similar climate conditions and plant communities do occur in Washington, in the Puget Trough and on the San Juan Islands, and also in Oregon in the Willamette Valley (Nuszdorfer et al. 1991).
8 Developed by Krajina, 1965, the Biogeoclimatic Ecosystem Classification System (BEC) classifies areas of similar regional climate, expected climax plant communities and site factors such as soil moisture and soil nutrients. The subzone is the basic unit of this classification system; within subzones, variants further identify more local climatic factors. The system is described in detail in a variety of publications including Meidinger and Pojar (1991) and Green and Klinka (1994).
Coastal Douglas-fir, moist maritime (CDFmm)
Coastal Western Hemlock, very dry maritime (CWHxm1)
Coastal Western Hemlock, moist maritime (CWHmm) (shows only portion within study area)
Coastal Western Hemlock, very dry maritime (CWHxm2) (shows only portion within study area)
20 0 20 40 60 80 100 Kilometers
$
$
$
$
$
Powell River
Sechelt
Campbell River
Comox
Vancouver
Victoria
Nanaimo
V a n c o u v e r
I s l a n d
S t r a i t
o f
G e o r g i a$
Port Alberni
Gulf Islands
pw
Figure 3: Biogeoclimatic Units Associated with the Study Area

Introduction
Sensitive Ecosystems Inventory: East Vancouver Island and Gulf Islands 5
A 1992 analysis of protected areas on Vancouver Island determined that although 12% of provincial ecosystems is generally considered a minimal protection target to achieve ecological representation, the CDF zone representation was already well below this figure, with less than 1% remaining (Eng 1992). Similarly, the Coastal Western Hemlock very dry maritime subzone (CWHxm) was identified as being greatly under-represented.
1.4.2 Development pressure The increasing development pressure on remaining natural areas in the most populated parts of British Columbia was a major impetus in initiating the Sensitive Ecosystems Inventory project for eastern Vancouver Island and the Gulf Islands. The region is considered one of the most desirable in B.C. for human settlement, a consequence of relatively easy accessibility, gentle topography well suited to development, a warm, sunny climate, attractive landscapes, and areas with high agricultural capability. Human population pressure is thus extreme, and the area supports one of the most dense concentrations in the province. By 1996, approximately 580,000 people (86% of the total Vancouver Island and Gulf Island population) lived within the SEI study area9. The area continues to experience rapid population growth and urban expansion. According to the latest census (1996), eastern Vancouver Island (outside of the Capital Regional District) had the highest growth rate in B.C., increasing by 19% between 1991 and 1996, ahead of both the Okanagan Valley (18%) and the lower mainland (15%). The average growth rate for B.C. during the same period was 13.5% compared to only 5.7% on average for Canada. Four of the top five fastest growing municipalities in B.C. (with >5,000 people) are in the study area: Courtenay (48% increase in population between 1991 and 1996), Ladysmith (32%), Qualicum Beach (31%) and Parksville (28%). This growth, along with its attendant infrastructure, results in the continuing loss of ecosystems through clearing, draining, and conversion to commercial and residential development, industry and agriculture. Continual fragmentation of the remaining ecosystems and a wide range of more indirect impacts also occur as a consequence. Prentice & Boyd (1988) examined historical changes to estuarine habitats on the east coast of Vancouver Island, and identified that substantial losses—a decrease of over 32%—to estuarine marshes had occurred by the turn of the century. Although this loss then slowed, they noted that adjacent forests and agricultural lands were being increasingly replaced by other urban land uses. Because of this continued development pressure, and an increased public awareness and interest, there was a growing need during the 1980’s and early 1990’s to identify remnant natural areas, and to bring attention to the available tools and mechanisms for implementing stewardship and protection of these areas.
1.5 History of the SEI Project In the spring of 1993, the Sensitive Ecosystems Inventory project was initiated. At that time a number of potentially overlapping projects on eastern Vancouver Island were concurrently being considered by government agencies, each with its own mandate and objectives. From this, it was apparent that a systematic and focused study to inventory rare and fragile
9 based on 1996 Census (Statistics Canada 1996).

Introduction
Sensitive Ecosystems Inventory: East Vancouver Island and Gulf Islands 6
ecosystems of biodiversity or wildlife significance would meet the objectives of a number of these agencies: • Environment Canada, Canadian Wildlife Service (CWS);
The Canadian Wildlife Service (CWS) handles wildlife matters that are the responsibility of the federal government. These include the conservation and management of migratory birds, nationally significant habitat and endangered species, as well as work on other wildlife issues of national and international importance. As a partner in the Pacific Coast Joint Venture (PCJV) under the North American Waterfowl Management Plan, CWS works towards ensuring the long-term maintenance of coastal wetland ecosystems. In 1992 CWS began conducting an inventory of wetlands in the Comox Valley, which was subsequently amalgamated into the broader SEI project.
• B.C. Ministry of Environment, Lands and Parks (MELP), Vancouver Island Regional office, Nanaimo;
MELP is responsible for the management, protection and enhancement of British Columbia’s environment and is also a partner in the PCJV. This includes the protection, conservation and management of provincial fish, wildlife, water, land and air resources; the management and allocation of Crown land; and the protection and management of provincial parks, recreation areas and ecological reserves. MELP Habitat Protection and Wildlife staff are interested in identifying areas of high biodiversity, wildlife habitat and conservation value.
• B.C. Ministry of Environment, Lands and Parks (MELP), Conservation Data Centre (CDC), Victoria.
The CDC’s mandate is to compile, analyze and distribute information on the Province’s biological diversity. The CDC maintains a computerized and centralized databank that is designed to provide an objective source of information on rare and endangered plants, animals and plant communities. The CDC locates, identifies, tracks and records the state of protection of these rare elements throughout B.C. The CDC assigns provincial status to species and ecosystems that are considered endangered or threatened (Red List), and vulnerable (Blue List). Design of sites for ecological protection and evaluation of proposed conservation sites is becoming an increasingly important function of the CDC.
By pooling resources and expertise, a more comprehensive, cost-effective, and efficient inventory was achieved. A Technical Advisory Group (TAG) comprising personnel from these agencies was established to initiate and direct the project through its various phases. The TAG formalized project goals, established methodologies, managed contracts, designed the inventory products and conducted quality control throughout the project to ensure continuity, consistency and accuracy. Consultants conducted the air photo interpretation, field checking and map production. Major funding throughout the five years of the project was provided by Environment Canada and the Habitat Conservation Trust Fund with additional contributions from several local governments and other government agencies (Acknowledgments). The SEI project has evolved into two distinct stages: the Inventory (1993-1997) that is described in this technical report; and the subsequent Implementation Stage that will be completed by 2000. In this second stage, support materials and extension services have been designed to engage the involvement of land-use decision-makers at all levels, and encourage the use of the SEI information. The Conservation Manual (companion report to this document) describes development guidelines and other tools and mechanisms which

Introduction
Sensitive Ecosystems Inventory: East Vancouver Island and Gulf Islands 7
can be used to conserve these ecosystems. Outreach services include short term scientific support, training programs to improve the SEI assessment capability within a variety of sectors and a web site containing an educational component and access to all SEI documents.
1.6 Sensitive Ecosystems Categories For this project, ecosystem is defined as a portion of landscape with relatively uniform dominant vegetation; a sensitive ecosystem is one which is considered fragile and/or rare. Seven broad categories of sensitive terrestrial ecosystem types were selected for delineation based on their rarity, their potential to support rare species, their value as wildlife habitats, and their biodiversity value: coastal bluff; sparsely vegetated; terrestrial herbaceous; wetland; riparian; woodland; and older forest ecosystems. Two modified ecosystem types were mapped based on their biodiversity and wildlife habitat values: seasonally flooded agricultural field and older second growth forest ecosystems (see Section 4 for details).
1.7 Inventory Format At the outset it was decided to develop the SEI using the Arc/Info Geographic Information System (GIS), primarily in recognition of the major benefits a GIS provides. GIS ensures the accurate measurement and location of spatial data, offers an efficient method of spatial analysis and allows for the timely updating of information and for the production of hardcopy maps upon demand. Another major benefit of GIS-produced data is that it facilitates the integration of other data sets, such as cadastral information, for analysis and illustration. Since ecosystems rarely follow legal lot lines, the management and analysis of a complex array of administrative, legal, planning and political boundaries and designations that can cover an ecosystem site are the types of functions which are ideally suited to GIS (McCullough and Mason 1996), and hence could be used with the SEI products. A set of 66 maps was produced at a scale of 1:20,000 and is available in both digital and hardcopy formats10. The SEI maps and accompanying database provide senior governments with necessary data for a variety of resource management issues, and also provide municipal and regional governments easier access to integrated data for use in developing Official Community Plans, Regional Growth Strategies, Local Area Plans, Greenways, Parks Plans, and in assessing development proposals. They can also be useful to land developers, public interest groups and the public.
10 For information on obtaining the maps or database, please see Appendix 1.

Methodology and Limitations
Sensitive Ecosystems Inventory: East Vancouver Island and Gulf Islands 8
10 0 10 20 30 Kilometers
pw
Comox Sub-unit
Nanaimo Sub-unit
Cowichan Sub-unit
Capital Sub-unit
Islands Sub-unit
Regional District boundaries
Comox-Strathcona
RD
Nanaimo RD
Powell River
RD
CowichanValley
RD
Capital RD
Figure 4: Study area sub-units

Methodology and Limitations
Sensitive Ecosystems Inventory: East Vancouver Island and Gulf Islands 9
Section 2 Methodology and Limitations This chapter describes methods used during each of the three stages of the inventory: air photo interpretation, field checking and map production. It also documents limitations inherent in the methods or materials employed. Quality control was conducted by the SEI Technical Advisory Group (TAG) on an ongoing basis throughout the five years of the project. Work submitted by consultants was checked and revised to ensure continuity, consistency, completeness and accuracy throughout the various stages of the inventory as well as across the five sub-units of the study area.
2.1 Study Area Boundaries The western boundary of the SEI study area was based on the Nanaimo Lowland Ecosection (NAL) boundary (Figures 1 and 2). This boundary, which was available only at a scale of 1:250,000, was transferred manually to the 1:20,000 TRIM11 base maps; minor adjustments were made to ensure consistency with the smaller scale maps. Therefore, the SEI boundary conforms closely but not exactly to the Nanaimo Lowland boundary as shown on the 1:250,000 Biogeoclimatic Units map (Ministry of Forests 1994). A few places near the boundary, where no air photos existed at appropriate scales, were also excluded from the study area at this stage. For practical purposes, the study area was divided into five separate sub-units of more manageable size. These five sub-units are referred to throughout this report as the Comox, Nanaimo, Cowichan, Capital and Islands sub-units (Figure 4). The four sub-units on Vancouver Island do not include entire Regional Districts, but rather consist of the coastal lowland portion of each Regional District. The included12 islands adjacent to Vancouver Island are grouped together as one sub-unit although they are technically part of the adjacent regional districts; for example, Pender Island is within the Capital Regional District but for the purpose of this project falls within the Islands Sub-unit. Air photo interpretation, field checking and data compilation were organized within the context of these five areas.
2.2 SEI Ecosystem Classification The SEI ecosystem classification was developed specifically for this project. The seven broad “sensitive ecosystem” categories represented the remaining terrestrial ecosystems within the study area that were considered to be particularly rare, fragile or threatened by continued development. These ecosystem types also contained higher concentrations of rare plants, animals and plant communities than were found in other ecosystem types within the study area. Within these broad categories there was often a wide range of specific vegetation
11 Refers to the standardized digital base map developed by the Province of B.C. (TRIM = Terrain Resource Information Management) 12 The islands in Howe Sound and the more northerly islands in the Strait of Georgia are not included in this study area.

Methodology and Limitations
Sensitive Ecosystems Inventory: East Vancouver Island and Gulf Islands 10
communities that could occur. (The nine ecosystems and their associated plant communities are described in Section 3; photographs depicting examples of the ecosystem types are shown at the end of the section). The seven sensitive ecosystem categories used for this project were: Coastal bluff (CB) – vegetated rocky islets, shorelines and coastal cliffs; Sparsely vegetated (SV) – dunes, spits and inland cliffs; Terrestrial herbaceous (HT) – mosaics of coastal grassland meadows and moss-covered
rock outcrops; Wetland (WN) – marshes, fens, bogs, swamps, shallow water, and wet meadows; Riparian (RI) – vegetated floodplains, stream and lake shores and gullies; Woodland (WD) – open forests dominated by deciduous trees with canopy cover generally
less than 50%; Older forest (OF) – forests older than 100 years, dominated by conifers; Two additional ecosystem types were mapped for their biodiversity and wildlife habitat values: Older second growth forest (SG) - large stands of conifers 60-100 years old; Seasonally flooded agricultural fields (FS). Using ecosystems as the basis for mapping was relatively new and for this reason few classification systems existed for the ecosystems mapped in this project. In some cases existing classification schemes were used and in other cases, they were modified to suit the landscape level inventory of the SEI. Classification systems did not exist for coastal bluff, sparsely vegetated and terrestrial herbaceous ecosystem categories. The sub-classes in each were selected by the CDC based on professional experience. Each ecosystem type had the potential to support within it a number of different and distinct vegetation communities, although the results of the inventory showed that some refinement was necessary to reduce some ambiguities and overlap within some of the SEI polygons. Some examples included the herbaceous Idaho fescue - junegrass community that may have occurred on coastal bluffs (or may have been mapped as terrestrial herbaceous ecosystems), and the mossy long-stoloned sedge-rock moss community that occurred on coastal bluffs and sparsely vegetated rock outcrops. There had been ongoing work on classifying wetland ecosystems since the mid 1970’s. Wetlands were classified for this project according to a developing provincial wetland classification scheme (McKenzie & Banner, 1998). Six wetland classes were recognized for coastal B.C. Classification was based on a combination of vegetation community and site factors such as hydrology and nutrient availability. There was, however, considerable variation within some of these classes, and more than one distinct plant community may have been recognized within them (see Section 3.5 for details). Wetland ecosystems are usually in a state of perpetual change, and complexes of several different types of wetlands within any one polygon were typical. SEI riparian ecosystem polygons were classified by structural stage,13 effectively indicating the successional (developmental) stage of the riparian vegetation. Structural stage 13 Structural stages were applied according to the Standards for Terrestrial Ecosystems Mapping in British Columbia. See Appendix 2 for full descriptions of structural stages.

Methodology and Limitations
Sensitive Ecosystems Inventory: East Vancouver Island and Gulf Islands 11
classifications used and their descriptions are briefly summarized in Section 3.6 and fully described in Appendix 2. Definitions for riparian structural stages were updated part way through the project to conform to new provincial standards. Floodplain areas are typically a complex of a variety of different structural stages because of the highly dynamic nature of these systems, which are in a state of constant flux as the river channels and flooding regimes change over time. Riparian gullies, although not on floodplains, were also included within the riparian ecosystem category. Gullies support a variety of different plant communities, which are often, but not always, some of the moister forest site series. Woodlands have long been recognized as distinct ecosystems and were therefore identified as a separate ecosystem category for this project; the CDC has described a number of different woodland plant community types. Roemer (1972) described woodland types within the Saanich Peninsula, McMinn (1976) described native plant communities including woodlands in the Victoria Metropolitan Area, and Erickson (1996) described plant communities associated with Garry oak throughout its range in southwestern British Columbia. SEI polygons classified as older forest and older second growth forest ecosystems represented particularly broad categories, encompassing a number of forested ‘site series’14 as described by the Ministry of Forests’ Biogeoclimatic Ecosystem Classification (BEC) system. Large forested SEI polygons may have occasionally represented a single site series but were more likely to comprise a complex of at least two different forest ecosystems. These site series are identified Greene & Klinka (1994) which recognizes 14 distinct site series within the Coastal Douglas fir zone, all of which are likely to occur within the study area. In addition, another 15 site series are described for the CWHxm, several of which occur in the SEI study area. Seasonally flooded agricultural field ecosystems were fields that flooded in winter and may at one time have supported a number of moist forested and non-forested ecosystems, including some wetland ecosystems. However, as they were generally ditched, drained and manipulated for their crops they had lost all resemblance to natural communities that once prevailed; nevertheless, they now serve an important role in providing habitat for some species. There was no attempt made to classify the sites under existing schemes.
14 Because of the importance of commercial forestry in B.C., individual forested ecosystems have been generally well described by the BEC system (Section 1.4.1). BEC units are called “site associations”; when specifically associated with a particular biogeoclimatic subzone, they are termed “site series”.

Methodology and Limitations
Sensitive Ecosystems Inventory: East Vancouver Island and Gulf Islands 12
2.3 Inventory Phase 1: Air Photo Interpretation (1993 - 1994)
2.3.1 Air photos The availability of recent air photos at appropriate scales was an important consideration in conducting this type of landscape level inventory. Over 3,000 air photos were obtained, providing almost complete coverage of the SEI study area at scales ranging from 1:8,000 to 1:20,000. The majority (93%) of sites mapped was delineated on air photos at scales of 1:15,000 or larger, 61% of them at 1:10,000 or larger; and the remaining sites were delineated on photos with scales ranging from 1:16,000 to 1:20,000. Most (61%) of the air photos were taken between 1991 and 1993, with almost all of the remainder (38%) taken between 1984 and 1990. To permit three-dimensional imagery needed for air photo interpretation, successive air photos (within and between flight lines) overlapped the same geographic area. In stereo view, topographic features were recognized. Combined with the visual appearance of discrete vegetation communities based on colour, texture and relative height air photo interpretation permitted delineation and tentative identification of ecosystems. The photos were examined stereoscopically by experienced ecologists who delineated (or “typed”) ecosystem boundaries in ink on the photos (see sample of typed air photo and corresponding portion of map at end of report). Supporting information from topographic, soils, and forest cover maps assisted in this process. At that stage, a minimal amount of field checking was conducted to assist the ecologists in air photo interpretation. There was some variability in the quality of the air photos. Recent photos with good resolution and good overlap between photos and flight lines permitted the most accurate interpretation; older photos taken late in the day, with many shadows, allowed less accurate results. On older photos, recent changes to the landscape were not reflected; some of the units identified may no longer exist, and unless field checked will still be depicted on the maps. General landscape conditions may have also changed since the photos were taken, and polygons (the outline delineating an ecosystem on an air photo or map) apparently isolated from development may now have road access, and could therefore be in poorer condition than might be assumed from the photos. In some instances, particularly on the Gulf Islands, newer photos were obtained after the initial air photo interpretation was done and the polygons were updated to exclude logged and developed areas.
2.3.2 Mapping criteria An initial workshop was held with consultants to clarify criteria for delineating polygons, standardize methodologies, and correlate standards between the groups conducting the air photo interpretation in the five sub-units of the SEI study area. In preparation for this task, background information was collected for each sub-unit, including topographic, soils and forest cover maps and relevant reports. Annotated bibliographies of these materials were also prepared15. Polygon Size The targeted minimum mapping size for most ecosystem types was 0.5 ha, although it was not possible to accurately measure the size of each polygon until after the polygons had 15 Available from the CDC

Methodology and Limitations
Sensitive Ecosystems Inventory: East Vancouver Island and Gulf Islands 13
been digitized. For the most part, individual sites less than 0.5 ha were not identified. This does not mean they were not ecologically important. In some cases it was possible to map smaller polygons, particularly where personal knowledge or field work provided the information. Upon completion of the inventory, it was apparent that many sites, in particular wetlands smaller than 0.5 ha, had been mapped and in many cases field checked. These polygons were retained in the inventory due to the valuable contribution they make to biodiversity and to water regulation. Larger minimum sizes were determined to be more appropriate for older and second growth forests, as small, fragmented stands do not support a large diversity of plant and animal life. For forests older than 250 years, one hectare was the minimum targeted size and for forests between 100 and 250 years old, the minimum acceptable size targeted was five hectares. Older second growth polygons were individually evaluated in terms of minimum size, also taking age class and structural stage into account. The original minimum size targeted was 100 hectares. However, this was changed to approximately 25 ha during the second phase of the inventory when it was realized that some valuable second growth polygons had been missed as a result of the 100 ha minimum. It was decided not to impose a strict minimum size for the following reasons: • In some areas, especially in the Gulf Islands, some of the islands themselves are very
small (< 25 hectares) but contain significant stands of older second growth forest; • Areas with smaller stands of older second growth forest but adjacent to other sensitive
ecosystems were included because of the buffer provided by the second growth forest and the valuable wildlife corridors created by the larger combined units.
The accurate identification of polygons as small as 0.5 hectare was possible on air photos at a scale of 1:15,000 or larger (represented by a 4.7mm x 4.7mm square on a 1:15,000 scale photo and 7mm x 7mm at 1:10,000). ‘Pure’ and ‘Complexed’ Units Wherever possible, polygons were delineated and classified as ‘pure’ units (an area contained only one broad ecosystem category). However, 1,659 (22%) of the polygons contained a mosaic of primary and secondary ecosystem components which could not be delineated separately; these were referred to as ‘complexed’ units. In complexed units an ecosystem occurred either as the dominant component (covering more than 50% of the polygon) or secondary component (covering less than 50% of the polygon). The first ecosystem type noted was dominant. As Figure 5 illustrates, some ecosystems occurred as pure units more often than others. For example, 96% of all polygons containing wetlands and 95% of all polygons containing riparian ecosystems occurred as pure units; coastal bluff and older forest ecosystems occurred as pure units in 67% and 53% of polygons respectively. The three other ecosystems most commonly occurred as complexed units: sparsely vegetated ecosystems occurred as pure units in only 39% of the polygons, woodlands 36% and terrestrial herbaceous 29%.

Methodology and Limitations
Sensitive Ecosystems Inventory: East Vancouver Island and Gulf Islands 14
Examples of some common complexes were: HT:ro/SG:co16: Predominantly terrestrial herbaceous rock outcrop ecosystem with
patches of older second growth coniferous forest; WD/HT: Woodland ecosystem interspersed with terrestrial herbaceous ecosystem;
CB:cl/WD: Coastal cliff ecosystem with patches of open woodland. Complexes also occurred within wetland and riparian polygons because of the dynamic nature of these ecosystems. Up to three subclasses for each wetland polygon and three riparian structural stages plus ‘gully’ were used during classification (see Section 3 for more details). The following are some common examples found in the study area:
WN:sp:ms:sw: A swamp-dominated wetland with smaller areas of marsh and shallow water
RI:6:4:1: A predominantly mature riparian forest interspersed with areas of younger floodplain vegetation
2.3.3 Database Development The information recorded during air photo interpretation formed the basic structure of the final database. Each polygon was assigned a unique identification number and all information pertaining to that delineated unit was recorded and subsequently entered into the database (dBase 5). In addition to information relating to the location of the site (map sheet and air photo number) a preliminary classification was assigned based on the seven sensitive and two additional ecosystem types, and the source of the information (e.g. personal knowledge, forest cover map) was recorded (Appendix 7).
16 See Section 3 for descriptions of ecosystem categories
0
500
1000
1500
2000
2500
3000
CB SV HT WN RI WD OF
Sensitive Ecosystem
Num
ber o
f site
s
Pure unit: ecosystem covers100% of unit
Complexed unit: ecosystemcovers >50% of unit (i.e. dominant ecosystem)
Complexed unit: ecosystemcovers <50% of unit (i.e. secondary ecosystem)
Figure 5: Occurrence of ‘pure’ and ‘complexed’ units by ecosystem type

Methodology and Limitations
Sensitive Ecosystems Inventory: East Vancouver Island and Gulf Islands 15
2.3.4 Working maps In order to track the air photo typing as it progressed, and to provide working maps for reference until the printed maps became available much later in the project, polygons were manually transferred onto 1:20,000 paper maps. Whereas maps prepared in this way are much less accurate than those produced by digital mapping methods, they provided a useful ongoing view of mapping progress, and adequate working maps for subsequent field checking.
2.4 Inventory Phase 2: Field Checking (1994 and 1995 field seasons) Once the working maps were complete, a two-day workshop was held with consultants to review and standardize field sampling methodology and to discuss private property and landowner rights.
2.4.1 Field sampling strategy The field checking program was designed to satisfy two objectives: verification of data collected in Phase 1; and collection of data to support the development of classification systems relating to non-forested plant communities. Sampling plans were developed based on accessibility, distribution of the ecological units across the landscape, the level of verification required for a particular ecosystem type, and budget limits. Field checking was higher for ecosystems which were difficult to fully interpret on air photos, such as wetlands, and lower for ecosystems such as coastal bluffs, which were relatively easy to identify. A minimum of 10% sampling was required for the older forests and second growth forests, as the classification for forested polygons was already well established. For non-forested polygons, a minimum of five full ecological plots (ecoplots17) were required In each sub-unit. Table 1 shows that actual field sampling ranged from 15% of coastal bluff polygons to over 45% in flooded fields
Table 1: Sites visited by ecosystem type
Sensitive Ecosystems
Field data collected
*
Ecoplots
Visual observation+
Total sites visited
(% of total sites)
Total no of sites
Coastal Bluff 42 0 47 89 15 591 Terrestrial Herbaceous 150 9 98 248 22 1135 Older Forest 112 4 26 138 29 470 Riparian 257 22 27 284 30 960 Sparsely Vegetated 10 0 6 16 18 86 Woodland 98 9 47 145 24 613 Wetland 942 80 173 1115 42 2645 TOTAL 1611 124 424 2035 31.3 6500
Other Ecosystems Older Second Growth Forest
79 2 40 119 19 614
Seasonally Flooded Field 41 1 84 125 46 274 TOTAL 120 3 124 244 27 888
* Groundtruthed by SEI or CWS Comox Valley Wetlands Inventory + Classification verified by walk by, drive by or water-based observation.
17 See Section 2.4.4

Methodology and Limitations
Sensitive Ecosystems Inventory: East Vancouver Island and Gulf Islands 16
. Accessibility and private land ownership strongly influenced the distribution of field sampling. Many sites were relatively far from existing access or physically difficult to access, such as steep cliffs. These polygons will have received less sampling than sites with good access. Results may be biased by this fact. For example, it is likely that the most accessible sites may be in generally poorer condition, and the data gathered would therefore reflect this. Fenced and gated properties where the owner could not be contacted were not sampled. In a few cases, it was still possible to partially complete a groundtruthing form from an adjacent viewpoint for inaccessible sites.
2.4.2 Private land access protocol A protocol was developed for accessing private land and a short information package was prepared and given to landowners. Field workers endeavored to contact landowners to obtain permission to access all private lands. Where this was not possible, and landowners could not be contacted, site visits were not made.
2.4.3 Field work Groundtruthing forms and guidelines for their use were designed specifically for this project, differing slightly for upland and wetland communities (Appendix 8). They were completed for all sites visited and include the following information: • date of field visit; • field data such as slope, aspect, soil type, moisture and nutrient regimes; • preliminary information on the general landscape condition, adjacent land uses, and the
type and level of disturbance the site had experienced; • vegetation data. The dominant and readily apparent species only were identified, rather
than a comprehensive listing of everything on site. Field crews collected vegetation that could not be identified in the field for subsequent identification. Field crews were provided with lists of rare vascular plants and animals that may occur within their areas and a list of commonly encountered introduced plant species. Percentage cover of introduced plant species was noted, which provided valuable information on the quality and condition of the polygon;
• supplementary notes on observed wildlife values; • for wetlands, information on the hydrology and water flow; • ecosystem classification; • photographs (prints and/or slides) taken to record the polygon; and • a site sketch made to mark: the location of the sample plot, the point from where the
photograph was taken, major vegetation groupings and stream inflow/outflow for wetland sites.
During field checking, tentative classifications assigned during Phase 1 were verified or reviewed and boundary adjustments made on air photos where necessary. Sites that had been developed since the air photos had been taken, or that were considered to be of marginal ecological value, were removed from the inventory. Occasionally polygons were subdivided or new ones added to air photos. As ecosystems were identified in the field, the air photos were reviewed in an iterative process so that as polygon classification was clarified, photos would be revised. In some cases new field visits were made to sites that required more information before classification could be confirmed.

Methodology and Limitations
Sensitive Ecosystems Inventory: East Vancouver Island and Gulf Islands 17
Timing of field work inevitably influences results, particularly vegetation data. Work conducted in early spring will emphasize different components of an ecosystem than work conducted in fall when a different suite of species may predominate on the same site. This factor should not influence site classification, but does influence the amount and quality of vegetation data available for any individual site.
2.4.4 Full ecological plots To assist in classification of the non-forested communities and forested communities of uncertain classification, full ecological plots (ecoplots) were also conducted at a number of the sites in addition to completing the standard SEI groundtruthing form. Detailed site, soils and vegetation forms were completed following standardized methodologies (Luttmerding et al. 1990). Full plots were primarily done on forested polygons not described in the existing field guide (Green & Klinka 1994), on woodlands where the understorey was not dominated by introduced species, and on non-forested polygons with apparently unique vegetation.
2.4.5 CWS Comox Valley Wetlands Inventory (CVWI) field work As noted in Section 1.4 of this report, the CWS had already begun the Comox Valley Wetlands Inventory, or CVWI, as a continuation of work begun under the auspices of the Pacific Coast Joint Venture. A total of 286 sites were identified on air photos and all of these sites were visited during the summer of 1993. For both the CVWI and SEI inventories, the same air photos and similar classification systems were applied. However, some details of the field data collected differed. Consequently, the CVWI data were revised to fit within the SEI classification system, and amalgamated into this inventory.
2.5 Inventory Phase 3: Map Preparation (1995 - 1997) The final steps of the inventory process involved: digitizing polygon boundaries from the air photos; finalizing the database; and digitally linking this database to the digitized polygons. The information recorded for each polygon could then be used to create the maps. The map design and layout were finalized and the map legends and explanatory text written. Hardcopy maps were then generated for editing and publication. Extensive quality control was conducted throughout this stage; ecosystem classifications were verified; each mapped polygon and every air photo were systematically reviewed and edited to resolve discrepancies and ensure consistency and accuracy. During this process the original number of sites in the database was reduced from 9,057 polygons to 7,388. With this number of polygons to check on 66 map sheets and roughly 1,500 stereo pairs of air photos, several sets of draft maps were necessary before discrepancies were resolved.
2.5.1 Digitizing The availability of a digital base map is considered “the single most important issue in developing GIS thematic layers from aerial photographs” (McCullough and Moore, 1995). It was fortunate, therefore, that the Province of B.C. had just completed development of a standardized digital base map, known as TRIM (Terrain Resource Information Management) for most of the study area. The maps are at a scale of 1:20,000 in UTM - NAD83 coordinates and are accurate to 10 m (horizontally).

Methodology and Limitations
Sensitive Ecosystems Inventory: East Vancouver Island and Gulf Islands 18
In order to transfer the polygon outlines accurately from the interpreted air photos to the digital base map, a software-based system known as mono restitution was used. This method was determined to be the most reliable and cost efficient for achieving reasonable accuracy. Mono restitution depends on available Digital Elevation Model (DEM) data, which provide 3-dimensional ground coordinates (XYZ) representing the terrain surface. The system ‘corrects’ for the interior and exterior orientation of the photograph including distortions created by axial rotations (e.g. tilt, roll) which occur when photographs are taken from aircraft. The use of ground control points to tie the polygons to either a map base (TRIM in this case), or to other existing photography, combined with a photogrammetric mathematical model, renders the polygon spatially accurate (International Systemap Corporation, pers. comm.). Discrepancies of up to 1mm can occur between the original line work on the air photos and the results on the maps. Since TRIM mapping at 1:20,000 is generally accurate to within 10m, that difference translates into a potential discrepancy of up to 20m on the ground. For this reason, polygon boundaries should always be field checked for accuracy.
2.5.2 Databases Based on the results of the field checking and subsequent quality control, the primary database was finalized in order to link the information to the digitized polygons for mapping. The contents of the final database are described in Appendix 7. A second database was also developed which contains all site-specific vegetation and ecological details collected during the field work; Appendix 9 replicates the field forms used by field crews and describes the type of information included in each field (see Instructions for completing SEI groundtruthing forms). A field data report18 can be generated for any field-checked polygon. It is anticipated that these electronic databases will generally be used in conjunction with the map sheets. However, the digital data sets can be used in absence of the maps to run a variety of queries and analyses, depending upon user interests. For example, a selection might be done for all woodland polygons within the Cowichan Sub-unit, or for all older forests within the Capital Sub-unit which are greater than 25 ha in size. For the selected polygons, map sheets containing the sites of interest can then be identified, and if necessary, obtained. If the air photos applicable to these polygons are desired, the appropriate air photo numbers can also readily be identified from the database. Within complexed polygons it is not possible to accurately determine the areal extent of the different ecosystem components, as the percentages of cover of each are not recorded19. Similarly, within a given ecosystem category, it is not possible to accurately run an areal analysis for each individual subclass or structural stage, as they are lumped together within one label, without an indication of the percentage occupied by each.
2.5.3 Map development Once this database was finalized it was linked digitally to the polygons which had been created by digitizing the linework on the air photos. This allowed all the information in the database to be accessed through the digital map file. Draft maps were then produced for thorough editing and quality control.
18 See Appendix 8 for sample field data report; available from the CDC. 19 An analysis of the database gives a general indication of how often a particular ecosystem occurs as either a ‘pure’ or ‘complexed’ unit (see section 2.3.2). The results of this analysis are presented as pie diagrams in Section 4.

Methodology and Limitations
Sensitive Ecosystems Inventory: East Vancouver Island and Gulf Islands 19
Base map The maps were organized according to the standard TRIM map grid (Appendix 1) and projected in UTM coordinates. Only selected digital TRIM map layers were used, and in some cases modified, so that base map detail would not detract from the thematic SEI information. In particular, roads were shown in one line symbol only, water bodies were converted into polygons for colouring, contours were labeled, toponymy (place names) was simplified and repositioned to accommodate the SEI data and additional streams were added20. Subsequently, this modified SEI base map was translated into a read-only graphic image for distribution to SEI users (Appendix 1). Map Content and Design All of the thematic information on the maps, including the study area boundary and Regional District boundaries were correctly geo-referenced to the TRIM base map. However, municipal boundaries were available in a planimetric format only and although they were not spatially accurate relative to roads and drainage features, their shape and location was generally correct. Limited resources prevented spatially geo-referencing them to TRIM and it was decided to include them on the maps as a useful reference, regardless of the obvious distortion. Polygon colours on the maps identified the dominant or primary ecosystem. As discussed in Section 2.3.2, secondary ecosystem components occurred in complexed polygons and were equally important to the understanding of the ecology of specific polygons. Complexed polygons were indicated by a diagonal dashed line symbol superimposed on the coloured polygon (Figure 8 and colour plate at end of report).
20 Courtesy of Habitat and Enhancement Branch, Department of Fisheries and Oceans, Vancouver
N0348
N0508N0509
N0346
N0504
N0499
N0506
N0500
N0508A
N0349
N0510
N0502
N0351C
N0510A
N0351A
N0348A
N0351B
N0511 N0348B
N0349A
N0507
N0503
N0508B
0.5 0 0.5 1 Kilometers
N
Pure unit - ecosystem covers 100% of polygon
Complexed unit - two ecosystems occur in polygon (diagonal lines appear as dashed lines on hardcopy mapy)
Enos Lake
Nanoose Bay From map sheet 92F.030
Nanoose Hill
Figure 6: Illustration of ‘pure’ and ‘complexed’ map symbols

Methodology and Limitations
Sensitive Ecosystems Inventory: East Vancouver Island and Gulf Islands 20
Each of the 66 full colour 1:20,000 map sheets includes:
Text - describing the project rationale, the ecological significance of the broad ecosystem types mapped, a brief account of the methodology and data limitations, and a list of participating agencies.
Legend - describing the ecosystem types mapped. List of air photos - providing dates and scales of air photos used for interpretation of
SEI sites on that map (photo centres are also plotted and labeled on each map). These are important indicators as to the reliability of the mapped information, especially for sites that were not visited.
Table - listing all sites on that map sheet by polygon ID number, classifying both
primary and secondary ecosystem components and indicating the level of field verification of the data for each site (Figure 7).
Ecosystem Classification for Sites on this Map Sheet *Site visited, classification verified, additional information available
+Site visited, classification verified only Site No. Primary Ecosystem Secondary
Ecosystem Site No. Primary
Ecosystem Secondary Ecosystem
* N0346 WN:ms:sw:sp * N0502 WN:sw:ms + N0348 SG:mx HT:ro N0503 WN:sp N0348B WD HT:ro * N0504 WN:sw N0348C WD HT:ro N0506 WD HT:ro * N0349 WN:sw:ms:sp N0507 WD HT:ro N0349A WN:ms:sw * N0508 WD HT:ro N0351A HT SG:mx * N0508A WD HT:ro N0351B HT SG:mx N0508B WD HT:ro N0351C HT SG:mx * N0510 WN:sw N0499 HT:ro WD * N0510A WN:sw:ms N0500 HT:ro WD
Figure 7: Sample of attribute table shown on paper maps For users of the SEI digital product, the above information is available in the attribute file linked to the polygons. For a sample portion of an SEI map sheet, see colour plate at end of report.
2.6 Limitations The SEI information is intended to be used as a flagging tool to alert land-use decision makers to the existence of an important ecological feature. If any land use changes are contemplated, it is imperative that an on-site assessment be carried out by a qualified professional to determine whether or not the proposed change will have a detrimental effect on the ecosystem. The accuracy of the boundaries of the mapped SEI data is limited by the scale of the air photos on which the sites are delineated. Enlargement of the data beyond the source scale (i.e. the scale of the photos on which the polygon is delineated) may result in unacceptable distortion and faulty registration with other data sets. Polygons on the map may have changed since the date of air photography and/or field work. For sites not field checked, there may be occasional differences in polygon boundaries or

Methodology and Limitations
Sensitive Ecosystems Inventory: East Vancouver Island and Gulf Islands 21
classifications between the information depicted on the map and the actual conditions on site. The most likely discrepancies are to be in different subclasses assigned, particularly with wetlands. Some wetland categories are difficult to distinguish on air photos and so it is possible that, for example, an unvisited polygon marked as a marsh/open water complex might actually be a fen/open water complex. Swamps (WN:sp) may be over represented due to the fact that this sub-class was assigned to polygons during the air photo interpretation phase when a wetland classification was uncertain. A field inspection is the only way to confirm these classifications. Wetland boundaries, on the other hand, are more easily distinguishable on air photos and are unlikely to vary much upon field inspection. Any boundary variations are likely to be minor. The map sheet should be consulted to determine the date of the aerial photo from which the photo interpretation was done. If field checked, then the information will have been updated to reflect conditions on site at the time of the site assessment. The vegetation data and assessment of condition provide some information on this, although the situation can change fairly rapidly in some cases, and site conditions may have changed since field work was done. In addition to the rare and fragile ecosystems mapped during this project, other landscape features may also have ecological values that should be considered whenever land use decisions are being made.
2.6.1 Revisions and updates Because the landscape is constantly changing, and some of the polygons mapped during this project have since been altered, or even lost entirely to development, a form designed to record any changes has been created21 (Appendix 5). These forms will document recent or pertinent knowledge about a particular polygon. Users are encouraged to forward completed change forms to the CDC for updating the database.
2.7 Obtaining Further Information If a site has been field checked (this information is provided in table on each map sheet - see Figure 6 above), field data may be obtained from the CDC (Appendix 6). Information collected in the field included both ecological and vegetation data (see Section 2.4.3, and Appendix 8 for sample field forms). Even if no field visit was made during the original field sampling period of this project, there may be some recent or updated information pertinent to the site. Although the database may not have been amended, the information may be known to the CDC.
21 CDC will track revisions to the SEI data.

Methodology and Limitations
Sensitive Ecosystems Inventory: East Vancouver Island and Gulf Islands 22

Ecosystem Descriptions
Sensitive Ecosystems Inventory: East Vancouver Island and Gulf Islands 23
Section 3 Ecosystem Descriptions A brief description of each ecosystem type is provided in this section, together with a summary of its ecological importance. This is followed by a summary of site and soil factors, and plant22 and animal communities. Photographs showing examples of each ecosystem type are included at the end of this section.
3.1 Significance and Interdependence of Ecosystem Types at the Landscape Level Although the mapped SEI polygons generally represent an individual ecosystem type, their value often lies at least partly in their spatial pattern upon the landscape, and in how they abut and interact with other or nearby ecosystems and land use. Where ecosystems are complexed within a polygon, for example, a forest or woodland is mixed with a wetland type, or different kinds of wetlands occur together, then the values of the individual ecosystem components, especially for wildlife habitat, are often greatly enhanced. Similarly, the same situation may also occur where polygons of single ecosystem types are mapped adjacent to one another. Thus, for example, wetlands clustered within an area often have higher waterfowl values than single isolated wetlands with similar characteristics, as the increased number provides greater feeding opportunities and alternate habitats. Significantly, the adjacency of upland, mature and older forested habitats with open wetlands of all kinds is an especially valuable feature of the landscape. For example, many of the bird species that feed mainly in wetlands will perch, nest or roost in adjacent forests. Others, such as a number of amphibians, may spend most of the year in the forest habitats, but reproduce in the wetlands. Consequently, many of the ecosystems are interdependent and cannot be looked at in isolation, but must be considered within the context of the overall landscape.
22 Common plant names are used in this report; see Appendix 4 for a list of corresponding scientific names.

Sensitive Ecosystems: Coastal Bluff (CB)
Sensitive Ecosystems Inventory: East Vancouver Island and Gulf Islands 24
3.2 Coastal Bluff (CB)
Vegetated rocky islets and shorelines (CB) Vegetated coastal cliffs and bluffs (CB: cl)
Two categories of the Coastal Bluff ecosystem are identified: vegetated rocky islets and shorelines (CB) (Photo 1) and vegetated coastal cliffs and bluffs (CB:cl). Vegetation consists of grasses and/or mosses and lichens which cover between 20% to 95% of a site and are interspersed with exposed bedrock. Distinct plant communities are formed by species adapted to harsh environmental conditions such as crashing waves, currents, tides, winds, heat, storms and salt spray. Coastal bluff ecosystems begin at the water’s edge and for this project include only lands above the mean ordinary high tide mark. These ecosystems are noted for their general lack of soils. Outwash deposits left in rock crevices and depressions sheltered from prevailing winds give rise to dry nutrient-poor soils that support plant growth. Due to the surrounding harsh environment it takes many years for organic matter to accumulate and distinct soil horizons to develop. Soils are usually sand to sandy-loams, often with high salinity (conductivity). Steep slopes limit the accumulation of soil organic matter to bedrock fissures on cliffs and bluffs (CB:cl). Where the land mass is large enough, and environmental conditions are more conducive for upland vegetation to occur inshore of the coastal bluffs, CB ecosystems may be interspersed with, and share many common species with, other SEI polygons such as terrestrial herbaceous, woodland, older forest and sparsely vegetated ecosystems. Coastal Bluff ecosystems are sensitive for the following reasons: • Rarity: CB ecosystems in a relatively natural condition are rare in the study area. • Fragility: Whereas rocky islets, shorelines and cliffs are generally robust and stable, the
species that inhabit them are less so. The lack of continuous soil coverage makes the few micro-sites where soil has developed very important. Thin soils are easily disturbed and plants can easily be dislodged onto bare rock where they cannot re-establish.
• Vulnerability: Nesting seabirds choose certain coastal bluffs and rocky islets because of
their isolation from predators and disturbance. Many tend to nest directly on the ground and human intrusion can result in damage to eggs and nests, or nest abandonment.
• High biodiversity: The juxtaposition of this ecosystem with the inter-tidal zone increases
species richness. Some species represent populations surviving at their most northern or western range limits and others are functioning at their ecological optimum.
• Specialized habitats: There are a number of species unique to these habitats; some,
including several rare species, are only known to occur in these ecosystems.

Sensitive Ecosystems: Coastal Bluff (CB)
Sensitive Ecosystems Inventory: East Vancouver Island and Gulf Islands 25
Coastal Bluff
Site Factors Coastal bluffs begin at the water’s edge, and for the purposes of this inventory include only lands above the mean ordinary high tide mark. Dry, open sites may be buffeted by high winds and ocean spray. Exposure to salt spray enhances physiological dryness. Slopes of CB:cl are at least 30% and frequently reach vertical and overhanging positions. Aspects are variable and often steep, soils are shallow veneers from thin layers of glacial till or slope wash from adjacent rock knobs interspersed with plentiful rock exposures. Soils are generally extremely poor in supplying moisture and nutrients to plant roots. Some rare plants are associated with small vernal pools or moist microsites within the bluffs and are usually too small to map. Often in combination with other dry ecosystems including Garry oak woodlands and Douglas-fir–arbutus stands (WD polygons).
Plants Trees & shrubs: Trees, if present, are sparse, may be stunted or windblown. Species include arbutus, Garry oak, Douglas-fir, and occasionally Rocky Mountain juniper. Shrub cover is limited but may include tall Oregon-grape, Saskatoon, oceanspray, and snowberry. Herbs: Consist largely of grasses, mosses, and lichens with a few herb species, including stonecrops, small-flowered alumroot, strawberries, nodding onion, death camas, sea blush, and gumweed. Harvest brodiaea and Menzies’ larkspur occur less often. Grasses include Alaska brome and the native subspecies of red fescue. Mosses & lichens: Many are diverse and typically include roadside rock moss, hairy screw moss, and, on exposed rock, awned haircap moss. Wallace’s selaginella can be common. Community types: Specific community types that can occur include Idaho fescue–Junegrass, and Long-stoloned sedge – Roadside rock moss. Rare species: Species found on coastal rock outcrop sites (but not found on inland rock outcrop sites) include several rarities, such as bear’s foot sanicle, erect pigmyweed and the endemic Macoun’s meadowfoam. Introduced species: Grasses such as early hairgrass, soft brome, sweet vernalgrass, and hedgehog dogtail, as well as the shrub Scotch broom often dominate. Many other introductions also occur.
Animals Amphibians & reptiles: Alligator Lizards are known to occur. Garter snakes and the red-listed Sharp-tailed Snake may be present. Birds: The steeper bluffs and cliffs, because of their inaccessibility to predators, can provide valuable nesting habitat for seabirds and may support nesting by raptors including the Turkey Vulture. Various birds feed on seeds and invertebrates on bluffs. Song Sparrow, Savannah Sparrow, Fox Sparrow and White-crowned Sparrow are common. Trees around the periphery of bluffs get high use by many bird species including Pacific-slope Flycatcher, Yellow-rumped, Townsend’s and Orange-crowned Warblers, and Hutton’s Vireo. Scattered trees within and adjacent to these bluffs also get high use by Bald Eagle, Great Blue Heron and Belted Kingfisher. Glaucous-winged Gulls, Pelagic Cormorants, Double-crested cormorants, Northwestern Crows and Common Ravens commonly use bluffs. Mammals: Deer often use warm, south-facing sites in winter and early spring, and cougar will hunt at these times. Many of the lower bluffs near the ocean receive considerable use by river otters, some use by mink, and also by raccoons when larger trees are available nearby. Some sites are also used as haul outs by marine mammals. Invertebrates: The Sara Orange Tip butterfly uses bluffs in spring, and Barry’s Hairstreak, endangered in Canada, uses Rocky Mountain juniper as its larval food plant. Moss’ Elfin larvae feed on stonecrops on some bluffs.

Sensitive Ecosystems: Coastal Bluff (CB)
Sensitive Ecosystems Inventory: East Vancouver Island and Gulf Islands 26
Vegetated coastal bluffs in the SEI study area include the Ballenas/Winchelsea Archipelago (Figure 8), North and South Trial Islands, Yellow Point near Ladysmith, Wallace Point on North Pender Island, and extensive shorelines on most of the other Gulf Islands. Familiar locations of the vegetated cliff class include Lyall Harbour on Saturna Island, Komas Bluffs on Denman Island, Gordon Head in Victoria, Newcastle Island near Nanaimo, and Chrome Island off the southern tip of Denman Island.
<Empty Picture>
0.5 0 0.5 Kilometers N
Coastal Bluff ecosystemOther sensitive ecosystem
Nanoose Peninsula
Nanoose Harbour
S r a i t o f G e o r g i a Winchelsea Islands
Wallis Point
Southey Island
Ada Islands
SchoonerCove
MaudeIsland
RuthIsland
Figure 8: Coastal Bluff polygons in the Ballenas/Winchelsea Archipelago

Sensitive Ecosystems: Sparsely Vegetated (SV)
Sensitive Ecosystems Inventory: East Vancouver Island and Gulf Islands 27
3.3 Sparsely Vegetated (SV)
Coastal sand dunes [SV:sd] Coastal gravel and sand spits [SV:sp]
Inland cliffs and bluffs [SV:cl]
Sparsely Vegetated ecosystems encompass three unique landforms that provide specialized wildlife habitats, and support newly-developing plant communities: inland cliffs and bluffs (SV:cl); sand dunes (SV:sd); and gravel and sand spits (SV:sp) (Photo 2). Vegetation is minimal, covering 5% to 20% of the polygon, the rest is bare sand, gravel or bedrock. Distinct plant communities develop slowly here, reflecting the harsh environmental conditions such as crashing waves, salt spray, shifting sands, exposure to winds and sun and in the case of inland cliffs, low moisture and nutrient conditions. Species diversity on spits and dunes is low in comparison to other ecosystems in the SEI study area with only a narrow range of plant and animal species having adapted to the harsh environment. Spits and dunes are typically formed through the accretion of sands and gravels. Steep cliffs and bluffs limit the accumulation of soil organic matter to bedrock fissures. Cliff and bluff units may be interspersed with, and share common species with, other ecosystems types (e.g. terrestrial herbaceous, woodland, older forest, and older second growth). Sparsely vegetated ecosystems are designated as sensitive for the following reasons: • Fragility: These ecosystems are typically highly unstable, evolving and eventually
stabilizing through the interaction of natural processes over thousands of years. Since they rarely have an organic layer to protect the surface from erosion and disturbance, the plant root systems can easily be disturbed or destroyed, thus causing a dune to “blow out” or a spit to be breached.
• Rarity: They are rare both within the SEI study area and in other areas of coastal B.C. • Specialized habitats and rare species: There are a number of species unique to these
habitats within the SEI study area, and the province in general.

Sensitive Ecosystems: Sparsely Vegetated (SV)
Sensitive Ecosystems Inventory: East Vancouver Island and Gulf Islands 28
Sparsely Vegetated Site Factors
Dunes and spits are dry and open sites that are gently sloping, and are generally within a few metres of the sea. Vegetation is restricted by typically saline conditions and rapid drainage combined with unstable soils precluding the root support needed by most trees and shrubs. On spits and dunes, only a few hardy, salt-tolerant plant species can withstand the combination of salt water, wind, shifting sands and gravels, and occasional surf. These sites consequently support distinct and characteristic communities. Cliffs and bluffs are also typically dry and open and often occur in combination with other dry ecosystems including woodlands and dry coniferous forests. Aspect and slope are variable, although sites are generally steep with rapid drainage and limited soil accumulation, and bedrock exposure is often extensive. More soil may accumulate on ledges.
Plants Dunes and spits
Trees & shrubs: Largely absent on dunes, except where invaded by Scotch broom; gravel spits often support nootka rose, small Douglas-fir, Pacific Crabapple and Douglas Hawthorn. Herbs: Herbs include silver burweed, entire-leaved gumweed, thrift, sea plantain, and American searocket. Robust grasses and sedges include seashore bluegrass, little beach bluegrass, dunegrass, and large-headed sedge. Mosses & lichens: Mosses are sparse but hoary rock moss and roadside rock moss may occur. Community types: Burweed–Searocket and Dunegrass–Beach pea. Rare species: Contorted-pod in sandy areas; seaside rein orchid and deltoid balsamroot on spits.
Cliffs and bluffs Cliff and bluff vegetation is variable and may be similar to that on coastal bluffs (CB) Trees & shrubs: Shallow-rooted, often stunted trees include Garry oak, arbutus and Douglas-fir. Patches of kinnikinnick may be present, and scattered baldhip rose and hairy manzanita shrubs can also occur. Herbs: Stonecrop, small-flowered alumroot, and nodding onion, plus introduced grasses are typical. Mosses & lichens: Mosses include hoary rock moss, broom moss, and juniper haircap moss. Lichens are common. Rare species: Tracy’s romanzoffia.
Animals General: Bluff and cliff polygons will have generally similar values to coastal bluffs; although, away from the ocean, the more inland bluffs receive less use by those species associated with the coast such as otters, raccoons, gulls, and eagles. Amphibians & Reptiles: Cliffs and bluffs have some potential for the rare Sharp-tailed Snake, and Alligator lizards may occur. Garter snakes are fairly common on spits. Birds: Sand spits and sand dunes have resting/roosting values for a variety of shorebirds and waterfowl such as the Brant. Cliffs and bluffs have potential for nesting by blue-listed Turkey Vultures and Peregrine Falcons. Mammals: Cliffs and bluffs – Bats use crevices in the rocks for roosting and hunt for insects over these open sites. High deer values are likely in winter and spring, and in certain localities, these polygons may have important values for Roosevelt Elk. Invertebrates: Butterflies are usually common and diverse along cliffs and bluffs, and a number of relatively rare butterfly species may occur.

Sensitive Ecosystems: Sparsely Vegetated (SV)
Sensitive Ecosystems Inventory: East Vancouver Island and Gulf Islands 29
Examples of this ecosystem in the study area include: classic sand spits with their narrow triangular shaped points at Sidney Spit (Figure 9), Shingle Spit on Hornby Island, Cordova Spit and the James Island spits; sand and gravel bars that form barrier spits parallel to the shoreline at Whiffen Spit (Sooke) (Figure 10), Albert Head Lagoon spit, Witty’s Lagoon (Metchosin), Pipers Lagoon (Nanaimo) and the spit at the mouth of the Little Qualicum River; dunes at Island View Beach and Cordova Spit on the Saanich Peninsula; and the extensive cliff systems occurring inland along the Cowichan River, and in the vicinity of Mount Benson in the Nanaimo Sub-unit.
<Empty Picture>
James Island
SidneyIsland
Cordova Spit
0.5 0 0.5 KilometersN
Sparsely Vegetated ecosystemSV:sp = spit; SV:sd = dune; SV:cl = cliff
Other sensitive ecosystem
SidneySpit
SidneyIsland
James Island
SV:cl
SV:sp
SV:sd
SV:sp
SV:sp
Sidney
CentralSaanich
Figure 9: Sparsely Vegetated spit, dune and cliff
polygons on Sidney and James Islands
N
Sparsely Vegetated - barrier spit Other sensitive ecosystem
0.5 0 0.5 Kilometers
Albert Head
Albert Head Lagoon
Witty's Lagoon
Metchosin
J u a n d e F u c a S t r a i t
Figure 10: Sparsely Vegetated barrier spits in the
Capital Sub-unit

Sensitive Ecosystems: Terrestrial Herbaceous (HT)
Sensitive Ecosystems Inventory: East Vancouver Island and Gulf Islands 30
3.4 Terrestrial Herbaceous (HT)
Natural grasslands and moss-dominated ecosystems (HT): rock outcrops are a dominant feature (HT:ro)
shrub cover is more than 20% (HT:sh)
Three categories of Terrestrial herbaceous ecosystem are recognized for this project: sites with continuous vegetation cover (HT); sites with rock outcrops as a dominant feature (HT:ro) (Photo 3); and sites with more than 20% shrub cover (HT:sh). They occur as open wildflower meadows and grassy hilltops and in most cases are interspersed with bare rock outcrops. They develop where thin, rapidly draining soils and difficult environmental conditions restrict the establishment of trees and shrubs. Nutrients are quickly leached out during winter rains, and summer heat and light conditions can create drying conditions. Most frequently, this results in less than 10% tree cover and less than 20% shrub cover. HT ecosystems may have taken a hundred years or more to reach their current state and composition. There may be an overlap with species common to the Coastal Bluff (CB) ecosystem, although HT ecosystems are more extensive, complex and species rich. Where environmental conditions are more conducive for woodland and forest development, HT ecosystems may be interspersed with other SEI ecosystems such as woodland, older forest and older second growth forest. Terrestrial Herbaceous ecosystems are sensitive for the following reasons: • Rarity: Undisturbed sites are rare both within the SEI study area and in the rest of
coastal B.C. A variety of individual rare species also occur here. • Fragility: Whereas the bedrock beneath is generally stable, the species that inhabit
these ecosystems are less so. Micro-habitats and niches may encompass only a few square inches or feet. Thin soils are easily disturbed, and herbaceous plants can be easily trampled, or dislodged onto bare rock where they cannot re-establish.
• High biodiversity: The various combinations of environmental factors affecting these HT
sites have created a diversity of micro-habitats that meet the requirements of many different plants, animals and invertebrate species. These include hummocks, hollows and vernal pools.
• Specialized habitats: There are a number of species unique to these habitats within the
SEI study area. Some are rare, and are only known to occur in these ecosystems. Others represent populations surviving at their most northern or western range limits.

Sensitive Ecosystems: Terrestrial Herbaceous (HT)
Sensitive Ecosystems Inventory: East Vancouver Island and Gulf Islands 31
Terrestrial Herbaceous Site Factors
Terrestrial herbaceous ecosystems are found outside the salt spray zone near shorelines, all the way to the summits of local hills and mountains. They occur in very small patches, often in a mosaic of several types of herbaceous community and often within a larger forested site or landscape. Level to moderately sloped (<30%), typically thin soiled, most of these dry sites are exposed and open. Bedrock is exposed as rock outcrops. Pockets of deeper soils may support sparse trees.
Plants General attributes: Many of the plants are similar to those in woodlands, but these polygons are dominated by grasses and mosses. Trees and shrubs: Where they occur, trees are Douglas-fir, arbutus, Garry oak, and lodgepole pine; sparse shrub cover includes oceanspray, snowberry, salal, baldhip rose and tall Oregon-grape. Herbs: In some areas, wildflowers completely dominate the vegetation in spring and include nodding onion, harvest brodiaea, and common camas, blue-eyed grass, shooting-star, fawn lily, sea blush, and saxifrage. Native grasses, if present, may include California oatgrass, Junegrass, western fescue, blue wildrye, and Columbia brome. Sedges include short-stemmed sedge and long-stoloned sedge. Mosses and lichens: Roadside rock moss is typical. In shady and moister microsites, mosses include electrified cat’s tail moss, step moss, and Oregon beaked moss. Community types: Includes some rare types such as the Idaho fescue–Junegrass, long-stoloned sedge-rock moss and California oatgrass–Idaho fescue communities. Rare plants: A variety of rare plants can occur such as seaside rein orchid, slimleaf onion, Lemmon’s needlegrass, prickly pear cactus, and farewell to spring. Introduced species: Sweet vernalgrass, hedgehog dogtail and other introduced grasses are common, and Scotch broom threatens many sites.
Animals Amphibians & Reptiles: Garter snakes are likely to be relatively common and the red-listed Sharp-tailed Snake is a slight possibility. Birds: Trees around the perimeter can be expected to receive high bird use. Vesper Sparrow and Streaked Horned Lark, now vanished from the study area, are grassland species that used these sites, and a variety of other more common sparrows, such as Lincoln’s, Savannah and Song, still do so. Mammals: Voles, mice, shrews and cottontail rabbits are likely to be common, and they attract a variety of predators including a number of raptors. Black-tailed Deer can be expected to make high use of these sites in spring and summer. Invertebrates: Invertebrate production appears to be very high, and a wide variety of aerial insectivores – swallows, flycatchers, bats, and others – are likely to hunt insects over these openings. These sites also have very high values for butterflies including the Zerene Fritillary and the Anise Swallowtail.

Sensitive Ecosystems: Terrestrial Herbaceous (HT)
Sensitive Ecosystems Inventory: East Vancouver Island and Gulf Islands 32
Terrestrial herbaceous ecosystems in the study area occur at Helliwell Park on Hornby Island, Sandy Island off the northern tip of Denman Island and Beacon Hill Park in Victoria. Rocky terrestrial herbaceous (HT:ro) sites are most common, and include large patches on: Mt. Tolmie, Mt. Work, and Mt. Finlayson in the Capital Sub-unit; Siwash Ridges, Blackjack Ridge, and Mt. Benson in the Nanaimo Sub-unit; Menzies Bay area (Figure 11), Lost Lake, and Campbell Lake in Comox Sub-unit; Burgoyne Bay on Saltspring Island, and Jervis Island off Lasqueti Island in the Islands Sub-unit; and Sheepshank Hill and Mount Jeffrey in the Cowichan Sub-unit.
N
Terrestrial Herbaceous ecosystem mostly complexes of HT:ro and SG:co
Other sensitive ecosystem0.5 0 0.5 1 Kilometers
Brown Bay
M e n z i e s B a y Wilfred
Point
M e n z i e s C r e e k
S e y m o u r N
a r r o w s
Figure 11: Terrestrial Herbaceous ecosystem polygons in
the Menzies Bay area

Sensitive Ecosystems: Wetland (WN)
Sensitive Ecosystems Inventory: East Vancouver Island and Gulf Islands 33
3.5 Wetland (WN)
Wet soils and moisture-dependent plants: Bog (WN:bg); Fen (WN:fn); Marsh (WN:ms); Swamp (WN:sp);
Shallow water (WN:sw); Wet meadow (WN:wm)
Wetland ecosystems are among the most productive environments in the world. Six classes of wetland are recognized for this project: Bog (WN:bg), Fen (WN:fn), Marsh (WN:ms), Shallow Water (WN:sw), Swamp (WN:sp), and Wet Meadow (WN:wm). They occur where the water table is at, or near, or above the soil surface and soils are saturated for sufficient length of time that excess water and resulting low soil oxygen levels are principal determinants of vegetation and soils development (Mckenzie and Banner 1998). Photos 4, 5, and 6 show examples of marsh, shallow water and swamp wetlands. Wetlands often occur as mosaics of several wetland classes (for example, WN:ms:sp:sw) or are transitional between two classes. (For example, common transitions occur between bogs and fens, as well as between fens and swamps.) This reflects the variation of the wetland environment, particularly seasonal water depth as well as successional processes. The concentric pattern of species distribution around some wetlands is an example of this process. Wetland ecosystems are sensitive for the following reasons: • Highly threatened: They are among the most threatened habitats in the world, mainly
due to drainage, land reclamation, pollution and overuse by competing land interests. • Rarity: Wetlands are naturally uncommon in this area because of the rain-shadow
climate with its low annual precipitation and pronounced summer dry period. • High biodiversity: Wetlands support a high number of habitat niches which provide
critical habitats for numerous mammal, bird, reptile, amphibian, fish and vertebrate species.
• Vulnerability to changes in hydrology and water quality: Wetlands respond to small
changes to hydrology such as reduced summer flow or lowering of the water table through drainage. Urban storm drainage, nutrient rich agricultural run-off, sediment from road building and other forestry activities and even limited changes in nitrogen or phosphorous levels can reduce the zone in which a specific wetland community can live.

Sensitive Ecosystems: Wetland (WN)
Sensitive Ecosystems Inventory: East Vancouver Island and Gulf Islands 34
Wetland
Site Factors Bog: Peat wetland with water table at or near the surface; stagnant water originating from precipitation.
Surfaces often raised or level with surroundings and are isolated from nutrient-rich groundwater. Bogs are thus very low in nutrients and are generally acidic in nature; organic substrate.
Fen: Peat wetland with the water table at or a few centimetres above or below the surface. Primary water source is groundwater or runoff from adjacent mineral uplands resulting in mineral-rich environments. Water not stagnant, but moves through peat by seepage, or open channels; organic substrate.
Marsh: May be freshwater, estuarine or saline nutrient-rich wetlands, permanently, seasonally or diurnally inundated. Marshes that dry by late summer, or at low tide, expose matted plants and unvegetated mud or salt flats, but saturation persists near the surface. Mainly mineral substrate with an occasional, well-decomposed peat veneer (freshwater sites) derived primarily from marsh plants. The substrate is strongly influenced by water chemistry, which in turn reflects basin geology and regional climate.
Shallow Water: Permanent, shallow water areas less than 2 m in depth in mid-summer. Sparse rooted vegetation. This class of wetland includes what are often termed ponds and sloughs.
Swamp: Characterized by periodic flooding and nearly permanent sub surface water flow through mixtures of mineral and organic materials. Thin organic layers, when present, are generally well-decomposed wood, although sedge material may occur below. A deep, well-humidified humus layer may also be present. Nutrient content is variable and dependent on water minerals. Standing or gently flowing water through pools or channels is typical and results in greater aeration than in fens, so sufficient dissolved oxygen occurs to support either shrubs or trees.
Wet Meadow: Wet meadows are one of the rarer wetland types. These herbaceous wetlands are on mineral materials, generally gleysols, which are periodically saturated but rarely inundated. After seasonal saturation, the water table drops below the rooting zone leaving a nutrient-rich, well-aerated rooting medium.
Plants Bog: Trees & shrubs: Trees usually absent; may get scattered, small-stature lodgepole pine or western red
cedar. Ericaceous shrubs common, such as Labrador tea, western bog-laurel, and bog cranberry. Herbs: Bog gentian and other acid loving species. Mosses & lichens: Covered or filled with poorly to moderately decomposed sphagnum peat mosses. Ribbed bog moss may also be observed.
Fen: Shrubs: Non-ericaceous shrubs such as sweet gale and hardhack, especially around the perimeter. Herbs: Densely herbaceous with sedges such as Sitka sedge, water sedge, dulichium and inflated sedge; grasses such as reed canarygrass and creeping bentgrass, other grasslike species such as common rush and common spike-rush. Mosses & lichens: Well to poorly decomposed sedge and/or brown moss such as sickle moss.
Marsh (freshwater): Herbs: Extensive emergent herbaceous community typified by a wide variety of sedges, rushes, grasses and reeds. Sedges are numerous and include beaked sedge, Sitka sedge and slough sedge. Other plants include cattail, tapered rush, hard-stemmed bulrush, buckbean, creeping spike rush and small flowered forget-me-not. Mosses & lichens: Due to regular flooding, the moss layer is usually sparse. Rare species: Henderson’s checker-mallow.
Marsh (brackish and saline): Herbs: Dominated by American glasswort, seashore saltgrass, alkaligrass, seaside plantain, tufted hairgrass, arctic rush and Lyngby’s sedge. Rare community types: Tufted hairgrass-Henderson’s checker-mallow. Rare species: Fleshy jaumea, beach sand-spurry and slender arrowgrass. Introduced species: European glasswort.
Shallow Water: Aquatics: Submerged and floating plants. Common species include floating-leaved pondweed, yellow pond-lily, and watershield. Rare species: Water-pepper.
Swamp: Trees & shrubs: Wooded wetlands dominated by 25% or more cover of flood-tolerant trees or shrubs including western red cedar, Pacific crab apple, willows and hardhack, which may be dense. Herbs: Skunk cabbage, sedges and other flood tolerant species such as horsetail may be present.
Wet Meadow: Herbs: The mixture of flood-tolerant grasses, low sedges, rushes, and forbs provide a grassy overall appearance. Wet meadow vegetation includes tufted hairgrass, cow-parsnip, and tall mannagrass. Rare species: Northern adder’s tongue, Henderson’s checker-mallow, greensheathed sedge and Geyer’s onion.

Sensitive Ecosystems: Wetland (WN)
Sensitive Ecosystems Inventory: East Vancouver Island and Gulf Islands 35
Animals - Wetlands in general Amphibians & Reptiles: Wetlands provide important breeding sites for many amphibians including the red-legged frog, Pacific Treefrog, Long-toed Salamander and Rough-skinned Newt. Garter snakes also utilize these sites. Birds: Wetlands provide critical wintering and breeding habitats for many waterfowl including Trumpeter Swans, Ring-necked Ducks, Bufflehead, Hooded Merganser, Wood Duck and numerous others. They also provide productive feeding sites for insectivorous birds. The blue-listed Great Blue Heron feeds in many wetlands. The Green Heron and American Bittern breed in wetland associated sites. Many raptors perch and hunt over wetlands including hawks, falcons, Osprey and Bald Eagle. A wide variety of small passerines breed at the edge of wetland communities – typical species include the Marsh Wren, Common Yellowthroat, Yellow Warbler and Red-winged Blackbird. Mammals: Beaver, muskrats, mink, raccoon and river otter depend on these habitats which also provide highly productive feeding sites for bats. Invertebrates: Wetlands are also of high value for breeding for invertebrates including many dragonflies and damselflies.
Examples of wetlands in the study area include Somenos Marsh in Duncan, Englishman River Estuary in Parksville, Hamilton Marsh near Qualicum Beach (Figure 12), Campbell River Estuary (Figure 13), Dyke slough and Burns Marsh in Courtenay, the large bog in the middle of Glengarry Golf Course, Qualicum Beach, Rithet’s Bog in Saanich, fens near Little Oyster River and Hell Diver Swamp and wet meadows north of the mouth of the Oyster River, at Somenos Marsh and Woodhus Slough.
N
Wetland ecosystem
Other sensitive ecosystem0.5 0 0.5 Kilometers
Strait of Georgia
QualicumBeach
Glengarry Bog
HamiltonMarsh
WN:sp
WN:bg
WN:ms:fn:sw
WN:bg:spFrench Creek
Figure 12: Wetlands near Qualicum
Beach
N
Other sensitive ecosystem200 0 200 Meters
Wetland ecosystem - marsh
Tyee Spit
C a m p b e l l River
D i s c o v e r y P a s s a g e
Campbell River
Figure 13: Wetlands at the Campbell
River estuary

Sensitive Ecosystems: Riparian (RI)
Sensitive Ecosystems Inventory: East Vancouver Island and Gulf Islands 36
3.6 Riparian (RI)
All stages of floodplain vegetation (RI:1-7) Riparian gullies [RI:g]
A riparian ecosystem, as identified for this project, is a distinct ecological system and is not to be confused with the term riparian zone. A riparian zone describes a fixed width management area surrounding streams and wetlands, with no consideration of ecological boundaries. Riparian ecosystems vary in width, from less than one metre adjacent to a small stream with steep banks to more than 100 metres near large rivers, and are delineated by site-specific vegetation, soil, and elevation features. For the SEI, riparian ecosystems are classified according to seven structural stages23 and include riparian gullies (RI:g). They are often a complex of more than one stage because of their highly dynamic nature; the dominant stage is listed first (e.g., RI:4:5:6:g). Abbreviated descriptions of each structural stage are given below.
RI:1 Sparse/bryoid - moss and lichen dominated, <10% treed, <20% shrub/herb. RI:2 Herb – herb dominated, <20% shrub, <10% treed. RI:3 Shrub/herb – >20% shrub, <10% treed. RI:4 Pole/sapling – trees >10 m tall, densely stocked, 10 - 40 years old. RI:5 Young forest – self-thinning evident, 40 - 80 years old. RI:6 Mature Forest – 80 - 250 years old.
RI:7 Older forest - >250 years old. Riparian ecosystems are nutrient-rich environments with rapid tree growth and understories which are rich in species and sometimes impenetrably dense (Photo 7). They occur on floodplains next to lakes, streams and rivers, where higher soil moisture and light conditions support plant communities and soils distinct from surrounding terrestrial areas; these areas rarely have summer soil moisture deficits. They commonly vary in dominant plant species, vegetation age, and structure radiating out from the aquatic feature; this pattern of zonation is more pronounced along large rivers. Nearest the river channel, grasses, sedges, and some forbs colonize the highest part of exposed gravel or cobble bars; adjacent to this, young trees grow rapidly once seeds have lodged between rocks and are covered by gravel or silt; upslope of this, mixed forests thrive in the rich, moist soils and are tolerant of periodic winter flooding. Although gullies are sloped and not on floodplains, they receive moisture and nutrients from above and as such, are also particularly rich and productive sites. Gullies are not always associated with surface water flow; in many cases, seepage areas along the gully walls maintain moist soil conditions. Gullies are important since their typically steep sides often make them inaccessible, particularly to human disturbance. This permits growth of species that are susceptible to disturbance. Riparian ecosystems are highly dynamic. Chronic and episodic disturbances such as periodic flooding, wind throw, stream channel changes, slope failures and debris flows are common in riparian ecosystems, increasing structural forest features such as snags, downed 23 See Appendix 2 for full descriptions of these stages

Sensitive Ecosystems: Riparian (RI)
Sensitive Ecosystems Inventory: East Vancouver Island and Gulf Islands 37
logs, and a multi-layered, uneven aged canopy, as well as the range of successional stages from recently exposed gravel bars to western red cedar forest. This ecosystem type is often naturally linear. However, the complex history of forestry, agriculture, and urban development in this study area has increased the fragmentation and reduced the continuity of many riparian ecosystems. Riparian ecosystems are sensitive for the following reasons: • High biodiversity: Riparian areas support a disproportionately high number of species
for the area they occupy. They contain water, cover and food, the three critical habitat components for wildlife, and have a concentration of varied habitat niches that are important for wildlife species. They also have a greater diversity of plant composition and structure than uplands. The elongated shape of most riparian ecosystems maximizes the amount of edge habitat and creates diverse and productive habitats for many species. Riparian ecosystems also have different microclimates from surrounding coniferous forests due to increased humidity, a higher rate of transpiration, and greater air movement. These conditions are preferred by some species during hot weather.
• Aquatic Habitat Protection: Riparian ecosystems contribute to the ecological health of adjacent aquatic areas through shading, bank stability, and the addition of large logs into the stream or lake margin.
• Wildlife corridors: Riparian ecosystems
are often linear and may function as linkages or corridors within the broader landscape. In highly fragmented landscapes such as eastern Vancouver Island, wildlife species depend on a series of inter-connected habitat patches.
Examples of mature riparian ecosystems occur along the Qualicum River, Nanaimo River, Quinsam Lake and River system, Haslam Creek, Oyster River, Englishman River system (Figure 14), French Creek and Nile Creek
N
Riparian ecosystem
Other sensitive ecosystem1 0 1 Kilometers
Strait of Georgia
Parksville
SouthEnglishm
anR
Ce
nt r
eC
ree
k
En
gl ish
ma
n
M o r i s o n C r e e k
EnglishmanRiverEstuary
Ri v er
Figure 14: Riparian ecosystem polygons on the
tributaries and main stem of the Englishman River
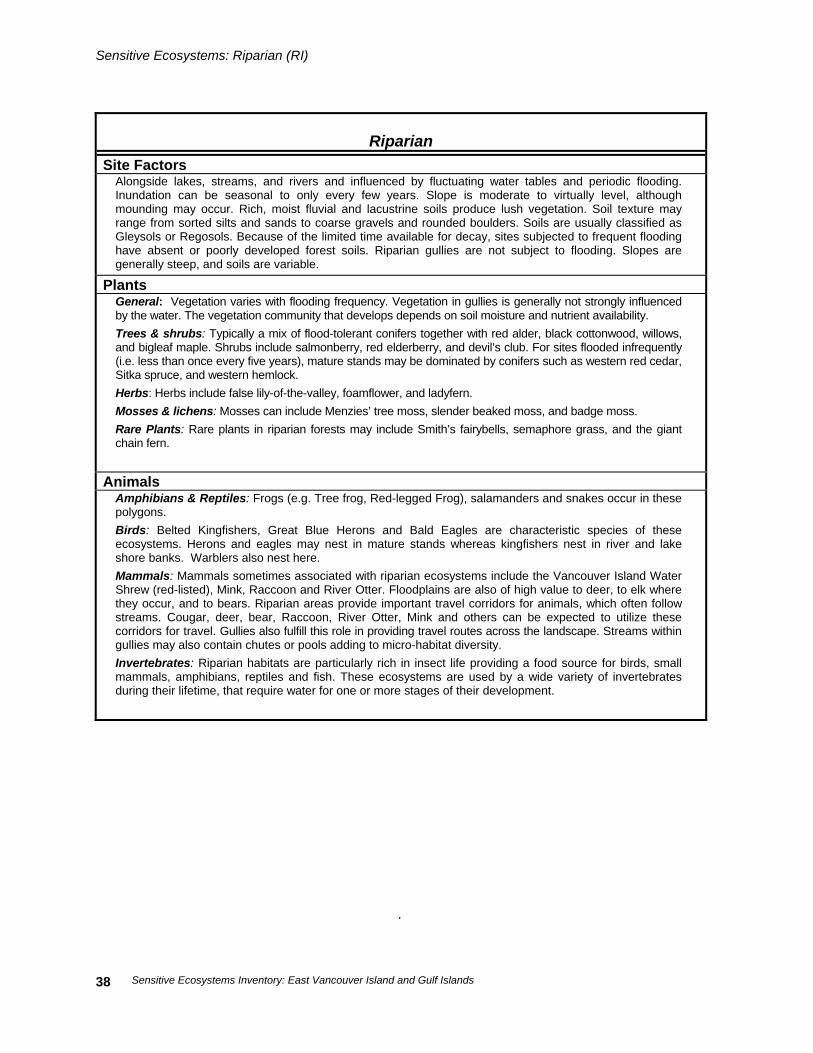
Sensitive Ecosystems: Riparian (RI)
Sensitive Ecosystems Inventory: East Vancouver Island and Gulf Islands 38
Riparian Site Factors
Alongside lakes, streams, and rivers and influenced by fluctuating water tables and periodic flooding. Inundation can be seasonal to only every few years. Slope is moderate to virtually level, although mounding may occur. Rich, moist fluvial and lacustrine soils produce lush vegetation. Soil texture may range from sorted silts and sands to coarse gravels and rounded boulders. Soils are usually classified as Gleysols or Regosols. Because of the limited time available for decay, sites subjected to frequent flooding have absent or poorly developed forest soils. Riparian gullies are not subject to flooding. Slopes are generally steep, and soils are variable.
Plants General: Vegetation varies with flooding frequency. Vegetation in gullies is generally not strongly influenced by the water. The vegetation community that develops depends on soil moisture and nutrient availability. Trees & shrubs: Typically a mix of flood-tolerant conifers together with red alder, black cottonwood, willows, and bigleaf maple. Shrubs include salmonberry, red elderberry, and devil’s club. For sites flooded infrequently (i.e. less than once every five years), mature stands may be dominated by conifers such as western red cedar, Sitka spruce, and western hemlock. Herbs: Herbs include false lily-of-the-valley, foamflower, and ladyfern. Mosses & lichens: Mosses can include Menzies’ tree moss, slender beaked moss, and badge moss. Rare Plants: Rare plants in riparian forests may include Smith’s fairybells, semaphore grass, and the giant chain fern.
Animals Amphibians & Reptiles: Frogs (e.g. Tree frog, Red-legged Frog), salamanders and snakes occur in these polygons. Birds: Belted Kingfishers, Great Blue Herons and Bald Eagles are characteristic species of these ecosystems. Herons and eagles may nest in mature stands whereas kingfishers nest in river and lake shore banks. Warblers also nest here. Mammals: Mammals sometimes associated with riparian ecosystems include the Vancouver Island Water Shrew (red-listed), Mink, Raccoon and River Otter. Floodplains are also of high value to deer, to elk where they occur, and to bears. Riparian areas provide important travel corridors for animals, which often follow streams. Cougar, deer, bear, Raccoon, River Otter, Mink and others can be expected to utilize these corridors for travel. Gullies also fulfill this role in providing travel routes across the landscape. Streams within gullies may also contain chutes or pools adding to micro-habitat diversity. Invertebrates: Riparian habitats are particularly rich in insect life providing a food source for birds, small mammals, amphibians, reptiles and fish. These ecosystems are used by a wide variety of invertebrates during their lifetime, that require water for one or more stages of their development.
.

Sensitive Ecosystems: Woodland (WD)
Sensitive Ecosystems Inventory: East Vancouver Island and Gulf Islands 39
3.7 Woodland (WD)
Open broad-leaved forests with canopy covering less than 50% (WD) Pure stands of Garry oak or Trembling aspen
Mixed stands of Douglas fir-Garry oak and Douglas fir-arbutus24 In a region where coniferous forest often extends from the ocean to the mountain tops, open woodlands are distinct in ecology, history and biological diversity. The open stand structure, soil conditions, and disturbance regime creates an environment which allows a rich mosaic of wildflowers, grasses and shrubs to thrive. Part of the value of woodlands is due to the diversity of shrub, herb and moss species in the understorey. Woodlands often occur on rocky knolls, south facing slopes, and ridges where summer soil moisture is low and shallow soils are common (Photo 8). Many occur in bedrock-dominated areas where fissures and folds in the rock collect seepage flow. Trembling aspen woodlands are an exception, and are typically associated with moist, rich sites. Historically, frequent lightning-induced wildfires, aboriginal burning, and elk and deer grazing prevented coniferous forests from crowding out the oak woodlands. Fires thinned out competing coniferous species, recycled nutrients into the soil, released and scarified seeds, and maintained the open woodland canopy for sunlight to enter. All of these processes are critical to maintaining woodland health and the natural cycles in the ecosystem. Woodlands occurred as inter-connected patches across the landscape. However, they have declined dramatically over the last 50 years and the remnants now occur in widely scattered fragments throughout the southern half of the study area. Hebda (1993) speculates that only 1-5% of the original Garry oak habitat remains. These ecosystems occur often in combination with other ecosystems: remnant patches of older Douglas-fir forest (OF), older second growth forest (SG), open meadows (HT) or rock outcrops (HT:ro). Woodlands are sensitive for the following reasons: • Rarity: The Garry oak woodland is amongst the rarest ecosystems in Canada; only
remnants survive. Much has been converted to agricultural use, evidenced by large solitary oaks that were left as shade for livestock. Several rare plant associations also occur. These are the most northern deciduous woodlands on the North American Pacific Coast, which contributes to their importance to biological diversity. Peripheral populations such as Garry oak are often genetically significant, and adapted to conditions at the fringe for that species. These populations may also be more vulnerable to climate change or other large-scale disturbances.
• High biodiversity: Oak woodlands support the highest plant species diversity of any
terrestrial ecosystem in coastal B.C. Woodlands in general support a rich assemblage of plants, insects, reptiles and birds that are drawn to the habitat diversity and food sources. This high biological diversity is closely linked to elements of stand structure including the open canopy, mixed age classes, snags, seasonal leaf fall, organically enriched upper
24 Pure arbutus second growth forests from logging and fire succession not included.

Sensitive Ecosystems: Woodland (WD)
Sensitive Ecosystems Inventory: East Vancouver Island and Gulf Islands 40
soil layers and also to the proximity and inter-mixing of Woodlands with other ecosystems. Even the bark of Garry oak and arbutus provides habitat for insects, spiders, mosses and lichens.
• Specialized habitats: Many species rely on specialized habitats such as vernal pools,
snags, rotten limbs, downed logs or rock outcrops that are associated with woodland ecosystems.
Examples of woodland ecosystems include Mt. Tzuhelam in the Cowichan Sub-unit, Mt. Maxwell on Saltspring Island (Figure 15), and Christmas Hill, Observatory Hill and Summit Park in Victoria.
N
Woodland ecosystem
Other sensitive ecosystem1 0 1 Kilometers
Mount Maxwell
Sansum N
arrows
Maxwell Point
SaltspringIsland
Figure 15: Woodland polygons on Saltspring Island

Sensitive Ecosystems: Woodland (WD)
Sensitive Ecosystems Inventory: East Vancouver Island and Gulf Islands 41
Woodland
Site Factors Often occur on some of the driest sites that can support trees. Garry oak woodlands are commonly in areas that comprise a mosaic of rock outcrops and shallow soils. Deep soil parkland supporting Garry oak ecosystems is an exception as most of these areas have been converted to agricultural use. On deep soils, the woodlands may be mixed with herbaceous meadows. Aspen stands in contrast typically occur on moist sites. They are often very small – most are too small to map at the project scale.
Plants General: Well adapted to a frequent fire regime, Garry oak meadow areas were actively burned by aboriginal peoples to promote camas crops and hunting opportunities. This may have perpetuated the oaks in some areas that would otherwise have succeeded to Douglas-fir dominant forests. Trees & shrubs: Typically Garry oak with or without arbutus; Douglas-fir trees occasional. Shrubs often include snowberry, oceanspray, and baldhip rose. Hairy honeysuckle is common. Aspen stands are dominated by trembling aspen and may have fairly dense hardhack shrubs or herbaceous understories. Herbs: These sites support colorful spring displays of wildflowers. Herbs may include common and great camas, death camas, broad-leaved or few-flowered shooting star, Easter lily, chocolate lily, spring-gold, and satin-flower. Brittle prickly pear cactus occurs on some sites. Rarities include, white-top aster, and Nuttall’s quillwort. Prairie violet can occur on deep soil sites. Mosses & lichens: Mosses include electrified cat’s tail moss and Oregon beaked moss. Communities: Ecosystems known to occur in this category include: Garry oak–brome; Garry oak–arbutus; Garry oak–oceanspray; Garry oak–snowberry, and Douglas-fir–Garry oak–oniongrass.
Animals General: As these polygons are often very small, wildlife values are strongly influenced by adjacent communities. Many of the animal species discussed elsewhere will utilize these woodland habitats at times, although they also use other ecosystems. There are a number of species that have been specifically linked to this ecosystem type, and many of these have vanished from the general study area or are in decline. Amphibians & Reptiles: Alligator Lizards occur in these woodland sites, and the red-listed Sharp-tailed Snake could occur. Garter snakes are relatively common. Birds: Species of concern in this category include Lewis’ Woodpecker and Western Bluebird. The latter two have essentially disappeared from this part of their former ranges. The Western Wood Pewee is also of some concern. Mammals: Deer utilize these sites for herbaceous plants in spring and early summer and for solar insulation in winter and spring. Deer in turn attract Cougar; although this species is now rarely seen in the more urbanized areas where most of the remnant woodlands occur. Rabbits and Deer Mice use these types and attract predators including raptors. Raccoons and squirrels also favour woodland sites. Invertebrates: Invertebrate production in woodlands appears to be very high attracting many aerial insectivores including Pacific Slope Flycatcher, Western Wood Pewee, Hutton’s Vireo, warblers, swallows, and probably a number of bat species. Some butterflies associated with these sites are the Large Marble White believed extirpated, the Chalcedon Checkerspot, which has been extirpated, Edith’s Checkerspot and Moss’ Elfin. The Propertius Dusky Wing butterfly is entirely dependent on Garry oak as the larval food, and Brown Elfins use arbutus as the larval food plant.

Sensitive Ecosystems: Older Forest (OF)
Sensitive Ecosystems Inventory: East Vancouver Island and Gulf Islands 42
3.8 Older Forest (OF)
Conifer-dominated stands older than 100 years Coniferous forests (OF:co),
Coniferous stands with a deciduous component of >15% (OF:mx) Older forest is not necessarily old-growth forest. Whereas definitions of ‘old-growth’ vary by jurisdiction, it is often related to the lack of large scale human disturbance and a specific size or age of trees. Most remaining older forests in the SEI study area have been influenced by some form of harvesting. The minimum age of 100 years for this ecosystem type was selected because many of the features associated with high biodiversity values in older forests begin to develop after 80 years. Two categories are identified for this project: coniferous stands (OF:co) and coniferous stands composed of more than 15% deciduous trees (OF:mx). See Photo 9 for an example of an older forest. Two distinct forest types25 occur in the study area. Forests with Douglas-fir as the dominant tree species have developed on the warmer, drier sites at lower elevations (<150m) of the southern portion of the study area; the low soil moisture of these forests favour an open stand structure and low growth of woody shrubs and herbs and grasses in the understorey. More northward and at higher elevations, western hemlock predominates due to a cooler and wetter climate the floor of this forest type develops a dense litter and moss layer which builds up over time due to the cool, damp and acidic conditions. Older forests are biologically rich ecosystems that are distinct from younger, second-growth forests in both structure and composition. Trees are generally large and tall. On some sites, Douglas-fir or western red cedar may be greater than 1.5m in diameter and more than 55m tall. Older forests are also structurally diverse. Snags, some as tall as the forest canopy, others reduced to low mounds on the forest floor, are intermixed with live trees of varying ages. Fallen logs with rows of western hemlock seedlings sprouting from a mat of mosses and lichens lie along the forest floor, and shrubs and Douglas-fir saplings grow dense and high where a gap in the forest canopy has formed. Structural features can take more than a century to develop in coastal forests. Older forests in the study area are highly fragmented by roads, logging, and urban development. The flat topography of much of the study area, in conjunction with proximity to transportation and markets, has resulted in several logging passes over most of the landscape; hence, only isolated patches remain. Older forests are sensitive for the following reasons: • Rarity: Only remnants exist of forests which were much more extensive throughout the
study area only 150 years ago. Several of the specific forest ecosystems, particularly the drier types, are found nowhere else in Canada.
• High biodiversity: Older forests support a rich community of wildlife, plant and
25 See Section 1.4.1 for a discussion of the Biogeoclimatic Ecosystem Classification system developed for forest classification and management in B.C.

Sensitive Ecosystems: Older Forest (OF)
Sensitive Ecosystems Inventory: East Vancouver Island and Gulf Islands 43
invertebrate species which were once common throughout the landscape. • Specialized habitats: Many species are dependent or associated with specific habitat
features only found in older forests. Fungi, canopy insects, and lichens are examples of species groups that account for a huge proportion of the biological diversity of older forests. For example, some lichens are not found in coastal forests younger than 100 years.
Examples of major stands of older forest occur east of Sooke Lake, on Niagara Mountain, in the Pike Lake area, between French Creek and Morningstar Creek, and adjacent to the lower reaches of Chef Creek at Deep Bay (Figure 16).
B a y n e s S o u n d
D e e p B a y
Denman Island
Rosewall Creek
C o
o k
C
r e
e k
C h e f C k
S a n d y C r e e k
N
Older Forest ecosystem
Other sensitive ecosystem1 0 1 Kilometers
Figure 16: Older forest polygons in the Deep Bay, Rosewall Creek
area

Sensitive Ecosystems: Older Forest (OF)
Sensitive Ecosystems Inventory: East Vancouver Island and Gulf Islands 44
Older Forest
Site Factors Site conditions are highly variable, and a wide range of ecosystem types can occur within this ecosystem.
Plants General: Possible plant communities are many and are determined by site factors especially soil moisture
and nutrient regimes. Species composition is highly variable. Rare plants occur less often within forested ecosystems than in open habitats.
Zonal (average) Sites: Trees & shrubs: Douglas-fir dominates; grand fir and Pacific dogwood may be present. Shrubs include dull Oregon-grape, and salal may be dense. Herbs: may include sword fern, vanilla-leaf, twinflower; fairyslipper and other orchids may also be found. Mosses & lichens: Thick moss layers generally blanket much of the forest floor, and a variety of fungi and lichen exist, including step moss, Oregon beaked moss and lanky moss.
Dry Sites: Trees & shrubs: On drier than average sites, arbutus occurs with the Douglas-fir. As well as salal and dull Oregon-grape, shrubs may include baldhip rose and ocean spray. Herbs and Mosses are similar to above but may also include Pacific sanicle and electrified cat’s tail moss. Rare species include poison oak.
Moist Sites: Trees & shrubs: In moister than average forests, western red cedar, grand fir or western hemlock may dominate, red alder and bigleaf maple are common. Shrubs are diverse and can include red elderberry, red huckleberry and salmonberry. Herbs are also diverse and can include ladyfern and foamflower. Mosses & lichens: Menzies’ tree moss and leafy mosses occur and Lettuce lung lichen may be present in the moister older forests. In very wet forests, skunk cabbage and Indian hellebore may occur. Rare species include Smith’s fairybells.
Animals General: Habitat values are variable depending upon the ecosystem types present.
Amphibians & Reptiles: Moister forest sites are good habitat for amphibians such as Red-legged Frog, as well as a number of salamanders. Birds: In general, old-growth stands provide optimal habitat for cavity nesting birds such as the Pileated Woodpecker and for birds that require large-limbed trees for nesting and roosting, e.g. Western Screech Owl, Bald Eagle, and Red-tailed Hawk. Smaller raptors including Cooper’s Hawk, Merlin and a number of owl species breed in older forests in the study area. A very wide range of small birds also breed in older forests, including kinglets, chickadees, juncos, many migratory warblers, flycatchers, and others. Numerous birds overwinter in old-growth. Good cone production provides food for many seed eating birds such as crossbills, finches, and pine siskins. Mammals: Old-growth stands appear to provide optimal roosting habitat for many bats. A variety of studies have linked certain bat species to old-growth forests (see Christy and West 1993, for example). Black Bears find excellent feeding, security cover and denning opportunities in the moister old forests in particular. Old forests also provide many excellent deer winter habitats and important elk habitats Good cone production supports healthy squirrel populations.

Other Ecosystems: Older Second Growth Forest (SG)
Sensitive Ecosystems Inventory: East Vancouver Island and Gulf Islands 45
The following ecosystem types are not categorized as sensitive but are valuable for their contributions to biodiversity and importance to wildlife.
3.9 Older Second Growth Forest (SG)
Coniferous forests 60-100 years old with <15% deciduous component (SG:co) Coniferous forests 60-100 years old with a deciduous component of > 15% (SG:mx)
Two categories of older second growth forest ecosystem are identified for this project: large stands of conifer-dominated forest between 60 and 100 years old with less than 15% deciduous trees (OF:co) and those with more than 15% deciduous tree cover (OF:mx). All older second growth forests have been influenced by logging or other human disturbance since settlement of Vancouver Island and the Gulf Islands began in the middle of the 19th century. Biologically, the richest second growth forests are over 80 years old, contain deciduous and coniferous trees, are large and are connected to other natural ecosystems. The broad variation in stand age, polygon size, vegetation composition, and other attributes of older second growth forest ecosystems makes it difficult to describe characteristic vegetation or wildlife use in these areas. They are differentiated from older forests by the presence of large stumps created by logging, and the general lack of snags and other structural elements of decay (Photo 10). Whereas these structural features begin to develop in stands as young as forty years, large snags and downed logs only occur after 80 to 100 years. Older second growth forest is important for the following reasons: • Future older forests: Within 20 years, many of the second growth forests that were
logged early this century will become older forests. Disturbance and competition will increase the number of structural forest features such as snags and downed logs, and wildlife species associated with older forest will increase. The biodiversity values of second growth forests generally become higher with age.
• Landscape Connectivity: Older second growth forest stands provide connections
between other natural areas that promote the movement and dispersal of many forest dwelling species across the landscape. Wildlife populations in remnant ecosystems surrounding large patches of second growth forest may be maintained by frequent immigration from the forest patch. As well, smaller patches may be recolonized following disturbance events by individuals that survived in the larger and more stable second growth forest.
• Buffers: Older second growth forests can minimize disturbance to sensitive ecosystems
that occur within or adjacent to the forest patch. Where they border or surround wetlands, patches of older forest or other sensitive ecosystems, the second growth area serves an important role in buffering the adjacent sensitive areas. Buffers provide a vegetated area that bears the brunt of edge effects such as windthrow, invasive species colonization and increased access. They may also maintain micro-climate conditions that are critical in wetland and riparian ecosystems.

Sensitive Ecosystems: Older Second Growth Forest (SG)
Sensitive Ecosystems Inventory: East Vancouver Island and Gulf Islands 46
Examples of some of the large tracts of older second growth forest occur in the Crystal Lake area, around Langley Lake, on Maple Mountain, in East Sooke Park and in the Seal Bay area (Figure 17).
N
Older Second Growth Forest ecosystem
Sensitive ecosystem
2 0 2 Kilometers
T s o l u m R i v e r
Puntledge R
SealBay
Cape Lazo
ComoxCourtenay
Comox Harbour
Figure 17: Older second growth forest polygons in the Comox Valley

Other Ecosystems: Older Second Growth Forest (SG)
Sensitive Ecosystems Inventory: East Vancouver Island and Gulf Islands 47
Older Second Growth Forest Site Factors
As with the older forests, these ecosystems may be any one (or a combination) of a wide range of potential forested types; site factors vary widely.
Plants General: Stand composition is very variable depending on moisture and soil nutrients, past disturbance, and treatment history. Stands typically consist of a mix of tree species varying in age and size as trees are maturing. The canopy is more open than in younger forests, with understorey shrub and herb layers becoming well developed. Fallen logs and stumps may be from the maturing trees and also left from the previous old-growth. Trees & shrubs: Douglas-fir may be established and may range from young seedlings to large maturing trees. Grand fir and Pacific dogwood may be present. Shrubs include dull Oregon-grape, and salal may be dense. In wetter, richer sites with a strong deciduous component, bigleaf maple and red alder may be common Herbs: Herbs include sword fern, vanilla-leaf, twinflower; fairyslipper and other orchids may be found. Grasses are largely absent. In wetter, richer sites salmonberry and devil’s club may occur with salal and red huckleberry, Lady fern, vanilla-leaf, foamflower, and sword fern. Mosses & lichens: Moss layers are often relatively thin, and a fairly low species diversity of fungi and lichens is typical. Step moss, Oregon beaked moss and lanky moss may be found. In wetter, richer sites, mosses such as Menzies’ tree moss and large leafy moss may be found. Fungi and lettuce lung or other lichens may occur, but diversity will be limited.
Animals Amphibians & Reptiles: Whereas older second growth stands certainly provide habitat for a variety of amphibians and a few snake species, the quality of habitat for many species, especially a number of the terrestrial salamanders, is likely to be in part dependent on the quantity and quality of available coarse woody debris. This may be a limiting factor in many second growth forests. Birds: As these are mature stands they often produce vigorous cone crops providing an important food source for seed eating birds including crossbills, finches, and Pine Siskins. Numerous common bird species utilize this ecosystem, which also supports some cavity nesting bird populations in the more mature stands. Similarly, raptors will nest in the larger trees, but suitable candidate trees are fewer than in older forest and nesting densities are lower. Mammals: Older second growth stands currently afford important habitats for a wide range of typical coastal animal species including deer, bear, raccoon, squirrel, and others. However, compared to older forests, these stands are generally of lower quality for those animal species that require old growth attributes such as large old trees or large downed logs. Black Bears den in and under very large old trees and logs, which are increasingly absent in the second growth stands. Bears use these components within existing second growth where they have been left from earlier logging. These stands have the potential to produce the necessary habitat elements in the future. However, repeated harvests will see these elements lost unless they are managed for. Existing second growth stands often provide important corridors connecting other habitats together and permitting the dispersal of animals across the landscape.

Other Ecosystems: Seasonally Flooded Agricultural Field (FS)
Sensitive Ecosystems Inventory: East Vancouver Island and Gulf Islands 48
3.10 Seasonally Flooded Agricultural Field (FS)
Agricultural fields that flood in winter and early spring (FS) Seasonally flooded agricultural fields (FS) are lands that have been modified for agricultural use but have important wildlife habitat value during specific times of the year (Photo 11). They are located primarily in low-lying areas such as the valley bottoms and deltas of large alluvial rivers and creeks. In some cases they are found on moisture-receiving sites, usually in association with lake shores, or lowlands adjacent to coastal bays. They are often former wetlands and in many cases are located adjacent to surviving wetlands such as marshes, swamps, and wet meadows. These sites form part of a ‘wetlands complex’, in conjunction with nearby freshwater marshes and the coastal estuarine marshes, that is important to wintering waterfowl. Winter flooding occurs naturally with poor drainage or constant seepage contributing to a gradual rise in the water table during the winter rainy season. This natural flooding provides an ideal mixture of shallow water, stubble, waste grain and produce, weed seeds, and invertebrates, that provide habitat for wintering waterfowl. Seasonally flooded agricultural field ecosystems are important for the following reasons: • Surrogate wetland habitat: With the historical loss of natural wetland ecosystems, FS
ecosystems are playing an increasingly important role by providing surrogate wetland habitat for wildlife. The SEI study area is located along the Pacific Flyway, which is the migratory path for bird species traveling between their northern summer breeding grounds and other wintering areas further south. Because of favourable climatic conditions and available habitat, this area is an important wintering area for many species of waterfowl and other birds.
• High biodiversity: These flooded fields can support high numbers of different bird
species for the area they occupy, depending on the previous season’s agricultural use and the weather. Many FS fields are adjacent to natural riparian and wetland ecosystems, which increases habitat diversity within the larger landscape mosaic. Habitat diversity attracts a greater variety of species, each with unique habitat needs. In addition, when an FS field is adjacent or connected to the larger mosaic of woodlands, wetlands, and riparian corridors, wildlife use will extend to other seasons. Many species depend on one ecosystem for part of their life cycle, and surrounding areas for another. For example, flooded fields may be vital for winter survival, and riparian woodlands essential for breeding and nesting.
• Linkages and travel corridors: Hedgerows that have developed along fence lines that
form the boundaries between land holdings create linkage opportunities in addition to those provided by adjacent natural wetland and riparian habitats.
• Forest/field edge: The edge between a woodland/forest and an FS field ecosystem is
also an ecologically important landscape component. The primary function of the edge is to provide a structural transition from a non-forested ecosystem to one that is forested. The result is a flow of energy, nutrients and species between these ecosystems. Both the lengthwise and transverse movements of species along and through these edges makes

Other Ecosystems: Seasonally Flooded Agricultural Field (FS)
Sensitive Ecosystems Inventory: East Vancouver Island and Gulf Islands 49
them places of intense species interactions (e.g. breeding, predation), thus moulding the composition of plant and animal communities within both the ecosystems. Forest/field edges that are given room to generate and expand, provide a gradual transition between the two ecosystems, resulting in species richness and habitat diversity.
Seasonally Flooded Agricultural Field
Site Factors Includes fields, hay meadows and herbaceous wetlands under agricultural use. These sites are periodically saturated but have a well-aerated rooting medium after the initial period of saturation. They are typically low lying, often poorly drained and regularly flood in winter or early spring.
Plants Native vegetation does not normally occur. The sites have a history of disturbance and are often seeded with agronomic grasses or are under other crops. These fields may have been seeded with fall rye or other winter crops. Fallow fields in winter following corn or potato crops may also be included. When not actively managed, native species that thrive in disturbed sites often appear – especially the common rush.
Animals Birds: The number of bird species in agricultural areas containing FS fields is higher than in other altered land use areas. With winter flooding, FS fields in the SEI study area provide valuable habitat for many bird species. Swans, geese and ducks depend on the varied diet available in flooded fields during the winter months, and the following species can be frequently seen foraging: American Wigeon, Mallard, Canada Goose, Northern Pintail, Green-winged Teal, Northern Shoveler, Gadwall, Ring-necked Duck, Lesser Scaup, Common Goldeneye, Bufflehead, Hooded Merganser, Eurasian Wigeon, Trumpeter Swan, Tundra Swan, and White-fronted Goose. Shorebirds using flooded fields include Killdeer, Common Snipe, Dunlin, Black-bellied Plover, and the occasional Dowitcher. Ducks attract hawks and other birds of prey: Bald Eagle, Gyrfalcon, Red-tailed Hawk, Cooper’s Hawk, Peregrine Falcon, Merlin, and American Kestrel, are everyday winter visitors to FS fields as they seek an easy meal. The appearance of birds of prey attracts mobbing flocks of Northwestern Crows, along with Brewer’s and Red-winged Blackbirds. Together with starlings, these species forage the shallow field margins. Suitable grassy edge and ditch habitats attract Short-eared Owls, Long-eared Owls, Snowy Owls, Western Meadowlarks, and Northern Shrikes. Spring brings migration, and the still-wet fields can attract open-field species such as swallows, Eurasian Skylarks, and Band-tailed Pigeons. When ponds and ditches are part of the FS habitat, or the freshet extends the period of flooding, various ducks and geese will remain near the fields, and occasionally establish nesting sites near permanent water. Spring-flooded fields are used for pair bonding and mating rituals by ducks and geese. The fields also supply seeds, invertebrates and other nutrients that increase egg-laying capacity, and provide calcium necessary for strong egg shells. During the summer breeding season, FS fields are under intensive cultivation and are of little use to songbirds and waterfowl. Small mammal use of the fields increases, and owls and raptors return for productive hunting forays after nightfall. Great Blue Herons and Barn Owls supplement their diets with Townsend voles that make their homes in wet meadows and fields. In autumn, FS fields are busy stopover points for birds migrating south. Species encountered will vary from field to field, depending on the surrounding habitat, and individual species requirements.

Other Ecosystems: Seasonally Flooded Agricultural Field (FS)
Sensitive Ecosystems Inventory: East Vancouver Island and Gulf Islands 50
Examples of some of the larger seasonally flooded agricultural fields occur on the Courtenay Flats and south of the Comox Airport, at Martindale Flats and near the estuaries of the Chemainus and Nanaimo rivers (Figures 18 and 19).
N
Seasonally Flooded Agricultural Field ecosystem
Sensitive ecosystem
0.5 0 0.5 1 1.5 Kilometers
Strait of GeorgiaC h e m a i n u s R i v e r
N o r t h
C o w i c h a n
Figure 18: Seasonally Flooded Agricultural Field polygons near the Chemainus River
N
Seasonally Flooded Field ecosystem
Sensitive ecosystem0.5 0 0.5 1 1.5 Kilometers
Gabriola Island
Duke Point
Nanaimo River Estuary
Nanaimo
Chase River
N a n a i m o R i v e r
Figure 19: Seasonally Flooded Agricultural Field polygons
near the Nanaimo River Estuary

Photos
Sensitive Ecosystems Inventory: East Vancouver Island and Gulf Islands 51
Photo 1: Coastal Bluff (CB)
Photo 2: Sparsely Vegetated sand and gravel spit (SV:sp)
Photo 3: Terrestrial Herbaceous (HT)

Photos
Sensitive Ecosystems Inventory: East Vancouver Island and Gulf Islands 52
Photo 4: Wetland: marsh (WN:ms)
Photo 5: Wetland: shallow water (WN:sw)
Photo 6: Wetland: swamp (WN:sp)

Photos
Sensitive Ecosystems Inventory: East Vancouver Island and Gulf Islands 53
Photo 7: Riparian: mature (RI:6)
Photo 8: Woodland (WD)
Photo 9: Older Forest (OF)

Photos
Sensitive Ecosystems Inventory: East Vancouver Island and Gulf Islands 54
Photo 10: Older Second Growth Forest (SG)
Photo 11: Seasonally Flooded Agricultural Field (FS)

Results and Discussion
Sensitive Ecosystems Inventory: East Vancouver Island and Gulf Islands 55
Section 4 Results and Discussion This section provides a summary of SEI data analysis for the study area as a whole, and then for each of the five study area sub-units shown in Figure 20. As described in Section 2.1, these five areas are the Comox, Nanaimo, Cowichan, Capital and Islands sub-units and do not conform to Regional District boundaries26. Additional data are presented for municipal areas within each sub-unit, however, a detailed analysis of municipal statistics has not been undertaken. They are included for completeness and because it is anticipated many users will find the municipal data of interest.
4.1 Limitations of the Analysis Limitations of the methods that may have had some influence on the results are discussed in detail in Section 2 of this report. Some of these factors which relate directly to the results presented are reiterated in this section. Polygons were not always ‘pure’ units27. Approximately 22% of the polygons contained a mix of two ecosystem types and were referred to as ‘complexed’28 units. The presence of a secondary ecosystem more fully described the ecological characteristics of a particular polygon. Areal measurements provided throughout this section were derived by analyzing the data on the basis of the dominant (primary) ecosystem component only (Table 2), because the percentage representation of primary and secondary components within complexed polygons were not available. The presence of a secondary ecosystem reduced the areal representation of the first or primary type and in turn increased overall representation of the secondary type; this is not reflected in the tabular results. To partly compensate for this limitation, the data were analyzed to determine how many polygons of each ecosystem type occurred as complexed or pure units and as primary or secondary components. The results of this analysis showed that wetlands and riparian ecosystems occurred more often as pure
26 See Section 2.1 for further explanation 27 For further discussion, see ‘Pure’ and ‘Complexed’ Units, Section 2.3.2 28 The colour of the mapped polygon reflects the dominant ecosystem and a dashed diagonal line superimposed on top of the coloured polygon indicates the presence of a secondary ecosystem type. Both the primary and secondary ecosystem types are described in the table at the bottom right of the map sheet.
10 0 10 20 30 Kilometers
pw
Comox Sub-unit
Nanaimo Sub-unit
Cowichan Sub-unit
Capital Sub-unit
Islands Sub-unit
Regional District boundaries
Comox-Strathcona
RD
Nanaimo RD
Powell River
RD
CowichanValley
RD
Capital RD
Figure 20: Study area sub-units

Results and Discussion
Sensitive Ecosystems Inventory: East Vancouver Island and Gulf Islands 56
units than other ecosystem types; this analysis is presented in pie diagrams for each ecosystem (sections 4.2.2 to 4.2.10). Secondly, the areal extent of older second growth forests (SG) was under-represented. In the first phase of the SEI, only older second growth polygons larger than 100 ha were mapped. This means that many smaller SG sites were not included in the inventory, and that actual totals would likely be higher29. The degree of field checking also influenced the results30. Field checking enhanced the reliability attached to the classification and the nature of additional data available. Overall, flooded fields and wetlands received the highest levels of field checking, coastal bluffs the least.
4.2 Analysis of Results for Entire SEI Study Area
4.2.1 Summary data Inventory results for the entire area are summarized in Table 2 and as noted above, are based on analysis by dominant, or primary, ecosystem only. It was found that the seven sensitive ecosystems collectively covered 7.9% of the study area. When combined with the other two ecosystem types, this total increased to 19.3%, primarily due to the stands of older second growth forest. Figure 21 illustrates the proportion of sensitive ecosystems to the modified landscapes of the study area. Modified landscapes are defined here as urban and rural landscapes and forests younger than 100 years.
29 For further discussion, see Polygon Size, Section 2.3.2 30 The intensity of sampling, or field checking, of each ecosystem category is discussed in Section 2.4.1
Landscapesof East Vancouver Island and Gulf Islands
Modified landscapes 92%
Sensitive Ecosystems8%
Coastal Bluff 0.3%Terrestrial Herbaceous 1.0%
Sparsely Vegetated <0.1%Woodland 0.6%
Wetland 1.7%Riparian 1.6%Older Forest 2.6%
Figure 21: Landscapes of East Vancouver Island and Gulf Islands

Results and Discussion
Sensitive Ecosystems Inventory: East Vancouver Island and Gulf Islands 57
Table 2: Summary SEI Data by Sub-unit and Dominant Ecosystem Type
Sensitive Ecosystems
Comox Sub-unit
Nanaimo Sub-unit
Cowichan Sub-unit
Capital Sub-unit
Islands Sub-unit
Study Area total
Coastal Bluff hectares % of land area no of sites
34.1
<0.1 13
43.7 <0.1
25
41.8 <0.1
30
312.1
0.5 116
611.2
0.9 407
1042.9
0.3 591
Sparsely Vegetated hectares
% of land area no of sites
92.7 <0.1
28
48.9 <0.1
17
24.6 <0.1
7
38.0 <0.1
9
136.2
0.2 25
340.4 <0.1
86 Terrestrial Herbaceous
hectares % of land area no of sites
1327.3
1.2 284
446.0
0.5 195
744.0
0.9 223
1042.6
1.7 274
683.0
1.0 159
4242.9
1.0 1135
Wetland hectares
% of land area no of sites
3271.4
3.0 879
1556.8
1.6 630
1196.2
1.5 522
537.9
0.9 403
491.6
0.8 211
7053.9
1.7 2645
Riparian hectares
% of land area no of sites
2818.0
2.6 393
2146.5
2.3 245
1323.8
1.6 243
381.7
0.6 73
36.5 <0.1
6
6706.4
1.6 960
Woodland hectares
% of land area no of sites
24.3 <0.1
5
82.0 <0.1
15
357.2
0.4 58
1156.3
1.9 275
898.9
1.4 260
2518.8
0.6 613
Older Forest hectares
% of land area no of sites
1117.0
1.0 81
1463.4
1.5 77
729.7
0.9 83
5031.9
8.1 104
2263.3
3.5 125
10605.1
2.6 470
TOTAL Sensitive Ecosystems
hectares % of land area no of sites
8684.8 8.0
1683
5787.3 6.1
1204
4417.3 5.4
1166
8500.5 13.8 1254
5120.7 7.8
1193
32510.67.9
6500 Other Ecosystems (mapped for general biodiversity values) Older Second Growth
hectares % of land area no of sites
8594.2
7.9 49
7736.3
8.1 69
3294.1
4.0 35
10754.8
17.4 124
14511.1
22.3 337
44890.5
10.9 614
Flooded Fields hectares
% of land area no of sites
491.4
0.5 12
956.8
1.0 101
772.5
0.9 83
325.2
0.5 26
232.9
0.4 52
2778.7
0.7 274
TOTAL Other Ecosystems
hectares % of land area no of sites
9085.6 8.4 61
8693.1 9.1
170
4066.6 5.0
118
11080.0 17.9 150
14744.0 22.7 389
47669.3 11.6 888
Land area
hectares % of total study area
108,154.8
26
95,048.1
23
81,973.4
20
61,792.7
15
65,157.5
16
412,126.4
100

Results and Discussion
Sensitive Ecosystems Inventory: East Vancouver Island and Gulf Islands 58
4.2.2 Coastal Bluff (CB) Coastal bluff ecosystems represented 0.3% of the study area. They are by nature very small in extent, typically a couple of hectares or less, and are confined to areas immediately adjacent to the ocean. Less than 10% of the bluffs mapped were identified as coastal cliffs—113 ha in 50 polygons—which may have been partly due to limitations in identifying vertical cliffs on air photographs.
Coastal bluffs were very sparse in the area north of the Capital Sub-unit (Figure 22). Each of the three northernmost sub-units (Comox, Nanaimo and Cowichan) supported well under 50 ha of coastal bluff or under 0.1% of their particular land base. Bluffs were much better represented in the Capital and Islands sub-units which reflected the geology, as these sub-units have more extensive areas in which hummocky, undulating bedrock is exposed. The greater proportion of coastal bluffs mapped for the Islands Sub-unit compared to the Capital Sub-unit probably reflected the much greater coast/interior ratio of the Islands. In addition, the dipping Nanaimo Group sandstones underlie many of the Gulf Islands, and give rise to bluffs on their scarp slopes. In the Comox, Nanaimo and Cowichan Sub-units, deep glacial or fluvial deposits in many places have buried the bedrock surface, and topography is more subdued, so bluffs and cliffs were less abundant.
Scattered trees were often noted in the bluffs mapped, including arbutus, Garry oak and Douglas-fir. In a number of cases in the Cowichan, Capital and Islands sub-units, Rocky Mountain juniper was also present. When occurring in complexed polygons (Figure 23), CB was usually found with arbutus or Garry oak woodland, or with young or mature Douglas-fir forests. In the 247 complexed polygons with CB as either the dominant or secondary component, WD occurred in conjunction with 180 (73%) of them. Most of these were in the southern third of the study area, within the main ranges of Garry oak and arbutus. Site degradation was commonly observed, with trails and recreational use most often
noted, and broom and other introduced plant species were found to be a problem at a great
0
0.1
0.2
0.3
0.4
0.5
0.6
0.7
0.8
0.9
1
Comox Nanaimo Cowichan Capital Islands
Perc
enta
ge o
f lan
d ar
ea
Coastal Bluff (CB) Coastal Cliff (CB:cl)
13 sites 25 sites 30 sites
116 sites
407 sites
Figure 22: Proportion of sub-units containing
Coastal Bluff ecosystems
‘Complexed’ units with CBdominant
(CB covers >50% of site)
‘Complexed’ units with CBsecondary
(CB covers <50% of site)
160 polygons
87polygons
504 polygons
‘Pure’ units
(CB covers 100% ofsite)
Figure 23: Occurrence of CB as ‘pure’ or
‘complexed’ polygons

Results and Discussion
Sensitive Ecosystems Inventory: East Vancouver Island and Gulf Islands 59
many sites. Rare plants were recorded on some of the bluffs that were field checked. A few of the offshore bluffs were identified as nesting sites for cormorant colonies. Fifteen percent of the coastal bluffs were field checked; however, many units initially photo-interpreted as Coastal Bluff units were found upon field checking to be unvegetated intertidal rock (many were sandstone), and were deleted from the database.
4.2.3 Sparsely Vegetated (SV) Sparsely vegetated ecosystems represented less than 0.1% of the study area. They had higher representation in the Islands Sub-unit than on Vancouver Island (Figure 24). As with coastal bluffs, this was likely a reflection of the greater coastline length on the Gulf Islands, together with the presence of Nanaimo Group sandstones, providing more opportunity for cliffs, sand dunes and gravel and sand spits to develop. A total of 86 polygons were mapped with SV as the pure or dominant ecosystem component (Figure 25). Most (52) of them comprised inland cliffs with smaller numbers of vegetated spits (26), and even some sand dunes (8) mapped. An additional 24 polygons contained SV as a secondary component.
Pure units mostly represented spit and dune ecosystems although in a few cases, wetland marsh was sometimes found in complex with dune ecosystems. Complexed units most often represented inland cliffs, which commonly occurred in combination with older second growth forest and rocky terrestrial herbaceous ecosystems. Eleven SV polygons exceeded 10 ha, with only 2 exceeding 20 ha. The largest unit mapped was on Sidney Spit where a large sand spit is protected within Sidney Spit Provincial Park. Another area of less than 23 ha was mapped on Pender Island (Swanson Channel).
Many of the sites were highly disturbed. At the sites field checked (18%), broom and introduced grasses were a common problem, and many sites were disturbed by recreational trails and other human activities.
0
0.05
0.1
0.15
0.2
0.25
Comox Nanaimo Cowichan Capital Islands
Perc
enta
ge o
f lan
d ar
ea
SV Dune (SV:sd) SV Spit (SV:sp) SV Cliff (SV:cl)
28 sites
17 sites
7 sites
9 sites
25 sites
Figure 24: Proportion of sub-units containing Sparsely
Vegetated ecosystems
‘Complexed’units with SV
dominant
(SV covers >50%of site)
‘Complexed’ units withSV secondary
(SV covers <50% ofsite)
24 polygons
43 polygons 43 polygons
‘Pure’ units
(SV covers 100%of site)
Figure 25: Occurrence of SV as ‘pure’ or
‘complexed’ polygons

Results and Discussion
Sensitive Ecosystems Inventory: East Vancouver Island and Gulf Islands 60
4.2.4 Terrestrial Herbaceous (HT) Terrestrial herbaceous ecosystems cover 1% of the study area. Figure 26 shows that the greatest proportional representation of HT occurred within the Capital Sub-unit, whereas the highest areal extent occurred in the Comox Sub-unit (Table 2). The lowest proportional representation of HT occurred in the Nanaimo Sub-unit. The majority of HT polygons, in all sub-units, are rock outcrop types (HT:ro). Polygon size range is very wide, but average size is small (under 4 ha). Nearly three quarters (71%) of all polygons containing HT occurred in combination with other ecosystem types, i.e., complexed units (Figure 27). Over half of the polygons were complexed with older second growth forest (SG). Some sites had
scattered oak or arbutus on them, and in the southern part of the study area, they were commonly complexed with woodlands (WD). Disturbance of terrestrial herbaceous units was frequently observed and recreational use and grazing was noted at some sites. This ecosystem type had been severely influenced by introduced grasses and other herb species. In some cases, polygons were removed from the database as the vegetation consisted of more than 90% introduced grasses. In total, 248 polygons or 22% were visited. Ten polygons exceeded 50 ha. The largest polygons included one on Mount Braden, a site on the coast north of Millstream Road and
one on Mount McDonald (all in the Capital Sub-unit). Elsewhere, the larger sites included an area north of Murder Point on Saturna Island, a site on the north shore of Comox Lake, and an area at Sheepshank Hill in the Cowichan area.
4.2.5 Wetland (WN)
0
0.2
0.4
0.6
0.8
1
1.2
1.4
1.6
1.8
Comox Nanaimo Cowichan Capital Islands
Perc
enta
ge o
f lan
d ar
ea
Terrestrial Herbaceous (HT)Terrestrial Herbaceous rockoutcrop (HT:ro)
284 sites
195 sites
223 sites
274 sites
159 sites
Figure 26: Proportion of sub-units containing
Terrestrial Herbaceous ecosystems
‘Complexed’ unitswith HT dominant
(HT covers >50% ofsite)
‘Complexed’ units withHT secondary
(HT covers <50% ofsite)
705 polygons
346 polygons
430 polygons
‘Pure’ units
(HT covers 100% ofsite)
Figure 27: Occurrence of HT as ‘pure’ or
‘complexed’ units

Results and Discussion
Sensitive Ecosystems Inventory: East Vancouver Island and Gulf Islands 61
Wetlands occupied approximately 1.7% of the study area (Table 2). They were unevenly distributed, being more abundant on Vancouver Island than in the Islands Sub-unit. On Vancouver Island, the surface expression of the Nanaimo Plain is at its most extensive, and the very subdued, gently undulating topography lends itself to wetland development (see Appendix 10 for more information on geology). Wetlands peaked in abundance in the Comox Sub-unit (Figure 28) and were also well represented in Nanaimo and Cowichan Sub-units. In these three northerly sub-units, concentrations of numerous small wetlands were mapped as well as some large contiguous wetland complexes. In total, five wetland polygons exceeded 50 ha—four of them were in the Comox Sub-unit, including the large Newman Creek wetland. In the Capital and Islands sub-units, however, wetlands covered much less of the land’s surface. This is due to the increased prevalence of hummocky, bedrock-controlled topography, as well as lower rainfall and greater seasonal moisture deficits. These wetlands were individually very small and widely scattered.
Wetland polygons occurred primarily as pure units (Figure 29). When occurring in complexed units, they were mostly associated with seasonally flooded agricultural fields (many of these fields were former wetlands which had been drained and cultivated over the past century). In a few locations, they occurred in complex with riparian and older second growth forest ecosystems.
0
0.5
1
1.5
2
2.5
3
3.5
Comox Nanaimo Cowichan Capital Islands
Perc
enta
ge o
f lan
d ar
ea
Bog FenMarsh SwampShallow water Wet meadow
879 sites
630 sites522 sites
403 sites
211 sites
Figure 28: Wetland sub-classes by sub-unit
‘Complexed’ units with WNdominant
(WN covers >50% of site)
‘Complexed’ units with WNsecondary
(WN covers <50% of site)
55 polygons59 polygons
2586 polygons‘Pure’ units
(WN covers 100% of site)
Figure 29: Occurrence of WN as ‘pure’ or
‘complexed’ polygons

Results and Discussion
Sensitive Ecosystems Inventory: East Vancouver Island and Gulf Islands 62
More than one-quarter of the wetlands mapped were further classified by up to three sub-classes (see Section 2.3.2 for further discussion). Swamps (WN:sp) were mapped most often (Figure 30). This may have been due in part to the fact that during the air photo interpretation phase of the inventory this sub-class was assigned to polygons when the wetland classification was uncertain31. Swamp wetlands occurred in 1614 polygons (61% of total), representing nearly 3,900 ha; swamps also occurred as secondary or tertiary components in an additional 204 sites. They usually occurred in complex with marsh and shallow water components.
Marsh-dominated wetlands (WN:ms) represented 1,806 ha and occurred in 519 polygons (20% of all wetlands mapped); they also occurred in an additional 259 polygons as a secondary component. Swamp and shallow water were the sub-classes most commonly occurring with marsh (more than half of these sites). Fen-dominated wetlands (WN:fn) had the next largest area representation with 540 ha mapped in 171 polygons (6% of total); they occurred in an additional 44 polygons as a secondary component and were commonly complexed with swamp, bog and shallow water wetlands. Shallow water-dominated wetlands (WN:sw) occurred in 187 polygons (7% of total number of wetlands) representing 482 ha; they also occurred as secondary components in an additional 171 polygons and usually occurred in complex with marsh and swamp sub-classes. Wet meadow-dominated wetlands (WN:wm) were only mapped in 87 polygons (3% of total) representing 160 ha; they occurred as a secondary component in 19 additional sites and again the common companion sub-class was swamp. Bog-dominated wetlands (WN:bg) occurred in only 56 locations (2% of total), representing 172 ha.
31 For further discussion, see Section 2.6
0
200
400
600
800
1000
1200
1400
1600
1800
2000
bog fen marsh sw amp shalloww ater
w etmeadow
Wetland Class
Num
ber o
f site
s
w etland class present ie. occurs as dominant or secondary componentw etland class dominant, other classes occur as secondary components w etland class on ly, ie. pure unit
Figure 30: Representation of wetlands by sub-class

Results and Discussion
Sensitive Ecosystems Inventory: East Vancouver Island and Gulf Islands 63
Wetlands were one of the primary focuses of the SEI project. Field checking in wetland units was therefore higher than for any category except flooded fields with over 42% checking in total. This high sampling figure was also partly because all 286 polygons included in the 1993 CVWI were field checked and subsequently incorporated in the SEI. However, within the WN category some types received very high levels of checking, especially bogs and fens at over 60% each, whereas the wet meadow class was field checked much less often with only 15 polygons, or 17% of the total number visited. There were very few examples remaining of undisturbed wet meadow, fen, bog and shallow water wetlands in the study area. Wetlands in the Islands Sub-unit were more disturbed than those on Vancouver Island.
4.2.6 Riparian (RI) Riparian ecosystems were unevenly distributed between the different sub-units (Figure 31). They were at their maximum in the Comox Sub-unit but declined in extent southwards; the Islands Sub-unit contained only six polygons. Riparian ecosystems cumulatively occupied 1.6% of the study area (Table 2). Some riparian polygons were dominated by the early seral stages32 of sparsely vegetated or shrubby gravel bars, but most of them were mapped as structural stages 4 and 5—young stands of deciduous trees (usually red alder or cottonwood)—or young coniferous forests (Figure 32). Only a small proportion of the total represented mature or old growth forests of structural stages 6 and 7. Old floodplain forests of structural stage 7 were very rare, having been identified for only 12 polygons in total and accounting for only 110 ha; 17 additional sites contained stage 7 as a secondary component. Mature stands in stage 6 occurred more often with 1,500 ha mapped in 177 polygons and another 118 polygons contained mature riparian forest stage 6 as a secondary component. 32 See Appendix 2 for description of these structural stages
0
0.5
1
1.5
2
2.5
3
Comox Nanaimo Cowichan Capital Islands
Perc
enta
ge o
f lan
d ar
ea
Old forest (RI:7)
Mature forest (RI:6)
Young forest (RI:4-5)
Early stages (RI:1-3)
Gully (RI:g)
393sites
245sites
243sites
6sites
73sites
Figure 31: Proportion of sub-units containing Riparian
structural stages
29
295
759
524
116
12
177
503
261
70
100
200
300
400
500
600
700
800
Old Forest Mature Forest Young Forest Early Stages Gully
Num
ber o
f site
s
stage dominant orsecondary
stage dominant
RI:7 RI:6 RI:4-5 RI:1-3 RI:gRiparian Structural Stages
Figure 32: Occurrence of Riparian Structural Stages as
pure or dominant components

Results and Discussion
Sensitive Ecosystems Inventory: East Vancouver Island and Gulf Islands 64
Gullies rarely occurred as the dominant or primary sub-class with only 7 units mapped; however, they occurred as secondary components in 116 polygons, the highest number occurring in Cowichan (43 sites) and Nanaimo (37 sites) sub-units. The large mountains of the Vancouver Island Ranges to the west of the three more northerly sub-units provide a large33 catchment with relatively abundant rainfall for the headwaters of a number of major river systems. These rivers drain to the east, collecting additional water along the way. They then cross a relatively broad band of the Nanaimo Lowland where they widen and have the opportunity to form large floodplains. Consequently some major river systems have developed in the three most northerly sub-units, such as the Campbell, Tsolum and Oyster rivers in the Comox Sub-unit, the Englishman, Nanaimo, Qualicum and Little Qualicum rivers in the Nanaimo Sub-unit, and the Cowichan and Chemainus rivers in the Cowichan Sub-unit. These rivers and their tributaries are where the major concentrations of riparian ecosystems occurred. In the Capital Sub-unit there is far less opportunity for large river systems to have developed; as the mountains are lower and less extensive, there is generally less rainfall, and the hummocky and irregular nature of the bedrock has not permitted the development of large catchments. Some small systems have developed, mainly in the western portion where there are more rugged hills and higher rainfall. In the eastern half on the much lower elevations of the Saanich Peninsula and around Victoria, riparian areas had very little representation. On the Gulf Islands, the low relief, generally tiny catchment areas, and low rainfall are even less conducive to riparian development, and this was reflected in the results, which illustrated riparian areas in the Gulf Islands are minimal. Dominant tree species were recorded for a few riparian ecosystem polygons only. Western hemlock, western red cedar, black cottonwood, bigleaf maple and Douglas-fir (in various
combinations) were the most commonly identified trees in stages 5, 6 and 7. However, in earlier stages, red alder was frequently the predominant species. Riparian polygons usually occurred as ‘pure’ units (Figure 33). Secondary ecosystems were rarely identified, although occasionally wetlands were indicated within a predominantly riparian polygon. Field checking of riparian units was conducted in 30% of the polygons in all, including three of the 12 structural stage 7 stands.
4.2.7 Woodland (WD)
33 Although these river systems are large relative to Vancouver Island, they are small relative to other areas of British Columbia. The SEI study area is characterized by relatively low rainfall and dry conditions throughout the growing season.
‘Complexed’ units with RIdominant
(RI covers >50% of site)
‘Complexed’ units with RIsecondary
(RI covers <50% of site)
15 polygons31 polygons
929 polygons‘Pure’ units
(RI covers 100% of site)
Figure 33: Occurrence of RI as ‘pure’ or ‘complexed’
polygons

Results and Discussion
Sensitive Ecosystems Inventory: East Vancouver Island and Gulf Islands 65
Woodland ecosystems were identified for 0.6% of the study area (Table 2). Garry oak-dominated woodlands accounted for nearly half of the woodland polygons. The majority of these occurred in the Capital and Islands sub-units then diminished further north (Figure 34). Very few woodlands were identified in the most northerly part of the area. This is consistent with the range of the oaks, which were historically predominant only in the southern part of the study area. Arbutus-dominated stands were identified in 221 polygons. In most cases, arbutus was found mixed with Douglas-fir. Only a very small proportion of polygons showed arbutus as the dominant tree species, combined with either Garry oak or a mix of Garry oak and Douglas-fir. Other units showed Douglas-fir as the dominant species, but variously mixed with oak, arbutus, and in a single case, Sitka spruce. In the southern third of the study area, oak and arbutus woodland ecosystems were frequently complexed with either coastal bluff or terrestrial herbaceous ecosystems, and less often with older second growth forest. A few trembling aspen sites were identified in the woodland category; however, only five of the polygons indicated aspen as a leading species either alone or mixed with bigleaf maple and red alder. Although more aspen stands certainly occurred in the study area, they were often very small. Most aspen sites in the study area were smaller than the SEI minimum polygon size of 0.5 ha. Only a few polygons were mapped, such as a site at Fort Rodd Hill in
the Capital Sub-unit and at Buttertubs Marsh in the city of Nanaimo. Whereas it was clear that woodlands were very fragmented and poorly represented in the area as a whole, the areal extent may have been even lower than indicated. Nearly half (294 sites) of all the WD-dominated polygons had secondary ecosystems mapped within them (Figure 35) so the actual area occupied by woodlands in these units was lower than indicated (see Section 4.1 for discussion on limits of analysis). This was countered to some extent by the fact that woodlands were also identified as secondary ecosystems in 285 polygons.
Of the 579 complexed WD units, 359 occurred in combination with terrestrial herbaceous ecosystems and an additional 177 polygons occurred with coastal bulff ecosystems.
0
0.2
0.4
0.6
0.8
1
1.2
1.4
1.6
1.8
2
Comox Nanaimo Cowichan Capital Islands
Perc
enta
ge o
f lan
d ar
ea
Woodland
5 sites 15 sites
58 sites
275 sites
260 sites
Figure 34: Woodland ecosystems by sub-unit
‘Complexed’ units with WDdominant
(WD covers >50% of site)
‘Complexed’ unitswith WD secondary
(WD covers <50% ofsite)
285 polygons
294 polygons
319 polygons
‘Pure’ units
(WD covers100% of site)
Figure 35: Woodlands as ‘pure’ or ‘complexed’
units

Results and Discussion
Sensitive Ecosystems Inventory: East Vancouver Island and Gulf Islands 66
Additionally, some polygons identified as woodland during air photo interpretation may not have represented oak or arbutus woodlands, but may in fact have been second growth disturbed areas. For example, in eight of the polygons, bigleaf maple was identified as the leading tree species, red alder as the leading species in two polygons, and in 27 polygons, arbutus alone is identified. Douglas-fir and arbutus together were indicated for another 172 polygons. Wildflowers were often noted in woodland stands, but the condition of the sites was often poor, with trails, trampling and general disturbance frequently observed. Broom and other introduced species were found throughout. Because the condition of most woodland sites (especially those with Garry oak) was often poor, the few sites of good to excellent quality and condition are noteworthy. The Elkington property north of Duncan was a good example of the type of Garry oak meadow that was once common on southern Vancouver Island. Other examples were found at Mt. Tzuhalem in the Cowichan Sub-unit and Mt. Maxwell on Salt Spring Island. Nearly one-quarter (23%) of these polygons were field checked; some were clearly on cool aspects, atypical for woodland units. Field checking these units would likely result in some polygons being excluded from the SEI database, as some may be heavily disturbed areas or logged and burned sites now dominated by young arbutus or arbutus/Douglas-fir mixes.
4.2.8 Older Forest (OF) Forests older than 100 years comprised 2.6% of the study area (Table 2). Only 5% (529 ha) of this was identified as predominantly mixed older forest containing more than 15% of deciduous trees combined with the conifers. The remainder was mapped as predominantly coniferous forest (Figure 36).
The Capital Sub-unit had by far the greatest representation of older forest, the majority of which existed within areas protected under a variety of tenures—in regional and provincial parks, on federal lands, and within the CRD water supply area. The sub-units of Comox, Nanaimo and most notably Cowichan, had poor representation of older forests. In the Comox area, an extensive fire 60 years ago and in the Cowichan Valley, intensive harvesting in the last 60 years would explain this. In the Cowichan Valley, less than 1% of the land area remained in older stands. Although older forests would once have predominated through much of the area, it was clear that they were now very fragmented. Through the whole study area, only 15 polygons individually exceeded 100 ha. Eleven of these occurred within the Capital Sub-unit; two were
0
1
2
3
4
5
6
7
8
9
Comox Nanaimo Cowichan Capital Islands
Perc
enta
ge o
f lan
d ar
ea
Older Coniferous Forest (OF:co) Older Mixed Forest (OF:mx)
78 sites77 sites
83 sites
104 sites
125 sites
Figure 36: Proportion of sub-units containing
Older Forest ecosystems

Results and Discussion
Sensitive Ecosystems Inventory: East Vancouver Island and Gulf Islands 67
in Nanaimo Sub-unit, and two in the Comox Sub-unit. In general, the older forests largely consisted of numerous very small fragments scattered across the landscape.
The age class information in the SEI database points to relatively poor representation of forests in the older age classes. A small number of polygons exceeded 250 years and the rest appeared to be between 100 and 250 years old. Figure 37 shows that there were almost as many complexed older forest units (287) as there were pure units. The most common combination was with older second growth forest and a few additional sites contained HT. Various tree species combinations were identified as the dominants in these polygons. Throughout the area, Douglas-fir
was the most common leading species listed under dominants. The rest were primarily Douglas-fir mixed with western hemlock or Douglas-fir mixed with western red cedar. Other combinations of dominant trees were much less common. A few sites included red alder and grand fir in the dominants. Field checking was conducted in 138 polygons (29%). In these older forests, large fire-scarred trees were often observed and attested to the fire history of the area. The condition of these ecosystems, although often disturbed, was generally better than most of the more open units. However, some introduced species such as spurge laurel and European ivy were common in these forests, even abundant in some sites in the Capital Sub-unit in particular.
‘Complexed’ units with OFdominant
(OF covers >50% of site)
‘Complexed’ unitswith OF secondary
(OF covers <50% ofsite)
139 polygons
148 polygons
322 polygons
‘Pure’ units
(OF covers100% of site)
Figure 37: Occurrence of OF as ‘pure’ or
‘complexed’ polygons

Results and Discussion
Sensitive Ecosystems Inventory: East Vancouver Island and Gulf Islands 68
The following two ecosystem types were not categorized as sensitive but were
included in the SEI inventory because they are valuable for their contributions to biodiversity and their importance to wildlife.
4.2.9 Older Second Growth Forest (SG) A very large proportion of the total area of ecosystems mapped for this project—over 56%34 (44,890.5 ha)—was classified as older second growth forest, reflecting the extensive logging history of the area. Maturing stands of second growth forest are significant in that they are potential replacements for the diminished representation of older forests. Within the older second growth forests, dominant trees varied. The most common dominant was Douglas-fir, either alone or combined with western hemlock, grand fir and occasionally red cedar or red alder, but a range of species mixes occurred. Mixed forests (with >15% deciduous component) accounted for about one third of the area of second growth forest; the remainder comprised coniferous stands with minimal deciduous tree cover. SG primarily occurred in combination with other ecosystem types (Figure 38), usually as a secondary component. The most common combinations were with older forests in 209 sites and terrestrial herbaceous ecosystems in 183 sites. 19% of the SG polygons were visited.
4.2.10 Seasonally Flooded Agricultural Field (FS) Flooded fields covered 0.7% of the study area (Table 2). Greatest representation was within the Nanaimo and Cowichan sub-units, whereas Comox, Capital, and Islands areas had more limited occurrences (Figure 39). There were a few large and significant flooded fields in each sub-unit. The average size was just over 10 ha. Only four polygons exceeded 100 ha—these were at Courtenay Flats, the farms south of Comox Airport on Richards Trail in the Cowichan Valley, and at Martindale Flats in the Capital Sub-unit. Another 10 polygons were between 50 and 100 ha. Field checking in this category was high with
34 The actual total will be higher than this, as only larger second growth stands were mapped (Section 2.3.2).
‘Complexed’ units with SGdominant
(SG covers >50% of site)
‘Complexed’ unitswith SG secondary
(SG covers <50% ofsite)
621 polygons
270 polygons
344 polygons
‘Pure’ units
(SG covers100% of site)
Figure 38: Occurrence of SG as ‘pure’ or
‘complexed’ polygons
0
0.2
0.4
0.6
0.8
1
1.2
Comox Nanaimo Cowichan Capital Islands
Perc
enta
ge o
f lan
d ar
ea
Seasonally Flooded Agricultural Field
12 sites it
101 sites
83 sites
26 sites
52 sites
Figure 39: FS ecosystems by sub-unit

Results and Discussion
Sensitive Ecosystems Inventory: East Vancouver Island and Gulf Islands 69
45% of the polygons observed in the field; again this was partly due to the additional sampling of the CWS CVWI. Most polygons classified as seasonally flooded fields occurred as pure units (Figure 40). Where complexed, FS occurred with wetlands in all but one site.
4.2.11 Additional General Observations The condition of the SEI polygons was found to be highly variable. In all areas, one of the most commonly encountered impacts upon the remaining natural ecosystems was the invasion of non-native plant species. Excluding flooded fields, which contained typically non-native vegetation, the ecosystems most affected by introduced species were the relatively dry and open habitats. Thus many of the sparsely vegetated, terrestrial herbaceous, coastal bluff and woodland polygons were the most extensively impacted. For example, terrestrial herbaceous ecosystems on the Gulf Islands were usually dominated by more than 50% cover of introduced grasses. At many sites, shrubs were the most immediately apparent introductions. Broom was the most widespread and was widely distributed throughout the southern two thirds of the study area. The spread of this European species across the landscape has been greatly assisted by linear developments including hydro lines and roads, some of which were actively seeded with broom for erosion control. European gorse is another introduction that was dominant in a number of open sites in the south of the area. In woodlands and forests, shrubs such as spurge laurel and European ivy were common. Whereas invasive species were most obvious in areas where there had been some past surface disturbance, even apparently undisturbed polygons often supported substantial non-native plant communities. On coastal bluffs, for example, non-native species occurred almost everywhere to some degree. More details of introduced species are provided in Appendix 10.
‘Complexed’ units with SGdominant
(SG covers >50% of site)
‘Complexed’ units with SGsecondary
(SG covers <50% of site)
14 polygons22 polygons
252 polygons‘Pure’ units
(FS covers 100% of site)
Figure 40: Occurrence of FS as ‘pure’ or
‘complexed’ polygons

Results: Comox Sub-unit
Sensitive Ecosystems Inventory: East Vancouver Island and Gulf Islands 70
4.3 Comox Sub-unit
4.3.1 Summary data The Comox Sub-unit includes the coastal lowland portion of Comox-Strathcona Regional District, but excludes Denman and Hornby Islands, which are discussed under the Islands Sub-unit (Section 4.7). Figure 41 shows the municipal areas within this sub-unit, and the ecosystem data is presented in Table 3. Only 8% of the Comox Sub-unit supported sensitive ecosystems, with an additional 0.5% of seasonally flooded fields. Over half of the total hectares mapped comprised second growth forests of 60-100 years old. The largest 25 polygons mapped were all either second growth forest (23 polygons) or flooded fields (2 polygons). No single sensitive ecosystem category exceeded 3% of this sub-unit (Table 2). The largest polygon mapped was a 114 ha area of older forest in the Trent River area and only three other sensitive ecosystem polygons exceeded 100 ha.
Table 3: Area (ha) of ecosystems in the Comox Sub-unit by municipality35 Comox Sensitive Ecosystems Other
Ecosystems All
CB HT OF RI SV WD WN Total FS SG Total Campbell River 0.0 103.2 70.6 341.9 19.1 0.0 416.9 951.7 0.0 408.0 1359.7 Comox 0.0 0.3 5.5 0.0 0.7 0.0 1.5 8.0 0.0 83.4 91.4 Courtenay 0.0 0.0 1.2 14.5 0.0 15.4 7.7 38.8 4.4 89.0 132.2 Cumberland 0.0 0.0 0.0 7.3 0.0 0.0 51.8 59.1 0.0 112.2 171.3 Unincorporated Areas
34.1 1223.8 1039.7 2454.3 72.9 8.9 2793.5 7,627.2 487.0 7901.6 16,015.8
Total 34.1 1327.3 1117.0 2818.0 92.7 24.3 3271.4 8684.8 491.4 8594.2 17,770.4 Land area = 108,155 ha or 26% of study area
35 No detailed analysis of these municipal statistics was undertaken. The data were included for completeness and because it was anticipated many users would find the information of interest.
5 0 5 10 15 Kilometers
Campbell River
ComoxCourtenay
Cumberland
V a n c o u v e r
S t r a i t o f G e o r g i a
I s l a n d
Denman I
Hornby IMunicipalityUnincorporated Area
pw
Figure 41: Comox Sub-unit and municipal
boundaries

Results: Comox Sub-unit
Sensitive Ecosystems Inventory: East Vancouver Island and Gulf Islands 71
The Comox Sub-unit was particularly important for wetlands, having far more wetland representation than any other sub-unit studied (Figure 42). It also had the greatest area of riparian ecosystems of the five sub-units. Woodlands however were essentially absent, and coastal bluffs were poorly represented relative to areas further south.
4.3.2 Coastal Bluff (CB) Coastal bluffs were scarce within this sub-unit. The average size was 2.6 ha—the largest was 6.2 ha and occurred at Balmoral Beach, Comox. Another unit of over 5 ha occurred at McMullen Point near the northern SEI boundary. Almost all the mapped bluffs were categorized as cliffs. Two polygons were complexes that included second growth forest. Four polygons were field checked.
4.3.3 Sparsely Vegetated (SV) Sparsely vegetated dunes, spits and cliffs were rare, covering less than 0.1% of the sub-unit; although with 93 ha mapped in 28 polygons, this area still had the greatest proportional representation except for the Islands. Most of the polygons were inland cliffs—the largest was a site of just under 20 ha in the John Hart Lake area; a 15 ha polygon was located in the Menzies Creek area. All other polygons are under 10 ha. Five of the polygons were gravel spits. The main occurrences were at Goose Spit and Kye Bay. Smaller spits also occurred at the mouth of Little River, in Mud Bay, and in Seal Bay. Only two ‘pure’ sand dune sites were mapped – one at Mud Bay and a second northeast of Kuhusan Point. There was also one site mapped as a sand dune/older forest complex just north of the Oyster River mouth. Altogether, 15 of the 28 polygons had a secondary ecosystem identified. Most of these were either terrestrial herbaceous (rock outcrop) type or older second growth forests, but there were two with wetlands and one with older forest identified. Five polygons or 18% were field checked in this sub-unit.
4.3.4 Terrestrial Herbaceous (HT) Terrestrial herbaceous ecosystems covered 1.2% of this sub-unit. Four polygons were large, exceeding 50 ha. Two of these including the largest at over 79 ha were mapped on the north
Terrestrial Herbaceous
15%
Woodland<1%
Sparsely Vegetated
1%
Coastal Bluff<1%
Older Forest13%
Riparian32%
Wetland38%
Figure 42: Relative proportion of sensitive
ecosystems in Comox Sub-unit

Results: Comox Sub-unit
Sensitive Ecosystems Inventory: East Vancouver Island and Gulf Islands 72
shore of Comox Lake, whereas the others were north of the Lost Lake area and at Brown Bay. Only about a fifth of these polygons were mapped as ‘pure’ units; all the rest were complexed and included other types. The majority of secondary ecosystems were second growth forests, whereas very small numbers were bluffs or sparsely vegetated units. Field checking was conducted at 53 or 19% of the sites.
4.3.5 Wetland (WN) Wetlands were much more frequent in this sub-unit than in any of the areas to the south, reflecting the extensive expanse of low-lying plain that predominates through the area and a relatively abundant water supply. About 3% of the sub-unit was mapped as wetland which was more than twice the area of wetland mapped for the Nanaimo Sub-unit, which had the next largest wetland representation. The average size of the wetlands in the Comox Sub-unit was a little under 4 ha. Reflecting the inventory results throughout the study area (Figure 28), swamp wetlands were by far the most abundant36 in this sub-unit. They occurred in 678 of the 879 wetland polygons, mostly as the dominant wetland sub-class. Whereas most (477) were mapped as pure swamp units, many were also mixed with other wetland types, particularly marsh ecosystems and, less often, shallow water wetlands. The largest polygon mapped was Newman Creek wetland, a 100 ha swamp complexed with marsh and bog. Other large swamps included a 60 ha site on Black Creek upstream from Northy Lake and a 34 ha swamp around Snakehead Lake. Marsh-dominated wetlands (for example, WN:ms or WN:ms:sp:sw) occurred in 178 polygons; marsh also occurred as a secondary component (for example, WN:sp:ms) in another 126 wetland polygons. Sizable marshes included Railway Marsh, a marsh/shallow water/swamp complex of 46 ha, located west of Merville and other sites of 20 to 40 ha each at Campbell River Delta, the south end of Quinsam Lake, at Cumberland sewage pond, at Base Flat and at Tyee Lake. The other wetland categories were much less common both in numbers and in total area mapped. Shallow water-dominated wetlands accounted for a total of 205 ha in 45 polygons, only two of which exceeded 10 ha; they most commonly occurred with marsh and swamp. A total of 108 polygons contained a shallow-water wetland component, which is especially important for waterfowl. The largest one was a 15.7 ha site east of Hell Diver Lake. Fen wetlands occurred in 38 polygons, and were dominant in 26 polygons, representing 262 ha. The average size was just under 9 ha. The largest was over 68 ha at Little Oyster River and another of over 50 ha occurred at Hell Diver Swamp. Many smaller fens also occurred in both these locations. As with the entire study area, wet meadows and bogs had the lowest representation among the wetlands with only 37 ha between 15 sites and 33 ha between 11 sites respectively. The largest bog was 7.5 ha, located north of the Van-West Logging Road, the largest wet meadow was 12.7 ha lying north of the mouth of Oyster River. 36 See section 2.6 for further discussion.

Results: Comox Sub-unit
Sensitive Ecosystems Inventory: East Vancouver Island and Gulf Islands 73
Field checking in the wetlands category in this area was particularly extensive, with over 50% of the polygons checked; hence confidence levels on ecosystem identification here are high.
4.3.6 Riparian (RI) Riparian ecosystems were relatively common in this sub-unit and were mapped for 393 polygons comprising 2.6% of this area. This was the greatest proportional representation in the overall study area. Main concentrations occurred along all the major river systems and their tributaries including the Oyster, Tsolum, Quinsam and Tsable Rivers, and many of the larger creeks including Menzies, Mohun, Cowie, Wilfred and Rosewall (Figure 43).
In all, relatively mature riparian forests (i.e. those sites with dominant structural stages 6 and 7) accounted for 78 polygons and a little over 650 ha; under 20 ha of this was mapped as structural stage 7. The largest of the five sites mapped as structural stage 7 was 10.6 ha
5 0 5 10 KilometersN
Menzies Ck
Mohun Ck
Campbell R
Quinsam R
Oyster R
Little Oyster R
Tsolum R
Puntledge Ck
Trent R
Hart Ck
Tsable RCowie Ck
Wilfred CkRosewall Ck
Perseverance Ck
Riparian ecosystems
SEI study area boundary
Figure 43: Riparian ecosystems in the Comox Sub-unit

Results: Comox Sub-unit
Sensitive Ecosystems Inventory: East Vancouver Island and Gulf Islands 74
near the lower reaches of the Tsable River. Some fairly large areas of structural stage 6 were identified on Mohun Creek, Tsolum River, Oyster River and Menzies Creek. The remaining riparian units were all in earlier seral stages.
Two sites were listed with Sitka spruce as the leading species, both in structural stage 6. Western red cedar was noted as one of the leading species in another 7 polygons in stages 5, 6 and 7. Field checking was conducted at 132 sites, (34%) of the total.
4.3.7 Woodland (WD) Woodlands were very scarce in this sub-unit with less than 25 ha mapped in only five polygons. This was to be expected as this part of the study area was well to the north of the main range of the oak and arbutus trees that predominated in woodlands. Only one of the five polygons exceeded 10 ha; this is located west of Comox Airport, and the dominant trees listed were bigleaf maple and red alder. Indeed, three of the five polygons had bigleaf maple listed as the dominant species, and none of them had either Garry oak or arbutus identified as dominants. It is possible that none of the five mapped polygons contained Garry oak. Some of these woodlands may have been temporary successional forests; field visits would be necessary to confirm this. Field checking was carried out at one of the five sites.
4.3.8 Older Forest (OF) Old forests comprised a total of 1,117 ha or 1.0% of the area within 81 polygons. The average size was a little under 14 ha. About a third of the polygons were indicated to exceed 250 years, however, they were all small. Of the stands identified as old-growth (i.e. greater than 250 years) only three polygons were larger than 10 ha. These were a stand of over 28 ha at Seymour Narrows, one of 11 ha on Menzies Creek and one just under 11 ha in the Campbell Lake area. The remaining stands appeared to be between 100 and 250 years of age. The largest was 113 ha in the vicinity of Trent River. Only one other polygon in the lower reach of the Tsable River exceeded 100 ha. Two large polygons totaling 129 ha also occurred around McMullen Point. A single polygon at Kitty Coleman Creek had Sitka spruce indicated as a dominant species. Most of the sites mapped were pure older forest units; only a few were complexed with other ecosystem types. Almost 45% of the polygons were field checked.
4.3.9 Older Second Growth Forest (SG) The larger stands of older second growth forest which were mapped in this sub-unit almost equaled the total area of all seven sensitive ecosystems combined and amounted to 7.9% of the area within 49 polygons. Average size was 175 ha reflecting the relatively large minimum sizes established for these units, and almost all (except 6) exceeded at least 25 ha. Thirteen of the polygons were greater than 200 ha, and the largest, around Langley Lake, was 1,269 ha. Other large polygons included the Seal Bay area (717 ha) and an area in the Newman Creek headwaters (576 ha). Three polygons had lodgepole pine indicated as the dominant species. Only 5 polygons had secondary ecosystems identified, all being terrestrial herbaceous (HT). Field checking occurred on 6 of the 49 sites.

Results: Comox Sub-unit
Sensitive Ecosystems Inventory: East Vancouver Island and Gulf Islands 75
4.3.10 Seasonally Flooded Agricultural Field (FS) Flooded fields comprised almost 491 ha in only 12 polygons. Mean polygon size was thus relatively large at almost 41 ha. However, only three of the polygons exceeded 50 ha. The greatest expanse of flooded fields occurred on Courtenay Flats where one polygon of 179 ha was mapped. Another very large site of 124 ha occurred south of Comox airport. Other large units included almost 51 ha at Northy Lake and almost 40 ha in the Woodhus Creek area. Field checking was conducted on three of the 12 sites.

Results: Nanaimo Sub-unit
Sensitive Ecosystems Inventory: East Vancouver Island and Gulf Islands 76
4.4 Nanaimo Sub-unit
4.4.1 Summary data The Nanaimo Sub-unit includes the Vancouver Island coastal lowland portion of the Regional District of Nanaimo. Offshore islands including Newcastle Island, the Winchelsea and Ballenas Archipelago and other Gulf Islands are discussed in the Islands Sub-unit (Section 4.7). Figure 44 shows the municipal areas within this sub-unit, and the ecosystem data is presented in Table 4. Sensitive ecosystems occurred on 6.1% of the Nanaimo Sub-unit, with an additional 0.98% of seasonally flooded fields. No single sensitive ecosystem category exceeded 3% representation. As in the other sub-units, over half of all the area mapped comprised larger stands of second growth forests of 60-100 years old.
Table 4: Area (ha) of ecosystems in the Nanaimo Sub-unit by municipality37 Nanaimo Sensitive Ecosystems Other Ecosystems All
CB HT OF RI SV WD WN Total FS SG Total Nanaimo 17.7 20.8 20.8 109.7 3.8 44.5 250.1 480.9 66.6 516.9 1050.9 Parksville 0.0 3.6 0.0 39.3 0.0 0.0 32.5 75.4 0.0 43.5 118.9 Qualicum Beach 0.0 0.0 16.4 21.5 0.0 0.0 1.4 40.5 0.0 6.5 45.8 Unincorporated Areas
26.0 421.6 1426.2 1976.0 45.1 37.5 1272.8 5190.5 890.2 7169.4 13,264.8
Total 43.7 446.0 1463.4 2146.5 48.9 82.0 1556.8 5787.3 956.8 7736.3 14,480.4 Land area = 95,048 ha or 23% of study area
37 No detailed analysis of these municipal statistics was undertaken. The data were included for completeness and because it was anticipated many users would find the information of interest.
S t r a i t o f G e o r g i a
Lasqueti I
Gabriola I
V a n c o u v e r
I s l a n d
Parksville
Qualicum Beach
Nanaimo
Nanoose Peninsula
5 0 5 10 Kilometers
PW
MunicipalityUnincorporated Area
Figure 44: Nanaimo Sub-unit and municipal boundaries

Results: Nanaimo Sub-unit
Sensitive Ecosystems Inventory: East Vancouver Island and Gulf Islands 77
Relative to the other sub-units, Nanaimo had minimal representation of coastal bluffs and sparsely vegetated ecosystems, and low representation of terrestrial herbaceous ecosystems. Woodlands were also poorly represented, although some small pockets existed (Figure 45). Wetland and riparian ecosystems were well represented, although less extensively than to the north in the Comox Sub-unit. Older and second growth forests were moderately represented in comparison to other sub-units, whereas flooded fields reached their greatest extent here with more than any other area.
4.4.2 Coastal Bluff (CB) As in other areas coastal bluffs were small and uncommon, accounting for a total of only 36 ha in 25 polygons. The largest site of over 7 ha was at Nanoose Hill. The remainder were all less than 3 ha each. Five of the polygons identified were categorized as cliffs. Only five of the bluffs were identified as having secondary ecosystems present—four with woodland units and one with older second growth forest. One third of the polygons were field checked.
4.4.3 Sparsely Vegetated (SV) Sparsely vegetated dunes, spits and cliffs were very uncommon. Only 17 polygons were mapped, ranging in size from 0.3 to almost 19 ha and totaling only 43 ha, or a minimal 0.04% of the sub-unit. Most were cliff units. The largest was a site of 18.7 ha at Horne Lake. Seven of the cliff polygons were clustered in the Mount Benson area, and three more occurred in Westwood Lake area. Only four polygons were identified as spits. One is at Madrona Point, another at the mouth of Little Qualicum River, and two at Piper’s Lagoon. No sites were identified as sand dunes. All of the 13 inland cliff units included secondary components of either older second growth or terrestrial herbaceous ecosystems. The site at Little Qualicum River mouth included an area of estuarine marsh. Three sparsely vegetated polygons were field checked.
4.4.4 Terrestrial Herbaceous (HT) The Nanaimo Sub-unit had the lowest proportional representation of terrestrial herbaceous ecosystems with 446 ha (0.5%) of the area in 195 polygons. Most of these (177) were rock outcrop types. Eight of the polygons were greater than 10 ha in size, but only one of these (at Horne Lake) exceeded 20 ha. About three-quarters of the polygons were complexed with secondary ecosystems. Older second growth forests accounted for the majority, but a few
Wetland27%
Riparian37%
Older Forest25%
Coastal Bluff1%
Sparsely Vegetated
<1%Woodland1%
Terrestrial Herbaceous
8%
Figure 45: Relative proportion of sensitive ecosystems
in Nanaimo Sub-unit

Results: Nanaimo Sub-unit
Sensitive Ecosystems Inventory: East Vancouver Island and Gulf Islands 78
polygons were mixed with sparsely vegetated ecosystems and one at Neck Point with a coastal bluff. Eleven sites were field checked.
4.4.5 Wetland (WN) Wetlands represented 1.6% of the sub-unit, roughly half the proportional representation of the Comox Sub-unit. These 1,557 ha in 630 polygons ranged from tiny (0.1 ha) to just over 50 ha (one polygon). A little under half or 303 of the polygons were field checked. Secondary ecosystem components other than wetlands were identified slightly more often in this sub-unit than in Comox, but this representation was also minimal with only a few wetlands (totaling 74 ha) identified as being in complexes with either riparian, older second growth, or flooded field units. Within the different wetland types identified, swamps were again by far the most abundant38 and well over half of the polygons were in this category. As in other sub-units, they were often complexed with marsh ecosystems. Marshes were also fairly common with 108 polygons identified comprising 474 ha. The largest was a saline marsh of just over 50 ha at Nanaimo estuary, mapped as a pure marsh unit. Other sizeable marshes included 38 ha at Hamilton Marsh, 35 ha at Buttertubs Marsh, and 26 ha on the Englishman River estuary. As in the other sub-units, the rest of the wetland categories were much less common. Shallow water-dominated wetlands accounted for about 76 ha in 40 polygons, and none of the 40 polygons exceeded 10 ha in size; shallow water also occurred in an additional 50 polygons. Fen-dominated wetlands totaled 68 ha in 26 sites, and only two of them exceeded 10 ha. Both of these were at Quennell Lake; the largest was 12.3 ha. Bogs totaled 63 ha in 20 polygons in this area. The largest (over 23 ha) was surrounded by Glengarry Golf Course, at Qualicum Beach, but only two of the others were greater than 5 ha in size. Field checking in the bogs was very high with 80% (16) field checked. Wet meadows were minimally represented with only 8 ha mapped within 5 polygons. The largest was just over 3 ha at Buttertubs Marsh.
4.4.6 Riparian (RI) Riparian ecosystems were mapped for 245 polygons comprising 2.3% of this area. Main concentrations occurred on the Qualicum, Little Qualicum, Nanaimo, and Englishman rivers and tributaries, and French Creek (Figure 46). The largest riparian polygon mapped was 142 ha on the Qualicum River at Hunts Creek. Another large stand of 121 ha was noted on the Nanaimo River. Three polygons were classified primarily as old forest floodplain (structural stage 7), although nine additional riparian polygons contained stage 7 stands as the secondary or tertiary components39. The largest of these three was a stand of 29 ha on the Englishman River; the largest continuous riparian polygon (36 ha) was also in the Englishman River system, on Centre Creek, a major tributary. Mature or structural stage 6 stands were better represented with 75 polygons representing 605 ha. The largest site with mature floodplain forest as the main element was a stand of 51 ha on the Nanaimo River. Field checking was conducted on 57 of the 245 sites. 38 See section 2.6 for further discussion 39 See section 3.6 for discussion of structural stages and Appendix 2 for full descriptions.

Results: Nanaimo Sub-unit
Sensitive Ecosystems Inventory: East Vancouver Island and Gulf Islands 79
4.4.7 Woodland (WD) Woodlands were uncommon in the Nanaimo Sub-unit with 15 polygons totaling 82 ha. Only two of these exceeded 10 ha in size. The largest was a stand at Molery Creek (Icarius Point) with 22.5 ha; however, no oak or arbutus was indicated in the dominant species for this site that was not field checked. The other, a site of just under 22 ha, was at Nanoose Hill where four smaller woodland polygons also occurred with two more nearby at Wallis Point. At Jack Point, adjacent to the Duke Point Ferry Terminal, there was a 9 ha woodland and coastal bluff unit. Of the 15 polygons identified, most had Garry oak listed as a dominant species. Almost half of the woodlands had terrestrial herbaceous rock outcrop ecosystems listed as a secondary component. One polygon mapped appeared to be an aspen stand. This unit of 6.67 ha was at Buttertubs Marsh, where dominant trees listed were aspen followed by bigleaf maple and red alder. Five polygons were field checked.
5 0 5 KilometersN
Riparian Ecosystems
SEI study area boundary
Qualicu
m R
Little
Qua
licum
R
Fren
ch C
k
Englis
hman
R
Nanaimo River
Figure 46: Riparian ecosystems in the Nanaimo Sub-unit

Results: Nanaimo Sub-unit
Sensitive Ecosystems Inventory: East Vancouver Island and Gulf Islands 80
4.4.8 Older Forest (OF) Older forests comprised a total of 1,463 ha or 1.5% of the total area within 77 polygons. Average unit size was 19 ha. The largest stand was 161 ha in the French Creek area. Only one additional polygon exceeded 100 ha – a site of 102 ha in the South Englishman River area which contained a complex of OF:co/HT:ro. Other large units included one of 90 ha at Deep Bay and another of 79 ha on the Nanoose Peninsula. Only about half of the polygons were identified as older forest only. Many polygons were complexed with secondary ecosystems, and older second growth stands accounted for most of these. A few were complexed with terrestrial herbaceous /rock outcrop units and a few with riparian ecosystems. A handful of sites included lodgepole pine in the dominants. Two polygons on Mount Benson had a mix of western hemlock, grand fir, and western red cedar identified. Field checking occurred on 16 or 21% of these sites.
4.4.9 Older Second Growth Forest (SG) Older second growth area exceeded the total area mapped for sensitive ecosystems and represented 8.1% of the sub-unit within 69 polygons. The average polygon size was 112 ha. Two huge polygons exceeded 1,000 ha each. One was in the Crystal Lake area (1,569 ha) and one at Extension Rd. (1,484 ha). Another six polygons were in the 200 to 300 ha size range including one at Hamilton Marsh. About a third of the units had secondary ecosystem components identified. Most often (15 sites, representing 1072 ha) this was older coniferous forest, but two coastal bluffs, three wetlands and 12 terrestrial herbaceous ecosystems, and a single woodland also occurred in the complexes. Sixteen sites (22%) were field checked
4.4.10 Seasonally Flooded Agricultural Field (FS) Flooded fields were relatively common in this sub-unit and comprised 957 ha in 101 polygons or 1% of the area. This was the largest representation of flooded fields for any of the sub-units. Mean polygon size was much smaller than to the north at only 9.5 ha. The largest site was almost 84 ha along Errington Rd. Four other polygons exceeded 50 ha; these were in the Nanaimo River Delta, south of Qualicum Beach, in the Brannen Lake area, and in the Annie Creek headwaters. At this latter site, water levels were controlled by Ducks Unlimited to manage for trumpeter swans. Fourteen of the flooded field polygons had secondary ecosystems mapped; all of these were wetlands. More than half (58) of these sites were field checked.

Results: Cowichan Sub-unit
Sensitive Ecosystems Inventory: East Vancouver Island and Gulf Islands 81
4.5 Cowichan Sub-unit
4.5.1 Summary data The Cowichan Sub-unit includes the Vancouver Island coastal lowland portion of the Cowichan Valley Regional District, and excludes the Gulf Islands, which are discussed in the Islands Sub-unit )see Section 4.7). Figure 47 shows the municipal areas within this sub-unit, and the ecosystem data is presented in Table 5. Only 5.22% of the Cowichan Sub-unit supported sensitive ecosystems, and no single category exceeded 1.6% of the total area. This area had the lowest percentage of sensitive ecosystems of all the study sub-units. Seasonally flooded fields accounted for 0.9% of the sub-unit. An additional 4% of the area comprised larger stands of second growth forests 60-100 years old, which was very low when compared to the other sub-units studied.40
Table 5: Area (ha) of ecosystems in the Cowichan Sub-unit by municipality41 Cowichan Sensitive Ecosystems Other Ecosystems All
CB HT OF RI SV WD WN Total FS SG Total Duncan 0.0 0.0 0.0 20.1 0.0 0.0 0.0 20.1 0.0 0.0 20.1 Ladysmith 0.0 0.0 0.0 51.0 0.0 0.0 0.9 51.9 0.0 0.0 51.9 Lake Cowichan 0.0 0.0 0.0 0.0 0.0 0.0 7.1 7.1 2.5 0.0 9.6 North Cowichan 18.2 292.9 93.5 261.4 3.6 218.5 414.3 1348.6 538.9 1231.4 3072.7 Unincorporated Areas
23.6 451.1 636.2 991.3 21.0 138.7 773.9 2989.6 231.1 2062.7 5329.6
Total 41.8 744.0 729.7 1323.8 24.6 357.2 1196.2 4417.3 772.5 3294.1 8,483.9 Land area = 81,973 ha or 20% of study area
40 This may due to the fact that the 100 ha minimum size was not revised later to 25 ha for this sub-unit. See Section 2.3.2. 41 No detailed analysis of these municipal statistics was undertaken. The data were included for completeness and because it was anticipated many users would find the information of interest.
5 0 5 10 15 Kilometers
pw
Ladysmith
North Cowichan
Duncan
Lake Cowichan
Saltspring
Galiano Island
Valdes Island
SaanichPeninsula
S t r a i t o f G e o r g i a
V a n c o u v e r
I s l a n d
Island
Municipality
Unincorporated Area
Figure 47: Cowichan Sub-unit and municipal
boundaries

Results: Cowichan Sub-unit
Sensitive Ecosystems Inventory: East Vancouver Island and Gulf Islands 82
Compared to the four other sub-units, Cowichan had moderate representation of wetland and riparian ecosystems, although they were less extensive than in the area to the north (Figure 48). Coastal bluffs and sparsely vegetated ecosystems were relatively rare. Woodlands appeared more often here than in the northern sub-units, although they were still limited in occurrence. Terrestrial herbaceous ecosystems were moderately well represented compared to the other study sub-units. Older forests, however, had the lowest representation in this sub-unit of all of the study area. Flooded fields are well represented, second in total after the Nanaimo area.
4.5.2 Coastal Bluff (CB) Coastal bluffs were again scarce totaling less than 42 ha within 30 polygons. The largest bluff was only 5.3 ha in size at Bamberton. Only two others exceeded 4 ha – one near Bamberton at McCurdy Point and one at Grave Point. Two of the polygons were identified as cliffs. Six polygons represented complexes with another unit – either older second growth forest (3) or woodland ecosystems (3). Almost two thirds of the polygons had been field checked.
4.5.3 Sparsely Vegetated (SV) Sparsely vegetated units were uncommon as they were in other sub-units. Only seven polygons, all small, were mapped totaling 25 ha. All sites were cliffs and the largest was a 12.3 ha site on the Chemainus River. Three polygons were complexed with forested ecosystems. Four of the six sites were field checked.
4.5.4 Terrestrial Herbaceous (HT) Terrestrial herbaceous units were frequently mapped with 223 polygons totaling less than 750 ha identified. The largest was a 56 ha site on Sheepshank Hill. A further four polygons exceeded 20 ha–one of 28 ha at Mount Tzuhalem and one of 34 ha on Baldy Mountain plus two polygons around Mount Jeffrey. Many smaller terrestrial herbaceous sites also occurred in the vicinity of Mount Jeffrey and in the Maple Mountain and the Richards Mountain areas. Well over half of these units were in complexes with other types – primarily second growth forests – but a few sites were complexed with sparsely vegetated cliffs, and 29 polygons (150 ha) included woodlands as the secondary ecosystem. These complexed polygons included sites on Mount Tzuhalem, on Maple Mountain, around Separation Point, and many around Richards Mountain. Field checking occurred at 22% of the sites in this category.
Wetland27%
Riparian29%
Older Forest17%
Coastal Bluff1%
Sparsely Vegetated
1%
Woodland8%
Terrestrial Herbaceous
17%
Figure 48: Relative proportion of sensitive
ecosystems in Cowichan Sub-unit

Results: Cowichan Sub-unit
Sensitive Ecosystems Inventory: East Vancouver Island and Gulf Islands 83
4.5.5 Wetland (WN) Wetlands occupied about 1.5% of the Cowichan Sub-unit (a similar proportion to the Nanaimo Sub-unit). The 522 polygons identified comprised 1196 ha of the sub-unit and ranged in size from tiny (0.1 ha) to over 40 ha. Again, many of the wetland polygons occurred within the context of larger wetland complexes. Significant wetland area complexes comprised a variety of polygons occur around Somenos Marsh (20 polygons), the Chemainus Estuary (16 polygons), the Cowichan Estuary (11 polygons), and along the lower reaches of the Cowichan River. As in most of the other sub-units, swamps were by far the most abundant wetland type42, accounting for 60% (312 polygons) of the wetland areas mapped. They were sometimes complexed with marsh ecosystems. Only two were greater than 20 ha in size – one of 41 ha in the Somenos Marsh area and one of almost 26 ha on the lower Cowichan River. Marsh-dominated wetlands were less numerous with 64 identified comprising approximately 282 ha. Only one marsh was over 20 ha –- a saline marsh of nearly 28 ha at Cowichan Bay. Many other marshes were also saline including a polygon of 11.3 ha on the Cowichan River Delta, as well as many smaller polygons in that vicinity and numerous marsh units mapped in the Chemainus Estuary. The majority of the marshes were very small. Concentrations of freshwater marshes occurred around Somenos Marsh, and there were many smaller, scattered units. The wet meadow category was mapped more frequently in this sub-unit than any of the others with 103 ha identified in 62 polygons. One on the Cowichan River was over 34 ha in size, although the rest were all fairly small. Only 22 fens and 14 bogs were identified comprising 61 ha and 47 ha respectively. The largest fen was a 22 ha hardhack-dominated site along Shawnigan Creek, and the largest bog mapped was just over 17 ha at the very western edge of the SEI study area near Lake Cowichan. Field checking in these wetlands was lower than in the north of the study area with about 20% of the polygons checked.
4.5.6 Riparian (RI) Riparian areas were mapped for 243 polygons comprising 1.6% of the Cowichan Sub-unit. Of these, mature riparian forests (i.e. those in structural stages 6 and 7) accounted for a relatively small proportion with only three stage 7 polygons totaling 23 ha and nineteen stage 6 polygons representing 194 ha. Main concentrations of riparian ecosystems occurred along the major river systems – the Cowichan and Chemainus Rivers and their tributaries such as the Koksilah River and on Haslam and Holland Creeks (Figure 49). The largest riparian area mapped was 98 ha of early seral stages on the Koksilah River at Marble Canyon. Other large riparian polygons included 90 ha on Holland Creek near Ladysmith, 87 ha on Haslam Creek (which was the largest representation of structural stage 6), and a 53 ha stand along Bonsall Creek. Only three polygons had stage 7 identified as the primary component. The largest of these was 14.8 ha in Marie Canyon on the Cowichan River. Cottonwoods were indicated as a leading species in nine of the riparian polygons mapped along the Cowichan River. Field checking was conducted in 52 or 21% of the 243 sites.
42 See section 2.6 for further discussion

Results: Cowichan Sub-unit
Sensitive Ecosystems Inventory: East Vancouver Island and Gulf Islands 84
Haslam Ck
Holland Ck
Chemainus R
C o w i c h a n R i v e r
Koksilah R
5 0 5 KilometersN
Nanaimo R
Riparian EcosystemSEI study area boundary
Figure 49: Riparian ecosystems in the Cowichan Sub-unit

Results: Cowichan Sub-unit
Sensitive Ecosystems Inventory: East Vancouver Island and Gulf Islands 85
4.5.7 Woodland (WD) Woodlands increased to the south of the study area and were therefore more common in this sub-unit, with 58 polygons mapped totaling 357 ha. This was still only 0.42% of the sub-unit and was much lower representation than further south and east on the Islands. The average size of the woodlands was small – just over 6 ha. Ten of the polygons exceeded 10 ha. Two of these including the largest at over 47 ha were on the north side of Big Sicker Mountain. These polygons were mapped as mixtures of bigleaf maple, red alder and arbutus (based on forest cover mapping). As they were on cool aspects, they may not have been woodland ecosystems, but have been retained in the data set due to their potential for high biodiversity values. Field checks would be required to confirm their status. Several polygons elsewhere (e.g. on Richards Mountain) apparently also supported mixes of arbutus with maple and red alder and require checking to confirm if they were indeed woodland units or were disturbed areas from logging/fire. Other relatively large woodland units occurred at Kulleet Bay (over 30 ha) and at Sheepshank Hill near Bamberton (921.5 ha). Several moderately large woodland polygons also occurred on and around Mount Tzuhalem, whereas concentrations of smaller polygons occurred at Separation Point, near Richards Mountain, around Maple Mountain, and on some of the small islets near Crofton. Twelve polygons had species other than oak or arbutus indicated as the dominant trees; some examples are noted above. Some of the woodlands were complexed with terrestrial herbaceous ecosystems and, in a few cases, with coastal bluffs or older second growth forests. Almost a third of the woodland polygons were field checked.
4.5.8 Older Forest (OF) Older forests were very poorly represented in this sub-unit and comprised a total of only 730 ha or less than 1% of the total area within 83 polygons. Average polygon size was almost 9 ha, and there were no really large areas of older forests left. The largest stand identified was nearly 62 ha near Oliphant Lake. Several polygons of around 40 ha occurred on Mount Hayes, in Marie Canyon, and north of Chemainus River. There was a stand of 30 ha on Kelvin Creek by Koksilah River, another near the Malahat, one of 22 ha on the south side of Mount Prevost and an area of 14 ha on Mount Brenton. In this area, 23% of the sites were indicated as mixed stands with a significant (i.e. >15%) deciduous component. Western red cedar was indicated as the leading species on three sites and western white pine on one site. Less than a third of the sites were complexed with other ecosystem types. Most secondary ecosystems (12) were second growth coniferous stands or terrestrial herbaceous (7), although a few others occurred. A total of 18 polygons or 21% were field checked.
4.5.9 Older Second Growth Forest (SG) Although older second growth stands accounted for 4% of the Cowichan Sub-unit (35 polygons), surprisingly few extensive areas were mapped and only three polygons exceeded 200 ha. These were 941 ha on Maple Mountain plus smaller stands on Mount Hayes and at Separation Point. This was perhaps a reflection of the fact that, although the valley was

Results: Cowichan Sub-unit
Sensitive Ecosystems Inventory: East Vancouver Island and Gulf Islands 86
heavily logged and second growth forest was extensive, the majority of the logging had occurred since the turn of the century. Consequently, the amount of forest older than 60 years was relatively low, whereas 30, 40, and 50 year old stands occupied huge tracts of land. Some moderate sized areas of older second growth forest occurred at McCurdy Point (166 ha) west of Mount Prevost (166 ha) and along the Cowichan River (146 ha). Field checking occurred on nine of the 35 sites.
4.5.10 Seasonally Flooded Agricultural Field (FS) Flooded fields were well represented in this sub-unit compared to other areas, second after Nanaimo. The total area mapped comprised 773 ha in 83 polygons averaging a little over 9 ha. The largest site was almost 141 ha along Richards Trail where there was a large commercial potato farm. Only three others were larger than 50 ha; these were 53 ha in the Westholme area, 55 ha at the Chemainus River estuary, and 58 at Michael Lake. Field checking was carried out in 27 of the 83 locations.

Results: Capital Sub-unit
Sensitive Ecosystems Inventory: East Vancouver Island and Gulf Islands 87
4.6 Capital Sub-unit
4.6.1 Summary data The Capital Sub-unit includes the Vancouver Island coastal lowland portion of the Capital Regional District, and includes Trial, Chatham, Discovery Islands but excludes the Gulf Islands which are discussed in the Islands Sub-unit (Section 4.7). Figure 50 illustrates the municipal areas within this sub-unit, and the ecosystem data is presented in Table 6.
Sensitive ecosystems covered 13.8% of the Capital Sub-unit with flooded fields comprising another 0.5%. Most of the sensitive ecosystem areas mapped were concentrated in the least developed portions of the sub-unit, i.e. in the western half. This area is more rugged and supports a less dense population than the eastern portion, which includes the Saanich Peninsula and the area around Victoria.
Table 6: Area (ha) of ecosystems in the Capital Sub-unit by municipality43 Capital Sensitive Ecosystems Other Ecosystems All
CB HT OF RI SV WD WN Total FS SG Total Central Saanich 9.4 17.2 17.6 18.3 27.5 7.3 6.5 103.8 200.8 69.6 374.2 Colwood 0.9 3.4 131.7 25.2 0.0 20.4 15.3 199.6 0.0 86.9 283.8 Esquimalt 4.1 7.6 4.2 0.0 0.0 14.2 0.0 30.1 0.0 0.0 30.1 Highlands 1.8 184.3 134.5 14.7 0.6 343.9 55.1 751.9 7.1 1640.0 23820 Langford 0.0 108.5 157.4 63.5 0.0 285.3 26.1 646.8 0.0 996.9 1637.7 Metchosin 56.4 229.8 658.4 51.8 3.2 149.1 47.9 1227.1 0.0 1508.5 2705.1 North Saanich 0.0 0.5 41.9 8.8 2.0 16.2 9.2 79.2 0.0 348.3 426.9 Oak Bay 17.9 11.0 4.2 3.8 0.0 29.2 0.0 66.1 0.0 0.0 66.1 Saanich 25.2 53.5 334.1 19.3 1.7 198.7 98.9 754.7 110.3 394.4 1236.1 Sidney 0.0 0.0 0.0 2.6 0.0 0.0 0.0 2.6 0.0 0.0 2.6 Victoria 6.1 18.1 2.7 0.0 0.0 21.8 1.3 50.4 0.0 0.0 50 View Royal 1.9 29.3 387.5 7.4 0.0 24.2 33.3 491.9 7.0 139.3 629.9 Unincorporated 188.4 379.4 3157.7 166.3 3.0 46.0 244.3 4,096.3 0.0 5570.9 9,756 Total 312.1 1042.6 5031.9 381.7 38.0 1156.3 537.9 8500.5 325.2 10754.8 19,580.5 land area = 61,793 ha or 15% of study area 43 No detailed analysis of these municipal statistics was undertaken. The data were included for completeness and because it was anticipated many users would find the information of interest.
SookeBasin
Metchosin
Langford
Colw
ood
Highlands
View Saanich
VictoriaOak Bay
Esqu
imalt
Central Saanich
NorthSaanich
Sidney
Royal
5 0 5 KilometersN
pw
Municipality
Unincorporated Area
V a n c o u v e r
I s l a n d
S a
a n
i c
h
I
n l
e t
J u a n d e F
u c a S t r
a i t
Figure 50: Capital Sub-unit and municipal
boundaries

Results: Capital Sub-unit
Sensitive Ecosystems Inventory: East Vancouver Island and Gulf Islands 88
This sub-unit had the best representation of older forests, woodlands, and terrestrial herbaceous ecosystems (Figure 51). Coastal bluffs were also well represented relative to the other areas. However, wetlands, riparian areas and flooded fields were very restricted in this sub-unit. Sparsely vegetated units were minimal, whereas older second growth forests were well represented.
4.6.2 Coastal Bluff (CB) Coastal bluffs were common compared to areas further north, and over 300 ha in 116 polygons (0.5% of the sub-unit) were identified in this category. The six largest bluffs mapped were all on the small islands southeast of Victoria within Discovery Island Marine Provincial Park. The largest was 22.7 ha on West Chatham Island, and three others that exceeded 10 ha were mapped on Bentinck Island (18.9 ha) and on the east and north shores of Discovery Island. Only five of the bluffs were categorized as cliffs. Fifteen were in complexes with some other unit, mainly terrestrial herbaceous or woodland ecosystems. Altogether over 27% of the sites were field checked.
4.6.3 Sparsely Vegetated (SV) Only 9 polygons accounting for 37.9 ha of sparsely vegetated units were mapped. This accounted for under 0.1% of the sub-unit, the lowest total representation of all ecosystem types. Within Greater Victoria, most sites were within existing parks. Only two units were identified as spits, another three as sand dunes, and four were mapped as cliffs. The largest polygon was at Cordova Spit comprising 18.3 ha, which was actually classified as a sand dune unit. Another sand dune site of 10.7 ha occurred as Island View Beach. The only polygons mapped as spits were at Witty’s Lagoon (2.8 ha) and Albert Head Lagoon (0.6 ha). One polygon had a secondary ecosystem – a terrestrial herbaceous unit. One site was field checked, but most of the sites were well known, and almost all appeared to have had some disturbance in the form of trails and introduced species.
4.6.4 Terrestrial Herbaceous (HT) Terrestrial herbaceous ecosystems were frequently mapped with 274 polygons totaling over 1,000 ha. This was the highest proportional representation of this ecosystem category for any of the study sub-units, although the Comox Sub-unit had more actual area mapped as this type. In total only four polygons exceeded 50 ha. The largest (125 ha) was at Mount Braden; two sites (59 ha and 58 ha) occurred around Mount McDonald, and one of 60 ha was north of Millstream Rd. in the Gowlland Ranges. A relatively high proportion of the terrestrial herbaceous units was mapped in this latter area and to the east around Mount Work. A few sites occurred within Mount Douglas Park.
Wetland6%
Riparian4%
Older Forest59%
Coastal Bluff4%
SV
Woodland14%
Terrestrial Herbaceous
12%
Figure 51: Relative proportion of sensitive
ecosystems in the Capital Sub-unit

Results: Capital Sub-unit
Sensitive Ecosystems Inventory: East Vancouver Island and Gulf Islands 89
Secondary ecosystems were common, especially woodlands which were identified for 112 of the polygons. A few polygons were complexed with other ecosystems including coastal bluffs and second growth or older forests. A high proportion (almost 40%) of the woodland units were field checked.
4.6.5 Wetland (WN) Wetlands were notably less frequent here than to the north. The 403 polygons identified comprised only 0.9% of the sub-unit. All of the wetlands were small; indeed only a single polygon exceeded 10 ha. Many wetlands in this area had been converted to agricultural use, and may have been included in the inventory as seasonally flooded agricultural fields. There were no concentrations of wetlands remaining anywhere within this sub-unit; they were generally widely scattered. Within the different wetland types identified, swamps were again by far the most abundant44 with 283 ha in 223 polygons mapped comprising well over half of all the wetlands in this area. The largest site was a swamp unit northeast of Sooke Lake. Swamps were often complexed with marsh ecosystems. Marshes were the next most abundant type with 83 polygons identified; all were very small, less than 4 ha. Several small estuaries and salt-marshes were mapped. Fens occurred in 63 polygons and occupied 83 ha; the largest was 6.3 ha west of Goldstream Lake. Twenty-five shallow water wetlands were mapped, seven bogs (all small) and a single wet meadow of 1.0 ha were identified. Field checking occurred in 34% of the polygons.
4.6.6 Riparian (RI) Riparian areas were also substantially less common than further north, and a total of 73 polygons comprising 382 ha or only 0.6% of the total sub-unit were mapped. Relatively mature riparian forests (i.e. those in structural stages 6 and 7) accounted for 10 polygons and 71 ha; a single, 4 ha polygon of stage 7 was identified. The remainder were in earlier seral stages, mainly, stages 4 and 5. Only seven polygons were greater than 10 ha. The largest was an area of 63 ha on Veitch Creek, and another stand of just over 20 ha was mapped on Waugh Creek. Both were structural stage 4 sites. Cottonwoods were noted as part of the cover for a single site of 8.9 ha west of Matheson Creek. Only two riparian units had secondary ecosystems identified – older forests in both cases. Field checking was conducted on 18 (25%) of the sites.
4.6.7 Woodland (WD) Woodlands were much more common in this sub-unit than further north. A total of 275 polygons were mapped totaling 1,156 ha. The majority of woodlands in this area had been converted since the mid-1880s into agricultural, residential and industrial areas. The average polygon size was very small (just over 4 ha), with only two polygons exceeding 50 ha. Both were a little under 100 ha, one was on Skirt Mountain, the other west of Munn’s
44 See section 2.6 for further discussion

Results: Capital Sub-unit
Sensitive Ecosystems Inventory: East Vancouver Island and Gulf Islands 90
Road at Fizzle Lake. An additional six polygons were larger than 20 ha. One of these was also at Fizzle Lake; the others were on Mount Helmcken, on Mill Hill, near Mount Work, on Mount Finlayson, and near Thetis Lake Park. Concentrations of woodland units occurred around the south end of the Gowlland Range, around Fizzle Lake, and around Mount Work (east of Third Lake) and Pease Lake. A number of small polygons, which together comprised over 26 ha, also occurred in Mount Douglas Park. Over a third of the polygons were actually complexes with secondary ecosystems, mostly terrestrial herbaceous. A few were complexed with forests or sparsely vegetated ecosystems. One third (90) of the woodland units were field checked.
4.6.8 Older Forest (OF) Older forests comprised a total of 5,032 ha or 8.1% of the total sub-unit within 104 polygons. This far exceeded representation in any other sub-unit. Average size was also much larger than in any other area at over 48 ha – a reflection of a number of particularly large polygons in this category. The largest stand was 1,227 ha, found northwest of Butchart Lake and east of Sooke Lake within the CRD water supply area. A number of other large polygons included over 532 ha south of Glinz Lake, 313 ha on Niagara Mountain, and 255 ha around Pike Lake. Most of the older forests identified in this inventory were on public lands. For example, moderate sized polygons occurred around Goldstream Park (141 ha), on DND lands in the Rocky Point area (134 ha), around Pearson College on DND lands (120 ha), in Francis King Park (59 ha), and two in Mount Douglas Park (52 and 41 ha). Other areas included Francis King Regional Park, Mill Hill, Mount Work, the Gowlland Range along Finlayson Arm, and the Begbie Lake area on the Saanich Peninsula. About a third of the polygons were complexes including other ecosystem types – mostly second growth forest. Only five sites were indicated to exceed 250 years; the rest were younger. Cottonwoods were dominant on one site. A total of 46 polygons were field checked.
4.6.9 Older Second Growth Forest (SG) Older second growth stands were extensive within the Capital Sub-unit occupying some 17.4% of the total land area within 124 mapped polygons. Average polygon size was 86.7 ha. Just under a third of the polygons were under 25 ha. Most were between 25 and 100 ha in size, whereas 15 were greater than 200 ha. The largest areas of second growth occurred in East Sooke Park in the area around Lubbe and Goldstream Lakes and through the Southern Warwick Range. Douglas-fir predominates in these stands. Eighteen percent (22) of the sites were field checked.
4.6.10 Seasonally Flooded Agricultural Field (FS) Flooded fields comprised 325 ha in 26 polygons. The average size was 12.5 ha, and the largest polygon mapped was 132 ha at Martindale Flats. Another large polygon of almost 62 ha was at Island View Beach Park. However, in total, only 6 polygons exceeded 10 ha. At least two of these – the Martindale Flats site and another 21 ha at Hastings Flats – are known to be important winter habitat for Trumpeter Swans. Just two polygons had secondary ecosystems mapped within them – wetlands in both cases. Four sites were field checked.

Results: Islands Sub-unit
Sensitive Ecosystems Inventory: East Vancouver Island and Gulf Islands 91
4.7 Islands Sub-unit
4.7.1 Summary data The Islands Sub-unit includes all the islands within the study area45, including Denman, Hornby and Lasqueti islands in the Northern Strait of Georgia. Figure 52 illustrates this sub-unit and the ecosystem data, including results for major islands, is presented in Table 7.
45 Texada Island, Quadra Island and the islands in Howe Sound are not part of this inventory.
V a n c o u v e r
I s l a n d
S t r a i t
o f
G e o r g i a
Denman I
Hornby I
Lasqueti I
Ballenas Islands
Winchelsea Islands
Jedediah I
20 0 20 40 Kilometers
Gabriola I
Valdes I
Galiano I
Mayne ISaturna I
Thetis I
Saltspring I
Sidney I
Pender IsPrevost I
Moresby I
Portland I
Kuper I
Victoria
Vancouver
#
#
#Nanaimo
#Qualicum Beach
pw
Figure 52: Islands Sub-unit and major islands

Results: Islands Sub-unit
Sensitive Ecosystems Inventory: East Vancouver Island and Gulf Islands 92
In the Islands area, only 7.8% of the land base was mapped as sensitive ecosystems with an additional 0.4% of seasonally flooded fields. Within the sensitive ecosystems identified, only the older forest category represented more than 3% of the Islands. Larger stands of older second growth forest 60 -100 year old were extensively represented with more area mapped here than for any of the other sub-units.
Table 7: Area (ha) of ecosystems in the Islands Sub-unit by major island46 Islands Sensitive Ecosystems Other
Ecosystems All
Ecosystems CB HT OF RI SV WD WN Total FS SG Total
Denman 23.2 4.1 286.7 11.4 0 0 165.2 490.6 64.0 1094.4 1649 Gabriola 8.0 3.8 0 0 0.4 4.4 28.9 45.5 43.1 218.2 306.8 Galiano 8.3 14.8 36.8 0 1.3 152.0 48.0 261.2 5.1 1283.8 1550.1 Hornby 1.9 24.2 104.6 0 15.1 16.6 1.0 163.4 14.5 572.6 750.5 Jedediah 23.2 9.8 146.0 0 0 0 0 179 0 46.1 225.1 Kuper 5.2 1.6 0 0 0 2.1 2.8 11.7 3.7 0 15.4 Lasqueti 107.9 100.8 282.2 14.9 0 40.6 56.8 603.2 0.5 1495.3 2099.0 Mayne 1.5 5.8 149.8 0 1.0 46.8 1.2 206.1 2.4 691.8 900.3 Moresby 9.0 4.6 0 0 0 11.9 0 25.5 0 476.0 501.5 Pender, N&S 10.6 13.0 71.0 0 23.0 119.4 9.2 246.2 7.0 654.5 907.7 Portland 8.9 6.1 0 0 0 5.4 0 20.4 0 167.6 188.0 Prevost 2.8 6.7 282.0 0 0 29.8 0.9 322.2 0 193.1 515.3 Salt Spring 37.7 261.0 527.5 1.8 7.2 184.6 85.3 1105.1 79.6 4240.4 5425.1 Saturna 12.1 134.2 65.7 2.9 0 79.8 7.1 301.8 0 932.3 1234.1 Sidney 8.2 19.4 26.0 0 53.4 9.4 8.0 124.4 0 373.1 497.5 Thetis 22.2 2.5 0 0 0 21.0 28.7 74.4 7.1 14.8 96.3 Valdes 32.4 4.3 22.0 5.5 0.1 1.5 16.8 82.6 0 853.8 936.4 Other islands 288.1 66.3 263.0 0 34.7 173.6 31.7 857.4 5.9 1203.3 2066.6 Total Islands 611.2 683.0 2263.3 36.5 136.2 898.9 491.6 5120.7 232.9 14511.1 19864.7
land area =65,158 ha or 16% of study area
Compared to the Vancouver Island portions of the study area, the Islands had by far the largest representation of coastal bluffs and moderate representation of the terrestrial herbaceous category. Many of the original CB and HT polygons were eliminated from the study area during the field checking phase because the vegetation was dominated by introduced grasses (in some cases, as much as 90% of the vegetation cover was introduced species). Sparsely vegetated ecosystems were mapped more often here; although overall, the actual area was still very low as these ecosystems are very rare everywhere. Older forests were well represented (Figure 53) compared to all areas except the Capital Sub-unit, and older second growth forests reached
46 No detailed analysis of these island statistics was undertaken. The data were included for completeness and because it was anticipated many users would find the information of interest.
Wetland10%
Riparian1%
Older Forest44%
Coastal Bluff12%
Sparsely Vegetated
3%
Woodland18%
Terrestrial Herbaceous
13%
Figure 53: Relative proportion of sensitive
ecosystems in Islands Sub-unit

Results: Islands Sub-unit
Sensitive Ecosystems Inventory: East Vancouver Island and Gulf Islands 93
their greatest proportional representation in the Islands. Wetlands, riparian ecosystems and flooded fields were all scarce.
4.7.2 Coastal Bluff (CB) Coastal bluffs reached their maximum extent in the Islands Sub-unit with a total of over 620 ha (0.9%) identified in 407 polygons. Almost all of them, however, were very small. Only three exceeded 10 ha; the largest bluff was 19.3 ha near Fiddlers Cove on Saturna Island. Other large bluffs were mapped near Lasqueti Island (Bull Island) and on the Ballenas Islands. Only 26 of the polygons were categorized as cliffs. Some islands had very high numbers of bluffs – Lasqueti, for example, had 119 polygons of this type mapped. Some 14% of the bluff polygons were complexed with other ecosystems; the vast majority of these were woodlands and a few included forested ecosystems. Less than 7% of the polygons were field checked.
4.7.3 Sparsely Vegetated (SV) Sparsely vegetated units were rare, and only 25 polygons were mapped totaling 136 ha or 0.2% of the sub-unit. Many islands had no SV ecosystems mapped at all. Only a single sand dune unit was identified – a 1.6 ha site at Tribune Bay on Hornby. A further 14 polygons were identified as spits. The largest, almost 39 ha, together with a smaller polygon of over 14 ha was in Sidney Spit Marine Provincial Park. Two additional spits of over 10 ha each occurred on James Island. The remaining 10 sites were mapped as cliffs; the largest of which, 23 ha, was on Pender Island. Two cliff units occurred on Hornby Island. Secondary ecosystems were identified in eight of the 25 polygons; these were mostly cliff units and were complexed mainly with second growth forest. Three of the sparsely vegetated sites were field checked.
4.7.4 Terrestrial Herbaceous (HT) Terrestrial herbaceous ecosystems were mapped in 159 polygons totaling 683 ha, (approximately 1% of the Islands). Over half of the polygons were mapped as ‘pure’ units; the rest are complexes, mainly with woodlands (38) and with older second growth forest (18). The largest polygon was over 80 ha on Saturna Island. Only four additional ones exceeded 20 ha – two of these (48 ha and 24 ha) were on Salt Spring Island and one of 23 ha on Jervis Island. A total of 24 polygons were field checked.
4.7.5 Wetland (WN) Wetlands were rare on the Islands, and most had experienced some level of disturbance such as ditching or draining. A total of 211 polygons were identified accounting for 491 ha. There were no major concentrations of wetlands on most of the Gulf Islands, and most of the wetland units found were small and scattered; only six polygons were greater than 10 ha. Denman Island was the exception, containing an extensive complex of wetlands that ran northwest to southeast down much of the island. This was a result of the island’s geological history, when folding and faulting of rock formed the linear ridges that run northwest to southeast. Glacial and post-glacial sediments filled the low-lying terrain between the ridges,

Results: Islands Sub-unit
Sensitive Ecosystems Inventory: East Vancouver Island and Gulf Islands 94
forming discontinuous wetlands. These formations are found to some extent on most of the Gulf Islands, but Denman boasted the largest wetland complex in the Islands Sub-unit. Unlike the other four sub-units, marshes rather than swamps were mapped most often with 86 polygons accounting for approximately 210 ha. The four largest marshes were all on Denman Island – two polygons (28 ha and almost 19 ha) at Morrison Marsh, over 20 ha at Pickles Road Beaver Pond, and over 17 ha at Swale Lake Farms. Swamp, fen, and shallow water-dominated wetlands were less common with 47, 35, and 30 polygons respectively. Swamps occupied just under 102 ha altogether, and the largest site was a little over 10 ha. Shallow water wetlands and fens occupied even less area, 80 and 66 ha respectively, and no sites exceeded 10 ha. Bogs and wet meadows were the most rare with only four polygons each on these islands accounting for 16 ha and 11 ha respectively. These were all very small sites. Secondary ecosystem components were variable and were identified in a total of only six polygons. Almost half of the sites were field checked.
4.7.6 Riparian (RI) Riparian areas were extremely rare on these dry, rocky islands and were mapped for only six polygons comprising 36.4 ha or less than 0.1% of the total Islands area. The largest polygon was just under 15 ha on Lasqueti Island near Bull Passage. No areas of old or structural stage 7 were identified anywhere. A single polygon of stage 6 was mapped at Fillongley Creek on Denman Island. None of the riparian polygons were field checked.
4.7.7 Woodland (WD) Woodlands were relatively frequent with 260 polygons mapped totaling almost 900 ha. Again they were generally very small with an average size of less than 4 ha. Only three of them exceeded 20 ha – two units on Salt Spring Island (one of over 40 ha at Burgoyne Bay and one of 33 ha on the southwest side of Mount Tuam), and one area of 22 ha on Galiano Island at Phillimore Point. The most northerly woodlands occurred on Lasqueti Island and the adjacent offshore islets. Many of the smaller islands in the area – such as Winchelsea Island and the Ballenas Islands – supported woodland ecosystems. These woodland units were frequently mapped with coastal bluffs as a secondary ecosystem. A few had terrestrial herbaceous or older second growth forest identified as secondary ecosystems also. In all, well over a half of the polygons had other ecosystems included within them. About 10% of the woodland units were field checked.
4.7.8 Older Forest (OF) Older forests comprised a total of 2,263 ha or 3.5% of the area within 125 polygons. There were numerous small stands but no really large ones, and average polygon size was just over 18 ha. The largest stand was 87 ha on Salt Spring Island near Burgoyne Bay. Other relatively large areas included 85 ha on Mayne, 72 ha near Selby Cove on Prevost Island, 70 ha near Little Bay on Pender Island and 70 ha on Jedediah Island.

Results: Islands Sub-unit
Sensitive Ecosystems Inventory: East Vancouver Island and Gulf Islands 95
Secondary ecosystems occurred in over half of the polygons. Older second growth forests were the typical inclusion, but terrestrial herbaceous units were also common within older forest polygons. A little under a third of the polygons were field checked.
4.7.9 Older Second Growth Forest (SG) In this sub-unit, 22.3% was mapped under this category within 337 polygons. Of the five sub-units, the Islands area had the highest percentage of older second growth stands. The average polygon size was smaller than for the other areas at 43 ha. This was partly a reflection of the fact that the many small islands inevitably only supported relatively small polygons and partly because of the systematic inclusion of smaller second growth polygons in this area in contrast to some sub-units. Older second growth stands were mapped for almost all of the islands with a relatively large representation on Lasqueti, Salt Spring, Denman and Hornby. All of Newcastle Island was also included. Over 40% of the forested polygons in this category were identified as having a significant deciduous component. This was much higher than for the other study areas. Secondary ecosystems were identified in under half of the polygons with terrestrial herbaceous and older forest ecosystems being the most common. Coastal bluffs were identified as secondary components in 16 polygons, woodlands in six. Almost 14% of the units were field checked.
4.7.10 Seasonally Flooded Agricultural Field (FS) Flooded fields had minimal representation in the Islands where 233 ha were identified in 52 polygons. Mean polygon size was less than 5.0 ha. Only five of the polygons exceeded 10 ha. The largest, at 29 ha, was at Swale Lake Farms on Denman Island. Other relatively large sites, also on Denman Island, were at Madigan Swale (15.2 ha) and in Strachan Valley (14.5 ha). Some islands had none or almost none. For example, on Lasqueti (a relatively large island) only a single polygon of 0.5.ha was mapped. Only one of the 52 polygons had a secondary ecosystem identified within it – a wetland marsh. Almost half of the sites were field checked.

Results: Islands Sub-unit
Sensitive Ecosystems Inventory: East Vancouver Island and Gulf Islands 96

Conclusions and Future Directions
Sensitive Ecosystems Inventory: East Vancouver Island and Gulf Islands 97
Section 5 Conclusions and Future Directions The Sensitive Ecosystems Inventory project set out to systematically identify, classify, and map remaining rare and fragile terrestrial ecosystems and other habitats of high biodiversity value on eastern Vancouver Island and the adjacent Gulf Islands. Five years later, those objectives have been largely met. The project has accumulated a solid inventory base that is being used to assist in sound land management decisions. The categories and classifications applied provide a preliminary identification of habitats which can be further investigated as required. The hardcopy and digital maps and associated database that have been produced provide a user-friendly medium for identifying remaining sensitive areas and important wildlife habitats. These products are intended for use as a flagging tool for locating sensitive ecosystems. These fragile ecosystems need to be considered carefully in any land management decisions that may affect them. The digital products permit users to develop any number of interpretations and tailor products to suit their own purposes. GIS analyses can be conducted by using any combination of administrative area or SEI database category. The resulting information may be used proactively in a variety of planning exercises, as an aid to identifying potential impacts of proposed developments upon the environment, and as a tool in identifying and selecting sites for protection and possible stewardship programs. The information generated during this project provides valuable scientific data that can be used as an effective tool in the land use planning process. The existence of the maps does not, however, reduce the need for further professional assessments. SEI data are not intended to be substitutes for a site-specific on-the-ground inventory and evaluation that are necessary steps before land use planning decisions can be finalized. In many cases, when any new land use or change in status is being considered, an on-site assessment by a professional is necessary to identify the ecological significance of the site under consideration, in relation to provincial, regional and local goals and conditions. An evaluation of the ecological condition of the site, of likely impacts, and of ways of avoiding or mitigating impacts may be required, depending upon the significance of the site and the nature of the proposed development. The Conservation Manual47, the companion volume to this report, describes the range of values inherent in the nine ecosystems mapped, presents management guidelines pertaining to each ecosystem and describes mechanisms and tools which are available for their conservation. Other extension materials and outreach services are being developed Including training programs for consultants, students, planners and resource agency personnel to improve the SEI assessment capability within a variety of sectors. Scientific support for SEI users is also available in the short term to assist regional and municipal governments, land trusts, conservancy groups, contractors, developers, First Nations, educational institutions and others in the interpretation of the SEI data. It is particularly important to work with local governments to promote the activation and use of various protection tools available to them as they develop conservation, growth and land use plans and strategies. Other materials are being produced to enhance the public’s understanding of the importance and ecological significance of the sensitive ecosystem sites. An SEI web site is being developed and will
47 McPhee et al. in progress.

Conclusions and Future Directions
Sensitive Ecosystems Inventory: East Vancouver Island and Gulf Islands 98
provide access to all SEI publications including interactive maps, and educational information on sensitive ecosystems and how to protect them. Within the context of the ecosystems considered most important, the inventory identified and mapped almost all remaining sensitive terrestrial ecosystems greater than 0.5 ha in size. The SEI did not identify every site of possible interest, as sites smaller than one-half hectare were usually not recorded. This does not imply that these sites are not important. Many small backyard ponds, for example, provide very important habitat for wildlife and should be fully considered within proposed developments. Similarly, there are many areas of older second growth forest that were too small to identify at the project scale but which provide important habitats for many wildlife species. Results of this inventory reconfirm that rare and fragile habitats are fast disappearing. Inventory results show that at the present time less than 8% of the entire study area is considered as sensitive ecosystems. Even many areas within this are already substantially degraded by fragmentation, human use, and introduced species. The need to treat all of the sites seriously and to fully evaluate all possible land use options and their implications before initiating any changes is critical. Most sites within the urban, suburban, and agricultural portions of the area are isolated fragments of the original distribution of native vegetation. With 85% of Vancouver Island’s population living in the study area, in many cases the only unmodified vegetation communities are now in areas where public access has been severely restricted, either by natural terrain and topographic features, or by legal designation. Consequently, the communities are often concentrated in relatively rugged and remote areas, or in and around existing protected areas. Many of the sensitive ecosystem sites identified are at high risk of conversion to other uses or degradation by invasive non-native species and human recreation. All governments and citizens have a role to play in safeguarding the values of the sensitive ecosystems identified. The Capital and Islands sub-units harbour the bulk of remaining native woodlands, the majority of the coastal bluffs, and by far the greatest representation of older forests, as well as extensive tracts of older second growth forest. However, these two sub-units have minimal representation of riparian and wetland ecosystems and of flooded fields, although some important sites do occur. In contrast, the most northerly part of the study area – the Comox Sub-unit– has very little coastal bluff and effectively no woodlands but has the largest proportion of wetland and riparian ecosystems. The Nanaimo and Cowichan sub-units lie between these extremes with moderate representation of almost all types, although, between them, they harbour the great majority of the flooded field ecosystems of value to wildlife. Compared to the Capital Sub-unit, the three more northerly sub-units on Vancouver Island are significantly less urbanized and provide a perception of extensive green space and naturalness. Results of this inventory, however, indicate that this interpretation is misleading. The distinct lack of older forests is no doubt a result of the combined influence of a number of factors including: • agricultural clearing around the turn of the century, • major fires, especially in the Comox Sub-unit, in the 1930s • a heavy reliance within these areas on the forest industry so that logging this century has
been extensive,

Conclusions and Future Directions
Sensitive Ecosystems Inventory: East Vancouver Island and Gulf Islands 99
• increasing urbanization and human population pressures, • poorly developed regional parks systems, and • a lack of awareness – by the public and government alike – of the issues involved. Through the provision of the scientific information, extension materials and outreach programs, the SEI project will help to redress this last factor by raising general awareness of the issues and, in addition, will assist decision makers in making informed, sound land use decisions. The extreme paucity and fragmentation of sensitive ecosystems in eastern Vancouver Island and the Gulf Islands underscores the need for more integrated land use planning and the urgency of protecting and conserving the remaining sensitive areas and high value wildlife habitats. If these ecosystems, and the wildlife they support, are indeed considered an important part of the quality of life of the communities within the study area, they must receive some form of protection. Further reduction or degradation of the ecosystems cannot be made without knowing that such actions will ultimately affect their remaining wildlife populations, and forever change the natural amenities important both to the people that live in the study area and those the eco-tourism trade tries to attract here. The SEI project has provided the initial step. From here, it is up to local governments, First Nations, community groups, and members of the public in cooperation with the private sector to translate the information and tools provided into sound land management practices.

Conclusions and Future Directions
Sensitive Ecosystems Inventory: East Vancouver Island and Gulf Islands 100

References
Sensitive Ecosystems Inventory: East Vancouver Island and Gulf Islands 101
References Agee, J.K. 1991. “Fire History of Douglas-fir Forests in the Pacific Northwest”. In USDA
Department of Agriculture: Wildlife and vegetation of unmanaged Douglas-fir forests. USDA Dept. of Agriculture. Pacific Northwest Research Station, Oregon.
Agriculture Canada Expert Committee on Soil Survey. 1987. The Canadian System of
Soil Classification, 2nd ed. Agriculture Canada. Ottawa, Ontario. Brubaker, L.B. 1991. “Climate Change and the Origin of Old-growth Douglas-fir Forests in
the Puget Sound Lowland.” In USDA Department of Agriculture: Wildlife and vegetation of unmanaged Douglas-fir forests. USDA Dept. of Agriculture. Pacific Northwest Research Station. Oregon, U.S.A.
Campbell, R. Wayne, Neil K. Dawe, Ian McTaggart-Cowan, John M. Cooper, Gary W.
Kaiser, Michael C. E. McNall. 1990. The Birds of British Columbia. Volume 1. Royal British Columbia Museum and Environment Canada, Canadian Wildlife Service. Victoria, B.C.
Cannings, R. and S. Cannings. 1996. British Columbia: A Natural History. Greystone
books, Douglas & McIntyre. Vancouver, B.C. Capital Regional District / Provincial Capital Commission. 1996. Green Blue Spaces
Strategy. The Distribution and Conservation Significance of Sensitive Ecosystems Inventory Sites in Greater Victoria. Unpublished paper presenting results of a CRD Parks Analysis of Preliminary SEI Data for Greater Victoria.
Christy, R.E. and S.D. West. 1993. Biology of bats in Douglas-fir forests. USDA Forest
Service, Pacific Northwest Research Station. General Technical Report PNW-GTR-3098. Portland, Oregon.
Conservation Data Centre. 1993. Garry Oak Ecosystems Information Brochure. Province of
British Columbia, Ministry of Environment, Lands and Parks. Victoria, B.C. Demarchi, D.A. 1996. An Introduction to the Eco-regions of British Columbia. Wildlife
Branch, Ministry of Environment, Lands and Parks. Victoria, B.C. Draft. Dunster, J. and K. Dunster. 1996. Dictionary of Natural Resource Management. UBC Press.
Vancouver, B.C. Ecosystem Working Group. 1995. Standards for Terrestrial Ecosystem Mapping in B.C.
Review Draft. Resources Inventory Committee. Terrestrial Ecosystems Task Force. Victoria, B.C.
Eng, M. 1992. Protected areas on Vancouver Island: An Analysis of Gaps in Representation
for Conservation Purposes. Ministry of Forests, 1991/1992 Progress report. Victoria, B.C.

References
Sensitive Ecosystems Inventory: East Vancouver Island and Gulf Islands 102
Environment Canada. 1993. Canadian Climate Normals, 1961-90. British Columbia, Environment Canada. Ottawa, Ontario.
Erickson, W.R. 1996. Classification and Interpretation of Garry-oak Plant Communities and
Ecosystems in Southwestern British Columbia. Masters Thesis. University of Victoria. Victoria, B.C.
Foster, J.B. 1980. “The role of Ecological Reserves in Protecting Threatened Species and
Habitats in British Columbia”. In Stace-Smith, R., L. Johns, and P. Joslin (eds.). 1980. Threatened and Endangered Species and Habitats in British Columbia and the Yukon. B.C. Ministry of Environment, Fish and Wildlife Branch. Victoria, B.C.
Green, R.N. and K. Klinka. 1994. A Field Guide for Site Identification and Interpretation for
the Vancouver Forest Region. Land Management Handbook No. 28. B.C. Ministry of Forests. Victoria, B.C.
Harcombe, A.P. and E. T. Oswald. 1990. Vegetation Resources of Vancouver Island.
Volume 1, Forest Zonation, Ministry of Environment, Technical Report 27, B.C. Ministry of Environment. Victoria, B.C.
Hebda, R.J. and F. Aitkens (Eds.). 1993. Garry Oak-meadow Colloquium. Proceedings.
Garry-Oak Meadow Preservation Society. Victoria, B.C. Hunter, R. 1980. “Threatened Coastal Habitats”. In Stace-Smith, R., L. Johns, and P. Joslin
(eds.). 1980. Threatened and Endangered Species and Habitats in British Columbia and the Yukon. B.C. Ministry of Environment, Fish and Wildlife Branch. Victoria, B.C.
Jungen, J.R., P. Sanborn, P.J. Christie. 1985. Soils of Southeast Vancouver Island,
Duncan-Nanaimo Area. MOE Technical Report 15. B.C. Ministry of Environment, Ministry of Agriculture and Food. Victoria, B.C.
Kenney, E.A., L.J.P. van Vliet, A.J. Green. 1988. Soils of the Gulf Islands of British Columbia
Volume 2 Soils of North Pender, South Pender, Prevost, Mayne, Saturna, and Lesser Islands. Report 43 of the British Columbia Soil Survey. Research Branch, Agriculture Canada. Vancouver, B.C.
Klinka, K., F.C. Nuszdorfer, and L. Skoda. 1979. Biogeoclimatic units of Central and
Southern Vancouver Island. B.C. Ministry of Forests. Victoria, B.C. Krajina, V. J. 1965. Biogeoclimatic zones and classification of British Columbia. Ecol. of
Western N. A. 1:1 - 17. Luttmerding, H.A., D.A. Demarchi, E.C. Lea, D.V. Meidinger, and T. Vold. 1990.
Describing Ecosystems in the Field (Second Edition). MOE Manual 11. Province of British Columbia, Ministry of Environment, Lands and Parks, in cooperation with Ministry of Forests. Victoria, B.C.
Madrone Consultants Ltd. 1993. Bamberton: Biological Inventory and Evaluation. 1992-
1993. Madrone Consultants Ltd. for South Island Development Corporation. Duncan, B.C.

References
Sensitive Ecosystems Inventory: East Vancouver Island and Gulf Islands 103
McCullough, D. and B. Mason. 1996. Using Geo-Technologies to Develop a Land-Use Planning Tool. Paper presented at GIS Conference, Vancouver March 1996
McCullough, Dwight and Kathleen Moore. 1995. Issues and Methodologies in Integrating
Aerial Photography and Digital Base Maps. In: Geo Info Systems, March 1995, p. 46-50.
McKenzie, W, A. Banner, D. Fraser and A. Harcombe. 1996. An Ecological Classification
Framework for British Columbia - Working Draft, Version 3.0. Forest Renewal B.C. Project BI016. Resources Inventory Committee (Terrestrial Ecosystems Task Force) and B.C. Wetlands Working Group. Victoria, B.C.
McKenzie, W, and A. Banner. 1998. A Wetland and Riparian Ecosystem Classification
Framework (WREC) for British Columbia. Unpublished draft. McMinn, R.G., S. Eis, H.E. Hirvonen, E.T. Oswald, and J.P. Senyk. 1976. Native
Vegetation in British Columbia’s Capital Region. Environment Canada, Forestry Service. Victoria, B.C
McPhee, M., L. Wolfe, N. Page, K. Dunster and I. Nykwist. in progress. Sensitive
Ecosystems Inventory: East Vancouver Island and Gulf Islands, 1993-1997. Volume 2: Conservation Manual.
Meidinger, D. and J. Pojar [eds.]. 1991. Ecosystems of British Columbia. Special Report
Series No. 6. B.C. Ministry of Forests. Victoria, B.C. Ministry of Environment, Lands and Parks and Ministry of Forests. 1998. Field Manual
for Describing Terrestrial Ecosystems. Province of British Columbia. Ministry of Forests, Research Branch. 1994. Biogeoclimatic Units of the Vancouver Forest
Region: Southern Vancouver Island and Sunshine Coast. Map 5 of 6. Nanaimo, B.C. Mosquin, T. and C. Suchal (Eds.). 1977. Canada’s Threatened Species and Habitats.
Proceedings of the Symposium on Canada’s Threatened Species and Habitats. Canadian Nature Federation and World Wildlife Fund (Canada). Ottawa, Ontario.
Nuszdorfer, F.C., K. Klinka, and D.A. Demarchi. 1991. “Coastal Douglas-fir Zone”. In
Meidinger, D. and J. Pojar. 1991. Ecosystems of British Columbia. B.C. Ministry of Forests. Victoria, B.C.
Parminter, J. 1992. Typical Historic Pattern of Wildlife Disturbance by Biogeoclimatic Zone.
B.C. Ministry of Forests. Victoria, B.C. Pojar, J. 1980a. “Threatened forest ecosystems of British Columbia”. In Stace-Smith et al.,
(Eds.). 1980. Threatened and Endangered Species and Habitats in British Columbia and the Yukon. B.C. Ministry of Environment, Fish and Wildlife Branch. Victoria, B.C.
Pojar, J. 1980b. “Threatened habitats of rare vascular plants in British Columbia”. In Stace-
Smith et al., (Eds.). 1980. Threatened and Endangered Species and Habitats in British Columbia and the Yukon. B.C. Ministry of Environment, Fish and Wildlife Branch. Victoria, B.C.

References
Sensitive Ecosystems Inventory: East Vancouver Island and Gulf Islands 104
Pojar, J. 1990. Old-growth Forests and Biological Diversity in British Columbia. Paper presented
at Symposium on “Landscape Approaches to Wildlife and Ecosystem Management”, May 3-6 1990. University of British Columbia. Ministry of Forests, Prince Rupert Forest Region and Research Branch. Victoria, B.C.
Pojar, J. 1993. “Terrestrial Diversity of British Columbia”. In Fenger, M.A., E.H. Miller, J.A,
Johnson, and E.J.R. Williams (Eds). Our Living Legacy. Proceedings of a Symposium on Biological Diversity. Victoria, B.C.
Prentice, A.C. and W.S. Boyd. 1988. Intertidal and Adjacent Upland Habitat in Estuaries
Located on the East Coast of Vancouver Island - a Pilot Assessment of Their Historical Changes. Technical Report Series No. 38, Canadian Wildlife Service, Pacific and Yukon Region. British Columbia.
Radcliffe, G. and H. Reid. 1997. Inventory of Proposed Wood Lots: Salt Spring Island and
Ladysmith. Madrone Consultants Ltd. for B.C. Environment. Nanaimo, B.C. Radcliffe, G., G. Porter, and J. Teversham. 1994. Ecological Assessment of Department of
National Defence Properties (C.F.B. Esquimalt), Vancouver Island. Madrone Consultants Ltd. for Department of Natural Resources and Department of National Defense. Duncan, B.C.
Roemer, H.L. 1972. Forest Vegetation and Environments of the Saanich Peninsula, Vancouver
Island. Ph.D. Thesis. University of Victoria. 405 p. Roemer, H.L., J. Pojar and K.R. Joy. 1988. “Protected old-growth forests in coastal British
Columbia.” In Natural Areas Journal. Vol. 8(3): 146-159. Ryan, M., G. Radcliffe and G. Butt. 1995. Ecological Assessment of Royal Roads Property
C.F.B. Esquimalt, Vancouver Island. Madrone Consultants Ltd. for Department of Natural Resources and Department of National Defence. Duncan, B.C.
Shepard, J.H. 1995. The Status of Butterflies of Conservation Concern on Southeastern
Vancouver Island and the Adjacent Gulf Islands, Draft report to B.C. CDC. Ministry of Environment, Lands and Parks. Victoria, B.C.
Statistics Canada. 1996 Census. Prepared by Population Section, B.C. Stats, Ministry of
Finance and Corporate Relations, Province of British Columbia. Turner, N.J. and H.V. Kuhnlein. 1983. Camas (Camassia spp.) and Riceroot (Fritillaria spp.):
two Liliaceous “root” foods of the Northwest Coast Indians. In Ecology of Food and Nutrition. 1983. Vol 13: 199-219.
Turner, N.J. 1991. Burning Mountainsides for Better Crops: Aboriginal Landscape Burning in
British Columbia. Draft paper. Environmental Studies Program, University of Victoria. Victoria, B.C.
van Vliet, L.J.P., A.J. Green and E.A. Kenney. 1987. Soils of the Gulf Islands of British
Columbia Volume 1 Soils of Salt Spring Island. Report 43 of the British Columbia Soil Survey. Research Branch, Agriculture Canada. Vancouver, B.C.

References
Sensitive Ecosystems Inventory: East Vancouver Island and Gulf Islands 105
Yorath and Nasmith. 1995. The Geology of Vancouver Island. Orca Book Publishers. Victoria,
B.C.

Glossary
Sensitive Ecosystems Inventory: East Vancouver Island and Gulf Islands 106
Glossary48 Agronomic: Of or relating to soil management and crop production. Biodiversity (biological diversity): The variety, distribution and abundance of different plants, animals, and other living organisms in all their forms and levels of organization, including genes, species, ecosystems, and the evolutionary and functional processes that link them. Biogeoclimatic ecosystem classification (BEC): A hierarchical classification scheme having three levels of integration - regional, local, and chronological - and combining three classifications - climatic, vegetation, and site. Biogeoclimatic zone: A geographic area having similar patterns of energy flow, vegetation and soils as a result of a broadly homogenous macro-climate. Biota: All of the living organisms (plants, animals, fungi and micro-organisms) found within a given area. Blue-listed species: those considered provincially vulnerable. See vulnerable/sensitive species Bluff: A steep precipitous slope of great lateral extent compared to its height. Bog: A wetland ecosystem made up of in-situ accumulations of peat, slightly or moderately decomposed, derived primarily from sphagnum moss. Bog water is acidic, usually at or very near the surface, and is unaffected by groundwater from adjacent soils. Climax community: the final stage of a plant succession, in which vegetation reaches a state of equilibrium with the environment. Coastal bluff: An ecosystem type containing grasses and herbaceous vegetation associated with the shoreline; includes rocky islets and herbaceous communities forming in vernal pools and seepage areas. Community: A group of living organisms connected by ecological processes to a particular ecosystem. Complexed polygon: SEI polygon containing a mosaic of primary and secondary ecosystem components which are too small to delineate separately (section 3.3.2). Conifer: Cone-bearing trees having needles or scale-like leaves, usually evergreen. Deciduous: Term applied to trees, commonly broadleaf, which usually shed their leaves annually. (Note that some conifers are also deciduous, e.g. larch).
48 Many definitions are extracted or adapted from the Dictionary of Natural Resource Management (Dunster and Dunster 1996).

Glossary
Sensitive Ecosystems Inventory: East Vancouver Island and Gulf Islands 107
Disturbance: A discrete force that causes significant change in structure or composition through natural events such as fire, flood, wind or earthquake; mortality caused by insect or disease outbreaks; or by human-caused events such as the harvest of a forest. Dominant 1: A plant or group of plants which by their collective size, mass or number, exert the most influence on other components of the ecosystem. Dominant 2 (Crown Class): Trees with crowns extending above the general level of the canopy and receiving full light from above and partly from the side; taller than the average trees in the stand with crowns well developed. Ecoplots: For the SEI project, those sites inventoried using Ecosystem Field Forms as described in Field Manual for Describing Terrestrial Ecosystems, 1998. These forms contain more detailed information on site, soil and vegetation than found on the SEI Groundtruthing forms. Ecoprovince: In Ministry of Environment, Lands and Parks Ecoregion Classification system (Demarchi), an area of consistent climate or oceanography, and physiography, useful for provincial-overview planning, and further divided into Ecoregion and Ecosection. There are nine terrestrial and one marine Ecoprovinces in B.C. The SEI study area lies within the Georgia Depression Ecoprovince. Ecoregion: Areas with major physiographic, minor micro-climatic or oceanographic differences within each ecoprovince. Ecoregions can be used to group biogeoclimatic or marine zones for the determination of historical and potential distribution of vegetation and wildlife. The SEI study area lies within the Eastern Vancouver Island (EVI) and Georgia-Puget Basin (GPB) Ecoregions. Ecosection: Areas with minor physiographic, climatic and oceanographic differences. Each Ecosection has a unique sequence of Biogeoclimatic subzones and marine zones. The SEI study area lies within the following Ecosections: Nanaimo Lowland (NAL), Southern Gulf Islands (SGI), and Strait of Georgia (SOG). Ecosystem: A functional unit consisting of all the living organisms (plants, animals, and microbes) in a given area, and all the non-living physical and chemical factors of their environment, linked together through nutrient cycling and energy flow. An ecosystem can be of any size - a log, pond, field, forest, or the earth’s biosphere - but it always functions as a whole unit. Ecosystems are commonly described according to the major type of vegetation, for example, forest ecosystem, old-forest ecosystem, or range ecosystem. For the SEI project, ecosystem has been defined as a portion of landscape with relatively uniform dominant vegetation. Endangered species: An indigenous species of flora or fauna that is threatened with imminent extirpation or extinction. Threatened and endangered species are referred to as “red-listed” by the CDC. Endemic species: A native species, not introduced and often with a limited geographical range. Extant: Now in existence.

Glossary
Sensitive Ecosystems Inventory: East Vancouver Island and Gulf Islands 108
Extirpation: The elimination of a species or sub-species from a particular area, but not from its entire range. Fauna: Animal life of a region or geological period. Fen: A landscape of low-lying peat land, made up in part of well-decomposed sedge (sometimes moss) materials, where the water is at or near the surface and fed by relatively fast-moving, nutrient-rich groundwater that is usually neutral or alkaline and rich in calcium. Forb: A herbaceous plant with broad leaves, excluding the grasses and grass-like plants. GIS: Geographic Information System - The use of a computer system to overlay large volumes of spatial data of different kinds. The data are referenced to a set of geographical coordinates and encoded in computer (digital) format so that they can be sorted, selectively retrieved, statistically and spatially analyzed. Gleying: A soil characteristic caused by poor soil aeration in saturated soils; soil is typically grey in colour interspersed with yellow, orange, or rusty brown mottles or streaks (Dunster). Gullies: Small valleys or ravines, through which water normally runs only after a period of rainfall or snowmelt. Habitat: Those parts of the environment on which an organism depends, directly or indirectly, in order to carry out its life processes. Herbaceous: Herb-like. Describing a plant that contains little permanent woody tissue. The aerial parts of the plant die back after the growing season. In annuals, the whole plant dies; in perennials the plant has organs (e.g. bulbs or corms) that are modified to survive beneath the soil in unfavorable conditions. Lacustrine: Pertaining to lakes. Marsh: An area of low-lying land, poorly drained, periodically or permanently inundated with standing or slow-moving, nutrient-rich water, and subject to seasonal fluctuations. Micro-climate: The climate in the immediate surroundings, especially insofar as this differs significantly from the general climate of the region. Microsite: The smallest measurable unit of habitat; the specific site occupied by an organism and the special relationship between this organism and its environment. Also, a small area that exhibits localized characteristics different from the surrounding area. For example, the microsites created on a rock outcrop by areas with shallow pockets of soil, or the shaded and cooled areas created on a site by the presence of slash. Mono restitution: A process used during digitizing of air photos by which natural distortions in the photos are corrected, and the photos made spatially accurate when the image is transferred onto a digital base map.

Glossary
Sensitive Ecosystems Inventory: East Vancouver Island and Gulf Islands 109
Old-growth forest: The age and structure of old-growth forests vary considerably by forest type. On the Pacific coast of North America, old-growth characteristics begin to appear in unmanaged forests at 175 to 250 years of age. Older forest: Forested ecosystem with dominant age class greater than 100 years. Older second growth forest: Forested ecosystem with dominant age class 60-100 years. Plant association: a unit of vegetation with a relatively uniform species composition and physical structure. Plant associations also tend to have characteristic environmental features such as bedrock geology, soil type, topographic position, climate, and energy, nutrient and water cycles. The more general term ‘plant community’ also refers to plant association. Polygon: A series of points that are joined to form an unbroken line delineating the perimeter of an area (e.g. ecosystem) on a map. A polygon is used to graphically represent and sort the features of an area by various attributes. Primary ecosystem: A polygon is often a mosaic of two or more ecosystem types. The primary ecosystem is the dominant one, occupying the greater percentage of polygon area. Red-listed species: See Threatened or endangered species. Riparian: Pertaining to anything connected with or immediately adjacent to the banks of a stream or any other body of water. Scarified: The physical or chemical modification of a hard seed to make it permeable or the mechanical disturbance of the forest floor to create better growing conditions for the germination of seeds. Scarp slopes: A steep slope produced by the differential erosion or faulting of the bedrock. Seasonally flooded agricultural fields: Land primarily used for agriculture that is periodically inundated by surface water, thereby creating valuable overwintering habitat for waterfowl. Secondary ecosystem: Term used in the SEI to describe the presence of more than one ecosystem type within one polygon; the ecosystem that occupies the lesser area. See also Primary ecosystem and Complexed polygon Sensitive ecosystem: Term used in the SEI; ecosystems that are considered fragile and/or rare. Seral stage: a phase in the sequential development of a climax community. Soil parent material: The unaltered or essentially unaltered mineral or organic material from which the soil profile develops by pedogenic processes. Sparsely vegetated: For the SEI project, an ecosystem containing sparse vegetation, further divided into cliff, sand dune, and spit sub-units.

Glossary
Sensitive Ecosystems Inventory: East Vancouver Island and Gulf Islands 110
Subzone: A more site specific level of the biogeoclimatic classification system than the biogeoclimatic zone. Subzones describe the zonal/or climax vegetation, and corresponding climate and soil. Succession: a series of dynamic changes in ecosystem structure, function, and species composition over time as a result of which one group of organisms succeeds another through stages leading to a potential natural community or climax stage. Swamp: A type of wetland where trees or tall shrubs dominate a landscape characterized by periodic flooding. Swamps have a nearly permanent, sub-surface, nutrient-rich water flow. Terranes: Area of the lithosphere distinguished by a certain assemblage of rock types. Terrestrial herbaceous: An ecosystem type containing natural grassland or bryophyte-dominated vegetation, including rock outcrop/grassland and rock outcrop/moss community types Threatened or endangered habitats: Ecosystems that are: • restricted in their distribution over a natural landscape (e.g., freshwater wetlands within
certain biogeoclimatic) or are restricted to a specific geographic area or a particular type of local environment; or,
• ecosystems that were previously widespread or common but now occur over a much smaller area due to extensive disturbance or complete destruction by such practices as intensive harvesting or grazing by introduced species, hydro projects, dyking, and agricultural conversion.
Threatened or endangered species: An indigenous species of flora or fauna that is likely to become endangered if the factors affecting its vulnerability do not become reversed. Threatened and endangered species are referred to as “red-listed” by the CDC. Type: To delineate ecosystem boundaries on an air photo or map. Vernal pool: A temporary body of freshwater that is filled by spring rains and snowmelt, only to dry up during the hot summer months. Many vernal pools are filled again by autumn rains, and may persist throughout the winter. Typically small and shallow. Vulnerable/sensitive species: Indigenous species that are not threatened but are particularly at risk because of low or declining numbers. These species are identified as “blue listed” by the CDC. Watershed: An area of land that collects and discharges water into a single main stream through a series of smaller tributaries. Wetland: An area of land inundated by surface water and groundwater frequently enough to support a prevalence of vegetation and aquatic life that require saturated or seasonally saturated soil conditions for growth and reproduction. Woodland: An open forest dominated by deciduous trees with canopy closure < 50%.

Appendix 1: Inventory Products
Sensitive Ecosystems Inventory: East Vancouver Island and Gulf Islands 111
Appendix 1: Inventory Products The inventory stage of the SEI project has resulted in three main user products: hardcopy maps; Arc/Info GIS files; and stand-alone electronic databases. Hardcopy maps The full set of SEI maps for East Vancouver Island and Gulf Islands includes sixty-six full colour maps at a scale of 1:20,000, each measuring 78.7 cm x 91.5 cm. They are organized by the standard TRIM map grid and are available for purchase from: Clover Point Cartographics, #202 - 919 Fort Street, Victoria, B.C., V8V 3K3. Phone: (250) 384-3537, Fax: (250) 384-2679. (Please refer to index below when ordering)
Trent Denman Hornby E.Hornby NW Lasq. NE Lasq.
Fanny Browser SW Lasq. SE Lasq.
Horne Qualicum Parksville Bellenas
Swane Englishman Nanoose Departure
Nanaimo W.Gab. E.Gab.
Nan. Lake Cassidy Valdes N.Gal.
Ladysmith Kuper Galiano E.Gal.
Cowichan Inwood Chemainus Ganges Mayne N.Sat.
Paldi Duncan Tuam Pender Satuma
Shawnigan Sidney James
Leech Saanich View
River Rodd Victoria
Sooke Metchosin
92K.023 92K.024
92K.013 92K.014
92K.003 92K.004
92F.093 92F.094 92F.095
92F.084 92F.085
92F.075 92F.076
92F.065 92F.066
92F.055 92F.056 92F.057 92F.058 92F.059 92F.060
92F.046 92F.047 92F.049 92F.050
92F.037 92F.038 92F.039 92F.040
92F.028 92F.029 92F.030 92G.021
92F.020 92G.011 92G.012
92F.010 92G.001 92G.002 92G.003
92B.091 92B.092 92B.093 92B.094
92C.090 92B.081 92B.082 92B.083 92B.084 92B.085
92B.071 92B.072 92B.073 92B.074 92B.075
92B.062 92B.063 92B.064
92B.052 92B.053 92B.054
92B.042 92B.043 92B.044
92B.032 92B.033
SEI Plots September 1997 Series
Sheets completed with SEI polygons, text, and legend informationIndicate the number of copies within each square.All 1:20000 sheets are $18 each plus GST.Additional copies of any sheet made on the same order are $12 each plus GST.Fax this order sheet to Clover Point Cartographics 384-2679
Return Address
Courier and account
Total Sheets
@ $18 =
@ $12 =
GST =
Total Invoice

Appendix 1: Inventory Products
Sensitive Ecosystems Inventory: East Vancouver Island and Gulf Islands 112
Arc/Info files and Electronic Databases For users with GIS capability, the data is available in three formats: Arc/Info coverage (129MB), ArcExport (42MB) and shape (11MB) files. The layers include the SEI polygons, the TRIM map grid, municipal and regional district boundaries and the SEI study area boundary. These digital files are available upon request to: Peggy Ward or Andrew Harcombe Ecosystem Mapping Coordinator Coordinator Canadian Wildlife Service Conservation Data Centre Environment Canada Ministry of Environment, Lands and Parks 3567 Island Highway West Box 9344, Stn. Prov Govt Qualicum Beach, B.C. Victoria, B.C. V9K 2B7 V8P 5J9 The files will be provided upon receipt of a signed Limited Use Agreement (see sample below): The Parties agree as follows: 1. The Owners grant to the User the revocable and non-exclusive right to use SEI digital files in connection with
________________________________________________________________ ____________________________________________________________[specify business purpose].
2. The User must not distribute or transfer any SEI digital files in whole or in part to any person or body without the written
consent of the Owners. 3. The User must acknowledge its use of the SEI as the source of data in any published maps or reports in the following
manner: “The Sensitive Ecosystems Inventory of East Vancouver Island and Gulf Islands was produced by Environment Canada and the B.C. Ministry of Environment, Lands and Parks. Major funding was provided by Environment Canada and the Habitat Conservation Trust Fund.”
4. The User acknowledges that for comprehensive site-specific evaluations, SEI data must be complemented by detailed on-
site ecological assessments. 5. SEI digital files must be displayed in their entirety. The User must include all polygons identified for a given area in mapped
and written information. If only part of the data is shown, the User must clearly specify that part of the data is not being displayed.
6. The User must not enlarge SEI data beyond the source scale (the scale of the air photo on which the relevant polygons
were delineated), as such enlargement may result in gross inaccuracies. 7. The User is requested by the Owners to provide information, from personal knowledge or otherwise, regarding updates and
revisions to this dataset, using the Information Change form provided (CHANGFRM.DOC). 8. The Owners will transfer TRIM map data only to those Users who have purchased TRIM. 9. Neither the Owners nor the CSSC is responsible for any damages resulting from omissions, deletions or errors that may be
contained in these data sets. The Owners and the CSSC expressly disclaim any warranty of merchantability or fitness for any particular purpose.
10. Subject to paragraphs 11 and 12, this Agreement starts on [date] and ends on ____________ [date]. 11. If the User breaches any term contained in paragraphs 2, 3, 5, 6 or 8 of this Agreement, the Owners may terminate this
Agreement by giving written notice. 12. If a dispute relating to this Agreement should arise, and the Parties cannot settle the dispute through negotiation, then the
Parties must attempt in good faith to resolve the dispute through mediation before resorting to litigation or other procedure.

Appendix 1: Inventory Products
Sensitive Ecosystems Inventory: East Vancouver Island and Gulf Islands 113
SEI Base Map The SEI base map, developed specifically for this project (section 3.5.3), has been translated into a read-only format for users without a license to use the digital TRIM files. The map image is in tiff format and is available from Environment Canada along with an index map showing the location of the 12 tiles which cover the entire study area (see map index below). These are raster images, and although they are spatially correct, the lines appear jagged. They are designed to be used at the scale of the hardcopy maps, 1:20,000. The SEI data must be superimposed on top of the basemap because the image is not transparent and will block out any data underneath it. All of the SEI data can be viewed against the backdrop of the image including the labeled polygons, study area boundary, municipal and regional district boundaries and air photo flight lines and photo centres. For more information please contact Environment Canada:
#
#
#
#
#
#
#
#
#
#
#
#
Tile 1
Tile 2
Tile 3
Tile 4
Tile 12
Tile 5
Tile 6 Tile 7
Tile 8
Tile 10
Tile 11
Tile 9
Index Map forbasemap image (tif) files for
Sensitive Ecosystems Inventory Project - East Vancouver Island and Gulf Islands
1998
10 0 10 20 Kilometers
File sizes: tiles 3,4 and 9: ~116 MBall other tiles: ~58 MB
Environment Canada Ministry of Environment, Lands and Parks

Appendix 2: Structural Stages
Sensitive Ecosystems Inventory: East Vancouver Island and Gulf Islands 114
Appendix 2: Structural Stages
Structural stage numbers are indicated for each riparian unit in the SEI study area. Additional substages are used to further differentiate the structural stages 1 through 3 according to life form layers and relative cover of individual strata. Stage 2 and substages 1a, 1b, 2a-d, 3a, and 3b are used for permanent shrub and herb communities.
Structural stages and codes49 Structural Stage Description
Post-disturbance stages or environmentally induced structural development
1 Sparse/bryoid Initial stages of primary and secondary succession; bryophytes and lichens often dominant, can be up to 100%; time since disturbance less than 20 years for normal forest succession, may be prolonged (50–100+ years) where there is little or no soil development (bedrock, boulder fields); total shrub and herb cover less than 20%; total tree layer cover less than 10%.
Substages
1a Sparse Less than 10% vegetation cover;
1b Bryoid Bryophyte- and lichen-dominated communities (greater than 1/2 of total vegetation cover).
Stand initiation stages or environmentally induced structural development
2 Herb2 Early successional stage or herbaceous communities maintained by environmental conditions or disturbance (e.g., snow fields, avalanche tracks, wetlands, grasslands, flooding, intensive grazing, intense fire damage); dominated by herbs (forbs, graminoids, ferns); some invading or residual shrubs and trees may be present; tree layer cover less than 10%, shrub layer cover less than or equal to 20% or less than 1/3 of total cover, herb-layer cover greater than 20%, or greater than or equal to 1/3 of total cover; time since disturbance less than 20 years for normal forest succession; many herbaceous communities are perpetually maintained in this stage.
Substages
2a Forb-dominated2 Herbaceous communities dominated (greater than 1/2 of the total herb cover) by non-graminoid herbs, including ferns.
2b Graminoid-dominated2
Herbaceous communities dominated (greater than 1/2 of the total herb cover) by grasses, sedges, reeds, and rushes.
2c Aquatic2 Herbaceous communities dominated (greater than 1/2 of the total herb cover) by floating or submerged aquatic plants; does not include sedges growing in marshes with standing water (which are classed as 2b).
2d Dwarf shrub2 Communities dominated (greater than 1/2 of the total herb cover) by dwarf woody species such as Phyllodoce empetriformis, Cassiope mertensiana, Cassiope tetragona,
49 from Field Manual for Describing Terrestrial Ecosystems. 1998. B.C. Ministry of Environment, Lands and Parks and B.C. Ministry of Forests.

Appendix 2:Structural Stages
Sensitive Ecosystems Inventory: East Vancouver Island and Gulf Islands 115
Structural Stage Description Arctostaphylos arctica, Salix reticulata, and Rhododendron lapponicum. (See list of dwarf shrubs assigned to the herb layer in the Field Manual for Describing Terrestrial Ecosystems).
3 Shrub / Herb2 Early successional stage or shrub communities maintained by environmental conditions or disturbance (similar to the herb stage); dominated by shrubby vegetation; seedlings and advance regeneration may be abundant; tree layer cover less than 10%, shrub layer cover greater than 20% or greater than or equal to 1/3 of total cover.
Substages
3a Low shrub2 Communities dominated by shrub layer vegetation less than 2 m tall; may be perpetuated indefinitely by environmental conditions or repeated disturbance; seedlings and advance regeneration may be abundant; time since disturbance less than 20 years for normal forest succession.
3b Tall shrub2 Communities dominated by shrub layer vegetation that are 2–10 m tall; may be perpetuated indefinitely by environmental conditions or repeated disturbance; seedlings and advance regeneration may be abundant; time since disturbance less than 40 years for normal forest succession.
Stem exclusion stages
4 Pole / Sapling3 Trees greater than 10 m tall, typically densely stocked, have overtopped shrub and herb layers; younger stands are vigorous (usually greater than 10–15 years old); older stagnated stands (up to 100 years old) are also included; self-thinning and vertical structure not yet evident in the canopy – this often occurs by age 30 in vigorous deciduous stands, which are generally younger than coniferous stands at the same structural stage; time since disturbance is usually less than 40 years for normal forest succession; up to 100+ years for dense (5,000–15,000+ stems per hectare) stagnant stands.
5 Young Forest3 Self-thinning has become evident and the forest canopy has begun differentiation into distinct layers (overstorey, intermediate, and suppressed); vigorous growth and a more open stand than in the pole/sapling stage; time since disturbance is generally 40–80 years but may begin as early as age 30, depending on tree species and ecological conditions.
Understorey reinitiation stage
6 Mature Forest3
Trees established after the last disturbance have matured; a second cycle of shade tolerant trees may have become established; understories become well developed as the canopy opens up; time since disturbance is generally 80–140 years for biogeoclimatic group A and 80–250 years for group B.

Appendix 2: Structural Stages
Sensitive Ecosystems Inventory: East Vancouver Island and Gulf Islands 116
Structural Stage Description
Old-growth stage
7 Old Forest3 Old, structurally complex stands composed mainly of shade-tolerant and regenerating tree species, although older seral and long-lived trees from a disturbance such as fire may still dominate the upper canopy; snags and coarse woody debris in all stages of decomposition typical, as are patchy understories; understories may include tree species uncommon in the canopy, due to inherent limitations of these species under the given conditions; time since disturbance generally greater than 140 years for biogeoclimatic group A and greater than 250 years for group B.
1 In the assessment of structural stage, structural features and age criteria should be considered together. Deciduous stands will generally be younger than coniferous stands belonging to the same structural stage. 2 Substages 3a and 3b may, for example, include very old krummholz less than 2 m tall and very old, low productivity stands (e.g., bog woodlands) less than 10 m tall, respectively. Stage 3, without additional substages, should be used for regenerating forest communities that are herb or shrub dominated and undergoing normal succession toward climax forest (e.g., recent cut-over areas or burned areas). 3Structural stages 4-7 will typically be estimated from a combination of attributes based on forest inventory maps and aerial photography. In addition to structural stage designation, actual age for forested units can be estimated and included as an attribute in the database, if required.

Appendix 3: Introduced Plant Species
Sensitive Ecosystems Inventory: East Vancouver Island and Gulf Islands 117
Appendix 3: Introduced Plant Species
COMMONLY ENCOUNTERED INTRODUCED PLANT SPECIES OF BRITISH COLUMBIA
Note: This list is to assist in calculating percent cover of introduced plant species; it is not a complete list of introduced plant species of B.C..
SHRUBS
Cotoneaster spp. Crataegus monogyna Cytisus scoparius Daphne laureola Ilex aquifolium
Malus pumila Rubus laciniatus R. discolor Ulex europaeus
FORBS
Allyssum spp. Anthemis spp. Aphanes spp. Arabidopsis thaliana Arabis glabra Arctium minus Arenaria serpyllifolia Artemisia absinthium A. vulgaris Atriplex heterosperma A. hortensis A. oblongifolia A. patula A. rosea Barbarea verna B. vulgaris Bellis perennis Berteroa incana Brassica spp. Capsella bursa-pastoris Cardamine hirsuta Cardaria spp. Centaurea spp. Centaurium erythraea Cerastium fontanum C. glomeratum Chenopodium album C. botrys C. capitatum C. urbicum Cichorium intybus Cirsium arvense C. vulgare
Clematis tangutica C. vitalba Conium maculatum Convolvulus arvensis C. sepium Cotula coronopifolia Crepis capillaris C. nicaeenis C. tectorum Cuscuta epithymum Cynoglossum officinale Daucus carota Descurainia sophia Digitalis purpurea Draba verna Echium vulgare Epipactis helleborine Erigeron annuus (native status uncertain) Erodium cicutarium Eschscholzia californica Euphorbia spp. (except E. serpyllifolia) Euphrasia nemorosa Filago spp. Foeniculum vulgare Geranium dissectum G. molle G. pusillum G. robertianum Gnaphalium uliginosum Gypsophila paniculata Hesperis matronalis Hieracium aurantiacum H. piloselloides

Appendix 3: Introduced Plant Species
Sensitive Ecosystems Inventory: East Vancouver Island and Gulf Islands 118
Holosteum umbellatum Hypochoeris spp. Iris pseudacorus Lactuca muralis L. serriola Lamium amplexicaule L. purpureum Lapsana communis Lathyrus pratensis L. sphaericus L. sylvestris Leontodon spp. Lepidium heterophyllum L. perfoliatum L. sativum Leucanthemum vulgare Linaria genistifolia L. purpurea L. vulgaris Lithospermum arvense Lotus corniculatus L. tenuis Lupinus arboreus Lychnis coronaria Lysimachia nummularia L. punctata L. terrestris L. vulgaris Lythrum salicaria Malva spp. Matricaria perforata Medicago spp. Melilotus spp. Mentha. spicata Moenchia erecta Myosoton aquaticum Myosotis arvensis M. discolor M. scorpioides M. stricta M. sylvatica Nasturtium officinale Neslia paniculata Onobrychis viciifolia Onopordum acanthium Oxalis corniculata Parentucellia viscosa Petasites japonicus Plantago lanceolata P. major Polygonum aviculare
Prunella vulgaris spp. vulgaris Ranunculus acris R. ficaria R. repens R. sardous R. conglomeratus Raphanus spp. Rorippa sylvestris Rumex acetosa ssp. acetosa R. acetosella Salsola kali Saponaria officinalis Scleranthus annuus Sedum acre S. album Senecio jacobaea S. sylvaticus S. viscosusS. vulgaris Silene alba S. armeria S. gallica S. noctiflora S. vulgaris Sisymbrium spp. Solanum spp. Sonchus spp. Spergularia marina Stellaria alsine S. graminea S. media Symphytum spp. Tanacetum parthenium T. vulgare Taraxacum laevigatum T. officinale Teesdalia nudicaulis Thlaspi arvense Tragopogon spp. Trifolium arvense T. aureum T. campestre T. dubium T. hybridum T. pratense T. repens T. subterraneum Valeriana officinalis Valerianella locusta Verbascum spp. Veronica anagallis-aquatica V. arvensis

Appendix 3: Introduced Plant Species
Sensitive Ecosystems Inventory: East Vancouver Island and Gulf Islands 119
V. chamaedrys V. filiformis V. hederaefolia V. officinalis V. persica Vicia cracca
V. hirsuta V. sativa V. tetrasperma V. villosa Viola arvensis V. odorata
GRAMINOIDS
Agrostis gigantea (= A. alba, A. stolonifera
var. major) Agrostis capillaris A. stolonifera Aira caryophyllea A. praecox Allopecurus geniculatus A. pratensis Ammophila arenaria Anthoxanthum odoratum Apera interrupta (=Agrostis interrupta) Arrhenatherum elatius Avena spp. Bromus commutatus B. hordeaceus (=B. mollis) B. rigidus B. sterilis B. tectorum Cynosurus cristatus C. echinatus Dactylis glomerata Digitaria spp. Echinochloa crus-galli Elymus repens (= Agropyron repens) Festuca arundinacea (= F. elatior) Festuca rubra (polymorphic species -
suggestions that there are distinctive native forms or subspcies - in particular a "coastal Festuca rubra" is considered a native spp. that is being outcompeted by introduced grasses on coastal bluffs.)
Glyceria maxima Holcus lanatus H. mollis Lolium spp. Phleum pratense Poa annua P. bulbosa P. nemoralis
P. pratensis (3 subspecies considered introduced - please see Douglas, et al. Vol. 4 1994 for details
P. trivialis Puccinellia distans Setaria spp. Spartina patens Typha angustifolia Vulpia bromoides (= Festuca bromoides)

Appendix 4: Common and Scientific Plant Names
Sensitive Ecosystems Inventory: East Vancouver Island and Gulf Islands 120
Appendix 4: Common and Scientific Plant Names Used in This Report
Note: * denotes introduced species Common Name Scientific Name Alaska brome Bromus sitchensis alkaligrass Puccinellia spp. American glasswort Salicornia virginica American searocket Cakile edentula arbutus Arbutus menziesii awned haircap moss Polytrichum piliferum badge moss Plagiomnium insigne baldhip rose Rosa gymnocarpa beach pea Lathyrus japonicus beach sand-spurry Spergularia macrotheca beaked sedge Carex utriculata bear’s foot sanicle Sanicula arctopoides bigleaf maple Acer macrophyllum bitter cherry Prunus emarginata black cottonwood Populus balsamifera ssp. trichocarpa bleeding heart Dicentra formosa blue wildrye Elymus glaucus blue-eyed grass Sisyrinchium spp. bog cranberry Oxycoccus oxycoccos bracken Pteridium aquilinum brittle prickly pear cactus Opuntia fragilis broad-leaved shooting star Dodecatheon hendersonii broom moss Dicranum scoparium buckbean Menyanthes trifoliata bull thistle* Cirsium vulgare California oatgrass Danthonia californica California poppy* Eschscholtzia californica Canada thistle* Cirsium arvense cattail Typha latifolia chocolate lily Fritillaria lanceolata coast microseris Microseris bigelovii Columbia brome Bromus vulgaris common camas Camassia quamash common rush Juncus effusus common spike-rush Eleocharis palustris contorted-pod evening-primrose Camissonia contorta cow-parsnip Heracleum lanatum creeping bentgrass* Agrostis stolonifera creeping spike rush Eleocharis palustris death camas Zygadenus venenosus

Appendix 4: Common and Scientific Plant Names
Sensitive Ecosystems Inventory: East Vancouver Island and Gulf Islands 121
Common Name Scientific Name deltoid balsamroot Balsamorhiza deltoidea devil’s club Oplopanax horridus Douglas-fir Pseudotsuga menziesii dulichium Dulichium arundinaceum dull Oregon-grape Mahonia nervosa dune bentgrass Agrostis pallens dunegrass Elymus mollis early hairgrass* Aira praecox Easter lily Erythronium oregonum electrified cat’s tail moss Rhytidiadelphus triquetrus English holly* Ilex aquifolium English ivy* Hedera helix entire-leaved gumweed Grindelia integrifolia erect pigmyweed Crassula connata var. connata European glasswort* Salicornia europaea European gorse* Ulex europaeus fairyslipper Calypso bulbosa false lily-of-the-valley Maianthemum dilatum farewell-to-spring Clarkia amoena fawn lily Erythronium spp. few-flowered shooting star Dodecatheon pulchellum fleshy jaumea Jaumea carnosa floating-leaved pondweed Potamogeton natans foamflower Tiarella trifoliata Garry oak Quercus garryana Geyer’s onion Allium geyeri giant chain fern Woodwardia fimbriata graceful arrow-grass Triglochin concinnum var. concinnum grand fir Abies grandis great camas Camassia leichtlinii Greensheathed sedge Carex Seta hairy honeysuckle Lonicera hispidula hairy manzanita Arctostaphylos columbiana hairy screw moss Tortula ruralis hardhack Spiraea douglasii hard-stemmed bulrush Scirpus lacustris harvest brodiaea Brodiaea coronaria hedgehog dogtail* Cynosurus echinatus Henderson’s checkermallow Sidalcea hendersonii herb robert* Geranium robertianum hoary rock moss Racomitrium lanuginosum Hooker’s onion Allium acuminatum humped bladderwort Utricularia gibba Idaho fescue Festuca idahoensis Indian hellebore Veratrum viride inflated sedge Carex exsiccata junegrass Koeleria macrantha

Appendix 4: Common and Scientific Plant Names
Sensitive Ecosystems Inventory: East Vancouver Island and Gulf Islands 122
Common Name Scientific Name juniper haircap moss Polytrichum juniperinum kinnikinnick Arctostaphylos uva-ursi Labrador tea Ledum groenlandicum lady fern Athryrium filix-femina lanky moss Rhytidiadelphus loreus large leafy moss Rhizomnium glabrescens large-headed sedge Carex macrocephala Lemmon’s needlegrass Stipa lemmonii lettuce lung lichen Lobaria oregana little beach bluegrass Poa confinis lodgepole pine Pinus contorta var. latifolia long-stoloned sedge Carex inops Macoun’s meadowfoam Limnanthes macounii maritime Alaska rein orchid Piperia maritima Menzies’ larkspur Delphinium menziesii Menzies’ tree moss Leucolepis acanthoneuron nodding onion Allium cernuum Northern adder’s tongue Ophioglossum pusillum Nuttall’s quillwort Isoetes nuttallii oceanspray Holodiscus discolor oniongrass Melica subulata orchard grass* Dactylis glomerata Pacific crab apple Malus fusca Pacific dogwood Cornus nuttallii Pacific sanicle Sanicula crassicaulis phantom orchid Cephalanthera austinae poison oak Rhus diversiloba prairie violet Viola praemorsa red alder Alnus rubra red elderberry Sambucus racemosa red fescue Festuca rubra red huckleberry Vaccinum parvifolium reed canary grass Phalaris arundinacea ribbed bog moss Aulacomnium palustre roadside rock moss Racomitrium canescens Rocky Mountain juniper Juniperus scopulorum rose campion* Lychnis coronaria salal Gaultheria shallon salmonberry Rubus spectabilis Saskatoon Amelanchier alnifolia satin-flower Sisyrinchium douglasii saxifrage Saxifraga spp. Scotch broom* Cytisus scoparius sea blush Plectritis spp. sea plantain Plantago maritima ssp. juncoides seashore bluegrass Poa macrantha seashore saltgrass Distichlis spicata

Appendix 4: Common and Scientific Plant Names
Sensitive Ecosystems Inventory: East Vancouver Island and Gulf Islands 123
Common Name Scientific Name semaphore grass Pleuropogon refractus shooting star Dodecatheon spp. shore pine Pinus contorta var. contorta short-stemmed sedge Carex brevicaulis sickle moss Drepanocladus uncinatus silver burweed Ambrosia chamissonis silver hairgrass* Aira caryophyllea Sitka sedge Carex sitchensis Sitka spruce Picea sitchensis skunk cabbage Lysichiton americanum slender arrowgrass Triglochin concinnum slender beaked moss Kindbergia praelonga slimleaf onion Allium amplectens slough sedge Carex obnupta small-flowered alumroot Heuchera micrantha small-flowered forget-me-not Myosotis laxa Smith’s fairybells Disporum smithii snowberry Symphoricarpos albus soft brome* Bromus mollis spring-gold Lomatium utriculatum spurge laurel* Daphne laureola step moss Hylocomium splendens stonecrop Sedum spathulat strawberry Fragaria spp. sweet vernalgrass* Anthoxanthum odoratum sword fern Polystichum munitum tall mannagrass Glyceria elata tall Oregon grape Mahonia nervosa tapered rush Juncus acuminatus thrift Armeria maritima tiny mousetail Myosurus minimus Tracy’s romanzoffia Romanzoffia tracyi trembling aspen Populus tremuloides trillium Trillium ovatum tufted hairgrass Deschampsia cespitosa ssp. beringensis twinflower Linnaea borealis vanilla leaf Achlys triphylla wall lettuce* Lactuca muralis Wallace’s selaginella Selaginella wallacei water-pepper Polygonum hydropiperoides watershield Brasenia schreberi western bog-laurel Kalmia microphylla ssp. occidentalis western buttercup Ranunculus occidentalis western fescue Festuca occidentalis western flowering dogwood Cornus nuttallii western hemlock Tsuga heterophylla western redcedar Thuja plicata

Appendix 4: Common and Scientific Plant Names
Sensitive Ecosystems Inventory: East Vancouver Island and Gulf Islands 124
Common Name Scientific Name western trumpet honeysuckle Lonicera ciliosa western white pine Pinus monticola western yew Taxus brevifolia white fawn lily Erythronium oreganum white-top aster Aster curtus willow Salix spp. yellow pond-lily Nuphar polysepalum

Appendix 5: SEI Update Form
Sensitive Ecosystems Inventory: East Vancouver Island and Gulf Islands 125
Appendix 5: SEI Update Form SENSITIVE ECOSYSTEMS INVENTORY
EAST COAST VANCOUVER ISLAND AND GULF ISLANDS INFORMATION CHANGE
This form is intended to provide updated information on areas and polygons that may have changed since the original survey in 1993. Please state whether change is due to disturbance, change in vegetation cover, development, elimination of sensitive ecosystem or other cause. Date: _______ Source of Information Name _____________________________________________________ Address_____________________________________________________ Phone_________________ Study Area ___________________ Capital Region District (CRD), Cowichan Valley (CVRD), Regional District of Nanaimo (RDN), Comox/Strathcona (CSRD), Islands Trust (IT) Check one: Addition of Polygon __ Modification of Existing Polygon__ Elimination of Polygon___ N.B. If change involves addition of new polygon(s), please contact Conservation Data Centre for additional field forms General Location __________________________________________________________________ _________________________________________________________________________________ Polygon #______________________________ Change ______________________________________________________________________________ ________________________________________________________________________________ _________________________________________________________________________________ Provide sketch map of change: Ground photos______ Aerial photos________ Maps ______are included with this form Send information to : Sensitive Ecosystems Inventory Coordinator Conservation Data Centre Ministry of Environment Lands and Parks Resource Inventory Branch, Wildlife Inventory Section Box 9344 Station Provincial Government Victoria, B.C. V8W 9M1 Fax :(250) 387-2733 Phone :(250) 356-0928

Appendix 6: List of Contacts
Sensitive Ecosystems Inventory: East Vancouver Island and Gulf Islands 126
Appendix 6: List of Contacts
Environment Canada, Canadian Wildlife Service, Qualicum Beach Peggy Ward Tel and Fax: (250) 752-9611 e-mail: [email protected]
Ministry of Environment, Lands and Parks, Conservation Data Centre, Victoria Jan Kirkby
Tel: (250) 387-0732 Fax: (250) 387-2733 e-mail: [email protected] web site: http//www.env.gov.bc.ca/wld/cdc
Ministry of Environment, Lands and Parks, Vancouver Island Region, Nanaimo
Marlene Caskey or Trudy Chatwin Tel: (250) 751-3100 Fax: (250) 751-3103 e-mail: [email protected] [email protected]

Appendix 7: SEI Polygon Database
Sensitive Ecosystems Inventory: East Vancouver Island and Gulf Islands 127
Appendix 7: SEI Polygon Database FIELDNAME CONTENTS POLYGON_ID Unique identification number. The letter prefix refers to the preliminary study area sub-
divisions and should not be used for data analysis by sub-unit, use ‘Ecoregion’ field instead. Numbers with different letter suffixes do not indicate association with polygons containing same number (i.e. N0034A is not associated with N0034B).
REGION Preliminary study area sub-divisions corresponding to Polygon ID prefix; do not use for data analysis.
ECOREGION Specifies sub-unit (Figure 4). USE THIS FIELD FOR DATA ANALYSIS. LOCATION Brief description of the general location of the polygon AIR_PHOTO Air photo ID number on which polygon is delineated PHOTOSCALE Scale of aerial photograph(s) on which polygon is delineated PHOTODATE Date of the aerial photograph(s) used for delineation MAP_SHEET TRIM map sheet number on which the polygon is located HECTARES Total area of the polygon in hectares, calculated digitally ECOSYSTEM1 Dominant or primary ecosystem code; see Section 4 for explanation of codes. ECOSYSTEM2 Secondary ecosystem code where applicable; see Section 2.3.2, ‘pure’ and ‘complexed’
units. DATASOURCE Indicates source of information; where blank, information was determined by air photo
interpretation only. CWS = Canadian Wildlife Service, Comox Valley Wetlands Inventory 1993; DB or WB = drive by or walk by to confirm existence of ecosystem; DFO = Department of Fisheries and Oceans; DU = Ducks Unlimited Canada; EP = ecoplot (Section 2.4.4); FC = forest cover maps, B.C. Ministry of Forests; GT = groundtruthed/fieldchecked; GVWD = Greater Victoria Water District; MBFC = forest cover maps, MacMillan Bloedel; PK = personal knowledge; SM = soils maps, B.C. Ministry of Environment; TRIM = from TRIM base map; WFC = forest cover maps, Weldwood; WO = observation from water craft to confirm existence of ecosystem.
DOMINANTS Tree species codes entered where known. These species may be based on field observation for groundtruthed plots, or on forest cover mapping when the plot has not been visited. Tree species codes for species found within the SEI study area are as follows: ACT = Black cottonwood, AT = Trembling aspen, BG = Grand fir, CW = Western red cedar, DR = Red alder, FD = Douglas-fir, HW = Western hemlock, MB = Bigleaf maple, PL = Shore pine, PW = Western white pine, QG = Garry oak, RA = Arbutus, SS = Sitka spruce, TW = Western yew.
AGE_FOREST Age of trees based on cores done during groundtruthing, or on forest cover maps. SOIL Codes taken from provincial soil maps where applicable or available. COMMENTS Miscellaneous comments FLD_CHKD Site has been visited; * = GT, EP or CWS with further information available upon
request; + = WB, DB, WO - existence of polygon and ecosystem classification have been confirmed visually but additional information is minimal. (See under ‘Datasource’ above for abbreviations.)
VERSION Database version.

Appendix 8: Field Data Report
Sensitive Ecosystems Inventory: East Vancouver Island and Gulf Islands 128
Appendix 8: Field Data Report - Sample Field Data Report date
Polygon ID: N0508A Sub-unit: NANAIMO Polygon Size (ha): 3.98 Map Sheet(s): 92F 030 Air Photo(s): 92130-023 Location: NANOOSE HILL __________________________________________________ Ecosystem 1:__WD _____ Ecosystem 2:__HT:ro_____ Forest Age:_____________ Data Source: ___PK,GT__________ Soil unit: _________________________________
Ecosystem1 or Ecosystem 2___1___ Multiple Plots: No Ecoplot No(s):_________ Landscape Condition: Highly fragmented (>5% landscape fragmentation)
Polygon Description Environmental Uniformity: Low Vegetation Uniformity: Low Forested Site Associations(s):____CDFmm 02__________________________________
Environmental Characteristics
Slope:____11%______ Slope Range:_____________ Mesoslope: _Upper Slope___ Elevation:___135m______ Elevation Range:___________ Aspect:_____180°________ Mineral Soil:__________ Organic Soil:_______________ Drainage: Well drained Moisture Regime: Xeric Nutrient Regime: Poor Hydrology:_________________________ Hydrology Data Source:__________________
Fish Observation: Not detected Disturbance History (natural)
Fire: Flooding: Animal Use: Erosion: Disease: Windthrow: Other Disturbance History (Anthropogenic)
Logging: Grazing: Agriculture: Construction: Recreation: Water Level Control: Dyking: Dredging: Pollutants(Dump): Other:
Adjacent Land Uses _RESIDENTIAL; MILITARY LAND_________________________ _____________________________________________________________________ _____________________________________________________________________ _____________________________________________________________________ Known Threats _____________________________________________________________________ _____________________________________________________________________ _____________________________________________________________________ _____________________________________________________________________ _____________________________________________________________________

Appendix 8: Field Data Report
Sensitive Ecosystems Inventory: East Vancouver Island and Gulf Islands 129
Polygon ID: N0508A Date:
Comments: SOME TRAILS________________________________________________ ________________________________________________________________________ ________________________________________________________________________ ________________________________________________________________________ ________________________________________________________________________ ________________________________________________________________________ _______________________________________________________________________
Vegetation Data
In general, dominant species only are recorded for each vegetation type. Rare, uncommon or indicator species may also be included. Non-vegetated type ________BARE ROCK_____________________________________ ________________________________________________________________________
Vegetation Type Percent Cover
Veg Typ
e
Species Code
Scientific Name Common Name
Percent Cover
1 Coniferous Trees 5 1 PSEUMEN Pseudotsuga menziesii douglas-fir 5 2 Hardwood Trees 5 2 ARBUMEN Arbutus menziesii arbutus 5 3 Tall Shrubs 32 3 ARBUMEN Arbutus menziesii arbutus 10 4 Low Shrubs 20 3 PSEUMEN Pseudotsuga menziesii douglas-fir 2 5 Forbs 1 3 QUERGAR Quercus garryana garry oak 20 6 Grasses 25 4 ARBUMEN Arbutus menziesii arbutus 15 7 Rushes 4 PSEUMEN Pseudotsuga menziesii douglas-fir 1 8 Sedges 4 QUERGAR Quercus garryana garry oak 5 9 Mosses/Lichens 25 5 POLYMUN Polystichum munitum sword fern 1 10 Aquatic vegetation 6 AIRAPRA Aira praecox early hairgrass 5 11 Non-Vegetated 15 6 CYNOECH Cynosurus echinatus hedgehog dogtail 7 6 FESTOCC Festuca occidentalis western fescue 10
12 Introduced Species 15 12 CYNOECH Cynosurus echinatus hedgehog dogtail 7 12 HOLCLAN holcus lanatus common velvet-
grass 3

Appendix 9: Groundtruthing Forms
Sensitive Ecosystems Inventory: East Vancouver Island and Gulf Islands 130
Appendix 9: Groundtruthing Forms Groundtruthing Form - Uplands
I.D. NO. (prelim): MAP SHEET: FINAL I.D. NO.
ECOSYSTEM CODE: LOCATION:
AIR PHOTO(S): GROUND PHOTO(S):
SOIL UNIT:
SURVEY DATE: SURVEYORS: Landscape condition:
___Unfragmented (< 5% of landscape fragmented) ___Partly fragmented (5-25% landscape fragmentation) ___Highly fragmented (> 25% landscape fragmentation)
POLYGON DESCRIPTION: Uniformity:
Degree of environmental uniformity: High Medium Low Degree of vegetation uniformity: High Medium Low
Environmental characteristics:
___%Slope ___Aspect ___Elevation ___Mesoslope
___Moisture Regime ___Nutrient Regime ___Drainage
Ecosystem type(s): Forested Site Association(s):
Non-forested Ecosystem(s):
Ecological Plot No. (where applicable):
Disturbance History (natural): ___Fire __Windthrow ___Disease ___Animal Use ___Erosion ___Other
Disturbance History (anthropogenic):
___Logging ___Grazing ___Agriculture ___Construction ___Recreation ___Other Adjacent land uses:
Known threats:
Comments:
Wildlife Observation:
Fish Present:___ Fish Not Detected:___
SKETCH:

Appendix 9:Groundtruthing Forms
Sensitive Ecosystems Inventory: East Vancouver Island and Gulf Islands 131
VEGETATION DESCRIPTION - UPLANDS Vegetation Type Dominant Species (% total layer) (% each) _____ Coniferous trees (core, dbh of dominant age class)
_____ Hardwood trees
_____ Tall shrub
_____ Low shrub
_____ Forb
_____ Grass
_____ Moss/Lichen
_____ Non-vegetated
_____ Introduced spp.
Voucher specimens:

Appendix 9: Groundtruthing Forms
Sensitive Ecosystems Inventory: East Vancouver Island and Gulf Islands 132
GROUNDTRUTHING FORM - WETLANDS I.D. NO. (prelim): MAP SHEET: FINAL I.D. NO.
ECOSYSTEM CODE: LOCATION:
AIR PHOTO(S): GROUND PHOTO(S):
SOIL UNIT:
SURVEY DATE: SURVEYORS: Landscape condition:
___Unfragmented (< 5% of landscape fragmented) ___Partly fragmented (5-25% landscape fragmentation) ___Highly fragmented (> 25% landscape fragmentation)
POLYGON DESCRIPTION: Uniformity:
Degree of environmental uniformity: High Medium Low Degree of vegetation uniformity: High Medium Low
Environmental characteristics:
___Elevation ___Mineral Soil ___Organic Soil Disturbance History (natural):
___Fire ___Flooding ___Animal Use ___Erosion ___Other Disturbance History (anthropogenic):
___Water Level Control ___Grazing ___Agriculture ___Dyking ___Dredging ___Pollutants (Dump) ___Recreation ___Other
Adjacent land uses:
Known threats:
Comments:
Wildlife Observations:
Fish Present:___ Fish Not Detected:___ CLASSIFICATION OF WETLAND: Ecoplot No.:
Hydrology:
Wetland class (%):
Inflow/Outflow: ___Photo-interpreted ___Fieldchecked ___Not verified
SKETCH:

Appendix 9:Groundtruthing Forms
Sensitive Ecosystems Inventory: East Vancouver Island and Gulf Islands 133
VEGETATION DESCRIPTION - WETLANDS Vegetation Type Dominant Species (% total layer) (% each) _____ Coniferous trees (core, dbh of dominant age class)
_____ Hardwood trees
_____ Tall shrub
_____ Low shrub
_____ Forb
_____ Grass
_____ Rushes
_____ Sedges
_____ Mosses
_____ Lichens
_____ Floating aquatic
_____ Submerged aquatic
_____ Non-vegetated
_____ Introduced spp.
Voucher specimens:

Appendix 9: Instructions for Completing Forms
Sensitive Ecosystems Inventory: East Vancouver Island and Gulf Islands 134
INSTRUCTIONS FOR COMPLETING SEI GROUNDTRUTHING FORMS ID NO (prelim): Fill in Polygon ID number assigned at the air photo interpretation stage.
MAP SHEET: Fill in corresponding mapsheet number
FINAL ID NO: Leave blank; to be filled in after editing stage.
ECOSYSTEM: Fill in the ecosystem code(s) assigned during air photo interpretation.
LOCATION: Use the location name assigned during air photo interpretation.
AIR PHOTO(S): Fill in the air photo number(s) on which the polygon is delineated.
GROUND PHOTO(S): Fill in slide photo roll and numbers taken on site.
SOIL UNIT: Fill in the soil unit as noted in DEIF [Describing Ecosystems in the Field
(Luttmerding et al. 1990)]; this will help with the site interpretation.
SURVEY DATE: Fill in date of groundtruthing.
SURVEYORS: Enter the name (or initials) of the crew members filling out the forms. Landscape condition: Describe the 500 ha surrounding the polygon being visited (basically the size of one photo). Fragmentation refers to separation of the landscape by significant anthropogenic influences, roads, hydro lines, developments, etc. POLYGON DESCRIPTION: Uniformity: Summarize the environmental characteristics of the polygon. For example: is this polygon a complex of slope positions and land forms or a complex of vegetation patterns? Can it be further divided into distinct polygons based on variability? Is the entire polygon on a steep south facing slope or is there a transition from steep to gentle? Refer to DEIF. If there is a wide range of mesoslope position, %slope or aspect, and these can be distinctly separated on the ground, then consider breaking up the polygon. However, if any variability is distributed throughout the polygon, then consider noting as a complex of 2 or more types (e.g. Forested ecosystems, CDFmm/01 and CDFmm/04 in a mosaic, or a mosaic of Garry oak - Oceanspray and Carex inops - Racomitrium community in the openings). Disturbance History (natural): This field is designed to provide information on disturbances that significantly impact the vegetation patterns within the polygon. Root rot centres, several blowdowns, deer severely grazing on shrubs, slides, regular flooding, etc. all influence the vegetation development and history. It is Important to distinguish between natural and introduced disturbances. Use category “other” if nothing else fits and explain. Disturbance History (anthropogenic): Use “other” and explain if not included here. Again, this information can indicate artificial causes of changes in vegetation patterns and consequently ecosystem structure and function. Environmental characteristics: This data will support ecosystem descriptions. Record Slope in percentage, Aspect in degrees, Elevation in metres. For Mesoslope, Moisture, Nutrient and Drainage, refer to the definitions from DEIF. The coding format to be used on the groundtruthing forms follows Mesoslope position; use CR-

Appendix 9: Instructions for Completing Forms
Sensitive Ecosystems Inventory: East Vancouver Island and Gulf Islands 135
crest, UP-upper slope, MD-midslope, LW-lower slope, TO-toe, DP-depression, LV-level, indicate range if necessary. For Drainage use R-rapidly drained, W-well drained, M-moderately well drained, I-imperfectly drained, P-poorly drained, VP-very poorly drained. For Moisture and Nutrient Regime use the numbers and terms from the Ministry of Forests Site Interpretation manuals for your region. e.g. 2-3(SD) Moisture VP(A) Nutrient Use indicator species to support your site interpretation. For wetlands, assess the first 50 cm of the soils using a soil auger, and tick mineral or organic on the form. Ecosystem type(s): Some polygons may contain both primary and secondary ecosystem components which cannot be delineated separately (review the ‘uniformity’ assessment). If this is the case, list separately on this line and indicate the % of the polygon each occupies. Describe the vegetation for each ecosystem type separately. Indicate the distribution of ecosystems in the sketch. If other ecosystems are represented only as minor inclusions, note in the comments field. Forested site associations should be listed according to the Biogeoclimatic Ecosystem Classification (e.g. CWHxm1/02, CWHxm1/00). If a full ecological plot is conducted, assign an number corresponding to DEIF plots that have been completed for the polygon. Adjacent land uses: Briefly describe land uses surrounding the polygon, farming, logging, sewage treatment, etc. Known threats: Briefly document any current knowledge or observations related to continued or further threats to the continued existence of the ecosystem(s) in that polygon. CLASSIFICATION OF WETLAND (use an approved classification system): Hydrology: Use the classes as set out in the wetland classification system. If there is more than one type of wetland in the polygon, list them separately. Wetland class (%): Use the classes as set out in the classification system. If there is more than one type of wetland in the polygon, list them separately and indicate % each occupies of the total polygon. If there is more than one wetland vegetation type for the class indicated, note this information. E.g. Marsh veg type A 20% and Marsh veg type B 80%. These two different marsh vegetation types should be described in separate vegetation lists and their orientation indicated on the sketch. Inflow/Outflow: Indicate on the sketch and on the air photo (with a small arrow) the direction of water flow in and out of the wetland(s) or polygon. If this is not visible on the photos and cannot be determined on the ground use the “Not verified” checkoff. SKETCH: Quickly sketch the polygon with the distribution of ecosystem association(s), landforms, water flow, etc. Mark the point where a plot was completed or from which most notes were taken. Mark North on the sketch and other features for orientation. VEGETATION DESCRIPTION (of sample plot):

Appendix 9: Instructions for Completing Forms
Sensitive Ecosystems Inventory: East Vancouver Island and Gulf Islands 136
Filling out this part of the Uplands groundtruthing form in not required if a DEIF vegetation plot (ecoplot or reci plot) has been completed. Since the DEIF forms do not separate out wetland vegetation layers, this part of the Wetlands groundtruthing form should be filled out, in addition to the DEIF (or reci) forms. Vegetation Type: In the first column indicate the % cover of all species combined within the Layer or vegetation category. e.g., Coniferous species present in the overstorey tree layer is 60% cover. Dominant Species: An example could be as follows: the dominant species is Pseudotsuga menziesii at 45% cover, Tsuga heterophylla is 30% and Thuja plicata another 25%. This percentage cover is to be based on the 100% cover for the vegetation unit (sample plot) being described. For coniferous species record the diameter at breast height and cored age of the most common age class. Indicate which canopy layer this age class is in e.g. veterans, A1, A2 or A3 as in DEIF. If tree species reappear in shrub, herb, grass or moss/lichen layers record their occurrence. Use Latin names for all species, and use the 8 letter codes (first 4 letters of genus followed by first 3 letters of species, and one letter of subspecies if applicable, e.g. Vaccpar is Vaccinium parvifolium). For tree species use the 2 letter codes as listed used by the Ministry of Forests. Use Qg for Garry oak and Ra for arbutus, Mb for big leaf maple, At for trembling aspen. Introduced vascular plants species must be recorded. Refer to Commonly Encountered Introduced Plant Species of British Columbia (Appendix 3). Voucher specimens: Prepare one collection sheet for each vascular plant in flower or in fruit encountered in their study area. If specimens are collected in the polygon being checked record the species collected (or the potential identification) and the collection number attached to the specimen.

Appendix 10:Natural History of the Study Area
Sensitive Ecosystems Inventory: East Vancouver Island and Gulf Islands 137
Appendix 10 Natural History of the Study Area Climate The west coast of British Columbia is exposed to an oceanic climate typified by high rainfall and mild temperatures. However, the Gulf Islands and eastern side of Vancouver Island lie within a rainshadow created by mountains to the west on Vancouver Island and to the south on the Olympic Peninsula (Figure 1). This region is therefore characterized by a cool Mediterranean-type climate of mild winters with an abundance of moisture but very little snow, warm relatively dry summers, and a long growing season. This area experiences some of the greatest annual sunshine hours in British Columbia, and has the mildest climate in Canada.
25
50
75
100
125
150
175
200
225
250
275
J M A M J J A S O N DF
Campbell River A
2
4
6
8
10
12
14
16
18
20
300
325
300
325
mm
mm
Celsius
25
50
75
100
125
150
175
200
225
250
275
J M A M J J A S O N DF
Cowichan Lake Villiage
2
4
6
8
10
12
14
16
18
20
300
325
300
325
mm
Celsius
25
50
75
100
125
150
175
200
225
250
275
J M A M J J A S O N DF
Victoria Gonzales Hts
2
4
6
8
10
12
14
16
18
20
300
325
mm
Celsius
25
50
75
100
125
150
175
200
225
250
275
J M A M J J A S O N DF
Victoria Marine
2
4
6
8
10
12
14
16
18
20
300
325
300
325
mm
Celsius
Victoria
Nanaimo
Duncan
CampbellRiver
Courtney
Va
nc o
uv e r I s l a n d M
o u n t a i n s
Prevailing Winds O l ymp i c Mo u n t a i n s
Madrone Consultants
Figure 1: Climate Variation Across the Study Area Graphs indicate average monthly temperature (lines) and average monthly precipitation
(bars), 1961-199050.
There are some steep gradients in precipitation across the study area, increasing from east to west and south to north. Thus, average annual precipitation at Victoria is between 650 mm and 800 mm, increasing to almost 1300 mm at Campbell River to the north, to over 1300 mm at Sooke to the west, and to over 1900 mm at Cowichan Lake Village, just beyond the western edge of the study area. Differences in rainfall between the south and north of the area are most pronounced in the summer months.
50 Climate data is based on Environment Canada. Canadian Climate Normals, 1961-90, British Columbia. Environment Canada, Ottawa, Ontario.

Appendix 10:Natural History of the Study Area
Sensitive Ecosystems Inventory: East Vancouver Island and Gulf Islands 138
Most of the rainfall occurs during the winter months. Limited precipitation in the summer period combined with higher temperatures results in pronounced summer moisture deficiencies (McMinn et al. 1976; Meidinger and Pojar 1991). This effect is most evident in the southern part of the area where seasonal moisture differences are greatest, and it decreases northwards as summer precipitation increases. Snow in this area is minimal, ranging from 5% to 15% of the total precipitation, and typically melts within a week of falling. Days with measurable snow generally range from an annual average of five to ten in the Victoria area to up to 17 in the northern part of the study area and west towards Cowichan Lake. Annual average temperatures in the area are among the highest in Canada due to the mild winters. However, despite high sunshine hours (averaging, for example, 2,082 hours per year at Victoria Airport), summer temperatures are modified by the ocean and the Strait of Georgia, resulting in warm rather than hot summers. This effect is most pronounced in the southern portion of the study area. Temperatures in Victoria, which experiences cooling summer breezes, are generally lower than in the northern part of the study area around Comox and Courtenay. The local climate exerts a major influence upon the vegetation of the study area, both directly and indirectly. Species and plant communities that are adapted to the warm, sunny climate with periods of drought are favoured over those that require more abundant rainfall or those that require more pronounced seasonal extremes for successful reproduction and establishment. Due to the climatic influence, many of the plants reach their northern range limits in the study area. Trees such as Douglas-fir and arbutus with high tolerances for drought and fires, predominate in the study area, and grassland development is common. Many wildflowers appear and flower very early in spring, when moisture is more available, then set seeds during the early summer months. By late summer, most have vanished, surviving periods of drought as bulbs or corms. Even plants more typically associated with desert conditions, such as the prickly pear cactus, are not uncommon within much of the study area. However, climatic conditions have not been stable over time; the changing climate and vegetation trends in the area are further discussed below (Climate and Vegetation Change). Geology Vancouver Island has been created mainly from distinct rock formations (terranes) formed elsewhere in the Pacific and squeezed onto the western margin of North America as a result of plate tectonics over the last 200 million years. Many of the rock formations in the study area derive from terranes accreted in this fashion. The accretion of distinct terranes was most complex in southern Vancouver Island, where the rocks are mainly volcanic (e.g., Metchosin volcanics) or metamorphic (e.g., Wark and Colquitz gneiss complexes) and lack a distinct regional structure. The resulting landforms are rather hummocky, creating numerous rocky knolls with shallow soils – many of which result in ecologically sensitive sites. Most of these landforms would originally have been covered in relatively continuous coniferous forests interspersed with sparsely vegetated ecosystems (mainly rock outcrops), arbutus groves, small, isolated wetlands, and, near the water, coastal bluffs. North of Victoria, much of the study area is underlain by sedimentary rocks of the Nanaimo Group. These were created by erosion and sedimentation from a mountain arc running along the axis of an early Vancouver Island. They consist of various combinations of conglomerate, sandstone, siltstone, shale, and coal (Yorath and Nasmith 1995). Over much of the area, these rocks have been faulted and tilted, and the more resistant beds (primarily sandstone)

Appendix 10:Natural History of the Study Area
Sensitive Ecosystems Inventory: East Vancouver Island and Gulf Islands 139
form linear ridges running mainly northwest-southeast. The sandstones, because of their resistance to erosion, stand out in relief and form most of the ridges and cliffs responsible for the trellis pattern of many of the Gulf Islands such as Galiano Island. Associated ecosystems are extensive conifer forests, interspersed with scattered sparsely vegetated units (mainly rock outcrops) and coastal bluffs, especially among the Gulf Islands. Less resistant beds tend to form lower lying terrain between the ridges. The resulting lowlands have almost everywhere been buried in glacial or post-glacial sediments. These areas now contain discontinuous wetlands, riparian ecosystems and seasonally flooded agricultural land. In the southern portion of the study area are several mountains and hills formed by a much older group of rocks. Examples include Sicker, Prevost and Maple Mountains in the Duncan-Chemainus area. These formations (the Sicker Group) are mainly hard volcanic rocks and are among the oldest rocks on Vancouver Island (representing one of the earlier terranes). The associated landforms again are hummocky or rounded hills with an irregular surface expression. They typically support a relatively continuous coniferous forest interspersed with sparsely vegetated ecosystems (i.e. rock outcrops) and a few scattered but isolated wetlands. Soils Soils in the SEI study area are young in geologic terms, having developed in the 13,000 years since the last glaciation. Soils are derived from glacial and meltwater deposits or from deposits laid down in near-shore marine environments at a time when sea level was higher, relative to land. Almost all of the soils have been developed in these sediments, which over time have been draped over a bedrock surface. Where the terrain is irregular and glacial deposits relatively thin, soils have been eroded from bluffs and hilltops leaving very thin soil cover or exposed rock. This has created the mosaic of small, scattered rock outcrops and cliffs that characterize the forests in much of the study area. Many of the upland soils tend to contain abundant gravels, cobbles and stones and are consequently limited in their ability to supply nutrients and moisture to plant roots. These soils are relatively unproductive and for this reason (together with unfavourable terrain) have mainly been used for forestry rather than agriculture. Podzols51 and Brunisols are the most common soils in the area, developing on relatively well-drained sites. These are generally associated with coniferous forests. In the SEI study area, both soil types tend to be characterized by the downward movement of iron and aluminum compounds in the soil profile, which creates a distinctive brownish to reddish yellow horizon. There are many variations of these soils depending on the drainage, history, and parent material. For example, certain summer-dry ecosystems with a strong grass or herb component, such as Garry oak communities, have soils now classed as Sombric Brunisols in recognition of their well developed organic (Ah) horizon near the surface. In contrast, imperfectly drained soils found in some wetlands, riparian, and seasonally flooded agricultural ecosystems, are Gleysols, and exhibit a blue-grey horizon reflecting prolonged saturation. If the gleying is less pronounced, the soil is classified as a gleyed sub-group of the Brunisol or Podzol order (e.g. Gleyed Dystric Brunisol). Soils developed on floodplains, such as those along the Nanaimo, Chemainus, Cowichan and Courtenay Rivers, are the most productive for agriculture, particularly vegetables.
51 These terms as well as the Ah horizon are described in the Canadian System of Soil Classification. (Agriculture Canada, 1987)

Appendix 10:Natural History of the Study Area
Sensitive Ecosystems Inventory: East Vancouver Island and Gulf Islands 140
However, these level areas have been increasingly subject to residential and commercial development. Some seasonally flooded agricultural fields occur in soils of this type. Few floodplain ecosystems have not been substantively altered by human activities. Certain wetlands, notably bogs and fens (Section 3.5), occur where organic soils have developed. These soils are saturated for most or all of the year producing conditions that impede decomposition and allow the accumulation of organic matter from vegetation. Highly immature soils, such as those on gravel bars alongside rivers, have had insufficient time to develop a characteristic profile. These “Regosols” contain accumulations of greyish sands, gravels, and, to a lesser extent, silts. Regosols are generally associated with point bars, gravel islands, and active floodplain areas (usually the “low-bench” component of a river system) supporting only sparse herbaceous vegetation or at most scrubby willow, young cottonwood or alder. The ecology of these riparian sites differs from that on larger rivers on the mainland because flooding in the study area occurs primarily in the winter (when most plants are dormant) rather than in the spring. As so many sensitive ecosystems form in non-forested sites, Gleysols, Organic Soils and Regosols are disproportionately important in this inventory. Biogeoclimatic Ecosystem Classification (BEC) The SEI study area includes two biogeoclimatic zones: the Coastal Douglas-fir zone (CDF) and the Coastal Western Hemlock zone (CWH). For more discussion, refer to Section 1.4 in this report. Biotic History of the Study Area In addition to the climate, soil, and geologic history described above, a variety of factors have interacted with the already complex landscape to give rise to current day conditions. Glaciation has had a profound and enduring influence upon the natural history of the area. Although glaciation initially reduced biotic diversity, subsequent active natural and man-induced disturbance regimes, combined with the warm climate and complex geology, have created an area of very high spatial diversity and complex successional patterns. Plant and animal dispersal patterns, movement barriers, climatic changes, wildfire, windthrow, insect and disease outbreaks, fluvial processes, and human settlement have all had an influence. Today, as Pojar (1980b) and others have pointed out, the Strait of Georgia harbours some of the greatest biodiversity in the province including many unusual, rare, and threatened ecosystems and species, high species diversity, and nationally and internationally significant biota. Climate and vegetation change Before the ice ages, British Columbia had a more diverse hardwood flora as well as extensive coniferous forests. After the glaciers retreated from this area approximately 12,000 to 13,000 years ago, Vancouver Island probably revegetated quickly with wind-borne seeds (Cannings and Cannings 1996). The climate was colder and drier and lodgepole pine was a predominant species in the region, although on eastern Vancouver Island and the Gulf Islands, an open landscape dotted with aspen groves prevailed. Since then, the climate has fluctuated with accompanying changes in vegetation. As the climate became warmer and drier during the Holocene (starting about 10,000 years ago), open meadows became more widespread, and hardwoods proliferated. Fires increased in frequency at that time when the climate appears to have been substantially warmer and

Appendix 10:Natural History of the Study Area
Sensitive Ecosystems Inventory: East Vancouver Island and Gulf Islands 141
drier than at present (Brubaker 1991). The range of Douglas-fir extended north along the coast replacing the pine, whereas Garry oak trees appeared about 7,000 to 8,000 years ago, peaking in abundance between 6,000 and 7,000 years ago. Sitka spruce was more common then, whereas western hemlock and western red cedar were much less common. By 6,000 years ago, Garry oaks formed a continuous woodland in the vicinity of Saanich Inlet (Cannings and Cannings 1996) and may have extended into the Fraser River valley. Douglas-fir forests would have predominated over much of the study area. From 6,000 years ago to the present, the climate has gradually cooled and precipitation has increased. Fire frequencies decreased permitting fire-sensitive species like western red cedar and western hemlock to increase (Brubaker 1991), whereas Douglas-fir and Sitka spruce diminished. Open grasslands on the coast peaked but then declined, and by 3,000 years ago, they probably occupied a range similar to today’s (although now only remnants remain within this range due to subsequent human influences). In the last thousand years, oaks gradually declined to their current extent. Today’s woodlands are thus historical remnants of what once existed much more extensively through this area. Influence of geographic barriers After the glaciers retreated, the Strait of Georgia would have presented a dispersal barrier to many organisms. Although many insects, birds, bats, and airborne seeds would have crossed to the Islands relatively easily, the Strait would have presented a significant barrier to the non-flying mammals in particular. This is reflected today in a relatively impoverished mammalian fauna on Vancouver Island compared to the lower mainland. However, some of the plant and animal species that did cross the Strait have since evolved in relative isolation from the mainland and are now recognizably different at the sub-species level. Early settlement and the influence of fire With the retreat of the glaciers, early human settlers established on the coast. Although much of the human activity in the area would have had relatively low impact up until the last two centuries, First Nations tribes are known to have used fire to maintain good hunting conditions and good bulb crops in the area. The edible bulbs of camas, chocolate lily and other species were the focus of native plant harvests (Turner and Kuhnlein 1983). Thus, fires were actively set in the open meadow/Garry oak ecosystems to perpetuate open woodland and prairie conditions. The dry Douglas-fir forests and the Garry oak/arbutus stands thrived in the study area under a fairly frequent fire regime—a combination of natural fires due to the warm, dry summers and managed fires by First Nations groups. Agee (1991) has estimated the average fire return interval in coastal Douglas-fir forests to be some 230 years, and Parminter (1992) suggests mean fire return intervals in the CDF zone in B.C. to be between 100 and 300 years. The thick bark of Douglas-fir trees permits them to withstand hot fires, that can eliminate other species, and repeated fires can lead to a prominence of Douglas-fir. Arbutus also thrives under a frequent fire regime and responds to top-kill by re-sprouting from the ground. In conjunction with increased human settlement, fire suppression may have facilitated the shrinking of open woodlands by the encroachment of the native Douglas-fir, thus promoting continuing succession to coniferous forest cover. Fire suppression has also permitted many of our open meadows and woodlands to be invaded by a variety of aggressive introduced grasses. Fire has thus played a significant role in shaping the present day vegetation in the

Appendix 10:Natural History of the Study Area
Sensitive Ecosystems Inventory: East Vancouver Island and Gulf Islands 142
study area and is likely to have been important in maintaining the native wildflower communities associated with some of the sensitive coastal Douglas-fir and Garry oak ecosystems (Radcliffe et al. 1994). Influence of recent human settlement Although the native vegetation of the study area is generally well adapted to frequent light fires and prolonged drought, it is very susceptible to physical disturbance. Thus, over the last 150 years, settlement and the associated agricultural and urban development have drastically changed the natural landscape in the study area. Ditching and drainage of wetlands, conversion of wetlands and floodplains for agriculture, removal of forest cover through harvesting operations, and the surfacing of the land for suburban and urban developments increased from the mid 1800s, and continues to this day. Although some aspects of development—especially conversion for agriculture—have now slowed, other aspects have dramatically accelerated. In particular, urban development has greatly increased in the last thirty or so years. This continuing large-scale change to the landscape is more permanent and more irrevocable than many of the earlier changes. In conjunction with increased human settlement and associated linear developments, with increased international shipping traffic and with the increase in grazing animals come further influences in the form of the introduction and spread of many alien plants and animals. More details on introduced flora and fauna are provided below. Present Day Vegetation of the Study Area General descriptions of the vegetation of the Coastal Douglas-fir and Coastal Western Hemlock zones can be found in Klinka et al. (1979), Green and Klinka (1994), Nuszdorfer et al. (1991) and Harcombe and Oswald (1990). Some descriptions of individual plant communities of these zones exist. Roemer (1972) describes plant communities of the Saanich Peninsula in detail. McMinn et al. (1976) provide descriptions of the communities for the Victoria area and Erikson (1996) describes Garry oak communities of southwestern B.C. in great detail. Native vegetation Douglas-fir is the most common tree species found in the SEI study area. Western red cedar, western hemlock, grand fir, red alder, and bigleaf maple frequently grow with Douglas-fir depending on site moisture and nutrient regime. On drier sites, Douglas-fir may be accompanied or replaced by varying proportions and mixes of Garry oak and the more frequently occurring arbutus, the only native evergreen broadleaf tree in Canada. The characteristic Garry oaks and arbutus of the drier sites occur in Canada only in the south-western corner of B.C.; Garry oak is especially restricted in distribution, being confined to the CDF zone. Shore (lodgepole) pine is a less common tree; although it occurs in localized areas on coastal bluffs, rocky knolls and in some boggy sites. Other tree species occurring within the area are western white pine, western yew and Sitka spruce whereas bitter cherry, Douglas maple, cascara and western flowering dogwood occur sporadically through many of the forests. Black cottonwood and Pacific crabapple are largely confined to floodplain areas, whereas small stands of trembling aspen are relatively rare throughout the area, occurring in only a few sites.

Appendix 10:Natural History of the Study Area
Sensitive Ecosystems Inventory: East Vancouver Island and Gulf Islands 143
Common shrub understorey species within the study area include salal, sword fern and dull Oregon-grape. Ocean-spray, baldhip rose, western trumpet honeysuckle, twinflower, bracken, and vanilla-leaf also occur on many sites (Greene and Klinka 1994). A variety of attractive wildflowers, including many rarities, can also be found. Typical flowers include white fawn lily, bleeding heart, trillium, common and greater camas, spring gold, western buttercup, Hooker’s and nodding onions, stonecrops, seablush and many others. The Conservation Data Centre (CDC) maintains a tracking list of rare, threatened, endangered and vulnerable plants, animals and plant communities. They have recorded 114 plant species and 18 plant communities within the study area that are considered to be rare or vulnerable. Although a few rare plants such as the giant chain fern, phantom orchid and Smith’s fairybells are restricted to forested habitats, the majority is associated with open grasslands, parklands, woodlands, and rock outcrops. Many of these rare species, such as deltoid balsamroot, coast microseris, and Nuttall’s quillwort are at or are approaching the northernmost limits of their natural ranges. Macoun’s meadow-foam is endemic to B.C., occurring nowhere else in the world beyond the study area. The CDC can be contacted for a list of rare species in a particular area, and the CDC website contains red and blue lists of rare species for the province (see Appendix 6 for contact information). Introduced plants Introduced plant species occur everywhere and are often dominant even on apparently undisturbed sites. Non-native grasses and shrubs occur at many sites and often devastate the native vegetation community. Although most intrusive where the ground has been disturbed, non-native species are also invading even relatively undisturbed sites. Scotch broom is the most widespread of the non-native shrubs, but other common introduced shrubs include English holly, European gorse, English ivy and spurge laurel. Numerous introduced grasses occur in many of the ecosystems identified; examples include orchard grass, early hairgrass, silver hairgrass, hedgehog dogtail, sweet vernalgrass, creeping bentgrass and a variety of brome species. A variety of European and Eurasian herbs have also become established in many sensitive ecosystems. Canada and bull thistles and wall lettuce are widespread in many terrestrial herbaceous units and some woodland units; purple loosestrife plagues wetlands; Herb Robert from Europe is present in some moister second growth forests, and the established garden escape, rose campion, is common on coastal bluffs. Animals of the Study Area Native fauna Although the fauna of eastern Vancouver Island and the adjacent Gulf Islands is limited in terms of species diversity compared to mainland B.C., there is nevertheless a wide range of characteristic native animals inhabiting the area, as well as a number of relatively recent introductions. Many animal species interact with the vegetation in a dynamic relationship in which they both influence and are influenced by the plant communities on which they depend. For example, it has been suggested that the Black-tailed Deer may help maintain the open character of the Garry oak landscape by suppressing some of the oak regeneration (CDC 1993); they may also spread some introduced species (as well as native plants) across the landscape.

Appendix 10:Natural History of the Study Area
Sensitive Ecosystems Inventory: East Vancouver Island and Gulf Islands 144
Reptiles and amphibians Reptiles characteristic of the warm, drier ecosystems in the area include the Northern Alligator Lizard and three species of Garter Snake. The red-listed Sharp-tailed Snake has also been recorded within the study area usually in dry, south-facing habitats. Pond-dwelling amphibians that are dependent on wetlands include Rough-skinned Newt, Long-toed Salamander, Pacific Treefrog and Red-legged Frog. Terrestrial salamanders include the Red-backed Salamander and the Ensatina Salamander. Moister, old-growth forests with abundant coarse woody debris including some floodplain and riparian forests are likely to be the most important units for these species. Birds Birds are better represented in the study area than the mammals and many species use the ecosystems at certain times during their life history. The Georgia Depression Ecoprovince (Figure 2) supports 90% of all bird species known to occur in B.C. and 60% of all species known to breed in the province (Campbell et al. 1990). Wetlands and flooded agricultural fields in the study area support the highest wintering populations of Trumpeter Swans in the world, as well as large numbers of many duck species, including Northern Shoveler, Northern Pintail and American Wigeon. Wetlands are also important to the survival of the Purple Martin and are important feeding sites for Osprey, as well as for Great Blue Herons, which roost and nest in some of the forest ecosystems mapped in this project. The blue listed Green Heron also occurs in a number of the wetlands in the study area. The Turkey Vulture is a common sight in the study area in summer, and this species may breed on some of the steeper rock bluffs and sparsely vegetated cliff units mapped. There is growing concern for a number of bird species associated with the dry ecosystems of the Coastal Douglas-fir zone and with the Garry oak ecosystems. The coastal subspecies of the Lewis’ Woodpecker previously used Garry oak ecosystems but has already disappeared from this area, and Western Bluebirds have all but vanished from the woodlands of southwestern B.C. A recognized subspecies of the Vesper Sparrow (Pooecetes gramineus subspecies affinis) occurred in Canada only in the Gulf Islands and southern Vancouver Island, on grasslands, and is now known from only a couple of sites on Vancouver Island. Similarly, the Streaked Horned Lark (Eremophila alpestris subspecies striatus) associated with grasslands of the Puget Lowlands has disappeared from the study area. Western Wood Pewee and Band-tailed Pigeon are also species of regional concern and these occur in Woodland ecosystems. The blue-listed coastal subspecies of the Western Screech Owl (Otus kennicottii subspecies saturatus) resides and breeds in large trees in a number of the mature and old-growth forested habitats in the study area. It is known to be declining on the eastern side of Vancouver Island (Fraser, pers. comm.). Mammals Large mammals common in the study area are limited to the Black-tailed Deer, Black Bear, and Cougar. Cougars often frequent forests and woodlands around the edges of many of the steep coastal bluffs and sparsely vegetated units where deer congregate in winter. The Gray Wolf occurs within some watersheds on the southern island but is now largely absent from the heavily populated study area. Roosevelt Elk herds were thought historically to be distributed throughout the study area, but now occur only very locally. Mid-sized mammals are better represented in the study area. Beaver, although not abundant here, occur in many of the wetlands. Muskrats also occur but are limited to herbaceous wetland ecosystems. River Otters maintain healthy populations along the coast, and Mink

Appendix 10:Natural History of the Study Area
Sensitive Ecosystems Inventory: East Vancouver Island and Gulf Islands 145
and Raccoon are very common. The latter three species are mostly associated with riparian areas, wetland habitats and sites immediately adjacent to the coast including coastal bluffs. The native Red Squirrel occurs in mature forests including maturing second growth stands. Native mice and vole species are restricted to the White-footed Deer Mouse and Townsend’s Vole, which is most abundant in herbaceous habitats. Shrews include the Dusky Shrew, the Vagrant Shrew and the rare Vancouver Island Water Shrew. Bats are well represented, as the mild climate supports a relatively high diversity of bat species (10 species). The blue-listed Townsend’s Big-eared Bat has been recorded at woodland and forest openings and the red-listed Keen’s Long-eared Myotis may also occur in old-growth forests. Invertebrates Knowledge of invertebrates in the study area is not extensive, but a number of butterflies are known to be associated with some of the sensitive ecosystems, particularly the coastal bluff, terrestrial herbaceous, and woodland ecosystems. The Large Marble White, known from southern Vancouver Island and the Gulf Islands, is now believed to be extinct due to habitat loss and competition from introduced species. The Chalcedon Checkerspot is probably extirpated, whereas Edith’s Checkerspot is known only from Hornby Island. The Sara Orange Tip is believed to be confined to steep, bare slopes not subjected to sheep grazing. Other butterfly species linked to habitats mapped in this project include the Propertius Duskywing, which is wholly dependent on Garry oak as its larval food plant, and the Zerene Fritillary, which on Saltspring Island occurs in open meadows interspersed with old-growth Douglas-fir forests. Introduced animals As with plants, many non-native animal species have become established within the study area. Some, such as the European Wall Lizard on the Saanich Peninsula, are very localized in distribution and have probably had relatively little effect on the native flora or fauna thus far. Others, such as the European Starling, House Sparrow and the Eastern Cottontail, are widespread in the study area and have likely affected populations of many of the native plants and animals through predation, consumption, competition and other more indirect effects. The Eastern Cottontail feeds out in openings such as the coastal bluffs and in terrestrial herbaceous units where it may impact on many native plants. The Gray Squirrel (including the black form) has been spreading in recent years up the east side of Vancouver Island and is now north of Duncan. It is likely that it will impact negatively on the native oaks, songbirds and the Red Squirrel. The American Bullfrog is a voracious introduced frog that has become widespread in the area. Abundant in some wetland ecosystems, the species is thought to have had a significant impact upon some of our native pond-breeding amphibians, insects and even ducks. The smaller Green Frog is also introduced to the area. The introduced North American Possum feeds on invertebrates, as well as the eggs and nestlings of many native passerine birds. Confined until recently to Hornby Island, it is now believed to be establishing on the Saanich Peninsula as well (Syd Cannings, pers. comm.). Other non-native fauna include the fallow deer populations that are well established but localized on a few of the Gulf Islands, as well as feral rabbits, goats and feral cats. Introduced house mice and rats (both Black and Norway) occur throughout the study area. The European Starling is the most conspicuous of the introduced bird species and has a considerable impact on many native breeding birds with which it competes (particularly for

Appendix 10:Natural History of the Study Area
Sensitive Ecosystems Inventory: East Vancouver Island and Gulf Islands 146
nest sites). In conjunction with habitat losses, it is believed to be largely responsible for the disappearance of the Western Bluebird and Purple Martin from the study area (Syd Cannings, pers. comm.). The House Sparrow is also well established in the study area.